evaluation of qualitative and quantitative efficiency of ... mansour.pdf · evaluation of...
TRANSCRIPT
An Najah National University
Faculty of Graduate Studies
Evaluation of Qualitative and Quantitative
Efficiency of Small Scale Biogas Units in Palestinian Rural Areas
Prepared by
Mahmood Rashad Rashed Mansour
Supervisor
Prof. Marwan Haddad
This Thesis is Submitted in Partial Fulfillment of the Requirements for The Degree of Master of Environmental Science, Faculty of Graduated Studies, An-Najah National University, Nablus , Palestine
2014


III
Dedication To the spirit of my mother, who had sacrificed intently for the sake of our
Education before she passed away. To my beloved father, wife (Ala’a),
brother (Ahmad), sisters (Manal, Afaf, Khitam, Somoud) and to my lovely
daughter; Nawal with love.
To everyone who cares about the environment and works to save it
Respect.

IV
Acknowledgments First of all, I would like to express my gratitude to ALLAH s.w.t, for
helping me in making this thesis possible.
I would like to dial a special thanks to Prof. Marwan Haddad my major
professor and advisor, for his continuous support, guidance and
encouragement .
I would like to thanks to the members of my thesis committee for taking
out of their busy schedules to review my work.
Thanks go also to all my friends and fellows graduate students, and special
thanks to my friends, Aws, Saed, Osama and Azmi for their support and
encouragement.
My warm thanks to my family, especially Khitam for all their support,
motivation , and help.
This research was partially funded through the American Consulate
General in East Jerusalem. I am grateful for their support.
Last, but certainly not least, I would like to thank my wife Ala’a for
constant love and support that have always given me the confidence and
the drive to pursue and realize my dreams.
Mahmood Mansour

V
اإلقرار
هأدنا الموقع أنا :العنوان تحمل التي الرسالة مقدم
Evaluation of Qualitative and Quantitative Efficiency of Small Scale Biogas Units in
Palestinian Rural Areas
أقر بأن ما اشتملت عليه هذه الرسالة إنما هي نتاج جهدي الخاص ، باستثناء ما تمت اإلشارة
رسالة ككل ، أو أي جزء منها لم يقدم من قبل لنيل أية درجة علمية أو إليه حيثما ورد ،وأن هذه ال
بحث علمي أو بحثي لدى أي مؤسسة تعليمية أو بحثية أخرى .
Declaration
The work provided in this thesis, unless otherwise referenced, is the
researcher's own work, and has not been submitted elsewhere for any
other degree or qualification.
Student's name: :اسم الطالب
Signature: : لتوقيعا
Date: التاريخ:
VI Table of Contents
Page Content No. III Dedication IV Acknowledgments V Declaration VI Table of contents
VIII List of tables IX List of figures X List of Photos XI Abbreviations XII Abstract 1 Chapter One : Introduction 2 Introduction 1.1 4 Objectives 1.2 4 Motivation 1.3 5 Hypothesis 1.4 6 Chapter Two : Literature Review 7 Biogas 2.1 7 Biogas composition 2.1.1 9 The Benefits of Biogas Technology 2.1.2
11 Environmental impact of biogas technology in Palestine
2.1.3
12 Biogas Generation 2.2 12 Anaerobic Digestion 2.2.1
15 Factors affect the rate of digestion and biogas production
2.2.2
19 Biogas plants types 2.2.3 19 Size types 2.2.3.1 20 Continuity types 2.2.3.2 21 Design types 2.2.3.3 27 Main factors influencing the selection of biogas design. 2.2.4 28 Inputs and their characteristics 2.2.5 31 Biogas technology in the world 2.3 32 Potential of biogas production in Palestine 2.4 35 Previous Studies 2.4 37 Summary 2.5 40 Chapter Three: Methodology 41 Experimental Setup 3.1 41 Materials and equipments 3.1.1 44 preparing Biogas Unit (Digester) 3.1.2

VII 45 Experimental program 3.2 45 Wastes Collection and Preparation 3.2.1 46 Samples Compositions 3.2.2 46 Sample preparing and introducing 3.2.3 48 Biogas withdrawing and weighting 3.3 49 Lab analysis 3.4 51 Chapter Four : Results & Discussions 52 Biogas production 4.1 52 Biogas production from cow manure sample 4.1.1
54 Biogas production from cow manure mixed with food residues
4.1.2
56 Biogas production from poultry manure mixed with food residues
4.1.3
57 Biogas production from food residues 4.1.4 60 Statistical analysis 4.2
60 Relationship between biogas production from cow manure and temperature
4.2.1
61 The Relationship between biogas production from cow manure mixed with food residues and temperature
4.2.2
62 Relationship between biogas production from poultry manure mixed with food residues and temperature
4.2.3
63 Relationship between biogas production from poultry manure and temperature
4.2.4
65 The Relationship between variables (biogas production ,time and temperature) for four waste types
4.2.5
65 Summary of results from ANCOVA analyses 4.2.5.1
68 Summary of results from nonlinear procedure of SAS (PROC NLIN)
4.2.5.2
73 Biogas quality 4.3 74 Biogas use 4.4 76 Financial analysis 4.5 77 Running cost 4.5.1 77 Biogas profit 4.5.2 78 Fertilizer profit 4.5.3 79 Conclusions 81 Recommendations 82 References 87 Appendix الملخص ب

VIII List of Tables
page Table No. 7 Biogas compositions Table (2.1) 8 Characteristics for CH4 Table (2.2) 9 Comparison of constituents in natural gas and biogas Table (2.3) 29 C/N ratio of some organic materials Table (2.4) 34 Livestock numbers by type in Palestine, 2005/2006 Table (2.5) 34 Types of wastes in the West Bank and Gaza Strip Table (2.6) 46 Samples Compositions Table (3.1) 52 Biogas production from cow manure sample Table (4.1) 54 Biogas production from cow manure mixed with food
residues sample Table (4.2)
56 Biogas production from poultry manure mixed with food residues sample
Table (4.3)
58 Biogas production from food residues sample Table (4.4) 59 Biogas production during 14 days from organic waste
samples Table (4.5)
61 Model Summary Table (4.6) 61 ANOVA Table (4.7) 61 Coefficients Table (4.8) 61 Model Summary Table (4.9) 62 ANOVA Table (4.10) 62 Coefficients Table (4.11) 62 Model Summary Table (4.12) 63 ANOVA Table (4.13) 63 Coefficients Table (4.14) 63 Model Summary Table (4.15) 64 ANOVA Table (4.16) 64 Coefficients Table (4.17) 65 ANOVA test results Table( 4.18) 66 Measured and predicted values of gas emission based on
the ANCOVA analysis model Table (4.19)
69 Nonlinear analyses results Table (4.20) 71 Measured and predicted values of gas emission based on
the NLIN analysis model Table (4.21)
73 (GC) analysis Table (4.22) 74 Time consume for biogas and Commercial gas burned Table (4.23) 76 Requirements and costs for constructing the small scale
biogas unit Table(4.24)
IX List of Figures
Page Figure No. 12 Anaerobic process microbiology consists of four
steps Figure (2.1)
21 KVIC Floating gas holder system Figure (2.2) 22 Concrete model biogas plant Figure (2.3) 23 Deenbandhu biogas plant (3 m3 gas production
per day) Figure (2.4)
24 Bag digester Figure (2.5) 24 Plug flow digester Figure (2.6) 25 Anaerobic filter Figure (2.7) 26 Up flow anaerobic sludge blanket (UASB) Figure (2.8) 42 Schematic diagram of Biogas Unit Figure (3.1) 53 Biogas production with time for cow manure
sample Figure (4.1)
55 Biogas production with time for cow manure mixed with food residues sample
Figure (4.2)
57 Biogas production with time for poultry Figure (4.3) 58 Biogas production with time for food residues
sample Figure (4.4)
68 Plot of predicted gas emission vs. measured gas values (ANOVA analysis model)
Figure (4.5)
69 Relationship of biogas emission with temperature
Figure (4.6)
70 Relationship of biogas emission with time Figure (4.7) 72 Plot of predicted gas emission vs. measured gas
values (NLIN analysis model) Figure (4.8)

X List of Photos
Page Photo No. 43 Biogas Unit Photo (3.1) 44 Some of the used materials Photo (3.2) 47 Mixing samples Photo (3.3) 48 Introducing sample into the digester Photo (3.4)
49 Withdrawing biogas from digester into air compressor Photo (3.5)
50 Gas Chromatography (GC) Photo (3.6)

XI Abbreviations
Methane gas CH4 Carbon dioxide gas CO2 Melting point [ºC] Tm Boiling point [ºC] Tb Flash point [ºC] Tf Auto ignition temperature [ºC] Ta Water Solubility [mg/L] S Density [kg/ m3] ρ Part per million ppm Anaerobic Digestion AD Acidity degree value pH Khaki and Village Industries Commission KVIC Polyvinyl chloride PVC Gobar Gas and agricultural equipment development Company GGC Galvanized Iron GI Up flow Anaerobic Sludge Blanket UASB Sustainable Development Department SDD Food and agriculture organization FAO Carbon : Nitrogen ratio C/N Total solids TS Gas Chromotography GC Statistical Package for Social Sciences SPSS The Statistical Analysis System SAS Municipal Solid Waste MSW Palestinian National Authority PNA

XII Evaluation of Qualitative and Quantitative Efficiency of Small Scale
Biogas Units in Palestinian Rural Areas By
Mahmood Mansour Supervised
Prof. Marwan Haddad
Abstract
The importance of the study stems from the increasing demands for the
natural gas and the tries to find an alternative for this substances.
Therefore, Alternative energy is one of the priorities, which seeks to
promote human and developed to replace non-renewable sources of energy,
of Biogas technology has the potential to provide an alternative to the
current unsustainable energy and provide environmental, social, and
economic benefits.
Biogas is generated when bacteria break down organic waste such as
manure, crop residues, or food waste in the absence of oxygen, in a process
known as anaerobic digestion. Biogas is a complex mixture of several
gases, but the majority of the product is methane(CH4) and carbon dioxide
(CO2).
The main objective of the study is to evaluate the qualitative and
quantitative efficiency of small Scale biogas units in Palestinian rural areas.
For achieving the study purpose, an experiment on cow manure , food
residues, cow manure mixed with food residues and poultry manure mixed
with food residues has been conducted, data has been gathered, codified,
entered the computer and statistically analyzed by using the Statistical

XIII
package of the Social Sciences (SPSS) and the Statistical Analysis System
(SAS) program .
The study consists of four chapters. The first one starts with an introduction
about the necessity of the energy resources in general and the need for the
renewable energy resources for and there advantages. The literature review
discuses the biogas as a recourse of energy in the world and its system.
The third chapter presents the study methods included the experimental
setup, experimental program, field measurements and lab analysis. A small
unit was used to produce biogas size of 1500 L was fed by four types of
organic waste: cow dung and food residues and cow dung mixed with the
remains of food, poultry manure mixed with the remains of food, and has
been studied and assess the effectiveness of the unit in the production of
biogas in terms of the amount and quality of the gas output of the four
organic waste each separately.
Results obtained from this study showed that all samples produce biogas at
ambient temperature. The food residues produce the biggest quantity of
biogas comparing with other organic wastes (22.160Kg biogas/ during 14
days), then poultry manure mixed with food residues (20.125Kg biogas/
during 14 days), then cow manure mixed with food residues (16.980Kg
biogas/ during 14days),then cow manure (16.600Kg biogas/ during 14
days ). The results indicated biogas has a heat value equals half heat value
of commercial gas used in our homes. Moreover, results reveal a strong
relationship between temperature and (Biogas production from cow
XIV
manure, food residues, cow manure mixed with food residues and poultry
manure mixed with food residues.
According to study results, it can be said that small scale biogas units are
not complicated, cheap, robust, easy to operate and maintain, and can be
constructed with locally produced materials and suitable for biogas
production for Palestinian rural families in order to cover its monthly
requirement from natural gas and producing high quality organic fertilizer
to improve crop yield.
Therefore, the possibility of making use of biogas as a source of energy in
Palestinian rural areas of small scale biogas units is recommended. This
what the fourth chapter contained.
According to the study results, several recommendations have been
suggested including substituting daily energy requirement of natural gas by
biogas in rural areas in order to save the costs, encouraging people to turn
to the new recourses of energy, supporting and encouraging biogas
technology in order to be used in Palestine by PNA with good cooperation
between farmers and related sectors as energy, environment and
agricultural sectors to improve and apply digesters in Palestinian rural
areas, more researches and practical studies about applying biogas
technology in Palestine should be conducted in order to improve biogas
plant in Palestine, financial should be provided in this field.

1
Chapter One
Introduction

2
1.1 Introduction
Energy is inevitable for human life and a secure and accessible supply of
energy is crucial for the sustainability of modern societies. Continuation of
the use of fossil fuels is set to face multiple challenges: depletion of fossil
fuel reserves, global warming and other environmental concerns,
geopolitical and military conflicts and of late, continued and significant
fuel price rise. These problems indicate an unsustainable situation.
Renewable energy is the solution to the growing energy challenges (Asif,
2005).
Renewable energy resources such as solar energy, wind energy , Hydro
energy, Bio energy, Geothermal energy, and Wave and tidal energy. These
sources are abundant, inexhaustible and environmentally friendly. Biogas is
a kind of renewable energy made from animal and human excreta and food
wastes. One way of making it is by collecting the wastes and putting them
in containers called digesters and the wastes are converted to gas by an
anaerobic process. The process essentially mimics the natural process by
which marsh gas is produced at the bottom of stagnant water bodies. The
gas is a mixture of methane and carbon dioxide (Asif, 2005).
Since Palestine is a developing country, its access to considerable amounts
of energy is essential to achieve economic growth and development. There
are many challenges facing Palestine, arising mainly from its energy
dependence. Its energy is not provided through domestic means but rather
provided through other countries which controls the quantity and quality of
energy imported.

3
With complete dependency on Israel for its energy needs, Palestine is put in
a vulnerable position given its complex political and security situation.
Such a threat has given rise to the importance of using renewable energy
such as solar, wind, biogas and so on (Ibrik, 2009).
Biogas technology is considered suitable technology for rural communities
like Palestine , and a good method for reducing the volume of generated
wastes that should be disposed off with more positive impacts on our
health, economy and our environment in general as well as decrease the
energy reliance on the other countries (Ibrik, 2009).
This thesis to share in disseminating this important technology in our rural
areas at a family scale which may provide our families and society with
many benefits such as:- biogas, organic fertilizer, decreasing the volume of
organic wastes that must be disposed off, and improving the environment
through evaluating qualitative and quantitative efficiency of small scale
biogas units in Palestinian rural areas. This thesis contains four chapters.
The first chapter includes an introduction, research objectives, research
motivation, , and research hypothesis.
The second chapter includes literature review ,describes biogas definition
and a characteristic, the benefits of biogas technology, the biogas process ,
and the important factors affecting the digestion process. Then the chapter
concerned with biogas system, its types and the main factors influencing
the selection of then shows the biogas production in the world, Arab
countries and Palestine.

4
The third chapter presents the experimental setup, experimental program,
field measurements ad lab analysis.
The fourth chapter presents the results and discussions, biogas production
,biogas quality, statistical analysis, biogas use and economic analysis.
At the end conclusions, recommendations and appendix.
1.2 Objectives
The study aims to achieve a set of goals and most important of which are
the following :
1. Evaluating the biogas production unit by using different types of
organic waste.
2. Evaluating the quality and quantity biogas production .
3. Modeling of biogas production as a function of operating parameters
(waste type, time and temperature).
1.3 Motivation
My personal motivation to study this topic came from the following
reasons:
1. Biogas technology is considered a renewable source of energy and a
good method for reducing the volume of generating wastes that
should be disposed off with more positive impacts on our health,
economy and our environment in general.
2. The vast majority of fossil fuels consumed in the Palestine is
imported, with the majority originating in other countries. Using
these energy sources may significantly decrease the energy reliance

5
on other countries and improve the Palestinian population’s access to
energy.
3. Many Palestinian families are suffering from high prices of
commercial gas. Biogas project provides these families a significant
portion of the money that spent on gas for cooking and heating.
4. Absence of governmental initiatives and concern for the
development of renewable resources.
For the previous reasons biogas technology is considered the most
important and suitable technology for rural families, and so it was selected
to be the subject of this study.
1.4 Hypothesis
The general hypothesis to the study is:
1. The project is feasible for the rural Palestinian families.
2. The amount of biogas produced from organic wastes by biogas unit
sufficient for household uses.
3. Household waste produces biogas enough for household uses such as
heating and cooking.
4. There is a relationship between Biogas production from organic
waste and the temperature.

6
Chapter Two
Literature Review

7
2.1 Biogas
Biogas is generated when bacteria break down organic waste such as
manure, crop residues, or food waste in the absence of oxygen, in a process
known as anaerobic digestion.
Biogas is a complex mixture of several gases, but the majority of the
product is methane and carbon dioxide. Methane, the desired component of
biogas, is a colorless, blue burning gas used for cooking, heating, and
lighting. Biogas is clean , renewable source of energy, which can be used
as a substitute for other fuels in order to save energy in rural areas .
2.1.1 Biogas composition
Werner, Stohr and Hees (1989) state that biogas usually contains about 50
to 70 % CH4 30 to 40 % CO2 and other gases, including ammonia,
hydrogen sulfide, and other noxious gases. It is also saturated with water
vapor. Werner, Stohr and Hees (1989) in their study, indicates that the
relative percentage of gases in biogas depends on the feed material and
management of the process. Table (2.1) shown Biogas compositions.
Table (2.1) : Biogas compositions (FAO/CMS, 1996) Substances Symbol Percentage Methane CH4 50 – 70 Carbon Dioxide CO2 30-40 Hydrogen H2 5- 10 Nitrogen N2 1-2 Water vapour H2O 0.3 Hydrogen Sulphide H2S Traces
Methane is virtually odorless and is invisible in bright daylight. It burns
with a clear blue flame without smoke and is non-toxic. Table (2.2) shown
characteristics for CH4.

8
Table (2.2) : Characteristics for CH4 Common synonyms
Marsh gas , fire damp
Formula CH4 Physical properties
Form : colorless , odorless gas . Stability : Stable Melting point [Tm]: -182 ºC Boiling point [Tb]: -164 ºC Flash point [Tf] : -1221 ºC Auto ignition temperature [Ta] : 537 ºC Water Solubility [S] : slight (25mg/L at 20 ºC) Density [ρ] = 0.717 kg/m3 at 20 ºC
Principal hazards CH4 is very flammable. CH4 can react violently or explosively with strong oxidizing agents, such as oxygen, halogens or inter halogen compounds. At high concentration methane acts as an asphyxiant .
Safe handling Wear safety glasses. The primary danger is from fire and explosion, so ensure work in a well-ventilated area, preferably within a fume cupboard, and that there is no source of ignition present.
Emergency Eye contact : Unlikely to occur. Skin contact : Unlikely to occur. If inhaled : Remove from the source of gas. If the amount inhaled is large or if breathing has ceased call for immediate medical help.
Disposal Small amounts of CH4 can be allowed to disperse naturally. Be aware that any significant build-up of gas presents a danger or fire or explosion.
Protective equipment
Safety glasses.
Heating value The heat value of biogas equal 1/2 heat value of butane gas (mahmoud,2007) = 9.5 kWh/Kg biogas (34200 kj /kg).
http://ptcl.chem.ox.ac.uk/~hmc/hsci/chemicals/methane.htm1
Biogas is highly flammable and is produced through the anaerobic (without
oxygen) decomposition of organic materials from plants and animals. It is
similar in most respect to Natural gas (obtained from fossil fuel) used for

9
heating and cooking at homes and industries. Table (2.4) presents
comparison between biogas and natural gas (Bothi, 2007).
Table 2.3 : Comparison of constituents in natural gas and biogas. Constituents Units Natural
Gas Biogas
Methane (CH4) Vol% 91 55-70 Ethane (C2H6) Vol% 5.1 0 Propane (C3H8) Vol% 1.8 0 Butane (C4H10) Vol% 0.9 0 Pentane (C5H12) Vol% 0.3 0 Carbon Dioxide (CO2) Vol% 0.61 30-45 Nitrogen (N2) Vol% 0.32 0-2 Volatile Organic Compounds (VOC) Vol% 0 0 Hydrogen (H2) Vol% 0 0 Hydrogen Sulfide (H2S) ppm ~1 >500 Ammonia (NH3) ppm 0 ~100 Carbon Monoxide (CO) ppm 0 0 Water Dew Point ºC <-5 Saturated Heating Value BTU/SCF 1031 ~600
Source: Jensen and Jensen (2000) referenced in Monnet (2003).
2.1.2 The Benefits of Biogas Technology
According to AgSTAR (2010), several benefits of biogas technology can
be achieved:
1. Energy benefits
• Multiple existing biogas end-use applications, including:
– Heat-only
– Electric-only
– Combined heat and power
_ Transportation fuel
• Dispatchable energy source (vs. intermittent wind and solar)

10
• Distributed generation (which means lower transmission /
transportation costs and higher reliability) .
• Direct replacement for non-renewable fossil fuels .
2. Waste treatment benefits
AgSTAR (2010) reported the following benefits for the waste treatment:
• Reduces volume of waste for transport, land application (vs. not
using digestion).
• Very efficient decomposition.
• Complete biogas capture.
• Nutrient recovery and recycling.
3. Environmental benefits
Also AgSTAR (2010) reported the following environmental benefits:
• Dramatic odor reduction.
• Reduced pathogen levels.
• Reduced greenhouse gas emissions.
• Platform for reducing nutrient runoff.
• Increased crop yield by produce High quality fertilizer. In the process
of anaerobic digestion, the organic nitrogen in the manure is largely
converted to ammonium. Ammonium is the primary constituent of
commercial fertilizer, which is readily available and utilized by
plants.
4. Economic benefits
AgSTAR (2010) reported the following economic benefits:
• Jobs (temporary /construction and permanent) .

11
• Turns cost item (i.e., waste treatment) into revenue-generating
opportunity.
• Can operate in conjunction with composting operations.
• Improves rural infrastructure and diversifies rural income streams
2.1.3 Environmental impacts of biogas technology in Palestine
Using organic wastes (animals dung, plants waste, domestic organic waste,
waste water) as a substrate for the biogas plants considered one of the most
important ways for wastes management. The following main impacts could
be achieved if this technology successfully applied:
1- Reducing the volume of wastes that to be disposed of by other
disposal ways as incineration, landfill, direct burning or bad
accumulation which eliminate negative impacts associated with these
ways as: smoke, dust, leachate forming and gases emissions. Biogas
technology decreases air, soil, ground and surface water pollution.
2- Reducing uses of fossil fuels, charcoal, firewood and direct burning
of animals dung for getting energy which decrease air pollutants,
save frosts, decreasing soil erosion and saving time and efforts for
gathering firewood.
3- Reducing pathogens and the following statement emphasize that
“Anaerobic digester systems can reduce fecal coli form bacteria in
manure by more than 99 percent, virtually eliminating a major source
of water pollution” (Oregon Office of Energy, 2002).

12
4- Using of digested organics as crops fertilizer reduces using of
chemical and manufactured fertilizers return positively on consumer
health.
5- The odor of digested wastes is much less than that of undigested.
6- Eliminating or reducing accumulated wastes decreases the
distribution of rodents, insects, flies and other disease victors in
addition to enhancing area aesthetic sight.
2.2 Biogas Generation
According to Demirer and Chen( 2004) biogas can be generated from the
following digestions:
2.2.1 Anaerobic Digestion
Anaerobic digestion is a microbiological process that produces biogas,
consisting primarily of methane (CH4) and carbon dioxide (CO2) in the
absence of oxygen. The digestion process occurs in four steps as shown in
figure (2.1).
Figure (2.1): Anaerobic process microbiology consists of four steps
http://water.me.vccs.edu/courses/ENV149/lesson4b.htm

13
Step1: Hydrolysis
Hydrolysis is an enzyme mediated conversion of complex organic
compounds (carbohydrates, proteins, and lipids) to simple organics
(sugar, amino acids, and peptides) for use as an energy source and cell
carbon.
Hydrolysis and liquefaction of complex and insoluble organics are
necessary to convert these materials to a size and form that can pass
through bacterial cell walls for use as energy or nutrient sources.
Step2: Fermentation or Acidogenesis
Acidogenesis is the process in which bacterial fermentation (by the
acidogens) of the hydroylsis products results in the formation of
volatile acids. The hydrogen-producing acetogens convert the volatile
acids (longer than two carbons) to acetate and hydrogen.These
microorganisms are related and can tolerate a wide range of
environmental conditions. Under standard conditions, the presence of
hydrogen in solution inhibits oxidation, so that hydrogen bacteria are
required to ensure the conversion of all acids.
Step3:Acetogenesis
The simple molecules from acidogenesis are further digested by
bacteria called acetogens to produce CO2, hydrogen and mainly acetic
acid.

14
Step4: Methanogenesis
Karki, et al.( 2005) added that methanogens convert the acetate and
hydrogen to methane and carbon dioxide. Or Methanogenesis -
methane, CO2 and water are produced by bacteria called methanogens.
The primary route is the fermentation of the major product of the acid
forming phase, acetic acid, to methane and carbon dioxide. Bacteria that
utilize acetic acid are acetoclastic bacteria (acetate splitting bacteria). The
overall reaction is:
CH3COOH CH4 + CO2
About two-thirds of methane gas is derived from acetate conversion by
acetoclastic methanogens. Some methanogens use Hydrogen to reduce
Carbon dioxide to Methane (hydrogenophilic methanogens) according to
the following overall reaction :
4H2 + CO2 CH4 + 2H2O
Circumstances in treating solid wastes, acetate is a common end product of
acidogenesis. This is fortunate because acetate is easily converted to
methane in the methanogenic phase. Due to the difficulty of isolating
anaerobes and the complexity of the bioconversion processes, much still
remains unsolved about anaerobic digestion.
The principle acids produced in Stage 2 are processed by methanogenic
bacteria to produce CH4. The reaction that takes place in the process of
CH4 production is called Methanization and is expressed by the following
equations:
15
CH3COOH CH4 + CO2
Acetic acid Methane Carbon dioxide
2CH3CH2OH + CO2 CH4 + 2CH3COOH
Ethanol Carbon dioxide Methane Acetic acid
CO2 + 4H2 CH4 + H2O
Carbon dioxide Hydrogen Methane Water
The above equations show that many products, by-products and
intermediate products are produced in the process of digestion of inputs in
an anaerobic condition before the final product CH4 is produced.
2.2.2 Factors affect the rate of digestion and biogas production
Several parameters within the anaerobic digester affect the physical
environment and therefore the efficiency of digestion and biogas
production potential. AD facility operators must monitor the following
parameters within acceptable ranges: pH, temperature, retention time,
organic loading rate, nutrient content, toxicants and mixing. The optimum
ranges and importance of these critical factors are described below.
1.pH value :
The pH of the input mixture plays very important role in methane
formation. The acidic condition is not favorable for methanogenic
process. The optimum biogas production is achieved when the pH value
of input mixture in the digester is between 6 and 7 (FAO/CMS, 1996).
2.Temperature :
The enzymatic activity of the bacteria largely depends upon temperature,
which is critical factor for methane production. There are mainly three

16
types of microorganisms categorized according to their habit of growth
temperature. They are as follows:
− Physophillic bacteria, which grow below I0°C;
− Mesophilic bacteria, which grow between 25°C - 35°C; and
− Thermophylic bacteria, which grow within the range of 45°C - 55°C.
Once metabolism occurs exothermic reaction is helpful for the methane
production. In case of mesophilic digestion, temperature range should be
maintained between 30 and 40°C. Satisfactory gas production takes place
in the mesophilic range, the optimum temperature being 35°C.
Therefore, in cold climate the temperature of fermenting substances in the
digester needs to be raised up to 35°C. Biogas production can be
augmented significantly by increasing the temperature up to 55°C beyond
which the production falls because of destruction of bacterial enzyme by
elevated temperature. Thus, in case of thermophylic digestion, it should be
between 45 and 55°C. On the other hand, when the ambient temperature
goes down to 10°C, gas production virtually stops. Gas production can be
increased in the cold climate by means of proper insulation of digester
(Verma, 2002).
3. Organic Loading Rate :
Lagrange( 1979) in his study stated that loading rate is the amount of
raw materials fed per unit volume of digester capacity per day. If the
plant is overfed, acids will accumulate and methane production will be
inhibited. Similarly, if the loading rate is lower, there will be less gas.

17
4.Retention Time :
Retention time (also known as detention time) is the average period that a
given quantity of input remains in the digester to be reacted, time is
calculated by dividing the total volume of the digester by the volume of
inputs added daily. Time is also dependent on the temperature and up to
35°C, when the time become higher the temperature get lower (
Lagrange, 1979).
5.Toxicity :
In terms of toxicity, Chengdu (1989) mentioned in his study that mineral
ions, heavy metals and the detergents are some of the toxic materials that
inhibit the normal growth of pathogens in the digester. Small quantity of
mineral ions (e.g. sodium, potassium, calcium, magnesium, ammonium
and sulphur) also stimulates the growth of bacteria, while very heavy
concentration of these ions will have toxic effect. For example, presence
of NH4 from 50 to 200 mg/L stimulates the growth of microbes, whereas
its concentration above 1,500 mg/L produces toxicity. This depends on
PH.
Similarly, heavy metals such as copper, nickel, chromium, zinc, lead, etc.
in small quantities are essential for the growth of bacteria but their higher
concentration has toxic effects. Likewise, detergents including soap,
antibiotics, organic solvents, etc. inhibit the activities of methane
producing bacteria and addition of these substances in the digester should
be avoided.

18
6. Slurry :
Lagrange (1979) states that this is the residue of inputs that comes out
from the outlet after the substrate is acted upon by the methanogenic
bacteria in an anaerobic condition inside the digester. After extraction of
biogas (energy), the slurry(also known as effluent) comes out of digester
as by-product of the anaerobic digestion system. There is less separation
in the slurry if the feed materials are homogenous. Appropriate ratio of
urine, water and excrement and intensive mixing before feeding the
digester leads to homogeneous slurry.
7. Mixing:
Al Sadi (2010) in his study states that this parameter is primarily a
function of the hydraulic regime (mixing) in the reactors. Mixing of the
substrate in the digester helps to distribute organisms uniformly
throughout the mixture and to transfer heat .The importance of adequate
mixing is considered to encourage distribution of enzymes and
microorganisms throughout the digester where MSW decomposition is
carried out. Furthermore, agitation aids in particle size reduction as
digestion progresses and in removal of gas from the mixture.
The material inside any digester may be further mixed through mechanical
or gas mixers that keep the solids in suspension. Often biogas is bubbled
through the digester as an inexpensive way to promote movement
.Mechanical mixers inside digesters are less common because maintenance
is somewhat difficult.

19
Mixing can also be achieved through the recirculation of waste. After
digested waste is removed from the reactor at the end of its retention time
,a percentage of it is fed into the stream of incoming fresh waste. This
serves to contact the fresh waste with bacterial mass and increase
movement in the digester, which prevents the buildup of a scum layer.
2.2.3 Biogas plants types
The biodigester is a physical structure, commonly known as the biogas
plant. Since various chemical and microbiological reactions take place in
the biodigester, it is also known as bio-reactor or anaerobic reactor .The
main function of this structure is to provide anaerobic condition within it.
As a chamber, it should be air and water tight. It can be made of various
construction materials and in different shape and size.
2.2.3.1 Size types
1- The family – size units
These units seem to be the most promising sizes. For these units
organic wastes of three or more equivalent animal units plus the
human waste and kitchen waste of an eight person family can be fed.
This waste is enough to produce biogas to supply the household with
its cooking gas needs.
2- The community – type units
These units are to be shared by neighbors, usually relatives. These
units will be fed by combined feed stock of human and animal wastes.
Also, these units can be used in public latrines in schools, factories,
20
hospitals. It is expected that these units will face problems in their
operation and maintenance as a result of the social structure.
3- The large- scale systems
Al Jaber (1992) showed in his study that there are a large number of
animal farms; these farms are suitable for large mechanized biogas
plants. This includes installation of modified biogas fueled internal
combustion engine driving electric generator for lighting and
operating small household electrical appliances in the village. The
situation in many villages is such that the Palestinian villages do not
have electricity or even running water. In these cases the community
indicated that their urgent need is supplying them with electricity
from biogas .
2.2.3.2 Continuity types
Hassan (2004) indicates that Biogas plants can be classified according to
the rate of substrate loading into three types which are:
1. continuous,
2. semi-continuous
3. and batch.
In the continuous plants, there is a daily (or regular) introducing of the
substrates into the digester with getting out the same quantity of digested
materials. While in the case of batch plants, all of required amount of
substrates to fill the digester are added once at the beginning of the
digestion process and removed all from the digester after completing
substrate digestion. In semi-continuous plants, fast or reasonable digested

21
substrates are added into and removed from the digester in a regular
manner.
Continuous plants provide the farmer or the investor with stable and high
biogas production, in addition to daily disposal of wastes, which avoid
from the bad odor that resulted from accumulation of these wastes. These
plants require fluid and homogenous substrate and they are so sensitive
toward substrate characteristics (especially pH and total solids) and
ambient conditions, therefore it requires monitoring .
2.2.3.3 Design types
1- Floating drum digester
In 1956 Jashu Bhai J Patel developed a design of floating drum biogas
plant popularly known as Gobar Gas Plant . In 1962, the Khadi and
Village Industries Commission (KVIC ) of India approved Patel's
design and this design soon became popular in India and the world. The
design of KVIC plant is shown in Figure 2.2 (Singh. Myles and Dhussa,
1987).
Figure (2.2): KVIC Floating gas holder system

22
In this design, the digester chamber is made of brick masonry in cement
mortar. A mild steel drum is placed on top of the digester to collect the
biogas produced from the digester. Thus, there are two separate structures
for gas production and collection.
2- Fixed dome digester ( Drumless Digester)
This type of digester was built in China as early as 1936. It consists of
an underground brick masonry compartment (fermentation
chamber)with a dome on the top for gas storage. In this design, the
fermentation chamber and gas holder are combined as one unit. This
design eliminates the use of costlier mild steel gas holder which is
susceptible to corrosion . Its sketch is given in figure (2.3) (Singh.
Myles and Dhussa, 1987).
Figure (2.3): Concrete model biogas plant
3- Deenbandhu model
Deenbandhu plants are made entirely of brick and work with a
spherical shaped gas holder at the top and a concave bottom, this

23
model proved 30%cheaper than Janata model (also developed in
India) which is the first fixed dome plant based on Chinese
technology. It also proved to be about 45%cheaper than a KVIC plant
of comparable size. A typical design of Deenbandhu plant is shown in
figure (2.4) (Singh. Myles and Dhussa, 1987).
Figure (2.4): Deenbandhu biogas plant (3 m3 gas production per day)
4- Bag digester
This design was developed in 1960s in Taiwan. It consists of a long
cylinder made of PVC or red mud plastic figure 2.5. The bag digester
was developed to solve the problems experienced with brick and metal
digesters. A PVC bag digester was also tested in Nepal by GGC at
Butwal from April to June 1986. The study concluded that the plastic
bag biodigester could be successful only if PVC bag is easily available,
pressure inside the digester is increased and welding facilities are
easily available. Such conditions are difficult to meet in most of the
rural areas in developing countries (Singh. Myles and Dhussa, 1987).

24
Figure (2.5): Bag digester
5- Plug flow digester
The plug flow digester is similar to the bag digester. It consists of a
trench (trench length has to be considerably greater than the width and
depth) lined with, concrete or an impermeable membrane.
The reactor is covered with either a flexible cover gas holder
anchored to the ground, concrete or GI top. The first documented use
of this type of design was in South Africa in 1957. Figure 2.6 shows a
sketch of such a reactor (Singh. Myles and Dhussa, 1987).
Figure (2.6): Plug flow digester

25
6- Anaerobic filter
This type of digester was developed in the 1950's to use relatively
dilute and soluble waste water with low level of suspended solids. It is
one of the earliest and simplest types of design developed to reduce
the reactor volume. It consists of a column filled with a packing
medium. It has a variety of non-biodegradable materials that have
been used as packing media for anaerobic filter reactors such as
stones, plastic, coral, mussel shells, reeds, and bamboo rings. The
methane forming bacteria form a film on the large surface of the
packing medium and are not earned out of the digester with the
effluent. For this reason, these reactors are also known as "fixed film"
or "retained film" digesters. Figure 2.7 presents a sketch of the
anaerobic filter. This design is best suited for treating industrial,
chemical and brewery wastes (Singh. Myles and Dhussa, 1987).
Figure (2.7): Anaerobic filter
26
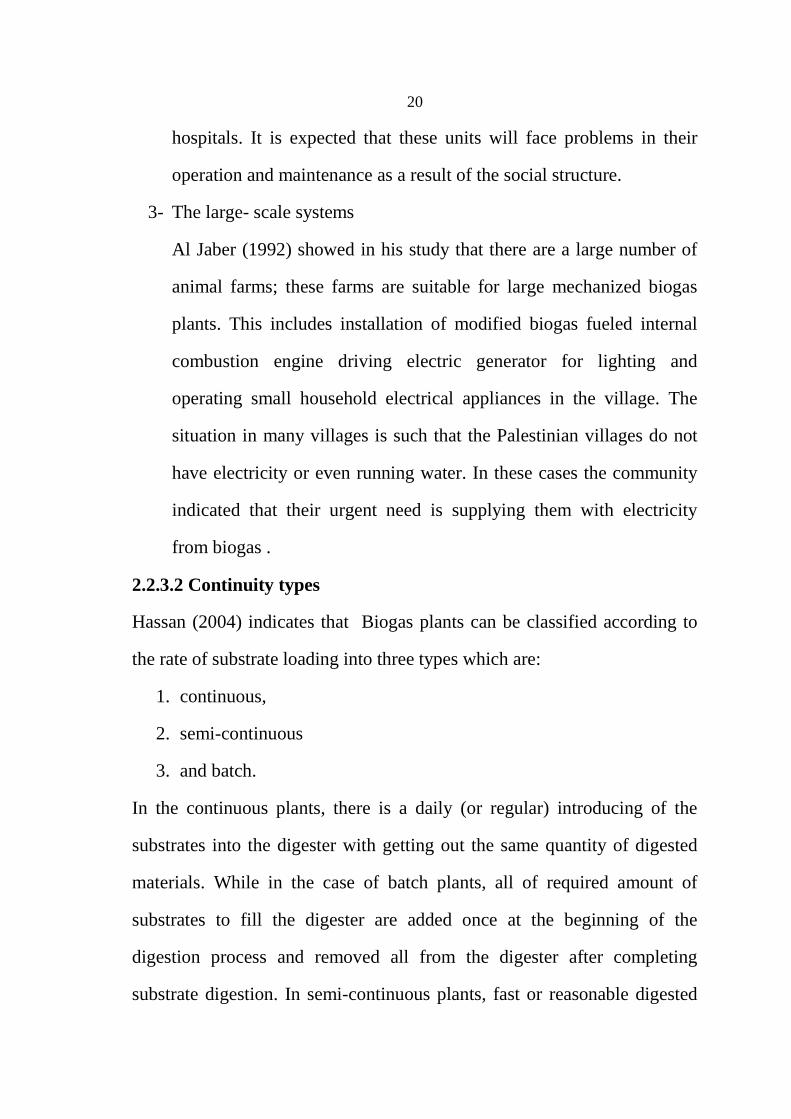
7- Up flow anaerobic sludge blanket
This UASB design was developed in 1980 in the Netherlands. It is
similar to the anaerobic filter in that it involves a high concentration of
immobilized bacteria in the reactor. However, the UASB reactors
contain no packing medium; instead, the CH4 forming bacteria are
concentrated in the dense granules of sludge blanket which covers the
lower part of the reactor.
The feed liquid enters from the bottom of the reactor and biogas is
produced while liquid flows up through the sludge blanket( Figure 2.8).
Many full-scale UASB plants are in operation in Europe using waste water
from sugar beet processing and other dilute wastes that contain mainly
soluble carbohydrates. (Singh. Myles and Dhussa, 1987).
Figure (2.8): Up flow anaerobic sludge blanket (UASB)

27
2.2.4 Main factors influencing the selection of biogas design
The main factors that influence the selection of a particular design or model
of a biogas plant according to Sustainable Development Department
(SDD), FAO(1997) are as follows (Al Seadi, 2008).
1.Economic
An ideal plant should be as low cost as possible in terms of the
production cost per unit volume of biogas both to the user of the biogas
as well as to the society which use the substance . At present, with
subsidy, the cost of a plant to the society is higher than to an individual
user.
2.Simple design
The design should be simple for construction operation and
maintenance.
3.Utilization of local materials
Use of easily available local materials should be emphasized in the
construction of a biogas plant. This is an important consideration.
4. Durability
Construction of a biogas plant requires certain degree of specialized
skill which may not be easily available. A plant of short life could also
be cost effective. Especially in situation where people are yet to be
motivated for the adoption of this technology and the necessary skill and
materials are not readily available, it is necessary to construct plants that
are more durable although this may require a higher initial investment.

28
4. Suitable design for the type of inputs
The design should be compatible with the type of inputs that would be
used. If plant materials such as rice straw, maize straw or similar
agricultural wastes are to be used then the batch feeding design or
discontinuous system should be used instead of a design for continuous
or semi continuous feeding.
6. Frequency of using inputs and outputs:
selection of a particular design and size of its various components also
depend on how frequently the user can feed the system and utilize the
gas.
2.2.5 Inputs and their characteristics
Since different organic materials have different bio-chemical characteristics
their potential for gas production also varies. Two or more of such
materials can be used together provided that some basic requirements for
gas production or for normal growth of methanogens are met. Some
characteristics of these inputs which have significant impact on the level of
gas production are described below (Karki, 1994).
1- C/N Ratio:
Karki (1994) says that the relationship between the amount of carbon
and nitrogen present in organic materials is expressed in terms of C/N
ratio. A C/N ratio ranging from 20 to 30 is considered optimum for
anaerobic digestion. If the C/N ratio is very high, the nitrogen will be
consumed rapidly by methanogens for meeting their protein requirements
and will no longer react on the left over carbon content of the material.
29
Karki (1994) continues : as a result, gas production will be low. On the
other hand, if the C/N ratio is very low, nitrogen will be liberated and
accumulated in the form of ammonia (NH4), NH4 will increase the pH
value of the content in the digester. A pH higher than 8.5 will start
showing toxic effect on methanogen population.
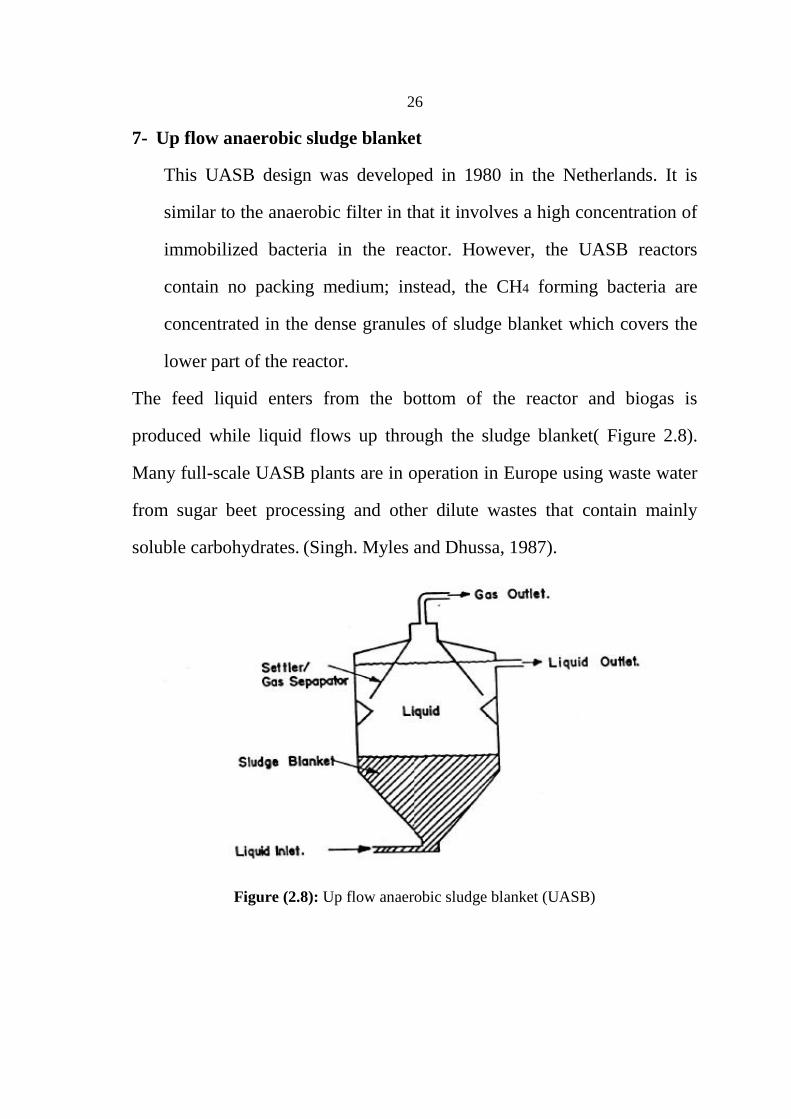
Animal waste, particularly cattle dung, has an average C/N ratio of about
24. The plant materials such as straw and sawdust contain a higher
percentage of carbon. The human excreta have a C/N ratio as low as 8.
C/N ratios of some of the commonly used materials are presented in
Table 2.8.
Table (2.4): C/N ratio of some organic materials Sample Raw Materials C/N Ratio 1. Duck dung 8 2. Human excreta 8 3. Chicken dung 10 4. Goat dung 12 5. Pig dung 18 6. Sheep dung 19 7. Cow dung/ Buffalo dung 24 8. Water hyacinth 25 9. Elephant dung 43 10. Straw (maize) 60 11. Straw (rice) 70 12. Straw (wheat) 90 13. Saw dust above 200
Source: (Karki. and Dixit 1984).
Materials with high C/N ratio could be mixed with those of low C/N
ratio to bring the average ratio of the composite input to a desirable
level.

30
2- Dilution and consistency of inputs
Before feeding the digester, the excreta such as fresh cattle dung has to
be mixed thoroughly with water. For proper solubilization of organic
materials, the ratio between solid and water should be 1:1 on unit
volume basis (i.e. same volume of water for a given volume of solid)
when the domestic wastes are used. However, if the dung is in dry form
(that has to be crushed before putting into the digester), the quantity of
water has to be increased accordingly to arrive at the desired
consistency of the inputs (e.g. ratio could vary from 1:1.25 to even 1:2).
The dilution should be made to maintain the total solids (TS) from 5 to
10 percent in order to facilitate its decomposition throughout the
bacteria . If the slurry mixture is too diluted, the solid particles can
precipitate at the bottom of the digester and if it too thick, the flow of
gas can be impeded. In both cases, gas production will be less than
optimum. Generally the users have the tendency to over dilute the
slurry. For thorough mixing of the cow dung and water (slurry), a Slurry
Mixture Machine can be fitted in the inlet of a digester (Karki, 1994).
3- volatile solids:
Sathianathan (1975) clarifies that the weight of organic burned off
when heated to about 538 °C is defined as volatile solids. The biogas
production potential to different organic material can be calculated on
the basis of their volatile solid content. The higher the volatile solid
content in unit volume of fresh dung, the higher the biogas production.

31
2.3 Biogas technology in the world
Historical evidence indicates that the AD process is one of the oldest
technologies. Biogas was used for heating bath water in Assyria during the
10th century BC and in Persia during the 16th century. AD advanced with
scientific research and, in the 17th century, Jan Baptista Van Helmont
established that flammable gases evolved from decaying organic matter.
Also, Count Alessandro Volta in 1776 showed that there was a relationship
between the amount of decaying organic matter and the amount of
flammable gas produced. In 1808, Sir Humphry Davy demonstrated the
production of methane by the anaerobic digestion of cattle manure (Lusk,
1997).
The industrialization of AD began in 1859 with the first digestion plant in
Bombay, India. By 1895, AD had made in roads into England where biogas
was recovered from a well-designed sewage treatment facility and fueled
street lamps in Exeter. Further AD advances were due to the development
of microbiology. Research led by Buswell and others in the 1930s
identified anaerobic bacteria and the conditions that promote methane
production (Lusk, 1997).
Barker in the mid 20 century was able to isolate and perform biochemical
studies on a large number of the bacteria involved in anaerobic digestion.
Today there is a desire for development of large scale bio digesters in
numerous applications. Four main reasons why bio digestion is being
pursued currently are according to Marchaim (1992):

32
1. Improvement of sanitation for treatment of high organic solid, high
nutrient, and high biological wastes and waste waters,
2. Reduction in unpleasant aroma associated with animal waste,
3. Production of energy,
4. Production of high quality fertilizers.
In Arab countries the applying of biogas plants started in 1970s in Egypt,
Morocco, Sudan and Algeria while it began in 1980s in other Asian Arab
countries as Iraq, Jordan and Yemen. In Egypt there were 18 family biogas
plants and 2 farm plants built till 1998, also two family biogas plants were
built in Keraeda and Um-Jar villages of Sudan in the period between 19/1
and 16/2/2001. There were two constructed plants for producing biogas
from liquid wastes in Jordan, one in Ain-Ghazal and the other in the central
station of Irbid. The number of biogas plants in Arab countries is very
small if it is compared with the numbers in other countries ( Hassan, 2004).
2.4 Potential of Biogas Production in Palestine
The climate in Palestine changes from region to region despite the small
area. The rainfall in the high regions reaches 510 mm with high humidity
and mild temperatures with a mean temperature of 18.5 ºC. While the
Jordan Valley has tropical climate and high evaporation rate, the mean
temperature in the Jordan Valley reaches 23.6 ºC and this is the highest
mean in the Palestine. At present all of the Palestinian energy needs are met
by importing oil products from Israeli companies. The prices are very high
and usually not affected by the international market price especially when
the international prices drop (Adwi,2008).
33
The problems facing rural families in disposing their animals waste, plants
residues, wastewater and domestic wastes are summarized in the following
points:
1. Transporting wastes after cleaning animal's farm along distance
between family home and wastes containers or disposing place.
2. Difficulty of farms wastes removing in winter season.
3. Lack of wastes collecting truck which cause over filling of wastes
containers (accumulation of wastes) and so distribution of bad odors
and insects.
4. Unavailability of enough number from waste containers.
5. Unavailability of wastewater disposing net.
6. Some families complain from unavailability of vacuum tank when
7. cesspit filled and form bad odors distributed when the cesspit
contents empty.
8. Some rural families complain from neighbor animal farms ( odors,
distribution of rats and flies)
Above problems indicates the suffering of rural Palestinian families in
disposing off wastes and this emphasized the opinion about negative
impacts of wastes on rural families life. The suitable solution to these
problems is building biogas digester at least for each Palestinian farm. The
number of animals during the years 2005-2006 appeared in the table (3.1).
(Adwi,2008).

34
Table (2.5): Livestock numbers by type in Palestine, 2005/2006 Chicken x 103 Goat Sheep Cows
Layers Broilers 3,372 31,533 387,123 793,874 36,284
Palestinian Agricultural relief Committees (PARC) (http://www.palarc.org/)
Considering the number of animals mentioned above, and estimating the
human and other organic wastes in the Palestinian rural community, the
yearly amounts of dry organic wastes can be estimated as in the table (3.2).
Table (2.6): Types of wastes in the West Bank and Gaza Strip
Prospects for Biogas Technology in the Palestinian Occupied Territories, November
1992
Based on the amount of organic wastes presented in table (3.2) the
theoretical amounts of the production of biogas in Palestine can be
calculated. At this point, it should be mentioned that 60% of goats and
sheep are raised in the mountains and their waste cannot be used, the 40%
left is raised in sheds and spend the day outside the shed, so only 50% of its
waste can be used. Then the yearly amount that considered as useful wastes
was 21,000tons/year out of the 105,000tons/year. This means that the
estimated amounts of biogas production to be presented are achievable. The
production is estimated to be 32 million m3/year of biogas. This is
equivalents 46.08 million NIS, which accounts 13% of Palestine spending
on oil products (Adwi,2008).
Waste type Yearly amount Animal wastes 22,000tons Chicken waste 17,000 tons Goats and sheep wastes 105,000 tons Kitchen wastes 8,000 tons

35
According to the findings and surveys from (Palestinian Centre for
Statistics) the animal ownership can be presented as follows: an average of
60% of the families in rural areas own animals and an average of 46% of
them owns one animal, 26 % of them own between 2-5 animals and 26% of
them own more than 6 animals (Adwi,2008). Unfortunately biogas
production is still under investigation and few demonstration projects are
existing in Palestine.
2.4 Previous studies
From the experimental studies about biogas in Palestine:
1. Ayoub Eshraideh,2002,Palestine: An Educational Biogas Prospect in
Tolkarm.
This digester was constructed in the middle of 2000 with 14 m3 digester
volume and 3 m3 holder volume that could store 60% from daily biogas
production, it was floating drum type digester fabricated locally by
PARC, it was located near the cows farm which belongs to agricultural
college of An-Najah National University. The fresh cow dung was
obtained from cow's farm which had 14 cows .The result when addition
rate of slurry added on daily basis was 50 L/day, the amount of biogas
produced is 0.685 m3, the average pH is 7.91 and the average ambient air
temperature is 34.5 ºC while for the 100 L/day rate , the amount of
biogas produced was 1.610 m3,the average pH is 7.96,and the average
ambient air temperature is 34 ºC .In both cases the slurry temperature
was 27 ºC.
36
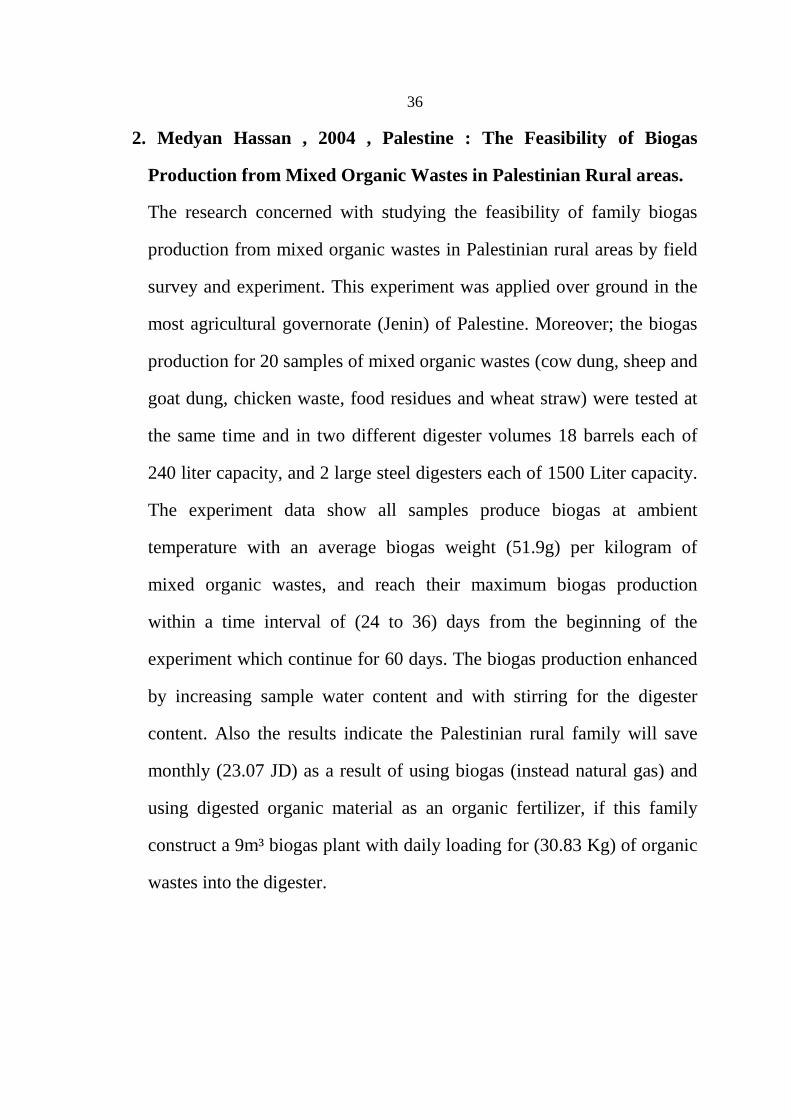
2. Medyan Hassan , 2004 , Palestine : The Feasibility of Biogas
Production from Mixed Organic Wastes in Palestinian Rural areas.
The research concerned with studying the feasibility of family biogas
production from mixed organic wastes in Palestinian rural areas by field
survey and experiment. This experiment was applied over ground in the
most agricultural governorate (Jenin) of Palestine. Moreover; the biogas
production for 20 samples of mixed organic wastes (cow dung, sheep and
goat dung, chicken waste, food residues and wheat straw) were tested at
the same time and in two different digester volumes 18 barrels each of
240 liter capacity, and 2 large steel digesters each of 1500 Liter capacity.
The experiment data show all samples produce biogas at ambient
temperature with an average biogas weight (51.9g) per kilogram of
mixed organic wastes, and reach their maximum biogas production
within a time interval of (24 to 36) days from the beginning of the
experiment which continue for 60 days. The biogas production enhanced
by increasing sample water content and with stirring for the digester
content. Also the results indicate the Palestinian rural family will save
monthly (23.07 JD) as a result of using biogas (instead natural gas) and
using digested organic material as an organic fertilizer, if this family
construct a 9m³ biogas plant with daily loading for (30.83 Kg) of organic
wastes into the digester.
37
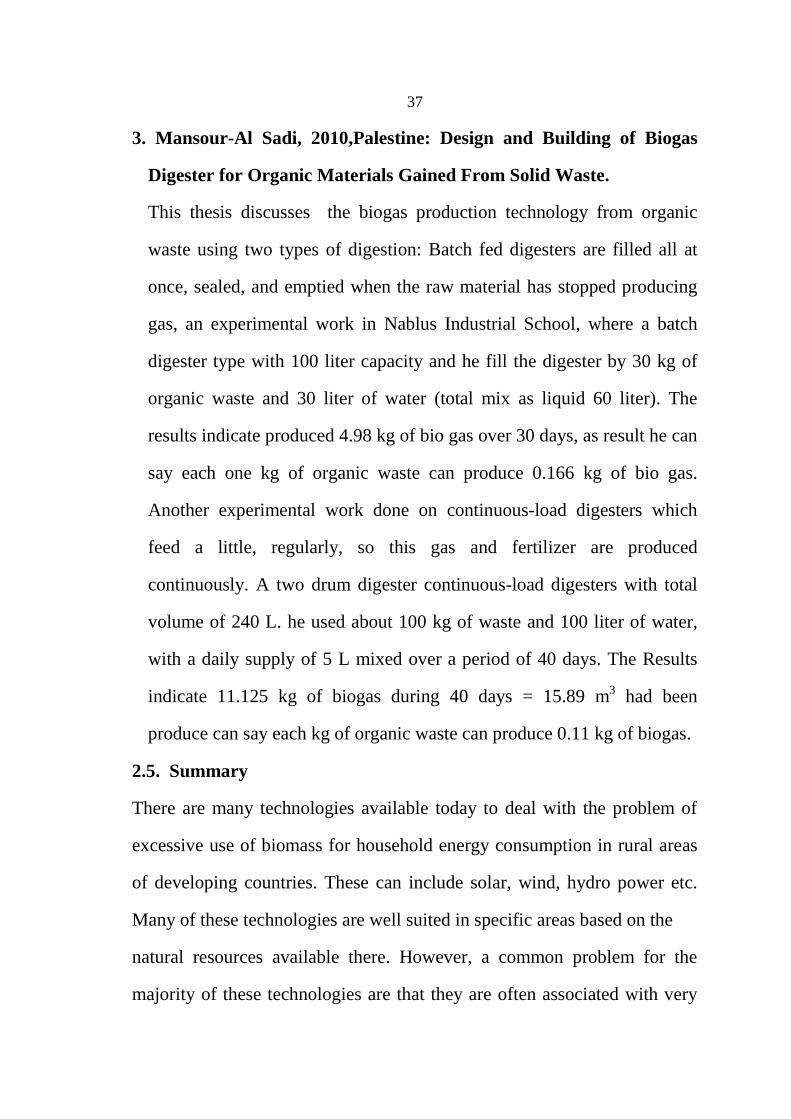
3. Mansour-Al Sadi, 2010,Palestine: Design and Building of Biogas
Digester for Organic Materials Gained From Solid Waste.
This thesis discusses the biogas production technology from organic
waste using two types of digestion: Batch fed digesters are filled all at
once, sealed, and emptied when the raw material has stopped producing
gas, an experimental work in Nablus Industrial School, where a batch
digester type with 100 liter capacity and he fill the digester by 30 kg of
organic waste and 30 liter of water (total mix as liquid 60 liter). The
results indicate produced 4.98 kg of bio gas over 30 days, as result he can
say each one kg of organic waste can produce 0.166 kg of bio gas.
Another experimental work done on continuous-load digesters which
feed a little, regularly, so this gas and fertilizer are produced
continuously. A two drum digester continuous-load digesters with total
volume of 240 L. he used about 100 kg of waste and 100 liter of water,
with a daily supply of 5 L mixed over a period of 40 days. The Results
indicate 11.125 kg of biogas during 40 days = 15.89 m3 had been
produce can say each kg of organic waste can produce 0.11 kg of biogas.
2.5. Summary
There are many technologies available today to deal with the problem of
excessive use of biomass for household energy consumption in rural areas
of developing countries. These can include solar, wind, hydro power etc.
Many of these technologies are well suited in specific areas based on the
natural resources available there. However, a common problem for the
majority of these technologies are that they are often associated with very
38
high initial capital costs and a dependency on foreign financing and
expertise. One solution that has proven itself to be very useful in most rural
areas in developing countries is the use of biogas.
The biogas energy is considered one of the best alternative energy
resources in the Palestine especially in rural areas. The rural areas are
considered an excellent environment to construct biogas systems.
Hence, previous studies indicated that 60% of Palestinian villages have
their own animals, which their wastes can be used for the generation of the
biogas. Compared to other countries in the world, the use of biogas
technology in Palestine is still under investigation and few demonstration
projects are existing in Palestine .
By reviewing the previous literatures, it has been cleared that the process of
generating biogas from organic waste could be technically clear, efficient
and simple operation and feasible in terms of cost, and meeting the
demands of renewable energy in Palestine.
From previous studies, it could be concluded that biogas technology
contribute to the sustainable development of Palestinian rural areas by
providing them with a wide variety of socioeconomic benefits, including
personal or household impacts, health impacts, social, economic and
environmental impacts.
Public support is very important in the promotion of biogas. If the rural
communities don't have confidence in investing in biogas they will
continue to use firewood and other biomass that are already available.
Spreading information about biogas and it's positive effects is important.

39
One approach is for the government to implement pilot biogas projects in
Palestinian rural areas to showcase the benefits of biogas technology. It is
important to build up a local knowledge base to ensure that there is long
term competence in the building and maintaining of biogas plants.
One major objective of the study is to explain the benefits of biogas
technology and to encourage the use of this technology in Palestinian rural
areas through providing small scale biogas unit for each Palestinian rural
families in order to encourage them to utilize this digester and other
designs of digesters.

40
Chapter Three
Methodology

41
This chapter includes the following information; the experimental setup;
the experimental program Field measurements and Lab analysis.
3.1 Experimental setup
3.1.1 Materials and equipments
The used materials and equipments are:
1. Biogas Unit (Digester) : used for anaerobic digesting of introducing
organic waste sample.
The biogas unit consists of the following major parts:
a. Digester tank (outer tank): Plastic tank cylindrical external diameter
of 125 cm and a height of 128 cm. It is the main part where the
biological processes take place.
b. Gas storage tank (inner tank): Plastic tank cylindrical internal
diameter of 106 cm and a height of 128 cm. to collect the biogas
produced, and when the amount of biogas is increasing the volume of
floating tank is proportionally increased.
c. Base square-shaped : made from iron (125 cm in diameter and height
of 25 cm)
d. The inlet with a Blender for feeding the Digester tank where water is
mixed with waste to form slurry directed through plastic pipe to the
digester tank .
e. The outlet, which is prepared for getting rid of the residue water
(sludge) that could be used in agricultural irrigation and fertilizer
because of many useful minerals in it.

42
f. Valves : gas valve to withdraw biogas and slurry valves to get out
slurry and clean. Figure (3.1) shows the Schematic diagram of
digester.
Figure 3.1: Schematic diagram of Biogas Unit
1. Digester tank 2. Gas storage tank 3. Blender 4. Base 5. Gas valve 6.
Slurry valve7. Cleaning valve 8. Inlet pipe 9. Gravel

43
Photo 3.1 : Biogas Unit
2. Air compressor to withdraw biogas from the digester.
3. Electronic balance used for weighing organic waste sample and used to
weigh produced biogas that withdrawn from the digesters .
4. Gas cylinder for collecting biogas from the digesters .
5. Thermometer to record temperatures .
6. Plastic vessel for measuring wastes and water volumes.
7. Steel funnels for simplifying substrate introducing into the digesters .
8. plastic vessel for wastes mixing .
9. PVC pipes of different lengths and connectors for connection purposes.
44
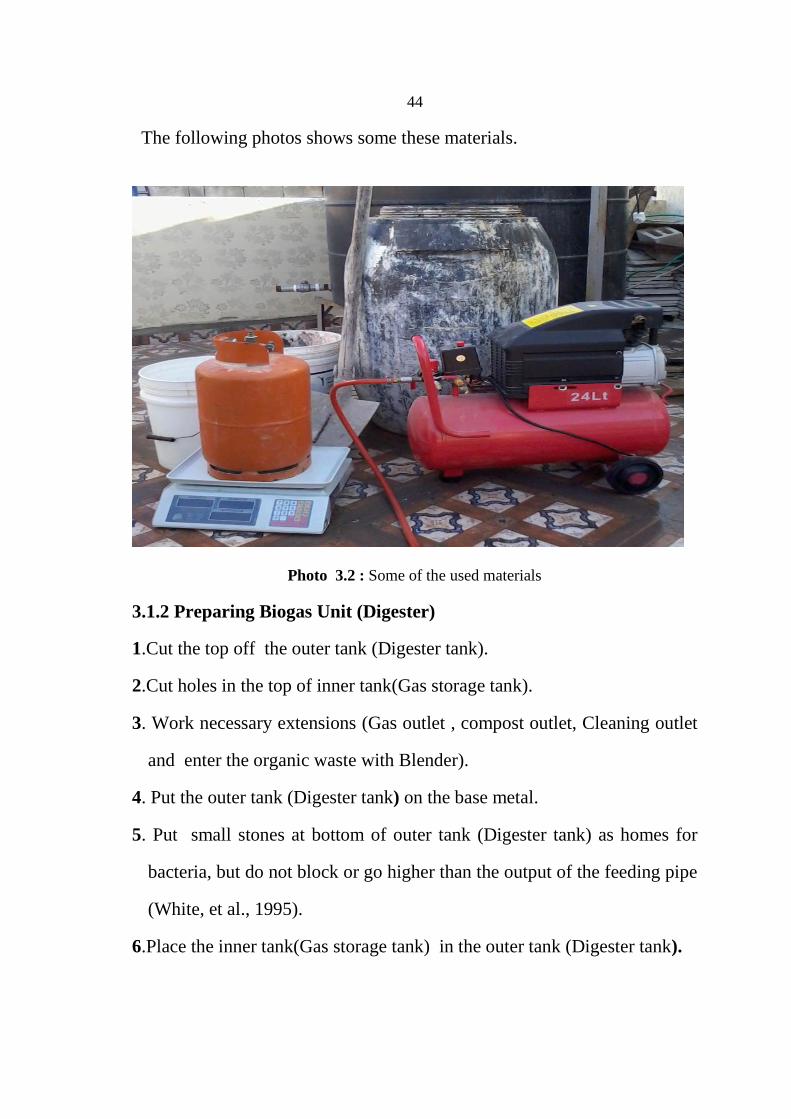
The following photos shows some these materials.
Photo 3.2 : Some of the used materials
3.1.2 Preparing Biogas Unit (Digester)
1.Cut the top off the outer tank (Digester tank).
2.Cut holes in the top of inner tank(Gas storage tank).
3. Work necessary extensions (Gas outlet , compost outlet, Cleaning outlet
and enter the organic waste with Blender).
4. Put the outer tank (Digester tank) on the base metal.
5. Put small stones at bottom of outer tank (Digester tank) as homes for
bacteria, but do not block or go higher than the output of the feeding pipe
(White, et al., 1995).
6.Place the inner tank(Gas storage tank) in the outer tank (Digester tank).
45
7. Fill half outer tank (Digester tank) with fresh cow manure , has to be
mixed with water at the ratio of 1:1 on a unit weigh basis (i.e. same
weigh of water in a given weigh of manure) .
fresh cow manure is the most suitable material for biogas plants because
of the methane producing bacteria already contained in the stomach of
ruminants .
8. Wait three weeks or so with valve closed until the inner tank(Gas storage
tank) starts to rise. Release all gas to the air and let it rise again in order
to evacuate the (CO2) -which is more than the Methane - resulted from
the first amount of production so the bacteria activate again and produce
the required gas .
9. Try to light gas coming out. If it doesn’t light it has too much CO2 in it.
Release it and let it rise again. then start feeding.
3.2 Experimental Program
3.2.1 Wastes Collection and Preparation
The used organic wastes in this experiment are:-
1. cow manure .
2. food residues.
3. cow manure mixed with food residues.
4. poultry manure mixed with food residues.
- Cow manure and poultry manure which were collected from neighboring
farms .
- Food residues were separated from local community domestic solid
waste disposal containers.

46
3.2.2 Samples Compositions
Four samples of organic wastes were introduced in biogas unit and the
composition of each sample with ratio of each organic waste type and
water dilution factor are found in table (3.1).
Table 3.1: Samples Compositions. No sample
Sample Composition Waste added (kg)
Water Dilution Factor (kg)
Time added (day )
cow Organic food residues
poultry
1. 12 0 0 12 14 2. 0 12 0 12 14 3. 6 6 0 12 14 4. 0 6 6 12 14
3.2.3 Sample preparing and introducing
For each sample, the required waste weight was weighted by Electronic
balance and drained in the mixing steel vessel were mixed with required
amount of water at the ratio of 1:1 on a unit kg (same kg of organic wastes
for a given kg of water) . The organic food residues were grounded by a
blender in order to transfer this substance into small pieces , then the slurry
was introduced into the digester. Each sample from waste is added daily
to the digester for 14 days . The use of this period of time is to accomplish
the experiment in an suitable time.
The main aim of preparing these samples is studying the effect of each
waste type on the samples productivity for biogas of the anaerobic
digestion of mixed organic wastes ,to evaluate efficiency of Biogas Units in
Palestinian rural areas. The air temperatures at the experiment location
were recorded every day by using a thermometer .

47
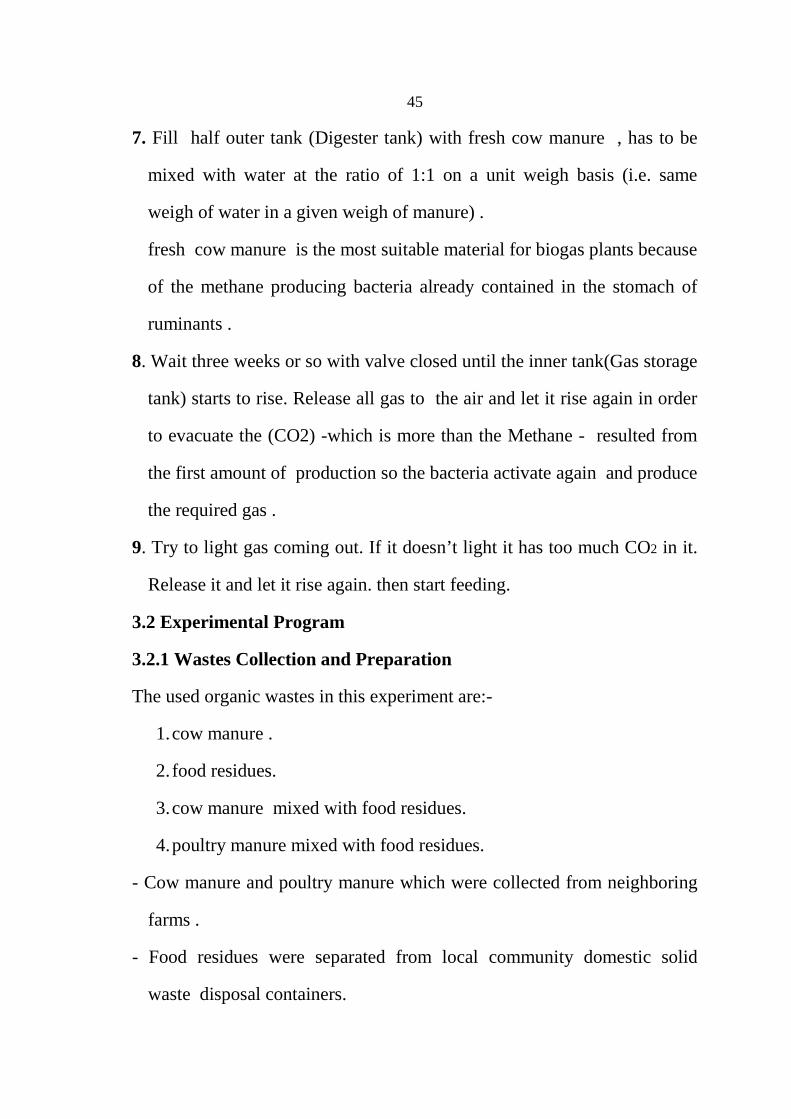
The following photos explain Sample preparing and introducing samples.
Photo 3.3: Mixing samples
48
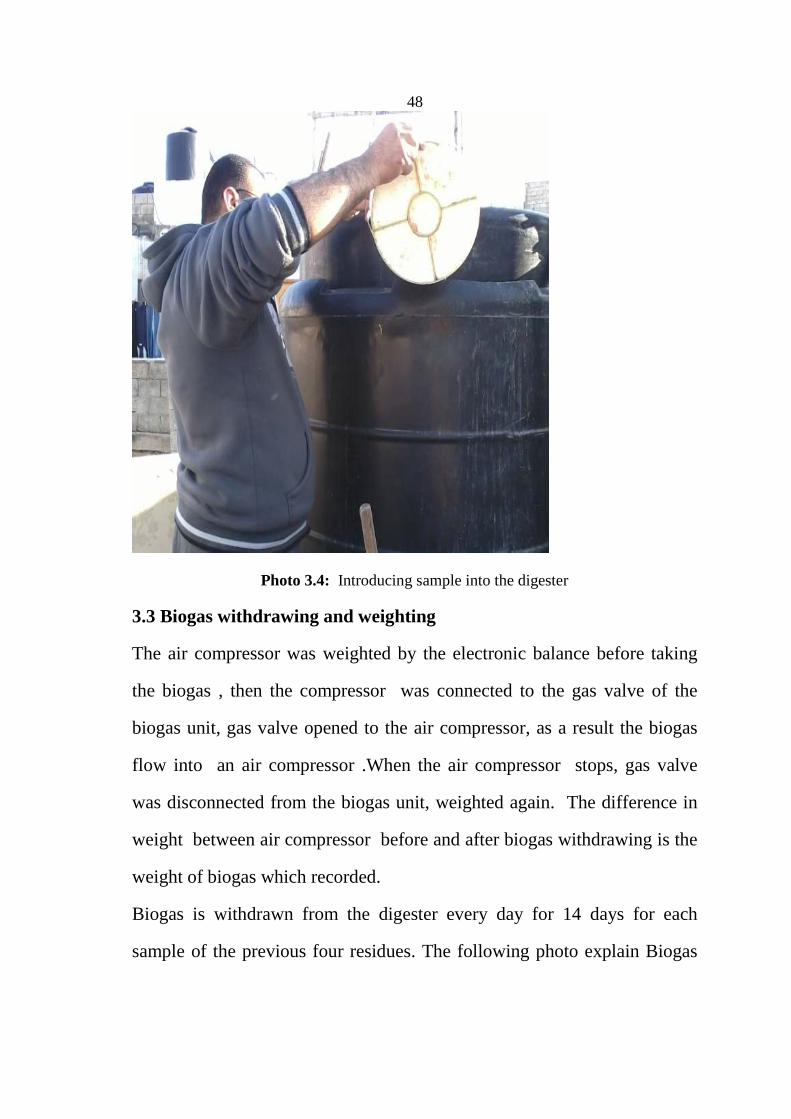
Photo 3.4: Introducing sample into the digester
3.3 Biogas withdrawing and weighting
The air compressor was weighted by the electronic balance before taking
the biogas , then the compressor was connected to the gas valve of the
biogas unit, gas valve opened to the air compressor, as a result the biogas
flow into an air compressor .When the air compressor stops, gas valve
was disconnected from the biogas unit, weighted again. The difference in
weight between air compressor before and after biogas withdrawing is the
weight of biogas which recorded.
Biogas is withdrawn from the digester every day for 14 days for each
sample of the previous four residues. The following photo explain Biogas

49
withdrawing and weighting.The operation was repeated three times a day
and the produced quantities were calculated .
Photo 3.5: Withdrawing biogas from digester into air compressor
3.4. Lab analysis
To evaluate quality biogas, will be measured the methane (CH4) ratio in the
produced biogas for different waste mixtures, by using Gas
Chromotography (GC) present at An-Najah National University.
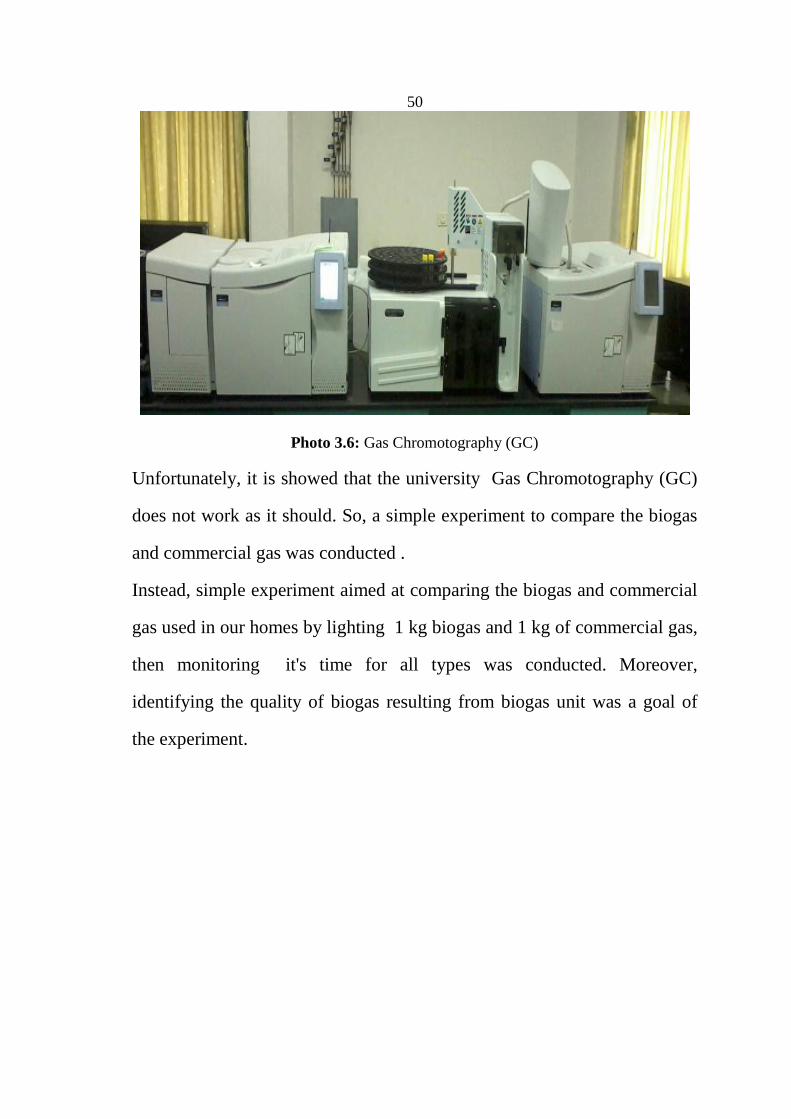
50
Photo 3.6: Gas Chromotography (GC)
Unfortunately, it is showed that the university Gas Chromotography (GC)
does not work as it should. So, a simple experiment to compare the biogas
and commercial gas was conducted .
Instead, simple experiment aimed at comparing the biogas and commercial
gas used in our homes by lighting 1 kg biogas and 1 kg of commercial gas,
then monitoring it's time for all types was conducted. Moreover,
identifying the quality of biogas resulting from biogas unit was a goal of
the experiment.

51
Chapter Four
Results & Discussion
52
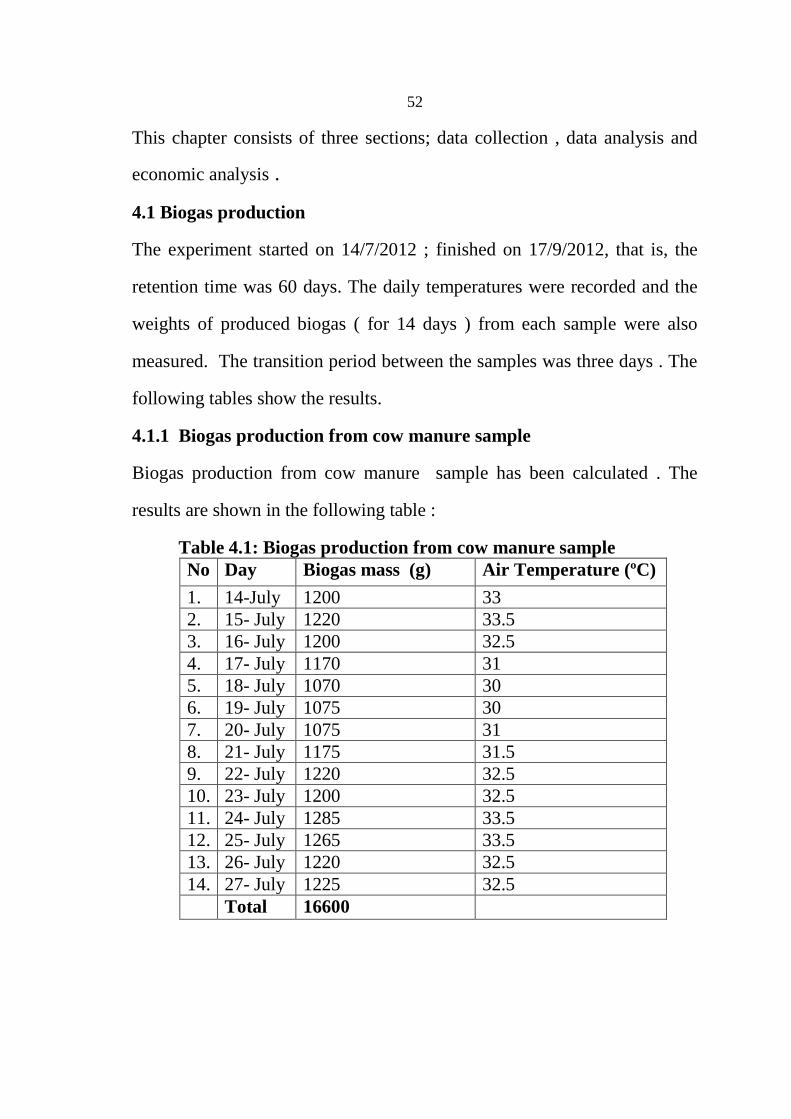
This chapter consists of three sections; data collection , data analysis and
economic analysis .
4.1 Biogas production
The experiment started on 14/7/2012 ; finished on 17/9/2012, that is, the
retention time was 60 days. The daily temperatures were recorded and the
weights of produced biogas ( for 14 days ) from each sample were also
measured. The transition period between the samples was three days . The
following tables show the results.
4.1.1 Biogas production from cow manure sample
Biogas production from cow manure sample has been calculated . The
results are shown in the following table :
Table 4.1: Biogas production from cow manure sample No Day Biogas mass (g) Air Temperature (ºC) 1. 14-July 1200 33 2. 15- July 1220 33.5 3. 16- July 1200 32.5 4. 17- July 1170 31 5. 18- July 1070 30 6. 19- July 1075 30 7. 20- July 1075 31 8. 21- July 1175 31.5 9. 22- July 1220 32.5 10. 23- July 1200 32.5 11. 24- July 1285 33.5 12. 25- July 1265 33.5 13. 26- July 1220 32.5 14. 27- July 1225 32.5 Total 16600

53
Figure 4.1: Biogas production with time for cow manure sample.
Table (4.1) shows that biogas production from cow manure sample ranged
between ( 1070 g) on the 18 th of July to with a temperature of (30 ºC)
which is the lowest degree to (1285 g) on the 24th of the same month with
a temperature of (33.5 ºC) which is the highest degree of the temperature at
the same month. Also, during the fourteenth days, the total amount of the
biogas production from cow manure reached 16600 g.
From the previous table , it can be concluded that Biogas production from
cow manure sample continue to increase due to the increasing in the
temperature . The lowest amount of the biogas(g) matches the lowest in the
temperature (ºC).Similarly, the highest one matches the highest temperature
degree. This result could be an indicator for a relationship which will be
clarified in the second section. Moreover, it indicates the importance of the
temperature degree in the biogas process.

54
4.1.2 Biogas production from cow manure mixed with food residues
Biogas production from cow manure mixed with food residues sample
has been calculated . The results are shown in the following table :
Table 4.2 Biogas production from cow manure mixed with food
residues
No Day Biogas mass (g) Air Temperature (ºC) 1. 31- July 1200 33 2. 1-Aug 1150 32 3. 2- Aug 1200 32.5 4. 3- Aug 1170 32 5. 4- Aug 1150 32 6. 5- Aug 1150 31.5 7. 6- Aug 1200 32 8. 7- Aug 1200 33 9. 8- Aug 1150 31.5 10. 9- Aug 1200 31.5 11. 10- Aug 1250 32 12. 11- Aug 1300 32.5 13. 12- Aug 1330 33 14. 13- Aug 1330 33
Total 16980

55
Figure 4.2:Biogas production with time for cow manure mixed with food residues
Table (4.2) shows that biogas production from cow manure mixed with
food residues sample in the month ranges from ( 1150 g) on the first
,4,5and 8th of August to with a temperature of (31.5 ºC – 32 ºC ) which is
the lowest degrees to (1330 g) on the 12 and the 13 of the same month
with a temperature of (33 ºC) which is the highest degree of the
temperature at the same month. Also, during the fourteenth days , the total
amount of the biogas production from cow manure reached 16980 g.
The behavior of the curve can be explained by two stages, the first one
shows nearly a steady amount of biogas production in the first ten days of
the month where the temperature ranged from(31.5) to ( 33.0) . This
duration of the production contains the lowest amount (per gram) which is (
1150 g) in the second fifth and sixth days of the duration of the experiment.
The second stage started at eleventh day of the experience , the biogas
production starts to continue its increasing from (1250 g) on the eleventh
day of the month with temperature degree of ( 32.0) to reach ( 1330 g) on

56
the fourteenth day with a temperature of ( 33.0) which is the maximum
during the experiment days.
Also, it can be concluded as in the case of cow manure mixed with food
residues sample, this result could be an indicator for a relationship which
will be clarified in the second section. Moreover, it indicates the
importance of the temperature degree in the biogas process.
4.1.3 Biogas production from poultry manure mixed with food residues
Biogas production from poultry manure mixed with food residues sample
has been calculated . The results are shown in the following table :
Table 4.3: Biogas production from poultry manure mixed with food
residues sample No Day Biogas mass (g) Air Temperature (ºC) 1. 17- Aug 1500 34 2. 18- Aug 1450 33 3. 19- Aug 1375 32.5 4. 20- Aug 1250 32 5. 21- Aug 1375 32.5 6. 22- Aug 1425 33 7. 23- Aug 1450 33.5 8. 24- Aug 1435 33 9. 25- Aug 1380 33.5 10 26- Aug 1410 33 11. 27- Aug 1450 34 12. 28- Aug 1500 33.5 13. 29- Aug 1550 33 14. 30- Aug 1575 33.5 Total 20125

57
Figure 4.3: Biogas production with time for poultry manure mixed with food residues
sample
Table (4.3) shows that biogas production from poultry manure mixed with
food residues ranges from ( 1250 g) on the 20th of August to with a
temperature of (32 ºC) which is the lowest degree to (1575 g) on the 30th
of the same month with a temperature of (33.5 ºC) which is the highest
degree of the temperature at the same month. Also, during the fourteenth
days , the total amount of the biogas production from poultry manure
mixed with food residues reached 20125 g.
4.1.4 Biogas production from food residues
Biogas production from food residues sample has been calculated . The
results are shown in the following table :

58
Table 4.4: Biogas production from food residues sample No Day Biogas mass (g) Air Temperature (ºC) 1. 4- Sep 1375 33.5 2. 5- Sep 1375 33 3. 6- Sep 1375 33.5 4. 7- Sep 1500 34 5. 8- Sep 1375 31.5 6 9- Sep 1450 32 7. 10- Sep 1500 33.5 8. 11- Sep 1500 33 9. 12- Sep 1750 34.5 10. 13- Sep 1625 34.5 11. 14- Sep 1750 34 12. 15- Sep 1750 33.5 13. 16- Sep 1875 35 14. 17- Sep 1960 35.5 Total 22160
Figure 4.4: Biogas production with time for food residues sample
Table (4.4) shows that biogas production from food residues sample
ranges from ( 1375 g) on the 4,5,6 of September with a temperature of (33
ºC - 35.5 ºC) which are the lowest degrees to (1960 g) on the 17th of the
same month with a temperature of (35 ºC) which is the highest degree of

59
the temperature at the same month. Also, during the fourteenth days , the
total amount of the biogas production from food residues sample reached
22160 g. The results from the previous tables show that there is an effect of
the temperature on the biogas production from its three resources which
give an indicator for conducting the statistical analyses in order to clarify
the results precisely. These results will be discussed widely in section
(4.2.Statistical analysis).
In general, the finding of the previous tables and figures seem to indicates
that there is a relationship between biogas production in all cases and the
temperature.
Table 4.5: Biogas production during 14 days from organic wastes N0. Sample Biogas production (Kg) 1. Cow manure 16.600 2. Cow manure mixed with food residues 16.980 3. Poultry manure mixed with food residues 20.125 4. Food residues 22.160
By comparing the results in the previous tables and figures for samples of
the four resources of the biogas production : cow manure, cow manure
mixed with food residues, Poultry manure mixed with food residues and
food residues; the data of the tables show that the sample of food residues
produces was the highest biogas production weights (22.160 Kg biogas).
In the second place , the sample of Poultry manure mixed with food
residues weights (20.125 Kg biogas), the sample of cow manure mixed
with food residues produces (16.980Kg biogas). Finally, the sample of cow
manure produces (16.600 Kg biogas).

60
The monthly average for Palestinian rural families consumption from
commercial gas is two gas cylinder of butane (24 kg) which is used for
cooking , heating , bread making and other purposes .The monthly weight
of biogas required for Palestinian rural family to cover its monthly
requirement from commercial gas is (48) Kg based on calorific value of
butane.
The small scale biogas unit which used in the study experiments is
continuous-load digester require a daily addition of organic waste, so that
biogas is produced continuously. Therefore, the amount of biogas
production from the small scale biogas unit may be adequate for one
home consumption per a month.
4.2 Statistical analysis
In order to clarify the relationship between biogas production from its four
major resources and the temperature statistically, the Statistical Package
for Social Sciences (SPSS) program, which is the most famous statistical
program used for evaluation and calculations of data in social sciences
studies, was used in the study for the experimental data evaluation and
calculations.
In order to identify the relationship between biogas mass and manure,
(Linear Regression Test) has been used and the following results has been
found:
4.2.1 The Relationship between Biogas production from cow manure
and the temperature :
The following tables show the results :

61
Table (4.6): Model Summary
Model R Adjusted R Square Std. Error of the Estimate 0.855 0.708 36.74045
Table ( 4.7): ANOVA Model Sum of Squares df Mean Square F Sig. Regression 43894.532 1 43894.532 32.518 *0.000 Residual 16198.326 12 1349.860 Total 60092.857 13
Table (4.8) : Coefficients
Model
Unstandardized Coefficients
Standardized Coefficients
t Sig. B Std. Error Beta (Constant) -211.285 245.179 -0.862- 0.406 Temperature 43.754 7.673 0.855 5.702 *0.000
Table (4.6) shows that R is ( 0.855) which means a strong relationship
between the independent variable ( Temperature ) and the dependant one
(Biogas production from cow manure) . P value (0.000) which is less than
(0.05) as indicated in table ( 4.7) . Also, the equation as in table (4.8) is:
Y(Biogas production from cow manure) = -211.285 + 43.754 X( Temperature )
4.2.2 The Relationship between Biogas production from cow manure
mixed with food residues and the temperature :
The following tables show the results :
Table (4.9) : Model Summary Model
R Adjusted R Square Std. Error of the Estimate 0.643 0.364 51.80550

62
Table (4.10) : ANOVA Model Sum of Squares df Mean Square F Sig. Regression 22680.000 1 22680.000 8.451 *0.013 Residual 32205.714 12 2683.810 Total 54885.714 13
Table(4.11) : Coefficients
Model
Unstandardized Coefficients
Standardized Coefficients
t Sig. B Std. Error Beta (Constant) -1109.143- 798.880 -1.388- 0.190 Temperature 72.000 24.768 0.643 2.907 *0.013
Table (4.9) shows that R is (0.643) which means a strong relationship
between the independent variable ( Temperature ) and the dependant one
(Biogas production from cow manure mixed with food residues ) . P value
(0.013) which is less than (0.05) as indicated in table (4.10)
.Also, the equation as in (4.11) is:
Y (Biogas production from cow manure mixed with food residues)
= -1109.143+ 72X( Temperature )
4.2.3 The Relationship between Biogas production from poultry
manure mixed with food residues and the temperature :
The following tables show the results :
Table (4.12) : Model Summary Model
R Adjusted R Square Std. Error of the Estimate 0.665 0.395 63.63656

63 Table (4.13) : ANOVA Model Sum of Squares df Mean Square F Sig. 1 Regression 38442.161 1 38442.161 9.493 *0.010
Residual 48595.339 12 4049.612 Total 87037.500 13
Table (4.14) : Coefficients
Model
Unstandardized Coefficients
Standardized Coefficients
t Sig. B Std. Error Beta (Constant) -1727.924- 1027.529 -1.682- 0.118 Temperature 95.508 30.999 0.665 3.081 *0.010
Table (4.12) shows that R is (0.665) which means a strong relationship
between the independent variable ( Temperature ) and the dependant one
(Biogas production from poultry manure mixed with food residues ) . P
value (0.013) which is less than (0.05) as indicated in table (4.13)
.Also, the equation as in table (4.14) is
Y (Biogas production from poultry manure mixed with food residues)
= -1727.924+ 95.508X ( Temperature )
4.2.4 The Relationship between Biogas production from food residues
and the temperature :
The following tables show the results :
Table (4.15 ) Model Summary Model
R Adjusted R Square Std. Error of the Estimate 0.795 0.601 126.82875

64 Table (4.16) ANOVA Model Sum of Squares df Mean Square F Sig. 1 Regression 331209.330 1 331209.330 20.591 *0.001
Residual 193026.384 12 16085.532 Total 524235.714 13
Table (4.17) Coefficients
Model
Unstandardized Coefficients
Standardized Coefficients
t Sig. B Std. Error Beta (Constant) -3292.734- 1075.003 -3.063- *0.010 Temperature 144.768 31.904 0.795 4.538 *0.001
Table (4.15 ) shows that R is (0.795) which means a strong relationship
between the independent variable ( Temperature ) and the dependant one
(Biogas production from food residues ) . P value (0.001) which is less
than (0.05) as indicated in table (4.16) .Also, the equation as in table (4.17)
is :
Y(Biogas production from food residues) = -3292.734+ 144.768X ( Temperature )
The results in the previous tables show a strong relationship between
temperature and biogas production from organic wastes . The temperature
is one of the most important physical factors used to improve the
anaerobic digestion of organic materials. The study reveals that anaerobic
digestion can occur in the mesophilic range between 30 to 35 °C and
biogas production affected positively with temperature changes and so the
quantity of the produced biogas because the methanogens are inactive in
extreme high and low temperatures. The optimum temperature for
satisfactory gas production is said to be 30-35°C. Doing the experiment in
warm months will enhance samples production for biogas with decreasing
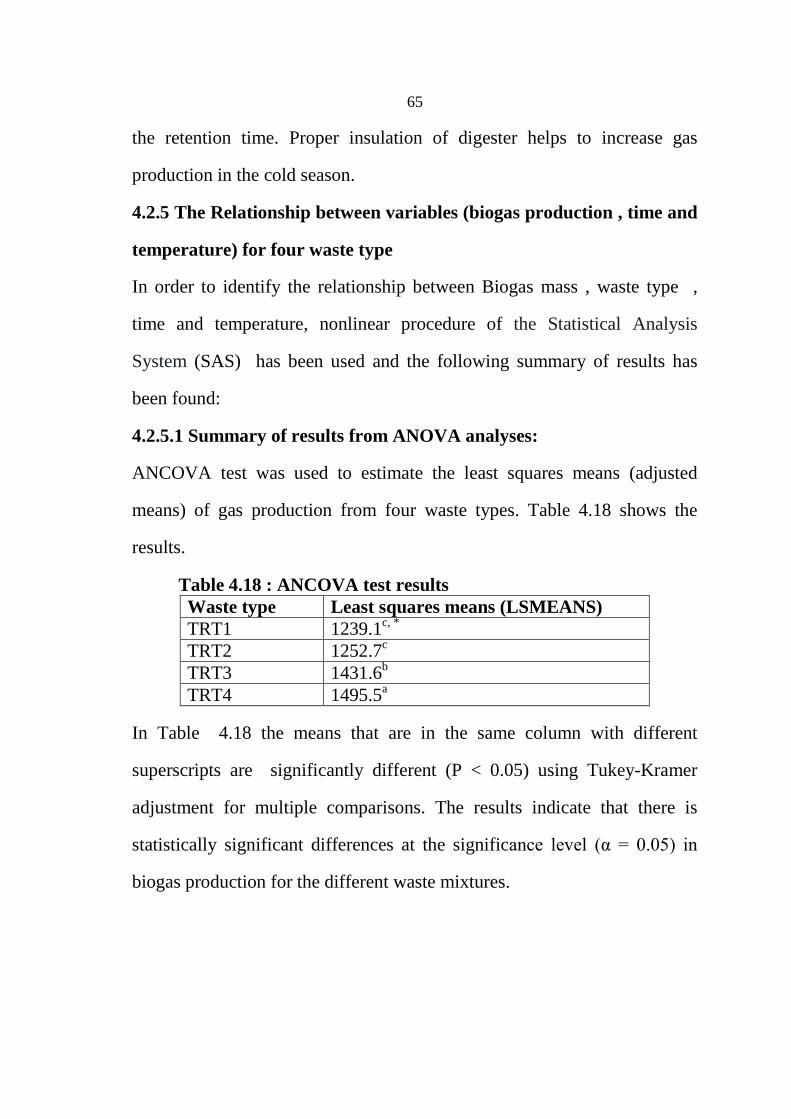
65
the retention time. Proper insulation of digester helps to increase gas
production in the cold season.
4.2.5 The Relationship between variables (biogas production , time and
temperature) for four waste type
In order to identify the relationship between Biogas mass , waste type ,
time and temperature, nonlinear procedure of the Statistical Analysis
System (SAS) has been used and the following summary of results has
been found:
4.2.5.1 Summary of results from ANOVA analyses:
ANCOVA test was used to estimate the least squares means (adjusted
means) of gas production from four waste types. Table 4.18 shows the
results.
Table 4.18 : ANCOVA test results Waste type Least squares means (LSMEANS) TRT1 1239.1c, * TRT2 1252.7c TRT3 1431.6b TRT4 1495.5a
In Table 4.18 the means that are in the same column with different
superscripts are significantly different (P < 0.05) using Tukey-Kramer
adjustment for multiple comparisons. The results indicate that there is
statistically significant differences at the significance level (α = 0.05) in
biogas production for the different waste mixtures.
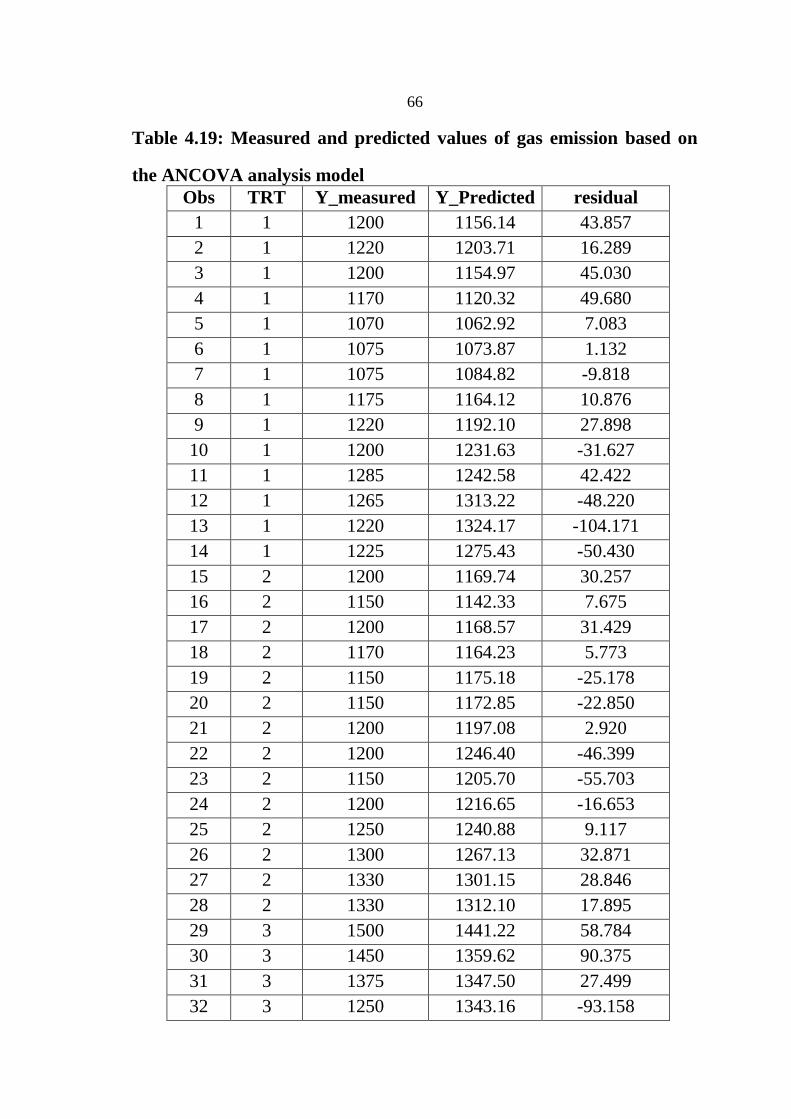
66
Table 4.19: Measured and predicted values of gas emission based on
the ANCOVA analysis model
residual Y_Predicted Y_measured TRT Obs 43.857 1156.14 1200 1 1 16.289 1203.71 1220 1 2 45.030 1154.97 1200 1 3 49.680 1120.32 1170 1 4 7.083 1062.92 1070 1 5 1.132 1073.87 1075 1 6 -9.818 1084.82 1075 1 7 10.876 1164.12 1175 1 8 27.898 1192.10 1220 1 9 -31.627 1231.63 1200 1 10 42.422 1242.58 1285 1 11 -48.220 1313.22 1265 1 12 -104.171 1324.17 1220 1 13 -50.430 1275.43 1225 1 14 30.257 1169.74 1200 2 15 7.675 1142.33 1150 2 16 31.429 1168.57 1200 2 17 5.773 1164.23 1170 2 18
-25.178 1175.18 1150 2 19 -22.850 1172.85 1150 2 20 2.920 1197.08 1200 2 21
-46.399 1246.40 1200 2 22 -55.703 1205.70 1150 2 23 -16.653 1216.65 1200 2 24 9.117 1240.88 1250 2 25 32.871 1267.13 1300 2 26 28.846 1301.15 1330 2 27 17.895 1312.10 1330 2 28 58.784 1441.22 1500 3 29 90.375 1359.62 1450 3 30 27.499 1347.50 1375 3 31 -93.158 1343.16 1250 3 32

67
5.597 1369.40 1375 3 33 21.572 1403.43 1425 3 34 -0.996 1451.00 1450 3 35 9.670 1425.33 1435 3 36
-92.898 1472.90 1380 3 37 -37.232 1447.23 1410 3 38 -100.725 1550.72 1450 3 39 -5.751 1505.75 1500 3 40 69.916 1480.08 1550 3 41 47.347 1527.65 1575 3 42 -74.096 1449.10 1375 4 43 -48.429 1423.43 1375 4 44 -95.997 1471.00 1375 4 45 -37.873 1537.87 1500 4 46 -29.634 1404.63 1375 4 47 21.136 1428.86 1450 4 48 -14.801 1514.80 1500 4 49 10.866 1489.13 1500 4 50 76.377 1673.62 1750 4 51 -59.574 1684.57 1625 4 52 54.475 1695.52 1750 4 53 180.444 1569.56 1750 4 54 45.743 1829.26 1875 4 55 -28.637 1988.64 1960 4 56

68
Y_Predicted
1000
1100
1200
1300
1400
1500
1600
1700
1800
1900
2000
Y_measured
1000 1100 1200 1300 1400 1500 1600 1700 1800 1900 2000
Figure 4.5 : Plot of predicted gas emission vs. measured gas values (ANOVA analysis
model)
4.2.5.2 Summary of results from nonlinear procedure of SAS (PROC
NLIN):
In order to clarify the relationship between biogas production from the four
mixtures and the temperature and time statistically, nonlinear procedure of
SAS was used. The nonlinear analyses were based on the following model:
Y = C*(Time) X1 * (Temp) X2 , where Y is biogas emission

69
Table 4.20: Nonlinear analyses results C X1 X2 Estimate SE Estimate SE Estimate SE
TRT1 19.14 13.10 0.0164 0.0102 1.1827 0.1971 TRT2 1.1339 1.6673 0.0416 0.00999 1.9863 0.4231 TRT3 0.9107 2.3563 0.0140 0.0160 2.0962 0.7397 TRT4 0.9991 1.4573 0.0997 0.0190 2.0423 0.4194
Average 5.545925 4.645225 0.042925 0.0137975 1.826875 0.444825
Biogas predicted:
1.826875 0.042925
Y = 5.545925 * (Time) * (Temp)
Figure 4.6: Relationship of biogas emission with temperature
Figure 4.5 clearly indicates that the production of biogas is dependent
upon temperature. Temperature factor is critical value in the beginning of
methane formation. One of the inherent limitations or constraints of biogas
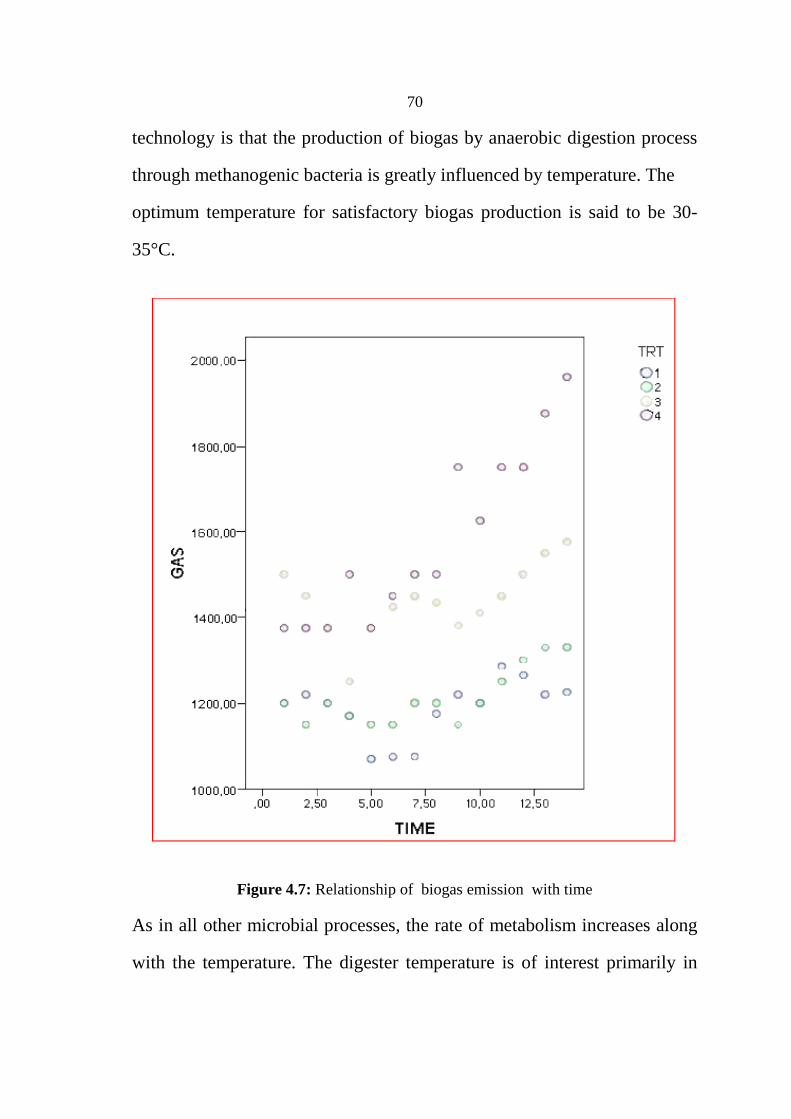
70
technology is that the production of biogas by anaerobic digestion process
through methanogenic bacteria is greatly influenced by temperature. The
optimum temperature for satisfactory biogas production is said to be 30-
35°C.
Figure 4.7: Relationship of biogas emission with time
As in all other microbial processes, the rate of metabolism increases along
with the temperature. The digester temperature is of interest primarily in
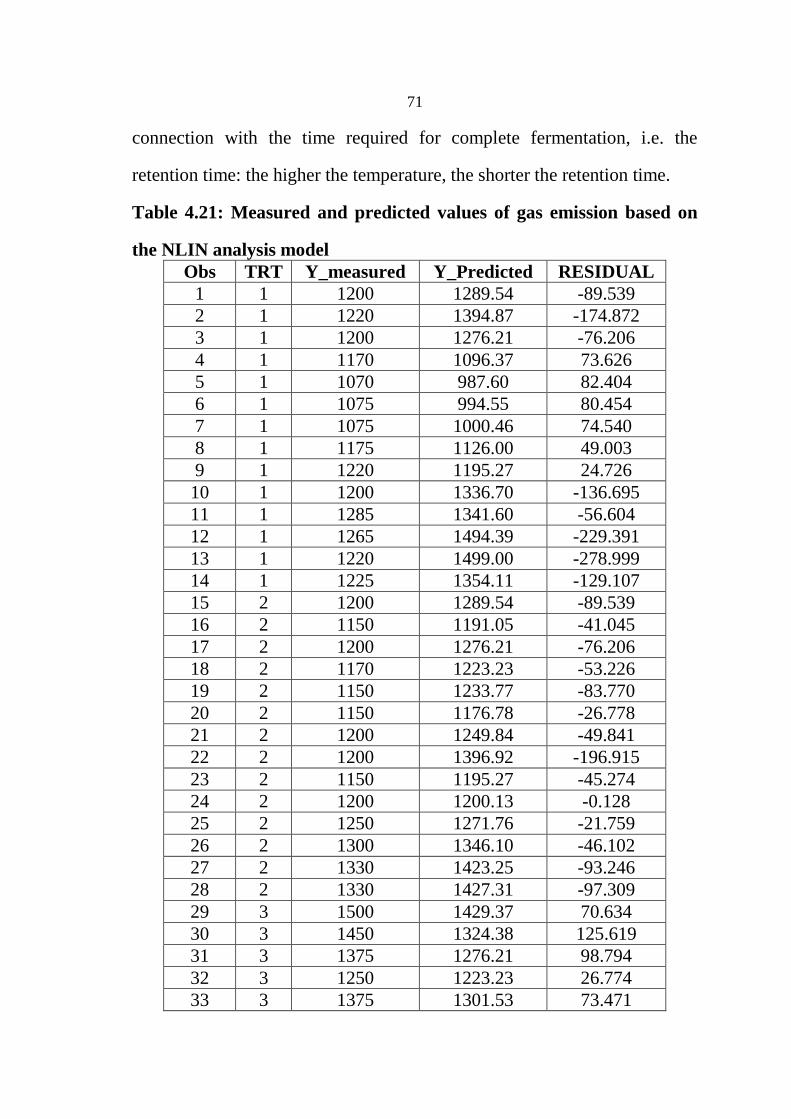
71
connection with the time required for complete fermentation, i.e. the
retention time: the higher the temperature, the shorter the retention time.
Table 4.21: Measured and predicted values of gas emission based on
the NLIN analysis model RESIDUAL Y_Predicted Y_measured TRT Obs
-89.539 1289.54 1200 1 1 -174.872 1394.87 1220 1 2 -76.206 1276.21 1200 1 3 73.626 1096.37 1170 1 4 82.404 987.60 1070 1 5 80.454 994.55 1075 1 6 74.540 1000.46 1075 1 7 49.003 1126.00 1175 1 8 24.726 1195.27 1220 1 9
-136.695 1336.70 1200 1 10 -56.604 1341.60 1285 1 11 -229.391 1494.39 1265 1 12 -278.999 1499.00 1220 1 13 -129.107 1354.11 1225 1 14 -89.539 1289.54 1200 2 15 -41.045 1191.05 1150 2 16 -76.206 1276.21 1200 2 17 -53.226 1223.23 1170 2 18 -83.770 1233.77 1150 2 19 -26.778 1176.78 1150 2 20 -49.841 1249.84 1200 2 21 -196.915 1396.92 1200 2 22 -45.274 1195.27 1150 2 23 -0.128 1200.13 1200 2 24 -21.759 1271.76 1250 2 25 -46.102 1346.10 1300 2 26 -93.246 1423.25 1330 2 27 -97.309 1427.31 1330 2 28 70.634 1429.37 1500 3 29 125.619 1324.38 1450 3 30 98.794 1276.21 1375 3 31 26.774 1223.23 1250 3 32 73.471 1301.53 1375 3 33

72 43.457 1381.54 1425 3 34 -13.729 1463.73 1450 3 35 38.085 1396.92 1435 3 36 -97.946 1477.95 1380 3 37 1.044 1408.96 1410 3 38
-117.467 1567.47 1450 3 39 5.609 1494.39 1500 3 40
126.754 1423.25 1550 3 41 71.722 1503.28 1575 3 42 16.825 1358.18 1375 4 43 50.619 1324.38 1375 4 44 -41.796 1416.80 1375 4 45 -7.649 1507.65 1500 4 46
206.446 1168.55 1375 4 47 207.548 1242.45 1450 4 48 36.271 1463.73 1500 4 49 103.085 1396.92 1500 4 50 114.276 1635.72 1750 4 51 -17.366 1642.37 1625 4 52 101.602 1648.40 1750 4 53 255.609 1494.39 1750 4 54 131.582 1743.42 1875 4 55 123.957 1836.04 1960 4 56
Figure 4.8 : Plot of predicted gas emission vs. measured gas values(NLIN analysis model)

73
4.3 Biogas quality
Methane concentration were determined by collecting samples of biogas
in small gas cylinders and transporting the samples to the An-Najah
National University laboratory. Biogas samples were taken with a pressure
lock syringe and their methane content was measured with gas
chromatographs (GC).
Gas chromatography (GC) is a popular instrument and has several
advantages such as high resolution, high speed, high sensitivity and good
quantitative results (B. Kolb, L. S. Ettre, 2006).
The following table shown results (GC) analysis
Table (4.22) : (GC) analysis Sample Methane content Cow manure 30.9 % Food residues 33.9 % Cow manure + food residues 32.9 % Poultry manure + food residues 31.2 %
The (GC) analysis are necessary for more confidence in evaluating the
objectives of the study, but unfortunately the results are not accurate for
two reasons: the first because the gas chromatography device at An-Najah
National University laboratory is inefficient for analyzing gases ; the later
there are no technical persons who are experienced with gas analysis.
These two reasons were obstacles for achieving this study purpose.
To overcome the possibility of a defect in the Gas chromatography (GC)
device , a simple experiment was conducted in order to compare the biogas
and commercial gas used in Palestinian homes, 1 kg biogas and 1 kg of
commercial gas were ignited , the time it takes for all types has been

74
monitored in order to identify the quality of biogas resulting from biogas
unit. The following table shows the results.
Table (4.23) : Time consume for biogas and Commercial gas burned Time (Hour) Gas type 5 Commercial gas 2.20 Biogas
The experimentally produced biogas burned with a flame similar to the
natural gas and nearly Biogas has a heat value which is equal to the half
of commercial gas by comparing 1 (kg) of both gasses on the same flow
rate. The result of the experiment indicates a good biogas quality.
4.4 Biogas use
Small scale biogas unit has several advantages of not complicated, cheap,
robust, easy to operate and maintain, low construction cost and that it could
be operated and repaired by the family itself. Moreover, it can be
constructed with locally produced materials and suitable to biogas
production for Palestinian rural family for covering its monthly
requirements of natural gas . It can produce high quality of organic
fertilizer used to improve crops yield.
Another advantage of a small biogas unit is that Biogas technology has the
potential for providing an alternative to the current unsustainable energy
and provide environmental, social, and economic benefits ,as well as
decreasing the energy reliance on Israel. This technology is a vital
component of the alternative rural energy in Palestine.
One major objective of the study is to explain the benefits of biogas
technology and to encourage the use of this technology in Palestinian rural

75
areas through providing small scale biogas unit for each Palestinian rural
families in order to encourage them to utilize this digester .
Biogas produce from small scale biogas unit can be used to:
1. Direct combustion and heat utilization instead of natural gas such as:
- Cooking
- Heating home
- Bread making
- Heating greenhouses to avoid the risk of frost in winter, and
- Heating poultry farms
2. Lighting and Power Generation
- Biogas from the digesters could be to a combustion engine in
order to convert it into electrical and mechanical energy. Biogas
requires a liquid fuel to start ignition. Diesel fuel can also be
combined with biogas for power generation( Bond, T.;
Templeton,2011).
- Biogas can be used to power engines when mixed with petrol or
diesel . Also, it helps in pumping water for irrigation.
- Biogas conversion into electricity using fuel cells is a hot research
topic nowadays. However, it is not commercially affordable due
to the requirement of clean gas and the cost of fuel cells( Bond,
T.; Templeton,2011).
- Providing electricity for houses by biogas lamps , Biogas lamps
are more efficient than the kerosene powered lamps, but the

76
efficiency is quite low compared to electric-powered lamps
(Laichena,1997).
3. Biogas Can be used to drive refrigeration processes. e.g. for cooling
food storage or for air conditioning.
4. A biogas plant is not only a supplier of energy, but also, the digested
substrate, usually named digestate, is a valuable soil fertilizer, which is
rich of nitrogen, phosphorus, potassium and micronutrients. These
substances can be applied on soils with the usual equipment for
application of liquid manure.
4.5 Financial analysis
The costs for constructing the proposed design of the small scale biogas
unit may be estimated as follows:
Table (4.24): Requirements and costs for constructing biogas unit Requirements Cost (NIS)
Plastic tank 1500L 500 Plastic tank 1000L 400
Base iron 150 Steel funnel 30
Blender 1200 PVC pipes 30
Gas valve and connectors 30 Slurry valves 60 Miscellaneous 100
Total 2500
As shown in the previous table, the initial investment to construct a floating
tank biogas unit is 2500 NIS.

77
4.5.1 Running cost
The Annual running cost for operating the biogas plant may come from
replacing some of the used gas transporting pipes or replacing some valves.
In addition to that, the price of using water in the digester in the case of
using clean water instead of waste water .
1- Annual running cost to operate the digester
=15 % of digester cost + water cost (Al Sadi,2010)
= 375 NIS + 22 NIS
= 397 NIS /Year
The water needed to operate the biogas unit in similar waste addition rate
as this study is 12 kg/day; that is 0.012 m3/day. According to Palestinian
Central Bureau of Statistics PCBS, the price of 1 m3 of water is 4-5 NIS.
(PCBS, 2013)
(22NIS) water cost/year = 0.012 m3/day x 365 day/year = 4.38 m3/Y
4.38 m3/Y x 5NIS/m3 = 21.9 NIS approximately 22 NIS
4.5.2 Biogas profit
Based on the experiment results, the biogas produced is sufficient to
provide for the family needs of cooking fuel; this means it is sufficient to
replace the commercial gas that is usually used for cooking. An average
Palestinian family needs one 12 kg-bottle of commercial gas per month.
The price of commercial gas in West Bank- Palestine fluctuates due to
some political reasons. But on average the price of 12kg bottle is 65 NIS.
So, the biogas profit = 65 NIS/month.
Profit of produced biogas =
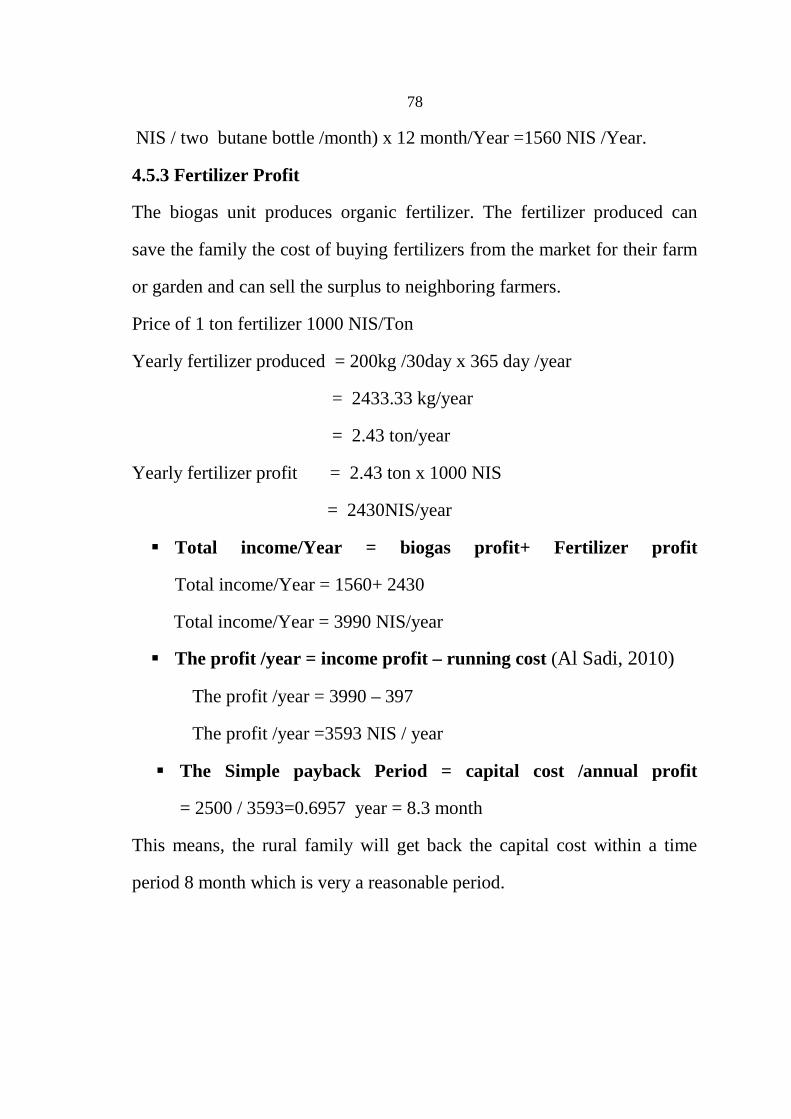
78
NIS / two butane bottle /month) x 12 month/Year =1560 NIS /Year.
4.5.3 Fertilizer Profit
The biogas unit produces organic fertilizer. The fertilizer produced can
save the family the cost of buying fertilizers from the market for their farm
or garden and can sell the surplus to neighboring farmers.
Price of 1 ton fertilizer 1000 NIS/Ton
Yearly fertilizer produced = 200kg /30day x 365 day /year
= 2433.33 kg/year
= 2.43 ton/year
Yearly fertilizer profit = 2.43 ton x 1000 NIS
= 2430NIS/year
Total income/Year = biogas profit+ Fertilizer profit
Total income/Year = 1560+ 2430
Total income/Year = 3990 NIS/year
The profit /year = income profit – running cost (Al Sadi, 2010)
The profit /year = 3990 – 397
The profit /year =3593 NIS / year
The Simple payback Period = capital cost /annual profit
= 2500 / 3593=0.6957 year = 8.3 month
This means, the rural family will get back the capital cost within a time
period 8 month which is very a reasonable period.
79
Conclusions
According to the study results several conclusions can be suggested,
included the following :
1. Biogas is usually generated when bacteria break down organic waste
such as manure, crop residues, or food waste in the absence of
oxygen. This process known as anaerobic digestion . Biogas
contains about 50-70 % CH4, 30 - 40% CO2, and other gases .
2. Biogas is a clean, efficient, and renewable source of energy, which
can be used as a substitute for other fuels in order to save energy in
rural areas.
3. Biogas technology contributes to the sustainable development of
Palestinian rural areas by providing them with a wide variety of
socioeconomic benefits, including personal or household impacts,
health impacts, social, economic and environmental impacts .
4. Small scale biogas unit is not complicated, cheap, robust, easy to
operate and maintain, low construction cost and that could be
operated and repaired by the family itself and can be constructed
with locally produced materials and suitable to biogas production for
Palestinian rural family to cover its monthly requirement from
natural gas and production high quality organic fertilizer to improve
crops yield.
5. The food residues (alone) produce the biggest quantity of biogas
comparing with other organic waste.
6. Biogas has a heat value equals half heat value of butane gas.

80
7. The success of the experiment indicates to the possibility for
technical application feasibility for biogas technology in the in
Palestinian rural areas.
8. Small scale biogas unit is a suitable family digester type. This will
make a benefit of 3593NIS/year and the simple payback period of it
is less than one year.
9. The digested slurry removed from the biogas plant is visibly
different than the pre-digested kitchen waste fed into the plant. The
pre-digested kitchen waste has a smell of rotten vegetables, takes the
color of the input material used , the type of vegetables , and fruits
can still be identified in the mix. The digested slurry is practically
odorless and blackish in color; the parent materials (as well as any
solids) are no longer visible. It is being used as organic fertilizer in
the kitchen garden.
10. The gas is practically odorless and burns with a blue flame. A slight
hissing sound can be heard during the initial opening of the valve at
the gas burner. This is due to the fact of accumulation of condensed
water in the pipe, which needs to be drained out from time to time.
11. It is possible to design a large anaerobic digesters in order to
process organic wastes in municipal wastes as an alternative to
landfill disposal. The digested effluent could also be used as
fertilizers rather than occupying space in the landfill.

81
Recommendations
Several recommendations have been suggested:
1. Constructing small scale biogas unit with continuous loading for
organic wastes will cover the daily energy requirements (instead of
natural gas) for rural family and provide it with organic fertilizer for
improving crops yield and so could be used instead of manufactured
fertilizers.
2. Informing and encouraging people about the benefits of biogas at a
young age, and providing school material about the importance of
the environment and the benefits of biogas is a necessity. This will
enable them to make sensible choices when they grow older.
3. Supporting and encouraging biogas technology in order to be used
in Palestine by Palestinian National Authority PNA with good
cooperation between farmers and related sectors as energy,
environment and agricultural sectors to improve and apply digesters
in Palestinian rural areas.
4. More researches and practical studies about applying biogas
technology in Palestine should be conducted in order to improve
biogas plant in Palestine.
5. Financial help (from government or non governmental organizations
-NGO´s-) should be provided for rural families in order to help
them in constructing biogas plants.

82
References
− Abu Hamed, T., Flamm, H. and Azraq, M.( 2011) : " Renewable
Energy in the Palestinian Territories" : Opportunities and
Challenges. Renewable and Sustainable Energy Reviews. 1082–
1088.
− Al Sadi , Mansour. (2010). "Design and Building of Biogas
Digester for Organic Materials Gained From Solid Waste" , Msc
thesis, Supervisor Prof.Dr. Marwan Mahmoud , An Najah National
University.
− Al Seadi, T; Rutz, D; Prassl, H; Köttner, M; Finsterwalder, T; Volk,
S; Janssen, R. (2008). Biogas handbook. (T. Al Seadi, Ed.)
Denmark: University of Southern Denmark Esbjerg.
− Asif, M. (2005). Energy Supply, its Demands and Security issues
for Developed and Emerging Economics, Renewable and
Sustainable Reviews, p.2-25
− AgSTAR: Energy and pollution prevention. Retrieved 25th
October from: http://www.epa.gov/agstar/anaerobic/fact.html
− Bond. T., and Templeton. M.R., 2011. History and future of
domestic biogas plants in the developing world., International
Journal Energy for Sustainable Development Volume 15, Issue 4, pp.
347–354
− Chengdu, (1989), The Biogas Technology in China Chengdu
Biogas Research Institute, China

83
− Demirer, G. N.; Chen, S., (2004). Effect of retention time and
organic loading rate on anaerobic acidification and
biogasification of dairy manure. Journal of Chemical
Technology and Biotechnology, 79(12), 1381-1387.
− Dr. Abdul Malk Al Jaber, Prospects for Biogas Technology in the
Palestinian Occupied Territories, November 1992
− Eshraideh ,Ayoub Mohamed (2002): An Educational Biogas
Prospect in Tolkarm Msc thesis, Supervisors Dr Muneer Abdoh, Dr
Abdellatif Mohamed, An Najah National University.
− FAO/CMS. A system Approach to Biogas Technology. Biogas
Technology: a training manual for extension.1996. Available at
website:-http://www.fao.org.
− Ibrik, E. (2009) : Energy Profile and the Potential of Renewable
Energy Sources in Palestine. In Renewable Energy in the Middle
East, ed. M. Mason and A. Mor, 71-89. Dordrecht: Springer
− Jensen, J. and A. Jensen. Biogas and Natural Gas Fuel Mixture for
the Future. 1st World Conference and Exhibition on Biomass for
Energy and Industry, Sevilla, 2000. Electronic access at
http://uk.dgc.dk/pdf/Sevilla2000.pdf.
− Karki, A., Shrestha, J. and Bajgain, S,( 2005):BIOGAS As
Renewable Source of Energy in Nepal Theory and Development.
Nepal: BSP-Nepal: 171p.

84
− Karki, A. B., K. M. Gautam and A. Karki (1994) Biogas Installation
from Elephant Dung at Machan Wildlife Resort, Chitwan, Nepal.
Biogas Newsletter, Issue No. 45.
− Karki, A.B. and K. Dixit (1984) Biogas Fieldbook, Sahayogi
Prakashan, Tripurcshwar, Kathmandu, Nepal.
− Kolb, B. L. S. Ettre, “Static headspace gas chromatography:
Theory and Practice,” Wiley interscience, 2006.
− Kimberly Lynn Bothi. Characterization of Biogas From
Anaerobically Digested Dairy Waste for Energy use, Msc thesis,
Supervisor Prof.Dr. Dr. Norman Scott, Cornell University,2007
− Lusk, P. (1997). “Anaerobic Digestion and Opportunities for
International Technology Transfer.” The Third Biomass
Conference of the Americas; August 24-29, 1997,Montréal, Québec.
UK: Pergamon Press; pp. 1211-1220.
− Lagrange, B. (1979), Biomethane 2, Principles – Techniques
Utilization. EDISUD, La Caiade, 1310
− Lichtman. R., et. al., 1996. The Improved Biogas Systems Project:
results and future work, Energy for Sustainable Development,
Volume 3, Issue 4, pp. 28–42.
− Medyan ,Adel Mustaffa Hassan( 2004) ,The Feasibility of Biogas
Production from Mixed Organic Wastes in Palestinisn Rural
areas, Msc thesis, Supervisor Prof. Marwan Hadad , An Najah
National University.

85
− Prof. Marwan M.Mahmoud, Lecture of renewable energy
2,Tuesday, February, 2007.
− Marchaim, U. (1992). Biogas Processes fopr Sustainable
Development. Rome: FAO Ag Services Bulletin.
− Mattocks, Richard: Understanding Biogas Generation. VITA.
Arlington, Virginia, USA. 1984. Available at website:-
http://www.vita.org/.
− Oregon Office of Energy: Anaerobic Digester Technology. U.S.A.
2002. Available at website:-http://www.energy.state.or.us.
− Ola Abd AL-Rahman Abd Allah Adawi , Design, Building and
Techno-Economic Evaluation of Biogas Digester, Msc thesis,
Supervisor Prof. Marwan Mahmoud, An Najah National University,
2008
− PCBS. (2013). Palestinian Central Bureau of Statistics Report.
Palestin
− Singh, J. B, R. Myles and A. Dhussa (1987) Manual on
Deenbandhu Biogas Plant. Tata McGraw Hill Publishing Company
Limited, India.
− Sustainable Development Department (SD), (1997): FAO,
Environment: Asystem approach to biogas technology .Source:
Library SLU.
− Sathianathan, M. A. (1975), Biogas Achievements and Challenges,.
Association of Voluntary Agencies of Rural Development, New
Delhi, India.
86
− Updated Guidebook on Biogas Development-Energy Resources
Development Series (1984), No. 27.United Nations. New York,
USA.
− Venkata Ramana P (1991) Biogas programme in India. TIDE
1(3):1–18
− Verma, S. (2002). Anaerobic digestion of biodegradable organics
in municipal solid waste. Columbia University.
− Werner,U.;U. Stohr and N. Hees .(1989): Biogas Plants in Animal
Husbandry. GATE/(GTZ) GmbH.
− White, P, Franke, M and Hindle, P. 1995. Integrated solid waste
management: a life cycle inventory. London : Champman and Hall,
1995.
− http://ptcl.chem.ox.ac.uk/~hmc/hsci/chemicals/methane.htm1
(methane) 5/8/2008.
− http://water.me.vccs.edu/courses/ENV149/lesson4b.htm

87
Appendix(1)
Statistical Analysis

88

89

90

91

92
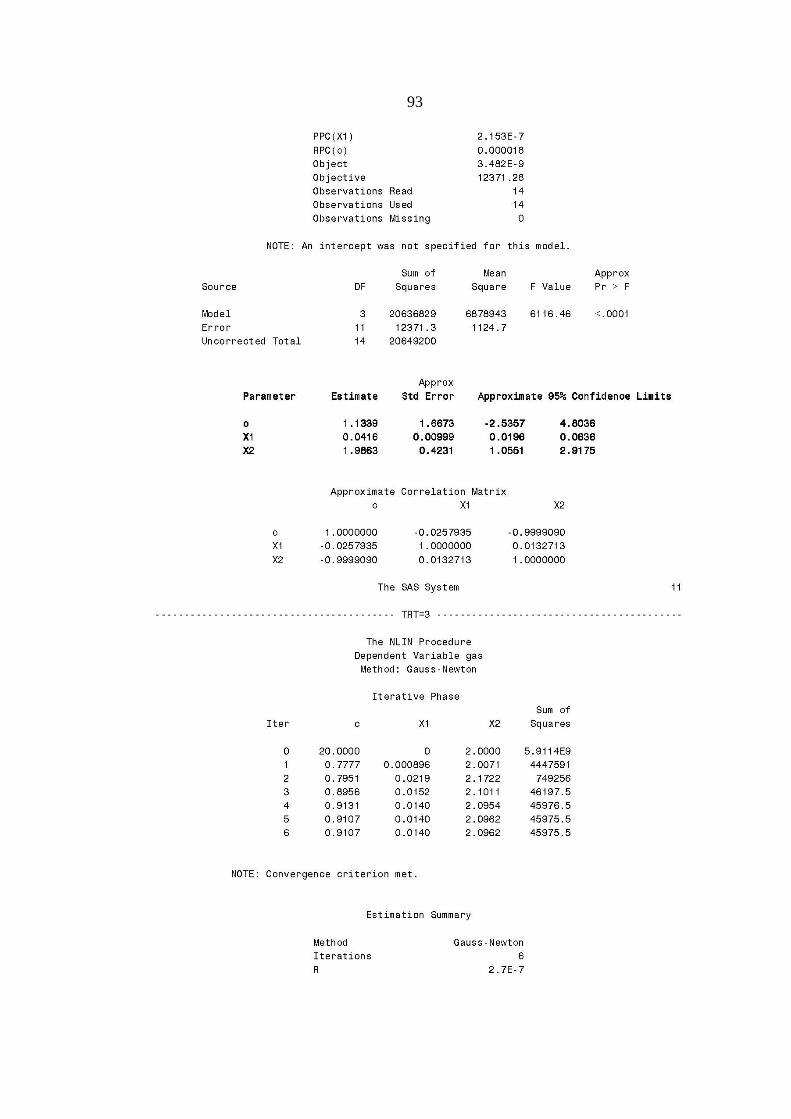
93

94

95

جامعة النجاح الوطنية
كلية الدراسات العليا
تقييم الكفاءة النوعية والكمية لوحدات صغيرة إلنتاج الغاز الحيوي في الريف الفلسطيني
إعداد
محمود رشاد راشد منصور
إشراف
حداد مروان د. . أ
درجة الماجستير في العلوم البيئية بكلية الحصول على قدمت هذه األطروحة استكماال لمتطلبات
في جامعة النجاح الوطنية في نابلس ، فلسطين . الدراسات العليا2014

ب تقييم الكفاءة النوعية والكمية لوحدات صغيرة
إلنتاج الغاز الحيوي في الريف الفلسطيني إعداد
محمود رشاد راشد منصور إشراف
حداد مروان أ.د.
الملخص
لتحل محل مصادر تطويرهاتعتبر الطاقة البديلة من األولويات التي تسعى البشرية لالرتقاء بها و
الطاقة غير المتجددة ، وتعتبر تقنية إنتاج الغاز الحيوي من البدائل المناسبة لكثير من أنواع الوقود
غير المتجددة وهي ذات فوائد بيئية واقتصادية متعددة .
يا ينتج الغاز الحيوي عن تحلل المواد العضوية الصلبة مثل مخلفات الحيوانات والمحاصيل وبقا
وبمعزل عن األكسجين ، ويتكون الغاز الطعام بواسطة البكتيريا تحت ظروف حرارية مناسبة
باإلضافة إلى غازات (CO2) الكربون ) وثاني أكسيدCH4الحيوي في غالبه من غازي الميثان (
أخرى .
لتر وتم تغذيتها 1500في هذه الدراسة قمنا بتصميم وحدة صغيرة إلنتاج الغاز الحيوي بحجم
مخلوطا بأربعة أنواع من المخلفات العضوية وهي: روث األبقار وبقايا الطعام وروث األبقار
ببقايا الطعام ، وروث الدجاج مخلوطا ببقايا الطعام ،وتمت دراسة وتقييم مدى فعالية الوحدة في
كل على إنتاج الغاز الحيوي من حيث كمية الغاز الناتج ونوعيته من المخلفات العضوية األربعة
حدا .
العضوية أنتجت الغاز النتائج التي تم الحصول عليها من هذه الدراسة أظهرت أن جميع المخلفات
الحيوي في درجات الحرارة السائدة .وبحسب النتائج أيضا فإن بقايا الطعام أنتجت أكبر كمية من
كغم خالل 20.125يوم) ثم روث الدواجن المخلوط ببقايا الطعام ( 14كغم خالل 22.160الغاز(
يوم) ثم روث األبقار 14 كغم خالل 16.980يوم) ثم روث األبقار المخلوط ببقايا الطعام ( 14
يوم) وأشارت النتائج إلى أن القيمة الحرارية للغاز الحيوي مساوية تقريبا 14كغم خالل 16.600(
للقيمة الحرارية للغاز التجاري المستخدم في بيوتنا . لنصف

ج
ت من خالل النتائج يمكننا القول أن تصميم وحدة إنتاج الغاز الحيوي المستخدمة في التجربة ذا
فعالية عالية في إنتاج الغاز الحيوي من حيث الكمية والنوعية وهي وحدات بسيطة التركيب ويمكن
بناؤها بكل سهولة وقليلة التكاليف وسهلة التشغيل والصيانة وكمية الغاز الناتج ونوعيته كافية
لتغطية االحتياجات الشهرية لألسر الريفية الفلسطينية من الغاز التجاري .
صي باستخدام وحدات الغاز الحيوي في المناطق الريفية الفلسطينية وإجراء المزيد من لذلك أو
الدارسات لتزويد أبناء شعبنا في الريف الفلسطيني بمعلومات وخبرات عملية أكثر حول تقنية الغاز
الحيوي والعمل على نشر هذه الفكرة .
.رين، والحمد ل رب العالمينوفي الختام ، نسأل هللا تعالى التوفيق والسداد في الدا