evaluation of qualified medicare beneficiary (qmb) and ... · pdf fileoctober 1, 2003...
TRANSCRIPT
October 1, 2003
Evaluation of Qualified Medicare Beneficiary (QMB) and Specified Low-Income Medicare
Beneficiary (SLMB) Programs
Final Report Volume I
Prepared for
Noemi Rudolph Centers for Medicare & Medicaid Services
DHHS/CMS/OA/ORDI/REG/DHSR 7500 Security Boulevard, C3-20-15
Baltimore, MD 21244-1850
CMS Contract No. 500-95-0058
Prepared by
Susan G. Haber, Sc.D. Walter Adamache, Ph.D.
Edith G. Walsh, Ph.D. Sonja Hoover, M.P.P.
Anupa Bir, Sc.D. RTI International
Health, Social, and Economics Research 411 Waverley Oaks Road, Suite 330
Waltham, MA 02452-8414
Cheryl Caswell, M.B.A. Henry Simpon, M.Ed.
Kevin Smith M.A. New England Research Institutes
9 Galen Street Watertown, MA 02172
RTI Project Number 08510.001
Evaluation of Qualified Medicare Beneficiary (QMB) and Specified Low-Income Medicare Beneficiary (SLMB) Programs
by Susan G. Haber, Sc.D. Walter Adamache, Ph.D.
Edith G. Walsh, Ph.D. Sonja Hoover, M.P.P.
Anupa Bir, Sc.D. Cheryl Caswell, M.B.A. Henry Simpon, M.Ed.
Kevin Smith M.A.
Federal Project Officer: Noemi Rudolph
RTI International*
CMS Contract No. 500-95-0058
September 30, 2003
This project was funded by the Centers for Medicare & Medicaid Services under contract no. 500-95-0058. The statements contained in this report are solely those of the authors and do not necessarily reflect the views or policies of the Centers for Medicare & Medicaid Services. RTI assumes responsibility for the accuracy and completeness of the information contained in this report. *RTI International is a trade name of Research Triangle Institute.
Acknowledgements This project was a true collaborative effort between staff at RTI International, the New England Research Institutes, and CMS. We would like to thank Noemi V. Rudolph, our CMS project officer, for her tireless efforts to facilitate our research, her thoughtful and prompt review of project reports, and her skillful coordination of input from federal, regional, and state Medicaid staff. We would also like to acknowledge CMS staff that contributed substantially to the design of the state Medicaid agency survey and data collection: Gina Clemons, John Kapustka, Donna Wenner, and Barbara Cotterman. Paul Saucier of the University of Southern Maine provided additional expert advice on the state survey design. Heidi Shaner from the American Public Human Services Association also contributed to data collection. Our work has been supported by many expert programmers at RTI: Matt Urato, Bob Baker, Ann Larsen, Valentina Akhmerova, Wesley Pan, and John Potelle. Amber Moore and Caren Kramer provided careful research assistance. We would also like to thank Michelle Bogus, Anita Bracero, Norma DiVito, Camille Quinn, and Linda Thompson for their many long hours on report production. Finally, we are indebted to our colleagues Janet Mitchell and Ed Drozd for their invaluable technical advice.
i
CONTENTS
EXECUTIVE SUMMARY .............................................................................................................1
Chapter 1 Introduction ...................................................................................................................15 1.1 Background on the Medicare Savings Programs .........................................................15 1.2 Previous Research on the Medicare Savings Programs...............................................18
1.2.1 Program Participation Rates ...............................................................................18
1.2.2 Characteristics and Service Use of QMB/SLMB Enrollees ...............................19 1.3 Study Design................................................................................................................19 1.4 Overview of the Report................................................................................................22
Chapter 2 Enrollment in the Medicare Savings Programs: Pathways, Barriers and Program Impacts ...................................................................................................................23 2.1 Introduction..................................................................................................................23 2.2 Study Questions ...........................................................................................................25 2.3 Methodology................................................................................................................26
2.3.1 Focus Groups ......................................................................................................26
2.3.2 Surveys................................................................................................................28 2.4 Findings from the National Surveys and Focus Groups by Enrollment Status ...........32
2.4.1 Demographic Characteristics, Use of Support Services, and Community Ties......................................................................................................................33
2.4.2 Health Status .......................................................................................................38
2.4.3 Utilization of Medical Care and Prescription Drugs...........................................38
2.4.4. Out-of-Pocket Expenditures................................................................................43
2.4.5 Types of Supplemental Insurance Coverage.......................................................47
2.4.6 Learning About the QMB and SLMB Programs ................................................50
2.4.7 Why Beneficiaries Enroll in the Programs .........................................................52
2.4.8 How Beneficiaries Apply for the Programs........................................................52
2.4.9 Why Eligible Nonenrollees Do Not Enroll in the Programs...............................56
2.4.10 Distribution of Survey Respondents across State Medicare Savings Program Characteristics ......................................................................................58
2.5 Findings from the National Surveys Comparing Enrollees in QMB-Plus States and Enrollees in Standard Benefit States .....................................................................61
2.5.1 Usual Source of Care and Health Care Utilization .............................................61
2.5.2 Medical Costs......................................................................................................63
2.5.3 Types of Supplemental Insurance Coverage.......................................................63
2.5.4 Learning About and Applying for the QMB Programs ......................................63 2.6 Predictors of Enrollment: Results from the Logistic Regressions ...............................63 2.7 Discussion ....................................................................................................................71
ii
Chapter 3 Impact of Precipitating Medical Events on QMB and SLMB Enrollment ...................75 3.1 Methodology................................................................................................................75 3.2 Results..........................................................................................................................77 3.3 Discussion ....................................................................................................................80
Chapter 4 Duration of Enrollment in the Medicare Savings Programs .........................................85 4.1 Introduction..................................................................................................................85 4.2 Methodology................................................................................................................85 4.3 Results..........................................................................................................................88 4.4 Discussion ....................................................................................................................98
Chapter 5 State Variation in Medicare Savings Programs Enrollment..........................................99 5.1 Introduction..................................................................................................................99 5.2 Theoretical Background.............................................................................................102 5.3 Data ...........................................................................................................................104
5.3.1 Takeup Rate ......................................................................................................104 5.3.2 State Outreach Activities, Enrollment Processes, and Eligibility Criteria........105 5.3.3 Medicaid Program Characteristics....................................................................107 5.3.4 Underlying Socio-Economic Characteristics....................................................108
5.4 Statistical Methods.....................................................................................................111 5.5 Descriptive Results ....................................................................................................112
5.5.1 State Takeup Rates............................................................................................112 5.5.2 State Outreach Activities ..................................................................................113 5.5.3 Relationship between Takeup and Outreach Activities ....................................117 5.5.4 Relationship between Takeup and Medicaid Program Characteristics.............134 5.5.5 Relationship between Takeup and Underlying Socio-Economic
Characteristics...................................................................................................134 5.6 Multivariate Results ...................................................................................................140
5.6.1 Cross Sectional Regressions .............................................................................140 5.6.2 Panel Regressions .............................................................................................143
5.7 Discussion ..................................................................................................................146 Chapter 6 Impact of the Medicare Savings Programs on Medicare Service Use and Out-
of-Pocket Costs ...................................................................................................................153 6.1 Introduction................................................................................................................153 6.2 Hypothesized Effects of Medicare Savings Programs Enrollment............................155 6.3 Methodology..............................................................................................................156
6.3.1 Medicare National Claims History Analyses....................................................157 6.3.2 MCBS Analyses................................................................................................159
6.4 Service Use and Cost Findings ..................................................................................164 6.4.1 Comparison by Type of Enrollee......................................................................164 6.4.2 Comparison of Enrollees and Eligible Nonenrollees........................................175 6.4.3 Adverse Selection Analyses..............................................................................186
6.5 Out-of-Pocket Expenditure Findings .........................................................................192 6.5.1 Comparison by Type of Enrollee......................................................................193 6.5.2 Comparison of Enrollees and Eligible Nonenrollees........................................199
6.6 Discussion ..................................................................................................................204 6.6.1 Summary of Findings........................................................................................204 6.6.2 Study Limitations..............................................................................................206
iii
6.6.3 Conclusions.......................................................................................................207 Chapter 7 Conclusions .................................................................................................................209
7.1 Summary of Findings.................................................................................................209 7.1.1 Program Enrollment..........................................................................................209 7.1.2 Outreach Activities and Application Procedures..............................................210 7.1.3 Service Use .......................................................................................................211 7.1.4 Out-of-Pocket Costs..........................................................................................212
7.2 Study Limitations.......................................................................................................213 7.2.1 Difficulty Identifying Type of Medicare Savings Programs Enrollee..............213 7.2.2 Difficulty Identifying Eligible Nonenrollee Population ...................................214 7.2.3 Adverse Selection .............................................................................................214 7.2.4 Limitations in Outreach Assessment ................................................................214
7.3 Discussion ..................................................................................................................213
References....................................................................................................................................218
Appendixes (Volume II) A. TPEARTH SPECIFICATIONS FOR IDENTIFYING DUAL ELGIBLES BY
ELIGIBILITY CATEGORY B. FOCUS GROUP DISCUSSION GUIDES C. SURVEY INSTRUMENTS D. ADJUSTMENT FOR NONRESPONSE E. DESCRIPTIVE COMPARISONS OF ENROLLEES AND NONENROLLEES IN QMB-
PLUS STATES AND STANDARD QMB BENEFIT STATES F. DESCRIPTIVE COMPARISONS OF QMB ENROLLEES IN QMB-PLUS STATES AND
IN STANDARD QMB BENEFIT STATES G. RATIO OF HOSPITALIZATIONS OF DUALS AND NONDUALS H. STATE OUTREACH SURVEY INSTRUMENT I. STATE OUTREACH ACTIVITY TABLES J. CROSS-SECTIONAL REGRESSION COEFFICIENTS FOR OUTREACH VARIABLES,
2000 K. RANDOM EFFECTS REGRESSION COEFFICIENTS FOR OUTREACH VARIABLES,
1999-2001 L. MULTIVARIATE ANALYSES OF SERVICE USE AND OUT-OF-POCKET COSTS
List of Tables Table A Selection of States for Focus Groups...............................................................................27
Table 1 Sociodemographic Characteristics of QMBs, SLMBs and Eligible Nonenrollees ..........34
Table 2 Health Status of QMBs, SLMBs and Eligible Nonenrollees............................................39
Table 3 Medical Care Utilization of QMBs, SLMBs and Eligible Nonenrollees .........................41
Table 4 Medical Care Costs of QMBs, SLMBs and Eligible Nonenrollees..................................44
Table 5 Types of Supplemental Insurance Coverage of QMBs, SLMBs and Eligible Nonenrollees.....................................................................................................................49
iv
Table 6 How Beneficiaries Learn About the Programs .................................................................51
Table 7 Why Beneficiaries Enroll in the Programs .......................................................................53
Table 8 How Beneficiaries Apply for the Programs......................................................................55
Table 9 Reasons Beneficiaries Do Not Enroll in the QMB and SLMB Programs ........................57
Table 10A Percentage of Unique States by State Medicare Savings Programs Characteristics.......................................................................................................................60
Table 10B Percentage of Survey Respondents Across State Medicare Savings Programs Characteristics.......................................................................................................................60
Table 11 Medical Care Utilization of QMB Beneficiaries by State Benefit .................................62
Table 12 Medical Care Costs of QMB Beneficiaries by State Benefit..........................................64
Table 13 Types of Supplemental Insurance Coverage of QMB Beneficiaries by State Benefit.............................................................................................................................66
Table 14 Odds Ratios from Logistic Regressions for Predicting Enrollment in the QMB and SLMB Programs.......................................................................................................68
Table 15 Odds Ratios from Logistic Regressions for Predicting Enrollment in the QMB Program...........................................................................................................................69
Table 16 Overall Means and Ratios for Hospital-Related Events .................................................78
Table B Data Sources for Medicaid Programmatic and Socio-Economic Variables ..................110
Table 17 Dual-Eligible Takeup Rates by State and Year ............................................................114
Table 18 Dual-Eligible Takeup Rates by Information Dissemination and Provision Activity and Year..........................................................................................................119
Table 19 Dual-Eligible Takeup Rates by Partnership Effort of State Medicaid Agencies and Year ........................................................................................................................122
Table 20 Dual-Eligible Takeup Rates by Provider Access and Year ..........................................128
Table 21 Dual-Eligible Takeup Rates by Leads Data and Year ..................................................132
Table 22 Dual-Eligible Takeup Rates by Application, Enrollment and Eligibility Process and Year ........................................................................................................................130
Table 23 Dual-Eligible Takeup Rates by Redetermination Standard and Year ..........................135
Table 24 Dual-Eligible Takeup Rates by Medicaid Program Characteristic and Year ...............136
Table 25 Dual-Eligible Takeup Rates by Socio-Economic Characteristic and Year ..................138
Table 26 Cross-Sectional Regression Results Including Socio-Economic and Standard Medicaid Programmatic Variables, 2000 .....................................................................141
Table 27 Cross-Sectional Regression Results Including Parsimonious List of Socio-Economic and Standard Medicaid Programmatic Variables, 2000 .............................142
Table 28 Cross-Sectional Regression Results From Parsimonious Model Plus Training of State Outreach Workers, 2000 ......................................................................................144
v
Table 29 Cross-Sectional Regression Results for Selected Individual and Aggregate Outreach Activities, 2000 .............................................................................................145
Table 30 Random Effects Regression Results, 1999-2001..........................................................147
Table 31 Random Effects Regression Results for Selected Individual and Aggregate Outreach Activities .......................................................................................................148
Table 32 MCBS Sample Sizes.....................................................................................................160
Table 33 Medicare Service Use and Expenditures by Type of Service and Type of Enrollee, All States, 2001 .............................................................................................166
Table 34 Medicare Service Use and Expenditures by Type of Service and Type of Enrollee, Standard QMB Benefit States, 2001 .............................................................169
Table 35 Medicare Service Use and Expenditures by Type of Service and Type of Enrollee, QMB-Plus States, 2001 .................................................................................170
Table 36 Odds of Medicare Service Use and Percent Difference in Expenditures by Type of Service and Type of Enrollee ...................................................................................173
Table 37 Characteristics of Beneficiaries by Program Eligibility and Enrollment Status...........177
Table 38 Medicare Service Use and Expenditures by Type of Service and Program Eligibility and Enrollment Status..................................................................................181
Table 39 Impact of Enrollment on Probability of Medicare Service Use and Expenditures by Type of Service and Program Eligibility .................................................................185
Table 40 Impact of Instrumental Variables on Probability of Enrollment by Program Eligibility ......................................................................................................................188
Table 41 Impact of Enrollment on Probability of Medicare Service Use and Expenditures by Type of Service and Program Eligibility: Comparison of Main Model Results and Selection Corrected Results ...................................................................................191
Table 42 Utilization and Out-of-Pocket (OOP) Expenditures by Type of Service and Type of Enrollee ...........................................................................................................195
Table 43 Percent Difference in Probability of Out-of-Pocket (OOP) Expenditures and Amount of Expenditures by Type of Service and Type of Enrollee.............................198
Table 44 Utilization and Out-of-Pocket (OOP) Expenditures by Type of Service and Program Eligibility and Enrollment Status ...................................................................200
Table 45 Impact of Enrollment on Probability of Out-of-Pocket (OOP) Expenditures and Amount of Expenditures by Type of Service and Program Eligibility.........................203
List of Figures
Figure 1 Dual to Nondual Ratio of Hospitalizations, Relative to Time of Enrollment .................79
Figure 2 QMB to Nondual Ratio of Hospitalizations, Relative to Time of Enrollment................81
Figure 3 SLMB to Nondual Ratio of Hospitalizations, Relative to Time of Enrollment ..............82
vi
Figure 4 Dually-eligible Beneficiaries Remaining Enrolled by Months Since Enrollment ..........89
Figure 5 Dually-eligible Beneficiaries Remaining Enrolled by Months Since Enrollment and Initial Type of Dual Eligibility.................................................................................91
Figure 6 Probability of Disenrolling for Prior Month Enrollees by Months Since Enrollment and Initial Type of Dual-Eligibility .............................................................92
Figure 7 Probability of Dually-Eligible Beneficiaries Re-enrolling by Months Since Disenrollment by Type of Dual Eligibility When Last Enrolled....................................93
Figure 8 Dually-Eligible Beneficiaries Remaining Disenrolled by Months Since Disenrollment by Type of Dual Eligibility When Last Enrolled..........................................95
Figure 9 Probability of Dually-Eligible Beneficiaries Disenrolling by Months Since Second Enrollment................................................................................................................95
Figure 10 Dually-Eligible Beneficiaries Remaining Enrolled by Months Since Second Enrollment.............................................................................................................................97
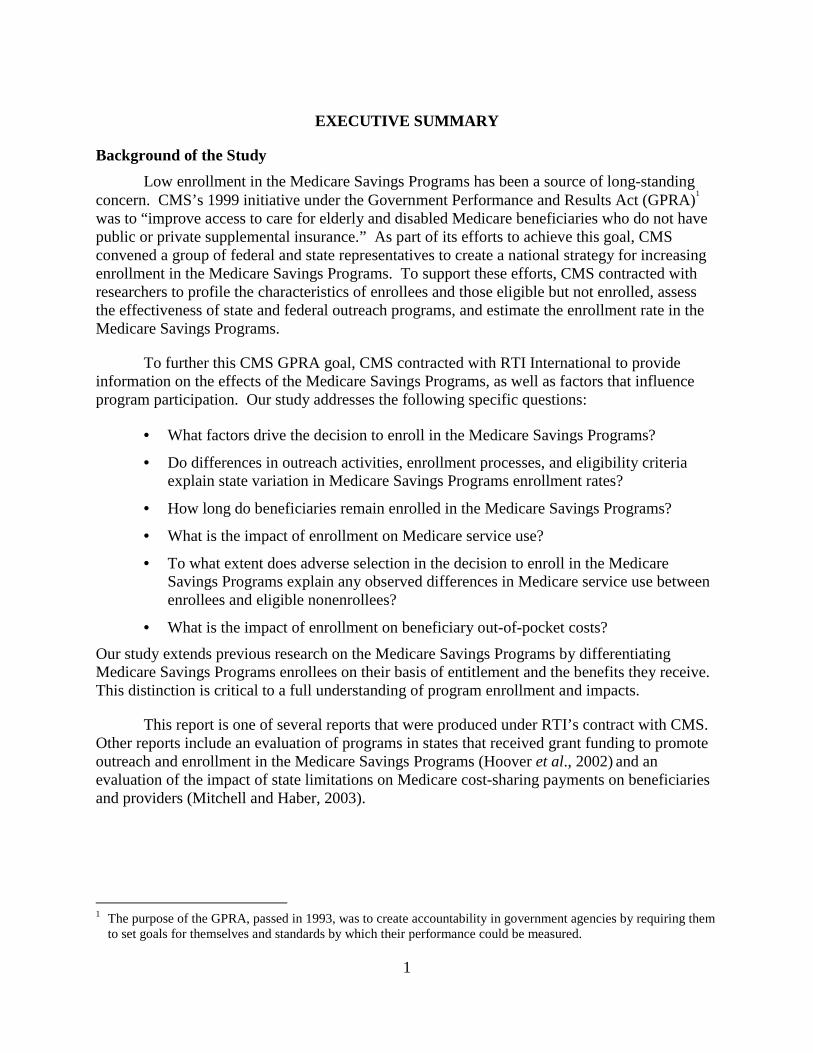
Symbols
*** Significantly different from eligible nonenrollees at the 0.01 level. ** Significantly different from eligible nonenrollees at the 0.05 level. * Significantly different from eligible nonenrollees at the 0.10 level.
††† Significantly different from SLMB at the 0.01 level. †† Significantly different from SLMB at the 0.05 level. † Significantly different from SLMB at the 0.10 level.
€€€ Significant at the .01 level. €€ Significant at the .05 level. € Significant at the .10 level.
# # # Significantly different from QMB-plus at the 0.01 level. # # Significantly different from QMB-plus at the 0.05 level.
# Significantly different from QMB-plus at the 0.10 level. ‡ Did not respond to the 1999 survey.
‡‡ Did not respond to the 2000 survey. ¥ ¥ ¥ Significantly different from QMB at the 0.01 level.
¥ ¥ Significantly different from QMB at the 0.05 level. ¥ Significantly different from QMB at the 0.10 level.
£££ Significantly different from SSI at the 0.01 level. ££ Significantly different from SSI at the 0.05 level. £ Significantly different from SSI at the 0.10 level.
Ф Ф Ф Significantly different from enrollees at the 0.01 level. Ф Ф Significantly different from enrollees at the 0.05 level. Ф Significantly different from enrollees at the 0.10 level.
aaa Significantly different from nonrespondents at the 0.01 level. aa Significantly different from nonrespondents at the 0.05 level. a Significantly different from nonrespondents at the 0.10 level.
1
EXECUTIVE SUMMARY
Background of the Study
Low enrollment in the Medicare Savings Programs has been a source of long-standing concern. CMS’s 1999 initiative under the Government Performance and Results Act (GPRA)
1
was to “improve access to care for elderly and disabled Medicare beneficiaries who do not have public or private supplemental insurance.” As part of its efforts to achieve this goal, CMS convened a group of federal and state representatives to create a national strategy for increasing enrollment in the Medicare Savings Programs. To support these efforts, CMS contracted with researchers to profile the characteristics of enrollees and those eligible but not enrolled, assess the effectiveness of state and federal outreach programs, and estimate the enrollment rate in the Medicare Savings Programs.
To further this CMS GPRA goal, CMS contracted with RTI International to provide information on the effects of the Medicare Savings Programs, as well as factors that influence program participation. Our study addresses the following specific questions:
• What factors drive the decision to enroll in the Medicare Savings Programs?
• Do differences in outreach activities, enrollment processes, and eligibility criteria explain state variation in Medicare Savings Programs enrollment rates?
• How long do beneficiaries remain enrolled in the Medicare Savings Programs?
• What is the impact of enrollment on Medicare service use?
• To what extent does adverse selection in the decision to enroll in the Medicare Savings Programs explain any observed differences in Medicare service use between enrollees and eligible nonenrollees?
• What is the impact of enrollment on beneficiary out-of-pocket costs?
Our study extends previous research on the Medicare Savings Programs by differentiating Medicare Savings Programs enrollees on their basis of entitlement and the benefits they receive. This distinction is critical to a full understanding of program enrollment and impacts.
This report is one of several reports that were produced under RTI’s contract with CMS. Other reports include an evaluation of programs in states that received grant funding to promote outreach and enrollment in the Medicare Savings Programs (Hoover et al., 2002) and an evaluation of the impact of state limitations on Medicare cost-sharing payments on beneficiaries and providers (Mitchell and Haber, 2003).
1 The purpose of the GPRA, passed in 1993, was to create accountability in government agencies by requiring them
to set goals for themselves and standards by which their performance could be measured.
2
Overview of the Medicare Savings Programs
Despite the broad health insurance coverage that Medicare provides to the aged and disabled populations, beneficiaries are subject to cost-sharing requirements in the form of Part B (and, occasionally, Part A) premiums, deductibles, and coinsurance. In addition, Medicare’s exclusion of certain services, such as outpatient prescription drugs and nursing home care, may pose a significant liability for beneficiaries. These out-of-pocket costs can pose a substantial burden for low-income Medicare beneficiaries. The Medicare Savings Programs were designed to provide low-income beneficiaries with relief from these out-of-pocket costs and improve their access to needed health care services.
The Medicare Savings Programs is the name used by CMS, many states, and other federal agencies to refer to benefits provided to individuals who are dually eligible for Medicare and some form of Medicaid. Beneficiaries can quality for the Medicare Savings Programs under five main categories:
• Qualified Medicare Beneficiary (QMB);
• Specified Low-Income Medicare Beneficiary (SLMB);
• Qualifying Individual-1 (QI-1);
• Qualified Disabled and Working Individual (QDWI); and
• Medicaid Only Dual Eligibles.
The benefits and eligibility criteria vary across these categories.
The QMB program was created under the Medicare Catastrophic Coverage Act (MCCA) of 1988, which mandated Medicaid coverage of Medicare cost-sharing requirements for Medicare beneficiaries with incomes up to 100% of the federal poverty level (FPL) and resources not in excess of twice the SSI resource limit.
2 Medicaid pays the Medicare Part B
premiums for QMB enrollees, as well as their deductibles and coinsurance.3 Under earlier
provisions of the Omnibus Reconciliation Act of 1986 (OBRA 86), states also have the option of providing full Medicaid benefits to Medicare beneficiaries with incomes up to 100% of FPL and resources not in excess of the SSI resource level (Carpenter, 1998). Currently 18 states and the District of Columbia exercise this option.
4
Beginning in 1993, the SLMB program expanded these protections by mandating Medicaid coverage of Part B premiums for Medicare beneficiaries with incomes up to 120% of 2 The Omnibus Reconciliation Act of 1986 had previously given states the option to provide coverage of either
Medicare cost-sharing or full Medicaid benefits to Medicare beneficiaries up to 100% of FPL. 3 Medicaid also pays the Part A premiums for a small number of QMBs. These are individuals who are required to
pay Part A premiums because they do not have sufficient work history to qualify for Social Security. 4 Fifteen states offer coverage to 100% of FPL: California, District of Columbia, Hawaii, Maine, Massachusetts,
Michigan, Mississippi, Nebraska, New Jersey, North Carolina, Oklahoma, Pennsylvania, Rhode Island, South Carolina, and Utah. In addition, four states offer coverage to lower income levels: Florida (90% FPL), Illinois (85% FPL), Minnesota (95% FPL), and Virginia (80% FPL).
3
FPL and resources that do not exceed two times the SSI limit. QI-1s have incomes from 120-135% of FPL.5 QDWIs are people with incomes up to 200% of FPL that have lost their Medicare Part A benefits as a result of returning to work. Beneficiaries in both categories are allowed resources up to two times the SSI limit. Like SLMBs, Medicaid reimburses only the Part B premiums for QI-1s. Medicaid pays the Medicare Part A premiums for QDWIs. Medicaid Only Dual Eligibles are typically individuals that need to spend down to qualify for Medicaid or fall into a Medicaid eligibility poverty group that exceeds the limits of the QMB, SLMB, QI-1, and QDWI programs. They receive full Medicaid benefits and coverage of Medicare coinsurance and deductibles. States also have the option of covering their Part B premiums.
Since its inception, Medicaid has supplemented Medicare for recipients of Supplemental Security Income (SSI) by paying Medicare’s cost-sharing requirements and covering Medicaid services that are not included in the Medicare benefit package. States also have the option of providing full Medicaid coverage to medically needy Medicare beneficiaries whose income and assets exceed SSI criteria, but who incur catastrophic medical expenses. Currently, 35 states and the District of Columbia operate medically needy programs.
All beneficiaries with incomes under 100% of the federal poverty level (FPL) are considered QMBs and beneficiaries with incomes from 100-119% FPL are considered SLMBs, regardless of their basis of entitlement to Medicaid. Thus, all SSI recipients and some medically needy eligibles are classified as QMBs. Under this definition, the QMB category includes both dually eligible beneficiaries receiving full Medicaid benefits and those whose coverage is limited to Medicare cost-sharing. Similarly, the SLMB category may encompass some full-benefit medically needy eligibles, as well as those eligible only for coverage of Part B premiums. CMS distinguishes these groups by differentiating between QMB-plus and SLMB-plus (full-benefit dual eligibles) and QMB-only and SLMB-only (duals eligible for coverage of Medicare cost-sharing only).
To avoid confusion among the different categories of beneficiaries covered under the Medicare Savings Programs, this report differentiates beneficiaries who were previously eligible for Medicaid under SSI and medically needy programs from those eligible only under the QMB and SLMB programs. SSI and medically needy recipients are referred to by those program names. Other beneficiaries are identified as QMB or SLMB depending on the program for which they qualify. Within this group of QMBs, we further differentiate between those eligible only for coverage of Medicare cost-sharing (called “standard benefit QMBs” ) and those eligible for full Medicaid benefits because they reside in state that provides full Medicaid to Medicare beneficiaries up to 100% of FPL (called “QMB-plus”).
Overview of the Study Design
Previous research on dually eligible beneficiaries (and on the QMB/SLMB programs in particular) has shown that large numbers of potentially eligible beneficiaries are not taking advantage of the benefits of the Medicare Savings Programs (Barents Group, 1999; GAO, 1999; 5 An additional category of Qualifying Individual-2 (QI-2), which covered people with incomes up to 175% FPL,
was also created. Medicaid paid a small amount of the Part B premium for these people. The QI-2 program was eliminated as of January 1, 2003.
4
Rosenbach and Lamphere, 1999; Families USA, 1998; Moon et al., 1996). Although enrollment rates have increased over time, more than a third of eligible beneficiaries still are not enrolled in the programs (ARC, 2002; Moon et al., 1998). Participation varies among the Medicare Savings Programs, with much lower enrollment in the SLMB program than in QMB (Barents Group, 1999; Moon et al., 1998; Moon et al., 1996; Families USA, 1998). Moreover, there is substantial variation across states in participation rates (Rosenbach and Lamphere, 1999; Families USA, 1998; Actuarial Research Corporation, 2002). Lack of awareness of the Medicare Savings Programs has been a major barrier to increasing program participation. Among the factors that have been identified as possible determinants of success in enrolling beneficiaries are state outreach activities, simplified application processes, and generosity of Medicaid eligibility standards (Rosenbach and Lamphere, 1999; Nemore, 1997; Shaner, 1999; GAO, 1999). However, previous research has yielded only mixed evidence of an association between intensity of outreach activities and participation rates (Neumann et al., 1994; GAO, 1994; Shaner, 1999).
Although these programs in the past have not reached many potential eligibles, previous studies show they benefit the most vulnerable beneficiaries, including those who are less educated, are minorities, are disabled or otherwise in poor health, receive SSI or other welfare income, and do not have private supplemental insurance (GAO, 1999; Neumann et al., 1995; Barents Group, 1999). In addition, enrollees have higher rates of service use compared to eligible nonenrollees (Barents Group, 1999; Parente and Evans, 1998; Neumann et al., 1995; Pezzin and Kasper, 2002). However, it is not clear whether program enrollment increases service use or sicker beneficiaries with a greater underlying propensity to use services are more likely to enroll (Parente and Evans, 1998; Pezzin and Kasper, 2002).
Prior studies have not differentiated dually eligible beneficiaries otherwise eligible under SSI or medically needy provisions from those eligible only under the QMB and SLMB programs. However, these categories of dually eligible beneficiaries differ along a number of dimensions that make it critical to distinguish among them in order to gain an accurate understanding of the operation and impact of the Medicare Savings Programs.
• Pathways to enrollment. SSI beneficiaries receive Medicaid by virtue of their eligibility for SSI cash benefits and beneficiaries in some states6 are automatically bought into Medicaid with no additional action on their part. Medically needy beneficiaries qualify for Medicaid because of their high medical expenditures. In contrast, Medicaid buy-in for QMBs and SLMBs is not triggered by enrollment in another program and they must take affirmative steps in order to receive these benefits. Although medical expenses may drive their enrollment decision, by definition they do not have medical expenses of the same magnitude as medically needy beneficiaries.
• Benefit packages. SSI, medically needy, and QMB-plus beneficiaries are entitled to coverage of all Medicaid services, as well as Medicare cost-sharing payments. Standard benefit QMBs only receive coverage of Medicare cost-sharing payments,
6 Currently 31 states and the District of Columbia have a §1634 agreement with the Social Security Administration
to automatically buy all SSI recipients into Medicaid. In the remaining 19 states, the state makes its own buy-in determination, sometimes using more restrictive eligibility criteria.
5
while SLMBs only receive the Medicare Part B premium. These varying benefits are likely to affect beneficiary incentives to enroll in the programs, as well as their service utilization.
• Beneficiary characteristics. Beneficiary income levels, which are typically associated with service use, differ across groups based on the income eligibility requirements for each program. Lower income may also be associated with other beneficiary characteristics that can affect service use, including race and age. The health status of enrollees may also differ across groups. Medically needy beneficiaries are likely to be in the poorest health. While lower income SSI beneficiaries might be expected to be in poorer health than QMBs and SLMBs, to the extent that the enrollment decision for QMBs and SLMBs is more driven by medical needs, this might not be the case.
This study was designed to identify the factors, both policy and individual, that influence enrollment in the Medicare Savings Programs, as well as program impacts on beneficiaries. Our study addresses some of the limitations of previous research by distinguishing among Medicare Savings Programs beneficiaries who have different bases of entitlement to Medicaid and who receive different benefits. To address these questions, we conducted many different types of analyses, drawing on a wide variety of primary and secondary data sources. Our primary data sources include:
• the first national survey of beneficiaries enrolled in the Medicare Savings Programs (and their nonenrollee counterparts) that focuses on QMBs and SLMBs who are not otherwise eligible for Medicaid as SSI or medically needy beneficiaries;
• focus groups of enrollees and eligible nonenrollees;
• focus groups of social service professionals who work with low-income Medicare beneficiaries; and
• a survey of state Medicaid agencies on outreach activities, enrollment processes, and eligibility criteria for the Medicare Savings Programs.
The secondary data sources used in our analyses include:
• the Medicare Current Beneficiary Survey (MCBS);
• the Medicare National Claims History (NCH) file;
• the Medicare Enrollment Data Base (EDB) and Denominator file; and
• the TPEarth (also known as the Third Party Buy-in) file.
Our study focuses primarily on QMBs and SLMBs who are not otherwise eligible for Medicaid under SSI or medically needy programs. Concerns about low program enrollment are greatest for these QMBs and SLMBs and little is known about them compared to traditional categories of dually eligible beneficiaries. Within the QMB population, we differentiate between beneficiaries residing in standard benefit states and those in QMB-plus states to identify the impact of differences in the benefits they receive. SSI beneficiaries are included in a number of our analyses, both to provide a comparison for QMBs and SLMBs and to provide a more
6
complete picture of beneficiaries covered by the Medicare Savings Programs.7 We classified
beneficiaries in these groups using CMS’s TPEarth (or Third Party Buy-in) file, which CMS uses to bill state Medicaid programs for the Part B premiums they have “bought into”, i.e., agreed to pay Medicare on behalf of their dually eligible beneficiaries. Our MCBS analysis also includes a comparison group of eligible nonenrollees. Specific nonenrollee comparison groups were identified for the SSI, QMB, and SLMB populations based on the income and asset eligibility criteria for those programs.
Summary of Findings
Program Enrollment
Medicare Savings Programs enrollment has grown over time. Between 1999 and 2001, the percentage of eligible beneficiaries who were enrolled in the program, or the takeup rate, increased from 62% to 64% nationwide.8 There was substantial variation in the takeup rate across states, ranging from 26% in New Hampshire and North Dakota in 2001 to 88% in California.
Enrollment in the Medicare Savings Programs is fairly stable, certainly in comparison with other means-tested programs that similarly require periodic recertification of eligibility. Despite anecdotal reports that substantial numbers of beneficiaries drop off the program at redetermination because they are unaware of the need to be recertified, we found little evidence that this is a problem. Although QMBs and SLMBs are more likely than SSI beneficiaries to lose eligibility at redetermination, only about 2% are disenrolled at their initial redetermination and the loss at each successive redetermination. Instead, there is a slow cumulative loss over time. At the end of five years, about 80% of SSI, 70% of QMB, and 60% of SLMB beneficiaries remain enrolled in one of the Medicare Savings Programs.
Beneficiaries with health problems are more likely to enroll in the Medicare Savings Programs. Although the specific measures that were significant varied across programs (i.e., SSI, QMB-plus, standard benefit QMB, and SLMB), enrollees have poorer self-reported health status, lower functional status, and more chronic conditions compared to eligible nonenrollees. In addition, enrollees were more likely to use non-medical services associated with decreased physical function, such as personal care and home making services. We also found strong
7 Medicaid Only Dual Eligibles, who are primarily medically needy, are excluded from most of our analyses for
several reasons. First, not all states “buy into” Medicaid on behalf of their medically needy population. Second, they are not continuously eligible for Medicaid, but (depending on the state) may need to re-qualify by spending down each year. Third, they represent a relatively small portion of all dually eligible beneficiaries and have atypical patterns of utilization and expenditures. We also exclude QI and QDWI beneficiaries from most of our analyses because QI enrollment is capped and QDWI enrolls only a small number of beneficiaries. Most of our analyses also exclude beneficiaries enrolled in Medicare+Choice plans because Medicare claims data are not available to analyze their patterns of service use. Even in those analyses that do not rely on claims data, we would not have adequate sample sizes to examine managed care enrollees separately.
8 One of CMS’ GPRA goals was to increase enrollment in the Medicare Savings Programs by 4%. This goal, which was achieved, was based on the increase in the number of enrollees from October 1, 1998, through September 30, 2000. In contrast, we report the change in the takeup rate and our data cover a later time period (1999-2001).
7
evidence that enrollment in the QMB and SLMB programs may be precipitated by major health events such as hospitalizations.
Outreach Activities and Application Procedures
States have increased their outreach activities for the Medicare Savings Programs over time. They have increased their use of both printed materials and live presentations. In addition, nearly all states have formed some type of partnership with other state agencies, federal agencies or local organizations to promote outreach. The application, enrollment, and eligibility processes have also become easier. For example, 38 states had adopted a shortened application form for the Medicare Savings Programs by 2001.
Despite these efforts, we did not find evidence that variation in state outreach activities and application procedures explains differences in takeup rates across states. There are a number of limitations to this analysis that may explain this finding, including the limited time period of the analysis and the accuracy of some of the key variables. These limitations are discussed in greater depth below.
However, it is striking that, despite extensive outreach efforts in recent years, our survey showed the main reason eligible individuals do not enroll is that they are unaware of these programs. Although CMS and the states have invested in print, broadcast media, and presentations, few beneficiaries responding to the survey had learned about the programs these ways. Rather, enrollment was associated with learning about the program from social workers and health professionals. In addition, there are high levels of illiteracy, as well as physical and cognitive impairment, in the target population for whom printed materials are of little value. We also found that helping professionals with whom beneficiaries come in contact and who could educate or encourage them to enroll are not consistently knowledgeable about the Medicare Savings Programs.
The study findings also point out the limited potential of presentations at community or senior centers as an approach to outreach. Only a small proportion of enrollees and eligible nonenrollees utilize these centers and only a small percentage of the enrollees indicated they had learned of the programs this way.
While focus groups comprised of social service professionals who work with low-income Medicare beneficiaries highly praised shortened applications, difficulties with the enrollment process itself may remain a barrier to enrollment. Although the majority of enrollees received help with the application and only a small percentage report it was very difficult, many still found it too long, too personal and too difficult. Fifteen to 20% of eligible nonenrollees overall cite the application as a barrier to enrollment.
Personal values or other considerations are often cited as impediments to enrollment. Close to 20% of eligible nonenrollees overall are concerned with estate recovery. While welfare stigma or the fierce commitment to self-sufficiency of the generation that lived through the Depression is one of the most often cited obstacles to enrollment, we found that few eligible nonenrollees do not want the assistance, and many enrollees indicated that they enrolled because they deserve the benefits. If beneficiaries have heard of the programs, they do not enroll because they do not know how to apply or they assume they will not qualify for them.
8
Service Use
Enrollment in the Medicare Savings Programs improves access to medical care services, as measured by service utilization. After controlling for the poorer health status of enrollees and other differences in beneficiary characteristics, our analyses show that enrollees are more likely than eligible nonenrollees to use inpatient services, outpatient hospital services, Part B services overall, and physician visits. We found greater service use by enrollees compared to nonenrollees regardless of the benefits to which they are entitled under the Medicare Savings Programs. The positive impact for SLMBs is particularly noteworthy given that they remain liable for Medicare copayments and deductibles. As a result, enrollment only affects their ability to purchase services through their savings on the Part B premium. However, the Part B premium represents a substantial share of total income for SLMBs. In 2003, Part B premium payments would consume about 7% of the annual income a single person living at 120% of the federal poverty level (FPL) and about 10% of the income of a couple.
Greater service use by enrollees may reflect differences between enrollees and eligible nonenrollees in health status or other characteristics that affect the likelihood of seeking care. As discussed above, enrollees are in poorer health than nonenrollees. In addition, hospitalizations are an important precipitating event for enrollment in the QMB and SLMB programs. To the extent that beneficiaries were hospitalized for chronic conditions, this could predict higher levels of ongoing service use.
Although we controlled for measurable differences in health status, it is possible that there remain unobserved differences between enrollees and eligible nonenrollees that contribute to our finding of higher service use by enrollees. We attempted to measure the impact of adverse selection on utilization differences between enrollees and nonenrollees using instrumental variables analysis. In some cases the estimated effects of program enrollment on service use were implausibly large in our instrumental variable analyses; in others, large estimated effects were insignificant. Although the instruments used in these analyses were significant predictors of enrollment, it is possible that they were not sufficiently powerful to identify the effects of adverse selection. As a result, we could not determine conclusively the extent to which higher service use by enrollees is determined by the protection from cost-sharing that they receive under the Medicare Savings Programs.
Findings on relative service use across types of Medicare Savings Programs enrollees are mainly consistent with differences in the generosity of the benefit package to which they are entitled. As expected, since they remain liable for Medicare copayments and deductibles, SLMBs are less likely than standard benefit QMB and QMB-plus beneficiaries to use most services. Some of the differences are quite large, particularly relative to QMB-plus beneficiaries.
Given that they both receive full coverage of Medicare copayments and deductibles, we expected and found few differences in Medicare service use between QMB beneficiaries living in standard QMB benefit states and those living in QMB-plus states. However, QMB-plus beneficiaries were significantly more likely to have a visit with a physician or other Part B provider. This may be related to coverage of prescription drugs that QMB-plus beneficiaries, but not standard benefit QMBs, receive through Medicaid. As discussed below, QMB-plus beneficiaries use more prescription drugs than those living in standard QMB benefit states. As a result, QMB-plus beneficiaries may need to see a doctor more often to monitor or renew their
9
medications. In addition, beneficiary focus groups suggested that beneficiaries without prescription drug coverage may avoid seeing a physician if they think the result will be a prescription that they are unable to afford.
Service use by SSI beneficiaries relative to other Medicare Savings Programs enrollees was generally lower than expected in light of the broad coverage to which they are entitled. They were less likely than standard benefit QMB and QMB-plus beneficiaries to use most Medicare services and there were few significant differences from SLMBs. These lower than expected levels of service use may reflect differences in the characteristics of the enrollee groups that we were unable to control for in our analyses. For example, enrollment in SSI may be less subject to adverse selection than the other Medicare Savings Programs. While QMBs and SLMBs apply to the Medicare Savings Programs specifically to receive medical benefits, SSI beneficiaries receive Medicaid by virtue of their entitlement to SSI cash benefits. Thus, enrollment in the SSI program may be less driven my medical care needs. Although they are inconclusive, our analyses did not find evidence of adverse selection in the SSI program, but suggest that there may be adverse selection in the other programs.
Out-of-Pocket Costs
The key goal of the Medicare Savings Programs is to provide assistance to low-income Medicare beneficiaries in paying their out-of-pocket expenses for medical care services. Our findings clearly indicate that the Medicare Savings Programs succeed in achieving this goal. Although they decrease the financial burdens experienced by Medicare beneficiaries, they do not eliminate them.
SSI, standard benefit QMB, and QMB-plus enrollees are in poorer health and use more services than their nonenrollee counterparts. Despite this, enrollees in all three groups have lower out-of-pocket costs than eligible nonenrollees. As expected, SSI and QMB-plus beneficiaries receive greater protection from out-of-pocket costs than standard benefit QMBs. In contrast, SLMB enrollees also use more services than eligible nonenrollees, but there are no differences between the groups in out-of-pocket costs. This suggests that they are using the savings on the Part B premium to purchase additional medical services. Nevertheless, more than half of SLMBs delay seeking care because of the cost.
Although the Medicare Savings Programs reduce beneficiary liability, the vast majority of enrollees continue to incur some out-of-pocket costs and the burden is particularly large for SLMBs. While a substantial proportion of standard benefit QMB and QMB-plus enrollees delay seeking medical care because of costs and have problems paying for their medications, SLMBs were even more likely to report these difficulties.
Coverage of prescription drugs through Medicaid provides a valuable benefit to SSI and QMB-plus enrollees. SSI and QMB-plus enrollees have substantially lower out-of-pocket costs for prescription medicines than eligible nonenrollees, while there were no differences between standard benefit QMB and SLMB enrollees and their nonenrollee counterparts. SSI and QMB-plus enrollees also have significantly lower out-of-pocket costs for prescription drugs than standard benefit QMB and SLMB enrollees. In our beneficiary survey, QMB-plus beneficiaries were much less likely than standard benefit QMB or SLMB beneficiaries to report they had difficulties paying for prescriptions or used fewer medications than prescribed due to costs.
10
Study Limitations
Identifying Type of Medicare Savings Programs Coverage
Our study findings highlight the importance of distinguishing among different categories of Medicare Savings Programs enrollees when assessing program operation and impacts. CMS’ TPEarth (Third Party Buy-In) file is the only data source that can be used to differentiate SSI, QMB, and SLMB beneficiaries. However, there are limitations to the TPEarth data that make it difficult to categorize beneficiaries in this way. First, it may be difficult to reliably differentiate SSI and QMB beneficiaries, except in states that automatically buy SSI beneficiaries into Medicaid. Second, except in states with automatic buy-in for SSI beneficiaries, it may be difficult to reliably identify transitions between eligibility categories within a period of continuous Medicaid buy-in.
As a result of these limitations in the TPEarth file, most of our analyses exclude data from ten states where we could not reliably distinguish QMB from SSI beneficiaries. Some analyses that look back over a beneficiary’s eligibility history exclude additional states. The states that remain in our analyses may not be representative of all states. Most importantly, all of the excluded states do not automatically enroll SSI beneficiaries in Medicaid. Our findings for SSI beneficiaries are, therefore, the most likely to suffer from any biases due to these exclusions.
Identifying Eligible Nonenrollee Population
Ideally, in identifying the eligible nonenrollee population, we would have liked to have adjusted income and asset data for the types of exclusions that are used when making eligibility determinations. However, this was not possible due to limitations in reporting income and asset data in the MCBS and, instead, we used gross income and assets. Our beneficiary survey similarly relied on questions about gross income and assets to identify eligible nonenrollees. This approach has also been used in previous studies (Pezzin and Kasper, 2002; GAO, 1999).
Because we could not adjust for income and assets for these exclusions, the eligible nonenrollee populations used in our analyses have lower income and assets than their enrollee counterparts. While this could affect our findings on differences between enrollees and nonenrollees, we tested the sensitivity of the results of our MCBS analyses to this bias and found little impact. Our findings on service use were unchanged when we limited the enrollee population to the income ranges used to identify eligible nonenrollees.
Adverse selection
There are many differences between enrollees and eligible nonenrollees, as well as between types of enrollees, that undoubtedly influence patterns of service use and out-of-pocket expenditures. Our multivariate analyses control for those characteristics that can be observed in our data sets. The MCBS analyses include a particularly rich set of controls. Nonetheless, there undoubtedly remain unmeasured differences between the groups that influence our findings. The adverse selection analyses attempted to systematically control for unmeasured differences between the enrollee and eligible nonenrollee populations. However, we could not determine conclusively the extent to which higher service use by enrollees is driven by Medicare Savings Programs benefits.
11
Data for Analysis of State Enrollment Variation
Our study of state variation in program enrollment found no significant relationship between state outreach activities or application procedures and Medicare Savings Programs enrollment rates. There are a number of limitations to the data that were used in this set of analyses that may explain these findings.
Some limitations are related to the limited time period for the study. There were only three years of data available for this portion of the study, which may not have been long enough to observe the impact of increasing outreach activities. In addition, variation in the enrollment rate was limited in a number of states during this time period. It may also take time to observe the impact of new outreach initiatives on enrollment. Although our analyses primarily looked at the relationship between concurrent outreach efforts and enrollment, we nonetheless found similar results when we tested the relationship between enrollment and prior year outreach. Finally, because the state is the unit of observation, the sample size was small even in the analyses that incorporated all three years of data.
Additional limitations are related to our ability to accurately measure the key variables used in these analyses. While we had hoped to measure the intensity of outreach efforts, it was not possible based on the responses to the state outreach survey and, for the most part, our analyses simply looked at the whether a state had undertaken a particular activity in a given year. As a result, our outreach variables may not have been refined enough to accurately identify enrollment impacts. In addition, the quality of some of the responses to the state outreach survey was poor. It is also difficult to reliably estimate the number of Medicare beneficiaries that qualify for the Medicare Savings Programs so that our enrollment rates may not be accurate. Finally, including SSI and medically needy beneficiaries in the enrollment rate may have diluted the impact of outreach activities because we expect their enrollment will be less affected by these efforts than that of QMBs and SLMBs.
Discussion
It is clear that the Medicare Savings Programs offer a valuable benefit to enrollees. Enrollment in the Medicare Savings Programs increases utilization of medical care services for low-income Medicare beneficiaries. While the benefit is greatest for those entitled to the broadest coverage, covering the Medicare Part B premium alone appears to increase service use for the SLMB population. Although it is a relatively modest benefit, this coverage may provide substantial financial relief for near-poor Medicare beneficiaries and free resources that enable them to purchase additional medical care services. Nonetheless, perhaps because of its more limited benefit, enrollment in the SLMB program has lagged behind that in other components of the Medicare Savings Programs and continued efforts are needed to promote the value of this program.
The Medicare Savings Programs also provide substantial protection from out-of-pocket costs. However, most enrollees continue to incur some out-of-pocket costs, particularly SLMBs, who have over $2,200 in out-of-pocket costs per year. Indeed, the average out-of-pocket costs for a SLMB beneficiary would consume about 20% of the annual income of a person living at 120% of poverty. Despite receiving very comprehensive benefits, the SSI and QMB-plus populations remain liable for out-of-pocket costs, ranging from $400 to over $1,000 per year,
12
that are likely to be a serious hardship for some beneficiaries. Further research is needed to better understand the sources of these remaining out-of-pocket costs, particularly for SSI and QMB-plus beneficiaries. Our findings also highlight the substantial burden posed by out-of-pocket expenditures for prescription drugs. While the burden is greatest for standard benefit QMB and SLMB beneficiaries, SSI and, especially, QMB-plus beneficiaries continue to incur out-of-pocket costs despite having coverage of outpatient prescription drugs through Medicaid.
Many studies have shown that the Medicare Savings Programs are under-utilized and our findings indicate that lack of awareness, not motivation, is the main reason eligible beneficiaries have not enrolled. Furthermore, personal assistance is key to successfully educating and enrolling beneficiaries into the Medicare Savings Programs. These findings suggest that it may be most effective to target outreach efforts to those in the community that can identify potentially eligible beneficiaries and assist them with the enrollment process. One strategy would be to focus education efforts on the many types of health and social service providers that have daily contact with potentially eligible Medicare beneficiaries, but often have little knowledge about the Medicare Savings Programs. A second strategy is to increase awareness among other helping professionals of the services available from SHIP, including assistance with the application process and answers to specific questions. SHIP workers should be encouraged to develop relationships with other helping professionals in their community. If more individuals seek assistance from SHIP, it will be necessary to increase investment and expand the SHIP program. A final strategy is to develop training on the Medicare Savings Programs for welfare office workers and to have welfare office staff that specializes in them. Although many enrollees receive help from local welfare office staff, our focus groups of beneficiaries and helping professionals reported that there is often limited staff in these offices to respond to calls about the program and the staff responsible for taking applications may have little knowledge about the programs themselves.
Despite significant strides toward simplification, our findings indicate that aspects of the application process and certain eligibility requirements remain impediments to enrollment. The application itself was cited as a barrier to enrollment by 15-20% of eligible nonenrollees and requiring documentation of income and assets decreased the likelihood of enrolling. Estate recovery was cited as a concern by 20% of eligible nonenrollees. Although the amount subject to estate recovery may be small, especially for SLMBs, beneficiaries often do not understand the limits of the estate recovery process. Finally, the current asset limits, which were established in 1989 and have not been updated since, exclude many low-income beneficiaries who would otherwise qualify for the program. In our survey, 45% of nonenrollee respondents with incomes under 120% of poverty had assets that exceeded the limits for the Medicare Savings Programs.
Our study highlights the importance of distinguishing among different categories of enrollees in the Medicare Savings Programs in order to understand how differences in eligibility pathways and benefit packages influence patterns of enrollment, service use, and out-of-pocket costs. However, it can be sometimes difficult to obtain some basic information about the Medicare Savings Programs because there is currently no centralized source of information about state policies. CMS is developing a web-based repository on state-plan information. It would be helpful for researchers and people in the policy community for this effort to be continued and resources invested to make this a user-friendly data source.
13
Our study was limited by the lack of data for certain states to reliably identify the benefits to which a Medicare Savings Programs enrollee is entitled and the basis of her eligibility. CMS has addressed these limitations through recent enhancements to the Medicaid Statistical Information System (MSIS). Beginning in 1999, MSIS includes detailed information on the type of dual benefits to which a beneficiary is entitled as well as basis of eligibility. Furthermore, MSIS now includes the Medicare Health Insurance Claim (HIC) number so that MSIS and Medicare data can be linked for dually eligible beneficiaries. This linkage to Medicare data is critical because Medicare is the primary payer for most services received by dually eligible beneficiaries and many analyses of the Medicare Savings Programs will focus primarily on Medicare data. However, this linkage, which requires researchers to work with quarterly MSIS files for each state, is cumbersome for Medicare analyses, particularly those that require data for multiple states. Although MSIS data are converted to MAXX files to be more accessible to researchers, there are considerable lags before these files are available. CMS could remove barriers to incorporating accurate information on dual eligibility in Medicare analyses by continuing to support and expedite creation of the MAXX files. In addition, MSIS data could be merged to Medicare analytic files. CMS is currently working on developing a process for such a merge.
References
Actuarial Research Corporation: Dual Eligible Buy-In Status. Prepared for the Centers for Medicare & Medicaid Services, July 29, 2002.
Barents Group, LLC: A Profile of QMB-Eligible and SLMB-Eligible Medicare Beneficiaries. Prepared for the Health Care Financing Administration. April 7, 1999.
Carpenter, L: Evolution of Medicaid Coverage for Medicare Cost Sharing. Health Care Financing Review, 20(2):11-18. Winter 1998.
Families USA: Shortchanged: Billions Withheld from Medicare Beneficiaries. Washington, DC: Families USA Foundation, 1998.
Hoover, S., Khatutsky, G., and Haber, S.: Evaluation of the Process and Impact of State Outreach and Enrollment Programs for Dual Eligibles. Final Report prepared under CMS contract No. 500-95-0058. November 20, 2002.
Mitchell, J.B. and Haber, S.G.: State Payment Limitations on Medicare Cost-Sharing: Impacts on Dually Eligible Beneficiaries and their Providers. Final Report, CMS Contract No. 500-95-0058, TO#8, Waltham, MA: RTI International, July 2003.
Moon, M., Kuntz, C., and Pounder, L.: Protecting Low-Income Medicare Beneficiaries. Washington, DC: The Urban Institute, November 1996.
Moon, M., Brennan, N., and Segal, M.: Options for Aiding Low-Income Medicare Beneficiaries. Inquiry, 35:346-356, Fall 1998.
Nemore, P.B.: Variations in State Medicaid Buy-in Practices for Low-Income Medicare Beneficiaries. Washington, DC: National Senior Citizens Law Center, November 1997.
14
Neumann, P.J., et al.: Identifying Barriers to Elderly Participation in the Qualified Medicare Beneficiary Program. Prepared for the Health Care Financing Administration under Cooperative Agreement No. 17-C-90094/3-01. Bethesda, MD. Project Hope Center for Health Affairs, August 23, 1994.
Neumann, P.J., et al.: Participation in the Qualified Medicare Beneficiary Program. Health Care Financing Review, 17(2):169-178, Winter 1995.
Parente, S.T. and Evans, W.N.: Effect of Low-Income Elderly Insurance Copayment Subsidies. Health Care Financing Review, 20(2):19-37, Winter 1998.
Pezzin, L.E. and Kasper, J.D.: Medicaid Enrollment among Elderly Medicare Beneficiaries: Individual Determinants, Effects of State Policy, and Impact on Service Use. Health Services Research, 37(4):827-847, August 2002.
Rosenbach, M. and Lamphere, J.: Bridging the Gaps Between Medicare and Medicaid: The Case of QMBs and SLMBs. Washington, DC: AARP, January 1999.
Shaner, H.: Dual Eligible Outreach and Enrollment: A View from the States. Report submitted by the American Public Human Services Association to HCFA, March 1999; available from http://www.hcfa.gov/medicaid/o&erpt.htm; Internet; accessed 27 May 1999.
United States General Accounting Office: Many Eligible People Not Enrolled in Qualified Medicare Beneficiary Program. Washington, DC, January 1994.
United States General Accounting Office: Low-Income Medicare Beneficiaries: Further Outreach and Administrative Simplification Could Increase Enrollment. Washington, DC, GAO/HEH-99-61, April 1999.
15
CHAPTER 1 INTRODUCTION
Low enrollment in the Medicare Savings Programs has been a source of long-standing concern. CMS’s 1999 initiative under the Government Performance and Results Act (GPRA)
9
was to “improve access to care for elderly and disabled Medicare beneficiaries who do not have public or private supplemental insurance.” As part of its efforts to achieve this goal, CMS convened a group of federal and state representatives to create a national strategy for increasing enrollment in the Medicare Savings Programs. To support these efforts, CMS contracted with researchers to profile the characteristics of enrollees and those eligible but not enrolled, assess the effectiveness of state and federal outreach programs, and estimate the enrollment rate in the Medicare Savings Programs.
To further this CMS GPRA goal, CMS contracted with RTI International to provide information on the effects of the Medicare Savings Programs, as well as factors that influence program participation. Our study addresses the following specific questions:
• What factors drive the decision to enroll in the Medicare Savings Programs?
• Do differences in outreach activities, enrollment processes, and eligibility criteria explain state variation in Medicare Savings Programs enrollment rates?
• How long do beneficiaries remain enrolled in the Medicare Savings Programs?
• What is the impact of enrollment on Medicare service use?
• To what extent does adverse selection in the decision to enroll in the Medicare Savings Programs explain any observed differences in Medicare service use between enrollees and eligible nonenrollees?
• What is the impact of enrollment on beneficiary out-of-pocket costs?
This chapter provides an overview of the Medicare Savings Programs and our study design. Our study extends previous research on the Medicare Savings Programs by differentiating Medicare Savings Programs enrollees on their basis of entitlement and the benefits they receive. As we will show, this distinction is critical to a full understanding of program enrollment and impacts.
This report is one of several reports that were produced under RTI’s contract with CMS. Other reports include an evaluation of programs in states that received grant funding to promote outreach and enrollment in the Medicare Savings Programs (Hoover et al., 2002) and an evaluation of the impact of state limitations on Medicare cost-sharing payments on beneficiaries and providers (Mitchell and Haber, 2003).
1.1 Background on the Medicare Savings Programs
Despite the broad health insurance coverage that Medicare provides to the aged and disabled populations, beneficiaries are subject to substantial cost-sharing requirements in the
9 The purpose of the GPRA, passed in 1993, was to create accountability in government agencies by requiring them
to set goals for themselves and standards by which their performance could be measured.
16
form of Part B (and, occasionally, Part A) premiums, deductibles, and coinsurance. In addition, Medicare’s exclusion of certain services, such as outpatient prescription drugs and nursing home care, may pose a significant liability for beneficiaries. The burden of these out-of-pocket costs on the low-income population was recognized in the original design of the Medicare program, which extended dual Medicare-Medicaid eligibility to certain categories of low-income beneficiaries. Since the program’s inception, Medicaid has supplemented Medicare for recipients of Supplemental Security Income (SSI) by paying Medicare’s cost-sharing requirements and covering Medicaid services that are not included in the Medicare benefit package. States were also given the option of providing full Medicaid coverage to medically needy Medicare beneficiaries whose income and assets exceed SSI criteria, but who incur catastrophic medical expenses. Currently, 35 states and the District of Columbia operate medically needy programs.
Even with these protections, out-of-pocket costs are a substantial liability for many low-income Medicare beneficiaries who are ineligible for Medicaid under these provisions (Moon et al., 1996). Since the late 1980s Congress has addressed this problem through a series of eligibility expansions that created a set of benefits known collectively as the Medicare Savings Programs. The Medicare Savings Programs is the name used by CMS, many states, and other federal agencies to refer to benefits provided to individuals who are dually eligible for Medicare and some form of Medicaid. Beneficiaries can qualify for the Medicare Savings Programs under five main categories:
• Qualified Medicare Beneficiary (QMB);
• Specified Low-Income Medicare Beneficiary (SLMB);
• Qualifying Individual-1 (QI-1);
• Qualified Disabled and Working Individual (QDWI); and
• Medicaid Only Dual Eligibles.
The benefits and eligibility criteria vary across these categories.
The QMB program was created under the Medicare Catastrophic Coverage Act (MCCA) of 1988, which mandated Medicaid coverage of Medicare cost-sharing requirements for Medicare beneficiaries with incomes up to 100% of the federal poverty level (FPL) and resources not in excess of twice the SSI resource limit.
10 Medicaid pays the Medicare Part B premiums for QMB enrollees, as well as their deductibles and coinsurance.
11 Under earlier
provisions of the Omnibus Reconciliation Act of 1986 (OBRA 86), states also have the option of providing full Medicaid benefits to Medicare beneficiaries with incomes up to 100% of FPL and resources not in excess of the SSI resource level (Carpenter, 1998). Currently 18 states and the
10 The Omnibus Reconciliation Act of 1986 had previously given states the option to provide coverage of either
Medicare cost-sharing or full Medicaid benefits to Medicare beneficiaries up to 100% of FPL. 11 Medicaid also pays the Part A premiums for a small number of QMBs. These are individuals who are required
to pay Part A premiums because they do not have sufficient work history to qualify for Social Security.
17
District of Columbia exercise this option.12
Beginning in 1993, the SLMB program expanded these protections by mandating Medicaid coverage of Part B premiums for Medicare beneficiaries with incomes up to 120% of FPL and resources that do not exceed two times the SSI limit.
Several other categories of dually eligible beneficiaries have been created during the past decade, including QI-1 and QDWI.
13 QI-1s have incomes from 120-135% of FPL. QDWIs are
people with incomes up to 200% of FPL that have lost their Medicare Part A benefits as a result of returning to work. Beneficiaries in both categories are allowed resources up to two times the SSI limit. Like SLMBs, Medicaid reimburses only the Part B premiums for QI-1s. Medicaid pays the Medicare Part A premiums for QDWIs. Medicaid Only Dual Eligibles are typically individuals that need to spend down to qualify for Medicaid or fall into a Medicaid eligibility poverty group that the exceeds the limits of the QMB, SLMB, QI-1, and QDWI programs. They receive full Medicaid benefits and coverage of Medicare coinsurance and deductibles. States also have the option of covering their Part B premiums.
The distinction among the various categories of dually eligible beneficiaries was blurred by the Technical and Miscellaneous Revenue Act of 1998, which changed the definition of QMBs to include anyone meeting QMB requirements even if they are otherwise eligible for Medicaid (Carpenter, 1998). Thus, all SSI recipients and some medically needy eligibles are classified as QMBs. Under this definition, the QMB category includes both dual eligibles receiving full Medicaid benefits and those whose coverage is limited to Medicare cost-sharing. Similarly, the SLMB category may encompass some full-benefit medically needy eligibles, as well as those eligible only for coverage of Part B premiums. CMS distinguishes these groups by differentiating between QMB-plus and SLMB-plus (full-benefit dual eligibles) and QMB-only and SLMB-only (duals eligible for coverage of Medicare cost-sharing only).
To avoid confusion among the different categories of beneficiaries covered under the Medicare Savings Programs, we differentiate beneficiaries who were previously eligible for Medicaid under SSI and medically needy programs from those eligible only under the QMB and SLMB programs. SSI and medically needy recipients are referred to by those program names. Other beneficiaries are identified as QMB or SLMB depending on the program for which they qualify. Within this group of QMBs, we further differentiate between those eligible only for coverage of Medicare cost-sharing (called “standard benefit QMBs” in our analyses) and those eligible for full Medicaid benefits because they reside in state that provides full Medicaid to Medicare beneficiaries up to 100% of FPL (called “QMB-plus” in our analyses).
Previous research on dually eligible beneficiaries (and on the QMB/SLMB programs in particular) has not distinguished between those otherwise eligible under SSI or medically needy
12 Fifteen states offer coverage to 100% of FPL: California, District of Columbia, Hawaii, Maine, Massachusetts,
Michigan, Mississippi, Nebraska, New Jersey, North Carolina, Oklahoma, Pennsylvania, Rhode Island, South Carolina, and Utah. In addition, four states offer coverage to lower income levels: Florida (90% FPL), Illinois (85% FPL), Minnesota (95% FPL), and Virginia (80% FPL).
13 An additional category of Qualifying Individual-2 (QI-2), which covered people with incomes up to 175% FPL, was also created. Medicaid paid a small amount of the Part B premium for these people. The QI-2 program was eliminated as of January 1, 2003.
18
provisions and those eligible only under the new QMB and SLMB programs. This commingling of groups is a significant limitation of previous research that we address in this study.
1.2 Previous Research on the Medicare Savings Programs
1.2.1 Program Participation Rates
Numerous studies have shown that large numbers of potentially eligible QMBs and SLMBs do not participate in these programs. Most studies have found that somewhere around half of all potential QMB/SLMB eligibles are not enrolled, with estimates ranging from 42% to 53% for time periods ranging from 1993 to 1996 (Barents Group, 1999; GAO, 1999; Rosenbach and Lamphere, 1999; Families USA, 1998; Moon et al., 1996). A more recent estimate found higher enrollment rates, with only 36% of QMB/SLMB eligibles not enrolled in 1998 (Moon et al., 1998). Actuarial Research Corporation (2002), which develops estimates of enrollment rates in dual eligible programs under contract to CMS, found a similar proportion not enrolled in 2002. Participation rates vary markedly for the QMB and SLMB programs. QMB participation rates range from as low as 41% (Neumann et al., 1995) to as high as 78% (Moon et al., 1998), while estimated SLMB participation rates are far lower, ranging from 0.5% to 16% (Barents Group, 1999; Moon et al., 1998; Moon et al., 1996; Families USA, 1998). Moreover, there is substantial variation across states in participation rates (Rosenbach and Lamphere, 1999; Families USA, 1998; Actuarial Research Corporation, 2002).
Despite their lack of uniformity, all of these estimates indicate that large numbers of potential eligibles are not taking advantage of the benefits of the Medicare Savings Programs. Among the factors that have been identified as possible determinants of success in enrolling beneficiaries are state outreach activities, simplified application processes, and generosity of Medicaid eligibility standards (Rosenbach and Lamphere, 1999; Nemore, 1997; Shaner, 1999; GAO, 1999). Most beneficiaries who are eligible but not enrolled have never heard of the Medicare Savings Programs (Neumann et al., 1994). Recent focus group findings indicate that eligible Medicare beneficiaries want to enroll once they are aware of the programs (Perry, Kannel, and Dulio, 2002). While one study found that Medicare beneficiaries residing in states that undertook more outreach activities were more likely to enroll (Neumann et al., 1994), other studies found little evidence of an association between outreach activities and participation rates (GAO, 1994; Shaner, 1999). Moreover, it appears that states make tradeoffs between the price of certain outreach activities and their effectiveness (Shaner, 1999).
Estimates of QMB and SLMB program participation rates from previous research may paint an overly optimistic picture of the success of these programs at enrolling beneficiaries who are eligible for only the QMB and SLMB programs because they include those who are otherwise eligible for Medicaid as SSI or medically needy recipients. Inclusion of SSI recipients, in particular, inflates the success of QMB and SLMB program enrollment. As noted previously, enrollment rates for SSI recipients should be virtually 100% in auto-accrete states, although it is possible that not all beneficiaries who qualify for SSI cash payments receive these benefits. Given that very few eligible beneficiaries are aware of the QMB program (Neumann et al., 1995; GAO, 1999), it is not surprising that SSI eligibility is a strong predictor of QMB participation. In marked contrast to the overall participation rates of roughly 50% cited in previous studies, Neumann and colleagues (1995) found that 95% of SSI recipients participated
19
in QMB, while the Barents Group (1999) reported 89% QMB participation among SSI recipients.
1.2.2 Characteristics and Service Use of QMB/SLMB Enrollees
Previous studies contrasting QMB and SLMB enrollees with eligible nonenrollees suggest that, although they have not reached many potential eligibles, these programs do appear to benefit the most vulnerable beneficiaries. Participation rates are highest among less educated beneficiaries, certain minorities, those without private supplemental insurance, those eligible for Medicare because of disability or end-stage renal disease, those receiving SSI or welfare income, those reporting fair or poor health status, and those reporting limitations in activities of daily living (GAO, 1999; Neumann et al., 1995). The Barents Group (1999) characterized enrollees and nonenrollees for the QMB and SLMB programs separately and found many similarities across the two groups. Compared to QMB enrollees, beneficiaries who were eligible but not enrolled were more likely to be among the oldest-old, White, married, residents of urban areas, better educated, and home-owners. They were less likely to receive SSI or other welfare program income. Nonenrollees reported better health status and they were also more likely to have private supplemental insurance. Like QMB nonenrollees, SLMB eligible nonenrollees were more likely than enrollees to be among the oldest-old, married, and homeowners and less likely to be on welfare. They were also more likely to report better health status, own private supplemental insurance and have a usual place of care than participating SLMBs.
Most studies have shown that QMB and SLMB enrollees have higher rates of service use compared to eligible nonenrollees (Barents Group, 1999; Parente and Evans, 1998; Neumann et al., 1995; Pezzin and Kasper, 2002). It is less clear, however, whether program enrollment induces higher service use or whether sicker beneficiaries with a greater underlying propensity to use services are more likely to enroll in the programs. Parente and Evans (1998) used an instrumental variable approach to control for potential endogeneity in the QMB enrollment decision. However, their model was imprecisely estimated and did not yield conclusive results. Pezzin and Kasper (2002) similarly used an instrumental variable approach and found that controlling for adverse selection enrollment reduced the impact of enrollment on service use.
Given its large size relative to QMBs and SLMBs, particularly during the earlier time periods covered by these studies, these findings on beneficiary characteristics and service use are dominated by the SSI population. As discussed in Section 1.3, there are significant differences in the characteristics, pathways to enrollment, and benefit package of SSI recipients compared to QMBs and SLMBs. As a result, these findings may not be representative of QMBs and SLMBs who were not otherwise eligible for Medicaid. This limitation of the previous research on the Medicare Savings Programs is addressed by our study.
1.3 Study Design
This study was designed to identify the factors, both policy and individual, that influence enrollment in the Medicare Savings Programs, as well as program impacts on beneficiaries. To address these questions, we conducted many different types of analyses, drawing on a wide variety of primary and secondary data sources. Our primary data sources include:
20
• the first national survey of beneficiaries enrolled in the Medicare Savings Programs (and their nonenrollee counterparts) that focuses on QMBs and SLMBs who are not otherwise eligible for Medicaid as SSI or medically needy beneficiaries;
• focus groups of enrollees and eligible nonenrollees;
• focus groups of social service professionals who work with low-income Medicare beneficiaries; and
• a survey of state Medicaid agencies on outreach activities, enrollment processes, and eligibility criteria for the Medicare Savings Programs.
The secondary data sources used in our analyses include:
• the Medicare Current Beneficiary Survey (MCBS);
• the Medicare National Claims History (NCH) file;
• the Medicare Enrollment Data Base (EDB) and Denominator file; and
• the TPEarth (also known as the Third Party Buy-in) file.
Most of the previous research on dually eligible beneficiaries has not distinguished beneficiaries who qualify for Medicaid under the eligibility expansions of the 1980s and 1990s that created the QMB and SLMB programs from those who qualify under SSI or medically needy provisions. However, these categories of dually eligible beneficiaries differ along a number of dimensions that make it critical to distinguish among them in order to gain an accurate understanding of the operation and impact of the Medicare Savings Programs.
First, there are distinct differences in the pathways to enrollment for these groups. SSI beneficiaries receive Medicaid by virtue of their eligibility for SSI cash benefits and for many SSI beneficiaries no action is required to obtain Medicaid benefits. Currently, 31 states and the District of Columbia (known as §1634 or auto-accrete states) have entered into an agreement with the Social Security Administration to automatically buy all SSI recipients into Medicaid. In these states, virtually 100% of SSI recipients should be enrolled in Medicaid. In the remaining 19 states (known as 209b states), the state makes its own buy-in determination for SSI recipients, sometimes using more restrictive eligibility criteria.
14 Medically needy beneficiaries qualify for
Medicaid because of their high medical expenditures. In contrast, Medicaid buy-in for QMBs and SLMBs is not triggered by enrollment in another program and they must take affirmative steps in order to receive these benefits. Many of the beneficiaries who are eligible for the QMB and SLMB programs may not have any relationship with a social services agency. Unlike SSI beneficiaries they may have less incentive to enroll since they do not receive cash benefits. On the other hand, because they only receive medical benefits, their enrollment decision may be more motivated by medical needs than that of SSI beneficiaries. Although medical expenses may drive the decision of QMBs and SLMBs to enroll, by definition they do not have expenses of the same magnitude as medically needy beneficiaries.
14 Of the 209b states, 8 apply SSI eligibility criteria, but still make their own Medicaid buy-in determination while
11 use eligibility criteria that are stricter than SSI.
21
Second, there are important differences in the benefits they receive. SSI, medically needy, and QMB-plus beneficiaries are entitled to coverage of all Medicaid services, as well as Medicare cost-sharing payments. Standard benefit QMBs only receive coverage of Medicare cost-sharing payments, while SLMBs only receive the Medicare Part B premium. These varying benefits are likely to affect beneficiary incentives to enroll in the programs, as well as their service utilization.
Finally, the characteristics of beneficiaries in each of these groups are likely to differ. Most notably, beneficiary income levels differ across groups based on the income eligibility requirements for each program. Lower income beneficiaries are expected to have greater needs for care and higher levels of service use all else being equal. Lower income may also be associated with other beneficiary characteristics that can affect service use, including race and age. The different pathways to program enrollment may also influence the characteristics of beneficiaries enrolled in each of the programs. Medically needy beneficiaries are likely to be in the poorest health. While lower income SSI beneficiaries might be expected to be in poorer health than QMBs and SLMBs, to the extent that the enrollment decision for QMBs and SLMBs is more driven by medical needs, this might not be the case.
Our study focuses primarily on QMBs and SLMBs who are not otherwise eligible for Medicaid under SSI or medically needy programs. Concerns about low program enrollment are greatest for these QMBs and SLMBs and little is known about them compared to traditional categories of dually eligible beneficiaries. Within the QMB population, we differentiate between beneficiaries residing in standard benefit states and QMB-plus states to identify the impact of differences in the benefits they receive. SSI beneficiaries are included in a number of our analyses, both to provide a comparison for QMBs and SLMBs and to provide a more complete picture of beneficiaries covered by the Medicare Savings Programs. Our MCBS analysis also includes a comparison group of eligible nonenrollees. Specific nonenrollee comparison groups were identified for the SSI, QMB, and SLMB populations based on the income and asset eligibility criteria for those programs.
We classified dually eligible beneficiaries by their basis of eligibility and the benefits to which they are entitled using CMS’s TPEarth file, which CMS uses to bill state Medicaid programs for the Part B premiums they have “bought into”, i.e., agreed to pay Medicare on behalf of their dually eligible beneficiaries. Based on a series of codes reported in the TPEarth file, beneficiaries were categorized as:
• SSI,
• QMB,
• SLMB, and
• Other.
We further divided QMBs into QMB-plus and standard benefit QMBs based on the state in which the beneficiary resided.
15 The category of “Other” includes anyone not classified as SSI,
15 The states that provide full Medicaid benefits up to 100% FPL have changed over time. The specific states used
to identify QMB-plus enrollees varied based on the time period covered by the data used in a particular analysis.
22
QMB, or SLMB (primarily medically needy beneficiaries and QI-1s). Appendix A contains the detailed specifications used to create these groups.
There are some limitations to the TPEarth data that make it difficult to reliably categorize beneficiaries in these groups in some cases. First, it may be difficult to distinguish between SSI and QMB beneficiaries in states that do not auto-accrete SSI beneficiaries into Medicaid. Based on the specifications described in Appendix A, we found that the proportion of beneficiaries identified as SSI recipients was implausibly low in 10 states.
16 These states were excluded from
most of our analyses. Second, it may be difficult to identify the original type of eligibility during a continuous period of buy-in because previous eligibility codes are overwritten when a beneficiary’s eligibility changes. The exception is when a beneficiary changes between SSI and other eligibility categories in auto-accrete states. Most of our analyses only required information on current eligibility. However, the duration of enrollment analysis (Chapter 4) is based on eligibility history data. As a result, this analysis excludes all 19 states that do not auto-accrete SSI recipients into Medicaid.
Medicaid Only Dual Eligibles, who are primarily medically needy, are excluded from most of our analyses for several reasons. First, not all states “buy into” Medicaid on behalf of their medically needy population. Second, they are not continuously eligible for Medicaid, but (depending on the state) may need to re-qualify by spending down each year. Third, they represent a relatively small portion of all dually eligible beneficiaries and have atypical patterns of utilization and expenditures. We also exclude QI and QDWI beneficiaries from most of our analyses because QI enrollment is capped and QDWI enrolls only a small number of beneficiaries.
Most of our analyses also exclude beneficiaries enrolled in Medicare+Choice plans because Medicare claims data are not available to analyze their patterns of service use. Even in those analyses that do not rely on claims data, we would not have adequate sample sizes to examine managed care enrollees separately.
1.4 Overview of the Report
The remainder of the report is organized as follows. Chapter 2 describes the findings from our beneficiary survey and focus groups on factors that influence enrollment in the Medicare Savings Programs and the programs’ impacts on enrollees. Adverse health events may be one of the factors that triggers enrollment in the Medicare Savings Programs. We explore this possibility in Chapter 3 using NCH data. In Chapter 4 we analyze patterns of enrollment in the Medicare Savings Programs and the impact of periodic eligibility recertification on the duration of coverage. Chapter 5 reports on the findings from our survey of state Medicaid agencies and examines the impact of outreach activities, enrollment processes, and eligibility criteria on state variation in Medicare Savings Programs enrollment rates. The impact of enrollment in the Medicare Savings Programs on Medicare service use and beneficiary out-of-pocket costs are examined in Chapter 6. In addition, this chapter discusses the impact of adverse selection on differences in service use between enrollees and eligible nonenrollees. The report concludes with a summary and a discussion of the findings. 16 The excluded states are: Connecticut, Hawaii, Idaho, Illinois, Indiana, Maryland, Missouri, Nevada, Oklahoma,
and Utah.
23
CHAPTER 2 ENROLLMENT IN THE MEDICARE SAVINGS PROGRAMS: PATHWAYS,
BARRIERS AND PROGRAM IMPACTS
2.1 Introduction
In this chapter, we present findings from the first national beneficiary survey focused on enrollment in the Medicare Savings Programs, that is limited to Qualified Medicare Beneficiaries (QMBs) and Specified Low-income Medicare Beneficiaries (SLMBs) covered under the eligibility expansions of the late 1980s and early 1990s and does not include traditional categories of dually eligible beneficiaries. We examine factors affecting enrollment in the Medicare Savings Programs, and the programs’ impacts on enrollees. The survey findings are enriched by results from focus groups comprised of enrollees, eligible nonenrollees, and social service professionals who had the potential to identify or assist eligible beneficiaries with the application process.
The goals of these activities were to provide information to evaluate current outreach efforts and help shape future outreach efforts. We set out to:
• better understand pathways and barriers to enrollment in the Medicare Savings Programs,
• understand what role health status may play in enrollment,
• learn about the experience of beneficiaries with the enrollment process, and
• learn the extent to which these programs decrease the financial burdens experienced by low-income Medicare beneficiaries.
In studying pathways and barriers to enrollment, we were interested in learning about individual motivations or triggers for enrollment (i.e., why some people seek these programs and others do not, and how people find out about the programs), and about system issues that promote or impede enrollment. In studying the impacts of the Medicare Savings Programs, we were interested in learning the extent to which the programs increase access to care or defray the costs of health care for low-income Medicare beneficiaries. As QMB enrollees in some states receive the full Medicaid benefit, we were also interested in learning to what extent enrollment assists these low-income beneficiaries with the costs of prescription drugs. Indeed, our findings indicate that the QMB program substantially reduces out-of-pocket costs for enrollees and, in the states that provide full Medicaid benefits, enrollment in the QMB program provides much needed assistance with the costs of prescription drugs.
As in the rest of this evaluation, we focus on QMB and SLMB beneficiaries who are not otherwise eligible for Medicaid as Supplemental Security Income (SSI) or medically needy recipients. In most states (referred to as standard QMB benefit states), these QMB and SLMB beneficiaries receive assistance with Medicare cost-sharing requirements, but do not receive other Medicaid benefits. However, some states (referred to as QMB-plus states) provide full Medicaid benefits to all Medicare beneficiaries with incomes up to 100% of the federal poverty level (FPL), regardless of whether they qualify as traditional SSI or medically needy dual eligibles.
24
We have excluded SSI and medically needy dually eligible beneficiaries from our analyses for several reasons. These beneficiaries face additional incentives to enroll based on the cash benefits, and (in standard QMB benefit states) the broader range of medical services available to them. Furthermore, in many states (known as auto-accrete states) SSI recipients are enrolled in Medicaid automatically. In addition, QMBs and SLMBs are likely to differ systematically from the SSI and medically needy populations. The medically needy are, by definition, high service users. SSI recipients are poorer than the QMBs and SLMBs. Lower income beneficiaries are expected to have greater needs for care and higher levels of service use all else being equal. To the extent that the enrollment decision for QMBS and SLMBs is more driven by medical needs, this might not be the case. While QMBs and SLMBs only receive medical benefits, SSI beneficiaries may be motivated to enroll in order to receive cash benefits.
Previous research on the Medicare Savings Programs has included traditional full benefit SSI and medically needy dual eligibles. Therefore, little is known about factors driving enrollment in the QMB and SLMB programs among beneficiaries not otherwise eligible for Medicaid, nor is there information about the experience of those who enroll. Our key findings include the following:
Program Impacts
• Both enrollees and nonenrollees report significant out-of-pocket expenditures for medical care, but Medicare Savings Programs enrollees are much better off than nonenrollees. They report lower out-of-pocket expenditures, despite evidence of poorer health status compared to nonenrollees.
• QMBs in QMB-plus states report less trouble paying for prescription drugs than nonenrollees; however, there is no difference for QMB enrollees in states with the standard QMB benefit compared to nonenrollees. This suggests that assistance with the Part B premium and with other cost-sharing requirements is not enough to offset the prescription drug costs faced by low-income Medicare beneficiaries.
Pathways to Enrollment
• Most eligible nonenrollees had never heard of the Medicare Savings Programs, while enrollees typically learned of the Medicare Savings Programs from multiple sources. Enrollees were most likely to hear about the programs through personal contacts with social workers, health care professionals, friends and family, or visits to community agencies or government offices.
• Receipt of community support services was a strong predictor of enrollment in the Medicare Savings Programs. This may reflect differences in help-seeking behavior, underlying health status, or connections to organizations that conduct Medicare Savings Programs case finding.
• Poor health status substantially increased the likelihood of enrollment.
25
• While many enrollees do not recall how they became enrolled, more than a third report a hospital stay triggered enrollment, a fourth cite a change in family situation (such as widowhood), and about a sixth enrolled after moving to subsidized housing.
• Two-thirds of enrollees report that someone helped them with the application process, including friends or family members, social workers or case managers, and staff at the office where they received the application.
• The most common reason enrollees gave for applying was to access help paying their medical bills.
• While few respondents attend senior centers or other community centers, at least half the respondents attend a place of worship. Thus, faith-based outreach efforts have the potential to reach many Medicare Savings Programs eligibles.
• Residence in a QMB-plus state, where a much richer benefit is offered, increases the likelihood of enrollment in both the QMB and SLMB programs (the latter presumably a spill-over effect from higher rates of application to the QMB program).
2.2 Study Questions
Given the gaps in the literature regarding QMB and SLMB enrollment, we developed and fielded surveys and focus groups to address the following study questions:
• Why do some beneficiaries enroll in these programs, while other eligible beneficiaries do not?
• What types of outreach or state enrollment processes are associated with higher enrollment rates?
• How do beneficiaries enroll? What facilitates their enrollment?
• What is the relationship between health status and enrollment in the QMB and SLMB programs?
• Are the use of social and community services associated with enrollment?
• To what extent does enrollment decrease out-of-pocket expenditures and financial burden for enrollees?
• How do enrollment in these programs and private supplemental coverage relate? Do beneficiaries substitute the Medicare Savings Programs for private supplemental coverage?
The remainder of this chapter is organized into six sections. In Section 2.3, we describe the focus group and survey methodologies. Sections 2.4 and 2.5 report findings from our descriptive analyses of the surveys, supplemented by information from the focus groups. The multivariate analyses, modeling enrollment as a function of individual and state program
26
characteristics, are presented in Section 2.6. We conclude with a discussion of the findings in Section 2.7.
2.3 Methodology
For this study we conducted a series of focus groups across the country, as well as developed two national beneficiary surveys. One survey was designed for QMB and SLMB enrollees and one was designed for eligible nonenrollees. In the following section we discuss how the focus group materials were developed and how the states were selected. We also discuss the development and pretest of the survey instruments.
2.3.1 Focus Groups
RTI and its subcontractor, New England Research Institutes (NERI), held 12 focus groups across 6 states. Four of these focus groups were used to pre-test recruiting techniques for the main focus groups and the focus group discussion guides. Based on our experience in the pre-test groups, we revised the discussion guides and recruitment techniques for the main focus groups. In addition, we used the pre-test focus groups to identify response options for inclusion in the beneficiary surveys. The findings in this report include those from the pre-test groups.
State Selection - We selected the pre-test focus group states (Massachusetts and New Hampshire) based on proximity to RTI’s and NERI’s offices to minimize travel costs. The main focus group sites were chosen based on QMB and SLMB enrollment rates from our analysis of the April 2000 TPEarth file. We included two states with high QMB/SLMB enrollment rates and two states with relatively low enrollment. High enrollment states were those with more than 50% of the dual eligible population enrolled in the QMB and SLMB programs, and low enrollment states were those with less than one-third of dual eligibles enrolled in the QMB and SLMB programs. We further required that one state from each category have a pharmacy assistance program. State pharmacy programs often have eligibility requirements similar to the Medicare Savings Programs. Including states with pharmacy programs would allow us to examine why eligible nonenrollees might be enrolled in the pharmacy programs but not the Medicare Savings Programs or, conversely, if enrollees learn about the Medicare Savings Programs during the process of applying for pharmacy assistance. From these general categories, we excluded states if:
• they were part of the sample for a National Senior Citizens Law Center study covering similar topics because we did not want to duplicate efforts;
• they provided full Medicaid benefits for QMB beneficiaries with incomes up to 100% FPL because we wanted to interview beneficiaries who only received cost-sharing assistance; and,
• they received grants from CMS to pilot programs to increase QMB and SLMB enrollments (“Building Partnerships for Innovative Outreach and Enrollment of Dual Eligibles.”) because we did not want to confound our results with states’ initiatives associated with this grant.
Based on the selection criteria, we held focus groups in Pennsylvania, North Carolina, Iowa and Colorado (Table A).
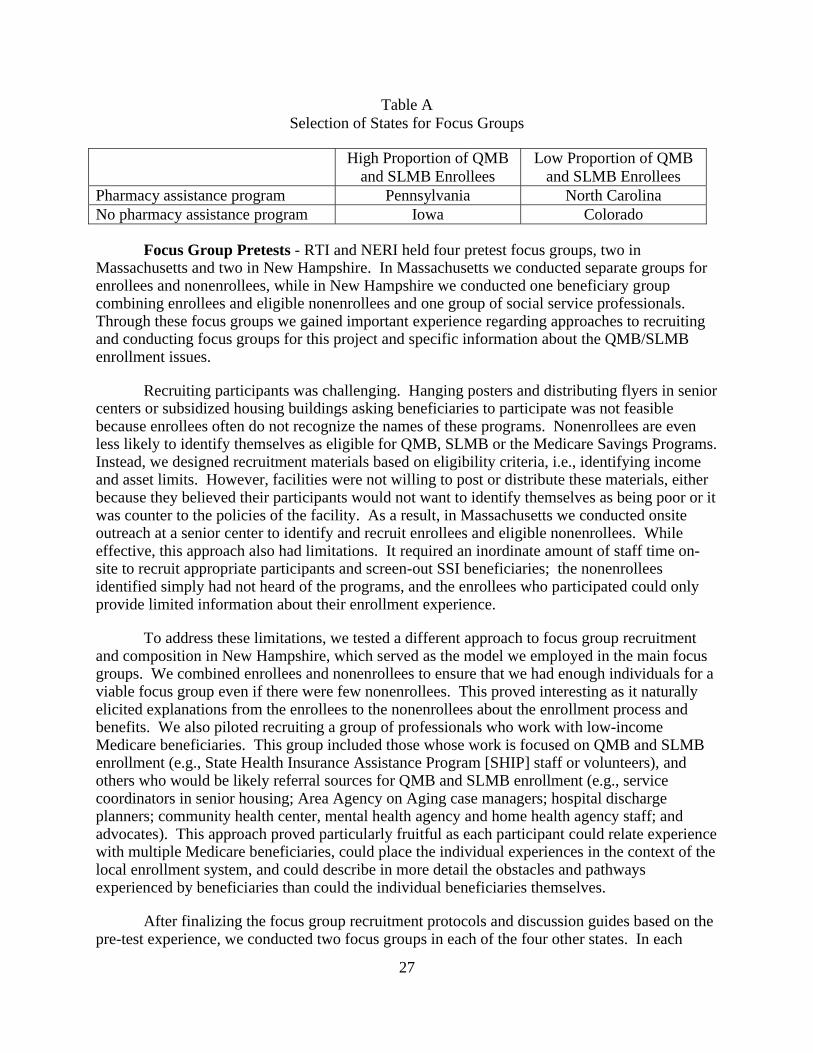
27
Table A Selection of States for Focus Groups
High Proportion of QMB and SLMB Enrollees
Low Proportion of QMB and SLMB Enrollees
Pharmacy assistance program Pennsylvania North Carolina No pharmacy assistance program Iowa Colorado
Focus Group Pretests - RTI and NERI held four pretest focus groups, two in Massachusetts and two in New Hampshire. In Massachusetts we conducted separate groups for enrollees and nonenrollees, while in New Hampshire we conducted one beneficiary group combining enrollees and eligible nonenrollees and one group of social service professionals. Through these focus groups we gained important experience regarding approaches to recruiting and conducting focus groups for this project and specific information about the QMB/SLMB enrollment issues.
Recruiting participants was challenging. Hanging posters and distributing flyers in senior centers or subsidized housing buildings asking beneficiaries to participate was not feasible because enrollees often do not recognize the names of these programs. Nonenrollees are even less likely to identify themselves as eligible for QMB, SLMB or the Medicare Savings Programs. Instead, we designed recruitment materials based on eligibility criteria, i.e., identifying income and asset limits. However, facilities were not willing to post or distribute these materials, either because they believed their participants would not want to identify themselves as being poor or it was counter to the policies of the facility. As a result, in Massachusetts we conducted onsite outreach at a senior center to identify and recruit enrollees and eligible nonenrollees. While effective, this approach also had limitations. It required an inordinate amount of staff time on-site to recruit appropriate participants and screen-out SSI beneficiaries; the nonenrollees identified simply had not heard of the programs, and the enrollees who participated could only provide limited information about their enrollment experience.
To address these limitations, we tested a different approach to focus group recruitment and composition in New Hampshire, which served as the model we employed in the main focus groups. We combined enrollees and nonenrollees to ensure that we had enough individuals for a viable focus group even if there were few nonenrollees. This proved interesting as it naturally elicited explanations from the enrollees to the nonenrollees about the enrollment process and benefits. We also piloted recruiting a group of professionals who work with low-income Medicare beneficiaries. This group included those whose work is focused on QMB and SLMB enrollment (e.g., State Health Insurance Assistance Program [SHIP] staff or volunteers), and others who would be likely referral sources for QMB and SLMB enrollment (e.g., service coordinators in senior housing; Area Agency on Aging case managers; hospital discharge planners; community health center, mental health agency and home health agency staff; and advocates). This approach proved particularly fruitful as each participant could relate experience with multiple Medicare beneficiaries, could place the individual experiences in the context of the local enrollment system, and could describe in more detail the obstacles and pathways experienced by beneficiaries than could the individual beneficiaries themselves.
After finalizing the focus group recruitment protocols and discussion guides based on the pre-test experience, we conducted two focus groups in each of the four other states. In each
28
state, one focus group consisted of service providers and one of enrollees and eligible nonenrollees combined. To organize the focus groups, we identified service coordinators in subsidized housing, based on contacts suggested by the State Housing and Finance Authorities, to serve as the local recruiters. These individuals have frequent contact with eligible beneficiaries and could easily recruit participants, and they were able to identify appropriate participants based on their knowledge of potential participants’ financial status. They could also arrange a location for the focus groups within the buildings where the participants lived, and they had working relations with other professionals who serve additional groups of low-income elders. We worked closely with these individuals by telephone and email, and provided recruitment materials and a stipend.
Focus Group Content - RTI and NERI designed discussion guides for the beneficiary focus groups and the service provider focus groups, copies of which are included in Appendix B. We asked the beneficiaries about the following topics: whether and how they had heard about the Medicare Savings Programs; how and why they enrolled; why nonenrollees did not enroll; unmet need and delayed care; out-of-pocket expenses; health care utilization and health status. We asked the professionals about how they and beneficiaries learned about the programs, how they assisted beneficiaries in applying for the programs, and why some beneficiaries enrolled in the programs while others chose not to. We also asked them about how beneficiaries perceived the programs. We recorded each of the focus groups, and each session was transcribed. We then reviewed the transcriptions for common themes and experiences across states to complement the data gathered through our beneficiary surveys.
2.3.2 Surveys
Sample Selection -Developing appropriate sampling frames for enrollees and eligible nonenrollees involved two major challenges. First, we needed to exclude other types of dual eligibles from the enrollee sample. As described previously, the surveys focused on individuals eligible for the QMB and SLMB programs only (as opposed to SSI and medically needy dual eligibles). The enrollee sample was drawn from the Medicare TPEarth file, which allowed us to distinguish QMB and SLMB beneficiaries from other categories of dual eligibles. Ten states were excluded from the sample due to the limitations of the TPEarth data.17 Further exclusions to the sample were:
17 Connecticut, Hawaii, Idaho, Illinois, Indiana, Maryland, Missouri, Nevada, Oklahoma and Utah were excluded
from the analysis because we could not reliably determine whether beneficiaries were QMBs or SSI recipients. In these states, the proportion of dual eligibles that our analyses of TPEarth data identified as SSI recipients was implausibly low compared to other states. None of these states allow auto-accretion of SSI recipients. This might explain the low SSI share identified in these states because auto-accrete status was one factor used in our classification algorithm to distinguish QMBs from SSI recipients.
29
• Beneficiaries aged 64 and younger.
• Beneficiaries who were not continuously eligible for Medicare in the 12 months prior to sample selection.
• Beneficiaries with any Medicare HMO coverage during this time period.
Beneficiaries in ten states that provide full Medicaid benefits for QMBs (QMB-plus states) were oversampled to permit comparisons between these states and those offering standard QMB benefits.18 Enrollees were stratified by whether they reside in a QMB-plus state and a simple random sample of 536 beneficiaries was drawn from each stratum.
The second major challenge was to identify eligible nonenrollees. This required a multi-step process because there is no data source that can be used to identify this population. We selected a sample of Medicare beneficiaries who were not dually eligible. Because many of the sample members would not meet the eligibility criteria for the QMB or SLMB programs, the survey included screening questions about income and assets that were used to determine whether a respondent qualified for the programs. The income screening question was based on the upper income limit for the SLMB program, 120% of FPL.19 This screening question was based on the more generous SLMB income criterion because we felt that it would be too difficult for respondents to reliably report income within the narrow band that is needed to differentiate QMB and SLMB eligibility. The asset screening question was set at two times the asset limit for the SSI program, which is the maximum amount allowed for QMB and SLMB eligibility.
Beneficiaries who meet the income and asset criteria for the QMB and SLMB programs are a small proportion of the non-dually eligible Medicare population. In order to increase the likelihood that sample members would meet the income and asset criteria for the QMB and SLMB programs, we oversampled beneficiaries residing in areas where a high concentration of elderly residents have low net worth (defined as net worth less than $5,000).20
To develop the nonenrollee sampling frame, we used Census data to identify the percentage of elderly residents with low net worth living in each ZIP code from the 41 states included in the study. We then assigned each ZIP code to a stratum based on whether a low, medium, or high percentage of its population over age 65 had a net worth of less than $5,000. A fourth stratum was added for ZIP codes with small numbers of Medicare beneficiaries.21 These 18 The District of Columbia, Florida, Maine, Massachusetts, Mississippi, Nebraska, New Jersey, Pennsylvania,
South Carolina and Vermont provide full Medicaid benefits to beneficiaries with incomes up to 100% FPL. Florida provides full benefits to 90% FPL.
19 The FPL is the same in all states except Alaska and Hawaii, where it is set higher to reflect the cost of living in these areas. Hawaii was excluded from the sample as one of the 10 states with poor quality TPEarth data. The income screening question on the version of the survey sent to residents of Alaska reflected the higher FPL in that state.
20 We arrived at this sampling strategy based on analyses of Census and TPEarth data that showed a correlation between rate of QMB/SLMB enrollment in a ZIP code and the net worth of residents age 65 and over. We also looked at the correlation between QMB/SLMB enrollment and the income of the population over age 65. Because net worth was more strongly correlated with enrollment, we selected this as the economic indicator used in our sampling strategy.
21 Approximately 4% of all zip codes have 30 or less Medicare beneficiaries. We were concerned that after excluding dual eligibles there would be a very small number of remaining beneficiaries qualifying for the
30
strata were further divided by whether the ZIP code was in a QMB-plus state, resulting in eight stratification cells. ZIP codes were sampled from these stratification cells, with oversampling of ZIP codes with a high concentration of elderly residents with low net worth. Then Medicare beneficiaries were sampled from the selected ZIP codes using the Medicare EDB.
Although we assumed that oversampling ZIP codes that have a high concentration of elderly residents with low net worth would increase the likelihood that sample members would meet the income and asset eligibility criteria for the QMB and SLMB programs, the effectiveness of the sampling strategy was unknown. Therefore, we selected the sample in two batches so that the sampling procedure could be revised based on the results of eligibility screening for the first batch. In the first batch, a total of 1,072 ZIP codes were randomly selected from eight stratification cells and one beneficiary was randomly sampled from each ZIP code. Experience with the first batch showed that sample members residing in ZIP codes that have a high percentage of elderly residents with low net worth were, in fact, more likely to meet the eligibility criteria than those residing in ZIP codes with low and medium percentages. Therefore, the second batch of 1,072 beneficiaries was selected entirely from the low asset ZIP codes. The hit rate (defined as the percent of respondents who met the income eligibility criteria) in the first batch was 25%. The hit rate increased to 29% in the second batch which was selected entirely from low asset ZIP codes. The overall hit rate was approximately 27%.
All members of the nonenrollee sample meeting the income criterion for these programs were included in the survey analyses, regardless of whether they met the asset criterion. Overall, 55% of the respondents in our nonenrollee analyses met both the income and asset criteria. We included beneficiaries who had assets in excess of the national limits for several reasons. First, strict adherence to the income and asset limits resulted in a very small sample (N=204) that would have limited our ability to make meaningful comparisons across various strata. Second, respondents had difficulty calculating their assets so we were not confident about the quality of these data. Third, twenty-one states have already relaxed their asset limits (Summer and Friedland, 2002) and advocates are suggesting that more states adopt this policy, which can be implemented at each state’s discretion. Thus, information on the experience of higher asset beneficiaries may be of interest to policy makers. Finally, the professionals in our focus groups also reported that many who would qualify based on their income alone exceed the asset limits by only several thousand dollars or less and could easily become eligible at a later point in time.
Survey Content - We developed separate survey instruments for enrollees and eligible, nonenrollees. Both surveys included sections on demographics, health status, health care utilization, use of support services and measures of community ties, out-of-pocket expenditures on health care and measures of financial stress, supplemental insurance coverage, and how they had heard about the Medicare Savings Programs (if at all). In addition, enrollees were asked about their experience with the application process, including what type of help they had received with the process, what had motivated them to apply, and how they valued the benefits
sample. However, simply omitting these zip codes from our sampling frame would exclude some beneficiaries and restrict the generalizability of our results. Instead, we created a separate stratum and undersampled these zip codes.

31
received. Eligible nonenrollees were asked why they had not enrolled. Both survey instruments are included in Appendix C.
We used information we obtained in the early focus groups to identify appropriate response options for some of the survey items. For example, the social service professionals identified Medicare HMO closures as a precipitating event leading to Medicare Savings Programs applications. In addition, we conducted a pre-test of the enrollee and eligible, nonenrollee survey instruments, to test the flow of the instruments and the wording of individual items.
Data Collection - The data collection for the mailed component of the study began in July 2001 and concluded in January 2002. NERI used a mixed-mode method for the survey data collection, where the surveys were first mailed to beneficiaries and followed-up with telephone interviews when necessary. RTI obtained telephone numbers for sample members from a private company that matched telephone numbers based on address information on the EDB.
The protocol for the mixed-mode survey consisted of mailing a pre-notification letter on Department of Health & Human Services’ stationery signed by an official at CMS, up to three mailings of the questionnaire to a sampled beneficiary, and telephone follow-ups to nonrespondents to the mailed survey component. Each mailing to study participants included a cover letter and a questionnaire with a postage pre-paid return enveloped. If the questionnaire was not returned to NERI within eight weeks, a second mailing was sent with another cover letter, again urging them to participate. In addition, sampled Medicare beneficiaries with telephone numbers who did not return their surveys received reminder calls encouraging them to return the mailed questionnaire. At the time of each telephone call, respondents were given the option to complete the survey by telephone. Responses to the telephone interviews were collected and recorded using NERI's in-house Computer Assisted Telephone Interviewing (CATI) System.
Response Rates - The response rate to the enrollee survey (N=1,072) was 57%. The response rate to the nonenrollee survey (N= 2,144) was higher, 72%, but, as expected, included many who did not meet the eligibility criteria. After excluding respondents who did not meet the income eligibility criteria, there were 405 individuals in the final nonenrollee sample. We assume the lower response rate achieved in the enrollee sample reflects the lower income and poorer health status of QMB and SLMB enrollees, compared to the initial nonenrollee sample, which included Medicare beneficiaries at all income levels. We cannot calculate a response rate for nonenrollees that is restricted to those meeting the income criteria as we have no way of knowing what proportion of the 28% who were nonrespondents would have met the eligibility criteria.
Analyses and Statistical Tests - We conducted descriptive and multivariate analyses to address the research questions. We used chi-square tests to determine statistical significance for categorical variables, and t-tests for continuous variables. In addition, we conducted logistic regressions to estimate the odds that an eligible beneficiary chose to enroll as a function of health status, sociodemographic characteristics and state characteristics derived from a survey of the states conducted as another component of this project (the State Outreach Survey). We used data from the 2000 State Outreach Survey and included types of outreach conducted by the state and simplicity of the enrollment process. Our findings are weighted to reflect the population of the
32
40 states and DC. Specifically, we weighted all observations for enrollees and eligible nonenrollees to adjust for the probability of selection and for non-response.22 All analyses were conducted in STATA to account for the complex sampling design.
We analyzed the survey responses in several ways. The main analysis compares all enrollees to eligible nonenrollees, as well as comparing eligible nonenrollees to QMBs and SLMBs separately. Next, we stratified the sample into two groups based on whether the QMB and nonenrollee respondents reside in a QMB-plus state (providing Medicaid-covered services for eligibles with income up to 100% of the FPL as well as Medicare cost-sharing) or in a state providing the standard QMB benefit.23 Our goal in these analyses is to evaluate whether this added incentive to enroll has an impact on QMB takeup rates or the characteristics of those who enroll; thus, we excluded SLMBs. We then conducted a separate analysis comparing the responses of QMB enrollees in QMB-plus states to QMB enrollees in states with the standard QMB benefit, again excluding SLMBs from the analysis.
Limitations - There are several limitations to this study. First, ten states were excluded from the analysis because of the limitations of their TPEarth data. Hence, the results are only generalizable to 40 states and the District of Columbia. Also, SLMB enrollees comprise only 8.5% of the sample. This was expected as there are very few SLMB enrollees compared to QMB enrollees nationally. However, many of the comparisons between SLMB enrollees and eligible nonenrollees that are insignificant may be a function of the small SLMB sample. Lastly, the percent of respondents who needed assistance completing the surveys was high: 56% of QMB, 47% of SLMB and 43% of eligible nonenrollees used proxies. Proxies could have either assisted or completed the surveys entirely for the respondents, and some bias could exist in terms of the assumptions proxies may have made in answering the questions. On the other hand, use of proxies likely improved the overall response rate.
2.4 Findings from the National Surveys and Focus Groups by Enrollment Status
In this section, we present the overall findings from the enrollee and nonenrollee surveys and the focus groups. In general, we present the survey findings for each topic with information from the focus groups to provide additional context or expand on the survey information. Our main analyses compare the characteristics and experiences of the following groups:
• All enrollees to nonenrollees;
• QMB enrollees to nonenrollees;
22 The probability of selection is based on (1) the probability that a beneficiary’s ZIP code was selected and (2) the
probability that the beneficiary was selected from all non-dually eligible Medicare beneficiaries in the ZIP code. We describe the adjustment for nonresponse in Appendix D.
23 As noted in the beginning of Section 2.2, we oversampled beneficiaries in states that provided full Medicaid benefits for QMBs (QMB-plus states). For the sample selection we used the QMB-plus states identified in Rosenbach and Lamphere (1999). Subsequently, we learned that a number of additional states had become QMB-plus. For our analyses, states that had become QMB-plus by 2001 are categorized as QMB-plus. As a result, there are a small number of states whose classification as QMB-plus differs between the sample selection and the analyses. State classified as QMB-plus in the analyses include: the District of Columbia, Florida, Maine, Massachusetts, Michigan, Mississippi, Nebraska, New Jersey, North Carolina, Pennsylvania, Rhode Island and South Carolina.

33
• SLMB enrollees to nonenrollees; and
• QMB enrollees to SLMB enrollees.
We also discuss key findings from separate analyses of QMBs and nonenrollees in QMB-plus states and standard benefit states. The full set of tables for these analyses are included in Appendix E. The analysis comparing the experiences of QMB enrollees in the QMB-plus states to those of enrollees in the states offering the standard QMB benefit are presented in Section 2.4.
2.4.1 Demographic Characteristics, Use of Support Services, and Community Ties
In Table 1, we compare demographic characteristics, use of various support services, and measures of community ties in the full sample. While the enrollee and nonenrollee groups do not vary on many demographic characteristics, there are substantial differences in the use of personal care, homemaking, home delivered meals, transportation, food stamps and rent subsidies. In every instance, a greater proportion of the enrollees reported use of these services than did the nonenrollees. We found only a small proportion of all survey respondents attend community or senior centers, while over half attend a place of worship. QMB and SLMB enrollees differ from each other on gender, race, residence in MSA and receipt of Meals on Wheels.
Demographic Characteristics- As seen in Table 1, there are significant differences in the gender of enrollees and eligible nonenrollees. These differences are driven by the QMB population. While significantly fewer QMB enrollees are male compared to nonenrollees (25% and 36% respectively), there is no significant difference in gender between the SLMB enrollees and eligible nonenrollees. Enrollees are a more diverse group than nonenrollees, with the difference again due to the QMB population rather than SLMB. For example, 50% of QMB enrollees were White beneficiaries compared to 71% of eligible nonenrollees; 17% of QMB enrollees were Black beneficiaries compared to 9% of eligible nonenrollees. There are no significant differences in terms of age or living arrangements across the enrollee and eligible nonenrollee groups. In all groups, close to half reported living alone, slightly less reported living with others, and a small proportion live in nursing facilities. There are also no significant differences between enrollees overall and nonenrollees in the proportion living in a metropolitan statistical area (MSA), although SLMBs are significantly less likely than nonenrollees to reside in an MSA.
There are also demographic differences between the QMB enrollees and the SLMB enrollees, some consistent with the lower income eligibility criteria for QMBs. The SLMB enrollees include a higher proportion of males (35%) and White people (80%).
In the separate analyses of enrollees and nonenrollees in QMB-plus versus states that offer standard QMB benefits (see Table E-1 in Appendix E), the patterns were similar, although the difference in gender between enrollees and nonenrollees was only significant in the QMB-plus states.
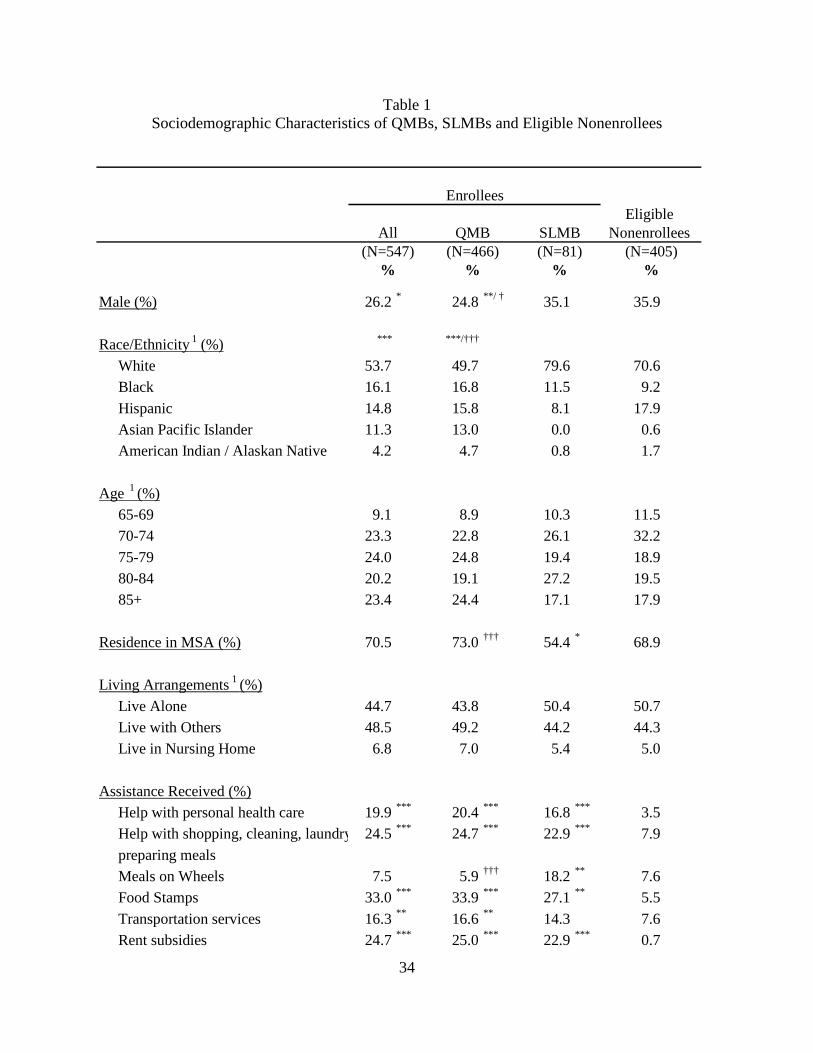
34
Table 1 Sociodemographic Characteristics of QMBs, SLMBs and Eligible Nonenrollees
Eligible Nonenrollees
(N=405)%
Male (%) 26.2 * 24.8 **/ † 35.1 35.9
Race/Ethnicity 1 (%) *** ***/†††
White 53.7 49.7 79.6 70.6 Black 16.1 16.8 11.5 9.2
Hispanic 14.8 15.8 8.1 17.9 Asian Pacific Islander 11.3 13.0 0.0 0.6 American Indian / Alaskan Native 4.2 4.7 0.8 1.7
Age 1 (%)65-69 9.1 8.9 10.3 11.5 70-74 23.3 22.8 26.1 32.2
75-79 24.0 24.8 19.4 18.9 80-84 20.2 19.1 27.2 19.5 85+ 23.4 24.4 17.1 17.9
Residence in MSA (%) 70.5 73.0 ††† 54.4 * 68.9
Living Arrangements 1 (%)
Live Alone 44.7 43.8 50.4 50.7 Live with Others 48.5 49.2 44.2 44.3 Live in Nursing Home 6.8 7.0 5.4 5.0
Assistance Received (%)Help with personal health care 19.9 *** 20.4 *** 16.8 *** 3.5 Help with shopping, cleaning, laundry 24.5 *** 24.7 *** 22.9 *** 7.9
preparing mealsMeals on Wheels 7.5 5.9 ††† 18.2 ** 7.6 Food Stamps 33.0 *** 33.9 *** 27.1 ** 5.5
Transportation services 16.3 ** 16.6 ** 14.3 7.6 Rent subsidies 24.7 *** 25.0 *** 22.9 *** 0.7
(N=466)QMB SLMB
(N=81)All
(N=547)
Enrollees
% %%
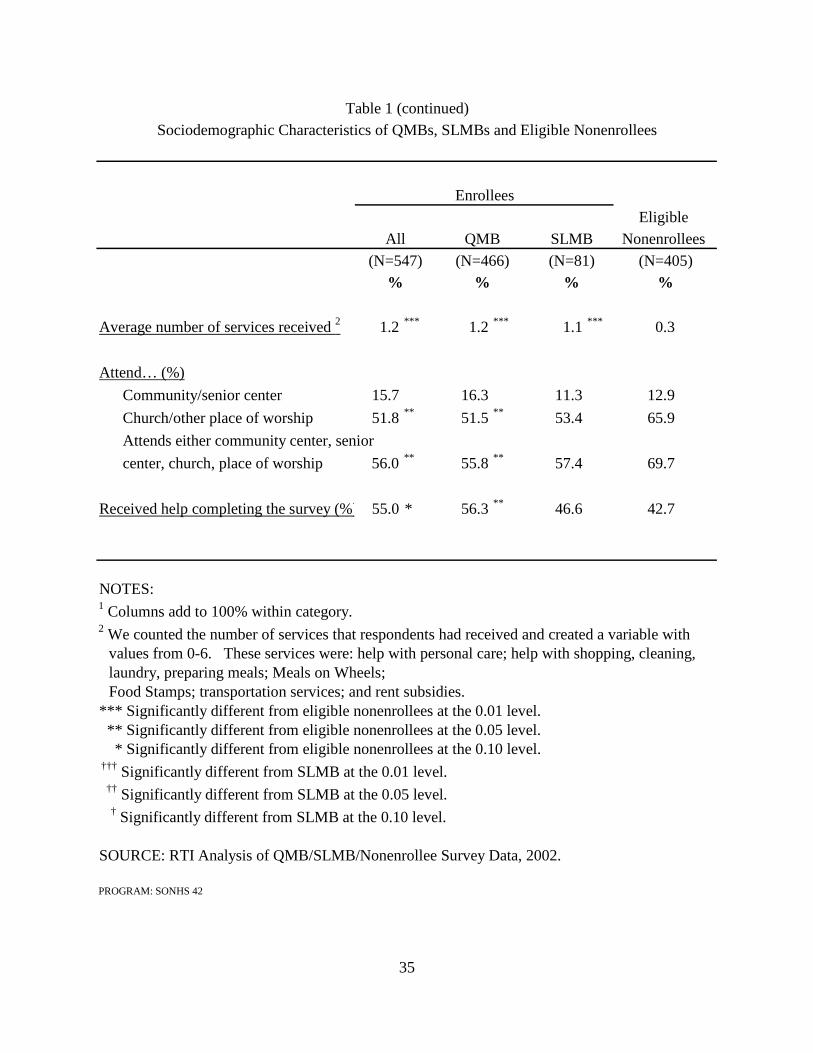
35
Eligible Nonenrollees
(N=405)%
Average number of services received 2 1.2 *** 1.2 *** 1.1 *** 0.3
Attend… (%)
Community/senior center 15.7 16.3 11.3 12.9
Church/other place of worship 51.8 ** 51.5 ** 53.4 65.9
Attends either community center, senior
center, church, place of worship 56.0 ** 55.8 ** 57.4 69.7
Received help completing the survey (%) 55.0 * 56.3 ** 46.6 42.7
NOTES:1 Columns add to 100% within category.2 We counted the number of services that respondents had received and created a variable with
values from 0-6. These services were: help with personal care; help with shopping, cleaning, laundry, preparing meals; Meals on Wheels; Food Stamps; transportation services; and rent subsidies.
*** Significantly different from eligible nonenrollees at the 0.01 level. ** Significantly different from eligible nonenrollees at the 0.05 level. * Significantly different from eligible nonenrollees at the 0.10 level. ††† Significantly different from SLMB at the 0.01 level. †† Significantly different from SLMB at the 0.05 level.
† Significantly different from SLMB at the 0.10 level.
SOURCE: RTI Analysis of QMB/SLMB/Nonenrollee Survey Data, 2002.
PROGRAM: SONHS 42
(N=547) (N=466) (N=81)% % %
Sociodemographic Characteristics of QMBs, SLMBs and Eligible Nonenrollees
Enrollees
All QMB SLMB
Table 1 (continued)
36
Use of Support Services - We included questions in the survey about use of support
services for several reasons. We wanted to test the hypothesis that use of other social services might serve as a pathway to enrollment to the Medicare Savings Programs. This could occur because social service providers or case managers might educate beneficiaries about these programs or provide assistance with the application process. In addition, differences in use of community services could also reflect differences in help seeking behaviors or the willingness to accept public assistance of any sort. Use of personal care and home making services can serve as markers for impairments in Activities of Daily Living and Instrumental Activities of Daily Living. As functional status was not a focus of the study, asking about use of these services provided a parsimonious approach to evaluating case mix differences.
Alternatively, some of the reported support service utilization could reflect Medicaid coverage for QMBs in the QMB-plus states. Specifically, personal care, homemaking services, and some transportation services might be provided to enrollees in QMB-plus states under the Medicaid benefit. In this case, greater utilization of support services by enrollees could reflect increased access to care resulting from enrollment rather than a pathway to enrollment. However, Medicaid does not cover these services for SLMBs or for QMBs in the standard benefit states. In addition, Meals on Wheels, food stamps, rent subsidies, nonmedical transportation (e.g., for shopping) and some homemaking services are covered by other state or federal programs, but not by Medicaid. We explore this issue further in Section 4, when we compare the utilization by QMB enrollees in QMB-plus states to QMB enrollees in standard benefit states.
Overall, we found that enrollees receive significantly more support services than nonenrollees. The differences are striking, with enrollees reporting at least 2-3 times as much service use as nonenrollees. For example, 20% of the QMB and 17% of SLMB enrollees receive personal care assistance, compared to only 4% of eligible nonenrollees. The percentage of enrollees who have someone who helps them with shopping, cleaning, laundry or preparing meals is also significantly higher compared to eligible nonenrollees (25% of QMB, 23% of SLMB and 8% of eligible nonenrollees).
Enrollees are also significantly more likely to receive services from community organizations and local and federal governments compared to eligible nonenrollees. Eighteen percent of SLMB enrollees receive Meals on Wheels compared to only 8% of eligible nonenrollees, while 17% of QMB enrollees utilize transportation services compared to 8% of eligible nonenrollees. Both QMB and SLMB enrollees are also significantly more likely to receive food stamps than eligible nonenrollees. In addition, one-quarter of QMB and 23% of SLMB enrollees receive rent subsidies compared to only 1% of eligible nonenrollees. On average, QMB and SLMB enrollees utilize slightly more than 1 service out of the six included in the survey, compared to an average of 0.3 services used by eligible nonenrollees. The patterns were similar, but with fewer statistically significant differences between enrollees and nonenrollees in the QMB-plus and standard QMB benefit states’ subanalyses (see Table E-1 in Appendix E).
The focus groups provided some additional information about how the use of community services and receipt of rent subsidies links to enrollment through information and referral, outreach, or advocacy. In HUD subsidized housing, service coordinators are available to assist
37
residents with accessing a variety of services and applying for other benefits. In at least some states, the Housing and Finance Administration that oversees these service coordinators conducts trainings specifically about the Medicare Savings Programs. In other areas, the service coordinators who participated in the focus groups had learned about the programs from residents who were already enrolled, or informally from their colleagues. The service coordinators and other social workers reported that individuals did not come to them already aware of the Medicare Savings Programs and asking for assistance specifically with these programs. They reported beneficiaries asking for help with specific medical bills (e.g., expensive drugs recently prescribed), or looking for any sort of financial assistance based on life changes such as widowhood, or the exit of a Medicare+Choice plan leaving them without pharmacy coverage and with the higher copayments and deductibles under Medicare fee-for-service. In addition, service coordinators screened their caseloads for potential eligibles either when new tenants arrived or on a periodic basis. They educated their residents about these programs and offered to assist with the application or refer them to workers for the SHIP. Finally, the service providers reported that there are high levels of illiteracy, physical impairments and cognitive impairment for whom printed materials, and in some cases broadcast media, are inadequate as information sources or to support these beneficiaries in the application process.
Other community service providers who have contact with eligible beneficiaries had mixed levels of information about these programs, including some who were completely unaware of these benefits. In one focus group, a nurse case manager and a home health nurse became aware of these programs only after their agencies hired benefits specialists whose role was to assist clients in identifying all available financial benefits. Some service professionals did not think of screening or educating eligible beneficiaries about programs other than the ones they represented. For example, a state pharmacy program volunteer, although a QMB herself, had not thought to inform her clients of other programs that might benefit them, focusing on helping them enroll only in the pharmacy program for which they had applied.
Community Ties - We asked survey respondents about whether they attended community centers, senior centers, churches or other places of worship to learn about their ties to the community. We included these items to identify whether nonenrollees might be more isolated than enrollees, and to identify the potential of various community settings as the focus of outreach activities. SHIP workers often make presentations at senior centers, and at least one state has targeted places of worship for possible outreach. There are several findings of note. First, only a small percentage of respondents reported attendance at community or senior centers (16% of QMB, 11% of SLMB and 13% of eligible nonenrollees), and there was no difference between the attendance reported by enrollees compared to nonenrollees or between QMB enrollees and SLMB enrollees. Second, a much higher proportion of the respondents reported attending a place of worship, 52% of QMB enrollees, 53% of SLMB enrollees and 66% of the eligible nonenrollees. In contrast to all our other measures of social supports, this is the only one in which the nonenrollees reported a significantly higher use rate. When we combined the two (community or senior center attendance with attendance at a place of worship), the QMB enrollees were still significantly less likely to participate compared to the nonenrollees, while there was no difference in attendance between the SLMB enrollees and the eligible nonenrollees.
We also asked respondents if they received help completing this survey, and found a sizable and significant difference between the QMB enrollees (56%) and the eligible nonenrollees (43%). Without additional information it is difficult to interpret this finding which
38
could be related to the differences we observe in health status between the two groups (discussed in the next section), or in social supports.
2.4.2 Health Status
We asked beneficiaries two questions about health status (Table 2). The first question is a standard item regarding self-rated general health. Both types of enrollees rated their health as poorer than did the nonenrollees; however, only the results for QMB enrollees were significant. Less than a third of the QMB respondents and 23% of SLMB enrollees described their health as excellent, very good or good compared to 45% of the nonenrollees. In addition, nearly 30% of the QMB enrollees and 36% of SLMB enrollees described themselves as in poor health, compared to only 16% of eligible nonenrollees. In the separate analyses of enrollees and nonenrollees in QMB-plus and standard QMB benefit states, the pattern is similar, but the differences observed were not statistically significant in the QMB-plus states or in the standard QMB benefit states. (Table E-2 in Appendix E).
Our second question used as a general marker of health status asks the degree to which health problems interfere with the respondent’s regular social activities. We have found this question to be as highly associated with the risk of Medicare costs as a battery of questions about ADL and IADL impairments (Pope et al., 1998). In the main analysis, there were no significant differences between the enrollees and nonenrollees in response to this question or between the QMB and SLMB enrollees, although the direction of the results suggest the health of nonenrollees is better than that of the enrollees. Less than one-quarter of QMB enrollees and SLMB enrollees reported that their health never interfered with their social activities, while less than one-third of eligible nonenrollees reported this. In the subanalysis of QMB enrollees and nonenrollees in QMB-plus states, there were also no significant differences (Table E-2 in Appendix E).
In addition, as described in the previous section, a much higher percentage of the enrollees compared to nonenrollees receive personal care, home making services and Meals on Wheels. The pattern of a significantly greater use of such support services among enrollees compared to nonenrollees holds up in both the QMB-plus and standard QMB benefit states’ analyses (Table E-1 in Appendix E). While these differences could reflect differences in access to care or in help seeking behavior, at least some of the difference is likely to be rooted in underlying differences in health status.
2.4.3 Utilization of Medical Care and Prescription Drugs
Differences across groups in health care utilization could indicate differences in access to care across the groups or in underlying health status. Our findings in the preceding section suggest that enrollees are in poorer health than nonenrollees. We would expect physician
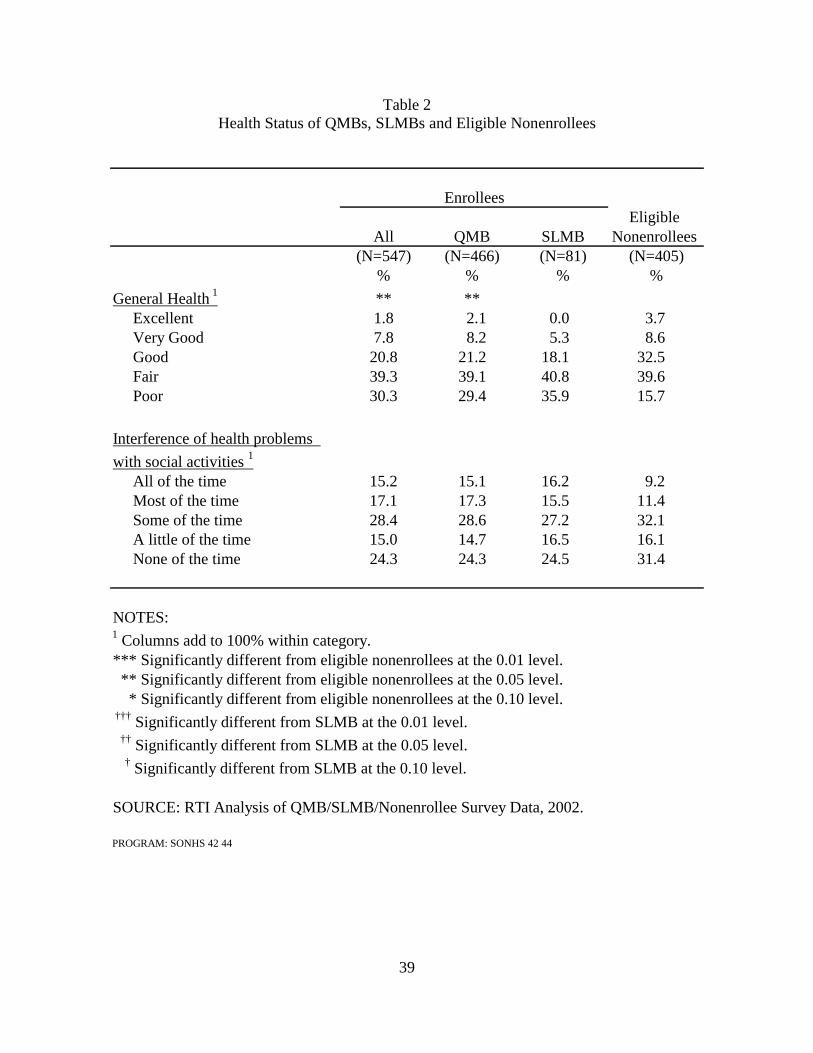
39
Table 2 Health Status of QMBs, SLMBs and Eligible Nonenrollees
Eligible All QMB SLMB Nonenrollees
(N=547) (N=466) (N=81) (N=405)% % % %
General Health 1 ** **Excellent 1.8 2.1 0.0 3.7 Very Good 7.8 8.2 5.3 8.6 Good 20.8 21.2 18.1 32.5 Fair 39.3 39.1 40.8 39.6 Poor 30.3 29.4 35.9 15.7
Interference of health problems
with social activities 1
All of the time 15.2 15.1 16.2 9.2 Most of the time 17.1 17.3 15.5 11.4 Some of the time 28.4 28.6 27.2 32.1 A little of the time 15.0 14.7 16.5 16.1 None of the time 24.3 24.3 24.5 31.4
NOTES:1 Columns add to 100% within category.*** Significantly different from eligible nonenrollees at the 0.01 level. ** Significantly different from eligible nonenrollees at the 0.05 level. * Significantly different from eligible nonenrollees at the 0.10 level. ††† Significantly different from SLMB at the 0.01 level. †† Significantly different from SLMB at the 0.05 level.
† Significantly different from SLMB at the 0.10 level.
SOURCE: RTI Analysis of QMB/SLMB/Nonenrollee Survey Data, 2002.
PROGRAM: SONHS 42 44
Enrollees
40
utilization to be higher for QMB-enrollees compared to nonenrollees, as they have no cost-sharing obligations serving as a barrier to utilization. Prescription drug utilization might also be higher for QMBs if it results from increased utilization of physician services, if they are sicker, or if the assistance with Medicare cost-sharing expenses makes it easier for them to purchase prescription drugs. In addition, enrollees in QMB-plus states receive at least some prescription drug coverage through their Medicaid benefits, and so we would expect utilization of prescription drugs to be higher for these beneficiaries. Our hypotheses about relative access for SLMBs and nonenrollees are less clear. While neither group receives assistance with copayments and deductibles, the SLMBs have higher incomes on average than the eligible nonenrollees, which includes a mix of people meeting the SLMB income eligibility criterion and the lower QMB income eligibility criterion. Similarly, it is not clear whether QMBs (who do not have to pay cost-sharing) or SLMBs (who have higher incomes) would have better access to care.
Nearly all enrollees and nonenrollees report having a usual source of care, and the vast majority sees physicians in either private offices, group practices, health centers or clinics (Table 3).24 However, there are significant differences in utilization patterns of enrollees and nonenrollees, with enrollees reporting more physician visits in the last three months. More than one-half of the enrollees visited their physician three or more times compared to only one-third of eligible nonenrollees. And while there were no differences between QMBs and SLMBs regarding the number of physician visits in the last three months, fewer QMBs report a usual source of care (88%) than do SLMBs (97%). In the subanalyses shown in Appendix E, the pattern is similar, but the differences between enrollees and nonenrollees are only significant in the standard QMB benefit states (Table E-3).
We also asked beneficiaries about their prescription drug use and found significant differences across all groups. Enrollees reported higher rates of prescription drug utilization compared to eligible nonenrollees. On average, enrollees took almost four medications each week while nonenrollees took three medications. Eleven percent of enrollees reported taking no prescription drugs at all, compared to 14% of the nonenrollees, and nearly one third of enrollees reported taking six or more prescription medications each week compared to only 14% of nonenrollees. Although there was no significant difference in the mean number of medications taken by QMBs in comparison to SLMB enrollees, there were significant differences in the distribution between QMB and SLMB enrollees with approximately 56% of SLMB enrollees taking five or more medications each week compared to 42% of QMB enrollees. Comparing enrollees and nonenrollees in the QMB-plus states and in the standard QMB benefit states reveals significantly higher prescription drug utilization among enrollees (see Table E-3 in Appendix E).
24 The impact of enrollment in the Medicare Savings Programs on service use, prescription drugs and out-of-pocket
costs are also discussed in Chapter 6.
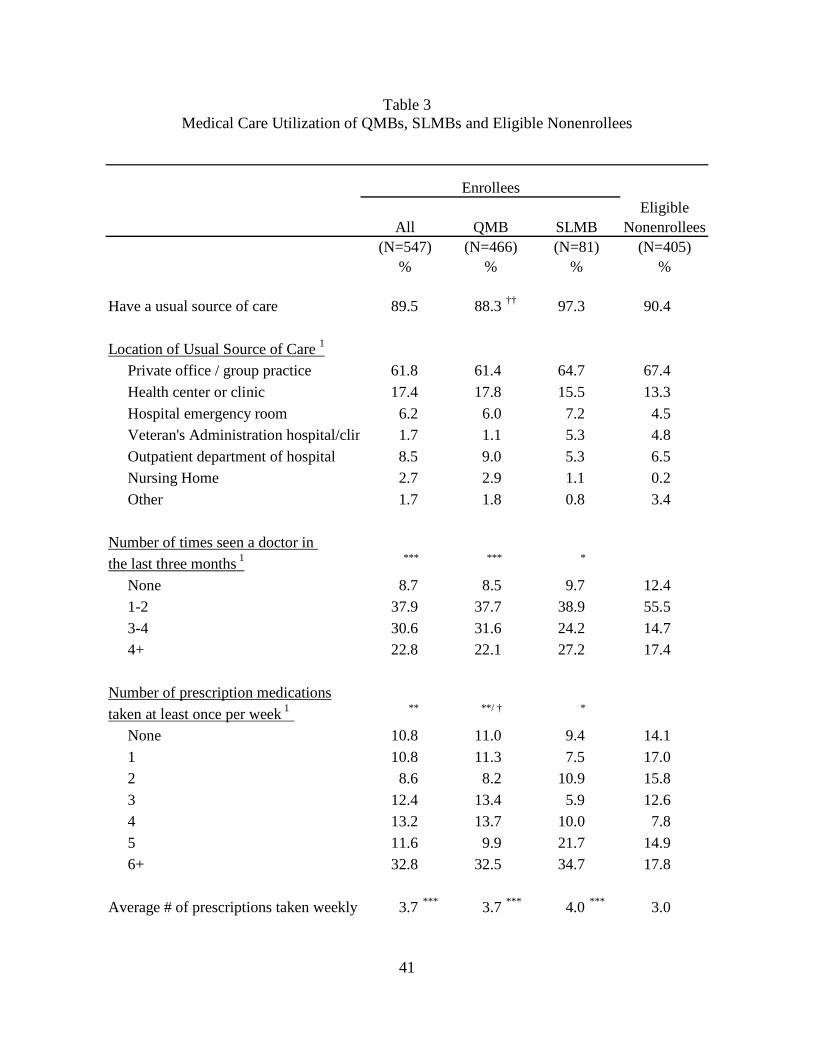
41
Table 3 Medical Care Utilization of QMBs, SLMBs and Eligible Nonenrollees
EligibleNonenrollees
(N=405)%
Have a usual source of care 89.5 88.3 †† 97.3 90.4
Location of Usual Source of Care 1
Private office / group practice 61.8 61.4 64.7 67.4 Health center or clinic 17.4 17.8 15.5 13.3 Hospital emergency room 6.2 6.0 7.2 4.5 Veteran's Administration hospital/clin 1.7 1.1 5.3 4.8 Outpatient department of hospital 8.5 9.0 5.3 6.5 Nursing Home 2.7 2.9 1.1 0.2 Other 1.7 1.8 0.8 3.4
Number of times seen a doctor in the last three months 1 *** *** *
None 8.7 8.5 9.7 12.4 1-2 37.9 37.7 38.9 55.5 3-4 30.6 31.6 24.2 14.7 4+ 22.8 22.1 27.2 17.4
Number of prescription medicationstaken at least once per week 1 ** **/ † *
None 10.8 11.0 9.4 14.1 1 10.8 11.3 7.5 17.0 2 8.6 8.2 10.9 15.8 3 12.4 13.4 5.9 12.6 4 13.2 13.7 10.0 7.8 5 11.6 9.9 21.7 14.9 6+ 32.8 32.5 34.7 17.8
Average # of prescriptions taken weekly 3.7 *** 3.7 *** 4.0 *** 3.0
% %%(N=547) (N=81)(N=466)
All SLMBQMB
Enrollees
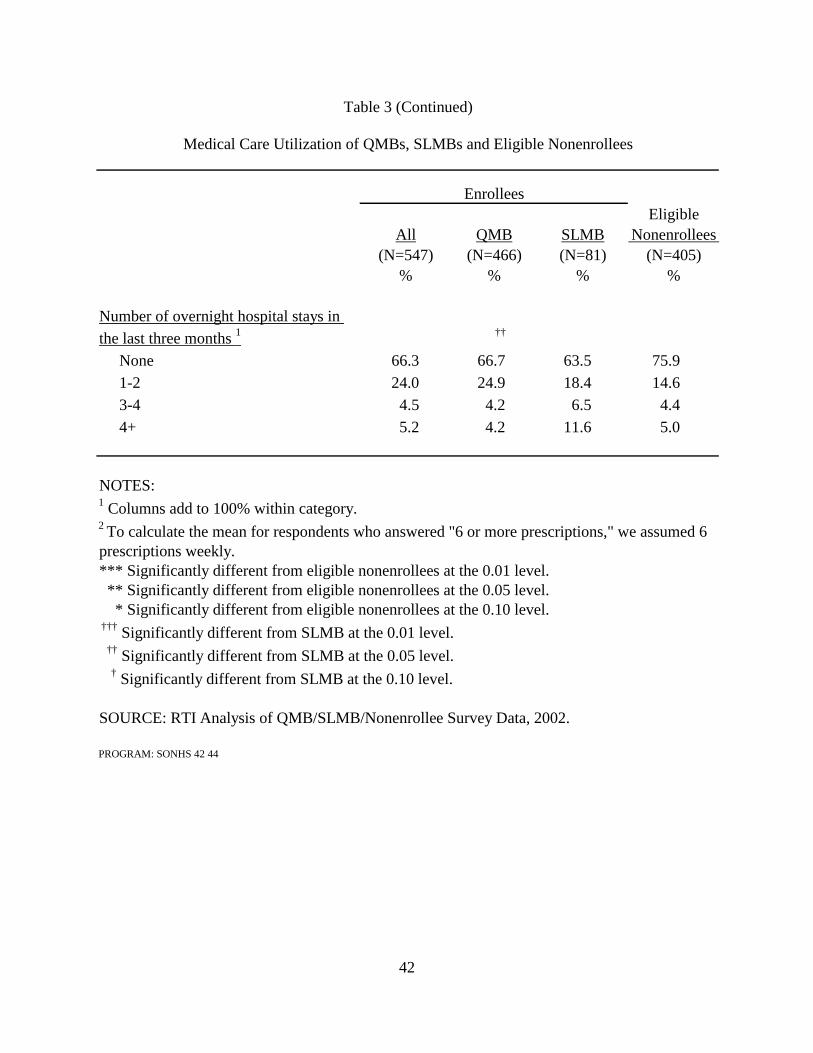
42
EligibleNonenrollees
(N=405)%
Number of overnight hospital stays in the last three months 1 ††
None 66.3 66.7 63.5 75.9 1-2 24.0 24.9 18.4 14.6 3-4 4.5 4.2 6.5 4.4 4+ 5.2 4.2 11.6 5.0
NOTES:1 Columns add to 100% within category.2 To calculate the mean for respondents who answered "6 or more prescriptions," we assumed 6 prescriptions weekly.*** Significantly different from eligible nonenrollees at the 0.01 level. ** Significantly different from eligible nonenrollees at the 0.05 level. * Significantly different from eligible nonenrollees at the 0.10 level. ††† Significantly different from SLMB at the 0.01 level. †† Significantly different from SLMB at the 0.05 level.
† Significantly different from SLMB at the 0.10 level.
SOURCE: RTI Analysis of QMB/SLMB/Nonenrollee Survey Data, 2002.
PROGRAM: SONHS 42 44
Enrollees
% % %
All QMB SLMB(N=547) (N=466) (N=81)
Table 3 (Continued)
Medical Care Utilization of QMBs, SLMBs and Eligible Nonenrollees

43
In comparison to outpatient care or prescription drug utilization, hospitalization is
generally less discretionary. As a result, any observed differences in hospitalization rates may reflect differences in underlying health status. There were no significant differences in hospitalization rates between enrollees as a whole and the nonenrollees, although SLMB enrollees reported significantly higher hospitalization rates compared to QMB enrollees. Overall, one-quarter to one-third of the sample reported at least one hospital stay in the three months prior to the survey. Given that less than one fifth of the Medicare population is hospitalized annually (CMS, http://cms.hhs.gov/mcbs/MCBSsrc/1998/98cbc3c.pdf), this finding corroborates the poor health status of this low-income population. As the Medicare deductible for hospitalization is steep, these hospitalizations also result in a substantial financial burden for the SLMBs and the eligible nonenrollees who remain responsible for such cost-sharing. There were no differences between enrollees and nonenrollees in QMB-plus and standard benefit states (Table E-3 in Appendix E).
2.4.4. Out-of-Pocket Expenditures
The key policy goal of the Medicare Savings Programs is to provide financial support to low-income Medicare beneficiaries with health-related costs. To evaluate the impact of these programs, we asked a series of questions about out-of-pocket expenditures and other measures of financial burden associated with health care costs. Indeed, the differences we observed between enrollees and nonenrollees demonstrate both the tremendous value of the Medicare Savings Programs to these beneficiaries, and the added value of the full Medicaid benefit, which includes prescription drug coverage, to QMBs residing in QMB-plus states.
We expect to observe lower out-of-pocket-costs for all enrollees compared to nonenrollees, and for QMBs residing in the QMB-Plus states relative to SLMBs and to QMBs residing in standard benefit states. In the QMB-Plus states, QMBs receive additional Medicaid covered services. In theory, all QMB enrollees might be expected to have lower out-of-pocket costs than either SLMBs or nonenrollees, as one of the intended benefits of QMB status is relief from Medicare copayments and deductibles, a benefit which is not extended to SLMBs. However, there is evidence that states do not consistently pay this cost-sharing for their dually eligible beneficiaries (Mitchell and Haber, 2003) and that providers sometimes charge these beneficiaries for Medicare copayments (Walsh and Clark, 2002). In addition, enrollees might experience higher out-of-pocket costs, associated with copayments and uncovered services, given their relatively poor health status and higher reported utilization.
In Table 4 we present findings regarding out-of-pocket expenditures and difficulty paying medical bills. About 85% of all respondents, enrollees and nonenrollees alike, report having medical bills not covered by Medicare which they either pay for themselves or receive help from their family or friends. However, despite indicators of poor health and higher utilization, the QMB enrollees appear to have significantly fewer out-of-pocket expenditures compared to SLMB enrollees and eligible nonenrollees. QMB enrollees pay significantly less in medical bills each month: 45% have no medical costs compared to 14% of SLMB enrollees and 11% of
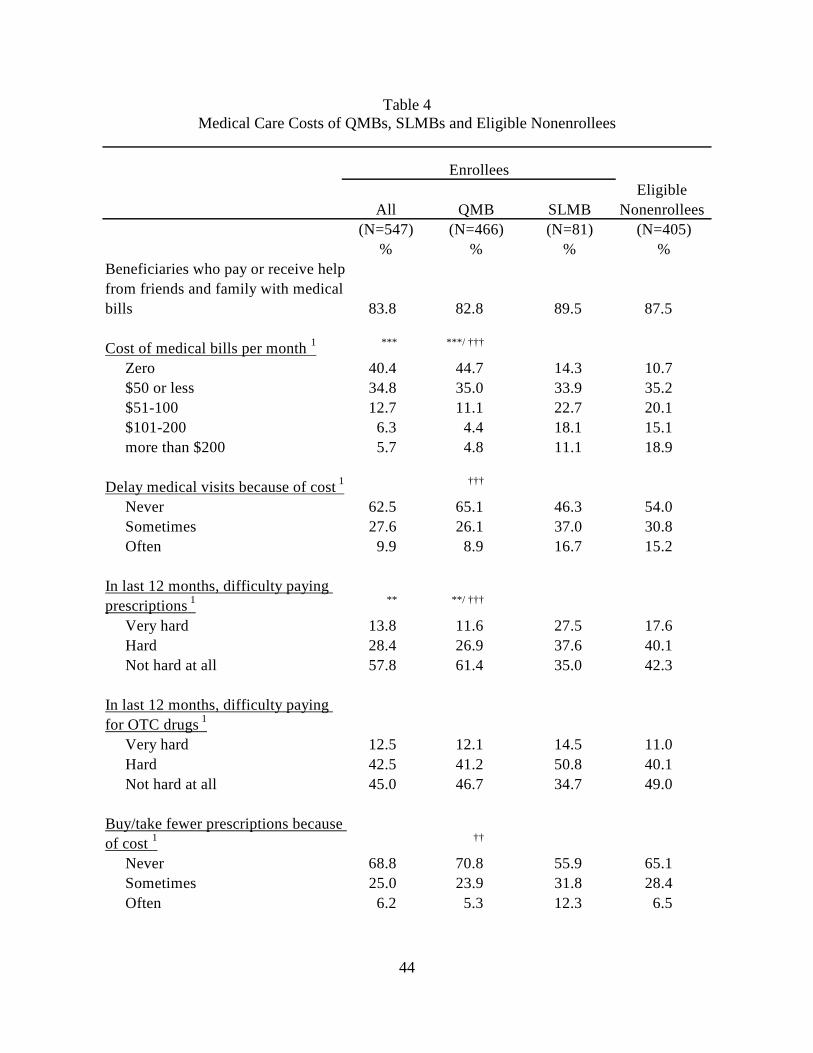
44
Table 4 Medical Care Costs of QMBs, SLMBs and Eligible Nonenrollees
Eligible Nonenrollees
(N=405)%
Beneficiaries who pay or receive helpfrom friends and family with medicalbills 83.8 82.8 89.5 87.5
Cost of medical bills per month 1 *** ***/ †††
Zero 40.4 44.7 14.3 10.7 $50 or less 34.8 35.0 33.9 35.2 $51-100 12.7 11.1 22.7 20.1 $101-200 6.3 4.4 18.1 15.1 more than $200 5.7 4.8 11.1 18.9
Delay medical visits because of cost 1 †††
Never 62.5 65.1 46.3 54.0 Sometimes 27.6 26.1 37.0 30.8 Often 9.9 8.9 16.7 15.2
In last 12 months, difficulty paying prescriptions 1 ** **/ †††
Very hard 13.8 11.6 27.5 17.6 Hard 28.4 26.9 37.6 40.1 Not hard at all 57.8 61.4 35.0 42.3
In last 12 months, difficulty paying for OTC drugs 1
Very hard 12.5 12.1 14.5 11.0 Hard 42.5 41.2 50.8 40.1 Not hard at all 45.0 46.7 34.7 49.0
Buy/take fewer prescriptions because of cost 1 ††
Never 68.8 70.8 55.9 65.1 Sometimes 25.0 23.9 31.8 28.4 Often 6.2 5.3 12.3 6.5
%
QMB(N=466)
All(N=547)
Enrollees
%
SLMB(N=81)
%

45
Eligible Nonenrollees
(N=405)%
Choose between paying for medicinesand paying other nonmedical bills 1 ††† ***
Never 57.9 60.3 43.4 59.2 Sometimes 31.0 31.0 31.1 31.5 Often 11.0 8.7 25.4 9.3
Importance of benefits 1
Very important 92.3 92.6 90.7 --Somewhat important 5.1 4.4 9.3 --Not at all important 2.6 3.0 0.0 --
NOTES:1 Columns add to 100% within category.*** Significantly different from eligible nonenrollees at the 0.01 level. ** Significantly different from eligible nonenrollees at the 0.05 level. * Significantly different from eligible nonenrollees at the 0.10 level. ††† Significantly different from SLMB at the 0.01 level. †† Significantly different from SLMB at the 0.05 level.
† Significantly different from SLMB at the 0.10 level.
SOURCE: RTI Analysis of QMB/SLMB/Nonenrollee Survey Data, 2002.
PROGRAM: SONHS 42 44
(N=547) (N=466) (N=81)% % %
Medical Care Costs of QMBs, SLMBs and Eligible Nonenrollees
All QMB SLMB
Enrollees
Table 4 (Continued)
46
eligible nonenrollees. In addition, only 9% of QMB enrollees pay more than $100 per month, while approximately 29% of SLMB enrollees and 34% of eligible nonenrollees pay more than $100 each month in medical bills. Although it is clear that, consistent with program benefits, the QMB enrollees have lower out-of-pocket expenditures than the SLMB enrollees and the nonenrollees, these findings show that over half of the QMBs still incur out-of-pocket costs for their medical care.
To evaluate the extent to which these findings are driven by the richer QMB benefit in QMB-plus states, we examined out-of-pocket costs separately in the QMB-plus and standard benefit states (Table E-4). Overall, the differences in out-of-pocket costs between enrollees and nonenrollees followed the same pattern regardless of whether the respondents resided in QMB-plus states or states offering the standard QMB benefit, i.e., enrollees in both QMB-plus and standard benefit states reported substantially lower out-of-pocket costs than did nonenrollees in these states.25 Forty-seven percent of enrollees in the QMB-plus states reported no medical bills each month, compared to 6% of the eligible nonenrollees in those states. Similarly, 43% of the enrollees in the standard-benefit states reported no medical bills compared to 11% of nonenrollees in those states. While only 7% of enrollees in the QMB-plus states and 15% of enrollees in the standard benefit states reported more than $100 per month in out-of-pocket expenditures, about one-third of nonenrollees reported this level of financial burden in both types of states.
We also asked beneficiaries a series of questions about their ability to pay for medical care, prescription drugs and over the counter medications. First, we asked whether they delay seeking medical care because of the costs. While a substantial proportion of enrollees and nonenrollees reported delays in seeking care due to costs, clearly QMBs less frequently face this issue than do SLMBs and nonenrollees (about a third of the QMB enrollees, more than one-half of the SLMB enrollees and almost half of the nonenrollees). Less than 10% of QMB enrollees often delay care compared to 17% of SLMB enrollees and 15% of eligible nonenrollees. When we compared enrollees to nonenrollees in QMB-plus versus standard benefit states, we observe the same patterns and no significant differences between enrollees and nonenrollees in either type of state.
We discussed this issue with the focus group participants. They reported delaying care not only due to the costs of seeing a doctor, but also because they believe doctors invariably will prescribe medication that they cannot afford. This is consistent with the survey findings reporting difficulty paying for prescription drugs. However, it is clear that the QMBs are much better off. Almost 39% of QMB enrollees, 65% of SLMB enrollees and nearly 60% of eligibles nonenrollees described it as “hard” or “very hard” to pay for prescription medications. In addition, almost 30% of QMB, 44% of SLMB, and 35% of the eligible nonenrollees reported using fewer medications than prescribed due to cost at least some of the time. In the focus groups, participants described going without prescribed medications or taking less than the prescribed amount due to cost. This included those who were enrolled in the state pharmacy assistance programs, as many of these programs only provide limited assistance with prescription drug costs. In addition, at least half of all respondents found it difficult to pay for over-the-counter drugs with no differences across the groups.
25 In these comparisons, separating enrollees and nonenrollees in the QMB-plus and standard benefit states, we
exclude the SLMB eligibles.
47
Once again, we analyzed differences between enrollees and nonenrollees residing in QMB-plus states and standard benefit states to determine to what extent the QMB findings regarding prescription medications was driven by the additional coverage enjoyed by enrollees in the QMB-plus states. As shown in Table E-4, in Appendix E, there were no significant differences in the degree of difficulty paying for prescription drugs between enrollees and nonenrollees residing in states offering the standard QMB benefit. However, in the QMB-plus states, which offer prescription drug coverage through the Medicaid benefit to their QMB enrollees, a much higher percentage of enrollees (69%) had no difficulty paying for their prescription drugs compared to only 41% of nonenrollees.26
We also asked beneficiaries how often they had to choose between paying for medicines and paying other bills, and found high rates of individuals having to make such trade-offs across the groups, with at least 40% in every group having to make this type of decision at least sometimes. SLMB enrollees were significantly more likely to have to choose between paying for medicines and paying for rent, groceries and other nonmedical bills compared to the QMB enrollees and eligible nonenrollees. More than one-quarter of SLMB enrollees described themselves as “often” having to choose, compared to 9% of the QMB enrollees and 9% of the eligible nonenrollees. Focus group participants indicated that they must budget carefully, often going without groceries and transportation. Nonenrollee focus group participants indicated that outstanding bills would be the first place they would apply any savings on their Medicare premiums if they enrolled in the Medicare Savings Programs. Given how difficult it is for enrollees to pay for medical and prescription costs, it is not surprising that over 90% of the enrollees (both QMBs and SLMBs) said that the Medicare Savings Programs benefits were very important to them.
2.4.5 Types of Supplemental Insurance Coverage
While QMBs in the states that provide full Medicaid benefits do receive prescription drug coverage under the Medicaid benefit, the other Medicare Savings Programs enrollees and nonenrollees do not. Given the recent debate over providing prescription drug benefits under Medicare, we were interested in learning to what extent these low-income beneficiaries have any type of public or private prescription drug coverage. We also wanted to evaluate potential crowd-out, i.e., to what extent enrollment in Medicare Savings Programs might replace privately purchased supplemental insurance, and the potential for crowd-out if prescription drug coverage were added to the Medicare benefit. Hence, we asked a series of questions about supplemental coverage. Because of the differing benefits offered in the QMB-plus versus standard benefit states, we compared enrollees to nonenrollees separately for these types of states.
Table 5 shows the results for the full sample, comparing all enrollees, QMBs, SLMBs and eligible nonenrollees regardless of whether they reside in a QMB-plus state or a standard benefit state. In Table E-5, we compare enrollees and eligible nonenrollees separately for QMB-plus states and standard benefit states. QMB enrollees are significantly more likely than eligible nonenrollees to report supplemental insurance coverage for prescriptions or to be enrolled in a
26 The one-third of enrollees in the QMB-plus states reporting difficulty paying for prescriptions could include
those who need medications that are either not covered at all by the Medicaid benefit in their states, or who face Medicaid cost-sharing requirements, or who live in a state that provides only a limited number of prescriptions covered each month.
48
state pharmacy program than either the SLMB enrollees or nonenrollees (Table 5). Nearly 60% of QMB enrollees reported some type of prescription drug coverage compared to 42% of eligible nonenrollees. Looking at types of coverage separately, we find 38% of QMB enrollees have supplemental insurance with prescription coverage compared to 21% of eligible nonenrollees and 22% of SLMB enrollees. About one-third of QMB enrollees and one-quarter of SLMB enrollees are enrolled in a state pharmacy program, compared to only 3% of eligible nonenrollees. On the other hand, eligible nonenrollees reported a significantly higher rate of prescription coverage through another insurance compared to QMB enrollees (25% versus 15%), and eligible nonenrollees have a substantially higher rate of supplemental insurance coverage that does not include prescription drug coverage compared to the QMB group (35% versus 21%). A small percent of beneficiaries (results not shown) reported having supplemental insurance in the past but dropped it, suggesting that the Medicare Savings Programs are not crowding out private insurance coverage.
Because the QMB enrollees in QMB-plus states receive prescription drug coverage through the Medicaid benefits, we expected to see different patterns of supplemental insurance coverage when we compared the enrollees to the nonenrollees in the QMB-plus and standard QMB benefit states separately. This is borne out by our analyses, indicating the importance of analyzing QMB-plus and standard benefit states separately, particularly with respect to prescription drug coverage. Within the QMB-plus states, 60% of enrollees reported prescription coverage, compared to 46% of nonenrollees. In the standard benefit states, 60% enrollees compared to 41% of nonenrollees had prescription drug coverage.27 However, a much higher proportion of enrollees in both groups of states participate in some type of state pharmacy assistance program compared to nonenrollees. In the standard benefit states, 34% of enrollees participate in a state pharmacy assistance program compared to only 1% of the eligible nonenrollees. In the QMB-plus states, 36% of enrollees compared to only 11% of nonenrollees participate in a state pharmacy assistance program.
In the focus groups, we learned that some beneficiaries choose to keep their supplemental insurance in addition to having QMB benefits. While this may seem duplicative and QMB enrollees are encouraged to drop their supplemental insurance if it does not include prescription drug coverage, many do not do so. They choose to keep it for security, as they fear that if they drop it, they will not have all the coverage they need or they will never get the policies back if they lose Medicaid.28 Sometimes having supplemental insurance deters beneficiaries from
27 It is not clear why only 60% of enrollees in the QMB-plus states reported prescription drug coverage. Perhaps
respondents differed in how they understood the question: some may have included their Medicaid benefits, while others may have assumed the question referred to private, supplemental insurance.
28 Some service providers indicated that they inform beneficiaries about the two-year freeze on Medicare supplemental policies. Beneficiaries are allowed to freeze their policies for two years. During that time, they do not pay a premium and do not receive benefits. At the end of two years, beneficiaries can either drop the coverage entirely or retain it.
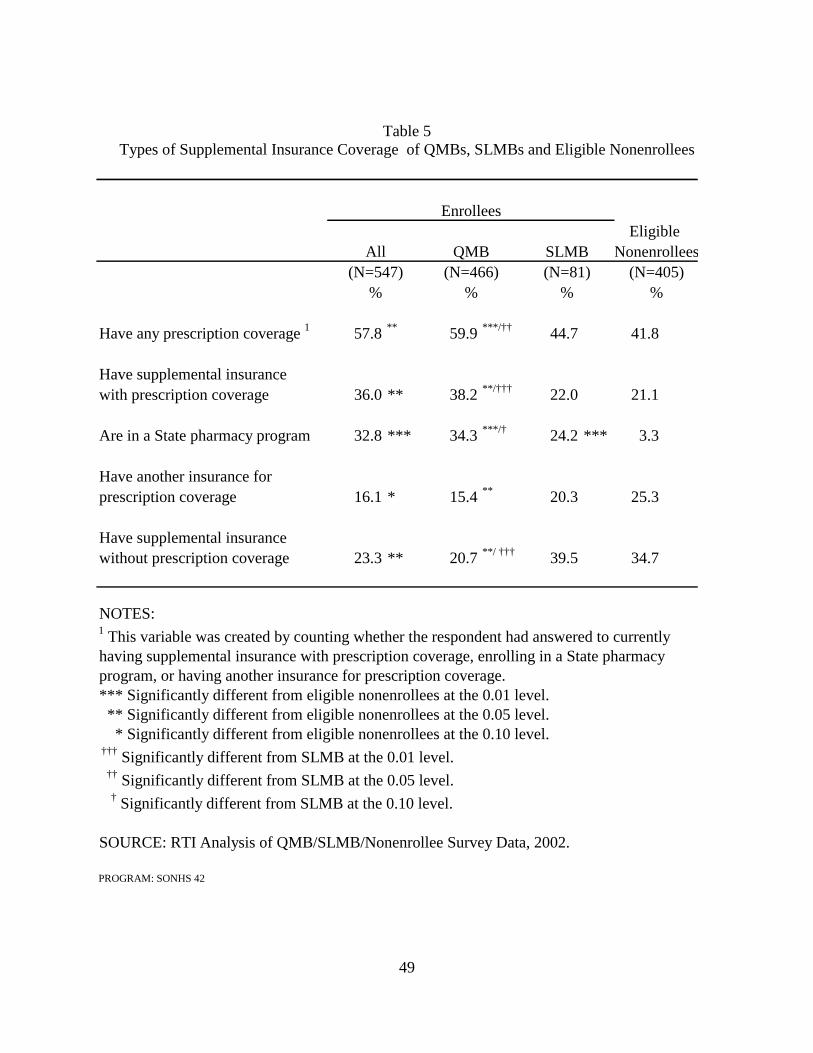
49
Table 5 Types of Supplemental Insurance Coverage of QMBs, SLMBs and Eligible Nonenrollees
Eligible Nonenrollees
(N=405)%
Have any prescription coverage 1 57.8 ** 59.9 ***/†† 44.7 41.8
Have supplemental insurancewith prescription coverage 36.0 ** 38.2 **/††† 22.0 21.1
Are in a State pharmacy program 32.8 *** 34.3 ***/† 24.2 *** 3.3
Have another insurance forprescription coverage 16.1 * 15.4 ** 20.3 25.3
Have supplemental insurancewithout prescription coverage 23.3 ** 20.7 **/ ††† 39.5 34.7
NOTES:1 This variable was created by counting whether the respondent had answered to currently having supplemental insurance with prescription coverage, enrolling in a State pharmacy program, or having another insurance for prescription coverage.*** Significantly different from eligible nonenrollees at the 0.01 level. ** Significantly different from eligible nonenrollees at the 0.05 level. * Significantly different from eligible nonenrollees at the 0.10 level. ††† Significantly different from SLMB at the 0.01 level. †† Significantly different from SLMB at the 0.05 level.
† Significantly different from SLMB at the 0.10 level.
SOURCE: RTI Analysis of QMB/SLMB/Nonenrollee Survey Data, 2002.
PROGRAM: SONHS 42
QMB SLMBAll
Enrollees
(N=547)% % %
(N=81)(N=466)
50
applying for the Medicare Savings Programs. Beneficiaries do not want to go through the Medicare Savings Programs application process for programs that provide fewer benefits than what they already have with the supplemental policies. Further, some beneficiaries believe that they should have supplemental insurance because their parents or their spouse had it.
2.4.6 Learning About the QMB and SLMB Programs
We asked both enrollees and nonenrollees whether they had heard of the Medicare Savings Programs, and how they had learned about them. About 25% of the enrollees and 70% of the nonenrollees had never heard about the Medicare Savings Programs (Table 6). That a quarter of enrollees have never heard of the programs is not surprising as many beneficiaries do not know the names of the programs that they are in, from which agency they receive benefits or the types of benefits they receive. Significantly more enrollees had heard about the Medicare Savings Programs than nonenrollees (76% compared to 29%); 75% of QMB beneficiaries had heard about the programs and nearly 80% of SLMB enrollees. The patterns are similar in the subanalyses: more than twice as many enrollees have heard of the programs compared to nonenrollees regardless of whether they reside in a QMB-plus or standard QMB benefit state (see Table E-6 in Appendix E).
We asked both enrollees and eligible nonenrollees how they learned about the programs. Of beneficiaries who have heard of the programs, the responses clearly show that personal contact and personal communication are highly correlated with beneficiaries learning about, and eventually enrolling in, the programs. Our results further indicate that advertisements about the programs through broadcast media or printed materials alone are not as effective as personal communications in educating beneficiaries about the programs, although they were the most common way eligible nonenrollees heard about them. Enrollees much more often reported learning about the programs from social workers and health care professionals than did eligible nonenrollees (50% compared to 10%). Significantly more enrollees learned about the Medicare Savings Programs through a visit to an agency compared to nonenrollees (40% of QMBs and 36% of SLMBs versus 17% of nonenrollees). A higher percentage of nonenrollees heard about the Medicare Savings Programs through printed materials, advertisements on radios and television compared to enrollees. Overall, less than 10% of enrollees and nonenrollees learned about the Medicare Savings Programs through presentations and talks. This finding is consistent with the relatively low rate of attendance at community and senior centers, reported in Table 1. Except for the percent reporting printed materials, there were no significant differences between the QMBs and SLMBs.
The subanalyses comparing enrollees and nonenrollees in QMB-plus versus standard QMB benefit states separately generally follow the same overall pattern (Table E-6). However, in the QMB-plus states there was no difference in the proportion of enrollees and nonenrollees who had heard of the Medicare Savings Programs through printed materials, while twice as many nonenrollees had heard of the programs this way as enrollees in the standard QMB benefit states. Nonenrollees in standard benefit states were also more than twice as likely to have heard about the programs through the radio and television. In addition, almost 20% of the nonenrollees in the QMB-plus states had heard about the Medicare Savings Programs at a presentation or talk, compared to only 4% of the enrollees in those states.
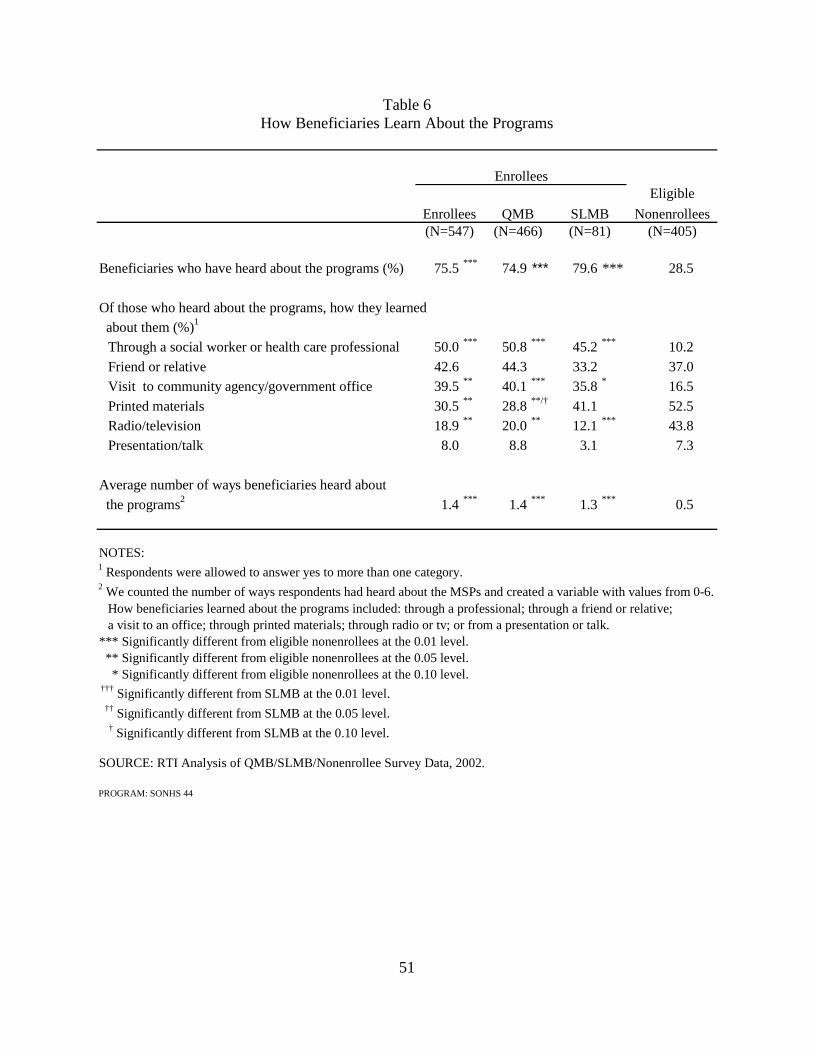
51
Table 6 How Beneficiaries Learn About the Programs
Eligible
Nonenrollees(N=405)
Beneficiaries who have heard about the programs (%) 75.5 *** 74.9 *** 79.6 *** 28.5
Of those who heard about the programs, how they learned about them (%)1
Through a social worker or health care professional 50.0 *** 50.8 *** 45.2 *** 10.2
Friend or relative 42.6 44.3 33.2 37.0 Visit to community agency/government office 39.5 ** 40.1 *** 35.8 * 16.5
Printed materials 30.5 ** 28.8 **/† 41.1 52.5 Radio/television 18.9 ** 20.0 ** 12.1 *** 43.8 Presentation/talk 8.0 8.8 3.1 7.3
Average number of ways beneficiaries heard about
the programs2 1.4 *** 1.4 *** 1.3 *** 0.5
NOTES:1 Respondents were allowed to answer yes to more than one category.2 We counted the number of ways respondents had heard about the MSPs and created a variable with values from 0-6.
How beneficiaries learned about the programs included: through a professional; through a friend or relative; a visit to an office; through printed materials; through radio or tv; or from a presentation or talk.
*** Significantly different from eligible nonenrollees at the 0.01 level. ** Significantly different from eligible nonenrollees at the 0.05 level. * Significantly different from eligible nonenrollees at the 0.10 level. ††† Significantly different from SLMB at the 0.01 level. †† Significantly different from SLMB at the 0.05 level.
† Significantly different from SLMB at the 0.10 level.
SOURCE: RTI Analysis of QMB/SLMB/Nonenrollee Survey Data, 2002.
PROGRAM: SONHS 44
Enrollees (N=547)
QMB(N=466)
SLMB(N=81)
Enrollees
52
We also created a count of the various ways beneficiaries may have learned about the Medicare Savings Programs, and found that on average, enrollees heard about these programs in more ways than nonenrollees did. QMB and SLMB enrollees heard about the programs in more than one way (1.4, 1.3, respectively), while nonenrollees heard about them in less than one way (0.5), on average. The pattern is the same in the subanalyses comparing QMB-plus state enrollees to nonenrollees and standard QMB benefit state enrollees and nonenrollees. Advocates suggest that beneficiaries may need to hear about the programs several times before they can understand the benefits and make a decision on whether to apply. In addition, they may have to learn about it in a number of different ways.
2.4.7 Why Beneficiaries Enroll in the Programs
We asked enrollees about whether there was an event that caused them to enroll in the QMB and SLMB programs and other possible motivations for enrollment (Table 7).29 There were no significant differences between the responses of the QMB and SLMB respondents. For both groups, the most common precipitating event was hospitalization (~38%) followed by a change in family situation (e.g., marriage, widowhood). Approximately 17% of enrollees responded that their move to subsidized housing led them to enroll in the programs. During our focus groups we learned that the service coordinators at senior housing frequently educate residents about the Medicare Savings Programs and assist them with enrolling. This reinforces the finding that enrollment is supported by personal assistance in learning about and applying for these programs. Based on discussions in the preliminary focus groups, and the high rate of Medicare managed care withdrawals, we also included a question asking whether the loss of Medicare managed care options led to Medicare Savings Programs enrollment. As seen in the table, 5% of enrollees did enroll in response to Medicare+Choice withdrawals. Five percent or less of the enrollees cited each of a variety other reasons leading them to enroll, including: turning 65, needing the financial assistance (particularly for the treatment of medical conditions), entering a nursing home and friends and family advising them to.
Beneficiaries enroll in the programs for a variety of reasons that can be divided into two categories: financial assistance and personal recommendation or encouragement. The vast majority (84%) of enrollees enrolled in the QMB or SLMB programs to receive assistance in paying for their medical bills, while nearly 40% indicated that they enrolled for the extra income. Nearly two-thirds enrolled because their family encouraged it, while two-thirds also enrolled because their health care provider recommended it. And, many beneficiaries (71%) enrolled because they believed that they deserved the benefits, a description used by CMS in its outreach materials. The patterns are the same regardless of whether enrollees reside in QMB-plus states or standard QMB benefit states (see Table E-7 in Appendix E).
2.4.8 How Beneficiaries Apply for the Programs
The helping professional focus groups reported many challenges in the enrollment process itself, including the stigma of going to a local welfare office, problems getting to the offices to pick up applications or submit them, problems getting through to the local welfare
29 A complementary analysis on precipitating events using Medicare claims and eligibility data is presented in
Chapter 3.
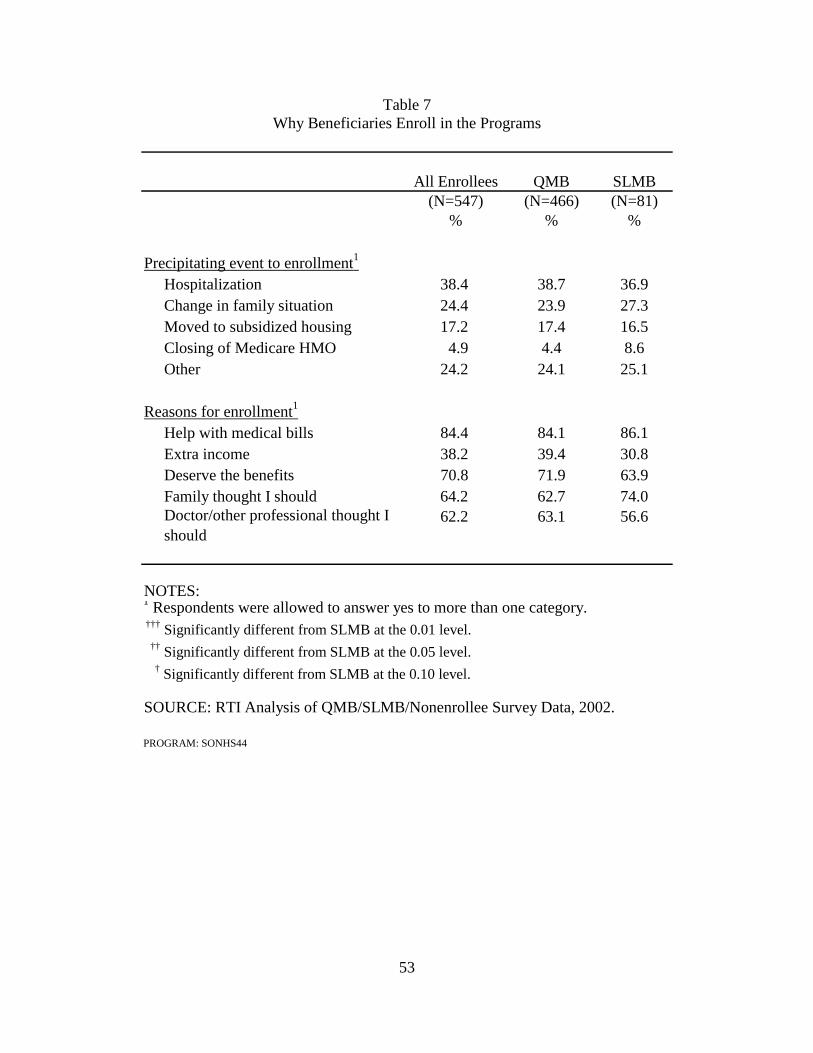
53
Table 7 Why Beneficiaries Enroll in the Programs
All Enrollees QMB SLMB(N=547) (N=466) (N=81)
% % %
Precipitating event to enrollment1
Hospitalization 38.4 38.7 36.9Change in family situation 24.4 23.9 27.3Moved to subsidized housing 17.2 17.4 16.5Closing of Medicare HMO 4.9 4.4 8.6Other 24.2 24.1 25.1
Reasons for enrollment1
Help with medical bills 84.4 84.1 86.1Extra income 38.2 39.4 30.8Deserve the benefits 70.8 71.9 63.9Family thought I should 64.2 62.7 74.0Doctor/other professional thought I should
62.2 63.1 56.6
NOTES:1 Respondents were allowed to answer yes to more than one category. ††† Significantly different from SLMB at the 0.01 level. †† Significantly different from SLMB at the 0.05 level.
† Significantly different from SLMB at the 0.10 level.
SOURCE: RTI Analysis of QMB/SLMB/Nonenrollee Survey Data, 2002.
PROGRAM: SONHS44
54
office by telephone, and challenges associated with the documentation required and the application form. They also reported problems regarding the responsiveness of case workers who process the applications due to case load size, state hiring freezes, and a lack of case workers specializing in these types of applications (rather than TANF or SSI). These focus group participants gave high marks to shortened application forms and systems that allow others to represent the applicant at the local welfare office. SHIP workers described serving as interim processors, i.e., reviewing applications for completeness, and holding off on submission until the beneficiaries had all the documentation to avoid the case being closed and having to start the application process over again. To learn more about the beneficiary experience and pathways to enrollment, we asked enrollees a series of questions about the enrollment process (Table 8).
Despite the difficulties we had heard about the ability and willingness of eligibles to go to the welfare offices to apply, one-quarter of the enrollees did receive their application in-person at a local, state or federal government office. Another 21% received the application in the mail. However, almost 30% received the applications in person from someone else, 23% from a social worker or case manager outside of the local welfare office, and 5% from friends or relatives. But, most did not know or remember how they got their applications (26%).
Perhaps the most important finding about the application experience is that two-thirds of enrollees received assistance in completing the application, although significantly more QMB enrollees received help than did SLMB enrollees. The majority reported receiving help from their friends or family (62%). Many had assistance from social workers and case managers (48%) while almost 40% had assistance from the office where they received the application. These findings further underscore the importance of personal contact and communication in learning about and applying for these programs.
When we asked enrollees how they submitted their applications, slightly more than one-third reported that they did not know or did not remember. A third of the enrollees did not recall who had submitted their applications, about one fifth had submitted the applications in-person, another fifth had mailed in their applications, and over a quarter reported a social worker, case manager or other professional had submitted it for them. In the beneficiary focus groups, we heard from many beneficiaries that they did not know how they got enrolled in the programs. Many indicated that they were enrolled somehow during their hospitalization. We presume this is the work of hospital discharge planners, or perhaps of social service professionals providing follow-up care in the community. However, hospital discharge planners in our focus groups did not consistently know about or focus on accessing QMB or SLMB coverage for their patients. This was primarily because their focus is on identifying resources needed to discharge patients efficiently, and while full Medicaid benefits are important to ensure access to nursing facility care, Medicare Savings Programs enrollment does not facilitate access to discharge destinations. In addition, it is not clear that there is any direct incentive to a hospital to facilitate enrollment. While the QMB program covers hospital copayments and deductibles, QMB status does not take effect until the first of the month following approval, and SLMB enrollment does not cover this type of cost-sharing at all.
Although the vast majority did not find the application hard to complete (perhaps due to assistance they received), 12% did find the application process difficult. About a third of respondents found the application too long, slightly fewer reported they had difficulty
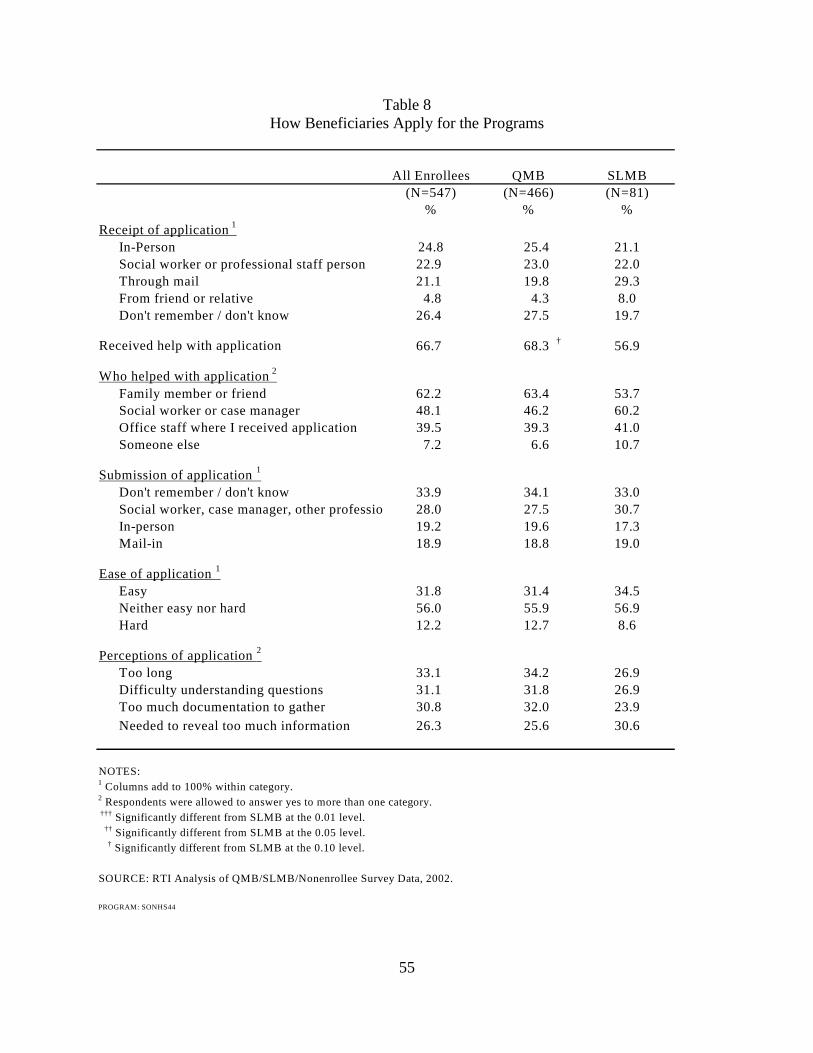
55
Table 8 How Beneficiaries Apply for the Programs
All Enrollees SLMB(N=547) (N=81)
% %
Receipt of application 1
In-Person 24.8 25.4 21.1Social worker or professional staff person 22.9 23.0 22.0Through mail 21.1 19.8 29.3From friend or relative 4.8 4.3 8.0Don't remember / don't know 26.4 27.5 19.7
Received help with application 66.7 68.3 † 56.9
Who helped with application 2
Family member or friend 62.2 63.4 53.7Social worker or case manager 48.1 46.2 60.2Office staff where I received application 39.5 39.3 41.0Someone else 7.2 6.6 10.7
Submission of application 1
Don't remember / don't know 33.9 34.1 33.0Social worker, case manager, other professio 28.0 27.5 30.7In-person 19.2 19.6 17.3Mail-in 18.9 18.8 19.0
Ease of application 1
Easy 31.8 31.4 34.5Neither easy nor hard 56.0 55.9 56.9Hard 12.2 12.7 8.6
Perceptions of application 2
Too long 33.1 34.2 26.9Difficulty understanding questions 31.1 31.8 26.9Too much documentation to gather 30.8 32.0 23.9Needed to reveal too much information 26.3 25.6 30.6
NOTES:1 Columns add to 100% within category.2 Respondents were allowed to answer yes to more than one category. ††† Significantly different from SLMB at the 0.01 level. †† Significantly different from SLMB at the 0.05 level. † Significantly different from SLMB at the 0.10 level.
SOURCE: RTI Analysis of QMB/SLMB/Nonenrollee Survey Data, 2002.
PROGRAM: SONHS44
%
QMB(N=466)
56
understanding questions on the application, objected to the amount of documentation required or felt the application required them to reveal too much personal information.
When we analyzed these variables separately for enrollees in QMB-plus and standard QMB benefit states, the patterns for every variable is similar to those for the sample overall. There are no significant differences between the two with the exception that more QMBs in QMB-plus states did not remember or did not know how they submitted the application compared to QMBs in standard benefit states (see Table E-8 in Appendix E).
The SHIP workers and other helping professionals in the focus groups also identified the importance of advocacy and assistance with the application process. They described difficulties getting through to understaffed welfare offices and of receiving correct information from them, and the challenges faced by illiterate, physically or cognitively impaired individuals trying to apply for these benefits, even with shortened application forms. In addition, the SHIP workers in some states indicated that time limits for submitting all of the documentation sometimes resulted in a case being closed while beneficiaries were still trying to comply. While SHIP workers have developed strategies for handling this type of problem (i.e., compiling all of the materials themselves prior to submission), individuals and families trying to apply on their own do not have the benefit of prior experience with the process.
Although we did not ask beneficiaries about the recertification process on the surveys, we learned from the focus groups that this was a principle reason why beneficiaries lose their QMB and SLMB benefits, as their income and assets do not often change. Annual recertification is a common requirement across states. Advocates report that having to reapply annually, having to reapply in person and having to redocument asset information are barriers to recertification. In addition, beneficiaries may not receive the letter notifying them that they have to recertify because they may be in the hospital or traveling. Therefore, their benefits are automatically terminated. Because it takes several months for the disenrollment to reach the Social Security Administration, premiums for these months are deducted in one lump sum from the beneficiaries’ checks. Beneficiaries sometimes learn that their benefits have been terminated only when they see a large deduction in their Social Security check to cover the Part B premium for several months at once.
2.4.9 Why Eligible Nonenrollees Do Not Enroll in the Programs
Another goal of the survey and focus groups was to learn why eligible beneficiaries do not take advantage of these programs. In Table 9 we present the reasons reported in the survey in two ways. The first column includes responses from all nonenrollees. In column two we include only those nonenrollees who had heard of the program (N=78). Because multiple responses were allowed, the percentage in the table do not sum to 100 within each column.
The main reason why eligible nonenrollees do not enroll in the QMB and SLMB programs is because they do not know the programs exist – 79% indicate that they have never heard of the programs. This is followed by a large percentage of eligible nonenrollees who do not know how to apply for the programs (68%). Eighteen percent are waiting to hear whether their application has been approved and 19% are concerned about estate recovery. In some of
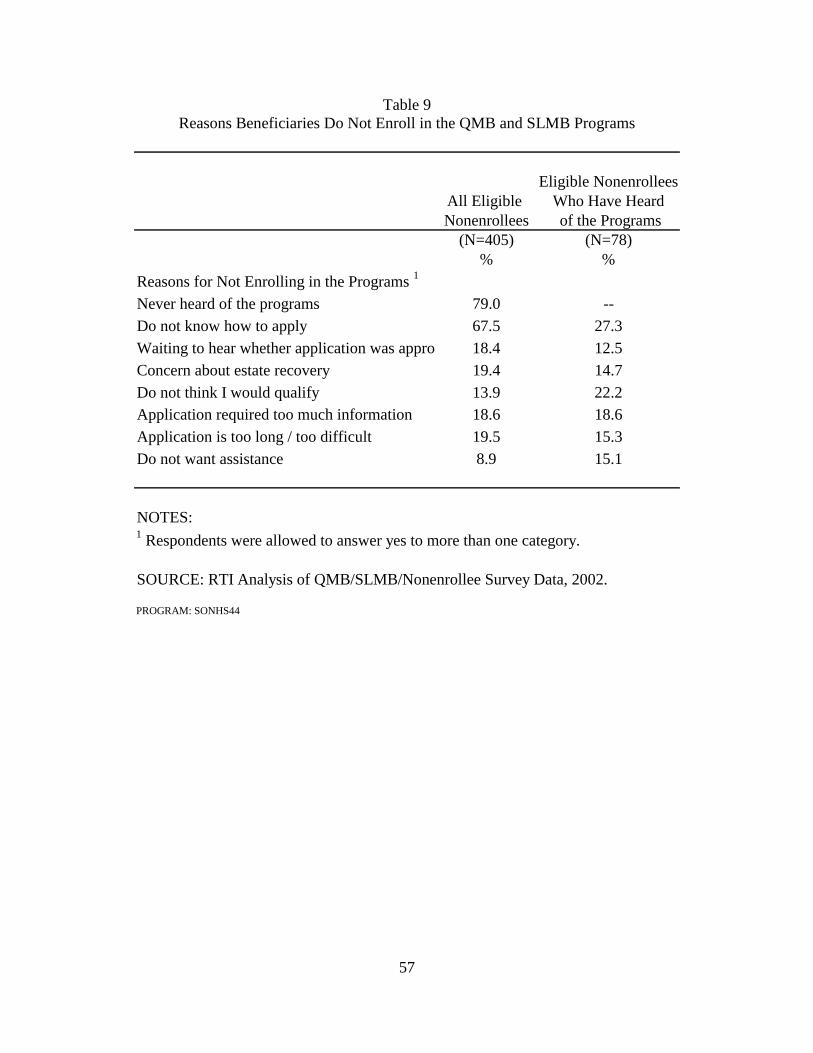
57
Table 9 Reasons Beneficiaries Do Not Enroll in the QMB and SLMB Programs
Eligible NonenrolleesAll Eligible Who Have HeardNonenrollees of the Programs
(N=405) (N=78)% %
Reasons for Not Enrolling in the Programs 1
Never heard of the programs 79.0 --Do not know how to apply 67.5 27.3Waiting to hear whether application was appro 18.4 12.5Concern about estate recovery 19.4 14.7Do not think I would qualify 13.9 22.2Application required too much information 18.6 18.6Application is too long / too difficult 19.5 15.3Do not want assistance 8.9 15.1
NOTES:1 Respondents were allowed to answer yes to more than one category.
SOURCE: RTI Analysis of QMB/SLMB/Nonenrollee Survey Data, 2002.
PROGRAM: SONHS44
58
our focus groups, even beneficiaries enrolled in pharmacy assistance programs did not know about the Medicare Savings Programs.
Of eligible nonenrollees who have heard of the programs, 13% are waiting to hear whether their application has been approved, while almost 27% do not know how to apply for the programs. Twenty-two percent believe that they would not qualify for the programs. More than 15% believe that the application is too bothersome and requires too much personal information. Although pride has been identified as an obstacle in the past, only 15% of the respondents indicated that they did not want any assistance. The patterns were generally similar in the QMB-plus states compared to the standard QMB benefit states (see Table E-9 in Appendix E); however, significantly fewer nonenrollees in standard benefit states reported the application required too much personal information and significantly more did not want the assistance compared to nonenrollees in QMB-plus states.
The focus group participants spoke about personal barriers to enrolling as well. Although only a small percentage of survey respondents identified welfare stigma as a barrier to enrollment, some focus group members identified this as a significant issue. Some beneficiaries cannot overcome the welfare stigma associated with Medicaid. They feel ashamed of or embarrassed about having to ask for assistance, as many had worked their entire lives. Many lived through the Depression and some reported that they would rather do without than seek assistance. Others do not know how to get help, as they are unfamiliar with the social welfare system. Physical impairments, such as vision problems, and illiteracy prevent beneficiaries from applying as well. Although many enrolled with assistance from service coordinators in their housing developments, some beneficiaries who receive rent subsidies are reluctant to apply because the Medicare premium assistance is counted as income and the added income may result in rent increases. Many would prefer to pay the premium instead of facing a rent increase even if they would have a net savings.
During the focus groups we also heard that some beneficiaries do not purchase Medicare Part B at their initial Medicare enrollment because they cannot afford the premiums. However, beneficiaries cannot apply for QMB or SLMB benefits unless they already are enrolled in Part B. Advocates try to encourage beneficiaries to enroll in Part B because they believe that people who cannot afford Part B are likely eligible for QMB or SLMB benefits.
2.4.10 Distribution of Survey Respondents across State Medicare Savings Program Characteristics
Analyses of the beneficiary surveys identify the impact of specific outreach activities, individual motivations, and predisposing factors on enrollment. To some extent, enrollment might also be a function of specific aspects of the QMB benefit or state operations. For example, beneficiaries may be more likely to apply for benefits in a state that offers the full Medicaid benefit to QMB enrollees, or that has liberalized asset criteria or permits self-declaration of income and assets. We examined the relationship between these factors in the state outreach analysis using the state as the unit of analysis (see Chapter 5) but in this section we were able to link these state characteristics to each individual survey respondent and examine the impact on enrollment, holding constant differences in individual beneficiary characteristics. The factors we selected from the state outreach survey were chosen based on information provided by the focus group participants.
59
We selected the outreach data for 2000, as the survey sample was drawn in the second quarter of 2001 and was fielded between July 2001 and January 2002. We hypothesized the relevant state outreach efforts were those implemented in the previous year. The variables we appended were: whether the state had a shortened Medicare Savings Programs application form; whether the state had trained outreach workers to educate beneficiaries about the Medicare Savings Programs; whether the state had liberalized assets; whether the state allows self-declaration of assets; and whether the state automatically screens for QMB/SLMB benefits when beneficiaries apply for other programs.
We present basic descriptive information about these program characteristics across the 41 study states in Table 10A, and then associate these characteristics with the individual enrollees and eligible nonenrollees who responded to the survey in Table 10B. Table 10A displays the percentage of states represented in our survey with each of the various program characteristics related to the Medicare Savings Programs. Sixty-seven percent of states have shortened their Medicare Savings Programs applications, and 64% have trained outreach workers. Twenty-six percent of states have liberalized assets and 26% also allow self-declaration. Most states (74%) automatically screen beneficiaries for QMB and SLMB benefits when they apply for other programs.
Table 10B shows the percent of each respondent type living in a state employing a particular approach that might promote enrollment in the Medicare Savings Programs. For example, 39% of all enrollees, 37% of QMBs and 47% of SLMBs live in one of the QMB-plus states in the sample, compared to only 23% of the eligible nonenrollees. This is consistent with our expectation that there is a greater incentive to apply in states providing full Medicaid benefits. The high proportion of SLMBs in QMB-plus states may be evidence of a spill-over effect to the SLMB program in these states, even though SLMBs do not receive Medicaid benefits in these states. It is likely that the possibility of receiving Medicaid benefits provides an incentive to more individuals to apply, some of whom are eventually determined to be SLMB eligible.
In contrast, some of the state characteristics are not associated with an increase in enrollment, or show inconsistent patterns across QMBs and SLMBs. In some cases, activities expected to increase enrollment are associated with a smaller proportion of enrollees compared to nonenrollees, indicating lower enrollment in states conducting these activities. This could result if the causal relationship between outreach activities and enrollment goes in the opposite direction, i.e., states undertake outreach efforts in response to low enrollment rates. The effectiveness of some outreach efforts may depend on the resources dedicated by each state to that activity. Because our data indicate only whether a state undertakes an activity, not the intensity of effort, we may not be able to accurately identify enrollment impacts. In addition, some activities may be implemented by so many states that it is not possible to observe differences in enrollment in relation to a given activity. For example, 82% of the QMB-plus states automatically screen for Medicare Savings Programs eligibility when beneficiaries apply for other programs.
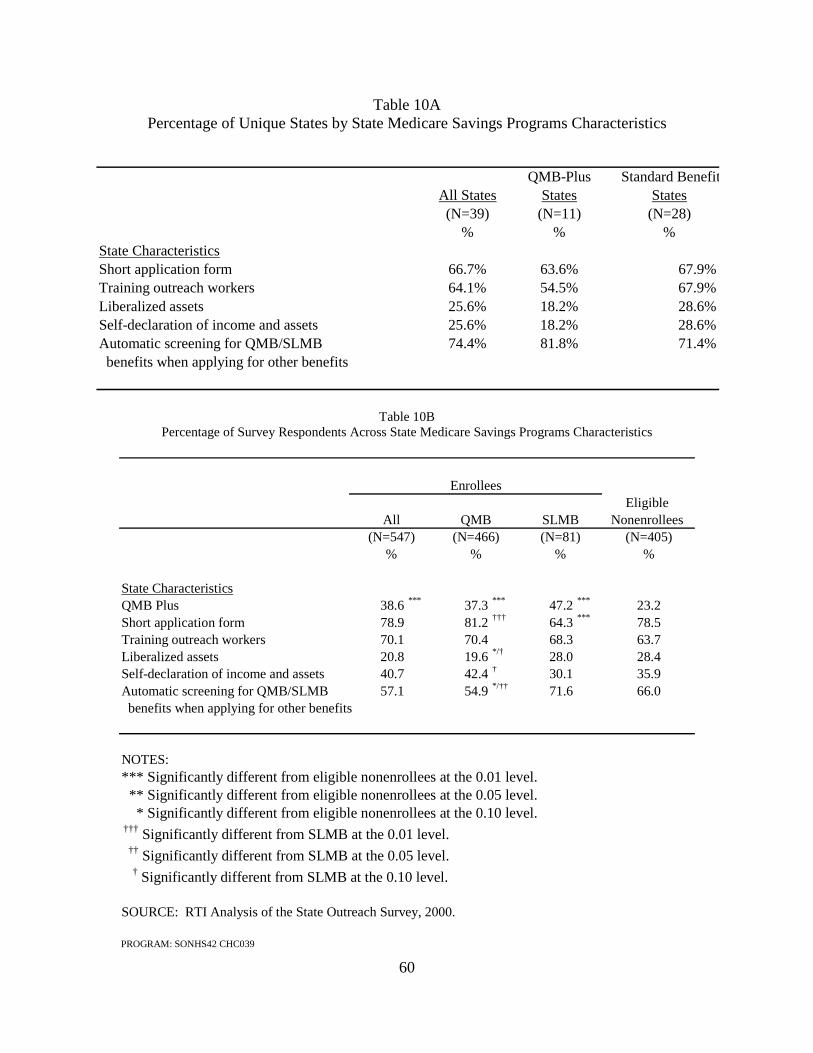
60
Table 10A Percentage of Unique States by State Medicare Savings Programs Characteristics
QMB-Plus Standard BenefitAll States States States(N=39) (N=11) (N=28)
% % %State CharacteristicsShort application form 66.7% 63.6% 67.9%Training outreach workers 64.1% 54.5% 67.9%Liberalized assets 25.6% 18.2% 28.6%Self-declaration of income and assets 25.6% 18.2% 28.6%Automatic screening for QMB/SLMB 74.4% 81.8% 71.4% benefits when applying for other benefits
Table 10B
Percentage of Survey Respondents Across State Medicare Savings Programs Characteristics
Eligible Nonenrollees
(N=405)%
State CharacteristicsQMB Plus 38.6 *** 37.3 *** 47.2 *** 23.2Short application form 78.9 81.2 ††† 64.3 *** 78.5Training outreach workers 70.1 70.4 68.3 63.7Liberalized assets 20.8 19.6 */† 28.0 28.4Self-declaration of income and assets 40.7 42.4 † 30.1 35.9Automatic screening for QMB/SLMB 57.1 54.9 */†† 71.6 66.0 benefits when applying for other benefits
NOTES:*** Significantly different from eligible nonenrollees at the 0.01 level. ** Significantly different from eligible nonenrollees at the 0.05 level. * Significantly different from eligible nonenrollees at the 0.10 level. ††† Significantly different from SLMB at the 0.01 level. †† Significantly different from SLMB at the 0.05 level.
† Significantly different from SLMB at the 0.10 level.
SOURCE: RTI Analysis of the State Outreach Survey, 2000.
PROGRAM: SONHS42 CHC039
(N=81)%
(N=547) (N=466)% %
All QMB
SLMB
Enrollees
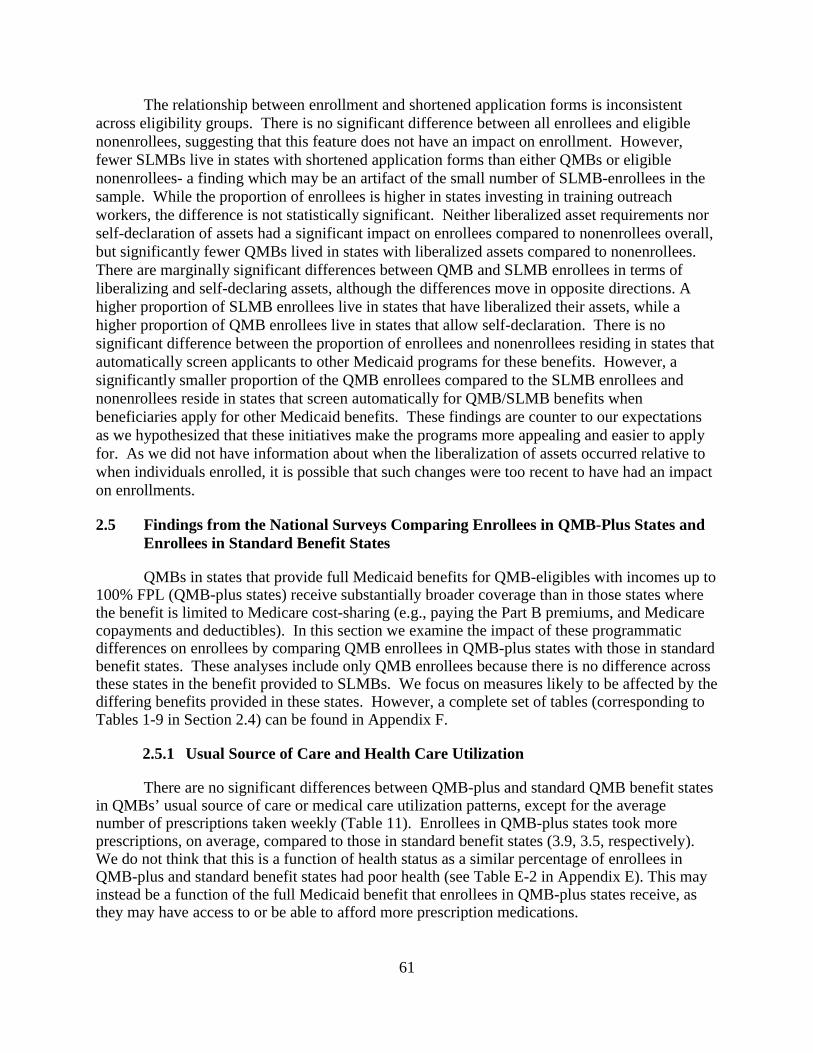
61
The relationship between enrollment and shortened application forms is inconsistent across eligibility groups. There is no significant difference between all enrollees and eligible nonenrollees, suggesting that this feature does not have an impact on enrollment. However, fewer SLMBs live in states with shortened application forms than either QMBs or eligible nonenrollees- a finding which may be an artifact of the small number of SLMB-enrollees in the sample. While the proportion of enrollees is higher in states investing in training outreach workers, the difference is not statistically significant. Neither liberalized asset requirements nor self-declaration of assets had a significant impact on enrollees compared to nonenrollees overall, but significantly fewer QMBs lived in states with liberalized assets compared to nonenrollees. There are marginally significant differences between QMB and SLMB enrollees in terms of liberalizing and self-declaring assets, although the differences move in opposite directions. A higher proportion of SLMB enrollees live in states that have liberalized their assets, while a higher proportion of QMB enrollees live in states that allow self-declaration. There is no significant difference between the proportion of enrollees and nonenrollees residing in states that automatically screen applicants to other Medicaid programs for these benefits. However, a significantly smaller proportion of the QMB enrollees compared to the SLMB enrollees and nonenrollees reside in states that screen automatically for QMB/SLMB benefits when beneficiaries apply for other Medicaid benefits. These findings are counter to our expectations as we hypothesized that these initiatives make the programs more appealing and easier to apply for. As we did not have information about when the liberalization of assets occurred relative to when individuals enrolled, it is possible that such changes were too recent to have had an impact on enrollments.
2.5 Findings from the National Surveys Comparing Enrollees in QMB-Plus States and Enrollees in Standard Benefit States
QMBs in states that provide full Medicaid benefits for QMB-eligibles with incomes up to 100% FPL (QMB-plus states) receive substantially broader coverage than in those states where the benefit is limited to Medicare cost-sharing (e.g., paying the Part B premiums, and Medicare copayments and deductibles). In this section we examine the impact of these programmatic differences on enrollees by comparing QMB enrollees in QMB-plus states with those in standard benefit states. These analyses include only QMB enrollees because there is no difference across these states in the benefit provided to SLMBs. We focus on measures likely to be affected by the differing benefits provided in these states. However, a complete set of tables (corresponding to Tables 1-9 in Section 2.4) can be found in Appendix F.
2.5.1 Usual Source of Care and Health Care Utilization
There are no significant differences between QMB-plus and standard QMB benefit states in QMBs’ usual source of care or medical care utilization patterns, except for the average number of prescriptions taken weekly (Table 11). Enrollees in QMB-plus states took more prescriptions, on average, compared to those in standard benefit states (3.9, 3.5, respectively). We do not think that this is a function of health status as a similar percentage of enrollees in QMB-plus and standard benefit states had poor health (see Table E-2 in Appendix E). This may instead be a function of the full Medicaid benefit that enrollees in QMB-plus states receive, as they may have access to or be able to afford more prescription medications.
62
Table 11 Medical Care Utilization of QMB Beneficiaries by State Benefit
QMB-Plus(N=239)
Have a usual source of care 89.6 87.6
Location of Usual Source of Care 1
Private office / group practice 60.9 61.6Health center or clinic 16.5 18.5Hospital emergency room 5.3 6.4Veteran's Administration hospital/clinic 1.6 0.9Outpatient department of hospital 9.8 8.5Nursing Home 4.4 2.1Other 1.5 2.0
Number of times seen a doctor in the last three months 1
None 9.3 8.11-2 38.5 37.33-4 31.4 31.84+ 20.9 22.9
Number of prescription medicationstaken at least once per week 1
None 5.6 14.21 10.1 12.02 10.7 6.83 13.0 13.74 15.6 12.65 11.1 9.26+ 34.0 31.6
Average # of prescriptions taken weekly 2 3.9 3.5 #
Number of overnight hospital stays in the last three months 1
None 64.0 68.31-2 25.9 24.43-4 5.5 3.44+ 4.6 4.0
NOTES:This analysis consists only of QMBs (SLMBs are excluded). 1 Columns add to 100% within category.2 To calculate the mean for respondents who answered "6 or more prescriptions," we assumed 6 prescriptions weekl# # # Significantly different from QMB-plus at the 0.01 level. # # Significantly different from QMB-plus at the 0.05 level. # Significantly different from QMB-plus at the 0.10 level.
SOURCE: RTI Analysis of QMB/SLMB/Nonenrollee Survey Data, 2002.
PROGRAM: SONHS45
Standard Benefit(N=227)
ENROLLEES
63
2.5.2 Medical Costs
Table 12 compares the medical costs of enrollees in QMB-plus and standard benefit states. We would expect that enrollees in QMB-plus states pay fewer medical bills than QMB enrollees in standard benefit states, because enrollees in QMB-plus states receive full Medicaid benefits. And in some instances, we do see significant differences confirming this hypothesis.
The results indicate that enrollees in standard benefit states have significant difficulty paying for prescription medications compared to enrollees in QMB-plus states. Forty-three percent of enrollees in standard benefit states find it hard or very hard to pay for prescriptions compared to 31% of enrollees in QMB-plus states. In addition, a significantly higher percentage enrollees in standard benefit states buy or take fewer medications because they cannot afford them. One-third of enrollees in standard benefit states have had to buy or take fewer medications compared to one-fifth of enrollees in QMB-plus states.
2.5.3 Types of Supplemental Insurance Coverage
We were interested in whether prescription drug and supplemental insurance coverage varied by enrollees in QMB-plus and standard benefit states (Table 13). We found no significant differences in prescription drug coverage among enrollees. The majority of enrollees had some type of prescription coverage, whether it was from supplemental insurance, a state pharmacy program or another type of insurance for prescription drug coverage. However, significantly more enrollees in standard benefit states had lower cost supplemental coverage that did not include prescription drug coverage (24% compared to 15%).
2.5.4 Learning About and Applying for the QMB Programs
A significantly higher percentage of QMBs in standard benefit states learned about the Medicare Savings Programs through a presentation or talk compared to QMBs in QMB-Plus states (Table E-6). Although there were no other significant differences in how QMBs learned about the programs, higher percentages of QMBs in standard benefit states learned about the programs through personal communications (e.g., social worker, friends, visits to government offices), while a higher percentage of QMBs in QMB-Plus states learned about them through printed materials or broadcast media. There were no significant differences in what led QMBs to enroll in the programs or why they enrolled (Table E-7). With one exception there were no significant differences in how enrollees apply for the programs (Table E-8). However, QMBs in QMB-Plus states were significantly more likely not to remember how they submitted the application compared to QMBs in standard benefit states.
2.6 Predictors of Enrollment: Results from the Logistic Regressions
To understand how the various factors interact to predict beneficiaries’ enrollment in the QMB and SLMB programs, we conducted multivariate analyses, using the beneficiary survey data and the additional variables from a survey of states regarding their Medicare Savings Programs eligibility rules and outreach activities. We ran three models that included respondents from all states in the survey, and two models that separately estimate enrollment in the QMB program for individuals residing in QMB-plus states versus standard QMB benefit states.

64
Table 12 Medical Care Costs of QMB Beneficiaries by State Benefit
QMB-Plus(N=239)
%Beneficiaries who pay or receive helpfrom friends and family with medicalbills 80.9 83.9
Cost of medical bills per month 1
Zero 46.9 43.4$50 or less 37.5 33.5$51-100 8.8 12.5$101-200 3.4 5.0more than $200 3.5 5.6
Delay medical visits because of cost 1
Never 65.0 65.1Sometimes 27.5 25.2Often 7.6 9.7
In last 12 months, difficulty paying prescriptions 1 # #
Very hard 7.2 14.2Hard 23.5 28.9Not hard at all 69.3 56.9
In last 12 months, difficulty paying for OTC drugs 1
Very hard 13.8 11.2Hard 40.4 41.7Not hard at all 45.9 47.1
Buy/take fewer prescriptions because of cost 1 # #
Never 78.6 66.1Sometimes 17.0 28.1Often 4.5 5.8
%
Standard Benefit(N=227)
ENROLLEES

65
QMB-Plus(N=239)
%
Choose between paying for medicines
and paying other nonmedical bills 1
Never 65.1 57.4Sometimes 25.9 34.0Often 9.0 8.6
Importance of benefits 1
Very important 94.3 91.6Somewhat important 4.0 4.7Not at all important 1.7 3.8
NOTES:This analysis consists only of QMBs (SLMBs are excluded). 1 Columns add to 100% within category.# # # Significantly different from QMB-plus at the 0.01 level. # # Significantly different from QMB-plus at the 0.05 level. # Significantly different from QMB-plus at the 0.10 level.
SOURCE: RTI Analysis of QMB/SLMB/Nonenrollee Survey Data, 2002.
PROGRAM: SONHS45
ENROLLEESStandard Benefit
Medical Care Costs of Beneficiaries by State BenefitTable 12 (Continued)
(N=227)%

66
Table 13 Types of Supplemental Insurance Coverage of QMB Beneficiaries by State Benefit
QMB-Plus(N=239)
%
Have any prescription coverage 1 60.3 59.6
Have supplemental insurance with prescription coverage 38.2 38.1
Are in a State pharmacy program 35.5 33.5
Have another insurance for
prescription coverage 19.8 12.9
Have supplemental insurance
without prescription coverage 15.4 23.7 #
NOTES: This analysis consists only of QMBs (SLMBs are excluded). 1 This variable was created by counting whether the respondent had answered to currently having supplemental insurance with prescription coverage, enrolling in a State pharmacy program, or having another insurance for prescription coverage.# # # Significantly different from QMB-plus at the 0.01 level. # # Significantly different from QMB-plus at the 0.05 level. # Significantly different from QMB-plus at the 0.10 level.
PROGRAM: SONHS45
Enrollees
(N=227)Standard Benefit
%
67
Dependent Variables - The dependent variable for each of the models is beneficiary enrollment. Models 1-3 (Table 14) predict enrollment in the full sample. Model 1 predicts enrollment in either program (QMB or SLMB). Model 2 predicts enrollment in the QMB program (excluding SLMB enrollees from the sample), while Model 3 predicts enrollment in the SLMB program (excluding QMB enrollees from the sample). Models 4 and 5 (Table 15) predict enrollment in the QMB programs for QMB-plus and standard benefit states, respectively, and the sample is restricted to QMBs and eligible nonenrollees. (The descriptives in Appendix F are restricted to QMBs.) Because these dependent variables are bivariate, we use logistic regression to estimate the models.
Independent Variables - We include several sociodemographic characteristics: gender (females are the reference group omitted), race and ethnicity (White beneficiaries are the reference group omitted) and age by categories (respondents age 65-69 are the reference group omitted). We include self-rated general health as a measure of health status, with respondents who report themselves either in excellent or very good health as the reference group. In addition we include receipt of any other community and government services (based on receipt of any of the following: personal care, homemaking, Meals on Wheels, transportation, food stamps or a rent subsidy). We include two measures of community ties separately: attendance at a community or senior center, and attendance at a place of worship. We exclude health care utilization and out-of-pocket expenditures, as these variables are not independent of enrollment.
We also include several variables from the 2000 State Outreach Survey in the regressions. These include whether the state utilizes a shortened application form for dual eligibles; trains outreach workers to educate and enroll beneficiaries in the programs; has liberalized its asset limits; allows beneficiaries to self-declare their assets on the applications; or automatically screens beneficiaries for the QMB and SLMB programs when they apply for other benefits. Each of these are hypothesized to have a positive effect on enrollment, all else equal, although in the descriptive analyses there were few differences across groups in these state variables. As many states employ multiple approaches, we evaluated the degree of correlation between these variables to avoid any problems due to collinearity. In the main analyses (Table 14) we also include whether the state offers full Medicaid benefits for beneficiaries with incomes up to 100% FPL, i.e. is a QMB-plus state.
Results - We present the odds ratios from the logistic regressions in Table 14 with a detailed discussion of the results below, and include results from Table 15 where the findings are noteworthy. In summary, a combination of personal and systems factors increased the likelihood of enrollment in Table 14: poor health, receipt of other types of assistance, living in a state with offering full Medicaid benefits for individuals with incomes up to 100% FPL, and living in a state permitting self-declaration of assets. Receipt of other types of assistance had the greatest impact on the likelihood of enrollment, increasing the likelihood 8-9 times. Due to the small number of SLMB enrollees, the findings in Model 3 should be interpreted cautiously. Restricting our analyses to the more robust Models 1 and 2, we also find the likelihood of enrollment increasing with female gender, identifying as Black or other race, and residing in a state investing in training outreach workers, while the likelihood of enrollment decreased with attending a place of worship or residing in a state automatically screening all Medicaid applications for QMB/SLMB eligibility.
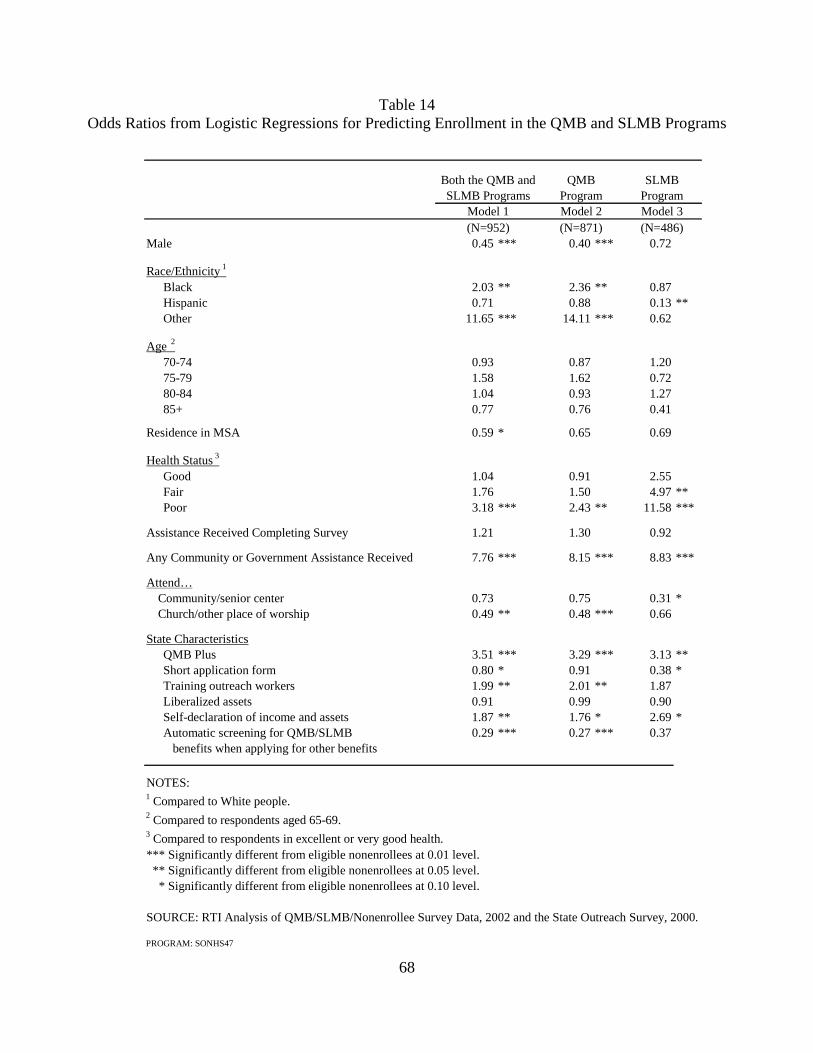
68
Table 14 Odds Ratios from Logistic Regressions for Predicting Enrollment in the QMB and SLMB Programs
Male 0.45 *** 0.40 *** 0.72
Race/Ethnicity 1
Black 2.03 ** 2.36 ** 0.87Hispanic 0.71 0.88 0.13 **Other 11.65 *** 14.11 *** 0.62
Age 2
70-74 0.93 0.87 1.2075-79 1.58 1.62 0.7280-84 1.04 0.93 1.2785+ 0.77 0.76 0.41
Residence in MSA 0.59 * 0.65 0.69
Health Status 3
Good 1.04 0.91 2.55Fair 1.76 1.50 4.97 **Poor 3.18 *** 2.43 ** 11.58 ***
Assistance Received Completing Survey 1.21 1.30 0.92
Any Community or Government Assistance Received 7.76 *** 8.15 *** 8.83 ***
Attend… Community/senior center 0.73 0.75 0.31 * Church/other place of worship 0.49 ** 0.48 *** 0.66
State CharacteristicsQMB Plus 3.51 *** 3.29 *** 3.13 **Short application form 0.80 * 0.91 0.38 *Training outreach workers 1.99 ** 2.01 ** 1.87Liberalized assets 0.91 0.99 0.90Self-declaration of income and assets 1.87 ** 1.76 * 2.69 *Automatic screening for QMB/SLMB 0.29 *** 0.27 *** 0.37 benefits when applying for other benefits
NOTES:1 Compared to White people.2 Compared to respondents aged 65-69.3 Compared to respondents in excellent or very good health.*** Significantly different from eligible nonenrollees at 0.01 level. ** Significantly different from eligible nonenrollees at 0.05 level. * Significantly different from eligible nonenrollees at 0.10 level.
SOURCE: RTI Analysis of QMB/SLMB/Nonenrollee Survey Data, 2002 and the State Outreach Survey, 2000.
PROGRAM: SONHS47
(N=486)(N=871)(N=952)Model 1 Model 2 Model 3
ProgramSLMB ProgramsQMB
ProgramBoth the QMB and SLMB
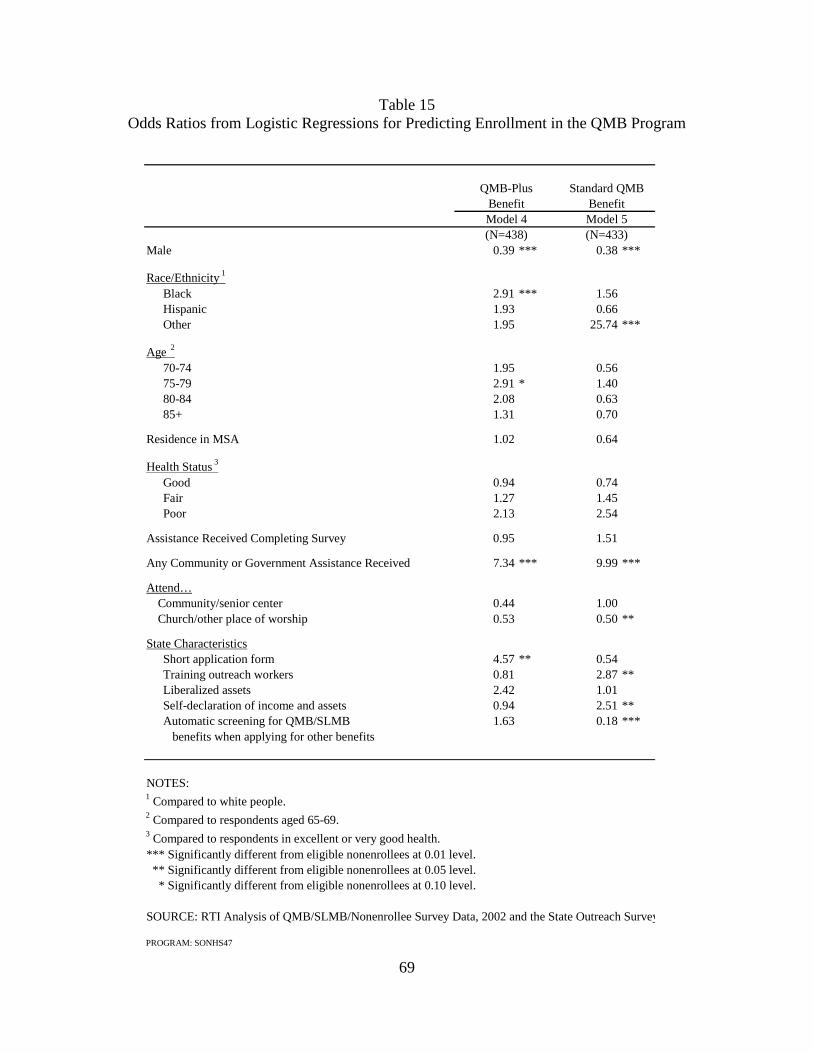
69
Table 15 Odds Ratios from Logistic Regressions for Predicting Enrollment in the QMB Program
Male 0.39 *** 0.38 ***
Race/Ethnicity 1
Black 2.91 *** 1.56Hispanic 1.93 0.66Other 1.95 25.74 ***
Age 2
70-74 1.95 0.5675-79 2.91 * 1.4080-84 2.08 0.6385+ 1.31 0.70
Residence in MSA 1.02 0.64
Health Status 3
Good 0.94 0.74Fair 1.27 1.45Poor 2.13 2.54
Assistance Received Completing Survey 0.95 1.51
Any Community or Government Assistance Received 7.34 *** 9.99 ***
Attend… Community/senior center 0.44 1.00 Church/other place of worship 0.53 0.50 **
State CharacteristicsShort application form 4.57 ** 0.54Training outreach workers 0.81 2.87 **Liberalized assets 2.42 1.01Self-declaration of income and assets 0.94 2.51 **Automatic screening for QMB/SLMB 1.63 0.18 *** benefits when applying for other benefits
NOTES:1 Compared to white people.2 Compared to respondents aged 65-69.3 Compared to respondents in excellent or very good health.*** Significantly different from eligible nonenrollees at 0.01 level. ** Significantly different from eligible nonenrollees at 0.05 level. * Significantly different from eligible nonenrollees at 0.10 level.
SOURCE: RTI Analysis of QMB/SLMB/Nonenrollee Survey Data, 2002 and the State Outreach Survey
PROGRAM: SONHS47
Model 4 Model 5(N=438) (N=433)
Benefit BenefitQMB-Plus Standard QMB
70
Personal Characteristics (Demographics and Health Status) - While age had no significant effect on enrollment overall, other demographic variables did. Men were only 45% as likely as women to be enrolled in either the Medicare Savings Programs overall (or 40% as likely in the QMB program specifically). The likelihood of enrollment in the SLMB program was also lower for men than women, but not statistically significant. Race and ethnicity were not consistent predictors of enrollment. For example, Black beneficiaries and beneficiaries of other races were significantly more likely to enroll in QMB compared to White beneficiaries, while Hispanics were significantly less likely to enroll in the SLMB program compared to White beneficiaries. This lack of consistency may be due to the small sample size of nonwhite respondents.
Self-rated general health was a significant factor in predicting enrollment in all three models. Beneficiaries in poor health were 3 times more likely than beneficiaries in excellent or very good health to enroll in either of these programs (Model 1), twice as likely to enroll in QMB and 12 times more likely to enroll in SLMB. Beneficiaries in fair health were also five times more likely to enroll in SLMB than beneficiaries in excellent or very good health. These findings are consistent with hypotheses that poor health motivates individuals to seek assistance with health care costs, or that individual negative health events may trigger enrollment through increased contact with professionals who might refer or assist with enrollment.
Receipt of Social Services and Community Ties - Whether a person receives social services, such as personal care, homemaking, Meals on Wheels, food stamps, transportation services or rent subsidies, was the strongest predictor of enrollment. Beneficiaries who received any of these services were almost 8 times more likely to enroll in these programs compared to beneficiaries who did not receive these services. They were also 8 times more likely to enroll in QMB and 9 times more likely to enroll in SLMB. This could reflect increased help seeking behavior, be related to poor health status, or an increased likelihood of being the target of outreach activities or referrals.
Attendance at either a community or senior center or place of worship appeared to have a negative effect on enrollment. Beneficiaries who attend centers were significantly less likely to enroll in the SLMB program compared to those who do not attend, while beneficiaries who go to church or other places of worship are half as likely to enroll in the QMB program as those who do not attend places of worship. Perhaps attendance at senior centers or places of worship is a proxy for better health and hence less incentive to seek assistance with medical costs or for less contact with providers who would encourage enrollment.
Characteristics of State Eligibility and Application Processes for Enrollees and Nonenrollees - State characteristics were also significant predictors of enrollment. Beneficiaries were more likely to enroll in the programs if residing in states offering full Medicaid benefits for those with incomes up to 100% of the FPL compared to others. Beneficiaries are 3 times more likely to enroll in QMB and in SLMB if full Medicaid benefits are offered to 100% of the FPL. Beneficiaries may be responding to the added benefits associated with QMB enrollment in the QMB-plus states. As discussed in the descriptive analysis, the increased rate of SLMB enrollment in these states may be a spillover effect related to the enhanced QMB-plus benefit. Residing in a state permitting beneficiaries to report their income and assets without supporting documentation (self-declaration of income and assets) increased the likelihood of enrollment in
71
the programs almost two-fold. From the beneficiaries’ point of view, there is less intrusion from the government into their personal affairs and the programs are easier to apply for.
States that train outreach workers to educate beneficiaries about the Medicare Savings Programs have positive effects on enrollment, and particularly on the QMB program. Beneficiaries were twice as likely to enroll in the QMB and SLMB programs combined compared to beneficiaries living in other states. Beneficiaries were also more than twice as likely to enroll in the QMB program specifically. However, the impact of outreach worker training is insignificant for the SLMB program. In contrast, shortened application forms and automatic screening for QMB and SLMB eligibility when individuals apply for other Medicaid programs were associated with a lower likelihood of enrollment, all else equal, and liberalized asset limits had no effect on enrollment.
When we examine the predictors of enrollment separately for QMB-plus states and standard QMB benefit states (Table 15), we notice the marked difference in the importance of state characteristics. Training outreach workers and allowing self-declaration of income and assets significantly increased the likelihood of enrollment in standard benefit states but not in QMB-plus states. State efforts to train their outreach workers increased the likelihood of QMB enrollment in standard benefit states by two and a half. Also, beneficiaries in states that permit applicants to self-declare their income and assets are more than twice as likely to enroll in QMB compared to states that do not. These findings suggest that in states where the benefit consists only of the premium and cost-sharing but not full Medicaid coverage, a concentrated effort must be made to educate beneficiaries about the programs, convince them to enroll, and to make the process simple for them.
As in Models 1-3, receipt of community services or other supports had the greatest impact on the likelihood of enrollment in these models. This was an especially strong predictor of QMB enrollment in the standard benefit states.
2.7 Discussion
Our objectives in conducting this research were to further CMS’ understanding of the characteristics of QMB and SLMB enrollees compared to eligible nonenrollees, pathways and barriers to enrollment, and the extent to which enrollment helps low-income Medicare beneficiaries with their health-related expenses. In addition, the results of these analyses can be used to help CMS and states continue to improve and target outreach efforts to increase enrollment in the Medicare Savings Programs.
Pathways and Barriers to Enrollment in the Medicare Savings Programs - One of the most striking findings in this study is that in 2001 the main reason eligible individuals had not enrolled was that they remain unaware of these programs. Many of the enrollees learned about the programs from people – social workers, government workers, friends or relatives. We see this in enrollee descriptions of how they learned about the programs, what led them to enroll, and how they submitted their applications. They most often enrolled after a hospitalization (where hospital social workers may assist in enrollment) or after moving into subsidized housing (where service coordinators conduct outreach and assist with enrollment). Beneficiaries who already receive other types of assistance from social, community or government services were also far more likely to enroll than were those who do not.
72
Not only are beneficiaries unaware of the programs, but our focus group findings indicate that helping professionals with whom they come in contact and who could educate or encourage individuals to enroll are not consistently knowledgeable about these programs. Given the survey findings that enrollment is strongly associated with assistance from others, as a means of learning about the programs and in the application process, the importance of disseminating information about the programs to various health and social service providers is clear. Few beneficiaries responding to the survey had learned about the programs from print, broadcast media, or presentations. In addition, because there are high levels of illiteracy, physical and cognitive impairment in the target population, printed materials are of limited value. Indeed, about half of the survey respondents received help completing the survey.
The study findings also point out the limited potential of presentations at community or senior centers as an approach to outreach. Only a small proportion of beneficiaries utilize these centers, equal proportions of the enrollee and nonenrollee samples, and only a small percentage of the enrollees indicated they had learned of the programs this way. In contrast, the findings indicate that half the respondents, enrollees and nonenrollees alike, attend a place of worship, although this factor was associated with a decreased likelihood of enrollment. The high level of attendance at places of worship suggests they might be a target for outreach efforts. However, outreach efforts targeting places of worship have been time consuming and have not resulted in increased enrollment (Hoover et al., 2002).
Beyond the lack of beneficiary awareness that has led CMS and the states to invest in outreach activities, personal values or other considerations are often cited as impediments to enrollment. Fear of estate recovery and the welfare stigma were discussed in the focus groups, and beneficiaries and professionals both indicated that these issues exist. The survey results indicate close to 20% of eligible nonenrollees overall are concerned about estate recovery, suggesting that policy makers may want to reconsider estate recovery for these beneficiaries, or better inform beneficiaries about the limits of the state recovery process (i.e., that only the amount of money paid to the beneficiary through the Medicare Savings Programs is at risk, not the full estate).
Welfare stigma or the fierce commitment to self-sufficiency of the generation that lived through the Depression is one of the most often cited obstacles to enrollment, yet this survey indicates that only 10% do not want the assistance, and many enrollees responded that they deserve the benefits. If beneficiaries have heard of the programs, they do not enroll because they do not know how to apply or they assume they will not qualify for them.
Difficulties with the enrollment process itself may also serve as a barrier to enrollment. Although the majority of enrollees received help with the application and only a small percentage report it was very difficult, many still found it too long, too personal and too difficult. Fifteen to 20% of eligible nonenrollees overall cite the application as a barrier to enrollment. While our professional focus group participants highly praised shortened application forms, the beneficiary survey did not support the shortened application as an important factor in beneficiary enrollment. It may be that the key variable is assistance with the process and that shortened application forms are desirable because they reduce the burden for SHIP workers and others who assist beneficiaries but they do not promote enrollment in and of themselves. Alternatively, it may take some time before the impact of shortened applications, which are a relatively recent innovation in many states, is observed.
73
The Relationship of Health Status and Other Beneficiary Characteristics to Enrollment - It is not possible to disentangle cause and effect in this study between health care utilization variables and enrollment in the Medicare Savings Programs, yet it is clear that enrollees are in worse health, have higher rates of health care services utilization, and have higher rates of utilization of other services associated with decreased physical function, such as personal care and home making services. These findings suggest that beneficiaries with health problems may indeed be more highly motivated to seek sources of assistance with medical care costs, as well as more likely to come in contact with health or social service professionals who refer them to these programs. However, it is not possible from this analysis to ascertain whether the increased utilization reported by enrollees reflects adverse selection into the programs or whether enrollment removes financial barriers to care. We address adverse selection in Chapter 6.
Program Benefits - The survey findings indicate that the Medicare Savings Programs decrease, but do not eliminate, the financial burdens experienced by low-income Medicare beneficiaries seeking medical care. Even though the enrollees report worse health, QMB enrollees have fewer medical bills and have less difficulty paying their bills compared to eligible nonenrollees. Because QMB enrollees have their premiums, deductibles and coinsurance paid for by Medicaid, they do not have many, if any, costs for benefits they receive under Medicare Parts A and B. QMB enrollees living in QMB-plus states receive additional medical services and the survey findings indicate they report less financial hardship. Even so, a substantial proportion of QMBs reported problems paying for their medications and other medical bills. An even larger percentage of SLMB enrollees report having to choose between which bills to pay. SLMB enrollees remain liable for deductibles and coinsurance, which can become quite costly, as they report visiting the doctor and staying overnight in the hospital as often and they take significantly more medications than eligible nonenrollees.
Concerns about crowd-out of private insurance were not validated in this analysis. While a fairly high percentage of respondents reported having some type of supplemental insurance coverage, particularly prescription drug benefits, only a very small percentage of enrollees had dropped supplemental coverage that they held previously.
Strategies to increase enrollment - These programs are clearly valuable to low income Medicare beneficiaries. We also know from other studies that the Medicare Savings Programs are under-utilized, and from this study, that lack of awareness, not motivation, is the main reason eligible beneficiaries have not enrolled. What can states do to increase enrollment in these programs? Our results underscore the importance of personal attention when educating and enrolling beneficiaries into the QMB and SLMB programs. There are varied reasons why individuals do not apply, necessitating personalized assistance to overcome them. Hence, our main recommendation is to target outreach efforts to those in the community that can identify potential eligibles and assist them with the process. Specific strategies could include:
1. Focusing education efforts on helping professionals. Case managers in Area Agencies on Aging and other social service agencies, hospital discharge planners, state pharmacy assistance program staff, home health staff, home delivered meals and congregate meals staff, service coordinators in subsidized housing, primary care doctors, pharmacists and community health centers all have daily contact with Medicare beneficiaries who may be eligible for these programs.
74
The development and dissemination of outreach materials directed to these individuals would support increased case finding.
2. Increase the investment in SHIP and encourage SHIP workers to develop relationships with other helping professionals in their communities. While it is appropriate to expect other service providers to assist in case finding, all of these individuals are busy working in their own arenas. Thus, it is important for these individuals to be aware that there are SHIP workers to whom they can refer their clients for more direct assistance with the application process and answers to specific questions. If more individuals learn of these programs and seek assistance with the process, the SHIP program will need added capacity.
3. Develop and implement training for welfare office workers, and encourage States to have staff that specialize in Medicare Savings Programs eligibility and enrollment. A third of the enrollees responding to this survey had received help from local welfare office staff. Yet the focus group participants described limited availability of office staff to respond to calls, and a lack of knowledge about the programs on the part of the staff responsible for taking applications from beneficiaries.
Strategies such as these would address lack of awareness as a barrier to enrollment. Remaining barriers would include application and recertification processes that beneficiaries experience as burdensome; fear of estate recovery; and asset requirements that have not been updated since they were established in 1989.
75
CHAPTER 3 IMPACT OF PRECIPITATING MEDICAL EVENTS ON QMB AND SLMB
ENROLLMENT
Little is known about factors that lead Medicare beneficiaries to enroll in the Medicare Savings Programs. Although there are likely multiple pathways into the program, one possibility is that beneficiaries may enroll following costly medical events, either to help defray their out-of-pocket costs or because they come into contact with a medical provider or other helping professional who refers them into the program. Indeed, our survey of enrollees in the QMB and SLMB programs found that half of the respondents learned about the programs through social workers or health care professionals, and a hospitalization was the most common precipitating event to enrollment, reported by 38% of enrollees overall. A better understanding of the context for this decision making would be useful for targeting outreach and enrollment activities, as well as for understanding and addressing beneficiary needs.
This analysis complements these survey findings, using Medicare claims and eligibility data to examine whether enrollment in the QMB and SLMB programs is related to having a high cost medical event. We focus on hospital admissions as readily identifiable events likely to be associated with significant beneficiary out-of-pocket costs. The analysis compares newly enrolled QMBs and SLMBs with a matched sample of non-dually eligible Medicare beneficiaries to look for evidence that the timing of QMB/SLMB enrollment is related to having a hospital admission. If hospital admissions precipitate enrollment in the QMB and SLMB programs, we would expect admission rates close to the time of enrollment to be higher for QMBs and SLMBs compared to the comparison groups of non-dually eligible beneficiaries. Our analyses exclude SSI and medically needy dually eligible beneficiaries because their pathways to enrollment are distinctly different from QMBs and SLMBs. In most states SSI beneficiaries are automatically enrolled in the Medicare Savings Programs by virtue of receiving SSI. Thus, we expect their enrollment is less likely to be associated with medical events. By definition enrollment of medically needy beneficiaries is associated with having high medical expenditures.
3.1 Methodology
We used the August 2002 TPEarth file to identify all beneficiaries with a spell of enrollment in the QMB and SLMB programs that began between January 1, 2000 and December 31, 2000. The sample was limited to newly eligible QMBs and SLMBs, rather than those who re-enrolled after a brief break in coverage or transferred into these programs from another dual eligibility category. We defined as newly eligible those beneficiaries who had not been enrolled in any dual eligible program in the prior six months.
We used the TPEarth and 2000 Denominator File to identify a comparison sample of Medicare beneficiaries with no current or prior period of dual eligible coverage. Because dually eligible beneficiaries are lower income than those who are not dually eligible, we expect that service use will vary systematically between these groups. As a partial control for unobservable characteristics, like health status, expected to affect the likelihood of hospitalization, the non-dually eligible sample was matched to our dual eligible population based on age, gender, race, and ZIP code. We excluded the following beneficiaries from both groups:
76
• beneficiaries under 65 years of age;
• beneficiaries on SSI;
• beneficiaries in managed care during 2000; and
• beneficiaries living in Connecticut, Hawaii, Idaho, Illinois, Indiana, Maryland, Missouri, Nevada, Oklahoma and Utah.30
For the newly eligible group, we extracted all Medicare Part A claims for a two-year period: one year prior to enrollment and the first year of enrollment. Part A claims were extracted for the control group for a comparable two-year period. For the control group, the date of enrollment for their matched dually eligible counterpart was used as the index date for defining the time period over which claims were extracted. The following measures of inpatient hospital service use were constructed:
• any admissions;
• number of admissions;
• length of stay;
• any admission for a surgical DRG;
• any admission for multiple trauma; and
• covered charges for admissions.
We used number of admissions, length of stay, and covered charges as proxies for higher out-of-pocket costs. Similarly, we assumed that admissions for surgical DRGs would be associated with higher out-of-pocket costs than medical DRGs. We expected that looking at admissions for multiple trauma would provide a comparison between dual and nondual beneficiaries that was less dependent on health differences between the two groups, since multiple trauma is typically the result of an accident.
These measures were constructed for eight time periods: 1, 3, 6, and 12 months before and after the index enrollment date. We hypothesize that the differences in hospitalization rates between duals and their matched nondual counterparts will generally be greater immediately before enrollment if these major health events were precipitating factors for enrollment. However, because it may take several months for an application to be processed and for a beneficiary to be enrolled, there may be a lag between a precipitating event and the date of enrollment. We constructed hospital utilization measures for varying time frames around the enrollment date to test whether these hypothesized patterns hold. We assume precipitating hospital events will mostly occur prior to enrollment. However, a beneficiary who anticipates a non-urgent hospitalization might apply for the Medicare Savings Programs and delay the
30 Beneficiaries from these states were excluded from the analysis because we could not reliably determine whether
beneficiaries were QMBs or SSI recipients. In these states, the proportion of dual eligibles that our analyses of TPEarth data identified as SSI recipients was implausibly low compared to other states. None of these states allow auto-accretion of SSI recipients. This might explain the low SSI share identified in these states because auto-accrete status was one factor used in our classification algorithm to distinguish QMBs from SSI recipients.
77
admission until after she is enrolled. To allow for these two scenarios, we looked at hospitalizations after the enrollment date, as well as before.
We examined the differences between newly enrolled dually eligible beneficiaries and their matched counterparts for each of the hospitalization measures in each of the eight time periods defined above. We then disaggregated to look at differences between the QMB and SLMB groups separately, to allow patterns to differ by type of dual eligibility. Each difference between duals and nonduals was tested for significance using the t-test for difference between means. Although we attempted to control for differences in health status between dually eligible and nondually eligible beneficiaries by matching on age, gender, race and ZIP code, it is likely that there are remaining unobserved differences between the groups that lead to differences in hospitalization rates. Therefore, for each measure we also calculated the ratio of the mean for the dually eligible population to the mean for the non-dually eligible control group. Because differences in health status should be time invariant, comparing ratios between the groups over time factors out the effect of health status and helps isolate any impact of precipitating health events.
3.2 Results
The means and ratios of all duals to all matched nonduals for each hospital-related event are presented in Table 16. Dually eligible beneficiaries were more likely to have a hospitalization, more likely to have a surgical admission major surgery, had longer lengths of stay, had more admissions, and had higher covered charges than their matched nondually eligible counterparts in each of the periods pre- and post-enrollment. For example, six months prior to enrollment, duals have 1.8 times the rate of major surgeries compared to nonduals, an admission rate that is 2.2 times higher than nonduals, and lengths of stay that are 4.5 times greater than nonduals. In each case, the differences are statistically significant. This pattern also held true when QMBs and SLMBs were compared separately to their matched controls. These consistently higher utilization rates likely reflect the poorer health status of the dually eligible population that was not controlled for by matching the comparison group based on age category, gender, race, and zip code.
The ratio of the means of duals to nonduals overall for each hospital utilization measure is graphed in Figure 1. The graphic representation of the null hypothesis, that there is no precipitating event effect, would be a line parallel to the X axis, or a constant ratio of dual to matched control group means over time. Instead, we see a consistent pattern of a peak in the ratio either just preceding or concurrent with enrollment. For most measures the ratio of duals to non-duals peaks at three months prior to enrollment. At this interval, duals have lengths of stay that are almost five times that of nonduals. Duals also have more than three times the number of admissions and nearly double the number of major surgeries compared to matched nonduals. A year prior to enrollment, the ratio between dual and nonduals is lower across all three measures. Duals have lengths of stay that are 3.61 times those of nonduals, 2.41 times the number of admissions, and 1.45 times the number of major surgeries.
Although these differences could indicate substantial health differences between the dual and nondual groups, the fact that the ratios a year after enrollment are all much lower, indicates that the differences between duals and nonduals are attributable to a precipitating event in
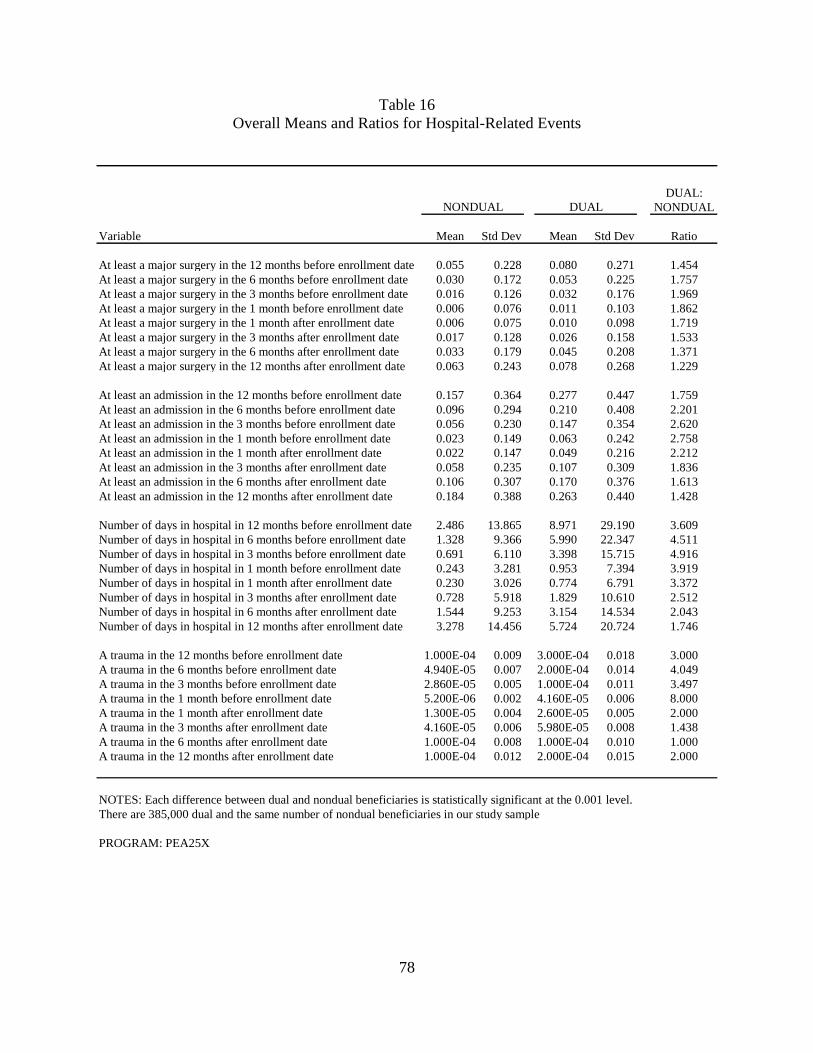
78
Table 16 Overall Means and Ratios for Hospital-Related Events
DUAL:NONDUAL
Variable Mean Std Dev Mean Std Dev Ratio
At least a major surgery in the 12 months before enrollment date 0.055 0.228 0.080 0.271 1.454At least a major surgery in the 6 months before enrollment date 0.030 0.172 0.053 0.225 1.757At least a major surgery in the 3 months before enrollment date 0.016 0.126 0.032 0.176 1.969At least a major surgery in the 1 month before enrollment date 0.006 0.076 0.011 0.103 1.862At least a major surgery in the 1 month after enrollment date 0.006 0.075 0.010 0.098 1.719At least a major surgery in the 3 months after enrollment date 0.017 0.128 0.026 0.158 1.533At least a major surgery in the 6 months after enrollment date 0.033 0.179 0.045 0.208 1.371At least a major surgery in the 12 months after enrollment date 0.063 0.243 0.078 0.268 1.229
At least an admission in the 12 months before enrollment date 0.157 0.364 0.277 0.447 1.759At least an admission in the 6 months before enrollment date 0.096 0.294 0.210 0.408 2.201At least an admission in the 3 months before enrollment date 0.056 0.230 0.147 0.354 2.620At least an admission in the 1 month before enrollment date 0.023 0.149 0.063 0.242 2.758At least an admission in the 1 month after enrollment date 0.022 0.147 0.049 0.216 2.212At least an admission in the 3 months after enrollment date 0.058 0.235 0.107 0.309 1.836At least an admission in the 6 months after enrollment date 0.106 0.307 0.170 0.376 1.613At least an admission in the 12 months after enrollment date 0.184 0.388 0.263 0.440 1.428
Number of days in hospital in 12 months before enrollment date 2.486 13.865 8.971 29.190 3.609Number of days in hospital in 6 months before enrollment date 1.328 9.366 5.990 22.347 4.511Number of days in hospital in 3 months before enrollment date 0.691 6.110 3.398 15.715 4.916Number of days in hospital in 1 month before enrollment date 0.243 3.281 0.953 7.394 3.919Number of days in hospital in 1 month after enrollment date 0.230 3.026 0.774 6.791 3.372Number of days in hospital in 3 months after enrollment date 0.728 5.918 1.829 10.610 2.512Number of days in hospital in 6 months after enrollment date 1.544 9.253 3.154 14.534 2.043Number of days in hospital in 12 months after enrollment date 3.278 14.456 5.724 20.724 1.746
A trauma in the 12 months before enrollment date 1.000E-04 0.009 3.000E-04 0.018 3.000A trauma in the 6 months before enrollment date 4.940E-05 0.007 2.000E-04 0.014 4.049A trauma in the 3 months before enrollment date 2.860E-05 0.005 1.000E-04 0.011 3.497A trauma in the 1 month before enrollment date 5.200E-06 0.002 4.160E-05 0.006 8.000A trauma in the 1 month after enrollment date 1.300E-05 0.004 2.600E-05 0.005 2.000A trauma in the 3 months after enrollment date 4.160E-05 0.006 5.980E-05 0.008 1.438A trauma in the 6 months after enrollment date 1.000E-04 0.008 1.000E-04 0.010 1.000A trauma in the 12 months after enrollment date 1.000E-04 0.012 2.000E-04 0.015 2.000
NOTES: Each difference between dual and nondual beneficiaries is statistically significant at the 0.001 level.There are 385,000 dual and the same number of nondual beneficiaries in our study sample
PROGRAM: PEA25X
NONDUAL DUAL
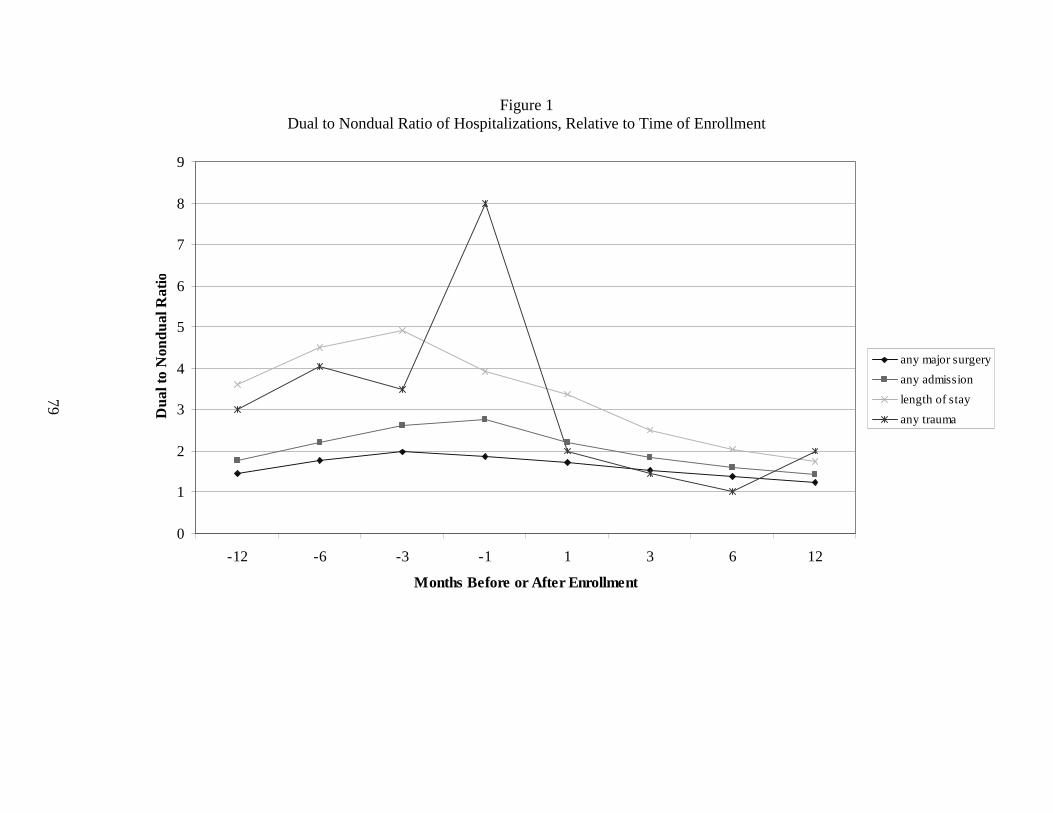
79
Figure 1 Dual to Nondual Ratio of Hospitalizations, Relative to Time of Enrollment
0
1
2
3
4
5
6
7
8
9
-12 -6 -3 -1 1 3 6 12
Months Before or After Enrollment
Dua
l to
Non
dual
Rat
io
any major surgery
any admission
length of stay
any trauma
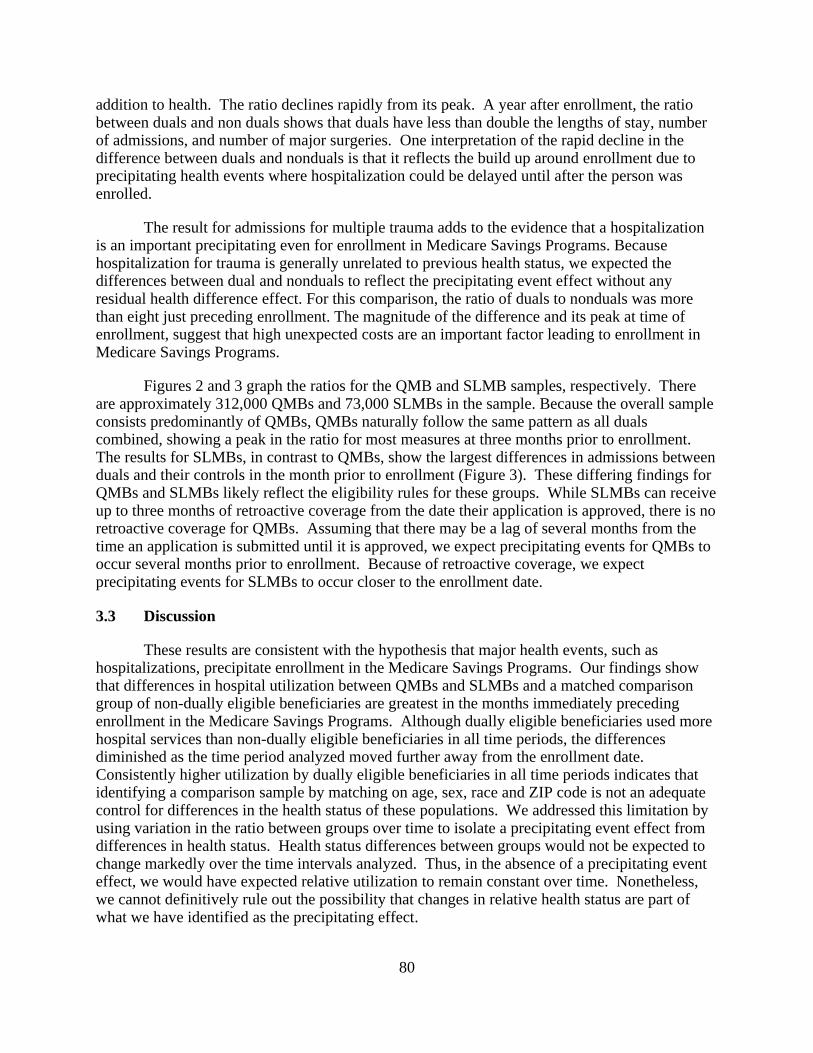
80
addition to health. The ratio declines rapidly from its peak. A year after enrollment, the ratio between duals and non duals shows that duals have less than double the lengths of stay, number of admissions, and number of major surgeries. One interpretation of the rapid decline in the difference between duals and nonduals is that it reflects the build up around enrollment due to precipitating health events where hospitalization could be delayed until after the person was enrolled.
The result for admissions for multiple trauma adds to the evidence that a hospitalization is an important precipitating even for enrollment in Medicare Savings Programs. Because hospitalization for trauma is generally unrelated to previous health status, we expected the differences between dual and nonduals to reflect the precipitating event effect without any residual health difference effect. For this comparison, the ratio of duals to nonduals was more than eight just preceding enrollment. The magnitude of the difference and its peak at time of enrollment, suggest that high unexpected costs are an important factor leading to enrollment in Medicare Savings Programs.
Figures 2 and 3 graph the ratios for the QMB and SLMB samples, respectively. There are approximately 312,000 QMBs and 73,000 SLMBs in the sample. Because the overall sample consists predominantly of QMBs, QMBs naturally follow the same pattern as all duals combined, showing a peak in the ratio for most measures at three months prior to enrollment. The results for SLMBs, in contrast to QMBs, show the largest differences in admissions between duals and their controls in the month prior to enrollment (Figure 3). These differing findings for QMBs and SLMBs likely reflect the eligibility rules for these groups. While SLMBs can receive up to three months of retroactive coverage from the date their application is approved, there is no retroactive coverage for QMBs. Assuming that there may be a lag of several months from the time an application is submitted until it is approved, we expect precipitating events for QMBs to occur several months prior to enrollment. Because of retroactive coverage, we expect precipitating events for SLMBs to occur closer to the enrollment date.
3.3 Discussion
These results are consistent with the hypothesis that major health events, such as hospitalizations, precipitate enrollment in the Medicare Savings Programs. Our findings show that differences in hospital utilization between QMBs and SLMBs and a matched comparison group of non-dually eligible beneficiaries are greatest in the months immediately preceding enrollment in the Medicare Savings Programs. Although dually eligible beneficiaries used more hospital services than non-dually eligible beneficiaries in all time periods, the differences diminished as the time period analyzed moved further away from the enrollment date. Consistently higher utilization by dually eligible beneficiaries in all time periods indicates that identifying a comparison sample by matching on age, sex, race and ZIP code is not an adequate control for differences in the health status of these populations. We addressed this limitation by using variation in the ratio between groups over time to isolate a precipitating event effect from differences in health status. Health status differences between groups would not be expected to change markedly over the time intervals analyzed. Thus, in the absence of a precipitating event effect, we would have expected relative utilization to remain constant over time. Nonetheless, we cannot definitively rule out the possibility that changes in relative health status are part of what we have identified as the precipitating effect.
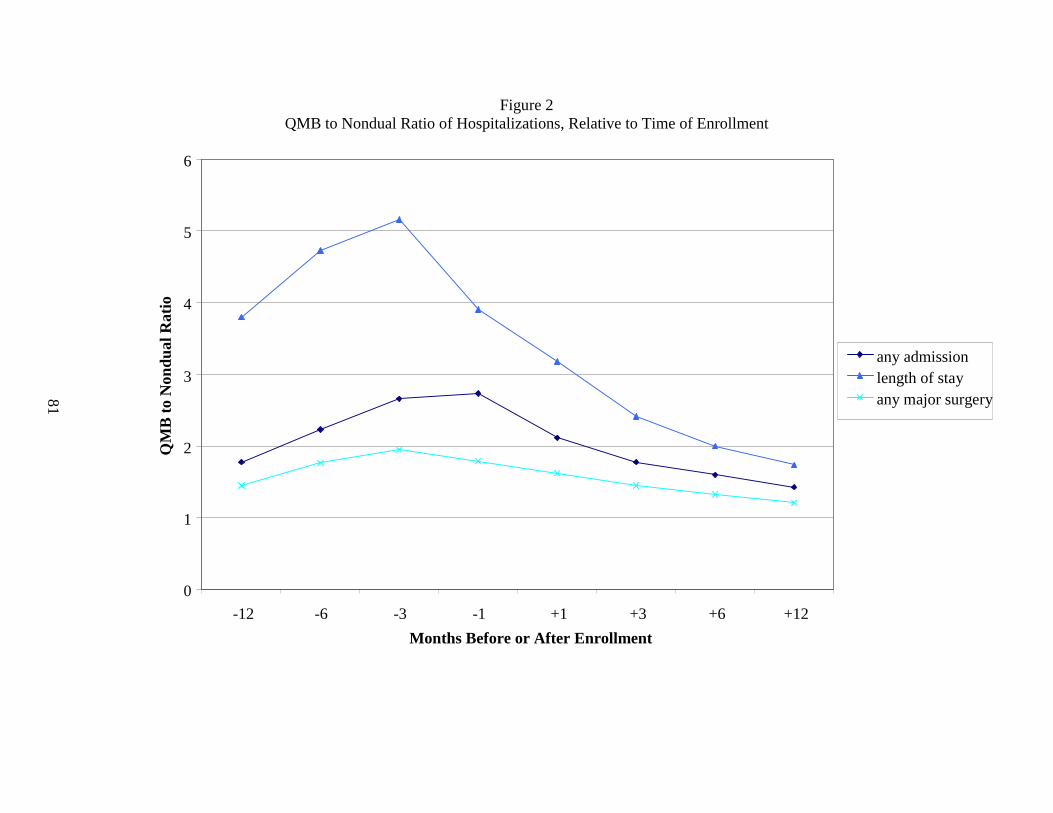
81
Figure 2 QMB to Nondual Ratio of Hospitalizations, Relative to Time of Enrollment
0
1
2
3
4
5
6
-12 -6 -3 -1 +1 +3 +6 +12
Months Before or After Enrollment
QM
B t
o N
ondu
al R
atio
any admissionlength of stayany major surgery
82
Figure 3 SLMB to Nondual Ratio of Hospitalizations, Relative to Time of Enrollment
0
0.5
1
1.5
2
2.5
3
3.5
4
4.5
-12 -6 -3 -1 +1 +3 +6 +12
Months Before or After Enrollment
any major surgery any admission
length of stayQM
B t
o N
ondu
al R
atio
83
Our conclusion is further supported by the somewhat differing findings for QMBs and SLMBs. Although both groups show a peak in relative hospital use prior to enrollment, the timing of this peak differed. The greatest differences between QMBs and their matched comparison group occurred three months prior to enrollment, while the greatest difference for SLMBs was in the month immediately preceding enrollment. These patterns are consistent with the differing eligibility rules for these groups. Since SLMBs can receive up to three months of retroactive coverage once their application is approved, whereas QMBs cannot, we would expect a longer lag between a precipitating health event and enrollment for QMBs.
Our results indicate that hospitalizations for precipitating events mainly occur prior to enrollment. However, the consistently declining ratio of hospital use between dually eligible and non-dually eligible beneficiaries in the months following enrollment also supports the hypothesis that some beneficiaries may delay hospitalizations associated with precipitating health events until after they are enrolled. Presumably these admissions would be scheduled as soon as possible after enrollment, leading to relatively higher utilization in the months immediately following enrollment.
There are two major limitations on our ability to identify the effect of precipitating health events on enrollment in the Medicare Savings Programs through this study. First, it is likely that spouses apply for the Medicare Savings Programs jointly and a major health event for either spouse could have triggered the decision to enroll. Therefore, for married beneficiaries it would have been preferable to capture hospitalizations for either the husband or wife in our utilization measures. This was not possible because spouses cannot be identified using Medicare’s administrative data sources. To the extent that only one member of a couple has a precipitating health event, our findings will understate their impact on the decision to enroll in the Medicare Savings Programs. The second limitation is that hospitalizations are only a partial indicator of the types of costly medical events that might lead a beneficiary to apply for Medicare Savings Programs. For example, beneficiaries might incur high out-of-pocket costs for other Medicare services. In addition, beneficiaries might have substantial expenses for services not covered by Medicare, such as prescription drugs. Because we do not capture the full range of health care expenditures, our results are a conservative estimate of the impact of precipitating health events on program enrollment. We do expect that hospitalization is a good proxy for other health care expenditure that is not fully captured in this analysis, however. Since unexpected health care expenditure appears to be especially important in determining enrollment, hospitalization is the best measure to use. Typically prescription drug costs and office visit costs can be more reliably anticipated.
The remaining question, for policy purposes, is why a hospitalization precipitates enrollment. The three options are: (1) that people enroll when they most need the dual coverage, and that is when they are hospitalized; or (2) that beneficiaries would have needed and been eligible for the coverage, but did not find out about the programs until they were hospitalized; or (3) a combination of the above reasons. Regardless of the mechanism, since hospitalization appears to precipitate enrollment, enrollment depends on hospital staff knowing about Medicare Savings Programs and informing patients about them.

84

85
CHAPTER 4 DURATION OF ENROLLMENT IN THE MEDICARE SAVINGS PROGRAMS
4.1 Introduction
Enrollment in means-tested programs that require periodic recertification of eligibility, such as Medicaid, can be unstable. Beneficiaries may lose coverage at eligibility redetermination, either because they no longer qualify, they do not understand that they need to reapply, they do not complete the reapplication process on time, or they do not reapply at all because they find the required paperwork too burdensome. Although these patterns of turnover in coverage have been documented for Medicaid generally, little is known about the enrollment patterns of people in the Medicare Savings Programs specifically. Dually eligible beneficiaries might be expected to have more stable enrollment patterns than other Medicaid beneficiaries, both because both their living arrangements are likely to be more stable and they are less likely to have income fluctuations that could cause them to lose eligibility. In addition, a number of states have introduced simplified procedures and shortened applications for eligibility redetermination to address this problem. Nevertheless, anecdotal evidence from focus groups and from site visits to states that received outreach and enrollment grants to increase enrollment in the Medicare Savings Programs (Hoover et al., 2002) suggests that disenrollment at redetermination may remain a problem.
In this chapter, we report our findings from analyses of enrollment patterns for beneficiaries in the Medicare Savings Programs, using enrollment data from CMS’ TPEarth file (also known as the Third Party Buy-in File). Our analyses contrast patterns of enrollment for QMBs and SLMBs covered under the eligibility expansions of the late 1980s and early 1990s with SSI dually eligible beneficiaries. We hypothesize that SSI beneficiaries will have relatively stable enrollment. Therefore, we use them as a benchmark for evaluating the enrollment experience of QMBs and SLMBs.
4.2 Methodology
The TPEarth file used in these analyses includes enrollment data through August 2002. Using the TPEarth data, we selected a rolling cohort of enrollees who began an enrollment period in a Medicare Savings Programs on or after January 1997. Our study population is limited to beneficiaries who were newly enrolled in the Medicare Savings Programs during the study period. A new enrollee is defined as a beneficiary who had not been enrolled in any dual eligible program for at least 12 months prior to the beginning of their first enrollment spell in our data. We include in our study sample beneficiaries who were newly enrolled in Medicare Savings Programs on or after January 1997 but who died between that enrollment and 2002. Using date of death information, we were able to treat the beneficiary death as a censoring event in the analyses.
For each member of the study population we constructed a history of all spells of enrollment in the Medicare Savings Programs through August 2002. An enrollment spell is defined as a period of continuous coverage, with no gaps in eligibility of one month or more. For each enrollment period, we calculate the episode length, in months. We defined enrollment spells in two ways. First, we defined a spell as a period of continuous coverage in a specific program. Under this definition, a spell would end if a beneficiary had a transition in her type of
86
dual eligibility (for example, from QMB to SSI) or if her coverage under the Medicare Savings Programs ended entirely. Second, we defined a spell as a period of continuous coverage in any Medicare Savings Programs. Using this definition, beneficiaries who transition between types of eligibility would still be considered continuously enrolled and a spell only ends when there is a period of one month or more with no coverage of any type. The difference between these two episodes is a measure of switching among Medicare Savings Programs. We also identify the type of dual eligibility (SSI, QMB, SLMB, etc.) at the beginning and end of the enrollment spell.
In addition, we calculate the length of any periods of disenrollment following the initial enrollment spell. Analyses of disenrollment spells provide information on how likely beneficiaries are to return to the Medicare Savings Programs after a break in coverage and whether they are most likely to return after a brief break in coverage. For example, relatively brief breaks in coverage might occur if beneficiaries have difficulties completing the recertification process on time.
The number of unique beneficiaries who are included in this analysis is 3,706,304, of whom 27% begin as QMBs, 11.7% as SLMBs, and 36% begin as SSI beneficiaries. There are also 14.8% who begin their enrollment as “other” or medically needy, and 10% for whom we do not know in which program they initially enrolled, due to a missing BIEC code. Of all these beneficiaries, only 18% had a second episode of enrollment. While this number seems low, there are a number of people who would not have been eligible to have a second episode of enrollment, like those who died or remained enrolled in the program throughout the five year period we studied.
We calculate two sets of descriptive statistics to characterize enrollment and disenrollment spells: the Kaplan-Meier empirical hazard function and the corresponding non-parametric survival function. The hazard function for enrollment spells is the likelihood of disenrolling in each month, given that the beneficiary remained enrolled at the end of the preceding month. The hazard function is defined as:
H(t) = (Number disenrolling in month t)/(Number remaining enrolled at the end of month t-1),
where t is the number of months since an enrollment spell began.31
The corresponding survival function measures the cumulative likelihood each month of remaining enrolled in the program. The survival function is defined as:
S(t) = S(t-1)*(1-H(t-1)).
Because all spells are at least one month long, S(1) = 1, the hazard and survival functions for spells of disenrollment were calculated comparably. For disenrollment spells, the hazard function measures the likelihood of re-enrolling in each month, given that the beneficiary was still disenrolled at the end of the preceding month. The survival function for disenrollment spells is the cumulative likelihood each month of remaining disenrolled.
31 The denominator for H(1) is the total number of enrollees in month 1.
87
Each of these estimates allows for two types of censoring. First, we consider a spell to be censored if it is ongoing at the end of our data (August 2002). Second, a spell is censored if it ends because the beneficiary dies. In these cases, we do not know how long the spell would have lasted if the censoring had not occurred (i.e., if the data had continued or if the person had not died). Thus, the calculation of the hazard and survival functions for month t exclude censored spells of length t. Statistically adjusting for censoring in the analyses is important so that our estimates of the length of enrollment and disenrollment spells are not affected by differential death rates or other censored outcomes. We identified enrollment spells that are censored due to death using a variable in the TPEarth file that identifies death as a reason for disenrollment. To identify disenrollment spells that are censored due to death, we merged on date of death from the Enrollment Data Base.
The TPEarth data, because they provide a complete history of enrollment in Medicaid buy-in programs, is well-suited for our analyses of enrollment duration. Although the data include a buy-in eligibility code (BIEC) that can be used to identify the basis of eligibility, there are limitations on how accurately specific type of dual eligibility can be identified. These limitations derive primarily from the following sources:
• Although there are specific BIECs for SSI recipients, the BIEC for QMBs are sometimes also used for SSI beneficiaries, who are considered QMB Plus enrollees.
• Changes in type of dual eligibility do not necessarily trigger the creation of a new TPEarth record. Unless a new record is generated for other reasons, old BIECs are overwritten with the most current BIEC, so that transitions between eligibility categories cannot be identified.
Our duration of enrollment analyses focus on QMBs and SLMBs, with SSI beneficiaries used as a reference group. As a result it is important that we be able to reliably distinguish SSI beneficiaries from QMBs and SLMBs. This is possible only in auto-accrete states where SSI recipients are automatically bought into Medicaid based on their SSI status. The accretion code, a TPEarth field, can be used to identify auto-accrete SSI eligibles, which enables us to distinguish them from SSI recipients who are reported using the QMB BIEC. In addition, a change in auto-accretion status will trigger the creation of a new TPEarth record.
32
As a result, transitions between SSI and other types of dual eligibility can be identified accurately over time in only auto-accrete states. Because of these data limitations, our analyses exclude the 19 states where SSI recipients are not automatically bought into Medicaid based on their SSI status.
33
We used the following groups to classify the type of eligibility at the beginning and end of an enrollment spell: SSI, QMB, SLMB, and Other. The “Other” category mainly includes medically needy beneficiaries who spend down to Medicaid eligibility and, to a lesser extent, QI-1 beneficiaries. Because of the limitations in the TPEarth file described above, we are not able to accurately distinguish movement between QMB, SLMB, and “Other” eligibility. Therefore, it is likely that there is some error in our identification of original type of eligibility. In addition,
32 A new TPEarth record is also created if a beneficiary moves to a new state. 33 The specific states excluded are: Alaska, Connecticut, Hawaii, Idaho, Illinois, Indiana, Kansas, Maryland,
Minnesota, Missouri, Nebraska, Nevada, New Hampshire, North Dakota, Ohio, Oklahoma, Oregon, Utah, and Virginia.

88
the BIEC is missing on approximately 9.6% of the observations in our data. These spells are classified as “Unknown” program type.
34
Although periods of “Unknown” coverage are included in our estimates of enrollment duration, we do not display them separately when reporting results by program type. As a result of the difficulty identifying movement between QMB and SLMB eligibility, we combined periods of QMB and SLMB coverage when we constructed enrollment spells based on continuous coverage within a specific program (so that an enrollment spell does not end if there is a transition between QMB and SLMB eligibility). However, these combined QMB/SLMB spells are categorized separately as QMB or SLMB based on the eligibility codes reported at the beginning and end of the enrollment spell.
4.3 Results
Figure 4 graphs the probability of dually eligible beneficiaries remaining enrolled in the Medicare Savings Programs by month since the beginning of an enrollment spell. These survival function results are shown for the initial enrollment spell. The solid line shows the probability of remaining enrolled in any Medicare Savings Programs, regardless of changes in program eligibility. The dashed line graphs the probability of remaining enrolled in a specific program (so an enrollment spell ends if a beneficiary moves between SSI and QMB/SLMB eligibility, for example).
For both definitions of an enrollment spell, the probability of remaining enrolled decreases fairly steadily over time, although the decline is somewhat steeper during the early months of enrollment. The probability of remaining enrolled is less when we look at duration of enrollment in a specific program compared to enrollment in the Medicare Savings Programs overall. The difference between these lines reflects beneficiaries who transition between programs, but remain continuously covered. For example, at the end of the first year, the probability of remaining enrolled is 0.91 for the Medicare Savings Programs overall compared to 0.87 in a specific program. The probability decreases further by 24 months, where it is 0.84 for the Medicare Savings Programs overall and 0.78 for a specific program. Within 5 years, the probability has further decreased to 0.73 for Medicare Savings Programs enrollment and 0.65 for a specific program. The gap between the two lines widens somewhat over time, indicating that later program-specific disenrollments are more likely than earlier ones to be a transition to another category of eligibility, rather than a disenrollment from the Medicare Savings Programs entirely. Overall, the differences between results when we look at enrollment in the Medicare Savings Programs overall and program-specific enrollment are fairly minor, reaching a maximum of 8% at 5 years. Thus it appears that relatively few beneficiaries transition between programs during a period of continuous coverage in the Medicare Savings Programs. However, it is likely that we underestimate the amount of switching that occurs because of the data limitations described previously.
34 Missing BIECs are concentrated among a small number of states. Among the states included in our analyses,
those with high proportions of records missing the BIEC were Colorado and North Carolina.
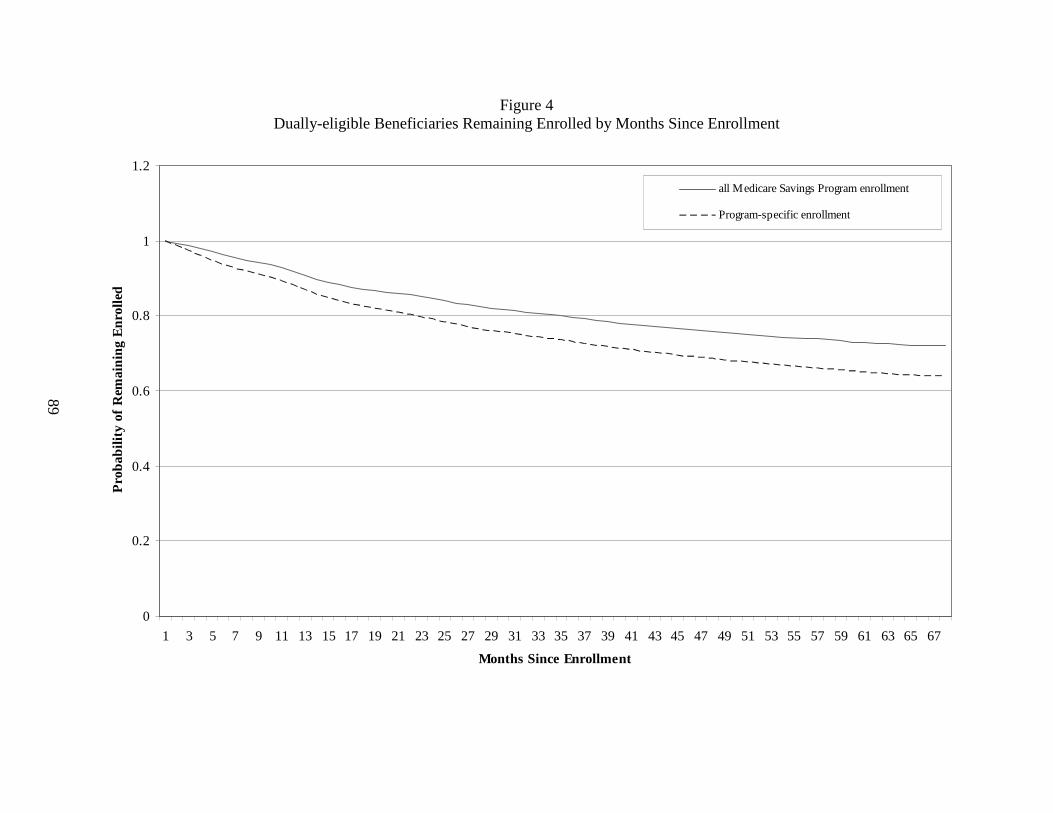
89
Figure 4 Dually-eligible Beneficiaries Remaining Enrolled by Months Since Enrollment
0
0.2
0.4
0.6
0.8
1
1.2
1 3 5 7 9 11 13 15 17 19 21 23 25 27 29 31 33 35 37 39 41 43 45 47 49 51 53 55 57 59 61 63 65 67
Months Since Enrollment
Pro
babi
lity
of R
emai
nin
g E
nrol
led
all Medicare Savings Program enrollment
Program-specific enrollment
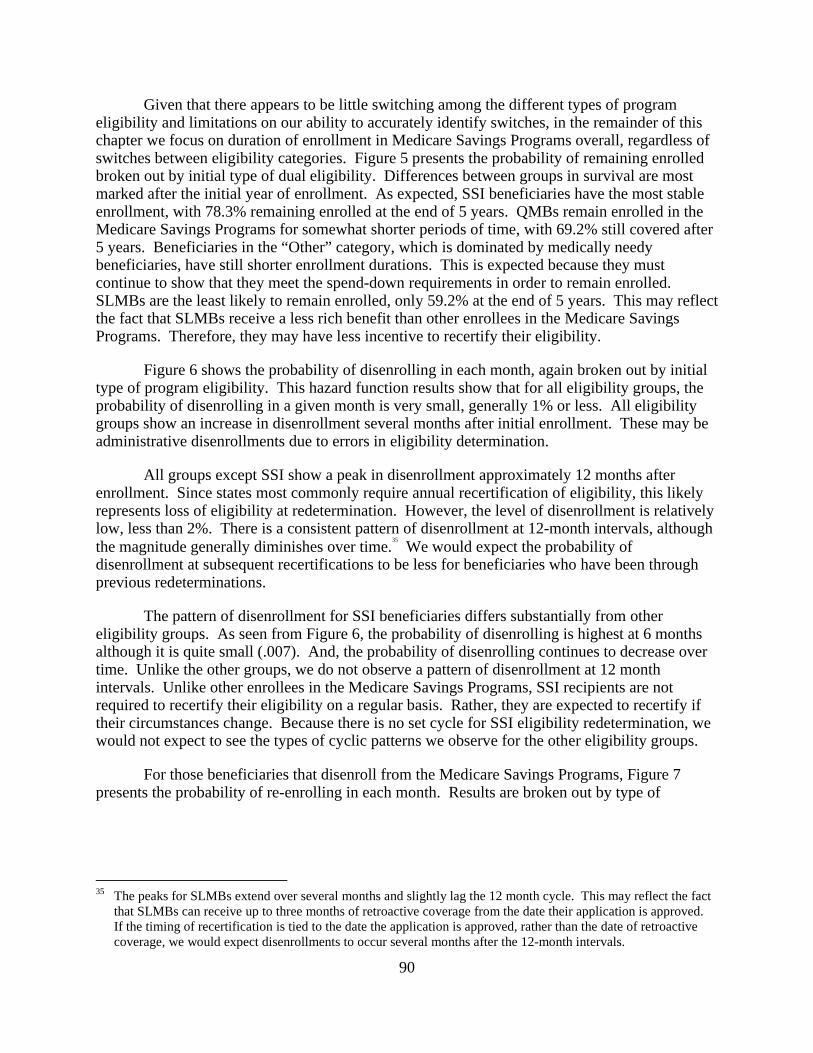
90
Given that there appears to be little switching among the different types of program eligibility and limitations on our ability to accurately identify switches, in the remainder of this chapter we focus on duration of enrollment in Medicare Savings Programs overall, regardless of switches between eligibility categories. Figure 5 presents the probability of remaining enrolled broken out by initial type of dual eligibility. Differences between groups in survival are most marked after the initial year of enrollment. As expected, SSI beneficiaries have the most stable enrollment, with 78.3% remaining enrolled at the end of 5 years. QMBs remain enrolled in the Medicare Savings Programs for somewhat shorter periods of time, with 69.2% still covered after 5 years. Beneficiaries in the “Other” category, which is dominated by medically needy beneficiaries, have still shorter enrollment durations. This is expected because they must continue to show that they meet the spend-down requirements in order to remain enrolled. SLMBs are the least likely to remain enrolled, only 59.2% at the end of 5 years. This may reflect the fact that SLMBs receive a less rich benefit than other enrollees in the Medicare Savings Programs. Therefore, they may have less incentive to recertify their eligibility.
Figure 6 shows the probability of disenrolling in each month, again broken out by initial type of program eligibility. This hazard function results show that for all eligibility groups, the probability of disenrolling in a given month is very small, generally 1% or less. All eligibility groups show an increase in disenrollment several months after initial enrollment. These may be administrative disenrollments due to errors in eligibility determination.
All groups except SSI show a peak in disenrollment approximately 12 months after enrollment. Since states most commonly require annual recertification of eligibility, this likely represents loss of eligibility at redetermination. However, the level of disenrollment is relatively low, less than 2%. There is a consistent pattern of disenrollment at 12-month intervals, although the magnitude generally diminishes over time.
35
We would expect the probability of disenrollment at subsequent recertifications to be less for beneficiaries who have been through previous redeterminations.
The pattern of disenrollment for SSI beneficiaries differs substantially from other eligibility groups. As seen from Figure 6, the probability of disenrolling is highest at 6 months although it is quite small (.007). And, the probability of disenrolling continues to decrease over time. Unlike the other groups, we do not observe a pattern of disenrollment at 12 month intervals. Unlike other enrollees in the Medicare Savings Programs, SSI recipients are not required to recertify their eligibility on a regular basis. Rather, they are expected to recertify if their circumstances change. Because there is no set cycle for SSI eligibility redetermination, we would not expect to see the types of cyclic patterns we observe for the other eligibility groups.
For those beneficiaries that disenroll from the Medicare Savings Programs, Figure 7 presents the probability of re-enrolling in each month. Results are broken out by type of
35 The peaks for SLMBs extend over several months and slightly lag the 12 month cycle. This may reflect the fact
that SLMBs can receive up to three months of retroactive coverage from the date their application is approved. If the timing of recertification is tied to the date the application is approved, rather than the date of retroactive coverage, we would expect disenrollments to occur several months after the 12-month intervals.
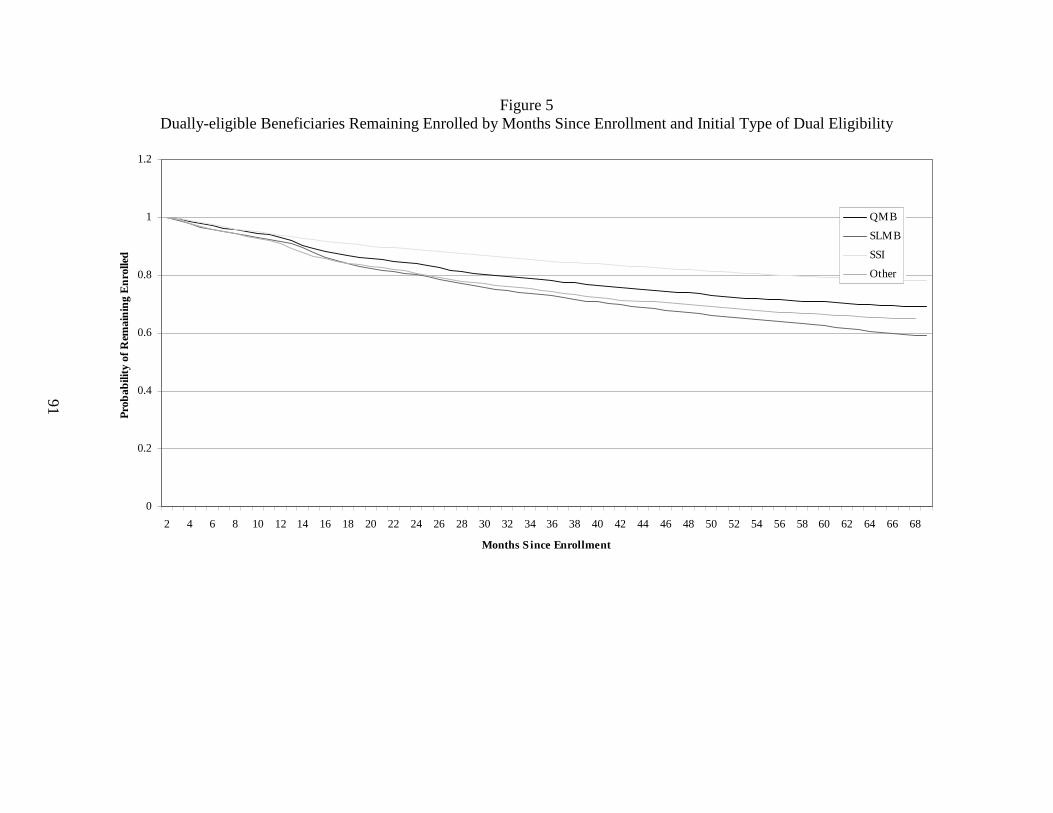
91
Figure 5 Dually-eligible Beneficiaries Remaining Enrolled by Months Since Enrollment and Initial Type of Dual Eligibility
0
0.2
0.4
0.6
0.8
1
1.2
2 4 6 8 10 12 14 16 18 20 22 24 26 28 30 32 34 36 38 40 42 44 46 48 50 52 54 56 58 60 62 64 66 68
Months S ince Enrollment
Prob
abili
ty o
f Rem
ain
ing
En
rolle
d
QMB
SLMB
SSI
Other
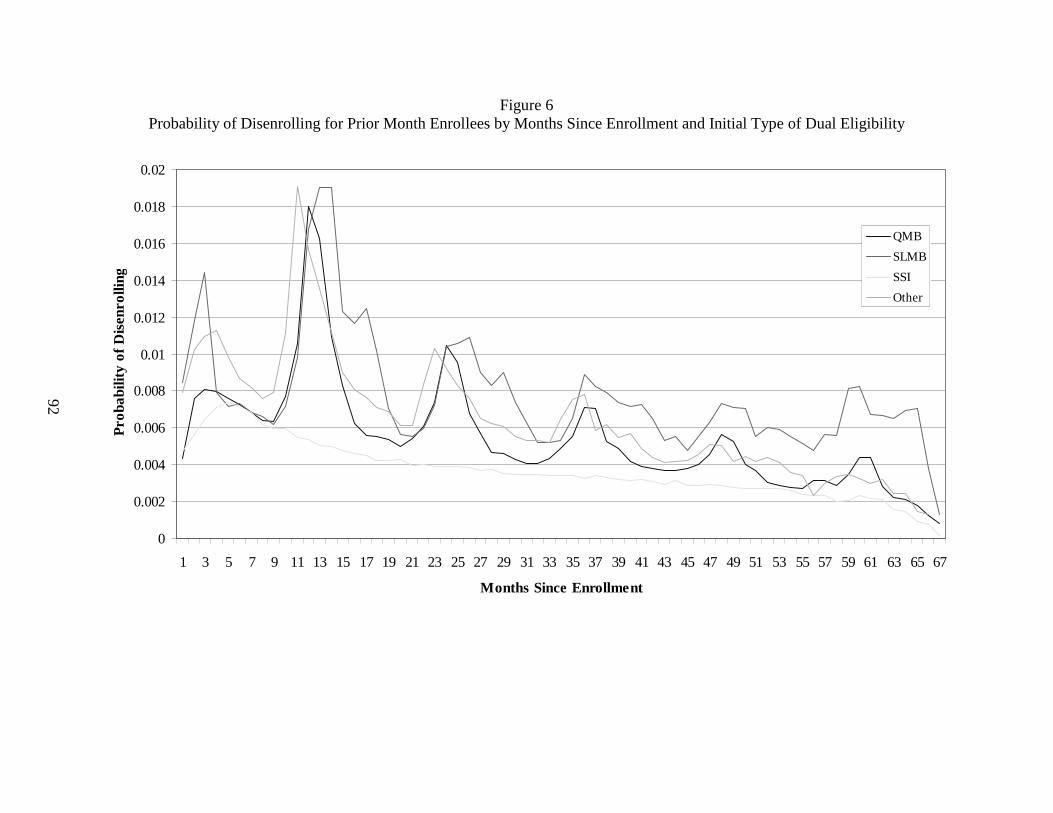
92
Figure 6 Probability of Disenrolling for Prior Month Enrollees by Months Since Enrollment and Initial Type of Dual Eligibility
0
0.002
0.004
0.006
0.008
0.01
0.012
0.014
0.016
0.018
0.02
1 3 5 7 9 11 13 15 17 19 21 23 25 27 29 31 33 35 37 39 41 43 45 47 49 51 53 55 57 59 61 63 65 67
Months Since Enrollment
Pro
babi
lity
of D
isen
rolli
ng
QMB
SLMB
SSI
Other
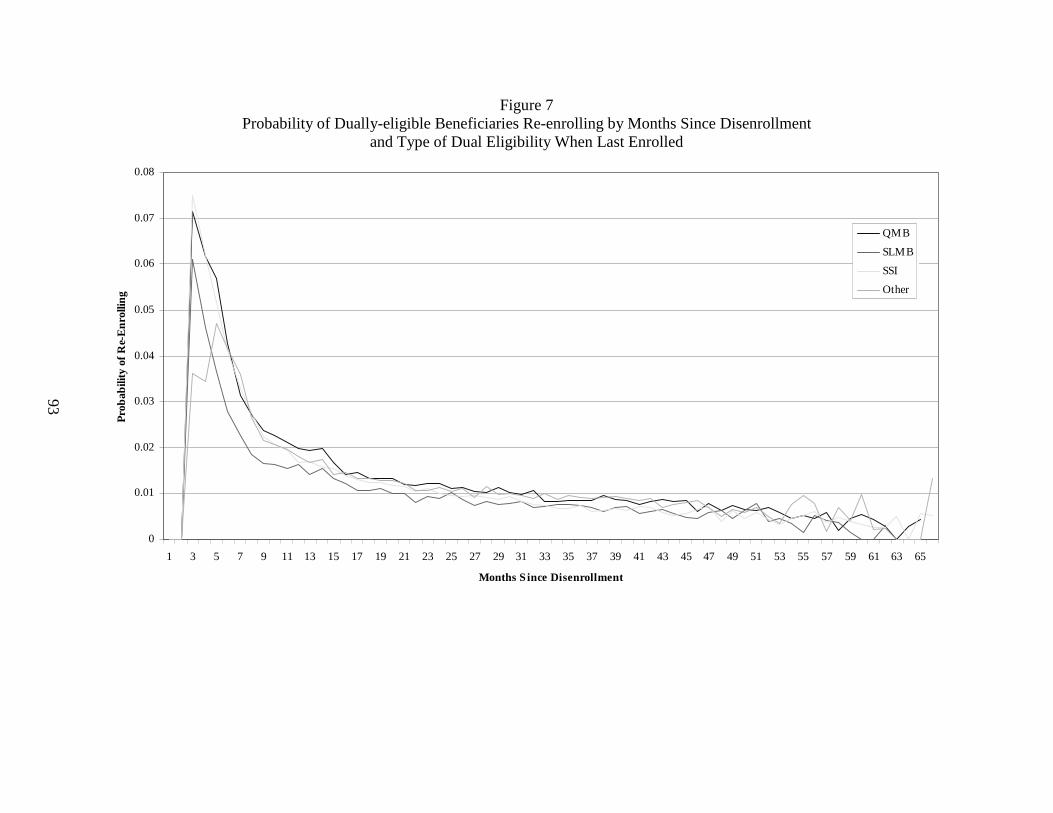
93
Figure 7 Probability of Dually-eligible Beneficiaries Re-enrolling by Months Since Disenrollment
and Type of Dual Eligibility When Last Enrolled
0
0.01
0.02
0.03
0.04
0.05
0.06
0.07
0.08
1 3 5 7 9 11 13 15 17 19 21 23 25 27 29 31 33 35 37 39 41 43 45 47 49 51 53 55 57 59 61 63 65
Months S ince Disenrollment
Pro
bab
ility
of
Re-
En
rolli
ng
QMB
SLMB
SSI
Other
94
eligibility at the end of the prior spell. Re-enrollment patterns are very similar across eligibility groups. For SSI, QMB, and SLMB beneficiaries, the probability of re-enrolling is highest 3 months after disenrollment (7.5%, 7.2%, and 6.1%, respectively). The fact that virtually no beneficiaries re-enroll before 3 months likely reflects the time required to process applications after a beneficiary is disenrolled. Following the peak at 3 months, in each case, the percentage of dual beneficiaries re-enrolling declines sharply for the following months. Throughout the first 48 months, the likelihood of QMBs and SSI beneficiaries re-enrolling in the program once disenrolled is consistently higher than the probability of SLMBs re-enrolling. The pattern for the “Other” category is somewhat different, with the likelihood of re-enrolling peaking slightly later, at 5 months.
Although the hazard function shows a small likelihood of re-enrollment in each month, the cumulative likelihood of re-enrolling over a larger number of months is not small, as Figure 8 presents. By five years after disenrollment, only 45.8% of SSI beneficiaries who disenrolled remain disenrolled. For QMBs, there is a slightly higher likelihood of re-enrollment, with only 42.7% remaining disenrolled. The likelihood of remaining disenrolled is highest for SLMBs, of whom 53.2% of those who disenrolled remain disenrolled after 5 years.
Figure 9 displays the hazard function for second enrollment spells for those beneficiaries that re-enroll after a break in enrollment.
36 The graph shows the probability of disenrolling in each month of a second enrollment spell, broken out by type of program eligibility at the beginning of the spell. Patterns of enrollment for second spells are similar to first spells (see Figure 6). For all programs the probability of disenrolling in a given month of a second spell is small and ranges from less than 0.1% to 3.3%. As in first enrollment spells, with the exception of SSI beneficiaries, the probability of disenrolling clusters around 12-month intervals indicating that disenrollment is highest around times of recertification. However, the probability of disenrolling is somewhat higher in second spells than first. For example, 3.3% of QMBs disenroll at their first annual recertification in a second enrollment spell compared to 1.8% of QMBs disenrolling at recertification in their first enrollment spell. The probability of disenrolling in second spells is also somewhat higher for SLMBs and other Medicaid beneficiaries. This likely reflects the fact that beneficiaries who disenroll once are at greater risk of subsequent disenrollments.
Looking at the survival function results for the cumulative probability of disenrolling from a second episode, in Figure 10, enables us to compare to the disenrollment probabilities from the first episode. In a second episode, SSI beneficiaries are among the least likely to remain enrolled, as are SLMBs, as compared to other Medicare Savings Programs beneficiaries. For a first episode, SSI beneficiaries were the most likely to remain enrolled. The reasons for these differences are unclear, but perhaps the type of SSI beneficiaries who disenroll are more likely to be the ones who cycle between being eligible and not being eligible. Results otherwise are consistent with the disenrollment patterns from the first episode.
36 Although our files contain data on all re-enrollments during our study period, only X% of beneficiaries have
more than two enrollment spells. Therefore, we only present results on the second enrollment spell.
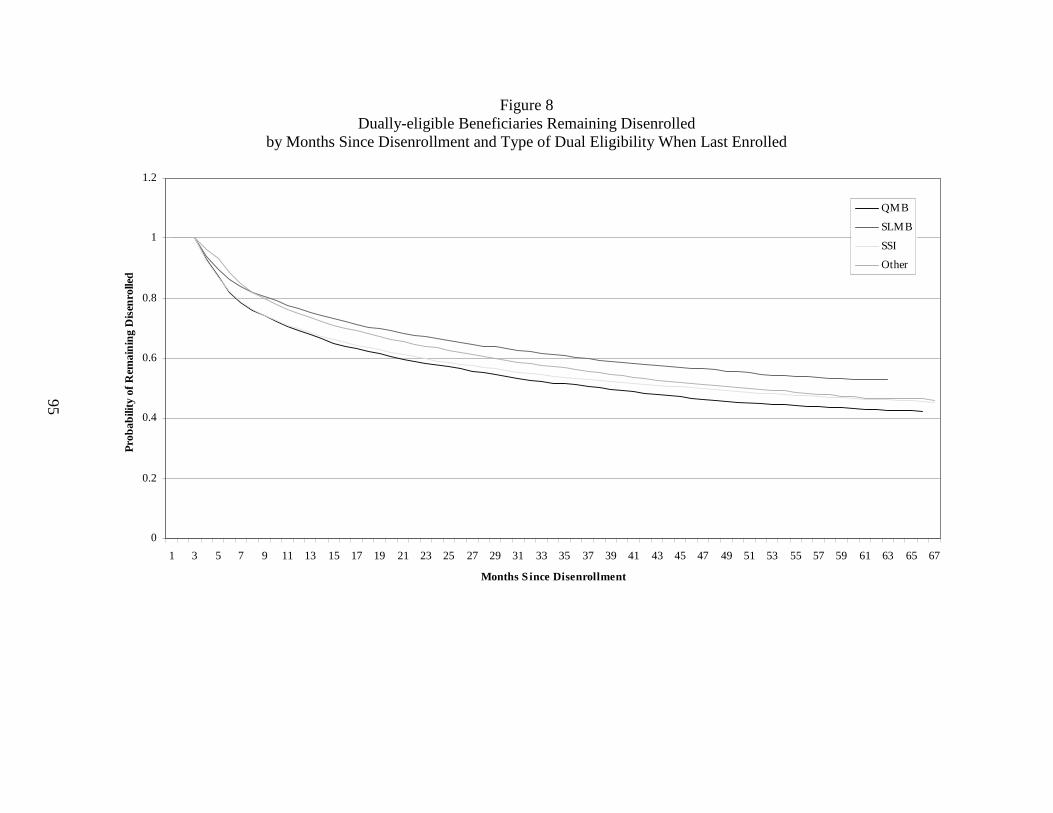
95
Figure 8 Dually-eligible Beneficiaries Remaining Disenrolled
by Months Since Disenrollment and Type of Dual Eligibility When Last Enrolled
0
0.2
0.4
0.6
0.8
1
1.2
1 3 5 7 9 11 13 15 17 19 21 23 25 27 29 31 33 35 37 39 41 43 45 47 49 51 53 55 57 59 61 63 65 67
Months S ince Disenrollment
Prob
abili
ty o
f Rem
ain
ing
Dis
enro
lled
QMB
SLMB
SSI
Other
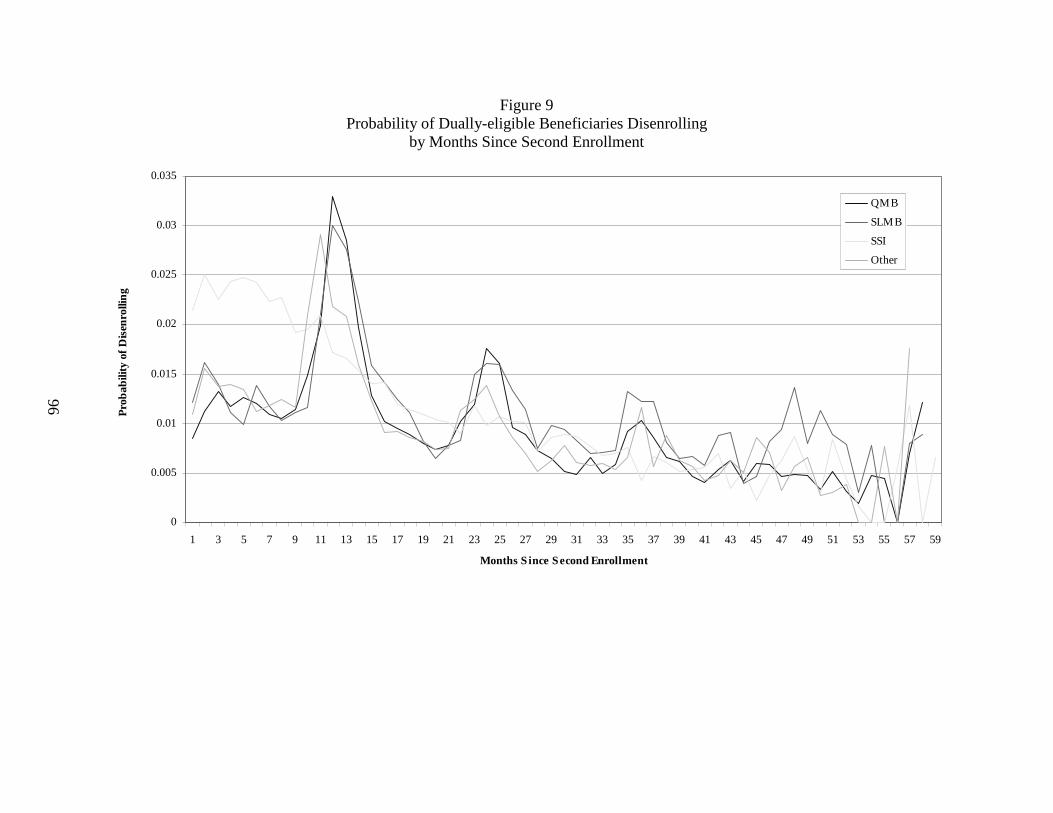
96
Figure 9 Probability of Dually-eligible Beneficiaries Disenrolling
by Months Since Second Enrollment
0
0.005
0.01
0.015
0.02
0.025
0.03
0.035
1 3 5 7 9 11 13 15 17 19 21 23 25 27 29 31 33 35 37 39 41 43 45 47 49 51 53 55 57 59
Months S ince Second Enrollment
Pro
bab
ility
of
Dis
enro
llin
g
QMB
SLMB
SSI
Other

97
Figure 10 Dually-eligible Beneficiaries Remaining Enrolled by Months Since Second Enrollment
0
0.2
0.4
0.6
0.8
1
1.2
1 3 5 7 9 11 13 15 17 19 21 23 25 27 29 31 33 35 37 39 41 43 45 47 49 51 53 55 57 59
Months S ince Enrollment
Pro
bab
ility
of
Rem
aini
ng
Enr
olle
d
QMB
SLMB
SSI
Other
98
4.4 Discussion
The results from these analyses show fairly stable enrollment in the Medicare Savings Programs relative to other categories of Medicaid eligibility. As expected, QMBs and SLMBs remain enrolled for shorter periods than SSI beneficiaries. QMBs and SLMBs show a clear pattern of disenrollment at eligibility redetermination, although the magnitude of the loss at redetermination is small, 2% or less. In contrast, we do not observe this pattern for SSI beneficiaries, for whom there is no regular redetermination cycle. Approximately 7% of QMBs and SLMBs re-enroll by the third month after disenrolling. These are undoubtedly beneficiaries who did not intend to disenroll and would have remained eligible, but either did not complete the paperwork on time or did not understand that they needed to reapply until after their coverage was terminated. The findings that only 2% of beneficiaries drop off at redetermination, and of these, a number re-enroll quickly, suggest that eligibility is quite stable. Given the stability of eligibility, it may be reasonable to consider using passive re-determination for QMBs and SLMBs or SSI-like procedures where eligibility is redetermined only if a beneficiary’s circumstances change. Passive redetermination, however, might not address beneficiaries whose eligibility category changes at redetermination, unless they recognize that their change in circumstance could alter their eligibility. Because of limitations in correctly identifying switching between programs, we cannot address the extent of switching at redetermination.
There are two major limitations to this study. First, it excludes 19 states. The remaining study states are all auto-accrete states where SSI recipients are automatically bought into Medicaid based on their SSI status. Thus, findings for SSI beneficiaries are not nationally representative. It is likely that SSI beneficiaries in auto-accrete states have more stable Medicaid enrollment than those in states that determine Medicaid eligibility separately for SSI recipients. As a result, our findings may overstate the differences in enrollment continuity between SSI beneficiaries and QMBs and SLMBs. We are not able to assess whether enrollment patterns of QMBs and SLMBs in the excluded states differ from those included in our analyses. Second, we are not able to accurately distinguish movement between QMB, SLMB, and “Other” eligibility because of the limitations in the TPEarth file. Therefore, it is likely that there is some error in our classification of beneficiaries by type of program eligibility. Since the results for these eligibility categories follow the expected patterns, it is likely that the impact of any misclassification is minor.
99
CHAPTER 5 STATE VARIATION IN MEDICARE SAVINGS PROGRAMS ENROLLMENT
5.1 Introduction
One of CMS’ initiatives under the Government Performance and Results Act (GPRA) is to increase enrollment in the Medicare Savings Programs, through which Medicaid assists low income Medicare beneficiaries in paying for their Medicare premiums and, in some cases, their deductibles and coinsurance. The Medicare Savings Programs include the Qualified Medicare Beneficiary (QMB), Specified Low-income Medicare Beneficiary (SLMB), Qualifying Individuals (QI-1 and QI-2), and Qualified and Disabled Working Individuals programs. Numerous studies have shown that large numbers of potentially eligible beneficiaries do not participate in the Medicare Savings Programs. These studies, which focus on the QMB and SLMB programs, typically show that somewhere around half of all eligible beneficiaries are not enrolled (Barents Group, 1999; GAO, 1994 and 1999; Rosenbach and Lamphere, 1999; Families USA, 1998; Moon, et al., 1996), although one study estimated a 64% participation rate (Moon, et al., 1998). Studies have also shown substantial variation in participation rates across states (Rosenbach and Lamphere, 1999; Families USA, 1998).
Because of data and other limitations, few past studies of QMB and SLMB enrollment have been able to determine the underlying reasons for low enrollment rates. It is widely believed that enrollment rates are low, in part, because states have not emphasized outreach activities (Rosenbach and Lamphere, 1999; Nemore, 1997; Shaner, 1999; GAO, 1999). The implicit premise is that qualified, but unenrolled, Medicare beneficiaries are not aware of the Medicare Savings Programs and that outreach is an effective method by which to increase both awareness and enrollment. Indeed, as found by Neumann, et al. (1994) and the beneficiary survey conducted as part of this study, the vast majority of Medicare beneficiaries who are eligible for the QMB and SLMB programs, but not enrolled, have never heard of them. Recent focus group findings indicate that eligible Medicare beneficiaries want to enroll in the Medicare Savings Programs once they know more about them (Perry, Kannel, and Dulio, 2002). An early study using MCBS data (Neumann, et al., 1994), found that Medicare beneficiaries residing in states that undertook more outreach activities, were more likely to have enrolled in the QMB program. However, other studies (GAO, 1994; Shaner, 1999) found little evidence of an association between outreach activities and participation rates.
The purpose of this study is to provide empirical evidence on the effect of state outreach activities and other factors on enrollment in the QMB and SLMB programs, or the programs’ “takeup rate.” As discussed in further detail in Section 5.3.1, the takeup rate, which varies from 0 to 1, is the proportion of eligible beneficiaries who are enrolled in the QMB and SLMB programs. Our analyses draw on state-level data on enrollment rates in the QMB and SLMB programs for a three-year period (1999-2001), as well as survey data on state outreach efforts and other policies related to QMB and SLMB enrollment during this time period. In addition, we include data on other Medicaid program characteristics and state socio-economic characteristics expected to influence program enrollment. Unlike other parts of the research conducted under our contract with CMS to evaluate the QMB and SLMB programs, these analyses include beneficiaries who are eligible for full Medicaid benefits as Supplemental Security Income (SSI) or medically needy (MN) recipients. We would have preferred to exclude these traditional full benefit dually eligible beneficiaries from our analyses because we expect
100
that outreach activities will have less of an impact on their enrollment than that of other QMBs and SLMBs. However this was not possible because of data limitations discussed later in this chapter. Therefore, in this chapter, we include SSI and MN beneficiaries when we refer to the QMB and SLMB programs.
Our study addressed the following questions:
• What are the factors that affect state variation in QMB/SLMB enrollment rates?
• Do outreach activities affect QMB/SLMB enrollment rates? If so,
– Controlling for the effect of other factors, how much do the outreach activities affect QMB/SLMB enrollment rates?
– Which types of outreach activities have the largest effect on QMB/SLMB enrollment rates?
– Do individual activities have an impact on QMB/SLMB enrollment rates or is the aggregate scope of efforts more important?
We had hoped to measure the impact of the intensity of outreach activities on enrollment rates, as well as the impact of efforts specifically targeted to QMBs and SLMBs not covered by the traditional full benefit dual eligible categories (i.e., SSI and MN); however, this was not possible because of data limitations.
The key findings from our analyses are summarized below.
State Outreach Efforts
• State outreach efforts generally increased from 1999 to 2001.
• The number of states using printed materials for outreach increased from 31 in 1999 to 43 in 2001.
• The number of states using live presentations for outreach increased from 28 in 1999 to 42 in 2001.
• Almost all states formed some type of partnership with other state agencies, federal agencies, or local organizations to promote outreach.
• States took some major steps towards simplifying the application, enrollment, and eligibility process during this period. For instance, the number of states using a shortened application form for QMB/SLMB benefits increased from 18 in 1999 to 38 in 2001.
101
Takeup Rates
• Takeup rates in 2001 ranged from 0.26 in New Hampshire and North Dakota to 0.88 in California.
• The national average takeup rate increased from 0.62 in 1999 to 0.64 in 2001.
• Takeup rates decreased in 15 states and increased in 36 states between 1999 and 2001.
Impact of Outreach Activities on Takeup Rates
• In the descriptive analyses, there were 71 types of outreach activities for which comparisons were performed for each of 3 years, a total of 212 comparisons. The difference in mean takeup rates was statistically significant in 36 (17%) out of the 212 comparisons. Of these, the mean takeup rate was higher in states that performed outreach in only 3 instances and lower in 33.
• Multivariate analyses also showed that differences in outreach activities did not explain the variation in state take-up rates.
The findings may be due to:
• Reverse causality. It is possible that there is an additional causal relationship between outreach and enrollment that moves in the opposite direction of the relationship tested in these analyses, i.e., a state’s takeup rate affects the likelihood that it will perform outreach activities rather than vice versa. While we could not test for this relationship, there are reasons to believe it is plausible. First, performing outreach is not costless. Only those states most likely to perceive a benefit from these activities (i.e., those with low takeup) are likely to invest in them. Second, as part of its GPRA initiative, CMS established a goal for each state of increasing enrollment of dual eligibles by 4%. For states that did not achieve 4% growth, CMS took into account performance of outreach activities as reported in the state outreach survey in determining whether a state had met its GPRA goal. States with low takeup rates might have undertaken outreach activities in order to satisfy CMS’ requirements.
• Large number of variables tested. Because of the large number of variables tested, a certain number of significant results are expected by random chance alone. For example, of the 212 variables tested in the descriptive analyses, approximately 11 will be significant due to random chance at the p=.05 level of statistical significance. Thus, it is possible that some of our significant results do not reflect a true association between outreach activities and program enrollment.
There are a number of limitations to our study that may explain the preponderance of insignificant results in our analyses. These include:
• Limited time period for the study. There were only three years of data available for our study. This period may not have allowed adequate time to observe the impact of increasing outreach activities. In addition, because the state is the unit of observation,
102
the sample size was small even in the panel data analyses that incorporated all three years of data.
• Limited variation in key variables. Variation in the takeup rate and in the explanatory variables in our models was limited in a number of states during the three-year study period. In particular, for 20 states takeup rates changed less than two percentage points between 1999 and 2001.
• Lagged relationship between outreach and enrollment. The impact of new outreach initiatives on enrollment might not be observed in the year in which the outreach activities are implemented. Although the analyses presented in this chapter look at the relationship between concurrent outreach efforts and enrollment, we also tested the relationship between enrollment and prior year outreach. Findings from the lagged analyses were similar to those using concurrent outreach and enrollment variables.
• Intensity of outreach effort. Our analyses mainly used simple binary variables to indicate whether a state had undertaken a particular outreach activity in a given year. Although we had hoped to measure intensity of outreach efforts, this was not possible based on the responses to the state outreach survey. As a result, our outreach variables may not have been refined enough to accurately identify enrollment impacts.
• Errors in measurement of takeup rates. It is quite difficult to reliably estimate the number of Medicare beneficiaries that qualify for buy-in status, particularly for the QMB, SLMB, and MN programs. As a result, our takeup rates may not be accurate.
• Inclusion of SSI and MN in takeup rates. We expect that SSI and MN enrollment will be less affected by outreach activities than will QMB and SLMB enrollment. As a result, inclusion of SSI and MN beneficiaries in the takeup rate dilutes the impact of outreach activities on enrollment and biases our analyses toward insignificant findings.
• Quality of state outreach survey data. The quality of some of the responses to the state outreach survey was poor. Errors in measuring the outreach variables could bias our analyses toward insignificant findings.
Section 5.2 presents the theoretical framework that underlies the analyses. Section 5.3 discusses the data used in the analyses. Section 5.4 discusses the methodological approaches used to determine if there is an association between state outreach activities and the enrollment or takeup rate. Section 5.5 presents the descriptive analyses, while Section 5.6 presents the multivariate analyses. The final section summarizes and discusses the analytical results.
5.2 Theoretical Background
Our empirical analyses of state variation in QMB and SLMB program takeup rates include three groups of explanatory variables:
• State outreach activities;
• State socio-economic characteristics; and
103
• State Medicaid program characteristics.
The primary purpose of these analyses is to determine the impact of outreach activities on program enrollment. Outreach activities are defined broadly to include policies related to the QMB and SLMB programs expected to impact enrollment, such as application and redetermination procedures. However, we assume that other factors may also affect QMB and SLMB program enrollment. It is important to control for any such factors in order to accurately estimate the independent impact of outreach activities. Below we discuss the rationale for the inclusion of variables other than those related to outreach activities in our analyses. The specific variables included are discussed in Section 5.3.
The median voter model provides the theoretical framework for identifying the socio-economic factors that may contribute to state variation in QMB and SLMB takeup rates. The median voter model was developed to explain differences in the behavior of democratically-elected governments (Atkinson and Stiglitz, 1980). In the U.S., elections are often decided by a simple majority. The hypothetical voter “responsible” for attaining the 50% majority is referred to as the “median voter.” The median voter model then assumes that the characteristics of the hypothetical median voter affect the behavior of government.
The median voter model treats the hypothetical median voter as a consumer of private and public goods. The preferences and attitudes of the median voter, as constrained by the resources available to the voter (i.e., income and assets) and the relative prices of private and public goods, determine the mix of private and public goods. Therefore, empirical work explaining government behavior should include variables that reflect voter preferences, resources, and prices.
Voter preferences are likely to be influenced by the demographic mix of the population (e.g., the elderly share of the population) and its political attitudes (e.g., liberal versus conservative). Resource constraints are reflected by variables such as income, poverty, and the local economy. If public services, including the provision of welfare benefits and in-kind benefits, are normal goods, then the median voter model predicts that the states with higher per capita income should have higher per capita takeup rates holding poverty levels constant. Welfare and in-kind benefits, however, do not completely fit the description of classic public goods such as transportation. For instance, in states with high per capita incomes, there should be fewer poor persons that need Medicaid coverage. To control for this possibility, a measure of the income distribution (e.g., the poverty rate) should also be included.
The median voter model also predicts that the price of providing benefits to QMBs and SLMBs may have an impact on program enrollment. The federal government shares in states’ Medicaid spending through the Federal Medical Assistance Percentage (FMAP). For each dollar a state spends on Medicaid, the federal government, through FMAP, gives a state between 0.50 dollars and 0.76 dollars. For a state with a FMAP of 0.60, for example, the federal government gives the state 60 cents for every dollar spent by the state on Medicaid-covered services. The state, then, only needs to pay 40 cents for every dollar of total expenditures, a reduction of 60% in the effective price of Medicaid-covered services. Thus, through FMAP, the price of Medicaid-covered expenditures (including QMB and SLMB) is lowered to states. The federal government sets the lowest FMAP rates for the richest states (e.g., Massachusetts and New York) and the highest rates for the poorest states (e.g., Mississippi and West Virginia). The
104
median voter model predicts, ceteris paribus, that a lower price of Medicaid-covered services results in a higher demand for these services.
Our model also includes characteristics of Medicaid and other programs for low-income populations that are expected to affect QMB and SLMB takeup either directly or indirectly. The full set of Medicaid program characteristics included in our model is described in Section 5.3.
Program characteristics related to the breadth of benefits or eligibility standards might directly affect enrollment in the QMB and SLMB programs. For example, extending full Medicaid benefits to all QMBs should increase the value of the benefit and encourage enrollment in the program. As another example, states with Medicaid eligibility criteria that are more restrictive than SSI criteria (§209(b) states) are expected to have lower enrollment rates.
In addition to state Medicaid program characteristics that are expected to directly affect takeup rates, other Medicaid program characteristics might indirectly affect takeup rates. Prior research has shown there are subtle interactions between components of state Medicaid programs (Cromwell, et al., 1994 and 1997). For example, if populations compete for limited Medicaid budget dollars, states that have more generous programs for women and children may have lower enrollment in the QMB and SLMB programs. Alternatively, generous coverage of women and children may be associated with overall generosity to low income populations and higher QMB and SLMB takeup.
5.3 Data
Four types of data are reviewed in this section: (1) data used to construct the takeup rate; (2) data on state outreach activities, enrollment processes, and eligibility criteria; (3) data on other Medicaid program characteristics; and (4) data on state socio-economic characteristics.
5.3.1 Takeup Rate
The takeup rate is defined as the proportion of all Medicare beneficiaries who are eligible for the QMB and SLMB programs that are enrolled in the programs. The numerator of the takeup rate is the number of qualifying Medicare beneficiaries that actually receive QMB and SLMB benefits. The denominator of the takeup rate is the number of Medicare beneficiaries that qualify for QMB and SLMB benefits. Thus, the takeup rate can range from 0 to 1.
As specified by CMS, the denominator for our takeup rate is an estimate of the number of Medicare beneficiaries potentially eligible for full Medicaid (i.e., SSI and MN), QMB, or SLMB, which was developed by Actuarial Research Corporation (ARC) under a separate contract from CMS. It includes Medicare beneficiaries with incomes up to 120% of the federal poverty level (FPL) after standard SSI income disregards. The estimate also takes into account the asset restrictions for the various programs. ARC used three years of Current Population Survey (CPS) data (March 1996, 1997, and 1998 data covering calendar years 1995, 1996, and 1997) to generate its estimates. These data were aged forward to produce estimates for later years, including the estimates for 1999-2001 used in our analyses. ARC supplemented the CPS data with Medicare Current Beneficiary Survey (MCBS) and Survey of Income and Program Participation (SIPP) data to generate its estimates.
105
The numerator for our analyses is calculated from CMS’ Third Party Buy-in (TPEarth) file. This is the database CMS uses to bill state Medicaid programs for the Part B premiums they have “bought into”, i.e., the Part B premiums they have agreed to pay on behalf of their dually eligible beneficiaries. Consistent with ARC’s denominator, our numerator includes SSI, MN, QMB, and SLMB beneficiaries reported in the TPEarth.
As noted earlier, we would have preferred to exclude SSI and MN beneficiaries from these analyses because we expect that their enrollment is less likely to be influenced by outreach activities. Most states (known as §1634 or auto-accrete states) have an agreement with the Social Security Administration (SSA) to automatically buy all SSI recipients into Medicaid. In these states, Medicaid buy-in does not require any action by SSI beneficiaries and should be virtually 100%. Enrollment of MN beneficiaries is likely to be triggered by health events leading to institutionalization or other sources of high health care expenditures.
However, it was not possible to exclude these traditional full benefit dually eligible beneficiaries from our analyses for several reasons. First, full benefit dual eligibles were included in ARC’s denominator. Therefore, in order to maintain consistency, they had to be included in the numerator. Second, our analysis of the TPEarth files showed that SSI and QMB beneficiaries could not be reliably distinguished in ten states. Finally, the data on state outreach activities used in our analyses were typically reported for dually eligible beneficiaries generally, not specifically for QMB or SLMB outreach.
5.3.2 State Outreach Activities, Enrollment Processes, and Eligibility Criteria
A survey of state Medicaid Offices on activities during each of Fiscal Years 1999 through 2001 was conducted, in part, to inform our analysis of whether differences in outreach activities, enrollment processes, and eligibility criteria explain variation in takeup rates across states. In addition, CMS used the survey as part of its assessment of whether states met their Government Performance Results Act (GPRA) goal for increasing enrollment of dual eligibles. Each of CMS’ Regional Offices (RO) either interviewed the state Medicaid Offices in its region by telephone or mailed them the survey instrument for completion. The instruments were then returned to the CMS Central Office. In some instances, follow-up was conducted by either the RO, the CMS Central Office, or by the American Public Human Services Association (APHSA).
Survey Instrument - State outreach activities were classified into six categories in the survey instrument:
• Dual Eligible Information Dissemination and Provision. The types of activities covered in this section of the outreach survey included information dissemination and provision activities such as letters, pamphlets, posters, newspaper notices, radio and TV broadcasts, live presentations, internet pages or links, dedicated telephone hotlines, training of outreach workers, and targeting of minority populations.
• Dual Eligible-Specific Partnership Efforts of State Medicaid Agencies. The types of activities covered in this section of the outreach survey included outreach partnerships that state Medicaid agencies formed with other state agencies, federal agencies, local government, the provider community, advocacy organizations (e.g., AARP), and miscellaneous groups (e.g., senior volunteers).
106
• Provider Access. The topics in this section were included to test whether the perceived benefits of enrolling in the Medicare Savings Programs affected beneficiary proclivity to enroll. State Medicaid policies for covering Medicare cost-sharing payments might affect potential dual eligibles’ perceptions of the value of the benefits from enrolling in the Medicare Savings Programs, particularly for the traditional full benefit eligibility categories and QMBs that receive assistance covering Medicare copayments and deductibles. States have flexibility in what they pay toward Medicare cost-sharing for dually eligible beneficiaries. A growing number of states have opted to not reimburse providers for the full cost-sharing amount, especially if the Medicare payment is at least as great as what Medicaid would have paid for the service. In these states, dual eligibles may have difficulties in gaining access to health care due to the lower payments to providers. Potential dual eligibles, thus, might be less likely to apply for benefits if they believe that physicians are reluctant to provide services to beneficiaries who receive Medicaid benefits. In addition, providers may be less likely to encourage their Medicare patients to apply for Medicaid if they are dissatisfied with cost-sharing reimbursement. Program enrollment may also be lower if fewer physicians participate in Medicaid or if delays in processing claims discourage providers from accepting Medicaid patients.
• Leads Data. This section was concerned with the coordination between the federal government and state governments in the enrollment of SSI beneficiaries in Medicaid, and particularly the use of data to identify potential SSI-eligible buy-in enrollees. Specific data sources include Leads Data, which can be provided by the SSA to states to identify new Social Security recipients that have incomes less than 100% of the federal poverty level; the State Data Exchange (SDX), which is provided by the SSA and includes SSI data; and having a §1634 Agreement with SSA, which allows automatic enrollment of SSI recipients into Medicaid.
• Dual Eligible-Specific Application, Enrollment, and Eligibility Process. Four broad topic areas are covered in this section: application length, application availability, application submission procedures, and eligibility determination standards. The first three areas address the extent to which states have adopted policies that simplify the Medicare Savings Programs application process, while the last area looks at policies that relax eligibility standards and requirements for eligibility determination.
• Redetermination. The topics in this section deal with the ease by which dual beneficiaries can re-enroll in Medicaid. States were asked whether they allow automatic redetermination at re-enrollment, whether they require an in-person interview, and whether they use shortened versus full application forms.
For each type of outreach activity, responses were requested for three specific target audiences: (1) general (all dual eligibles), (2) QMB-only sub-group, and (3) SLMB-only sub-group. In addition, provision was made for “other” sub-groups of dual eligibles that states might target for outreach. Three types of responses were requested from states regarding their outreach activities: (1) expenditures (EX), (2) number of items distributed or occasions an outreach activity was performed (#), and (3) whether or not they perform the activity (yes/no). The full survey instrument is included in Appendix H.
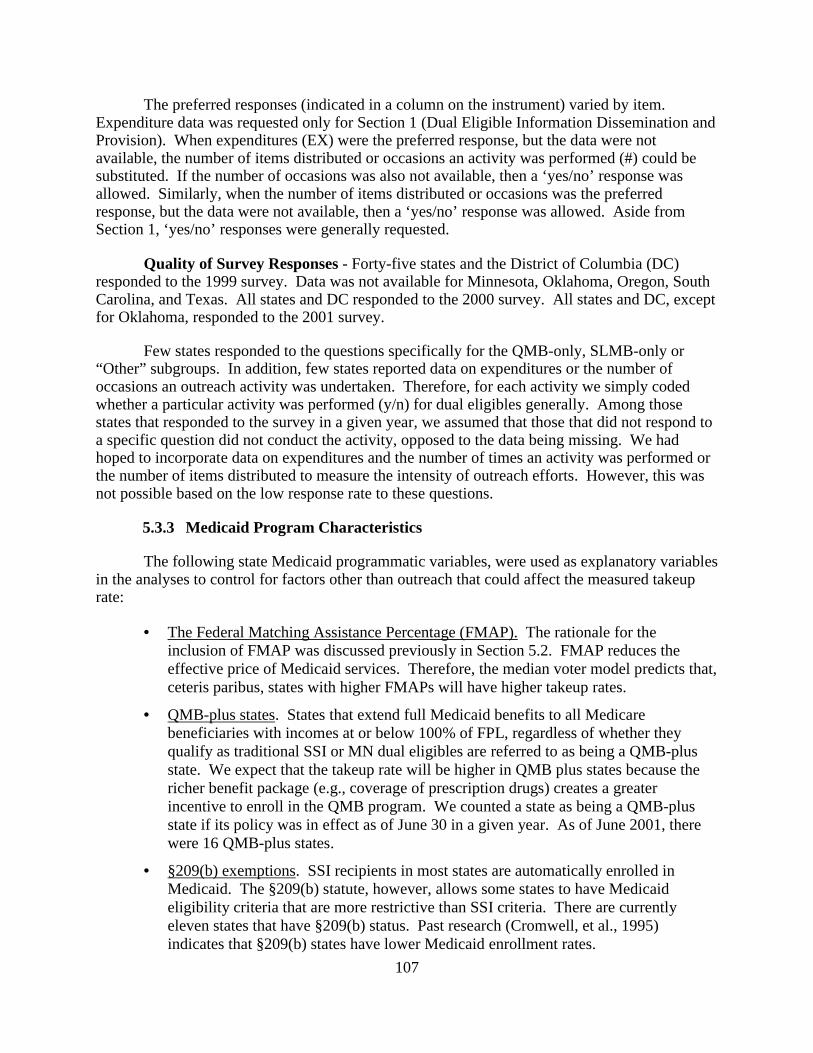
107
The preferred responses (indicated in a column on the instrument) varied by item. Expenditure data was requested only for Section 1 (Dual Eligible Information Dissemination and Provision). When expenditures (EX) were the preferred response, but the data were not available, the number of items distributed or occasions an activity was performed (#) could be substituted. If the number of occasions was also not available, then a ‘yes/no’ response was allowed. Similarly, when the number of items distributed or occasions was the preferred response, but the data were not available, then a ‘yes/no’ response was allowed. Aside from Section 1, ‘yes/no’ responses were generally requested.
Quality of Survey Responses - Forty-five states and the District of Columbia (DC) responded to the 1999 survey. Data was not available for Minnesota, Oklahoma, Oregon, South Carolina, and Texas. All states and DC responded to the 2000 survey. All states and DC, except for Oklahoma, responded to the 2001 survey.
Few states responded to the questions specifically for the QMB-only, SLMB-only or “Other” subgroups. In addition, few states reported data on expenditures or the number of occasions an outreach activity was undertaken. Therefore, for each activity we simply coded whether a particular activity was performed (y/n) for dual eligibles generally. Among those states that responded to the survey in a given year, we assumed that those that did not respond to a specific question did not conduct the activity, opposed to the data being missing. We had hoped to incorporate data on expenditures and the number of times an activity was performed or the number of items distributed to measure the intensity of outreach efforts. However, this was not possible based on the low response rate to these questions.
5.3.3 Medicaid Program Characteristics
The following state Medicaid programmatic variables, were used as explanatory variables in the analyses to control for factors other than outreach that could affect the measured takeup rate:
• The Federal Matching Assistance Percentage (FMAP). The rationale for the inclusion of FMAP was discussed previously in Section 5.2. FMAP reduces the effective price of Medicaid services. Therefore, the median voter model predicts that, ceteris paribus, states with higher FMAPs will have higher takeup rates.
• QMB-plus states. States that extend full Medicaid benefits to all Medicare beneficiaries with incomes at or below 100% of FPL, regardless of whether they qualify as traditional SSI or MN dual eligibles are referred to as being a QMB-plus state. We expect that the takeup rate will be higher in QMB plus states because the richer benefit package (e.g., coverage of prescription drugs) creates a greater incentive to enroll in the QMB program. We counted a state as being a QMB-plus state if its policy was in effect as of June 30 in a given year. As of June 2001, there were 16 QMB-plus states.
• §209(b) exemptions. SSI recipients in most states are automatically enrolled in Medicaid. The §209(b) statute, however, allows some states to have Medicaid eligibility criteria that are more restrictive than SSI criteria. There are currently eleven states that have §209(b) status. Past research (Cromwell, et al., 1995) indicates that §209(b) states have lower Medicaid enrollment rates.
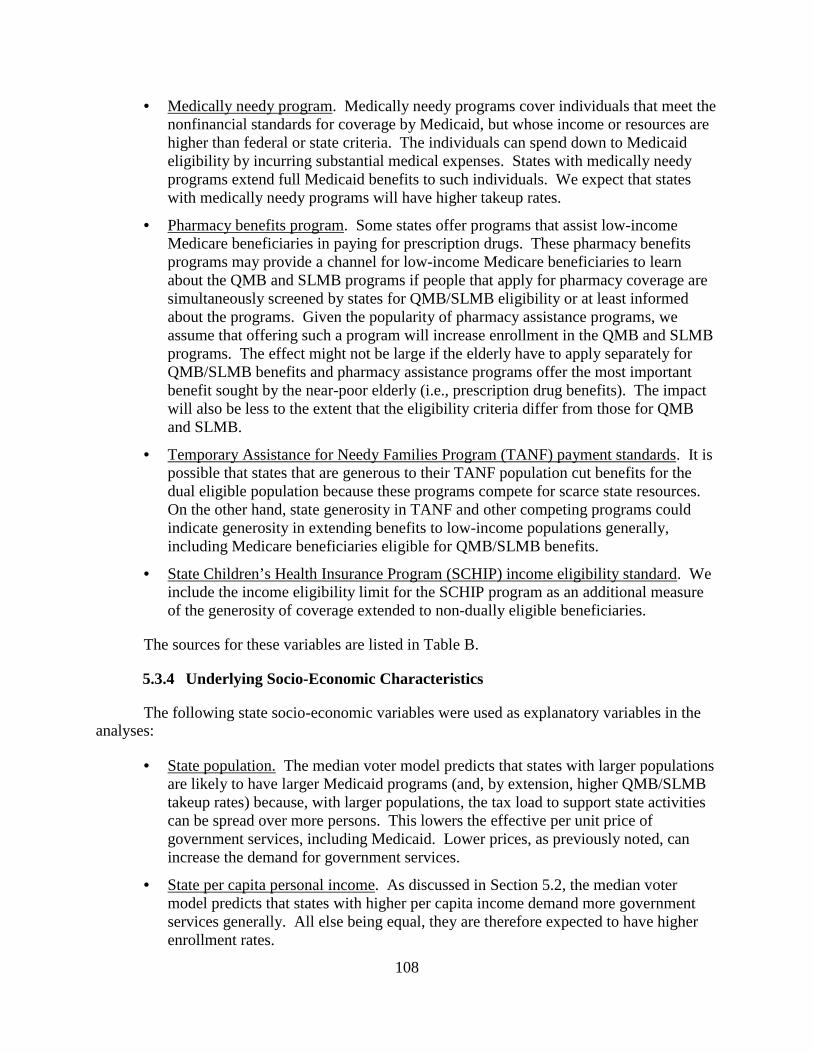
108
• Medically needy program. Medically needy programs cover individuals that meet the nonfinancial standards for coverage by Medicaid, but whose income or resources are higher than federal or state criteria. The individuals can spend down to Medicaid eligibility by incurring substantial medical expenses. States with medically needy programs extend full Medicaid benefits to such individuals. We expect that states with medically needy programs will have higher takeup rates.
• Pharmacy benefits program. Some states offer programs that assist low-income Medicare beneficiaries in paying for prescription drugs. These pharmacy benefits programs may provide a channel for low-income Medicare beneficiaries to learn about the QMB and SLMB programs if people that apply for pharmacy coverage are simultaneously screened by states for QMB/SLMB eligibility or at least informed about the programs. Given the popularity of pharmacy assistance programs, we assume that offering such a program will increase enrollment in the QMB and SLMB programs. The effect might not be large if the elderly have to apply separately for QMB/SLMB benefits and pharmacy assistance programs offer the most important benefit sought by the near-poor elderly (i.e., prescription drug benefits). The impact will also be less to the extent that the eligibility criteria differ from those for QMB and SLMB.
• Temporary Assistance for Needy Families Program (TANF) payment standards. It is possible that states that are generous to their TANF population cut benefits for the dual eligible population because these programs compete for scarce state resources. On the other hand, state generosity in TANF and other competing programs could indicate generosity in extending benefits to low-income populations generally, including Medicare beneficiaries eligible for QMB/SLMB benefits.
• State Children’s Health Insurance Program (SCHIP) income eligibility standard. We include the income eligibility limit for the SCHIP program as an additional measure of the generosity of coverage extended to non-dually eligible beneficiaries.
The sources for these variables are listed in Table B.
5.3.4 Underlying Socio-Economic Characteristics
The following state socio-economic variables were used as explanatory variables in the analyses:
• State population. The median voter model predicts that states with larger populations are likely to have larger Medicaid programs (and, by extension, higher QMB/SLMB takeup rates) because, with larger populations, the tax load to support state activities can be spread over more persons. This lowers the effective per unit price of government services, including Medicaid. Lower prices, as previously noted, can increase the demand for government services.
• State per capita personal income. As discussed in Section 5.2, the median voter model predicts that states with higher per capita income demand more government services generally. All else being equal, they are therefore expected to have higher enrollment rates.
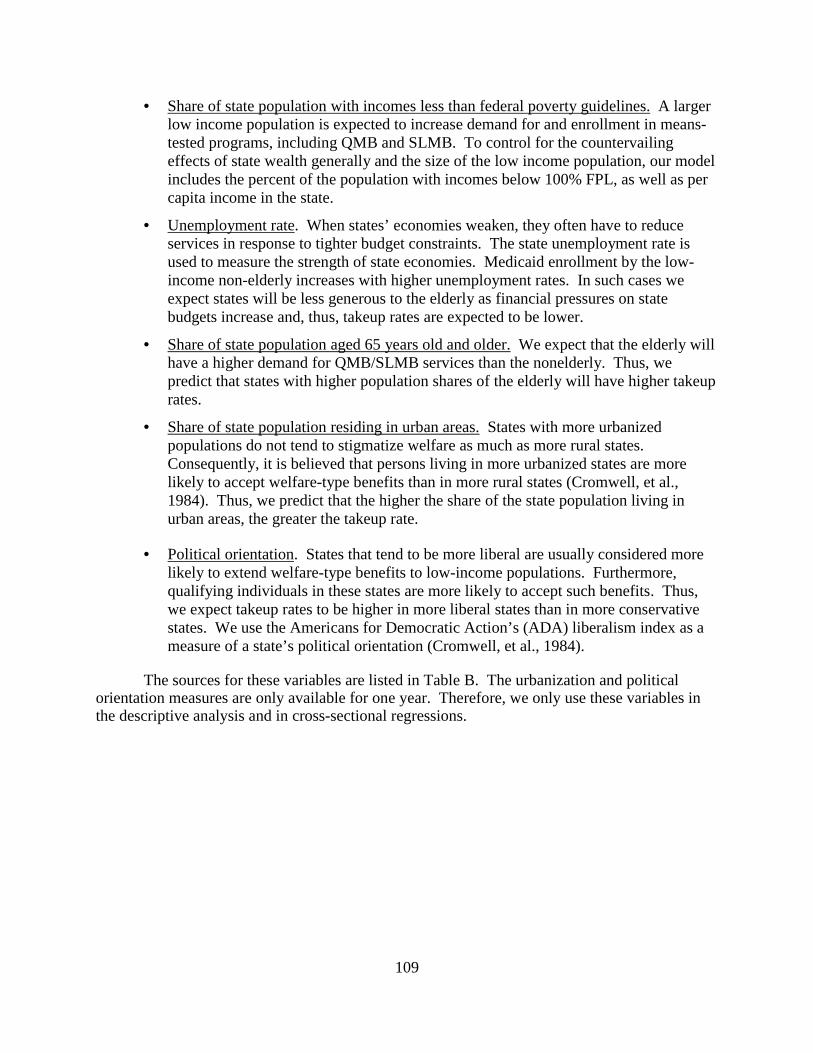
109
• Share of state population with incomes less than federal poverty guidelines. A larger low income population is expected to increase demand for and enrollment in means-tested programs, including QMB and SLMB. To control for the countervailing effects of state wealth generally and the size of the low income population, our model includes the percent of the population with incomes below 100% FPL, as well as per capita income in the state.
• Unemployment rate. When states’ economies weaken, they often have to reduce services in response to tighter budget constraints. The state unemployment rate is used to measure the strength of state economies. Medicaid enrollment by the low-income non-elderly increases with higher unemployment rates. In such cases we expect states will be less generous to the elderly as financial pressures on state budgets increase and, thus, takeup rates are expected to be lower.
• Share of state population aged 65 years old and older. We expect that the elderly will have a higher demand for QMB/SLMB services than the nonelderly. Thus, we predict that states with higher population shares of the elderly will have higher takeup rates.
• Share of state population residing in urban areas. States with more urbanized populations do not tend to stigmatize welfare as much as more rural states. Consequently, it is believed that persons living in more urbanized states are more likely to accept welfare-type benefits than in more rural states (Cromwell, et al., 1984). Thus, we predict that the higher the share of the state population living in urban areas, the greater the takeup rate.
• Political orientation. States that tend to be more liberal are usually considered more likely to extend welfare-type benefits to low-income populations. Furthermore, qualifying individuals in these states are more likely to accept such benefits. Thus, we expect takeup rates to be higher in more liberal states than in more conservative states. We use the Americans for Democratic Action’s (ADA) liberalism index as a measure of a state’s political orientation (Cromwell, et al., 1984).
The sources for these variables are listed in Table B. The urbanization and political orientation measures are only available for one year. Therefore, we only use these variables in the descriptive analysis and in cross-sectional regressions.
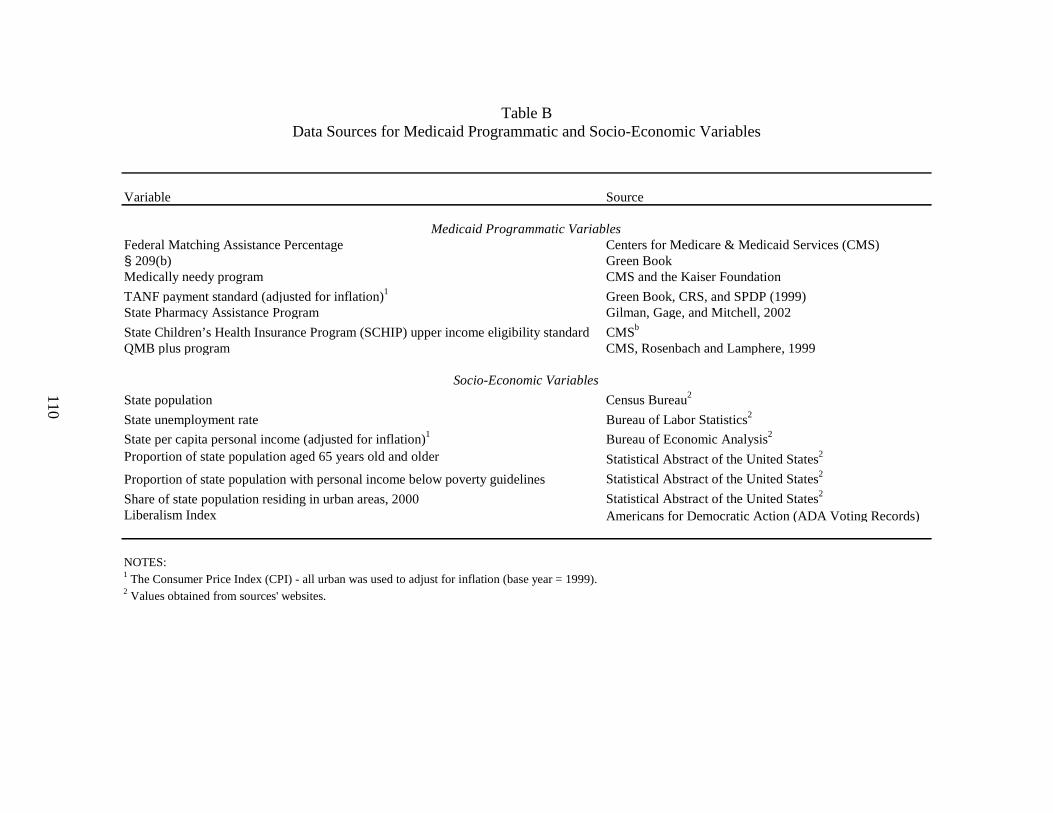
110
Table B Data Sources for Medicaid Programmatic and Socio-Economic Variables
Variable Source
Medicaid Programmatic VariablesFederal Matching Assistance Percentage Centers for Medicare & Medicaid Services (CMS)§ 209(b) Green BookMedically needy program CMS and the Kaiser Foundation
TANF payment standard (adjusted for inflation)1 Green Book, CRS, and SPDP (1999)State Pharmacy Assistance Program Gilman, Gage, and Mitchell, 2002
State Children’s Health Insurance Program (SCHIP) upper income eligibility standard CMSb
QMB plus program CMS, Rosenbach and Lamphere, 1999
Socio-Economic Variables
State population Census Bureau2
State unemployment rate Bureau of Labor Statistics2
State per capita personal income (adjusted for inflation)1 Bureau of Economic Analysis2
Proportion of state population aged 65 years old and older Statistical Abstract of the United States2
Proportion of state population with personal income below poverty guidelines Statistical Abstract of the United States2
Share of state population residing in urban areas, 2000 Statistical Abstract of the United States2
Liberalism Index Americans for Democratic Action (ADA Voting Records)
NOTES:1 The Consumer Price Index (CPI) - all urban was used to adjust for inflation (base year = 1999).2 Values obtained from sources' websites.
111
5.4 Statistical Methods
Both descriptive and multivariate analyses were performed. Descriptive analyses compared state mean takeup rates in the QMB and SLMB programs by outreach activity and other QMB/SLMB program policies; other Medicaid program characteristics; and state socio-economic characteristics. The descriptive analyses were conducted for each of the three years included in our study (1999 through 2001). The explanatory variables used in the descriptive analyses were defined as binary variables. Most of the outreach variables, as did several of the Medicaid programmatic variables, used a “yes/no” classification. For the rest of the variables (usually continuously measured), states were usually classified as “above average” or “below average” where the median was used as a measure of the average.
Multivariate analyses were performed to isolate the individual effects of outreach activities and QMB and SLMB program policies, controlling for other Medicaid program and socio-economic characteristics. We conducted panel data analyses to take advantage of the fact that three years of data were available, which substantially increased the sample size compared to a simple cross-sectional model. In addition, because they use multiple years of data, the panel data analyses can reflect the possibility that the relationship between outreach and takeup varied over time as the states engaged in specific outreach activities changed.
Two types of panel models can be estimated: fixed effects and random effects models. These models differ in their assumptions about how unmeasured differences between states (i.e., differences that are not captured in our set of independent variables) might affect the takeup rate. Fixed effects models assume that the effect of any unmeasured differences across states do not change over time. Random effects models allow the effect of these differences to vary over time. These differing assumptions are reflected in the error terms for the two models. We preferred the random effects model to the fixed effects because it makes less restrictive assumptions about the error term. An additional disadvantage of the fixed effects model is that they must include 51 state dummy variables. This uses a substantial number of degrees of freedom, which is a serious concern given the small sample size. However, we estimated both types of models to test the sensitivity of our results to these assumptions.
We also estimated individual cross-section equations, one for each year, in order to investigate the impact of certain factors that were invariant over time (e.g., having a medically needy program and political orientation). Typically panel models cannot be estimated including variables whose values do not change over time. However, these cross-sectional models were limited by the small number of observations (a maximum of 51 in each year, corresponding to the number of states).
Variables from the state survey representing provider access were not included in any of the multivariate models because the response rates to these specific questions were very low. Inclusion of these variables would have resulted in even fewer observations available for the regressions, with a consequent loss of degrees of freedom. We were also concerned that the states that did respond to these questions might not have been representative of the states that did not respond.
Even with the exclusion of the provider access variables, there were 81 outreach variables that could be tested in the multivariate equations. After including Medicaid program and state
112
socio-economic characteristics, it would have been impossible to estimate a model including all of these variables or even a limited subset without a drastic loss of degrees of freedom given the small number of observations available for our analyses (even in the panel models). Additionally, there is likely to be considerable collinearity between the outreach variables. Consequently, separate regressions were estimated for each outreach activity, entering a single outreach variable along with the variables for Medicaid program and socio-economic characteristics.
In addition, we estimated regressions using aggregate measures of outreach activities to examine the possibility that it is the scope of outreach activities that affects takeup rates, rather than individual outreach activities. While we would have liked to measure the intensity of outreach activities more directly, as described previously, this was not possible based on the responses provided in the state outreach survey. We developed several alternate specifications for our measure of aggregate outreach activities. The count of basic information activities variable is based on three information dissemination activities: (1) any use of printed materials, (2) any use of broadcast media, and (3) any live presentations. The variable ranges in value from zero to three. The count of liberalized eligibility determination variable is a count of how many of the five types of liberalized eligibility determination procedures included in the survey were adopted by each state and ranges in value from 0 to 5. The count of application form liberalization is based on the following activities: (1) has a shorter application form for dual eligibles; (2) the application form is available by mail, through providers, through community organizations, or on line via the Internet; and (3) applications are accepted by mail, through provider/community organizations, by phone, by FAX, or on line via the Internet. The variable ranges in value from zero to three. The count of liberalized eligibility determination and application form liberalization variable is a combination of the two preceding count variables and ranges in value from zero to eight. The last count variable, count of basic information and eligibility/application liberalization activities, is the sum of the previous count variables plus whether the state uses automatic redetermination and ranges from 0 to 11. Finally, we analyzed a binary variable, any liberalized eligibility determination, which measures whether any of the five types of liberalized eligibility determination procedures was adopted by a state.
5.5 Descriptive Results
Three types of results are presented in this section: (1) state takeup rates; (2) state outreach activities based on responses to the state outreach survey; and (3) comparisons of takeup rates by whether a state performs a specific outreach activity, Medicaid program characteristics, and state socio-economic characteristics. All descriptive analyses are presented by year for 1999-2001.
5.5.1 State Takeup Rates
State takeup rates by year are shown in Table 17. In 1999, North Dakota and New Hampshire had the lowest rate at 0.23 (23%) and California had the highest rate at 0.88. In 2000, New Hampshire had the lowest takeup rate at 0.23 and California had the highest rate at 0.87. In 2001, New Hampshire and North Dakota again had the lowest takeup rate at 0.26 and California again had the highest rate at 0.88.
113
The unweighted mean state takeup rate was 0.58 in 1999 and 2000. This increased to 0.59 in 2001. The weighted mean state takeup rates (where the number of potential eligibles serves as the weights) increased from 1999 through 2001 and were, respectively, 0.62, 0.62, and 0.64. Between 1999 and 2000, takeup rates declined for 25 states and increased for 26 states. Between 2000 and 2001, takeup rates declined for 11 states and increased for 40 states. Cumulatively, for 1999 to 2001, takeup rates declined for 15 states and increased for 36 states. The unweighted mean decline in takeup rates was 4% for the 15 states with cumulative declines. The unweighted mean increase in takeup rates was 3% for the 36 states with cumulative increases.
Alaska and Utah each have takeup rates that are 0.13 lower in 2001 than in 1999, a substantially greater decline than in other states. This decline is due to the large growth in the estimated number of qualifying (enrollees plus eligible nonenrollees) beneficiaries in these states, rather than reductions in the number of enrolled beneficiaries. We believe that this large growth may be due to unreliable estimates of the number of qualifying beneficiaries. ARC’s estimates of the number of qualifying beneficiaries in each year were based on the same 1996-1998 data, which were then aged forward to produce estimates for 1999 through 2001. The data aging methodology is more likely to produce unreliable forecasts for low-population states such as Alaska and Utah than for high-population states.
5.5.2 State Outreach Activities
Responses to the state outreach survey are reported in Appendix Tables I-1 through I-6. Even after accounting for the states that did not respond to the 1999 and 2001 surveys, it appears that states have generally increased the level of outreach activities since 1999. For many outreach activities, it also appears that the highest levels were in 2000 and that there was a slight decrease in 2001. For instance, the number of states reporting that they sent letters to potential eligibles increased from 17 in 1999, to 27 in 2000 and, then, down to 25 in 2001 (Appendix Table I-1). Most of the decreases are small, on the order of two or three states. There are also a number of instances in which there were continuing increases in activities. For instance, the number of live presentations to small groups increased from 20 in 1999, to 28 in 2000, and to 36 in 2001 (Appendix Table I-1). Increases between 1999 and 2000, and to a lesser extent decreases from 2000 to 2001, are due, in part, to changes in the number of states responding to the survey. The remainder of this section describes significant changes between 1999 and 2001 for each category of outreach activity.
Dual Eligible Information Dissemination and Provision - The number of states using any type of printed material to inform beneficiaries about Medicare Savings Programs benefits increased from 31 in 1999 to 43 in 2001, an increase of nearly 40% (Appendix Table I-1). The number of states using any type of letter to inform beneficiaries about Medicare Savings Programs benefits increased from 22 in 1999 to 32 in 2001, an increase of about 45%. The number of states mailing letters to potential eligibles increased from 17 in 1999 to 25 in 2001. For all three activities, the number of states performing such activities fell slightly between 2000 and 2001.
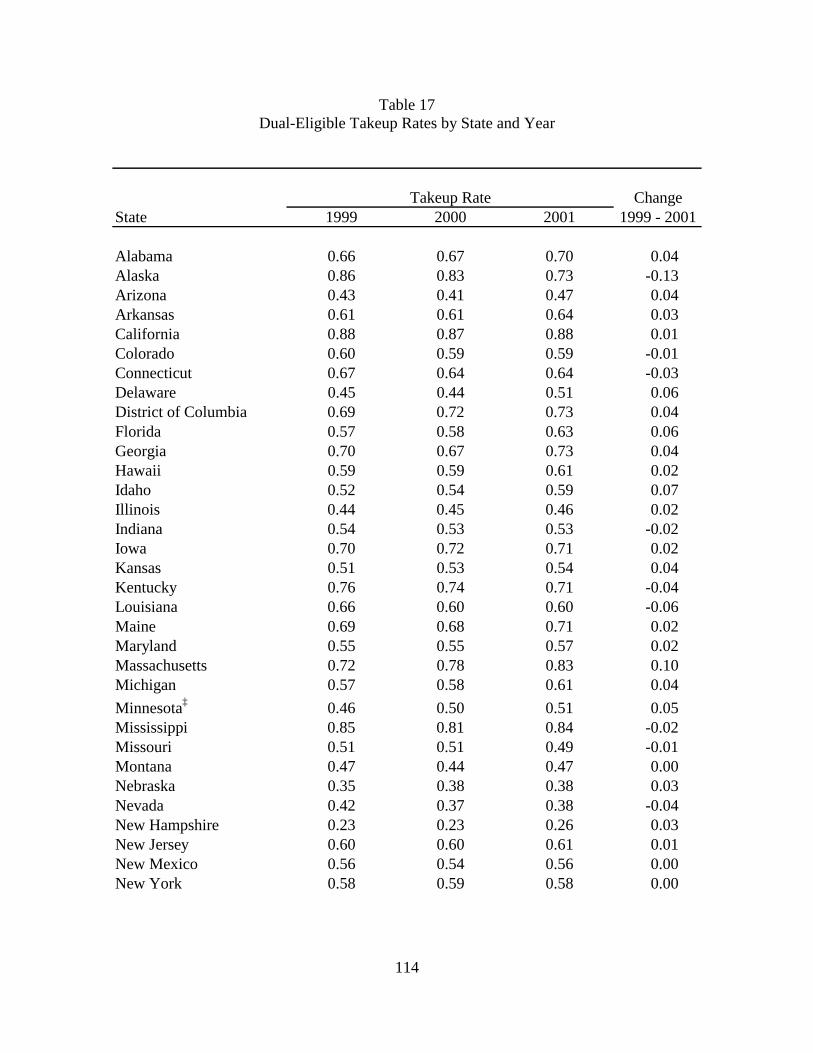
114
Table 17 Dual-Eligible Takeup Rates by State and Year
ChangeState 1999 2000 2001 1999 - 2001
Alabama 0.66 0.67 0.70 0.04Alaska 0.86 0.83 0.73 -0.13Arizona 0.43 0.41 0.47 0.04Arkansas 0.61 0.61 0.64 0.03California 0.88 0.87 0.88 0.01Colorado 0.60 0.59 0.59 -0.01Connecticut 0.67 0.64 0.64 -0.03Delaware 0.45 0.44 0.51 0.06District of Columbia 0.69 0.72 0.73 0.04Florida 0.57 0.58 0.63 0.06Georgia 0.70 0.67 0.73 0.04Hawaii 0.59 0.59 0.61 0.02Idaho 0.52 0.54 0.59 0.07Illinois 0.44 0.45 0.46 0.02Indiana 0.54 0.53 0.53 -0.02Iowa 0.70 0.72 0.71 0.02Kansas 0.51 0.53 0.54 0.04Kentucky 0.76 0.74 0.71 -0.04Louisiana 0.66 0.60 0.60 -0.06Maine 0.69 0.68 0.71 0.02Maryland 0.55 0.55 0.57 0.02Massachusetts 0.72 0.78 0.83 0.10Michigan 0.57 0.58 0.61 0.04
Minnesota‡ 0.46 0.50 0.51 0.05Mississippi 0.85 0.81 0.84 -0.02Missouri 0.51 0.51 0.49 -0.01Montana 0.47 0.44 0.47 0.00Nebraska 0.35 0.38 0.38 0.03Nevada 0.42 0.37 0.38 -0.04New Hampshire 0.23 0.23 0.26 0.03New Jersey 0.60 0.60 0.61 0.01New Mexico 0.56 0.54 0.56 0.00New York 0.58 0.59 0.58 0.00
Takeup Rate
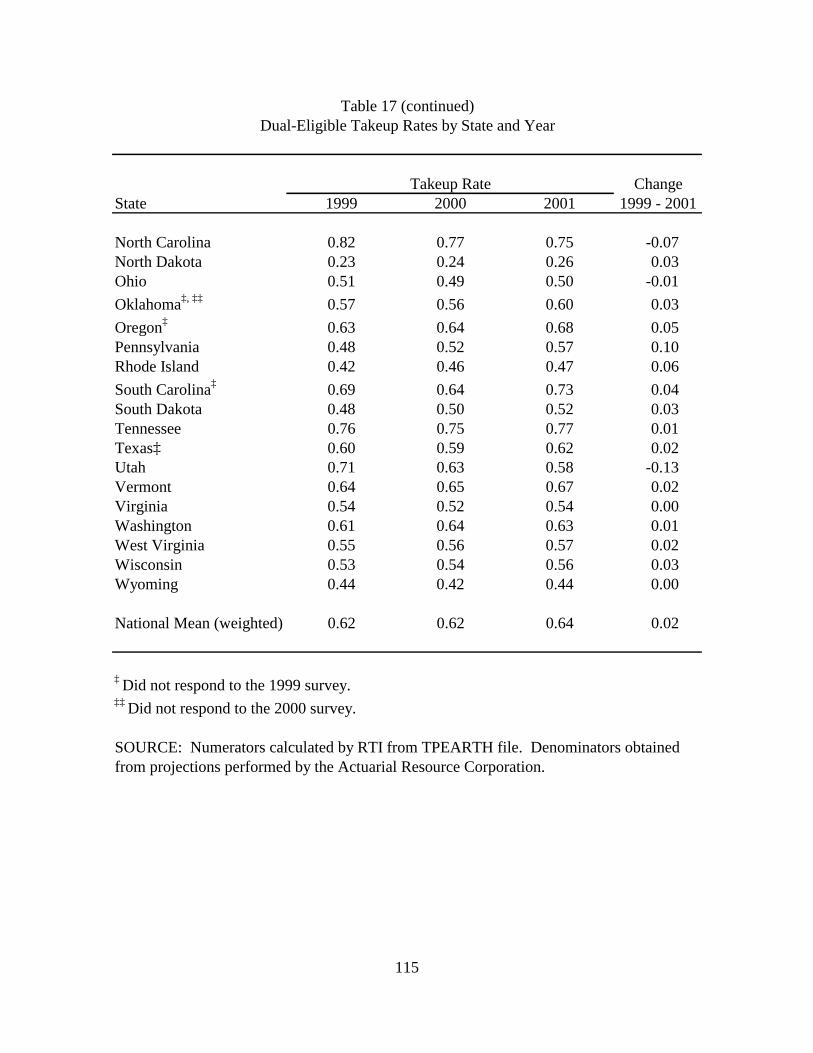
115
ChangeState 1999 2000 2001 1999 - 2001
North Carolina 0.82 0.77 0.75 -0.07North Dakota 0.23 0.24 0.26 0.03Ohio 0.51 0.49 0.50 -0.01
Oklahoma‡, ‡‡ 0.57 0.56 0.60 0.03
Oregon‡ 0.63 0.64 0.68 0.05Pennsylvania 0.48 0.52 0.57 0.10Rhode Island 0.42 0.46 0.47 0.06
South Carolina‡ 0.69 0.64 0.73 0.04South Dakota 0.48 0.50 0.52 0.03Tennessee 0.76 0.75 0.77 0.01Texas‡ 0.60 0.59 0.62 0.02Utah 0.71 0.63 0.58 -0.13Vermont 0.64 0.65 0.67 0.02Virginia 0.54 0.52 0.54 0.00Washington 0.61 0.64 0.63 0.01West Virginia 0.55 0.56 0.57 0.02Wisconsin 0.53 0.54 0.56 0.03Wyoming 0.44 0.42 0.44 0.00
National Mean (weighted) 0.62 0.62 0.64 0.02
‡ Did not respond to the 1999 survey.‡‡ Did not respond to the 2000 survey.
SOURCE: Numerators calculated by RTI from TPEARTH file. Denominators obtainedfrom projections performed by the Actuarial Resource Corporation.
Takeup Rate
Table 17 (continued)Dual-Eligible Takeup Rates by State and Year
116
On the other hand, the number of states printing pamphlets and using newspaper notices increased each year. For pamphlets, the number increased from 23 in 1999 to 29 in 2000, and to 35 in 2001. Although the levels are low in each year, the number of states using newspaper notices to inform beneficiaries about Medicare Savings Programs benefits increased from 3 in 1999 to 13 in 2001.
Use of any type of broadcast media to inform beneficiaries increased from 8 in 1999 to 22 in 2001 with the greatest increase in use of public service announcements (PSAs) and participation in talk shows. Even so, fewer than half the states used the broadcast media as a way of disseminating information about the Medicare Savings Programs. The story is similar for use of websites and dedicated telephone hot lines.
Large increases in the number of live presentations continued beyond 2000. States reporting any type of live presentation increased from 28 in 1999 to 36 in 2000, and to 42 in 2001. Similar increases occurred for presentations at health fairs and to small groups. There was also an increase in the number of one-on-one presentations from 12 in 1999 to 24 in 2001.
Dual Eligible-Specific Partnership Efforts of State Medicaid Agencies - In 1999 (Appendix Table I-2), the majority of states had some type of partnership with other state agencies (41) and federal agencies (36). There were increases in almost every type of partnership over the three years. The largest increases in partnerships were with providers and state or local groups. The number of states reporting any type of partnership with providers increased from 23 in 1999 to 34 in 2001, with the greatest increase in partnerships with community health centers. The number states reporting partnerships with state or local groups increased by seven between 1999 and 2001 with the largest increase in partnerships with senior volunteers. The number of partnerships with advocacy organizations increased by 9 between 1999 and 2001, about a 35% increase.
Provider Access - The number of states reporting that their Medicaid rates were less than or equal to 80% of Medicare rates increased from 25 in 1999 to 36 in 2001 (Appendix Table I-3). At the same time, the number of states reporting that they pay the Medicare co-insurance even when Medicaid rates are less than or equal to 80% of Medicare rates increased from 19 in 1999 to 26 in 2001. Overall, the number of states reporting that their Medicaid rates are less than 80% but they pay the Medicare co-insurance regardless increased from 11 in 1999 to 21 in 2001. These last two statistics show a trend away from states taking advantage of their right to limit Medicare cost-sharing payments to Medicaid payment amounts. However, it should be noted that this contradicts evidence that state limitations on cost-sharing payments increased following the passage of the Balanced Budget Act (BBA) in 1997, which confirmed states’ discretion to limit these payments (Nemore, 1999; Mitchell and Haber, 2003).
There was little reported change in the rates of physician participation in Medicaid; the mean and median rates were about 75% each year. Both the mean and median number of days required to process claims increased between 1999 and 2001.
There were a number of states that did not respond to any component of this section. For instance, fewer than half of the states responded to the physician participation question in each year. In contrast to the physician participation question, the number of states responding to the question about number of days required to process claims increased from 25 in 1999 to 36 in
117
2001. Therefore, it is not clear whether some of the changes described above were real or an artifact of item non-response.
Leads Data - Although 23 states received Leads Data from CMS in 2001, only 21 report using them (Appendix Table I-4). Thirty-one states report having a §1634 Agreement with SSA to make Medicaid eligibility determinations, and 40 states use the SDX.
The notable change over time in this section was in the number of states reporting that they used SDX information from SSA, which increased from 33 in 1999 to 40 in 2001. For states that responded to the outreach survey all three years, the number of states reporting that they used SDX information increased from 33 in 1999 to 37 in 2001.
Dual Eligible-Specific Application, Enrollment, and Eligibility Process - States took some major steps towards simplifying the application, enrollment, and eligibility processes for Medicare beneficiaries during this period. The number of states using a shortened application for Medicare Savings Programs benefits increased from 18 in 1999 to 38 in 2001 (Appendix Table I-5). Although the majority of states had already made application forms available outside of welfare departments by 1999, the number continued to increase so that, in 2001, over 80% of the states made applications available by mail, through providers, or other community organizations. An increasing number of states allowed applications to be submitted by mail, through provider/community organizations, or by FAX.
The number of states that liberalized their income and assets tests increased during the study period; in 2001, 16 states had liberalized their income tests and 13 had liberalized their assets tests. The number of states that no longer required in-person interviews increased from 27 in 1999 to 42 in 2001. Also, the number of states that automatically screened for Medicare Savings Programs when people apply for other programs increased from 27 in 1999 to 37 in 2001.
Redetermination - The number of states reporting that they use automatic redetermination increased from 18 in 1999 to 28 in 2001 (Appendix Table I-6). The number of states that used a shorter form for redeterminations than for the original application increased from 14 in 1999 to 33 in 2001. It appears that, in general, that states are making the redetermination process easier for dually eligible beneficiaries.
5.5.3 Relationship between Takeup and Outreach Activities
The goal of state outreach activities is to increase takeup rates. To test this, takeup rates for states that performed a given type of outreach were compared to those for states that had not performed outreach. For each outreach activity tested, the comparisons were performed for each of the three years, 1999 through 2001. In the following discussion, comparisons are organized by the topical sections of the state outreach survey.
There were 71 types of outreach activities for which comparisons were performed for each of three years, a total of 212 comparisons. The differences in mean takeup rates were statistically significant in 36 (17%) out of the 212 comparisons. Of these, the mean takeup rate was higher in states that performed outreach in only 3 instances and lower in 33. One reason why the differences in mean takeup rates were usually statistically insignificant is because of the small number of observations (i.e., a maximum of 51 states in any year). In addition, in many
118
cases the differences in mean takeup rates by outreach activity were small. Below, we describe the findings by section of the survey.
We report the results of analyses of the contemporaneous relationship between outreach activities performed in a given year and takeup rates for the same year. However, it is possible that there is a lagged relationship between outreach activities and the takeup rate. That is, takeup rates in a given year might be affected by the outreach activities in the previous year, particularly if an outreach initiative occurs late in the year or if it takes some time before applications are submitted and processed. Tests of lagged relationships were also performed, looking at the relationship between 1999 and 2000 outreach activities and enrollment in 2000 and 2001, respectively. Findings from these lagged analyses did not differ from those using contemporaneous outreach and enrollment variables. Therefore, we report the contemporaneous results only.
Information Dissemination and Provision Activity - The types of activities covered in this section of the outreach survey included information dissemination and provision activities such as letters, pamphlets, posters, newspaper notices, radio and TV broadcasts, live presentations, internet pages or links, dedicated telephone hotlines, training of outreach workers, and targeting of minority populations. To reduce table length, the letter, broadcast, and live presentation categories were collapsed. For instance, the letter category included separate responses for mailings to potential beneficiaries, community health centers, other providers, family members, and flyers in other mailings (e.g., utility bills). If a state performed outreach in any of these five sub-categories, then it was considered that the state perform “letter outreach”.
Table 18 displays the mean takeup rate by whether the outreach activity had been performed. The number of states reporting that they did or did not perform an outreach activity is shown in parentheses under the takeup rate. We also report whether the difference in mean takeup rate for these groups of states is statistically significant. For instance, the mean takeup rate for states that used any type of printed material for outreach was 0.59 in 1999. There were 31 states that used printed materials in 1999. The mean takeup rate for the 15 states that did not use any type of printed material was 0.56. The difference between the two rates groups was not statistically significant.
Of the 33 comparisons in Table 18, there were only six in which the differences in mean takeup rates were statistically significant: pamphlet distribution during 2001, newspaper notices during 2001, dedicated telephone hotlines during 2001, live presentations during 1999, training of state outreach workers during 2000, and targeting of minority populations during 2001. For all six, contrary to expectations, the mean takeup rate for states that performed the outreach activity was lower.
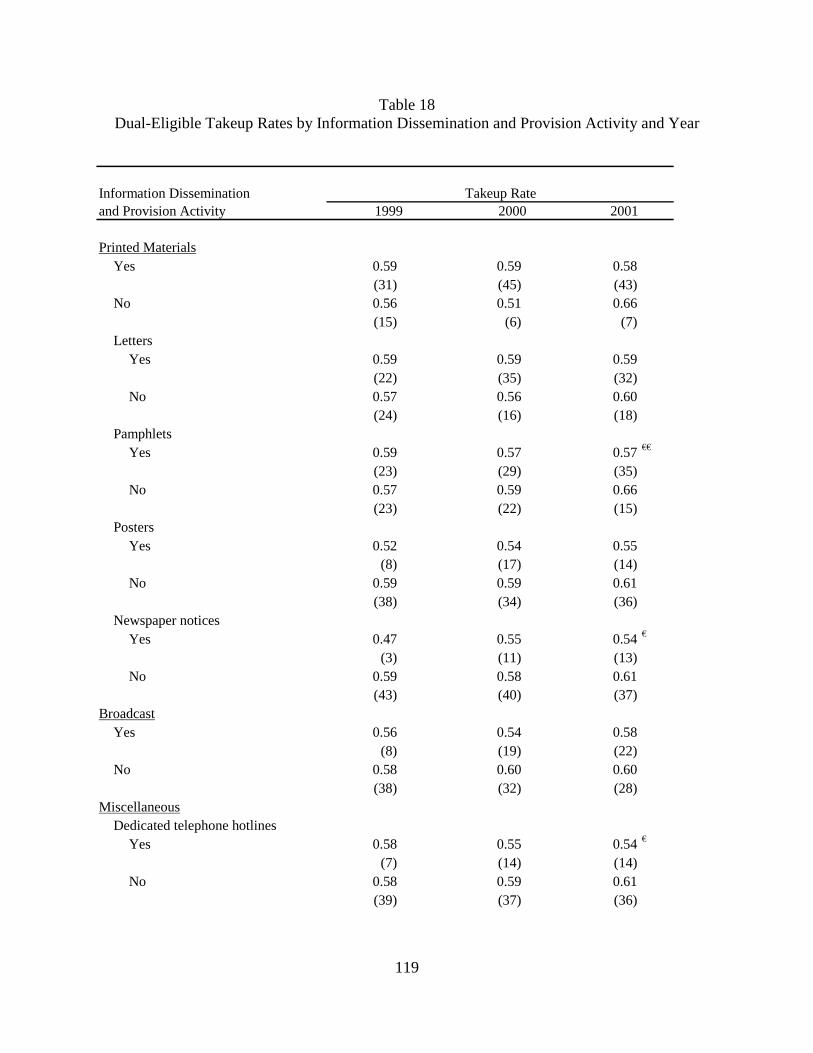
119
Table 18 Dual-Eligible Takeup Rates by Information Dissemination and Provision Activity and Year
Information Dissemination and Provision Activity
Printed MaterialsYes 0.59 0.59 0.58
(31) (45) (43)No 0.56 0.51 0.66
(15) (6) (7)Letters
Yes 0.59 0.59 0.59(22) (35) (32)
No 0.57 0.56 0.60(24) (16) (18)
PamphletsYes 0.59 0.57 0.57 €€
(23) (29) (35)No 0.57 0.59 0.66
(23) (22) (15)Posters
Yes 0.52 0.54 0.55(8) (17) (14)
No 0.59 0.59 0.61(38) (34) (36)
Newspaper noticesYes 0.47 0.55 0.54 €
(3) (11) (13)No 0.59 0.58 0.61
(43) (40) (37)Broadcast
Yes 0.56 0.54 0.58(8) (19) (22)
No 0.58 0.60 0.60(38) (32) (28)
MiscellaneousDedicated telephone hotlines
Yes 0.58 0.55 0.54 €
(7) (14) (14)No 0.58 0.59 0.61
(39) (37) (36)
2001Takeup Rate
1999 2000
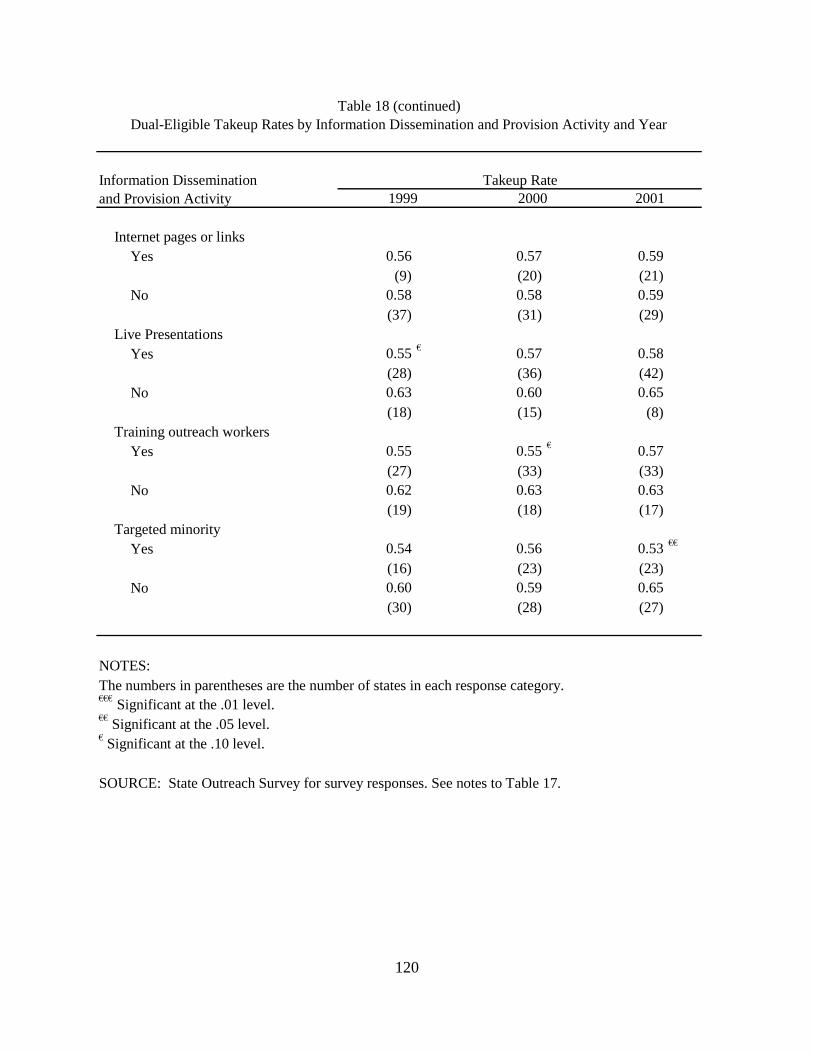
120
Information Dissemination and Provision Activity
Internet pages or linksYes 0.56 0.57 0.59
(9) (20) (21) No 0.58 0.58 0.59
(37) (31) (29) Live Presentations
Yes 0.55 € 0.57 0.58 (28) (36) (42)
No 0.63 0.60 0.65 (18) (15) (8)
Training outreach workers Yes 0.55 0.55 € 0.57
(27) (33) (33) No 0.62 0.63 0.63
(19) (18) (17) Targeted minority
Yes 0.54 0.56 0.53 €€
(16) (23) (23) No 0.60 0.59 0.65
(30) (28) (27)
NOTES: The numbers in parentheses are the number of states in each response category.€€€ Significant at the .01 level. €€ Significant at the .05 level. € Significant at the .10 level.
SOURCE: State Outreach Survey for survey responses. See notes to Table 17.
Table 18 (continued)Dual-Eligible Takeup Rates by Information Dissemination and Provision Activity and Year
Takeup Rate1999 2000 2001
121
Partnership Effort of State Medicaid Agencies - The types of activities covered in this section of the outreach survey included outreach partnerships that state Medicaid agencies formed with other state agencies, federal agencies, local government, the provider community, advocacy organizations (e.g., AARP), and miscellaneous groups (e.g., senior volunteers). In addition to the comparisons for each individual type of entity with which the Medicaid agency partnered (e.g., CMS, SSA, HRSA, etc.), comparisons were performed for overall categories of partnering entities (e.g., any federal agency). For instance, if the state Medicaid program had an outreach partnership with any of the seven federal agencies listed in Table 19, then the state was considered to have a partnership with any federal agency.
Of the 87 comparisons in Table 19, there were only 15 in which the differences in mean takeup rates were statistically significant. Although we expected partnership activities to be associated with higher enrollment, for all 15 the mean takeup rate for states that performed the outreach activity was lower. The 15 statistically significant partnerships were with state Health Insurance Programs (2001), state Income Maintenance Divisions (1999 and 2000), statewide Task Forces (2000 and 2001), CMS (1999), SSA (2001), Medicare FI/Carrier (1999 and 2000), any provider group (2001), community health centers (2000 and 2001), hospitals (2001), other state/local efforts (2001), and senior volunteers (2001).
Nearly all state Medicaid programs had a partnership with some other agency or group (Any Partnership rows in Table 19). The differences in the mean takeup rate by whether a state had any type of partnership were not statistically significant in any year. Similarly, most states have a partnership with at least one other state agency or organization (Any other State Agencies). Again, we find no significant difference in takeup rates associated with having a partnership with some other state agency. By 2000, about 86% of state Medicaid agencies had an outreach partnership with a federal agency, in particular with CMS and SSA. As with other partnership efforts, there was no statistically significant increase in takeup rates that could be attributed to having some type of federal partnership.
Provider Access - The topics in this section were included to test whether access to providers might have affected beneficiary proclivity to enroll in the Medicare Savings Programs. The first three items measure the extent to which reimbursement of Medicare cost-sharing payments is constrained by a state’s Medicaid payment rates. The next item measures provider participation in the Medicaid program. The final item looks at claims processing time, based on the assumption that providers will find Medicaid patients less attractive in states with long claims processing lags.
We did not find any evidence that these indicators of provider access are associated with variation in QMB/SLMB enrollment. In only one of the 15 comparisons, was the difference in mean takeup rates statistically significant (Table 20) and the relationship was opposite to the one expected – the mean takeup rate was lower in states that had above average physician participation rates in Medicaid during the year 2000. Note, however, that many states did not respond to the questions in this section. Further, as noted previously, responses to the question about payment of the Medicare co-insurance when the Medicaid rates are less than 80% of the Medicare rate may not be accurate.
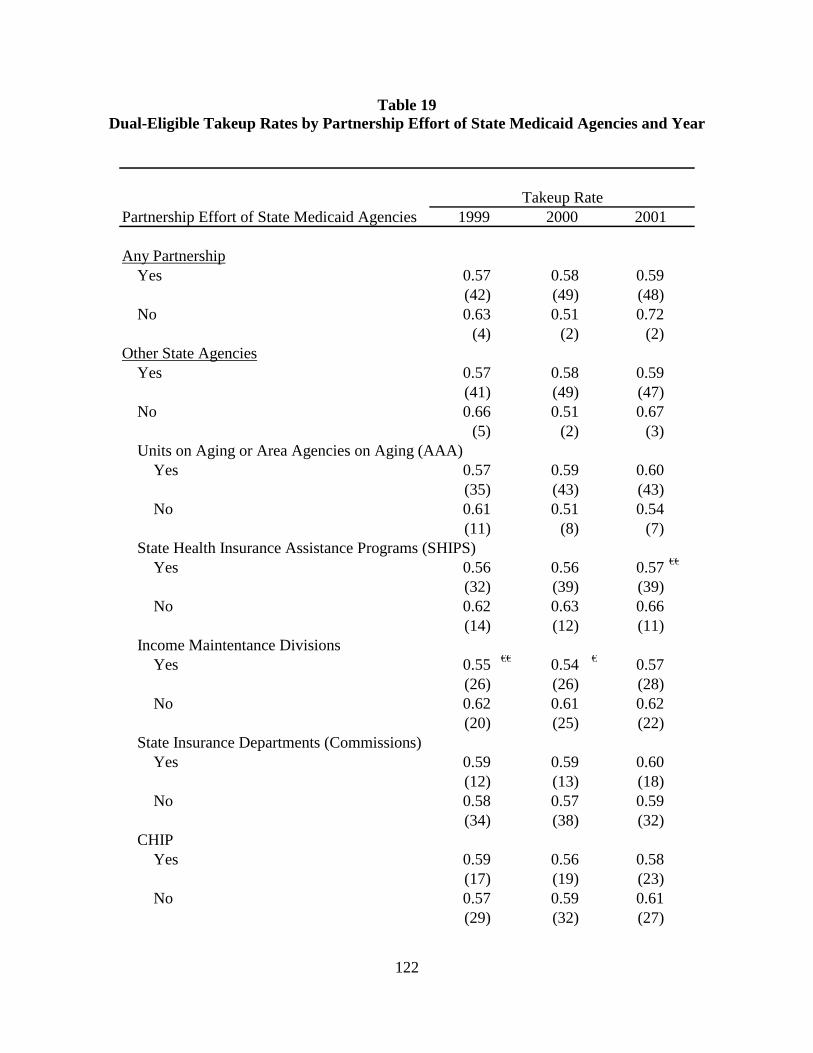
122
Table 19 Dual-Eligible Takeup Rates by Partnership Effort of State Medicaid Agencies and Year
Partnership Effort of State Medicaid Agencies
Any PartnershipYes 0.57 0.58 0.59
(42) (49) (48)No 0.63 0.51 0.72
(4) (2) (2)Other State Agencies
Yes 0.57 0.58 0.59(41) (49) (47)
No 0.66 0.51 0.67(5) (2) (3)
Units on Aging or Area Agencies on Aging (AAA)Yes 0.57 0.59 0.60
(35) (43) (43)No 0.61 0.51 0.54
(11) (8) (7)State Health Insurance Assistance Programs (SHIPS)
Yes 0.56 0.56 0.57 €€
(32) (39) (39)No 0.62 0.63 0.66
(14) (12) (11)Income Maintentance Divisions
Yes 0.55 €€ 0.54 € 0.57(26) (26) (28)
No 0.62 0.61 0.62(20) (25) (22)
State Insurance Departments (Commissions)Yes 0.59 0.59 0.60
(12) (13) (18)No 0.58 0.57 0.59
(34) (38) (32)CHIP
Yes 0.59 0.56 0.58(17) (19) (23)
No 0.57 0.59 0.61(29) (32) (27)
1999 2000 2001Takeup Rate
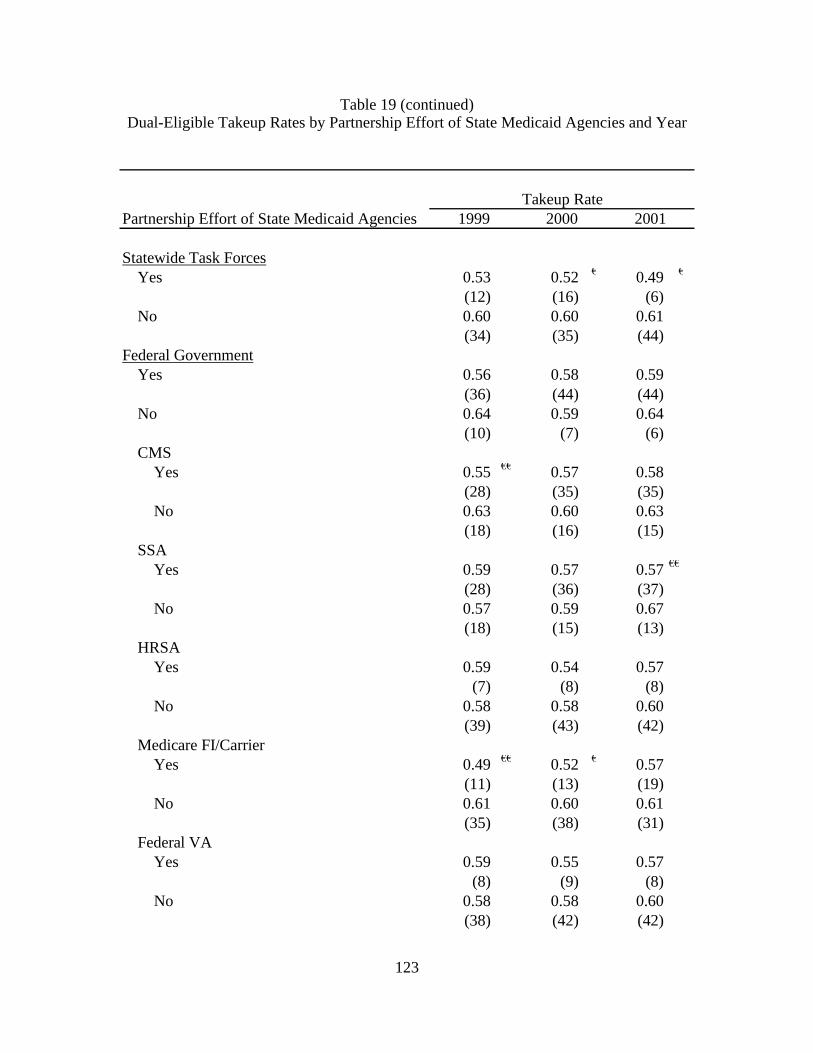
123
Table 19 (continued) Dual-Eligible Takeup Rates by Partnership Effort of State Medicaid Agencies and Year
Partnership Effort of State Medicaid Agencies
Statewide Task ForcesYes 0.53 0.52 € 0.49 €
(12) (16) (6)No 0.60 0.60 0.61
(34) (35) (44)Federal Government
Yes 0.56 0.58 0.59(36) (44) (44)
No 0.64 0.59 0.64(10) (7) (6)
CMSYes 0.55 €€ 0.57 0.58
(28) (35) (35)No 0.63 0.60 0.63
(18) (16) (15)SSA
Yes 0.59 0.57 0.57 €€
(28) (36) (37)No 0.57 0.59 0.67
(18) (15) (13)HRSA
Yes 0.59 0.54 0.57(7) (8) (8)
No 0.58 0.58 0.60(39) (43) (42)
Medicare FI/CarrierYes 0.49 €€ 0.52 € 0.57
(11) (13) (19)No 0.61 0.60 0.61
(35) (38) (31)Federal VA
Yes 0.59 0.55 0.57(8) (9) (8)
No 0.58 0.58 0.60(38) (42) (42)
Takeup Rate1999 2000 2001

124
Table 19 (continued) Dual-Eligible Takeup Rates by Partnership Effort of State Medicaid Agencies and Year
Partnership Effort of State Medicaid Agencies
HUD Housing ProjectsYes 0.52 0.52 0.55
(6) (9) (12)No 0.59 0.59 0.61
(40) (42) (38)Indian Health Service
Yes 0.61 0.55 0.57(10) (12) (13)
No 0.57 0.58 0.60(36) (39) (37)
County/City GovernmentYes 0.61 0.55 0.55
(12) (16) (14)No 0.57 0.59 0.61
(34) (35) (36)Provider Community
Yes 0.56 0.55 0.55 €€€
(23) (29) (34)No 0.60 0.61 0.68
(23) (22) (16)Medicaid MCOs
Yes 0.63 0.62 0.62(5) (8) (9)
No 0.57 0.57 0.59(41) (43) (41)
Medicare MCOsYes 0.60 0.59 0.61
(7) (9) (10)No 0.58 0.57 0.59
(39) (42) (40)Community Health Centers
Yes 0.56 0.54 € 0.53 €€€
(21) (23) (29)No 0.59 0.61 0.68
(25) (28) (21)
Takeup Rate1999 2000 2001
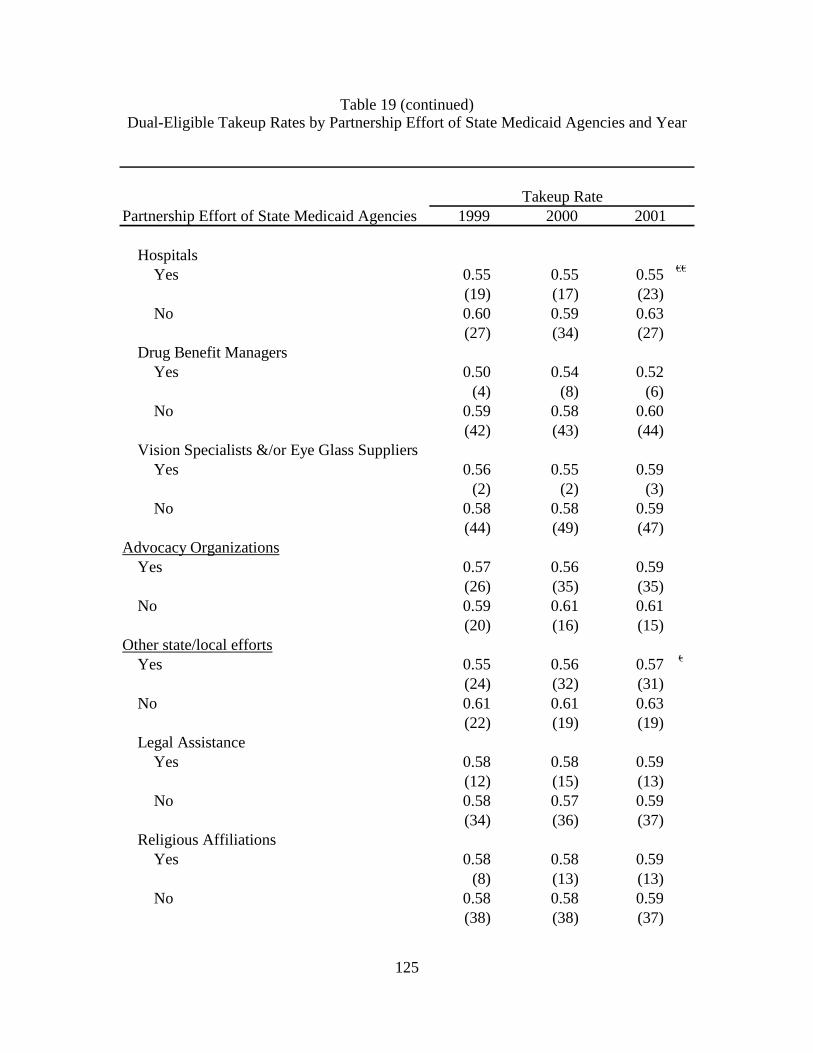
125
Table 19 (continued) Dual-Eligible Takeup Rates by Partnership Effort of State Medicaid Agencies and Year
Partnership Effort of State Medicaid Agencies
HospitalsYes 0.55 0.55 0.55 €€
(19) (17) (23)No 0.60 0.59 0.63
(27) (34) (27)Drug Benefit Managers
Yes 0.50 0.54 0.52(4) (8) (6)
No 0.59 0.58 0.60(42) (43) (44)
Vision Specialists &/or Eye Glass SuppliersYes 0.56 0.55 0.59
(2) (2) (3)No 0.58 0.58 0.59
(44) (49) (47)Advocacy Organizations
Yes 0.57 0.56 0.59(26) (35) (35)
No 0.59 0.61 0.61(20) (16) (15)
Other state/local effortsYes 0.55 0.56 0.57 €
(24) (32) (31)No 0.61 0.61 0.63
(22) (19) (19)Legal Assistance
Yes 0.58 0.58 0.59(12) (15) (13)
No 0.58 0.57 0.59(34) (36) (37)
Religious AffiliationsYes 0.58 0.58 0.59
(8) (13) (13)No 0.58 0.58 0.59
(38) (38) (37)
Takeup Rate1999 2000 2001
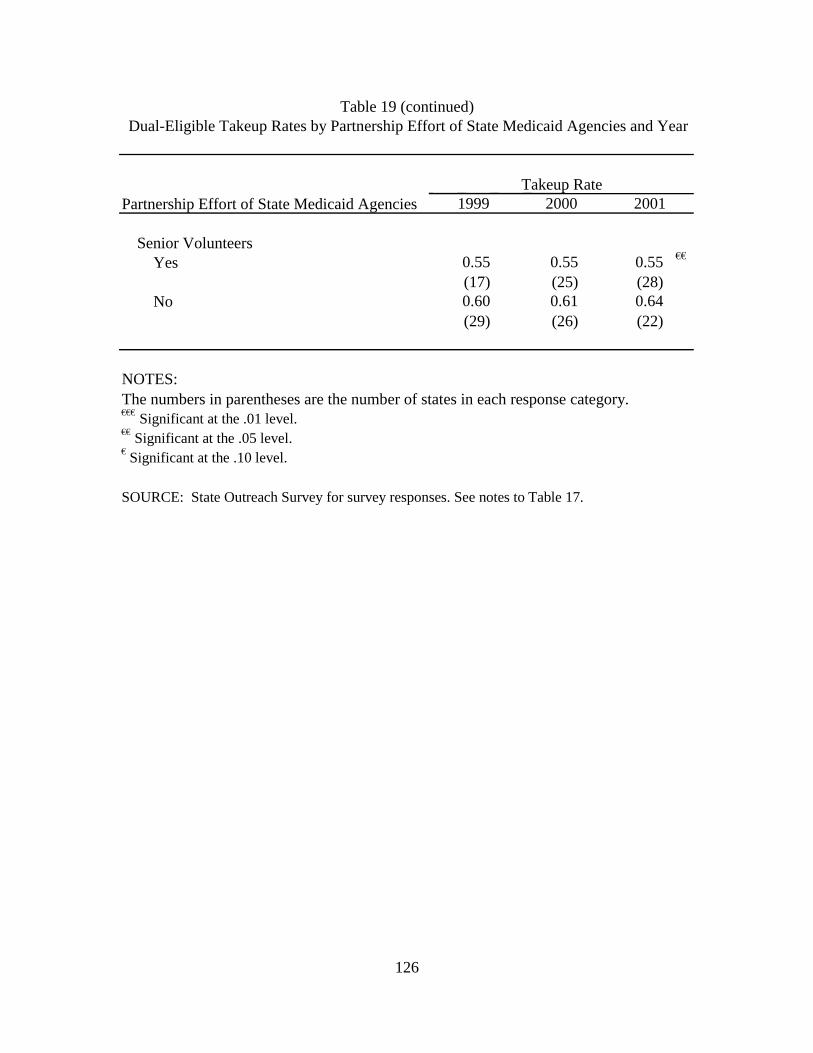
126
Partnership Effort of State Medicaid Agencies
Senior VolunteersYes 0.55 0.55 0.55 €€
(17) (25) (28) No 0.60 0.61 0.64
(29) (26) (22)
NOTES: The numbers in parentheses are the number of states in each response category. €€€ Significant at the .01 level. €€ Significant at the .05 level. € Significant at the .10 level.
SOURCE: State Outreach Survey for survey responses. See notes to Table 17.
Table 19 (continued)Dual-Eligible Takeup Rates by Partnership Effort of State Medicaid Agencies and Year
Takeup Rate 1999 2000 2001
127
Leads Data - This section was concerned with the coordination between the federal government and state governments in the enrollment of Medicare beneficiaries for Medicaid benefits. Two questions revolved around the receipt and use of Leads Data from CMS to identify potential buy-in eligibles. Another asked whether states had a §1634 Agreement with SSA. The last question asked states whether they used the SDX.
In all 12 comparisons, the mean takeup rate for states that responded “yes” to the questions were higher than for those states that responded “no” (Table 21), although the only significant differences were associated with having a §1634 Agreement. The takeup rate in states with a §1634 Agreement was 0.08 and 0.10 higher than in states without an agreement in 2000 and 2001, respectively. However, the §1634 Agreement program only affects the enrollment of SSI recipients into Medicaid, but not into the QMB program or any of the other Medicare Savings Programs.
Application, Enrollment, and Eligibility Process - Four broad topic areas are covered in this section: application length, application availability, application submission, and eligibility determination standards. The first three areas address the extent to which states have adopted procedures that simplify the Medicare Savings Programs application process, while the last area looks at policies that relax eligibility standards and requirements for eligibility determination.
Of the 57 comparisons in Table 22, there were 8 in which the differences in mean takeup rates were statistically significant and, for all 8, the mean takeup rate for states that performed the outreach activity was lower. Five of the 8 statistically significant differences were for two questions that addressed requirements for eligibility determination: the requirement of an in-person interview and automatic screening for QMB/SLMB eligibility when beneficiaries apply for other benefits. The takeup rate in states that did not require an in-person interview was 0.08-0.10 lower than in states that required an in-person interview. The takeup rate in states that automatically screened for QMB/SLMB eligibility was 0.10 and 0.08 lower than in states that did not automatically screen in 2000 and 2001, respectively. In several other cases where there are significant differences, the results are not reliable because of the small number of states in a given response category. For example, in 2001 the takeup rate in states that do not accept applications through providers or community organizations was 0.14 higher than the rate in states that do; however, only 3 states reported that they did not accept applications through these sites.
Redetermination - The topics in this section deal with the ease by which dual beneficiaries can re-enroll in Medicaid. States were asked whether they allow automatic redetermination at re-enrollment, whether they require an in-person interview, and whether they use shortened versus full application forms.
Of the 11 comparisons in Table 23, there were 5 in which the differences in mean takeup rates were statistically significant and, for four of them, the mean takeup rate for states that performed the outreach activity was lower. Three of these were for the automatic redetermination standard. The takeup rate in states that had automatic redetermination was 0.08-0.10 lower than in states that did not have automatic redetermination. The only instance in which the mean takeup rate was higher and statistically significant was in 2001 for those states that allowed use of a shortened form for re-application.
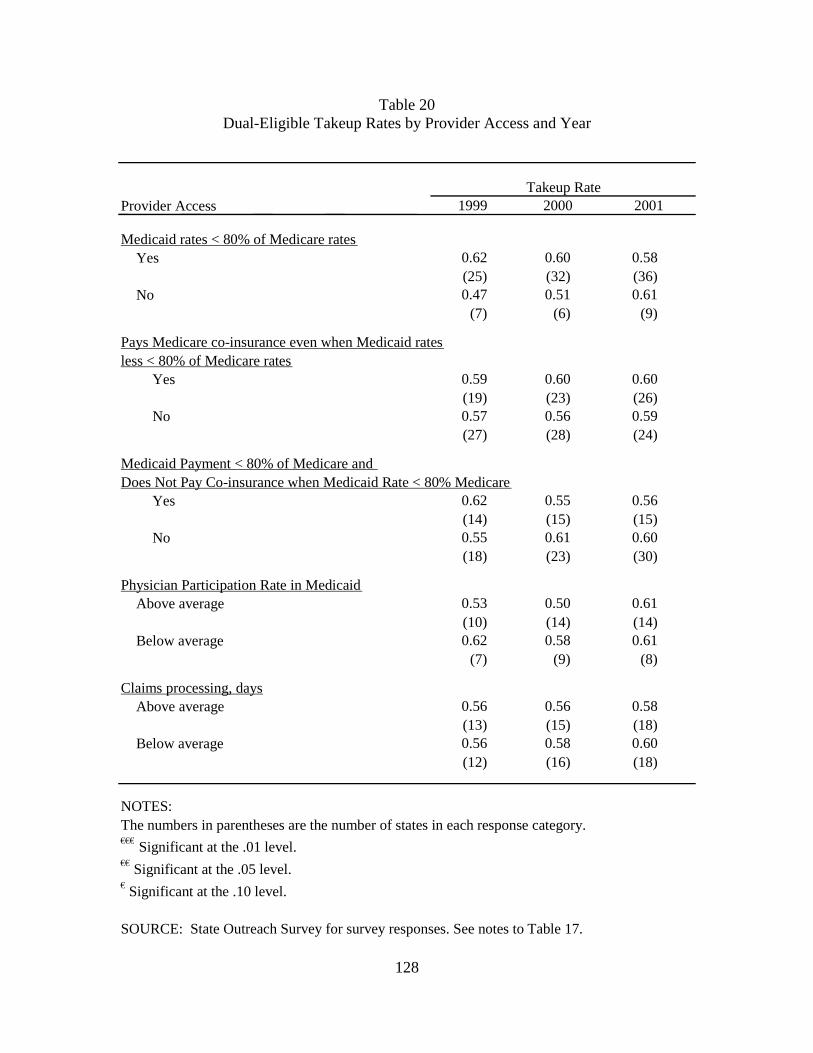
128
Table 20 Dual-Eligible Takeup Rates by Provider Access and Year
Provider Access
Medicaid rates < 80% of Medicare ratesYes 0.62 0.60 0.58
(25) (32) (36) No 0.47 0.51 0.61
(7) (6) (9)
Pays Medicare co-insurance even when Medicaid ratesless < 80% of Medicare rates
Yes 0.59 0.60 0.60 (19) (23) (26)
No 0.57 0.56 0.59 (27) (28) (24)
Medicaid Payment < 80% of Medicare and Does Not Pay Co-insurance when Medicaid Rate < 80% Medicare
Yes 0.62 0.55 0.56 (14) (15) (15)
No 0.55 0.61 0.60 (18) (23) (30)
Physician Participation Rate in MedicaidAbove average 0.53 0.50 0.61
(10) (14) (14) Below average 0.62 0.58 0.61
(7) (9) (8)
Claims processing, days Above average 0.56 0.56 0.58
(13) (15) (18) Below average 0.56 0.58 0.60
(12) (16) (18)
NOTES: The numbers in parentheses are the number of states in each response category. €€€ Significant at the .01 level. €€ Significant at the .05 level. € Significant at the .10 level.
SOURCE: State Outreach Survey for survey responses. See notes to Table 17.
Takeup Rate 1999 2000 2001
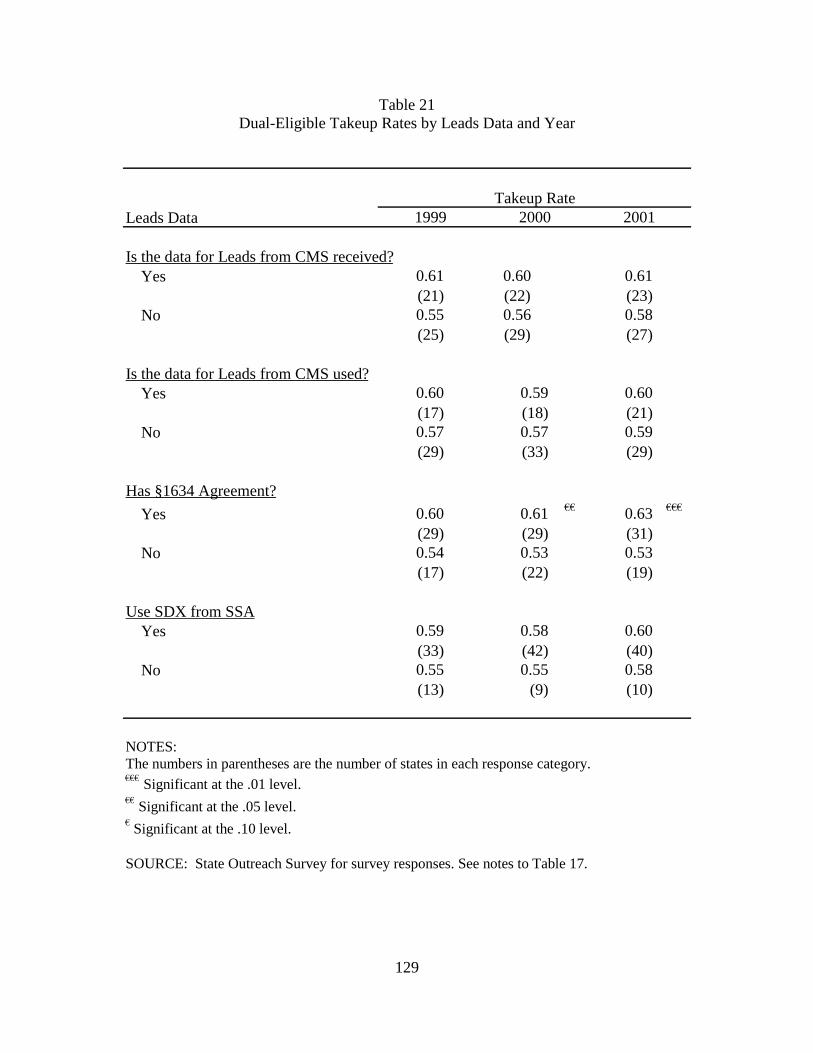
129
Table 21 Dual-Eligible Takeup Rates by Leads Data and Year
Leads Data
Is the data for Leads from CMS received?Yes 0.61 0.60 0.61
(21) (22) (23) No 0.55 0.56 0.58
(25) (29) (27)
Is the data for Leads from CMS used?Yes 0.60 0.59 0.60
(17) (18) (21) No 0.57 0.57 0.59
(29) (33) (29)
Has §1634 Agreement?
Yes 0.60 0.61 €€ 0.63 €€€
(29) (29) (31) No 0.54 0.53 0.53
(17) (22) (19)
Use SDX from SSAYes 0.59 0.58 0.60
(33) (42) (40) No 0.55 0.55 0.58
(13) (9) (10)
NOTES: The numbers in parentheses are the number of states in each response category. €€€ Significant at the .01 level. €€ Significant at the .05 level. € Significant at the .10 level.
SOURCE: State Outreach Survey for survey responses. See notes to Table 17.
Takeup Rate 1999 2000 2001
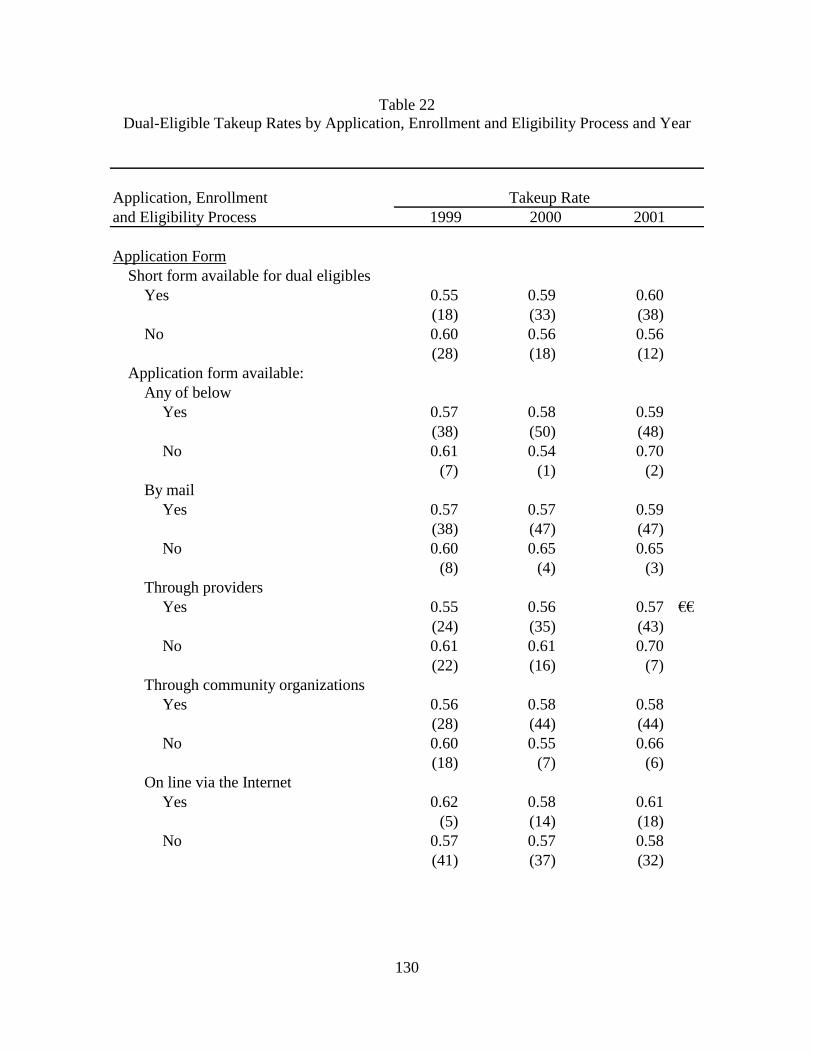
130
Table 22 Dual-Eligible Takeup Rates by Application, Enrollment and Eligibility Process and Year
Application, Enrollment and Eligibility Process
Application FormShort form available for dual eligibles
Yes 0.55 0.59 0.60(18) (33) (38)
No 0.60 0.56 0.56(28) (18) (12)
Application form available:Any of below
Yes 0.57 0.58 0.59(38) (50) (48)
No 0.61 0.54 0.70(7) (1) (2)
By mailYes 0.57 0.57 0.59
(38) (47) (47)No 0.60 0.65 0.65
(8) (4) (3)Through providers
Yes 0.55 0.56 0.57 €€
(24) (35) (43)No 0.61 0.61 0.70
(22) (16) (7)Through community organizations
Yes 0.56 0.58 0.58(28) (44) (44)
No 0.60 0.55 0.66(18) (7) (6)
On line via the InternetYes 0.62 0.58 0.61
(5) (14) (18)No 0.57 0.57 0.58
(41) (37) (32)
Takeup Rate1999 2000 2001
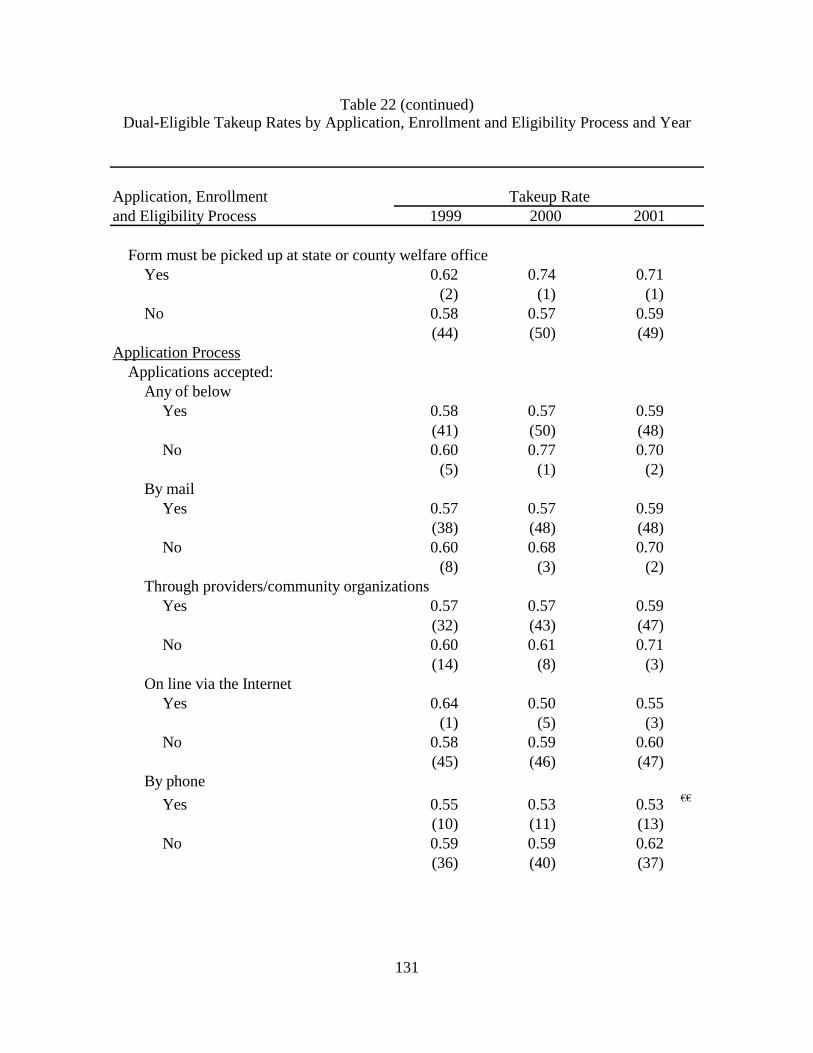
131
Table 22 (continued) Dual-Eligible Takeup Rates by Application, Enrollment and Eligibility Process and Year
Application, Enrollment and Eligibility Process
Form must be picked up at state or county welfare officeYes 0.62 0.74 0.71
(2) (1) (1)No 0.58 0.57 0.59
(44) (50) (49)Application Process
Applications accepted:Any of below
Yes 0.58 0.57 0.59(41) (50) (48)
No 0.60 0.77 0.70(5) (1) (2)
By mailYes 0.57 0.57 0.59
(38) (48) (48)No 0.60 0.68 0.70
(8) (3) (2)Through providers/community organizations
Yes 0.57 0.57 0.59(32) (43) (47)
No 0.60 0.61 0.71(14) (8) (3)
On line via the InternetYes 0.64 0.50 0.55
(1) (5) (3)No 0.58 0.59 0.60
(45) (46) (47)By phone
Yes 0.55 0.53 0.53 €€
(10) (11) (13)No 0.59 0.59 0.62
(36) (40) (37)
Takeup Rate1999 2000 2001
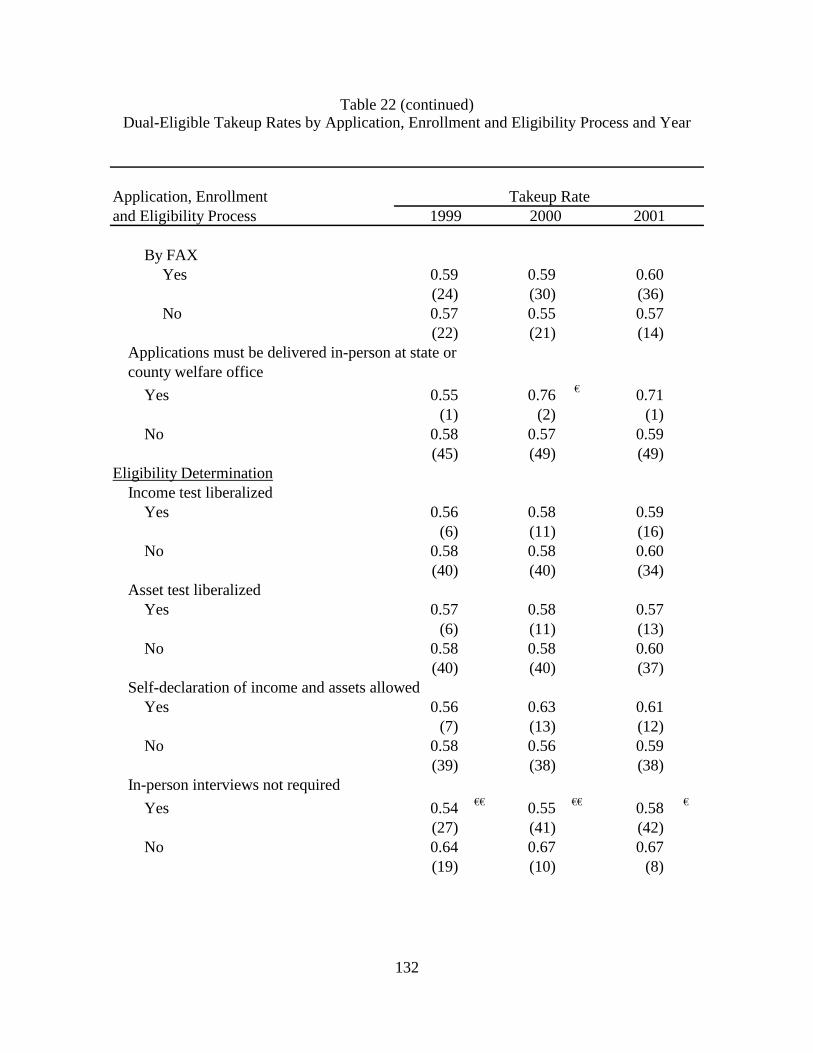
132
Table 22 (continued) Dual-Eligible Takeup Rates by Application, Enrollment and Eligibility Process and Year
Application, Enrollment and Eligibility Process
By FAXYes 0.59 0.59 0.60
(24) (30) (36)No 0.57 0.55 0.57
(22) (21) (14)Applications must be delivered in-person at state orcounty welfare office
Yes 0.55 0.76 € 0.71(1) (2) (1)
No 0.58 0.57 0.59(45) (49) (49)
Eligibility DeterminationIncome test liberalized
Yes 0.56 0.58 0.59(6) (11) (16)
No 0.58 0.58 0.60(40) (40) (34)
Asset test liberalizedYes 0.57 0.58 0.57
(6) (11) (13)No 0.58 0.58 0.60
(40) (40) (37)Self-declaration of income and assets allowed
Yes 0.56 0.63 0.61(7) (13) (12)
No 0.58 0.56 0.59(39) (38) (38)
In-person interviews not required
Yes 0.54 €€ 0.55 €€ 0.58 €
(27) (41) (42)No 0.64 0.67 0.67
(19) (10) (8)
Takeup Rate1999 2000 2001
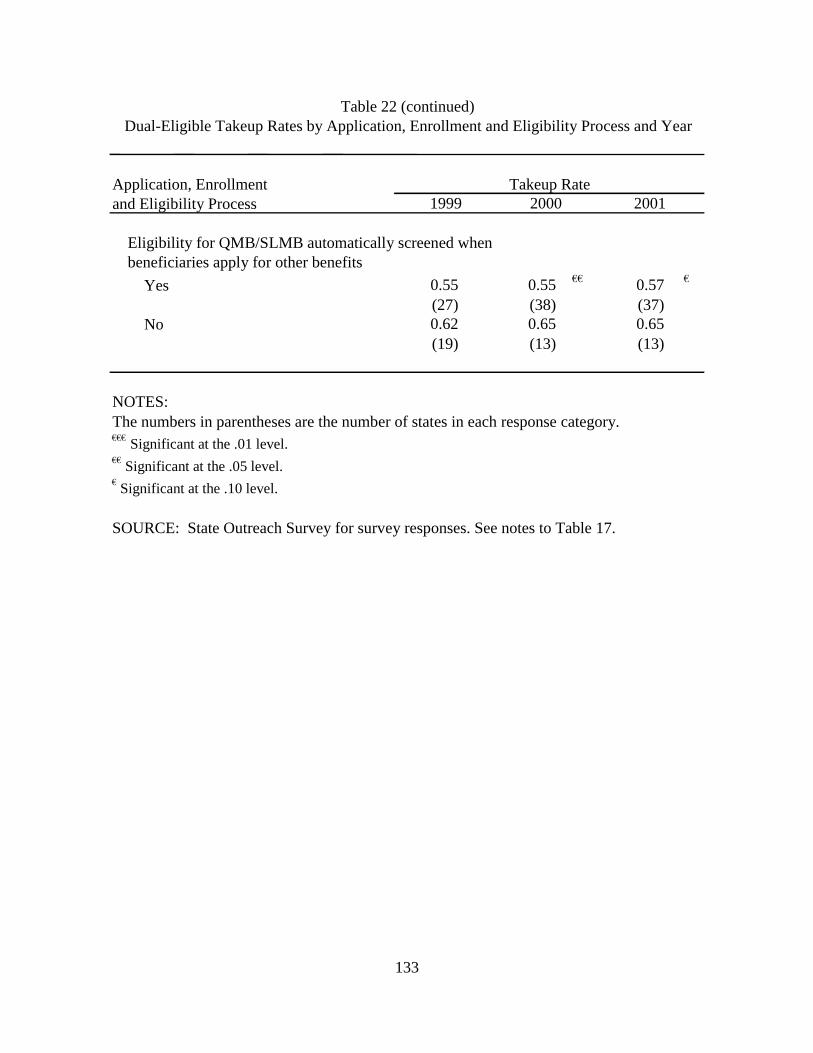
133
Application, Enrollment and Eligibility Process
Eligibility for QMB/SLMB automatically screened whenbeneficiaries apply for other benefits
Yes 0.55 0.55 €€ 0.57 €
(27) (38) (37) No 0.62 0.65 0.65
(19) (13) (13)
NOTES: The numbers in parentheses are the number of states in each response category. €€€ Significant at the .01 level. €€ Significant at the .05 level. € Significant at the .10 level.
SOURCE: State Outreach Survey for survey responses. See notes to Table 17.
Table 22 (continued)Dual-Eligible Takeup Rates by Application, Enrollment and Eligibility Process and Year
Takeup Rate 1999 2000 2001
134
5.5.4 Relationship between Takeup and Medicaid Program Characteristics
The seven Medicaid program characteristics for which comparisons of mean takeup rates were performed were: the FMAP; having a QMB-plus program; having a medically needy program; having a §209(b) program; the TANF payment standard; having a pharmacy assistance program; and the income eligibility limit for the SCHIP program (Table 24). The FMAP, TANF, and SCHIP standards were classified into “above” or “below” average; in these cases, the median was used for the average. The other three Medicaid program characteristics were classified as “yes” or “no” depending on whether a state had the program. Only those states that responded to the state outreach survey in each year are included in this table.
Consistent with the hypothesized relationship, states with a §209(b) exemption have lower takeup rates than states without the exemption and the differences were statistically significant at the 5% level or better for all three years. Having a §209(b) exemption is associated with a 0.12-0.14 reduction in the takeup rate. The takeup rate in states with a QMB-plus program was 0.08-0.10 higher than those without such a program in 2000 and 2001. The differences in mean takeup rates were not statistically significant for any of the other Medicaid program characteristics.
5.5.5 Relationship between Takeup and Underlying Socio-Economic Characteristics
Several state socio-economic characteristics were examined as factors that could potentially affect takeup rates. These include: the unemployment rate; personal per capita income; share of the state population aged 65 years and older; share of the state population with income less than the federal poverty guidelines; liberalism index; and share of state population living in urban areas during 2000 (Table 25). Except for the liberalism index, states were classified into “above” or “below” average using the median as the average. This table only includes the states that responded to the state outreach survey in a given year.
States with above average unemployment rates had higher takeup rates each year than those with below average unemployment rates; however, the results were only statistically significant for 2001. States with above average shares of the elderly had lower takeup rates than those states with below average shares; however, only the difference in 1999 was statistically significant (and only at the 10% level). Both of these results are contrary to what was expected. As hypothesized, states with an above average share of the population with income less than federal poverty guidelines had a higher takeup rate than those that are below average. The differences were statistically significant for both 2000 and 2001. Takeup rates classified by the liberalism index and by the share of the state population living in an urban were never statistically significant. Only a single year of data was available for the urbanization and political orientation measures. Therefore, the classification of states by these variables did not change over time (except for the exclusion of some states in 1999 and 2001 because they did not respond to the state outreach survey).
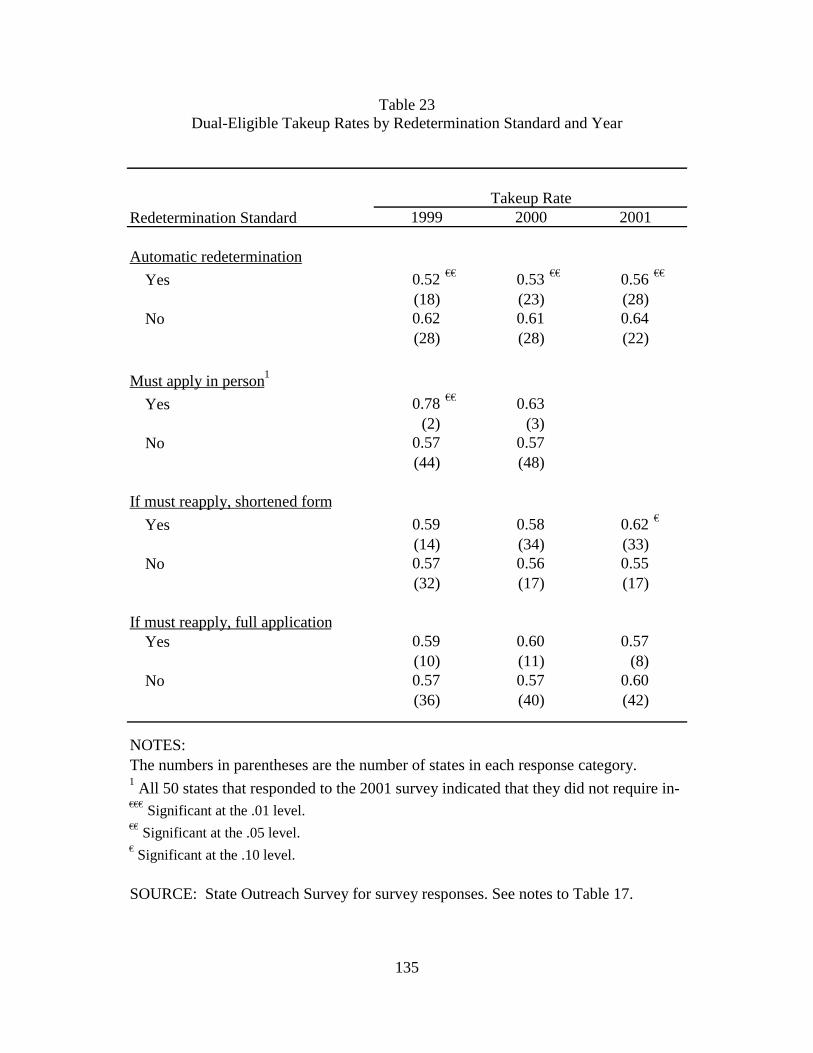
135
Table 23 Dual-Eligible Takeup Rates by Redetermination Standard and Year
Redetermination Standard
Automatic redetermination
Yes 0.52 €€ 0.53 €€ 0.56 €€
(18) (23) (28) No 0.62 0.61 0.64
(28) (28) (22)
Must apply in person 1
Yes 0.78 €€ 0.63(2) (3)
No 0.57 0.57(44) (48)
If must reapply, shortened form
Yes 0.59 0.58 0.62 €
(14) (34) (33) No 0.57 0.56 0.55
(32) (17) (17)
If must reapply, full application Yes 0.59 0.60 0.57
(10) (11) (8) No 0.57 0.57 0.60
(36) (40) (42)
NOTES: The numbers in parentheses are the number of states in each response category.
€€€ Significant at the .01 level. €€ Significant at the .05 level. € Significant at the .10 level.
SOURCE: State Outreach Survey for survey responses. See notes to Table 17.
1 All 50 states that responded to the 2001 survey indicated that they did not require in-
Takeup Rate 1999 2000 2001
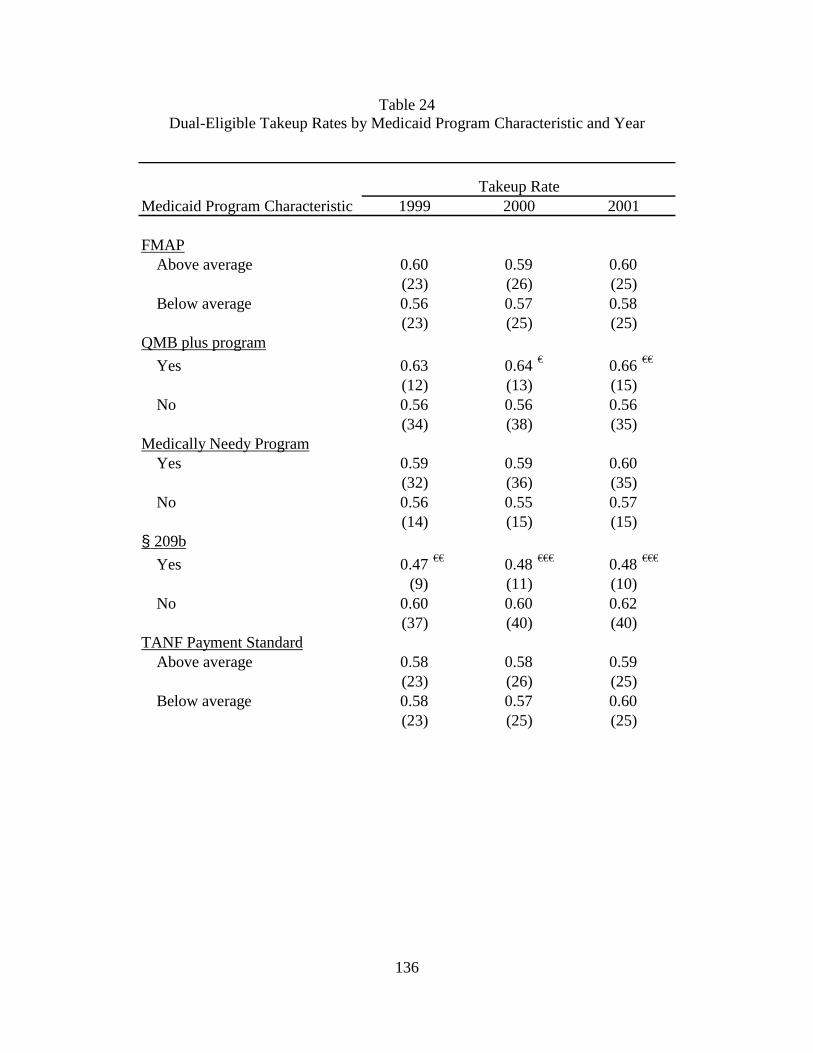
136
Table 24 Dual-Eligible Takeup Rates by Medicaid Program Characteristic and Year
Medicaid Program Characteristic
FMAPAbove average 0.60 0.59 0.60
(23) (26) (25)Below average 0.56 0.57 0.58
(23) (25) (25)QMB plus program
Yes 0.63 0.64 € 0.66 €€
(12) (13) (15)No 0.56 0.56 0.56
(34) (38) (35)Medically Needy Program
Yes 0.59 0.59 0.60(32) (36) (35)
No 0.56 0.55 0.57(14) (15) (15)
§ 209b
Yes 0.47 €€ 0.48 €€€ 0.48 €€€
(9) (11) (10)No 0.60 0.60 0.62
(37) (40) (40)TANF Payment Standard
Above average 0.58 0.58 0.59(23) (26) (25)
Below average 0.58 0.57 0.60(23) (25) (25)
Takeup Rate1999 2000 2001
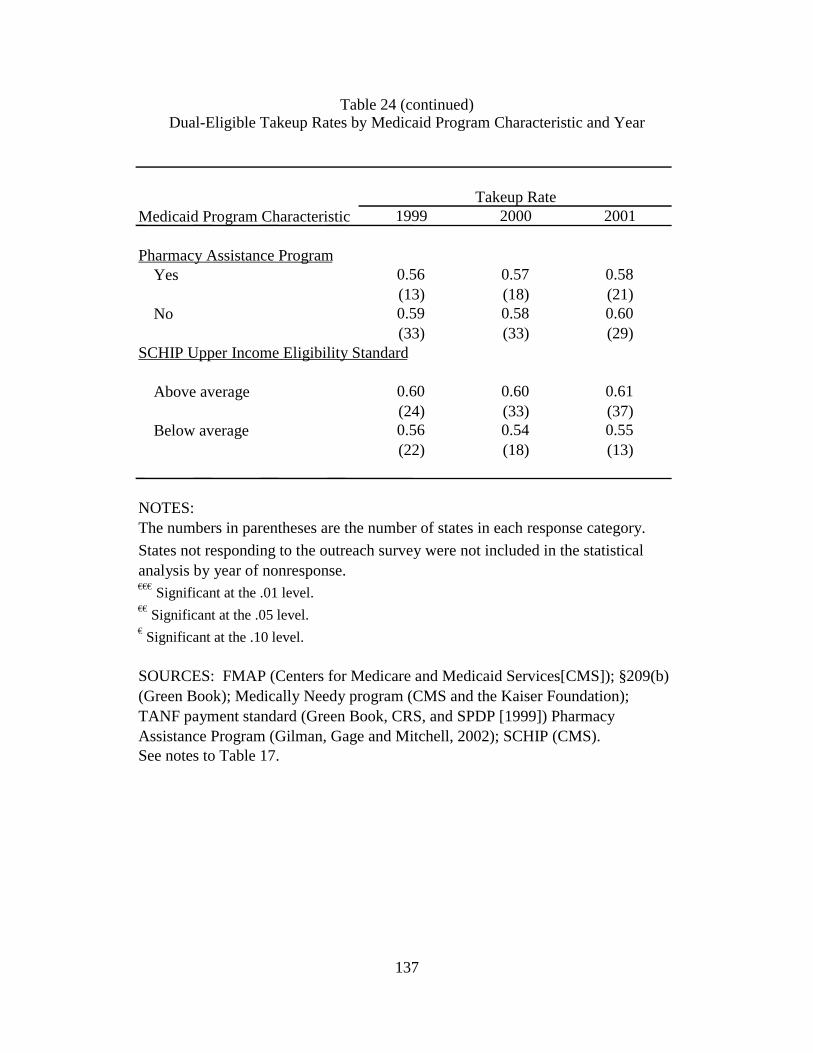
137
Table 24 (continued) Dual-Eligible Takeup Rates by Medicaid Program Characteristic and Year
Medicaid Program Characteristic
Pharmacy Assistance Program Yes 0.56 0.57 0.58
(13) (18) (21) No 0.59 0.58 0.60
(33) (33) (29) SCHIP Upper Income Eligibility Standard
Above average 0.60 0.60 0.61 (24) (33) (37)
Below average 0.56 0.54 0.55 (22) (18) (13)
NOTES: The numbers in parentheses are the number of states in each response category.
€€€ Significant at the .01 level. €€ Significant at the .05 level. € Significant at the .10 level.
See notes to Table 17.
States not responding to the outreach survey were not included in the statistical analysis by year of nonresponse.
SOURCES: FMAP (Centers for Medicare and Medicaid Services[CMS]); §209(b) (Green Book); Medically Needy program (CMS and the Kaiser Foundation); TANF payment standard (Green Book, CRS, and SPDP [1999]) Pharmacy Assistance Program (Gilman, Gage and Mitchell, 2002); SCHIP (CMS).
Takeup Rate1999 2000 2001
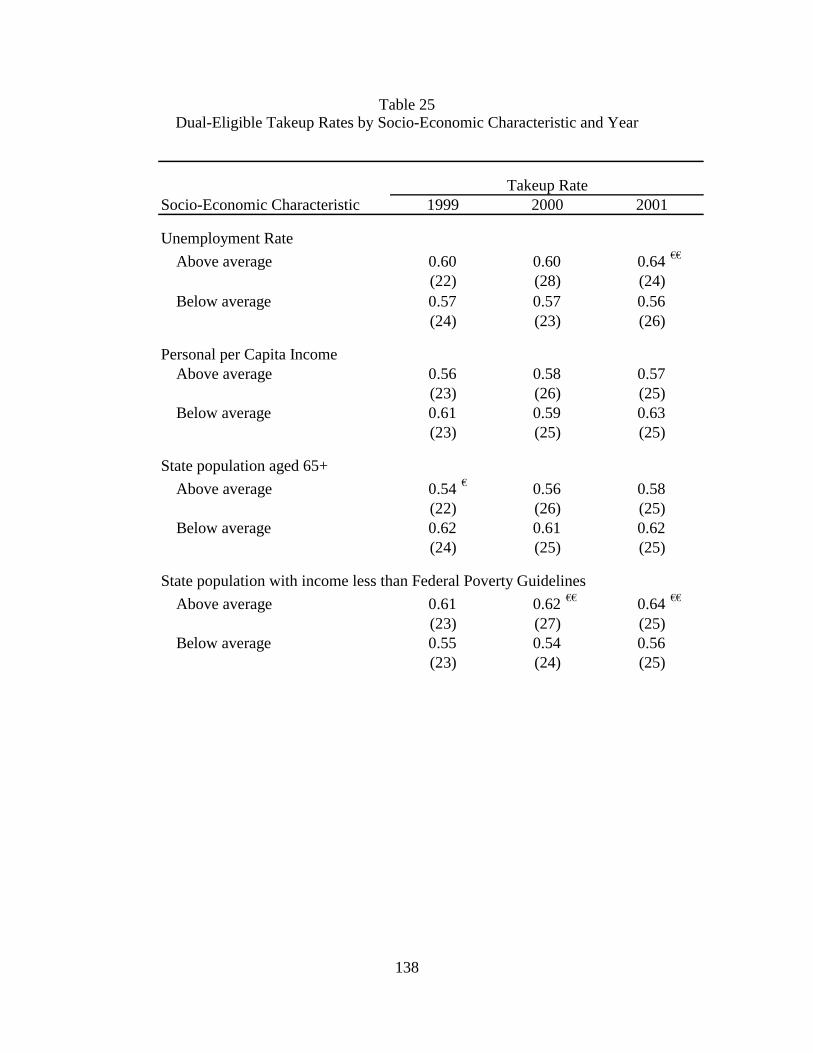
138
Table 25 Dual-Eligible Takeup Rates by Socio-Economic Characteristic and Year
Socio-Economic Characteristic
Unemployment Rate
Above average 0.60 0.60 0.64 €€
(22) (28) (24)Below average 0.57 0.57 0.56
(24) (23) (26)
Personal per Capita IncomeAbove average 0.56 0.58 0.57
(23) (26) (25)Below average 0.61 0.59 0.63
(23) (25) (25)
State population aged 65+
Above average 0.54 € 0.56 0.58(22) (26) (25)
Below average 0.62 0.61 0.62(24) (25) (25)
State population with income less than Federal Poverty Guidelines
Above average 0.61 0.62 €€ 0.64 €€
(23) (27) (25)Below average 0.55 0.54 0.56
(23) (24) (25)
Takeup Rate1999 2000 2001
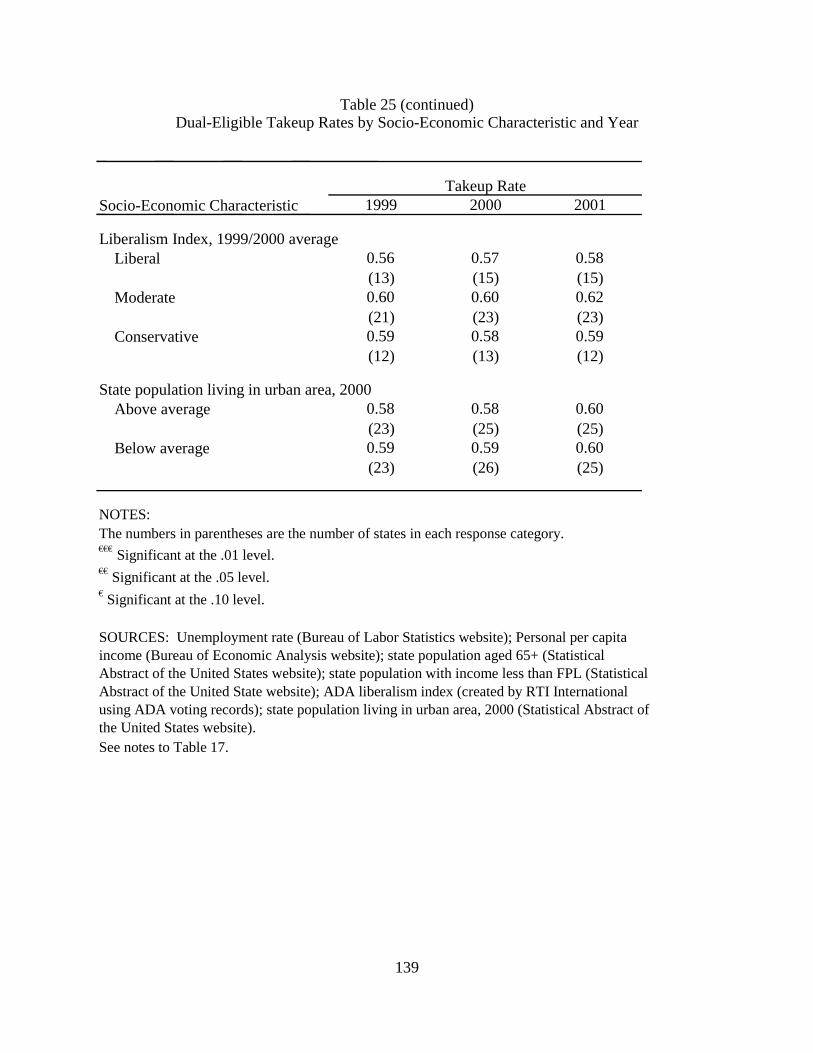
139
Table 25 (continued) Dual-Eligible Takeup Rates by Socio-Economic Characteristic and Year
Socio-Economic Characteristic
Liberalism Index, 1999/2000 average Liberal 0.56 0.57 0.58
(13) (15) (15) Moderate 0.60 0.60 0.62
(21) (23) (23) Conservative 0.59 0.58 0.59
(12) (13) (12)
State population living in urban area, 2000Above average 0.58 0.58 0.60
(23) (25) (25) Below average 0.59 0.59 0.60
(23) (26) (25)
NOTES: The numbers in parentheses are the number of states in each response category.€€€ Significant at the .01 level. €€ Significant at the .05 level. € Significant at the .10 level.
See notes to Table 17.
SOURCES: Unemployment rate (Bureau of Labor Statistics website); Personal per capita income (Bureau of Economic Analysis website); state population aged 65+ (Statistical Abstract of the United States website); state population with income less than FPL (Statistical Abstract of the United State website); ADA liberalism index (created by RTI International using ADA voting records); state population living in urban area, 2000 (Statistical Abstract of the United States website).
Takeup Rate1999 2000 2001
140
5.6 Multivariate Results
5.6.1 Cross Sectional Regressions
For the cross-sectional analyses, we first estimated models that contained all socio-economic measures plus all standard Medicaid program measures. The basic regression results, for the year 2000, are shown in two sets of columns in Table 26.
In the regression that contained only socio-economic variables, only one variable was statistically significant (population in millions), and that only marginally so with a p value of 0.087. When standard Medicaid programmatic variables were added (second set of columns) the elderly population share became marginally statistically significant (p value = 0.079), but unexpectedly had a negative sign. This negative relationship was also found in the descriptive analyses. FMAP had the expected positive sign, but was not statistically significant. The effects of both the medically needy program and §209(b) status on takeup rates were as expected with positive and negative signs respectively, although neither was statistically significant.
One of the reasons that so few variables were statistically significant is the small number of observations (51 for the year 2000), particularly relative to the number of explanatory variables. There was also considerable collinearity between the explanatory variables. We, therefore, created a parsimonious list of variables by selectively dropping variables. This was done by reviewing the correlation matrix and several regressions. The following variables were dropped because they were highly correlated with other variables: the unemployment rate, the TANF payment standard, and having a pharmacy benefits program. We also dropped variables whose values did not change over time during the study period 1999 through 2001 because they could not be used in subsequent panel analyses. These included: the urban share of population, the ADA measure of liberalism, having a medically needy program, §209(b) status, and being a QMB-plus state.
The basic parsimonious regressions are shown in Table 27. The parsimonious regression containing socio-economic variables only had two statistically significant variables (poverty and elderly shares); the elderly share, as before, had the unexpected sign. An even more parsimonious model could have been specified in order to further reduce the impact of collinearity, but that would have resulted in a model with only one or two explanatory variables and, hence, little face validity. The second regression in Table 27 includes two Medicaid program variables (FMAP and the SCHIP upper income standard). FMAP had the expected positive sign and was statistically significant at the 5% level. With the inclusion of the two Medicaid variables, the poverty share variable became statistically insignificant, while the population variable became statistically significant and had the expected positive sign.
Individual outreach activities were then added to the parsimonious model one at a time. The complete regression results including one such activity (training of state outreach workers) is shown in Table 28. The takeup rate in states that train state outreach workers was about 7% lower than in states that do not train state outreach workers; the difference is statistically significant at the 10% level. The effects of adding training of state outreach workers to the parsimonious model were as follows:
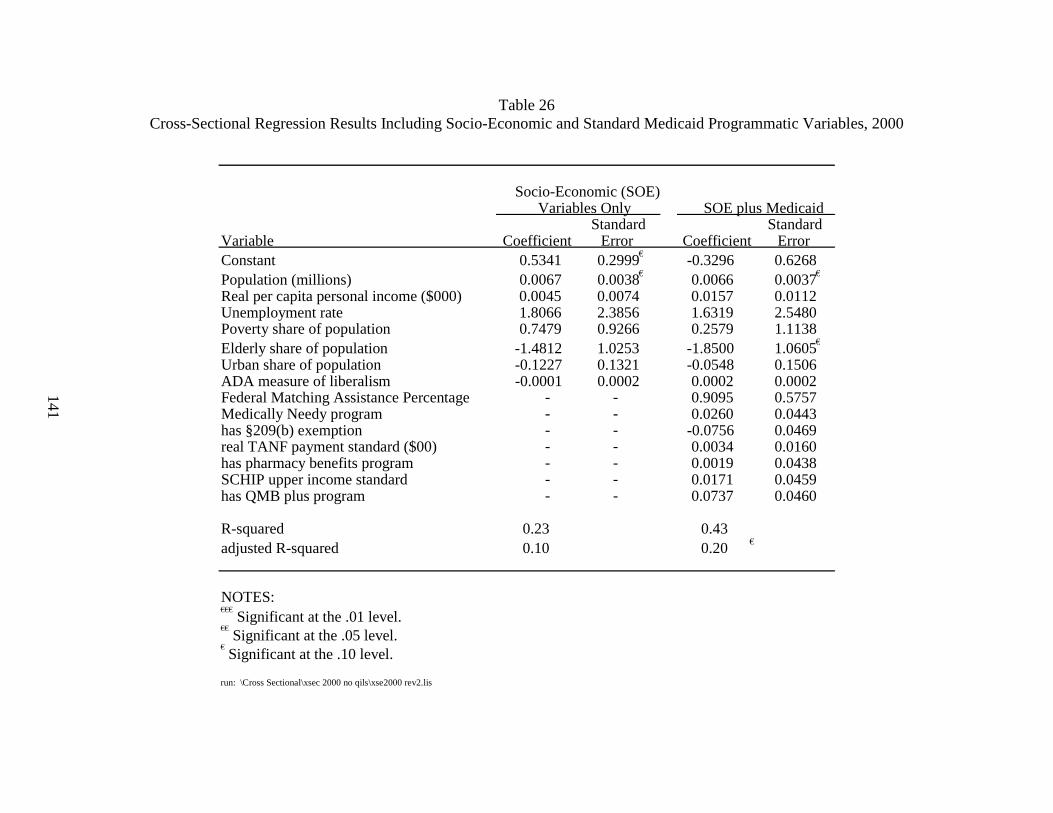
141
Table 26 Cross-Sectional Regression Results Including Socio-Economic and Standard Medicaid Programmatic Variables, 2000
Variable Coefficient CoefficientConstant 0.5341 0.2999 € -0.3296 0.6268Population (millions) 0.0067 0.0038 € 0.0066 0.0037€
Real per capita personal income ($000) 0.0045 0.0074 0.0157 0.0112Unemployment rate 1.8066 2.3856 1.6319 2.5480Poverty share of population 0.7479 0.9266 0.2579 1.1138Elderly share of population -1.4812 1.0253 -1.8500 1.0605€
Urban share of population -0.1227 0.1321 -0.0548 0.1506ADA measure of liberalism -0.0001 0.0002 0.0002 0.0002Federal Matching Assistance Percentage - - 0.9095 0.5757Medically Needy program - - 0.0260 0.0443has §209(b) exemption - - -0.0756 0.0469real TANF payment standard ($00) - - 0.0034 0.0160has pharmacy benefits program - - 0.0019 0.0438SCHIP upper income standard - - 0.0171 0.0459has QMB plus program - - 0.0737 0.0460
R-squared 0.23 0.43adjusted R-squared 0.10 0.20 €
NOTES: €€€
Significant at the .01 level.€€
Significant at the .05 level.€ Significant at the .10 level.
run: \Cross Sectional\xsec 2000 no qils\xse2000 rev2.lis
Standard Error
SOE plus MedicaidStandard
Error
Socio-Economic (SOE) Variables Only
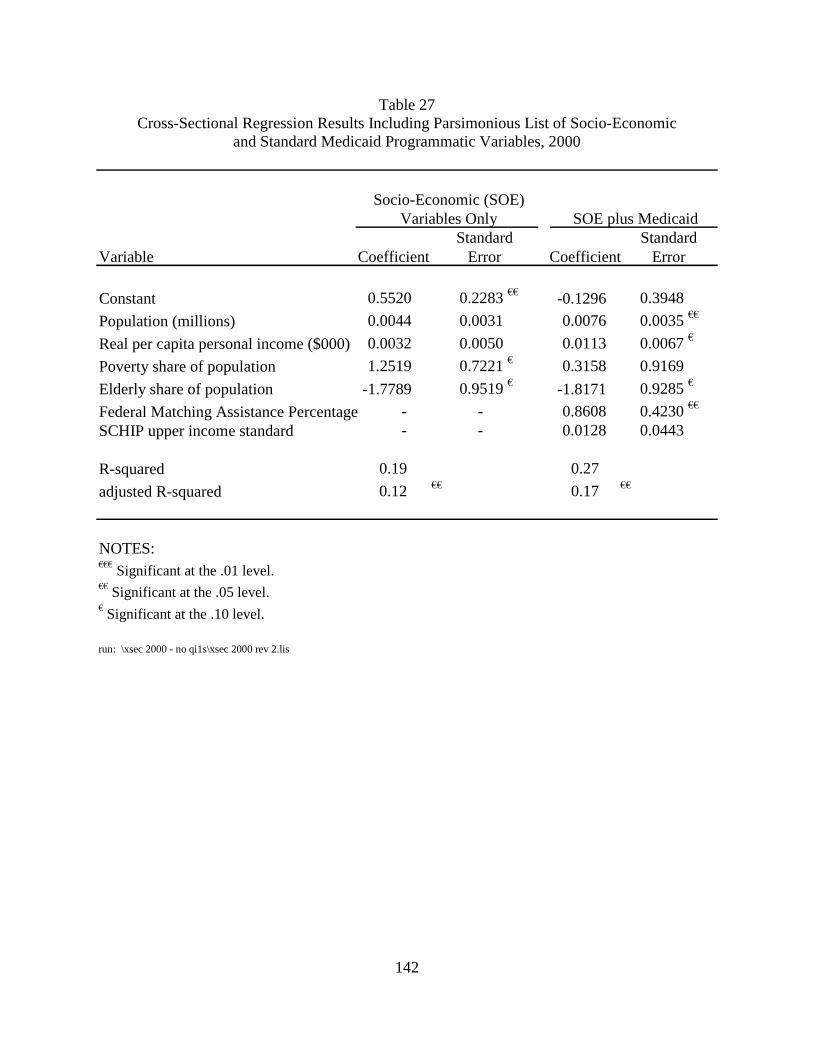
142
Table 27 Cross-Sectional Regression Results Including Parsimonious List of Socio-Economic
and Standard Medicaid Programmatic Variables, 2000
Variable Coefficient Coefficient
Constant 0.5520 0.2283 €€ -0.1296 0.3948
Population (millions) 0.0044 0.0031 0.0076 0.0035 €€
Real per capita personal income ($000) 0.0032 0.0050 0.0113 0.0067 €
Poverty share of population 1.2519 0.7221 € 0.3158 0.9169
Elderly share of population -1.7789 0.9519 € -1.8171 0.9285 €
Federal Matching Assistance Percentage - - 0.8608 0.4230 €€
SCHIP upper income standard - - 0.0128 0.0443
R-squared 0.19 0.27
adjusted R-squared 0.12 €€ 0.17 €€
NOTES: €€€ Significant at the .01 level. €€ Significant at the .05 level. € Significant at the .10 level.
run: \xsec 2000 - no qi1s\xsec 2000 rev 2.lis
StandardError
StandardError
SOE plus MedicaidVariables OnlySocio-Economic (SOE)

143
• the statistical significance of one of the basic parsimonious model variables was slightly affected: FMAP’s regression coefficient declined slightly and it was statistically significant at the 10% level rather than at the 5% level it had been in Table 27; and
• the adjusted R-squared of the model was 0.204, at least two percentage points higher than the models without outreach activities included as regressors.
The above results were not always found in each of the other cross-sectional regressions, but are highlighted as an example of how sensitive the results are to the specification of the regressions.
Table 29 shows the regression results for those outreach activities that were significant in the cross-sectional regressions, as well as the coefficients for our aggregate outreach measures. For brevity, we do not display the results for Medicaid program and socio-economic variables included in the models.
Only 10 of the individual state outreach activities had a statistically significant impact on takeup rates (upper panel of Table 29). Of these, only two had regression coefficients in the expected direction: having a §1634 Agreement and using CMS’ SDX data. Among the state outreach variables that had regression coefficients in the opposite direction expected were two live presentation activities (small groups and one-on-one), training of state outreach workers, state Medicaid partnerships (with state income maintenance divisions, statewide task forces, and CMS), requiring delivery of applications in-person at welfare offices, and not requiring in-person interviews for eligibility determination. A comprehensive list of all of the regression coefficients for outreach activities in the year 2000 cross-sectional regressions can be found in the tables in Appendix J.
The bottom panel of Table 29 shows the regression coefficients for the aggregate or global state outreach variables. None of these aggregate or global measures of state outreach activity were statistically significant. We also estimated a cross-section model including the first four count variables and automatic redetermination, as well as the Medicaid program and socio-economic variables. None of the outreach variables were significant in this specification either (results not shown).
5.6.2 Panel Regressions
We estimated two basic panel models. We present the results for the random effects model because, as discussed in Section 5.4, it makes less restrictive assumptions about the error term in the model. The signs and statistical significance of the state outreach activity measures were similar in the fixed effects and random effects models. The socio-economic and Medicaid program variables, however, were more likely to be statistically significant in the random effects models than in the fixed effects models.
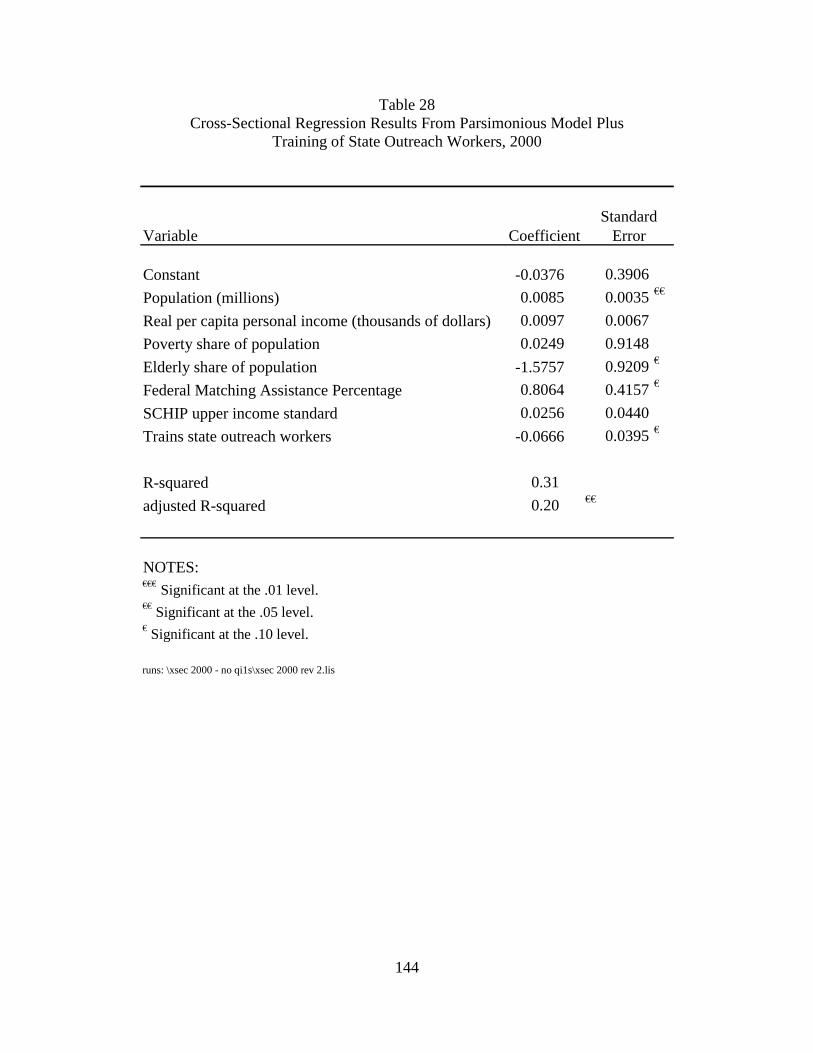
144
Table 28 Cross-Sectional Regression Results From Parsimonious Model Plus
Training of State Outreach Workers, 2000
Variable Coefficient
Constant -0.0376 0.3906
Population (millions) 0.0085 0.0035 €€
Real per capita personal income (thousands of dollars) 0.0097 0.0067
Poverty share of population 0.0249 0.9148
Elderly share of population -1.5757 0.9209 €
Federal Matching Assistance Percentage 0.8064 0.4157 €
SCHIP upper income standard 0.0256 0.0440
Trains state outreach workers -0.0666 0.0395 €
R-squared 0.31
adjusted R-squared 0.20 €€
NOTES: €€€ Significant at the .01 level. €€ Significant at the .05 level. € Significant at the .10 level.
runs: \xsec 2000 - no qi1s\xsec 2000 rev 2.lis
Standard Error
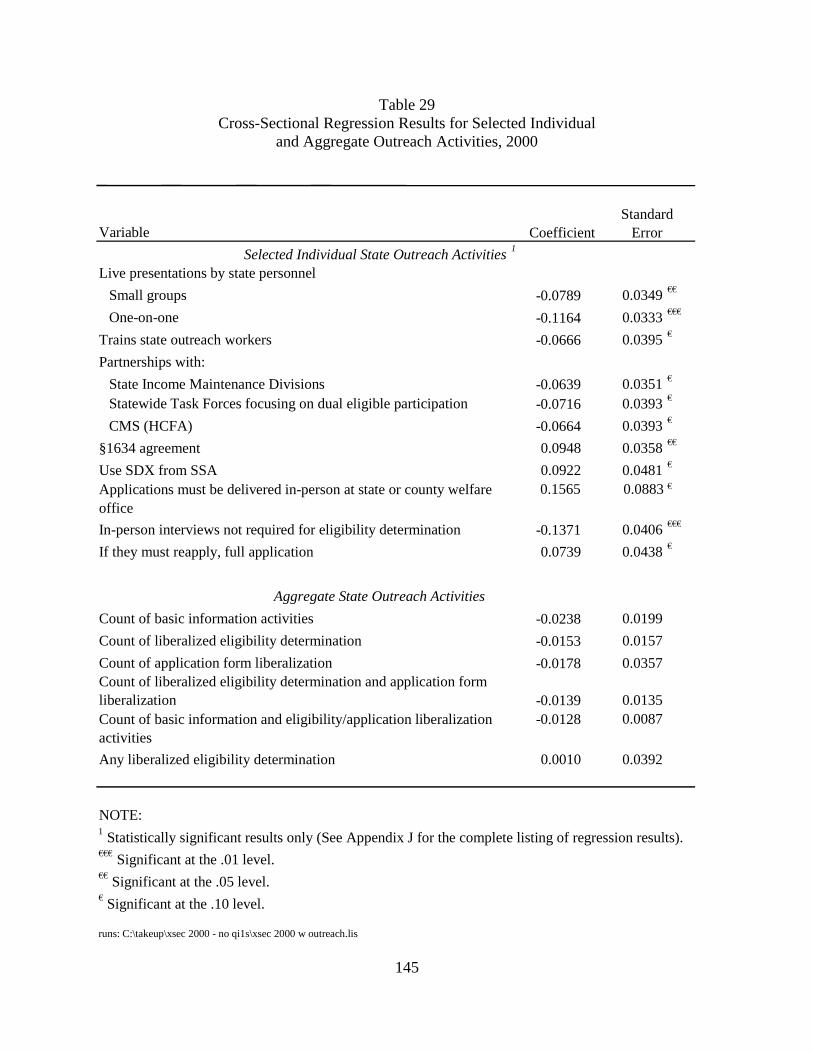
145
Table 29 Cross-Sectional Regression Results for Selected Individual
and Aggregate Outreach Activities, 2000
Variable Coefficient Selected Individual State Outreach Activities 1
Live presentations by state personnel Small groups -0.0789 0.0349 €€
One-on-one -0.1164 0.0333 €€€
Trains state outreach workers -0.0666 0.0395 €
Partnerships with: State Income Maintenance Divisions -0.0639 0.0351 €
Statewide Task Forces focusing on dual eligible participation -0.0716 0.0393 €
CMS (HCFA) -0.0664 0.0393 €
§1634 agreement 0.0948 0.0358 €€
Use SDX from SSA 0.0922 0.0481 €
Applications must be delivered in-person at state or county welfare office
0.1565 0.0883 €
In-person interviews not required for eligibility determination -0.1371 0.0406 €€€
If they must reapply, full application 0.0739 0.0438 €
Aggregate State Outreach Activities
Count of basic information activities -0.0238 0.0199 Count of liberalized eligibility determination -0.0153 0.0157 Count of application form liberalization -0.0178 0.0357 Count of liberalized eligibility determination and application form liberalization -0.0139 0.0135 Count of basic information and eligibility/application liberalization activities
-0.0128 0.0087
Any liberalized eligibility determination 0.0010 0.0392
NOTE:
€€€ Significant at the .01 level. €€ Significant at the .05 level. € Significant at the .10 level.
runs: C:\takeup\xsec 2000 - no qi1s\xsec 2000 w outreach.lis
1 Statistically significant results only (See Appendix J for the complete listing of regression results).
StandardError
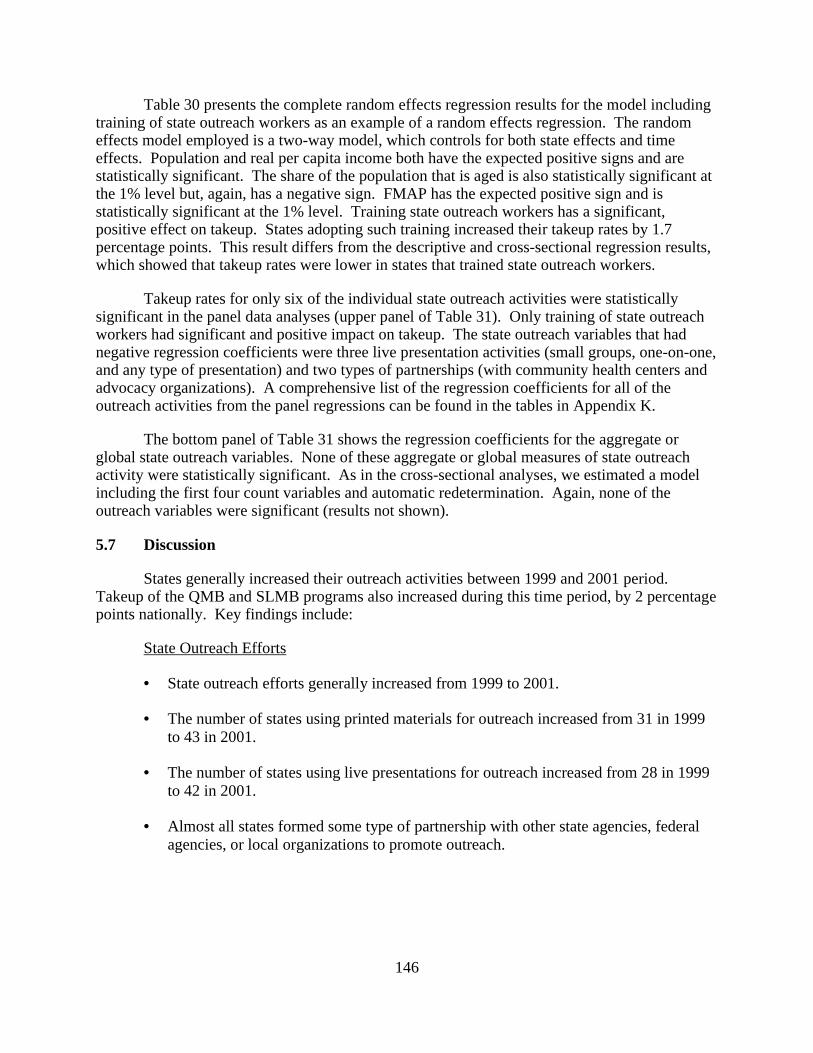
146
Table 30 presents the complete random effects regression results for the model including training of state outreach workers as an example of a random effects regression. The random effects model employed is a two-way model, which controls for both state effects and time effects. Population and real per capita income both have the expected positive signs and are statistically significant. The share of the population that is aged is also statistically significant at the 1% level but, again, has a negative sign. FMAP has the expected positive sign and is statistically significant at the 1% level. Training state outreach workers has a significant, positive effect on takeup. States adopting such training increased their takeup rates by 1.7 percentage points. This result differs from the descriptive and cross-sectional regression results, which showed that takeup rates were lower in states that trained state outreach workers.
Takeup rates for only six of the individual state outreach activities were statistically significant in the panel data analyses (upper panel of Table 31). Only training of state outreach workers had significant and positive impact on takeup. The state outreach variables that had negative regression coefficients were three live presentation activities (small groups, one-on-one, and any type of presentation) and two types of partnerships (with community health centers and advocacy organizations). A comprehensive list of the regression coefficients for all of the outreach activities from the panel regressions can be found in the tables in Appendix K.
The bottom panel of Table 31 shows the regression coefficients for the aggregate or global state outreach variables. None of these aggregate or global measures of state outreach activity were statistically significant. As in the cross-sectional analyses, we estimated a model including the first four count variables and automatic redetermination. Again, none of the outreach variables were significant (results not shown).
5.7 Discussion
States generally increased their outreach activities between 1999 and 2001 period. Takeup of the QMB and SLMB programs also increased during this time period, by 2 percentage points nationally. Key findings include:
State Outreach Efforts
• State outreach efforts generally increased from 1999 to 2001.
• The number of states using printed materials for outreach increased from 31 in 1999 to 43 in 2001.
• The number of states using live presentations for outreach increased from 28 in 1999 to 42 in 2001.
• Almost all states formed some type of partnership with other state agencies, federal agencies, or local organizations to promote outreach.

147
Table 30 Random Effects Regression Results, 1999-2001
Variable Coefficient
Constant -0.0566 0.2877
Population (millions) 0.0085 0.0030 €€€
Real per capita personal income ($000) 0.0102 0.0048 €€
Poverty share of population -0.0905 0.1938
Elderly share of population -1.8833 0.7244 €€€
Federal Matching Assistance Percentage 0.9084 0.2693 €€€
SCHIP upper income standard 0.0018 0.0080
Trains state outreach workers 0.0172 0.0076 €€
R-squared 0.30
NOTES: Oklahoma only responded to the 2000 survey and, therefore, was excluded from the regressions.€€€ Significant at the .01 level. €€ Significant at the .05 level. € Significant at the .10 level.
run: \gp6\section agg - 6.lis
Standard Error
148
Table 31 Random Effects Regression Results for Selected Individual
and Aggregate Outreach Activities
Variable Coefficient Selected Individual State Outreach Activities1
Live presentations by State personnel at health fairs -0.0142 0.0065 €€
for small groups -0.0145 0.0070 €€
any -0.0181 0.0079 €€
Trains state outreach workers 0.0172 0.0076 €€
Partnership with community health centers -0.0116 0.0069 €
State Medicaid Program has a partnership with advocacy organizations -0.0170 0.0070 €€
Aggregate State Outreach ActivitiesCount of basic information activities -0.0050 0.0037Count of liberalized eligibility determination 0.0003 0.0032Count of application form liberalization -0.0032 0.0043Count of liberalized eligibility determination and application form liberalization-0.0007 0.0022Count of basic information and eligibility/application liberalization -0.0013 0.0016Any liberalized eligibility determination 0.0037 0.0084
NOTE: 1 Statistically significant results only (See Appendix K for the complete listing of regression results.)€€€
Significant at the .01 level. €€
Significant at the .05 level. € Significant at the .10 level.
run: \gp6\section agg - 6.lis
ErrorStandard
149
States took some major steps towards simplifying the application, enrollment, and eligibility process during this period. For instance, the number of states using a shortened application form for QMB/SLMB benefits increased from 18 in 1999 to 38 in 2001.
Takeup Rates
• Takeup rates in 2001 ranged from 0.26 in New Hampshire and North Dakota to 0.88 in California.
• The national average takeup rate increased from 0.62 in 1999 to 0.64 in 2001.
• Takeup rates decreased in 15 states and increased in 36 states between 1999 and 2001.
However, we found that differences in outreach activities did not explain the variation in state take-up rates. In most instances, we found no significant relationship between performing an outreach activity and enrollment in the QMB and SLMB programs. The descriptive analyses showed three instances in which performing an outreach activity was associated with significantly higher takeup rates (use of a shortened application form in 2001 and having a §1634 Agreement in 2000 and 2001). In the cross-sectional multivariate regressions for 2000, two outreach activities were associated with higher takeup rates – having a §1634 Agreement that allows automatic enrollment of SSI beneficiaries in Medicaid and using SSA’s SDX data. In the panel data analyses, training state outreach workers was associated with significantly higher takeup rates. While the descriptive and the cross-sectional analyses did not show a positive impact of the training of outreach workers on take-up rates, the panel analysis results are similar to those found in our analysis of enrollment pathways (Chapter 2). If this result is not a random finding, it suggests that eligible but unenrolled Medicare beneficiaries might enroll if they had more assistance from state outreach workers in completing and submitting applications as well as going through the other steps involved in enrolling. To the extent that there were significant relationships, both the descriptive and multivariate analyses more often found a negative relationship between performance of outreach activities and program takeup.
There are several possible explanations for our findings.
• Reverse Causality. It is possible that there is an additional causal relationship between outreach and enrollment that moves in the opposite direction of the relationship tested in these analyses, i.e., a state’s takeup rate affects the likelihood that it will perform outreach activities rather than vice versa. Under this scenario, we might hypothesize that a state with a low takeup rate would be more likely to invest in outreach activities in order to increase enrollment than one with a high takeup rate. Indeed, this relationship was found in previous research (Shaner, 1999). While we could not test for this relationship directly using the data available to us, there are reasons to believe it is plausible. First, performing outreach is not costless. Thus, only those states most likely to perceive a benefit from these activities (i.e., those with low takeup) are likely to invest in them. Second, as part of its GPRA initiative, CMS established a goal for each state of increasing enrollment of dual eligibles by 4%. CMS also used the outreach survey as part of its assessment of whether states had met their GPRA goal. For states that did not achieve 4% growth, CMS took into account performance of outreach activities as reported in the state outreach survey in
150
determining whether a state had met its GPRA goal. In light of this policy, states with low takeup rates may have undertaken outreach activities in order to satisfy CMS’ requirements.
• Large number of variables tested. Because of the large number of variables tested, a certain number of significant results are expected by random chance alone. For example, of the 212 variables tested in the descriptive analyses, approximately 11 will be significant due to random chance at the p=.05 level of statistical significance. Thus, it is possible that some of our significant results do not reflect a true association between outreach activities and program enrollment.
There are a number of limitations to our study that may explain the preponderance of insignificant results in our analyses. These are discussed in turn below:
• Limited time period for the study. There were only three years of data available for our study. This period may not have allowed adequate time to observe the impact of increasing outreach activities. In addition, because the state is the unit of observation in our analyses, the sample size was small even in the panel data analyses that incorporated all three years of data.
• Limited variation in key variables. Variation in the takeup rate and in the explanatory variables in our models was limited in a number of states during the three-year study period. In particular, takeup rates for 20 states changed less than two percentage points between 1999 and 2001. Extending the study period would have allowed for more variation.
• Lagged relationship between outreach and enrollment. The analyses presented examine the relationship between outreach activities and enrollment in the same year. However, it is possible that the impact of new outreach initiatives on enrollment might not be observed until the following year, particularly if the initiative is implemented late in the year or if there are delays in processing applications. We tested this using 1999 and 2000 outreach activities as predictors of enrollment in 2000 and 2001, respectively, and did not find evidence to support the hypothesis that outreach has a lagged effect on enrollment. Findings from these lagged analyses were similar to those using concurrent outreach and enrollment variables.
• Intensity of outreach effort. Our analyses mainly used simple binary variables to indicate whether a state had undertaken a particular outreach activity in a given year. Although we had hoped to measure intensity of outreach efforts, this was not possible based on the responses to the state outreach survey. As a result, our outreach variables may not have been refined enough to accurately identify enrollment impacts. For example, the impact of mailing 10,000 letters to potential beneficiaries in a large state like California might be considerably different than the impact of mailing 300,000 letters. However, our analyses could not distinguish cases such as these. We attempted to address this partially by creating aggregate outreach variables that reflected the scope of outreach activities undertaken by a state. These aggregate variables were never significant in our analyses.
• Errors in measurement of takeup rates. As specified by CMS, the denominator for our takeup rate is ARC’s estimate of the number of Medicare beneficiaries who are
151
potentially eligible for Medicaid as SSI, MN, QMB, or SLMB. Consistent with this, our numerator includes these four groups. It is quite difficult to reliably estimate the number of Medicare beneficiaries that qualify for buy-in status, particularly for the QMB, SLMB, and MN programs. As a result, our takeup rates may not be accurate. ARC’s memo on its methodology for estimating potential eligibles notes a number of challenges in estimating eligibility for means tested programs, including the lack of data on assets in the survey datasets typically used, difficulty matching the income reporting period used in survey data with that used to determine program eligibility (annual vs. monthly income), and the poor quality of income and asset data from surveys. Another related issue is that eligibility can be determined on an individual or on a couple basis; however, the income information in the datasets used to estimate eligibles is usually family income. In addition, ARC did not have income and asset data for the years included in our study (1999-2001). Instead, they had to age forward data for 1996-1998, which undoubtedly introduced measurement error. Estimating the population potentially eligible for MN programs poses particularly thorny problems because their eligibility is based on income net of medical expenses, but only gross income is available from survey data. ARC’s estimate of the population potentially eligible for SSI, MN, QMB, and SLMB included Medicare beneficiaries with incomes up to 120% of FPL. However, MN beneficiaries can have incomes that exceed this level if they incur sufficiently large medical expenses. Indeed, ARC’s memo on its estimation methodology noted that approximately one-quarter of the people that reported themselves as being eligible for Medicaid in the surveys used for their estimates had incomes above 120% of FPL. Thus, while the numerator includes all MN enrollees regardless of income, the denominator does not include people with incomes above 120% of FPL who are eligible as MN.
• Inclusion of SSI and MN in takeup rates. We expect that SSI and MN enrollment will be less affected by outreach activities than will QMB and SLMB enrollment. In states with a §1634 agreement with the SSA to automatically buy all SSI recipients into Medicaid, Medicaid buy-in does not require any action by SSI beneficiaries and should be virtually 100%. Enrollment of MN beneficiaries is likely to be triggered by health events leading to institutionalization or other sources of high health care expenditures. As a result, inclusion of SSI and MN beneficiaries in the takeup rate dilutes the impact of outreach activities on enrollment and biases our analyses toward insignificant findings. We attempted to address this problem by excluding SSI beneficiaries from the denominator using data on the number of SSI recipients in each state obtained from the SSA. However, counts of SSI beneficiaries in the TPEarth were often not consistent with the counts reported by the SSA. As a result, this exclusion yielded implausible takeup rates in a number of states (e.g., considerably greater than 100%). Exclusion of MN beneficiaries is even more challenging because an unknown number have incomes greater than 120% of FPL. Thus, it is not accurate to simply exclude them from the numerator and the denominator when calculating the takeup rate. Our beneficiary survey (discussed in Chapter 2), which was limited to QMBs and SLMBs, allows us to test the sensitivity of the findings in this chapter to inclusion of SSI and MN beneficiaries. Those analyses showed that allowing self-declaration of assets and training outreach workers increased enrollment. However, shortened application forms and automatic screening for QMB and SLMB eligibility
152
when individuals apply for other Medicaid programs were associated with a lower likelihood of enrollment, all else equal, and liberalized asset limits had no effect on enrollment. Thus, it appears that excluding SSI and MN beneficiaries would not substantially change the findings in this chapter.
• Quality of state outreach survey data. The quality of some of the responses to the state outreach survey is of concern. Errors in measuring the outreach variables bias our analyses toward insignificant findings. For instance, several states reported receiving Leads Data, although CMS had not sent them the data. Data on provider access issues were poorly reported. Finally, in most cases we assumed that states did not perform an outreach activity if they did not complete an item on the survey, rather than assuming that the data were simply missing.
The large number of insignificant results in our analyses may also indicate that outreach alone is not adequate to increase program enrollment. The difficulties that beneficiaries have with the application process suggest the importance of complementing outreach efforts with assistance in completing the application. If, as our findings suggest, outreach activities do not explain the state enrollment variation in QMB and SLMB programs, the question remains how beneficiaries come to enroll in the programs. First, there are other means by which Medicare beneficiaries could have learned about the QMB and SLMB programs besides the outreach activities measured in the state outreach survey. For example, our survey analyses reported in Section 5.2 showed that enrollment was often precipitated by a hospitalization or a move into subsidized housing when a social worker or other service coordinator may have provided information about the program. Enrollment was also associated with receiving other types of assistance from social, community or government services. Some of these entities may not have had formal partnerships with the state Medicaid agency. Thus beneficiaries may have received “outreach” from sources not captured in the state outreach survey. Second, the spread of information about government programs does not always require formal information channels. That is, “word-of-mouth” and other such informal methods might be important information channels.
Although our analysis provides little empirical evidence that outreach has a positive impact on enrollment, our findings are not conclusive given the limitations of our study. While we attempted to assess the impact of these limitations on our finding to the extent possible, there remain problems that we could not address. Further work on this issue should seek to disentangle the direction of the causal relationship between outreach and enrollment in order to understand the negative relationships identified in our analyses. Future research would be enhanced by having a longer study period and improved data on outreach activities, particularly on the intensity of outreach efforts. In addition to improved information on the intensity of outreach efforts, improved information on QMB-specific and SLMB-specific outreach activities would be important, especially if take-up rates exclusive of SSI and MN can be developed. However, our lack of success in collecting this information suggests that it may be difficult to obtain data at this level of specificity, either because states do not record it or it is not readily obtainable from state record systems.
153
CHAPTER 6 IMPACT OF THE MEDICARE SAVINGS PROGRAMS
ON MEDICARE SERVICE USE AND OUT-OF-POCKET COSTS
6.1 Introduction
The Medicare Savings Programs were designed to provide low-income Medicare beneficiaries with assistance in paying their out-of-pocket expenses for medical care services. Depending on the particular program a beneficiary qualifies for, this may include the Part B premium,37 Part A and B deductibles, and Part A and B coinsurance amounts. In addition, some beneficiaries receive full Medicaid benefits including services, such as prescription drugs, that are not covered by Medicare. In general, Medicare Savings Programs enrollment is expected to improve access to care and reduce beneficiary out-of-pocket expenditures. However, the extent of the impact is likely to vary with the benefit for which a beneficiary qualifies.
This chapter examines the impact of the Medicare Savings Programs on Medicare service use and beneficiary out-of-pocket costs. Although there has been no previous research on the effect of Medicare Savings Programs enrollment on out-of-pocket costs, several previous studies have documented higher Medicare service use and cost among Medicare Savings Programs enrollees as compared to eligible nonenrollees. Parente and Evans (1998) found that QMB enrollees were significantly more likely than nonenrollees to have some use of both Part A and Part B services and, for those with service use, significantly higher Part B expenses. A more detailed analysis by type of service showed that enrollees had greater use of inpatient care, outpatient hospital care, physician office visits, prescription medicine, and home health care (Pezzin and Kasper, 2002). Neumann et al. (1995) also found that eligible beneficiaries with greater numbers of hospital, physician, and emergency room visits were more likely to enroll in the QMB program. In contrast, the Barents Group (1999) found no significant difference between QMB enrollees and nonenrollees in the likelihood of having at least one hospital stay, SNF admission, or home health visit, although enrollees were significantly more likely to have an outpatient hospital visit. On the other hand, SLMB enrollees were more likely than nonenrollees to use inpatient hospital, outpatient hospital, and home health services.
One limitation of these studies is that they do not differentiate among QMB beneficiaries on their basis of eligibility or on the benefit package for which they qualify. Thus, the QMB group includes beneficiaries who are otherwise eligible for Medicaid as SSI recipients. In addition, SSI beneficiaries and QMBs who live in states that have elected to provide full Medicaid benefits to dually eligible beneficiaries up to 100% of the federal poverty level (FPL) receive a much richer benefit package than other QMBs, who only receive coverage of Medicare cost-sharing payments.
This chapter examines the following two main study questions:
• What is the impact of enrollment in the Medicare Savings Programs on Medicare costs and service use?
37 Medicaid will also cover the Part A premium for the small number of beneficiaries that are required to pay it.
154
• What is the impact of enrollment in the Medicare Savings Programs on beneficiary out-of-pocket costs?
For both questions, we conducted two types of analyses:
• comparisons between Medicare Savings Programs enrollees based on the specific program benefits they qualify for, and
• comparisons between enrollees and eligible nonenrollees.
Each analysis looks at four subpopulations of Medicare Savings Programs enrollees separately: SSI, QMB in states offering full Medicaid benefits (called QMB-plus), QMB in standard benefit states (called standard benefit QMB), and SLMB. For the comparison of service use and costs, we also analyze the extent to which adverse selection due to the enrollment of higher service users in the Medicare Savings Programs explains differences in service use between enrollees and eligible nonenrollees.
The beneficiary survey (Chapter 2) also addressed some of the questions covered in this chapter. The analyses in this chapter extend our findings from the beneficiary survey in several ways:
• Data are available for a larger sample of beneficiaries than are included in the beneficiary survey.
• Data are available for SSI beneficiaries, who are excluded from our beneficiary survey.
• Nonenrollees are identified based on the specific program benefits they qualify for.
• Data on Medicare service use are more reliable because they are derived from claims data, rather than self-report.
• More detailed data are available on service use and costs, as well as out-of-pocket costs.
• More detailed information on beneficiary characteristics is available for our MCBS analyses.
However, the findings reported in this chapter largely confirm the findings reported in Chapter 2.
The remainder of this chapter is organized as follows. The next section describes the expected effect of Medicare Savings Programs enrollment on service use, differentiating among types of enrollees and types of service. This is followed by a description of our data sources and analytic methods. Next, we describe findings on Medicare Savings Programs impacts on Medicare service use and costs, first comparing types of Medicare Savings Programs enrollees and then comparing enrollees and nonenrollees. The section also describes findings from our adverse selection analyses. The following section describes findings on out-of-pocket costs, first based on comparisons by type of enrollee and then based on comparisons of enrollees and nonenrollees. The chapter concludes with a discussion of the findings.
155
6.2 Hypothesized Effects of Medicare Savings Programs Enrollment
Depending on the type of coverage a beneficiary is eligible for, enrolling in the Medicare Savings Programs can affect Medicare service use and beneficiary out-of-pocket costs through three mechanisms.38 We discuss the effect of each of these in turn.
Coverage of Medicare premiums: Medicaid pays the Medicare premiums for all four types of enrollees. This leaves enrollees with greater disposable income that can be used to purchase medical care services, as well as other types of goods and services. For a low-income population, the Medicare Part B premium can represent a sizeable proportion of total income – 8% for a single person and 12% for a couple in 2003.39 This is expected to increase demand for services and reduce total out-of-pocket costs for medical care including health insurance premiums. However, out-of-pocket costs for medical services alone could increase if this additional income is used to purchase services for which the beneficiary has some financial liability.40
Coverage of Medicare cost-sharing: Medicaid pays the Medicare deductibles and copayments for SSI, QMB-plus, and standard benefit QMB beneficiaries. This reduces the effective price of Medicare services to zero for these beneficiaries, which is expected to increase demand for these services41 and reduce out-of-pocket costs for Medicare-covered services.42
38 Coverage of the Part B premium might also encourage beneficiaries who were not enrolled in Medicare Part B to
sign up for this coverage. For these beneficiaries, the impact of enrolling would be substantial. However, we assume that most enrollees would have had Part B coverage in the absence of the Medicare Savings Program.
39 The Medicare Part B premium was $58.70 per month in 2003. The 2003 FPL was $8,980 for a single person and $12,120 for a couple.
40 This is most likely to be the case for SLMBs, who are liable for cost-sharing on Medicare-covered services and the full cost of non-Medicare services, and for QMBs in standard benefit states, who are liable for the full cost of non-Medicare services. SSI and QMB-plus beneficiaries are only liable for the cost of services that are not covered by either Medicare or Medicaid.
41 The impact on service use would be reduced to the extent that Medicare cost-sharing payments were borne by providers as bad debt. Under this scenario, covering Medicare cost-sharing payments would mainly redistribute income to providers.
42 In addition, these savings on out-of-pocket costs provide additional disposable income that can be used to purchase non-covered services for which the beneficiary is financially liable. Thus, use of non-Medicare-covered services could also increase and the beneficiary’s out-of-pocket costs for these services could increase. For the SSI and QMB-plus groups, this effect would only be observed for services not covered by Medicare or Medicaid.
156
Coverage of full Medicaid benefits: SSI beneficiaries and QMBs in QMB-plus states receive coverage of all Medicaid services, including prescription drugs and nursing home care. This is expected to increase demand for these services and reduce out-of-pocket costs.43
Overall, we expect enrollment to increase service use and reduce out-of-pocket costs for all four groups. Relative to eligible nonenrollees, enrollees are hypothesized to have higher service use and lower out-of-pocket costs.44 The overall effect of Medicare Savings Programs enrollment on service use and out-of-pocket costs will be largest for the SSI and QMB-plus populations, which receive the most comprehensive benefits. However, the effect on use of Medicare covered services and out-of-pocket costs for these services should be similar for the SSI, QMB-plus, and standard benefit QMB populations. On the other hand, the impact on use of Medicaid services will be greater for the SSI and QMB-plus populations. Overall impacts are expected to be smallest for the SLMB population.
It is more difficult to predict a priori patterns of relative service use and out-of-pocket costs by type of enrollee. Holding all else constant, we would expect SSI and QMB-plus beneficiaries to have the highest levels of service use and the lowest out-of-pocket costs based on the generosity of the benefit package to which they are entitled, followed by standard benefit QMBs and then SLMBs. However, many factors other than cost-sharing requirements contribute to differences in service use, including beneficiary income and other beneficiary characteristics. While we control for some of these factors in our multivariate analyses, it is likely that there remain unmeasured characteristics that also influence relative service use by SSI, QMB-plus, standard benefit QMB, and SLMB enrollees.
6.3 Methodology
Our analyses of service use and costs draw on two complementary data sources – the Medicare National Claims History (NCH) 5% file and the Medicare Current Beneficiary Survey (MCBS). The NCH file, which includes data on a far larger sample of Medicare beneficiaries than the MCBS, can support more detailed analyses of service use and cost by type of service. In addition, it is available for more current time periods than the MCBS. However, the NCH file contains limited information on beneficiary characteristics, whereas the MCBS provides rich data on a wide range of topics, including sociodemographic characteristics, health status, living arrangements, and supplemental insurance coverage. The MCBS also includes information on beneficiary income and assets that can be used to identify beneficiaries who are eligible for, but not enrolled in, the Medicare Savings Programs. Furthermore, the MCBS collects data on beneficiary out-of-pocket spending on health care services.
43 The savings from the elimination of out-of-pocket costs for Medicaid services can be used to purchase services
not covered by Medicare or Medicaid, thus increasing the use of these services and beneficiary out-of-pocket costs for them. In addition, coverage of Medicaid services could impact the demand for Medicare services. For example, prescription drug coverage might reduce the need for hospital care and other types of services. On the other hand, it might increase the demand for office visits to monitor medications or renew prescriptions.
44 The impact on service use will be mitigated to the extent that eligible nonenrollees have private supplemental insurance that covers Medicare cost-sharing or non-Medicare services.
157
Our uses of the NCH and MCBS data in our analyses of service use and cost reflect the differing strengths of these data sources. The NCH data are used to compare Medicare service use and cost by type of Medicare Savings Programs enrollee (SSI, standard benefit QMB, QMB-plus, and SLMB beneficiaries). The MCBS data are used to compare Medicare service use and costs for enrollees and eligible nonenrollees. We also use the MCBS to analyze out-of-pocket costs, comparing enrollees and eligible nonenrollees, as well as comparing types of enrollees.
6.3.1 Medicare National Claims History Analyses
Study Sample and Dependent Variables - Our NCH analyses use the 5% file for 2001, the most current year available. We identified beneficiaries in the 5% file with any period of enrollment in the Medicare Savings Programs. For these beneficiaries, our analyses include only those months in which the beneficiary was enrolled. In addition, we excluded any months in which the beneficiary did not have both Medicare Part A and Part B coverage or the beneficiary was enrolled in managed care. As in other parts of this study, we excluded beneficiaries residing in the ten states where we could not reliably distinguish QMB from SSI beneficiaries using the TPEarth file.45 Members of the study sample were matched to the TPEarth file in order to identify the Medicare Savings Programs to which they were entitled (SSI, QMB, or SLMB) for each month of coverage.46 We distinguished standard benefit QMBs from QMB-plus beneficiaries based on state of residence.47 The final sample sizes are:
SSI: 130,945 Standard benefit QMB: 41,771 QMB-plus: 34,399 SLMB: 20,616
We pulled all Medicare claims during each month of enrollment in the Medicare Savings
Programs for members of our study sample. We summarized services by the following categories:
• inpatient hospital;
• SNF;
• home health;
• outpatient hospital;
• services provided by medical doctors and osteopaths (MD/DO services);
• other Part B provider services and;
45 These states are: Connecticut, Hawaii, Idaho, Illinois, Indiana, Maryland, Missouri, Nevada, Oklahoma, and
Utah. 46 We were able to identify a TPEarth record for 98% of the dually eligible beneficiaries identified in the 5% file.
Beneficiaries for whom we could not find a matching TPEarth record were excluded from the analyses. 47 The following states in our study sample provided full Medicaid benefits to QMB beneficiaries during all of
2001: California, District of Columbia, Florida, Maine, Massachusetts, Michigan, Mississippi, Nebraska, New Jersey, North Carolina, Pennsylvania, Rhode Island, and South Carolina. Minnesota and Virginia began providing full Medicaid benefits on July 1, 2001.
158
• DME/supplier services.48
Statistical Methods - We conducted descriptive analyses, comparing service use and cost by type of Medicare Savings Programs enrollee. Descriptive analyses used chi-square tests to determine the statistical significance for categorical variables (probability of using any services) and t-tests for continuous variables (expenditures and number of services). All analyses weight observations for the number of months during the year a beneficiary was eligible for the Medicare Savings Programs.
In a number of cases, states that have adopted the QMB-plus benefit (e.g., California, Florida, and Massachusetts) tend to have higher medical costs than those with the standard QMB benefit. As a result, some of the difference in service costs between QMB-plus and other types of enrollees may reflect the higher medical costs in these states, rather than differences due to the more generous Medicaid benefit package they receive. In order to control for the potential confounding effect of these underlying differences in medical costs on our ability to identify the impact of benefit differences, we conducted three sets of descriptive analyses:
• All states: compares SSI and SLMB beneficiaries, as well as QMB and QMB-plus beneficiaries combined.
• Standard QMB benefit states: compares beneficiaries receiving the standard QMB benefit to SSI and SLMB beneficiaries in states offering the standard QMB benefit.
• QMB-plus states: compares QMB beneficiaries receiving full Medicaid benefits to SSI and SLMB beneficiaries in states that offer QMB-plus benefits.
We also conducted multivariate analyses of the probability of using a given service and of expenditures for those with service use. Logistic regression was used to estimate the probability of service use. We used lognormal regression to estimate expenditures for those with service use in order to reduce skewness in the dependent variable. The following were included as independent variables in our models:
• type of Medicare Savings Programs eligibility: dummy variables for standard benefit QMB, QMB-plus, and SLMB (with SSI the omitted reference group);
• age category: dummy variables for less than 65, 75 to 84, and 85 and over (with 65 to 74 the omitted reference group);
• gender: dummy variable for female;
• race: dummy variables for Black, Hispanic, and all other races (with white the omitted reference group);
• died: dummy variable for beneficiaries that died during the year;
• end-stage renal disease (ESRD): dummy variable for beneficiaries entitled due to ESRD;
48 We also analyzed hospice and long-term stay hospital services. These results are not presented here because
only a small percentage of beneficiaries use these services.
159
• disability: dummy variable for beneficiaries age 65 and over who were originally entitled to Medicare due to disability; and
• metropolitan statistical area (MSA): dummy variable for beneficiaries residing in an MSA.
In addition, we included a set of dummy variables for state of residence to control for medical costs differences between states offering QMB-plus benefits and those offering standard QMB benefits.
6.3.2 MCBS Analyses
Study Sample - The MCBS analyses draw on pooled data for three years – 1995, 1997, and 199849 – in order to obtain adequate sample sizes to support analyses by type of Medicare Savings Programs enrollee. The sample excluded beneficiaries who were not eligible for both Part A and Part B of Medicare, who were institutionalized,50 who were enrolled in managed care, or who had ESRD. In addition, we excluded beneficiaries residing in the 10 states where we could not reliably distinguish QMB from SSI beneficiaries using the TPEarth file, plus Ohio. Ohio was excluded because the eligibility code was missing on a large percentage of its TPEarth records.
MCBS data were used for two types of comparisons: (1) comparisons among Medicare Savings Programs enrollees by type of coverage and (2) comparisons between beneficiaries enrolled in the Medicare Savings Programs and eligible nonenrollees. Table 32 shows the sample sizes for each of the groups used in our MCBS analyses.
Identification of Enrollees. MCBS respondents with some period of enrollment in the Medicare Savings Programs were identified using a data element in the MCBS that indicates whether the beneficiary was enrolled in Medicaid during any part of the year. We then linked to the TPEarth file to obtain monthly information on type of coverage (SSI, standard benefit QMB, QMB-plus, and SLMB) for these beneficiaries.
While the MCBS reports service use and out-of-pocket costs for the entire year, beneficiaries with some period of enrollment might not have had this coverage for the full year. In order to ensure that service utilization and costs for our enrollee sample primarily reflected their experience as enrollees in the Medicare Savings Programs, our enrollee sample was limited to beneficiaries who were enrolled in Medicaid for at least half of the months during the year that they were entitled to Medicare. Overall, 93% of our enrollee sample was covered by Medicaid for all 12 months in the year. Thus, the impact of our inability to link service use and out-of-pocket costs to specific dates of enrollment in the Medicare Savings Programs is minor.
49 Data for 1996 were not used because the income and asset file required to identify the eligible nonenrollee
sample was not available from CMS. 50 These beneficiaries were excluded because the income and asset information required to identify eligible
nonenrollees is not collected for the institutionalized population.

160
Table 32 MCBS Sample Sizes
EligibleEnrollees Nonenrollees
SSI 2,430 778 Standard Benefit QMB 523 597 QMB-Plus 294 197 SLMB 158 725
SOURCE: RTI analysis of MCBS Cost and Use Files(1995, 1997, and 1998) and corresponding Income and Asset supplements.
Beneficiaries that were considered to be enrolled based on this rule were then classified into one of the four Medicare Savings Programs. Beneficiaries with coverage in more than one category during the course of the year were assigned to the program in which they were covered for the greatest number of months. In the event of a tie, the beneficiary was assigned to the program with the most extensive benefits.
Identification of Eligible Nonenrollees. Beneficiaries who were not classified as a Medicare Savings Programs enrollee based on the criteria described above were eligible for inclusion in the eligible nonenrollee sample.51 We applied a simple set of rules to family asset and income data reported in the Income and Asset supplement to the MCBS to ascertain if they were eligible for coverage under one of the Medicare Savings Programs. The rules were based on the income and asset standards for the SSI, QMB, and SLMB programs, which vary by marital status. Single Medicare beneficiaries with reported incomes no higher than 70% of the FPL and no more than $2,000 in reported assets were classified as eligible for SSI. Married beneficiaries with reported income no higher than 80% of the FPL and no more than $3,000 in assets were classified as SSI eligible. In addition, beneficiaries who reported receiving SSI income were classified as SSI eligible. Beneficiaries that did not meet the SSI eligibility criteria, but who had incomes no higher than 100% of FPL and assets no more than twice the SSI standard, were classified as eligible for the QMB program. QMB beneficiaries were categorized as eligible for standard QMB benefits or QMB-plus based on state of residence. Beneficiaries whose reported income was between 100 and 120% of the FPL and whose assets were no more than twice the SSI standard were classified as SLMB eligible. The FPL appropriate to each year of the MCBS was used to define the income limits. The asset standards did not change over this time period.
51 Although beneficiaries who were covered by Medicaid for less than half of their months in Medicare were
eligible for the nonenrollee sample, less than 3% of the eligible nonenrollee sample had any months of Medicaid eligibility during a year.
161
The income disregard of $20 per month was applied to reported family income in determining eligibility based on the algorithm described above. Actual determination of eligibility for the Medicare Savings Programs involves a complex set of adjustments to income and assets based on allowable disregards. Because we did not take most of these disregards into account when determining eligibility, some beneficiaries were classified either as eligible for a less generous program than the one for which they actually would qualify or as ineligible entirely. 52 On the other had, it is known that income is under-reported in the MCBS. Therefore, it is possible that few beneficiaries were misclassified. Nonetheless, because of these rules, our eligible, nonenrollee sample has a lower reported income distribution than the corresponding enrollee population.
Dependent Variables - The MCBS was used to analyze Medicare service use and costs, as well as beneficiary out-of-pocket costs. We analyzed data on service use and costs for four categories of service summarized in the MCBS Cost and Use RIC A2 file:
• inpatient hospital;
• outpatient hospital;
• total Part B; and
• office visits.
Because the sample sizes in some of our eligibility groups are relatively small, we focus on major categories of Medicare services and do not present statistics for services that are used by relatively small proportions of beneficiaries (SNF, hospice, and home health). We used the medical consumer price index (CPI) to adjust expenditures from the 1995 and 1997 MCBS to 1998 levels to account for medical price inflation.
The MCBS Cost and Use RIC SS file includes expenditures covered by type of payer including Medicare, Medicaid, private insurance, HMO coverage, and beneficiary out-of-pocket expenditures. Expenditures are reported by payer for nine major categories of service: dental,
52 We attempted to develop an algorithm that adjusted reported income and assets for possible disregards. The
Income and Asset supplements for our study years only include information on whether beneficiaries have certain types of income and assets, but not the amount. Thus, they do not include the data required to adjust gross income and assets to simulate eligibility rules. We attempted to use Income and Asset data from the 1991 MCBS, which collected detailed amounts for various categories of income and assets, to develop a model that predicted eligibility after accounting for disregards based on having various types of income and assets. The parameters from this model would have been applied to the data for 1995, 1997, and 1998. However, this model did not accurately classify beneficiaries. Therefore, other than the $20 per month income disregard, adjustments to income and assets were not included in our eligibility algorithm. A similar approach was used previously by Pezzin and Kasper (2002) and GAO (1999), which both used reported income data in the MCBS to identify eligible nonenrollees. However, they did not take into account assets, SSI payments, or the $20 per month disregard. In addition, they did not distinguish between types of Medicare Savings Program enrollees.
We also considered adopting the adjustments for income and asset disregards used in a previous study (Barents Group, 1999). To obtain beneficiary countable income and assets that are used in actual benefit determinations, reported income and assets were adjusted using the values of income and asset disregards reported in the 1991 Income and Asset supplement. While this methodology is satisfactory for trending income and asset data forward for a few years, it is less satisfactory over the time period required for our study (up to seven years, from 1991 to 1998).
162
facility, home health, hospice, inpatient, institutional utilization, medical provider, outpatient hospital, and prescribed medicine. Taking advantage of this detailed data, out-of-pocket expenditures for the nine major categories of services, as well as for total out-of-pocket expenditures, were obtained from the MCBS RIC SS files. We adjusted out-of-pocket expenditures for medical care price inflation to 1998 levels.
Premiums paid by the beneficiary for private third-party insurance were obtained from the MCBS RIC 4 file. Beneficiary payments for Medicare Part B coverage were calculated by subtracting the number of Medicaid-covered months from the months of fee-for-service eligibility. Both private and Medicare Part B premiums were then added to total beneficiary out-of-pocket expenditures.
We analyzed five categories of out-of-pocket expenditures:
• medical provider services;
• outpatient hospital services;
• prescribed medicine;
• all medical services; and
• all medical services plus all premiums.53
Statistical Methods - We conducted both descriptive and multivariate analyses. Because we were able to use the NCH data to compare utilization by type of enrollee, the MCBS service use and cost analyses focused on comparisons of enrollees and eligible nonenrollees. Both types of comparisons were undertaken for the out-of-pocket cost analyses.
Descriptive analyses use chi-square tests of statistical significance for categorical variables and t-tests for continuous variables. Given the relatively small MCBS sample, we did not make separate comparisons for enrollees living in standard QMB benefit and those in QMB-plus states as we did in the NCH analyses. However, as described below, the multivariate analyses did include a control for state of residence.
Multivariate analyses used probit to estimate the probability of service use or the probability of having out-of-pocket costs. We used lognormal regression to estimate expenditures for those with service use and out-of-pocket costs for those with some out-of-pocket costs. We included the following independent variables in our models:
• gender: dummy variable for female;
• race: dummy variable for White;
• age category: dummy variables for less than 65, 75 to 84, and 85 and over (with 65 to 74 the omitted reference group);
53 The other six service categories reported in the MCBS were not analyzed either because they are used by only a
small proportion of Medicare beneficiaries so that the number of MCBS respondents reporting these types of service use was too small to support the analyses or because there was little variation in utilization or out-of-pocket expenditure patterns by eligibility or enrollment class.
163
• education: dummy variable for being less than a high school graduate;
• income: dummy variable for having an income greater than 100% FPL;
• MSA: dummy variable for beneficiaries residing in an MSA;
• census region: dummy variables for midwest, south, and west (with east the omitted category);
• children: dummy variable for having living children.
• marital status: dummy variables for being divorced or separated, widowed, and never married (with married the omitted category);
• living arrangement: dummy variables for living with a spouse, living with a child, and other living arrangements (with living alone the omitted category);
• self-reported health status: dummy variables for excellent/very good and fair/poor (with good the omitted category);
• ADLs and IADLs: dummy variables for having IADLs only, having 1-2 ADLs, and having 3 or more ADLs (with no IADLs or ADLs the omitted category);
• count of chronic conditions: ranged from 0-16;54
• disability: dummy variable for beneficiaries age 65 and over who were originally entitled to Medicare due to disability;
• died: dummy variable for beneficiaries that died during the year;
• private insurance coverage: dummy variable for having private insurance (excluded from models for out-of-pocket costs including premiums);
• other public coverage: dummy variable for having public coverage other than Medicare or Medicaid, including a state prescription drug program; and
• prescription drug coverage: dummy variable for having insurance that covers prescription drugs (included only in models for out-of-pocket costs for prescription drugs).
Models comparing enrollees and eligible nonenrollees also included a dummy variable for being enrolled in the Medicare Savings Programs. Models comparing types of enrollees included additional variables for type of coverage (standard benefit QMB, QMB-plus, and SLMB, with SSI the omitted reference group). In addition, these models included a variable for residing in a QMB-plus state to control for the higher medical costs in these states.
All analyses were conducted in STATA to take into account the complex sample design used in the MCBS. Analyses for the full population adjust for both stratum and primary
54 The count of chronic conditions was based on a series of questions in the MCBS that asked beneficiaries whether
a doctor had ever told them they had various conditions. The conditions included in our count variable were: hardening of the arteries, hypertension, myocardial infarction, angina pectoris, other heart conditions, stroke, skin cancer, other cancer, diabetes, rheumatoid arthritis, arthritis, Alzheimer’s disease, mental disorder, osteoporosis, Parkinson’s disease, and emphysema.
164
sampling unit (PSU). Analyses that are restricted to beneficiaries that used specific types of service adjust only for PSU. Because these analyses were limited to small subpopulations of the overall MCBS sample, there were often only a handful of PSUs per strata. In this case, accounting for stratification has only a minimal impact on the calculation of standard errors.
The MCBS uses a rotating sample. Because we pooled multiple years of MCBS data, some sample members have more than one observation in our data set. Standard errors should, therefore, be adjusted to take into account correlation in an individual’s utilization over time. STATA adjusts standard errors to account for the correlation within a PSU. To the extent that individuals remain in the same PSU over time, STATA’s adjustment for correlation within a PSU also accounts for the correlation across observations for an individual.
6.4 Service Use and Cost Findings
We analyzed the NCH 5% file to compare use of Medicare covered services among Medicare Savings Programs enrollees based on the type of benefit to which they are entitled. MCBS data were used to compare service use between enrollees and eligible nonenrollees. As discussed in greater detail in Section 6.2, we expect enrollees to use more services than nonenrollees. Because they receive more restricted benefits, we expect the impact of enrollment on use of Medicare services will be smaller for SLMBs than for SSI, QMB, and QMB-plus beneficiaries.
6.4.1 Comparison by Type of Enrollee
This section reports our findings on the use and cost of Medicare services, comparing SSI, standard benefit QMB, QMB-plus, and SLMB beneficiaries. We analyzed the use of seven types of service: inpatient hospital, SNF, home health, outpatient hospital, MD/DO services, other Part B provider services, and DME/supply services. We first describe the results of our descriptive analyses, followed by our multivariate findings.
The descriptive analyses first compare average expenditures per beneficiary for each type of service. Expenditure differences are then decomposed into differences in the likelihood of using services and differences in expenditures for those with some service use. Where meaningful, we also identify differences in intensity of service use based on the number of services for service users and expenditures per service. The multivariate analyses use a two-part model to identify the effect of enrollment in the different Medicare Savings Programs on Medicare expenditures. The first part is a logistic regression for the probability of service use. The second part is an ordinary least squares regression on expenditures for those with some service use, where the dependent variable is the natural logarithm of expenditures.
Descriptive Analyses - As described in Section 3.1, we conducted three sets of analyses: (1) comparisons of SSI, QMB, and SLMB enrollees in all states combined, (2) comparisons of QMBs receiving the standard benefit with SSI and SLMB beneficiaries residing in states offering the standard QMB benefit, and (3) comparisons of QMBs receiving full Medicaid benefits with SSI and SLMB beneficiaries residing in QMB-plus states. We conducted the second and third set of comparisons in order to identify impacts on service use attributable to differences in the QMB benefit package controlling for differences in medical costs between standard QMB benefit and QMB-plus states. Therefore, our comparisons of service use and costs in QMB-plus and standard benefit QMB states focus on differences between QMBs and SSI and SLMB
165
enrollees, and not on differences between SSI and SLMB beneficiaries, which are addressed in our analyses of all states combined.
All States. Relative spending by QMBs and SSI beneficiaries varies by type of service (Table 33). QMB beneficiaries have significantly lower expenditures for home health, outpatient hospital, and MD/DO services, but significantly higher expenditures for SNF, other Part B provider, and DME/supplier services. There was no significant difference in inpatient hospital expenditures. Despite this variation in relative expenditures, with the exception of home health, QMBs are significantly more likely than SSI beneficiaries to use all types of service. However, the magnitude of the difference is generally small – 3% or less. The largest differences are for outpatient hospital services and visits to other Part B providers, where QMBs are 5% and 7% more likely to use services than SSI beneficiaries. In general, QMBs use services less intensively than SSI beneficiaries. Among those with some service use, QMBs have significantly lower expenditures than SSI beneficiaries for all services other than SNF and DME /supplier. For those services where we analyzed intensity based on the quantity of services and cost per service, there was generally no difference in the number of services among service users, but QMBs tended to use a less costly mix of services.
There were fewer significant differences between SLMB and SSI beneficiaries in service expenditures. SLMB beneficiaries had significantly lower expenditures for MD/DO and other Part B provider services, while their expenditures for SNF services were significantly higher. Despite having expenditures that were generally lower than or not significantly different from SSI recipients, SLMB beneficiaries are more likely than SSI beneficiaries to use all types of services other than home health and MD/DO services, for which there is no significant difference. As was the case for QMBs, differences in the probability of service use are generally small. SLMB beneficiaries use services less intensely than SSI beneficiaries. Expenditures for those with service use are significantly lower compared to SSI recipients for all types of service other than DME/supplier. As was the case for QMBs, this reflects a less costly mix of services rather than smaller quantities of service for service users.
There is no consistent pattern in relative service use for SLMB and QMB beneficiaries. While SLMBs have significantly higher expenditures for inpatient hospital, home health, and MD/DO services, their expenditures are significantly lower for SNF, other Part B provider, and DME/supplier services. SLMBs are less likely than QMBs to use most types of services, although they are more likely to use home health services and marginally more likely to have an inpatient stay. Relative expenditures for those with service use are generally similar to findings on overall expenditures. There are few differences between QMBs and SLMBs in the intensity of service use, both in terms of the number of services for those with service use or the cost per service.
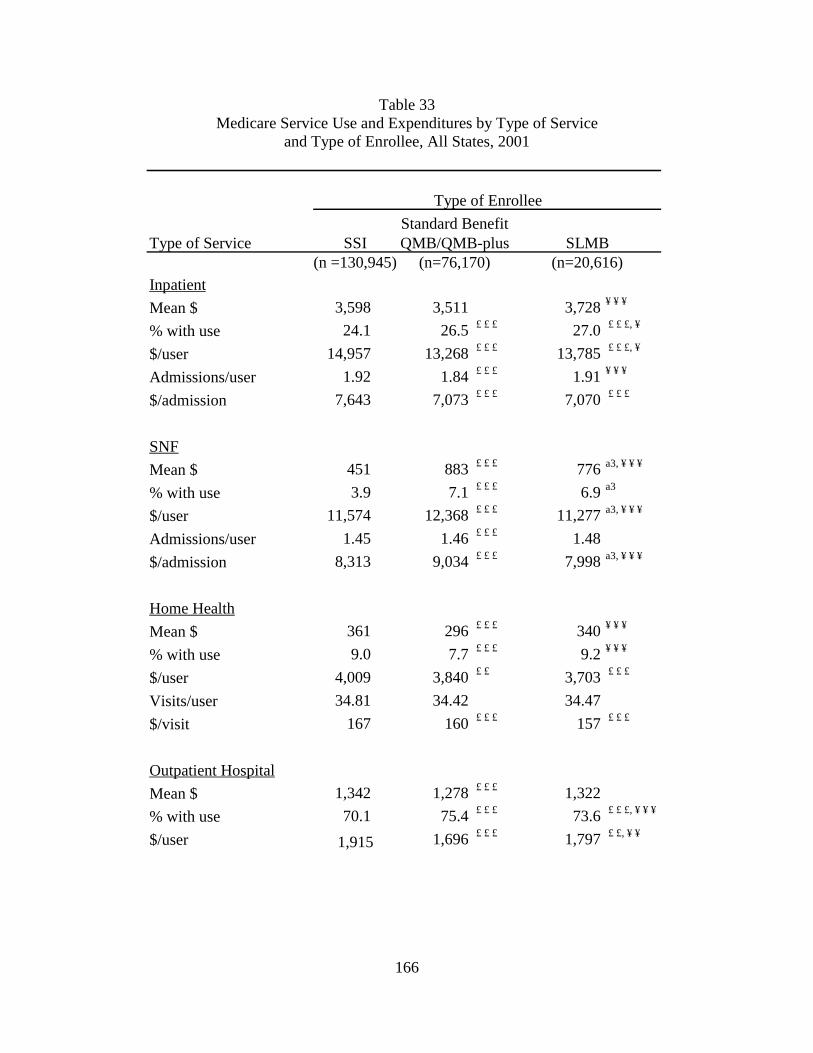
166
Table 33 Medicare Service Use and Expenditures by Type of Service
and Type of Enrollee, All States, 2001
Type of Service SSI(n =130,945)
Inpatient
Mean $ 3,598 3,511 3,728 ¥ ¥ ¥
% with use 24.1 26.5 £ £ £ 27.0 £ £ £, ¥
$/user 14,957 13,268 £ £ £ 13,785 £ £ £, ¥
Admissions/user 1.92 1.84 £ £ £ 1.91 ¥ ¥ ¥
$/admission 7,643 7,073 £ £ £ 7,070 £ £ £
SNF
Mean $ 451 883 £ £ £ 776 a3, ¥ ¥ ¥
% with use 3.9 7.1 £ £ £ 6.9 a3
$/user 11,574 12,368 £ £ £ 11,277 a3, ¥ ¥ ¥
Admissions/user 1.45 1.46 £ £ £ 1.48
$/admission 8,313 9,034 £ £ £ 7,998 a3, ¥ ¥ ¥
Home Health
Mean $ 361 296 £ £ £ 340 ¥ ¥ ¥
% with use 9.0 7.7 £ £ £ 9.2 ¥ ¥ ¥
$/user 4,009 3,840 £ £ 3,703 £ £ £
Visits/user 34.81 34.42 34.47
$/visit 167 160 £ £ £ 157 £ £ £
Outpatient Hospital
Mean $ 1,342 1,278 £ £ £ 1,322
% with use 70.1 75.4 £ £ £ 73.6 £ £ £, ¥ ¥ ¥
$/user 1,915 1,696 £ £ £ 1,797 £ £, ¥ ¥
Standard BenefitQMB/QMB-plus SLMB
(n=76,170) (n=20,616)
Type of Enrollee
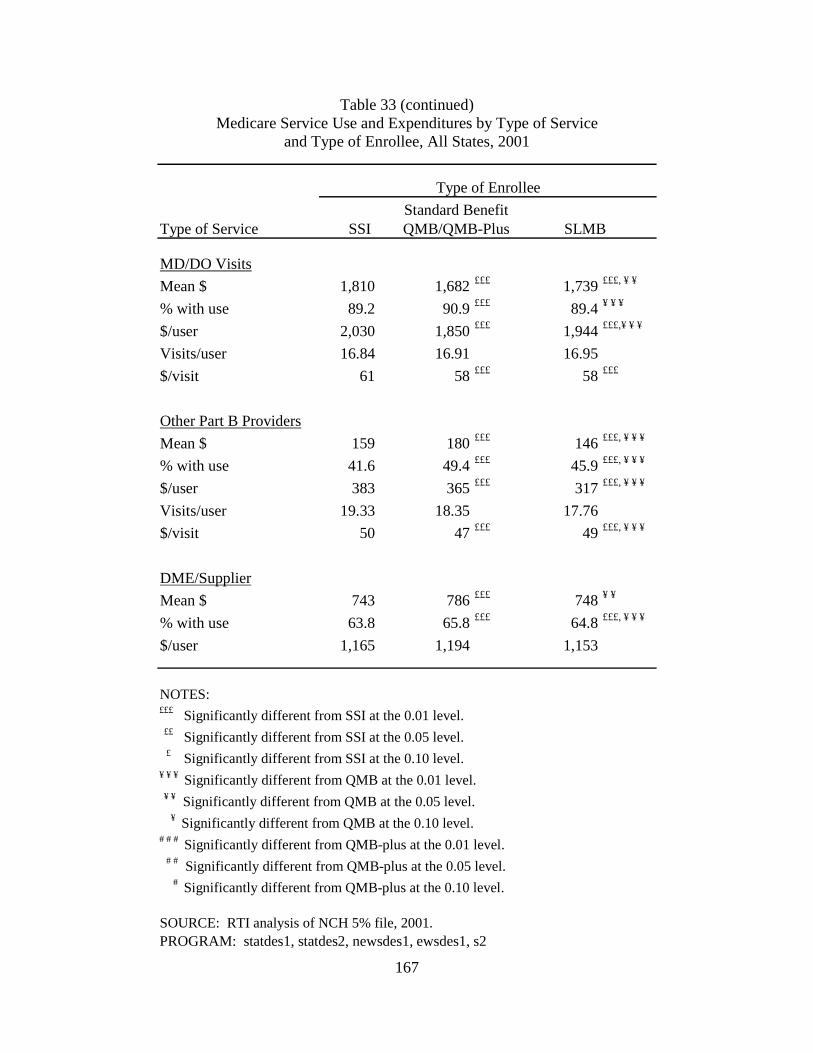
167
Table 33 (continued) Medicare Service Use and Expenditures by Type of Service
and Type of Enrollee, All States, 2001
Type of Service SSI
MD/DO Visits
Mean $ 1,810 1,682 £££ 1,739 £££, ¥ ¥
% with use 89.2 90.9 £££ 89.4 ¥ ¥ ¥
$/user 2,030 1,850 £££ 1,944 £££,¥ ¥ ¥
Visits/user 16.84 16.91 16.95
$/visit 61 58 £££ 58 £££
Other Part B Providers
Mean $ 159 180 £££ 146 £££, ¥ ¥ ¥
% with use 41.6 49.4 £££ 45.9 £££, ¥ ¥ ¥
$/user 383 365 £££ 317 £££, ¥ ¥ ¥
Visits/user 19.33 18.35 17.76
$/visit 50 47 £££ 49 £££, ¥ ¥ ¥
DME/Supplier
Mean $ 743 786 £££ 748 ¥ ¥
% with use 63.8 65.8 £££ 64.8 £££, ¥ ¥ ¥
$/user 1,165 1,194 1,153
NOTES:£££ Significantly different from SSI at the 0.01 level. ££ Significantly different from SSI at the 0.05 level. £ Significantly different from SSI at the 0.10 level.¥ ¥ ¥ Significantly different from QMB at the 0.01 level. ¥ ¥ Significantly different from QMB at the 0.05 level. ¥ Significantly different from QMB at the 0.10 level.# # # Significantly different from QMB-plus at the 0.01 level. # # Significantly different from QMB-plus at the 0.05 level. # Significantly different from QMB-plus at the 0.10 level.
SOURCE: RTI analysis of NCH 5% file, 2001.
Standard Benefit
Type of Enrollee
QMB/QMB-Plus SLMB
PROGRAM: statdes1, statdes2, newsdes1, ewsdes1, s2
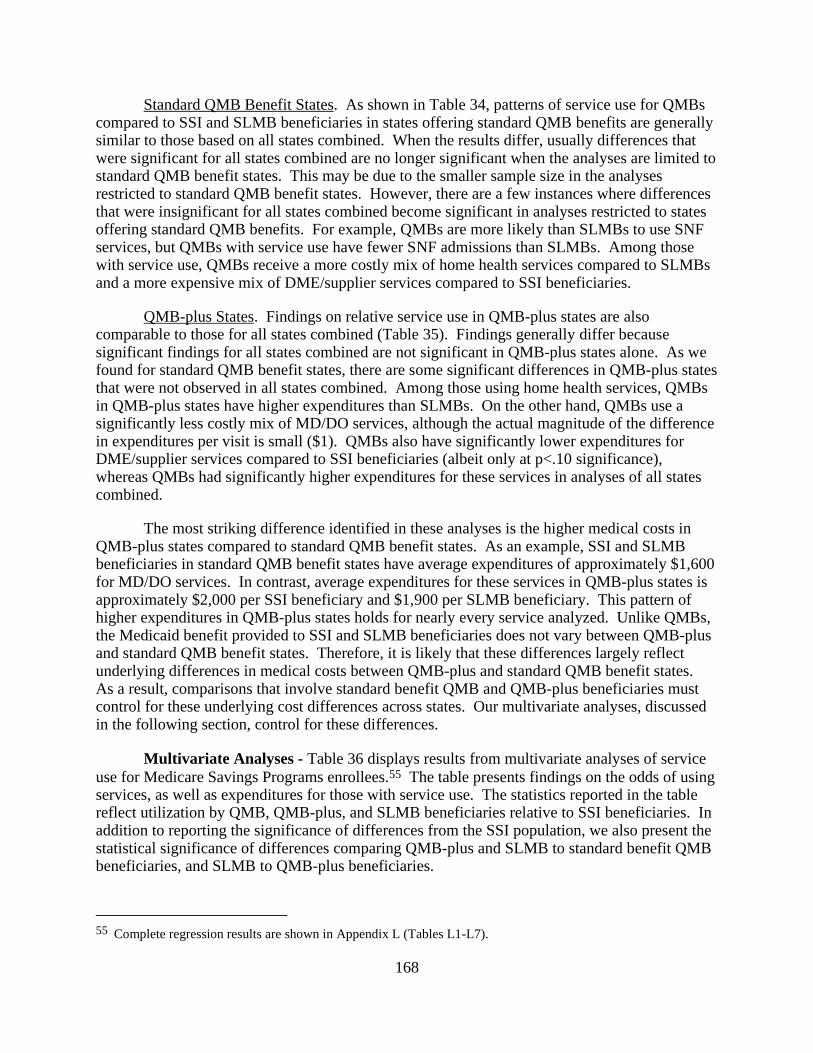
168
Standard QMB Benefit States. As shown in Table 34, patterns of service use for QMBs compared to SSI and SLMB beneficiaries in states offering standard QMB benefits are generally similar to those based on all states combined. When the results differ, usually differences that were significant for all states combined are no longer significant when the analyses are limited to standard QMB benefit states. This may be due to the smaller sample size in the analyses restricted to standard QMB benefit states. However, there are a few instances where differences that were insignificant for all states combined become significant in analyses restricted to states offering standard QMB benefits. For example, QMBs are more likely than SLMBs to use SNF services, but QMBs with service use have fewer SNF admissions than SLMBs. Among those with service use, QMBs receive a more costly mix of home health services compared to SLMBs and a more expensive mix of DME/supplier services compared to SSI beneficiaries.
QMB-plus States. Findings on relative service use in QMB-plus states are also comparable to those for all states combined (Table 35). Findings generally differ because significant findings for all states combined are not significant in QMB-plus states alone. As we found for standard QMB benefit states, there are some significant differences in QMB-plus states that were not observed in all states combined. Among those using home health services, QMBs in QMB-plus states have higher expenditures than SLMBs. On the other hand, QMBs use a significantly less costly mix of MD/DO services, although the actual magnitude of the difference in expenditures per visit is small ($1). QMBs also have significantly lower expenditures for DME/supplier services compared to SSI beneficiaries (albeit only at p<.10 significance), whereas QMBs had significantly higher expenditures for these services in analyses of all states combined.
The most striking difference identified in these analyses is the higher medical costs in QMB-plus states compared to standard QMB benefit states. As an example, SSI and SLMB beneficiaries in standard QMB benefit states have average expenditures of approximately $1,600 for MD/DO services. In contrast, average expenditures for these services in QMB-plus states is approximately $2,000 per SSI beneficiary and $1,900 per SLMB beneficiary. This pattern of higher expenditures in QMB-plus states holds for nearly every service analyzed. Unlike QMBs, the Medicaid benefit provided to SSI and SLMB beneficiaries does not vary between QMB-plus and standard QMB benefit states. Therefore, it is likely that these differences largely reflect underlying differences in medical costs between QMB-plus and standard QMB benefit states. As a result, comparisons that involve standard benefit QMB and QMB-plus beneficiaries must control for these underlying cost differences across states. Our multivariate analyses, discussed in the following section, control for these differences.
Multivariate Analyses - Table 36 displays results from multivariate analyses of service use for Medicare Savings Programs enrollees.55 The table presents findings on the odds of using services, as well as expenditures for those with service use. The statistics reported in the table reflect utilization by QMB, QMB-plus, and SLMB beneficiaries relative to SSI beneficiaries. In addition to reporting the significance of differences from the SSI population, we also present the statistical significance of differences comparing QMB-plus and SLMB to standard benefit QMB beneficiaries, and SLMB to QMB-plus beneficiaries.
55 Complete regression results are shown in Appendix L (Tables L1-L7).
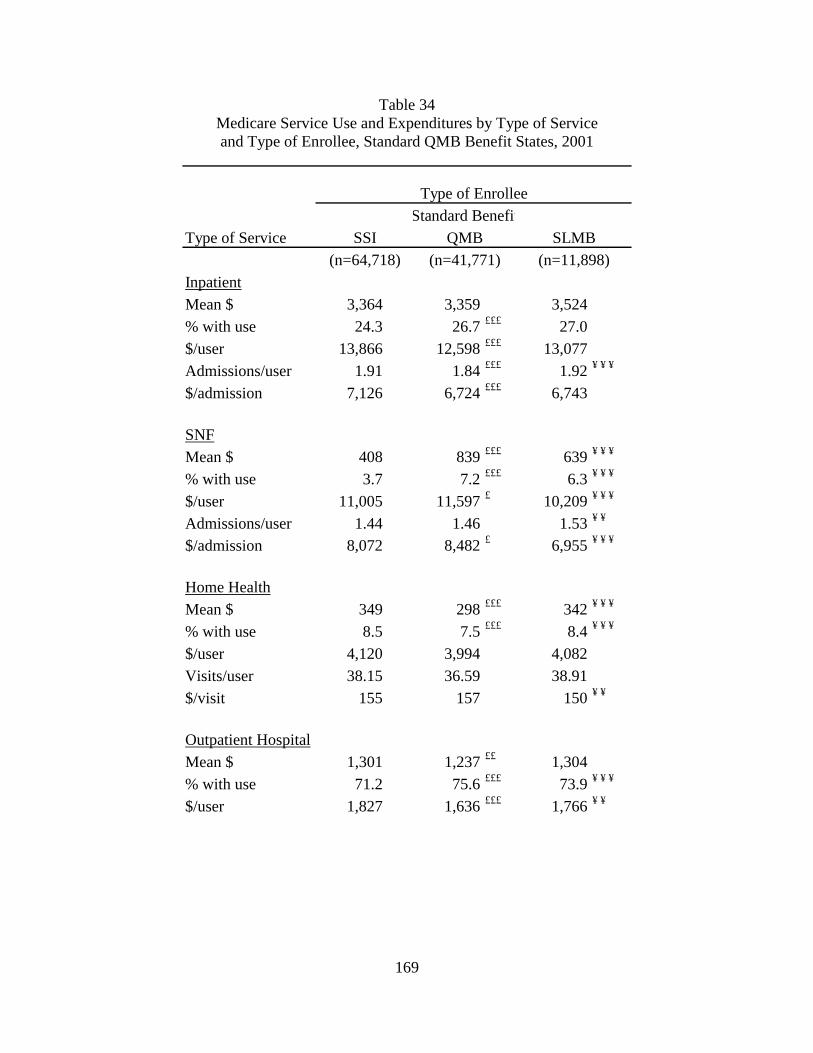
169
Table 34 Medicare Service Use and Expenditures by Type of Service and Type of Enrollee, Standard QMB Benefit States, 2001
Type of Service
InpatientMean $ 3,364 3,359 3,524% with use 24.3 26.7 £££ 27.0$/user 13,866 12,598 £££ 13,077Admissions/user 1.91 1.84 £££ 1.92 ¥ ¥ ¥
$/admission 7,126 6,724 £££ 6,743
SNFMean $ 408 839 £££ 639 ¥ ¥ ¥
% with use 3.7 7.2 £££ 6.3 ¥ ¥ ¥
$/user 11,005 11,597 £ 10,209 ¥ ¥ ¥
Admissions/user 1.44 1.46 1.53 ¥ ¥
$/admission 8,072 8,482 £ 6,955 ¥ ¥ ¥
Home HealthMean $ 349 298 £££ 342 ¥ ¥ ¥
% with use 8.5 7.5 £££ 8.4 ¥ ¥ ¥
$/user 4,120 3,994 4,082Visits/user 38.15 36.59 38.91$/visit 155 157 150 ¥ ¥
Outpatient HospitalMean $ 1,301 1,237 ££ 1,304% with use 71.2 75.6 £££ 73.9 ¥ ¥ ¥
$/user 1,827 1,636 £££ 1,766 ¥ ¥
Standard Benefit
(n=41,771) (n=11,898)SSI
Type of Enrollee
QMB SLMB(n=64,718)

170
Table 34 (continued) Medicare Service Use and Expenditures by Type of Service and Type of Enrollee, Standard QMB Benefit States, 2001
Type of Service
MD/DO VisitsMean $ 1,591 1,554 ££ 1,595 ¥ ¥ ¥
% with use 88.6 90.5 £££ 88.9$/user 1,795 1,718 £££ 1,795 ¥ ¥
Visits/user 15.57 15.83 £ 15.87$/visit 58 56 £££ 56
Other Part B ProvidersMean $ 153 173 £££ 126 ¥ ¥ ¥
% with use 41.8 48.7 £££ 43.0 ¥ ¥ ¥
$/user 366 356 294 ¥ ¥ ¥
Visits/user 20.47 18.64 18.59$/visit 50 47 £££ 49 ¥ ¥
DME/SupplierMean $ 640 781 £££ 770 ¥ ¥ ¥
% with use 62.2 65.9 £££ 64.5$/user 1,029 1,185 £££ 1,193
NOTES:£££ Significantly different from SSI at the 0.01 level. ££ Significantly different from SSI at the 0.05 level. £ Significantly different from SSI at the 0.10 level.¥ ¥ ¥ Significantly different from QMB at the 0.01 level. ¥ ¥ Significantly different from QMB at the 0.05 level. ¥ Significantly different from QMB at the 0.10 level.# # # Significantly different from QMB-plus at the 0.01 level. # # Significantly different from QMB-plus at the 0.05 level. # Significantly different from QMB-plus at the 0.10 level.
SOURCE: RTI analysis of NCH 5% file, 2001.
Standard BenefitType of Enrollee
SSI QMB SLMB
PROGRAM: statdes1, statdes2, newsdes1, ewsdes1, s2.
171
Table 35 Medicare Service Use and Expenditures by Type of Service
and Type of Enrollee, QMB-Plus States, 2001
Type of Service
Inpatient
Mean $ 3,811 3,730 3,979 ¥
% with use 24.3 26.4 £££ 27.2
$/user 15,975 14,118 £££ 14,655
Admissions/user 1.93 1.84 £££ 1.89
$/admission 8,126 7,514 £££ 7,472
SNF
Mean $ 490 944 £££ 946
% with use 4.1 7.1 £££ 7.7 ¥
$/user 12,007 13,340 £££ 12,358 ¥ ¥
Admissions/user 1.46 1.47 1.42
$/admission 8,514 9,719 £££ 9,053 ¥
Home Health
Mean $ 371 299 £££ 337 ¥ ¥
% with use 9.5 8.1 £££ 10.2 ¥ ¥ ¥
$/user 3,918 3,675 ££ 3,316 ¥ ¥
Visits/user 32.07 32.03 29.94
$/visit 176 162 £££ 165
Outpatient Hospital
Mean $ 1,379 1,343 1,345
% with use 69.0 75.7 £££ 73.2 ¥ ¥ ¥
$/user 1,998 1,774 £££ 1,836
QMB-Plus SLMBSSI
(n=70,518) (n=34,399) (n=9,429)
Type of Enrollee
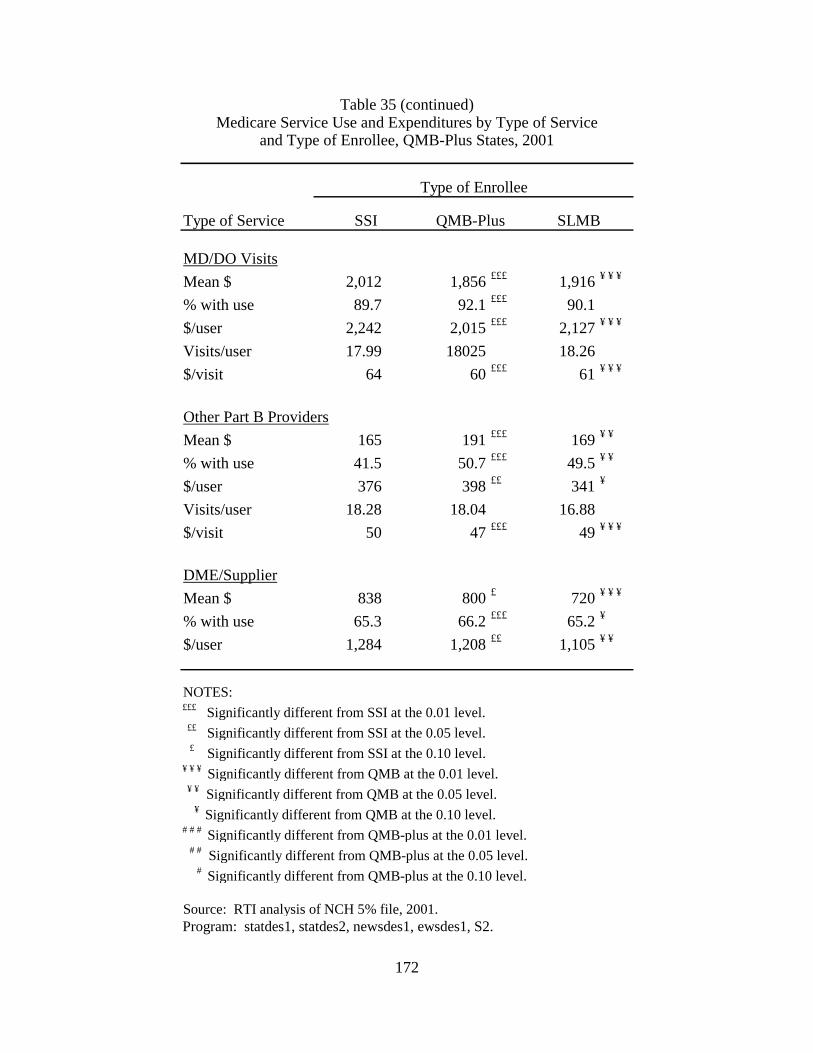
172
Table 35 (continued) Medicare Service Use and Expenditures by Type of Service
and Type of Enrollee, QMB-Plus States, 2001
Type of Service
MD/DO Visits
Mean $ 2,012 1,856 £££ 1,916 ¥ ¥ ¥
% with use 89.7 92.1 £££ 90.1
$/user 2,242 2,015 £££ 2,127 ¥ ¥ ¥
Visits/user 17.99 18025 18.26
$/visit 64 60 £££ 61 ¥ ¥ ¥
Other Part B Providers
Mean $ 165 191 £££ 169 ¥ ¥
% with use 41.5 50.7 £££ 49.5 ¥ ¥
$/user 376 398 ££ 341 ¥
Visits/user 18.28 18.04 16.88
$/visit 50 47 £££ 49 ¥ ¥ ¥
DME/Supplier
Mean $ 838 800 £ 720 ¥ ¥ ¥
% with use 65.3 66.2 £££ 65.2 ¥
$/user 1,284 1,208 ££ 1,105 ¥ ¥
NOTES:£££ Significantly different from SSI at the 0.01 level. ££ Significantly different from SSI at the 0.05 level. £ Significantly different from SSI at the 0.10 level.¥ ¥ ¥ Significantly different from QMB at the 0.01 level. ¥ ¥ Significantly different from QMB at the 0.05 level. ¥ Significantly different from QMB at the 0.10 level.# # # Significantly different from QMB-plus at the 0.01 level. # # Significantly different from QMB-plus at the 0.05 level. # Significantly different from QMB-plus at the 0.10 level.
Source: RTI analysis of NCH 5% file, 2001.
Type of Enrollee
SSI QMB-Plus SLMB
Program: statdes1, statdes2, newsdes1, ewsdes1, S2.
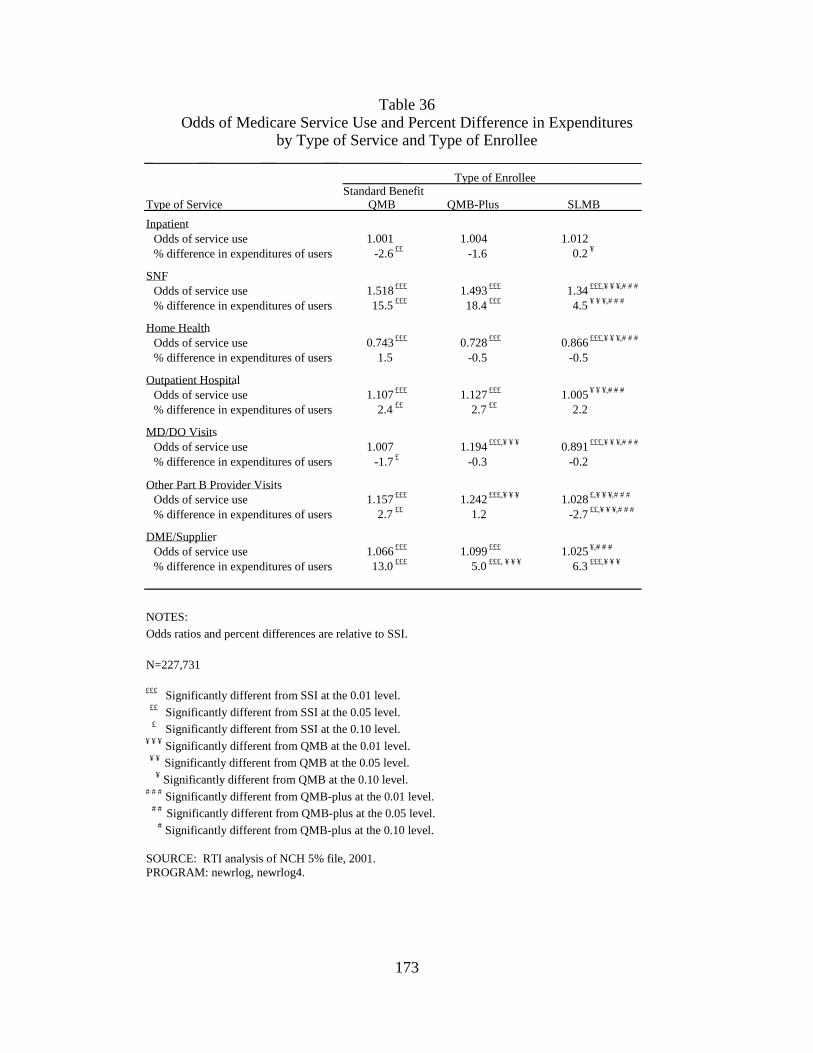
173
Table 36 Odds of Medicare Service Use and Percent Difference in Expenditures
by Type of Service and Type of Enrollee
Type of Service Inpatient
Odds of service use 1.001 1.004 1.012 % difference in expenditures of users -2.6 ££ -1.6 0.2 ¥
SNF Odds of service use 1.518 £££ 1.493 £££ 1.34 £££,¥ ¥ ¥,# # # % difference in expenditures of users 15.5 £££ 18.4 £££ 4.5 ¥ ¥ ¥,# # #
Home Health Odds of service use 0.743 £££ 0.728 £££ 0.866 £££,¥ ¥ ¥,# # # % difference in expenditures of users 1.5 -0.5 -0.5
Outpatient Hospital Odds of service use 1.107 £££ 1.127 £££ 1.005 ¥ ¥ ¥,# # # % difference in expenditures of users 2.4 ££ 2.7 ££ 2.2
MD/DO Visits Odds of service use 1.007 1.194 £££,¥ ¥ ¥ 0.891 £££,¥ ¥ ¥,# # # % difference in expenditures of users -1.7 £ -0.3 -0.2
Other Part B Provider Visits Odds of service use 1.157 £££ 1.242 £££,¥ ¥ ¥ 1.028 £,¥ ¥ ¥,# # # % difference in expenditures of users 2.7 ££ 1.2 -2.7 ££,¥ ¥ ¥,# # #
DME/Supplier Odds of service use 1.066 £££ 1.099 £££ 1.025 ¥,# # # % difference in expenditures of users 13.0 £££ 5.0 £££, ¥ ¥ ¥ 6.3 £££,¥ ¥ ¥
NOTES: Odds ratios and percent differences are relative to SSI.
N=227,731
£££ Significantly different from SSI at the 0.01 level. ££ Significantly different from SSI at the 0.05 level. £ Significantly different from SSI at the 0.10 level.¥ ¥ ¥ Significantly different from QMB at the 0.01 level. ¥ ¥ Significantly different from QMB at the 0.05 level. ¥ Significantly different from QMB at the 0.10 level.# # # Significantly different from QMB-plus at the 0.01 level. # # Significantly different from QMB-plus at the 0.05 level. # Significantly different from QMB-plus at the 0.10 level.
SOURCE: RTI analysis of NCH 5% file, 2001.PROGRAM: newrlog, newrlog4.
QMB-Plus SLMB QMB
Type of EnrolleeStandard Benefit

174
Findings from multivariate analyses of the probability of service use are generally
consistent with those from the descriptive analyses. QMB and QMB-plus beneficiaries are both significantly more likely than SSI beneficiaries to use most types of service. However, as in the descriptive findings, both groups are significantly less likely than SSI beneficiaries to use home health services. Unlike the descriptive findings, after controlling for beneficiary characteristics and residence, QMB and QMB-plus beneficiaries are not significantly more likely than SSI beneficiaries to have an inpatient admission. In addition, the multivariate analysis showed no significant difference between QMB and SSI beneficiaries in the likelihood of using MD/DO services.
The overall pattern of higher service use among QMB compared to SSI beneficiaries is somewhat surprising as these groups receive identical coverage for Medicare services. Indeed, we expected that SSI beneficiaries might be higher service users due to their lower income. However, it is possible that the QMB and QMB-plus programs attract a sicker pool of enrollees than SSI. While QMB and QMB-plus beneficiaries enroll in the Medicare Savings Programs specifically to receive medical benefits, SSI beneficiaries receive Medicaid by virtue of their eligibility for SSI cash benefits. Indeed, in auto-accrete states, SSI beneficiaries are automatically enrolled in Medicaid. As a result, the decision to apply for SSI benefits may be less driven by medical needs than is the decision to enroll in the QMB and QMB-plus programs. Differences in relative use of SNF and home health services by SSI beneficiaries compared to standard benefit QMB and QMB-plus beneficiaries also suggest that there may be differences in patterns of illness in these populations. SSI beneficiaries, who use more home health services, may be more likely to have chronic conditions, while QMBs may be more likely to have acute conditions that lead to post-acute SNF care.
As predicted, there are mainly no significant differences between standard benefit QMB and QMB-plus beneficiaries in the likelihood of service use. However, QMB-plus beneficiaries have nearly 20% greater odds of using MD/DO services than standard benefit QMBs and about 7% greater odds of receiving services from other Part B providers. Although Medicaid reimburses the Medicare Part B copayments and deductibles for both standard benefit QMBs and QMB-plus beneficiaries, differences in prescription drug coverage effect the use of other services. Findings from beneficiary focus groups indicated that beneficiaries without prescription drug coverage may avoid seeing a physician if they believe the visit will result in a prescription for medications they cannot afford. Alternatively, greater use of prescription drugs may increase the need for office visits to monitor medications or renew prescriptions.
Unlike QMB and QMB-plus beneficiaries, multivariate findings for SLMBs differ from the descriptive analyses. Controlling for beneficiary characteristics and residence reduced the likelihood of service use by SLMBs compared to SSI beneficiaries. Whereas descriptive results showed that SLMBs were more likely than SSI beneficiaries to use inpatient, outpatient hospital, and DME/supplier services, there were no significant differences in the multivariate analyses. Similarly, multivariate results show that SLMBs are significantly less likely than SSI recipients to use home health and MD/DO services, whereas there was no significant difference in the descriptive analyses. However, consistent with the descriptive findings, SLMBs are substantially more likely to use SNF services and marginally more likely to use other Part B provider services. Although we expected SLMBs to have relatively lower use than SSI beneficiaries because of their more limited benefit, as discussed above, the more mixed pattern of findings may reflect
175
greater adverse selection in the SLMB program. In addition, greater use of SNF services may indicate more acute healthcare needs in the SLMB population.
Consistent with our hypotheses, SLMBs are significantly less likely than standard benefit QMB and QMB-plus beneficiaries to use all services other than inpatient, where there were no significant differences, and home health, where SLMBs are significantly more likely to use services. Unlike the descriptive findings, where differences between SLMBs and QMBs were typically only a few percentage points, in multivariate analyses some of the differences in the likelihood of service use are quite large, particularly relative to QMB-plus beneficiaries. For example, QMB-plus beneficiaries have more than 30% greater odds of having an MD/DO visit than SLMBs and more than 20% greater odds of seeing other Part B providers.
There are generally fewer significant results in the lognormal regressions for expenditures compared to the logistic regressions for the probability of service use. Among those with service use, QMBs receiving standard benefits have significantly lower expenditures for inpatient services and MD/DO services compared to SSI beneficiaries, although the magnitude of the difference is small (2-3% less). On the other hand, relative to SSI, standard benefit QMBs have significantly higher expenditures for SNF, outpatient hospital, other Part B provider, and DME/supplier services. Differences for SNF and DME/supplier services are particularly large (16% and 13%, respectively). There are fewer differences in expenditures between QMB-plus and SSI beneficiaries. QMB-plus beneficiaries have significantly higher expenditures for SNF, outpatient hospital, and DME/supplier services (5%). With the exception of DME/supplier services, there are no significant differences in expenditures between standard benefit QMBs and QMB-plus beneficiaries.
Unlike the descriptive findings, there are few differences in expenditures between SLMBs and SSI beneficiaries. Among those with service use, SLMBs have 3% lower expenditures for other Part B providers compared to SSI recipients, and 6% higher expenditures for DME/supplier services. There are also few differences between SLMB and QMB beneficiaries. SLMBs have significantly lower expenditures than standard benefit QMBs and QMB-plus recipients for SNF and other Part B provider services. SLMBs also have significantly lower expenditures than standard benefit QMBs for DME/supplier services and higher expenditures for inpatient services (significant only at p<.10).
6.4.2 Comparison of Enrollees and Eligible Nonenrollees
This section describes our findings comparing enrollees and eligible nonenrollees based on analyses of MCBS data. We expect enrollment in the Medicare Savings Programs to increase utilization of Medicare services. Differences between enrollees and eligible nonenrollees should be smaller for SLMBs, who remain liable for Medicare copayments and deductibles.
We begin by comparing the characteristics of enrollees and nonenrollees. This is followed by a discussion of descriptive findings on relative service use by these groups and then a discussion of the results of our multivariate analyses. The section concludes with an analysis of the impact of adverse selection on differences in service use between enrollees and eligible nonenrollees.
The service use analyses focus on four types of service: inpatient hospital, outpatient hospital, total Part B, and office visits. For each type of service, the descriptive analyses
176
compare average expenditures per beneficiary, probability of service use, and average expenditures for those with service use. For inpatient hospital and office visits, we also compare the quantity of services for all beneficiaries and service users only.56 As we did in the NCH analyses, we estimated a two-part multivariate model of service use. The first part is a probit regression for the probability of service use and the second part is a lognormal regression on expenditures for those who had positive expenditures.57
Beneficiary Characteristics - Table 37 compares the characteristics of beneficiaries enrolled in the Medicare Savings Programs with eligible nonenrollees. Statistics are presented separately for SSI, standard benefit QMB, QMB-plus, and SLMB enrollees and nonenrollees.
SSI enrollees are significantly more likely to be female than eligible nonenrollees. This pattern is reversed for other categories of Medicare, although the difference is only significant for standard benefit QMBs. SSI enrollees are significantly more likely to be non-White than nonenrollees. This pattern holds for other Medicare Savings Programs categories, although the differences are not statistically significant. For all groups, the age distribution of enrollees is significantly younger than that of eligible nonenrollees, with substantially higher proportions under the age of 65. Enrollees are less educated than nonenrollees, although the difference is statistically significant only for the SSI and QMB-plus groups. Overall, education levels are low – more than half of the Medicare beneficiaries in all groups have less than a high school education. In all categories other than SSI, enrollees are significantly less likely to reside in a metropolitan statistical area (MSA) than nonenrollees. For both SSI and standard benefit QMBs, there are also significant differences in the geographic distribution of beneficiaries. Enrollees are more likely to live in the south and less likely to live in the eastern part of the country.
There are substantial differences between SSI enrollees and eligible nonenrollees in the availability of social supports. Enrollees are significantly less likely to have children, less likely to be married, and more likely to live alone. QMB enrollees are also less likely than nonenrollees to have children. Although there are significant differences between the marital status of QMB enrollees and nonenrollees, the pattern differs from SSI with a higher percentage of widowed beneficiaries in the nonenrollee population. This likely reflects the higher percentage of females in the nonenrollee population. On the other hand, there are no significant differences along these dimensions between enrollees and nonenrollees for the QMB-plus and SLMB populations.
56 Service quantities are not meaningful for outpatient hospital and total Part B services because of the
heterogeneity of services included in these categories. 57 We estimated a probit model, rather than a logistic model as we did in the NCH analyses, for consistency with
our adverse selection analyses, in which we estimated a bivariate probit model for the probability of service use (see Section 6.4.3).
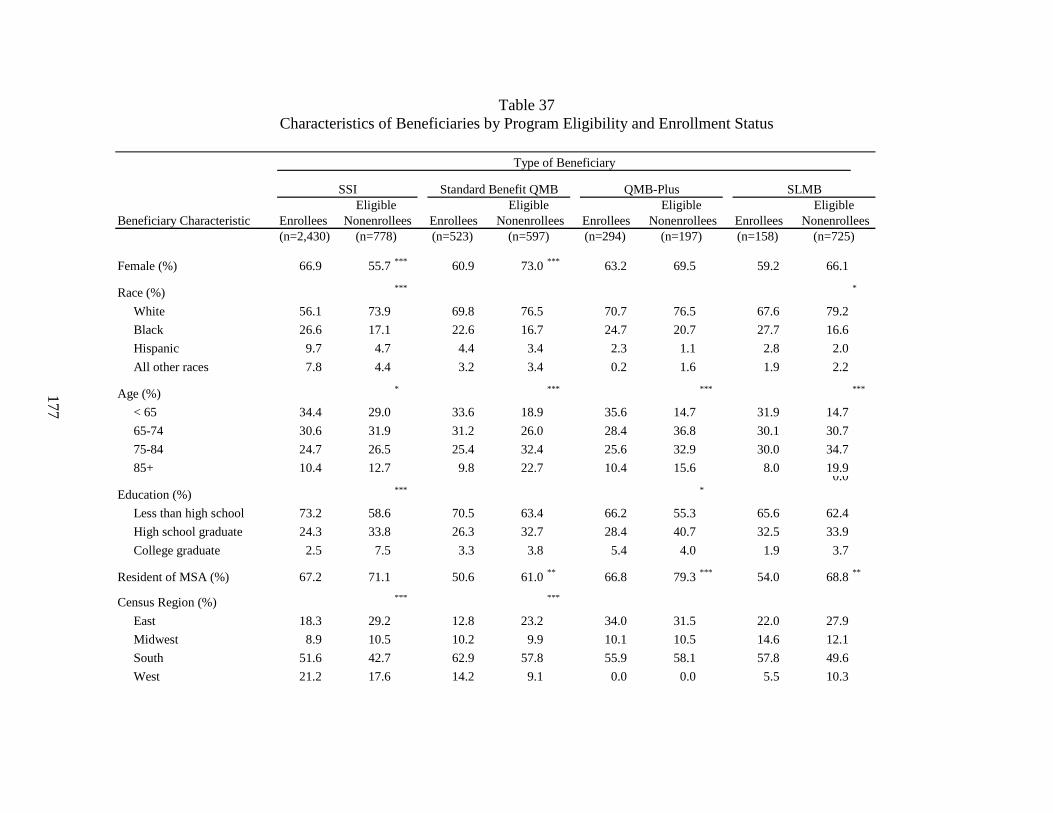
177
Table 37 Characteristics of Beneficiaries by Program Eligibility and Enrollment Status
Beneficiary Characteristic Enrollees Enrollees Enrollees Enrollees(n=2,430) (n=523) (n=294) (n=158)
Female (%) 66.9 55.7 *** 60.9 73.0 *** 63.2 69.5 59.2 66.1
Race (%) *** *
White 56.1 73.9 69.8 76.5 70.7 76.5 67.6 79.2
Black 26.6 17.1 22.6 16.7 24.7 20.7 27.7 16.6
Hispanic 9.7 4.7 4.4 3.4 2.3 1.1 2.8 2.0
All other races 7.8 4.4 3.2 3.4 0.2 1.6 1.9 2.2
Age (%) * *** *** ***
< 65 34.4 29.0 33.6 18.9 35.6 14.7 31.9 14.7
65-74 30.6 31.9 31.2 26.0 28.4 36.8 30.1 30.7
75-84 24.7 26.5 25.4 32.4 25.6 32.9 30.0 34.7
85+ 10.4 12.7 9.8 22.7 10.4 15.6 8.0 19.90.0
Education (%) *** *
Less than high school 73.2 58.6 70.5 63.4 66.2 55.3 65.6 62.4
High school graduate 24.3 33.8 26.3 32.7 28.4 40.7 32.5 33.9
College graduate 2.5 7.5 3.3 3.8 5.4 4.0 1.9 3.7
Resident of MSA (%) 67.2 71.1 50.6 61.0 ** 66.8 79.3 *** 54.0 68.8 **
Census Region (%) *** ***
East 18.3 29.2 12.8 23.2 34.0 31.5 22.0 27.9
Midwest 8.9 10.5 10.2 9.9 10.1 10.5 14.6 12.1
South 51.6 42.7 62.9 57.8 55.9 58.1 57.8 49.6
West 21.2 17.6 14.2 9.1 0.0 0.0 5.5 10.3
(n=725)(n=778) (n=597) (n=197)
Type of Beneficiary
QMB-Plus SLMBStandard Benefit QMBSSI
NonenrolleesEligibleEligible
NonenrolleesEligible
NonenrolleesEligible
Nonenrollees
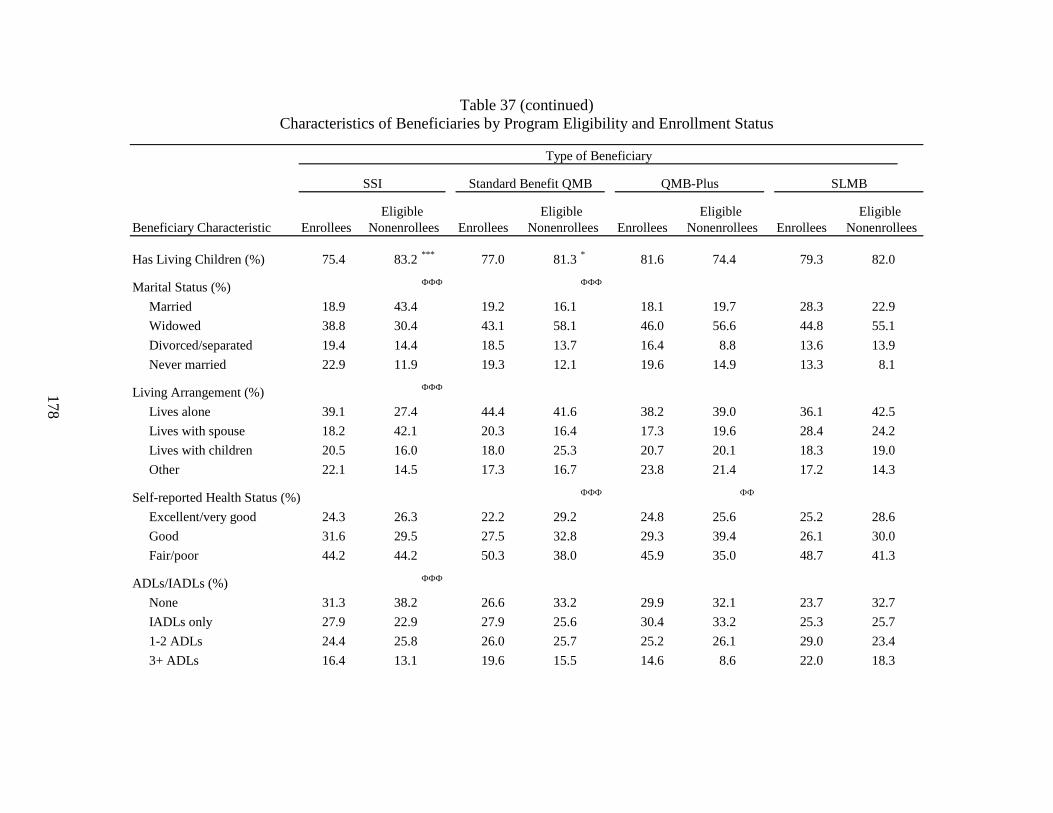
178
Table 37 (continued) Characteristics of Beneficiaries by Program Eligibility and Enrollment Status
Beneficiary Characteristic Enrollees Enrollees Enrollees Enrollees
Has Living Children (%) 75.4 83.2 *** 77.0 81.3 * 81.6 74.4 79.3 82.0
Marital Status (%) ФФФ ФФФ
Married 18.9 43.4 19.2 16.1 18.1 19.7 28.3 22.9
Widowed 38.8 30.4 43.1 58.1 46.0 56.6 44.8 55.1
Divorced/separated 19.4 14.4 18.5 13.7 16.4 8.8 13.6 13.9
Never married 22.9 11.9 19.3 12.1 19.6 14.9 13.3 8.1
Living Arrangement (%) ФФФ
Lives alone 39.1 27.4 44.4 41.6 38.2 39.0 36.1 42.5
Lives with spouse 18.2 42.1 20.3 16.4 17.3 19.6 28.4 24.2
Lives with children 20.5 16.0 18.0 25.3 20.7 20.1 18.3 19.0
Other 22.1 14.5 17.3 16.7 23.8 21.4 17.2 14.3
Self-reported Health Status (%) ФФФ ФФ
Excellent/very good 24.3 26.3 22.2 29.2 24.8 25.6 25.2 28.6
Good 31.6 29.5 27.5 32.8 29.3 39.4 26.1 30.0
Fair/poor 44.2 44.2 50.3 38.0 45.9 35.0 48.7 41.3
ADLs/IADLs (%) ФФФ
None 31.3 38.2 26.6 33.2 29.9 32.1 23.7 32.7
IADLs only 27.9 22.9 27.9 25.6 30.4 33.2 25.3 25.7
1-2 ADLs 24.4 25.8 26.0 25.7 25.2 26.1 29.0 23.4
3+ ADLs 16.4 13.1 19.6 15.5 14.6 8.6 22.0 18.3
Type of Beneficiary
SSI Standard Benefit QMB QMB-Plus SLMB
Eligible Eligible Eligible Eligible Nonenrollees Nonenrollees Nonenrollees Nonenrollees

179
Table 37 (continued) Characteristics of Beneficiaries by Program Eligibility and Enrollment Status
Beneficiary Characteristic Enrollees Enrollees Enrollees Enrollees
Number of Chronic Conditions 3.2 3.1 3.4 3.0 ФФ 3.8 3.2 ФФ 3.8 3.3 Ф
Originally Entitled Due to Disability (65+ only) (%) 10.0 6.9 ФФ 16.5 8.0 ФФФ 8.9 8.1 16.5 9.9 ФФ
Died (%) 2.7 5.4 ФФФ 1.9 7.9 ФФФ 2.0 6.8 ФФФ 1.5 9.6 ФФФ
Has Private Insurance (%) 4.1 45.1 ФФФ 13.1 52.9 ФФФ 9.0 57.0 ФФФ 26.6 55.9 ФФФ
Has Other Public Coverage (%) 6.3 9.8 Ф 15.8 10.1 9.4 13.7 25.0 14.7 ФФ
Has Insurance that Covers Prescription Medicine (%) 4.8 28.0 ФФФ 5.2 21.9 ФФФ 9.7 24.4 ФФФ 15.4 26.4 ФФ
NOTES:Ф Ф Ф Significantly different from enrollees at the 0.01 level. Ф Ф Significantly different from enrollees at the 0.05 level. Ф Significantly different from enrollees at the 0.10 level.
SOURCE: RTI analysis of MCBS Cost and Use Files (1995, 1997, and 1998) and corresponding Income and Asset supplements.
Nonenrollees Nonenrollees Nonenrollees NonenrolleesEligible Eligible Eligible Eligible
Type of Beneficiary
SSI Standard Benefit QMB QMB-Plus SLMB
PROGRAM: ynstest02, ynxstest07b, ynstest01b, qt3, ynstest01
180
We examined a number of health status indicators. The specific indicators that are significant differ by Medicare Savings Programs category; however, in general it appears that enrollees are in poorer health than eligible nonenrollees. Although there were no differences between SSI enrollees and nonenrollees in self-reported health status, enrollees were significantly less likely to have no ADLs or IADLs. While there were no significant differences in the number of ADLs and IADLs between enrollees and nonenrollees for the QMB and QMB-plus populations, in both groups enrollees were substantially more likely to report themselves as being in fair or poor health. There were no differences between SLMB enrollees and nonenrollees along these dimensions, but SLMB enrollees report significantly greater numbers of chronic conditions than eligible nonenrollees. QMB and QMB-plus enrollees also report significantly more chronic conditions than eligible nonenrollees. For all groups other than QMB-plus, enrollees over age 65 were more likely than eligible nonenrollees to have been originally entitled to Medicare due to disability. Recall also that in all groups, a larger proportion of enrollees are under age 65, virtually all of who are entitled due to disability. Overall, a substantially higher proportion of enrollees are disabled. On the other hand, eligible nonenrollees are more likely to have died during the study period than enrollees. This likely reflects the older age distribution of the nonenrollee population.
Nonenrollees are more likely than enrollees to have sources of insurance coverage other than Medicare and Medicaid. For all categories, nonenrollees are significantly more likely to report having private insurance coverage. Relatively small percentages of enrollees have private insurance coverage, while 45 to 56% of eligible nonenrollees say they have such coverage. Not surprisingly given their relatively higher income and more restricted Medicaid benefits, SLMB enrollees are the most likely category of beneficiaries to have private insurance – 27%. The MCBS asks respondents whether they receive public coverage other than Medicare or Medicaid, including state prescription drug programs. Among the SLMB population, enrollees (who are not eligible for prescription drug benefits under Medicaid) are more likely than nonenrollees to have such coverage. In contrast, SSI enrollees (who receive prescription drug coverage through Medicaid) are less likely than eligible nonenrollees to have other forms of public coverage. Although the differences are not significant for the standard benefit QMB and QMB-plus populations, the direction of differences is consistent with differences in the drug benefits each group receives through Medicaid – in the standard QMB benefit population, a higher percentage of enrollees compared to nonenrollees have other public coverage, while a lower percentage of enrollees in QMB-plus programs have this coverage. In all groups, eligible nonenrollees are substantially more likely than enrollees to report having insurance that covers prescription medications.
Descriptive Analyses - Table 38 displays the utilization and costs of selected Medicare services, comparing enrollees to eligible nonenrollees. Statistics are reported separately for the four categories of Medicare Savings Programs in order to identify whether differences between enrollees and nonenrollees are associated with variation in the benefits to which enrollees are entitled.
There are mainly no significant differences between enrollees and eligible nonenrollees in the utilization and cost of inpatient services. However, enrollees are generally significantly more likely to use all other service examined (outpatient hospital services, Part B services overall, and office visits) and they mainly have significantly higher expenditures for these
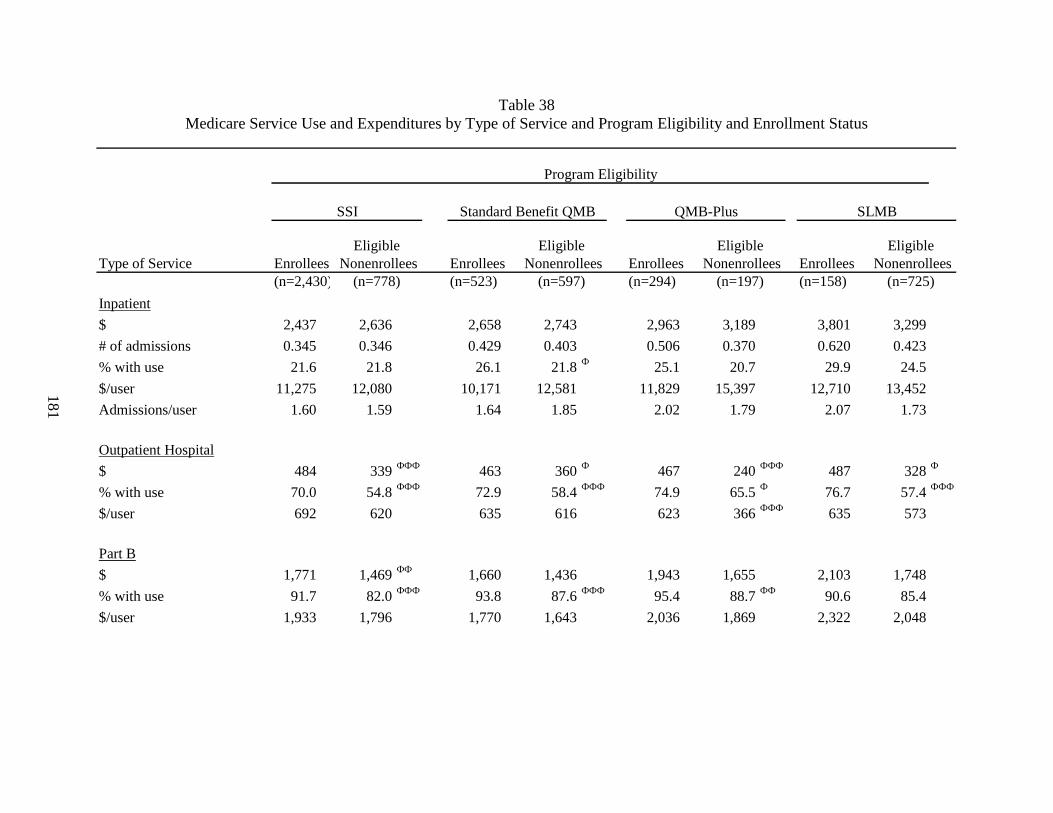
181
Table 38 Medicare Service Use and Expenditures by Type of Service and Program Eligibility and Enrollment Status
Type of Service Enrollees Enrollees Enrollees Enrollees(n=2,430) (n=523) (n=294) (n=158)
Inpatient
$ 2,437 2,636 2,658 2,743 2,963 3,189 3,801 3,299
# of admissions 0.345 0.346 0.429 0.403 0.506 0.370 0.620 0.423
% with use 21.6 21.8 26.1 21.8 Ф 25.1 20.7 29.9 24.5
$/user 11,275 12,080 10,171 12,581 11,829 15,397 12,710 13,452
Admissions/user 1.60 1.59 1.64 1.85 2.02 1.79 2.07 1.73
Outpatient Hospital
$ 484 339 ФФФ 463 360 Ф 467 240 ФФФ 487 328 Ф
% with use 70.0 54.8 ФФФ 72.9 58.4 ФФФ 74.9 65.5 Ф 76.7 57.4 ФФФ
$/user 692 620 635 616 623 366 ФФФ 635 573
Part B
$ 1,771 1,469 ФФ 1,660 1,436 1,943 1,655 2,103 1,748
% with use 91.7 82.0 ФФФ 93.8 87.6 ФФФ 95.4 88.7 ФФ 90.6 85.4
$/user 1,933 1,796 1,770 1,643 2,036 1,869 2,322 2,048
(n=778) (n=597) (n=197) (n=725)
Eligible Nonenrollees
Eligible Nonenrollees
Eligible Nonenrollees
Eligible Nonenrollees
Program Eligibility
SSI SLMBQMB-PlusStandard Benefit QMB
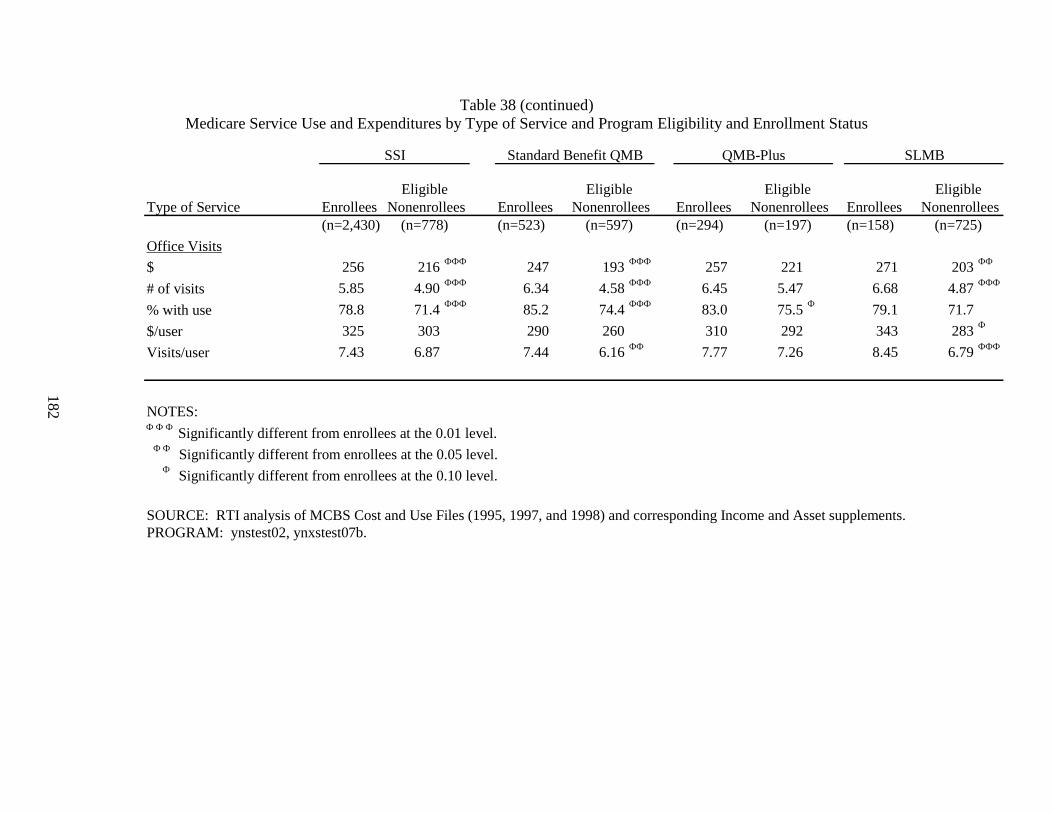
182
Table 38 (continued) Medicare Service Use and Expenditures by Type of Service and Program Eligibility and Enrollment Status
Type of Service Enrollees Enrollees Enrollees Enrollees(n=2,430) (n=523) (n=294) (n=158)
Office Visits $ 256 216 ФФФ 247 193 ФФФ 257 221 271 203 ФФ
# of visits 5.85 4.90 ФФФ 6.34 4.58 ФФФ 6.45 5.47 6.68 4.87 ФФФ
% with use 78.8 71.4 ФФФ 85.2 74.4 ФФФ 83.0 75.5 Ф 79.1 71.7
$/user 325 303 290 260 310 292 343 283 Ф
Visits/user 7.43 6.87 7.44 6.16 ФФ 7.77 7.26 8.45 6.79 ФФФ
NOTES: Ф Ф Ф Significantly different from enrollees at the 0.01 level. Ф Ф Significantly different from enrollees at the 0.05 level. Ф Significantly different from enrollees at the 0.10 level.
SOURCE: RTI analysis of MCBS Cost and Use Files (1995, 1997, and 1998) and corresponding Income and Asset supplements.PROGRAM: ynstest02, ynxstest07b.
(n=778) (n=597) (n=197) (n=725)
SSI Standard Benefit QMB QMB-Plus SLMB
Eligible Eligible Eligible Eligible Nonenrollees Nonenrollees Nonenrollees Nonenrollees
183
services. While not all differences are significant, there is a consistent pattern of higher service use and costs for enrollees compared to nonenrollees.
Across all eligibility groups, enrollees have significantly higher reimbursed amounts for outpatient hospital services. The difference is particularly large for QMB-plus beneficiaries, where reimbursed amounts for enrollees are nearly double those of eligible nonenrollees. In all groups, enrollees are also substantially more likely to use outpatient hospital services, with differences ranging from approximately 20 percentage points (SLMB) to roughly 10 percentage points (QMB-plus). With the exception of the QMB-plus category, differences in the likelihood of using services mainly explain the difference between enrollees and eligible nonenrollees in overall reimbursements and there are no significant differences in reimbursed amounts for outpatient hospital services among those with service use. The powerful impact enrollment on outpatient hospital services may reflect the historically higher levels of copayments for these services. Due to a technicality in the Medicare law that was not corrected until August 2000 with the implementation of outpatient prospective payment, copayments for outpatient hospital services were based on billed charges. As a result, beneficiary copayments were approximately 50% of hospital outpatient payments and price may have been a greater barrier to use of outpatient hospital services (MedPAC, 2001).
Enrollees are more likely than nonenrollees to use Part B services of any kind, although the difference for the SLMB group is not significant. Enrollees also have higher allowed charges, but the difference is only significant for the SSI group and there are no significant differences in allowed charges for users only. Nonetheless, in all cases mean allowed charges are higher for enrollees. The absence of significant differences reflects the relatively small sample sizes in these analyses and high variability of allowed charges across beneficiaries.
Similar to Part B services overall, enrollees are more likely than nonenrollees to have an office visit, although the difference is only significant at the 10% level for the QMB-plus population and insignificant for SLMBs. Other than the QMB-plus group, enrollees also have significantly higher allowed charges and a greater average number of office visits than nonenrollees. For those beneficiaries that had an office visit, there are generally no significant differences in allowed charges between enrollees and eligible nonenrollees (although the difference in the SLMB group is significant at p<.10). Both standard benefit QMB and SLMB enrollees with at least one office visit had significantly more visits than their nonenrollee counterparts.
Multivariate Analyses - As discussed earlier in this section, characteristics of enrollees and eligible nonenrollees differ substantially along many dimensions. These differences, as well as the Medicaid benefits they receive, may explain the greater levels of service use by enrollees. We used multivariate analysis to control for differences in beneficiary characteristics in order to isolate the impact of the Medicaid benefits provided to Medicare Savings Programs enrollees on service use. The beneficiary characteristics in the multivariate analyses include sociodemographic characteristics, availability of social supports, health status, and other insurance coverage.
184
Multivariate analyses confirm and strengthen the results of our descriptive analyses (Table 39).58 As hypothesized, enrollees in each of the four Medicare Savings Programs groups are significantly more likely than nonenrollees to use outpatient hospital services, Part B services overall, and office visits, even after controlling for their poorer health status. SSI, standard benefit QMB, and SLMB enrollees are also significantly more likely than eligible nonenrollees to have an inpatient admission, although the results for QMBs and SLMBs are only significant at p<.10. As in the descriptive analyses, the difference in the probability of service use between enrollees and nonenrollees are largest for outpatient hospital services, ranging from 23% (SLMB) to 12% (standard benefit QMB). Enrollment also had a large effect on the probability of having an office visit. QMB-plus and SLMB enrollees are about 16% more likely than their nonenrollee counterparts to have an office visit, while SSI and standard benefit QMBs are about 12% more likely than eligible nonenrollees. The impact of enrollment on the probability of using any Part B services was 7% for all groups except SSI, for which it was 11%. The strength of the impact of enrollment for the SLMB population is particularly notable given that they remain liable for Medicare copayments and deductibles. However, coverage of the Part B premium provides them with additional disposable income that can be used to purchase additional medical care.
For those with some service use, enrollment in the Medicare Savings Programs significantly increased allowed charges for Part B services and office visits for all groups except QMB-plus. The failure to find a significant impact on Part B visits for QMB-plus enrollees likely reflects the small sample size for this population. SSI enrollment also had a significant, positive impact on reimbursed amounts for outpatient hospital services. Enrollment did not have a significant positive impact on payments for inpatient services. However, among those that had an inpatient stay, beneficiaries enrolled in standard benefit QMB and QMB-plus programs have approximately 40% lower inpatient payments than their eligible, nonenrollee counterparts.
As described in Section 6.3.2, the income distribution of our eligible, nonenrollee group differs systematically from that of the enrollee sample. To test the sensitivity of our findings to these differing income distributions, we re-estimated our multivariate model, restricting the enrollee sample to the income ranges used to identify eligible nonenrollees.59 Findings from these restricted analyses were consistent with those from the full sample. The impact of enrollment remained significant for all categories where it was significant in the full sample, with the exception of those variables that had been significant only at p<.10 in the full sample which became insignificant in the restricted sample. In addition, there were only modest changes in the magnitude of the impact of enrollment on the probability of service use and service costs.
58 Complete Regression results are shown in Appendix L (Tables L8-L23).
59 These are: less than 80% of FPL for the SSI population, 80-100% of FPL for the standard benefit QMB and QMB-plus populations, and 100-120% of FPL for the SLMB population.
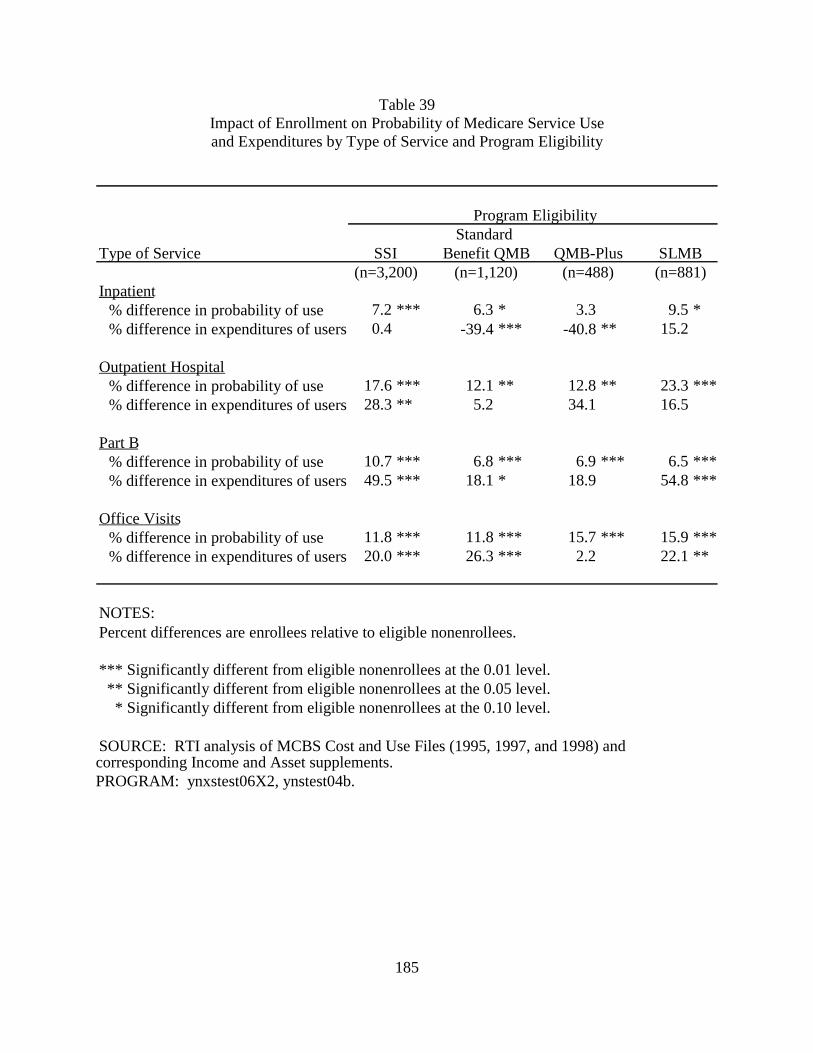
185
Table 39 Impact of Enrollment on Probability of Medicare Service Use and Expenditures by Type of Service and Program Eligibility
Type of Service
Inpatient % difference in probability of use 7.2 *** 6.3 * 3.3 9.5 *% difference in expenditures of users 0.4 -39.4 *** -40.8 ** 15.2
Outpatient Hospital % difference in probability of use 17.6 *** 12.1 ** 12.8 ** 23.3 ***% difference in expenditures of users 28.3 ** 5.2 34.1 16.5
Part B % difference in probability of use 10.7 *** 6.8 *** 6.9 *** 6.5 ***% difference in expenditures of users 49.5 *** 18.1 * 18.9 54.8 ***
Office Visits % difference in probability of use 11.8 *** 11.8 *** 15.7 *** 15.9 ***% difference in expenditures of users 20.0 *** 26.3 *** 2.2 22.1 **
NOTES: Percent differences are enrollees relative to eligible nonenrollees.
*** Significantly different from eligible nonenrollees at the 0.01 level. ** Significantly different from eligible nonenrollees at the 0.05 level. * Significantly different from eligible nonenrollees at the 0.10 level.
SOURCE: RTI analysis of MCBS Cost and Use Files (1995, 1997, and 1998) and corresponding Income and Asset supplements.PROGRAM: ynxstest06X2, ynstest04b.
SLMB
Program Eligibility Standard
SSI Benefit QMB QMB-Plus (n=3,200) (n=1,120) (n=488) (n=881)
186
6.4.3 Adverse Selection Analyses
Our finding that enrollment in the Medicare Savings Programs has a positive impact on service use is consistent with the hypothesis that eliminating or reducing cost-sharing increases demand for health care services. Nonetheless, some of the difference in service use may also be due to differences between enrollees and eligible nonenrollees in health status or other factors that affect the propensity to seek care. Indeed, both findings from our beneficiary survey (see Chapter 2) and our comparison of service use prior to enrollment in the Medicare Savings Programs (Chapter 3) indicate that hospitalizations are an important precipitating event for program enrollment. To the extent that beneficiaries were hospitalized for chronic conditions, this could predict higher levels of ongoing service use.
Although our multivariate analyses control for numerous characteristics that are expected to influence service use, including several measures of health status, it is possible that there remain unmeasured differences between enrollees and their nonenrollees counterparts that contribute to the finding that enrollment is positively related to service use. Previous research by Parente and Evans (1998) used an instrumental variables approach to control for the possibility that adverse selection in enrollment contributes to higher levels of service use among QMB enrollees compared to nonenrollees. After instrumenting for QMB enrollment, they found little change in the magnitude of the effect of QMB enrollment on Part B service use overall, although parameters were imprecisely estimated and no longer significant. However, the effect of QMB enrollment on the probability of having some Part A use fell substantially and was no longer significant. The authors interpreted these findings as suggesting that the effect of QMB enrollment on Part A use is driven by adverse selection, while the effect on Part B use is driven by the elimination of cost-sharing liabilities. However, the authors note that their ability to draw conclusions is limited by the imprecision of their estimates. Pezzin and Kasper (2002) also used an instrumental variables approach and found only a modest impact of Medicare Savings Program enrollment on service use after controlling for adverse selection. However, even after correcting for self-selection, enrollees were more likely than nonenrollees to have an outpatient hospital department or physician office visit.
Both of these previous studies combined SSI and QMB beneficiaries in their study populations. Given the much higher rate of Medicare Savings Programs enrollment among beneficiaries eligible for SSI compared to those eligible for QMB, the enrollee population is undoubtedly dominated by SSI recipients. In contrast, beneficiaries that qualify for the QMB program are disproportionately represented in the nonenrollee population. As a result, differences they find between the enrollee and nonenrollee populations may be confounded by differences between the SSI and QMB populations.
Statistical Methods - To address this limitation, we analyze the impact of adverse selection on differences in service use for enrollees and eligible nonenrollees separately for our four subpopulations – SSI , QMB in standard benefit states, QMB in QMB-plus states, and SLMB. As in previous studies, we use instrumental variables to control for the impact of adverse selection in the decision to enroll on differences in service use observed between enrollees and nonenrollees. We estimated bivariate probit models as the instrumental variables counterpart of the probit models reported in Section 6.4.2. Similarly, the lognormal models reported previously were replicated using instrumental variables in a two-stage least squares model.
187
The variables selected as instruments should predict enrollment in the Medicare Savings Programs, but should be uncorrelated with service use. The instruments used for each subpopulation are shown in Table 40. As described below, the set of instruments varied by subpopulation based on the results of descriptive analyses and our hypotheses about the impact of certain program variables on specific groups.
The set of instruments for all of the subpopulations included a dummy variable for whether the beneficiary rents her home.60 Descriptive comparisons showed that enrollees in each of the subpopulations were substantially more likely to rent than nonenrollees. These differences were statistically significant for each of the subpopulations except QMB-plus. We hypothesized that renters would be more likely to enroll in these programs because homeowners might believe their assets were too high to qualify or they might be reluctant to enroll because of concerns about losing their home due to estate recovery. In addition, our beneficiary survey and focus groups showed that moving to subsidized housing often precipitates enrollment in the Medicare Savings Programs and service coordinators at senior housing frequently educate residents about these programs.
Our list of potential instruments also included various state outreach and enrollment activities that were identified as being related to enrollment rates either in our state enrollment analysis (Chapter 5) or our beneficiary survey analysis (Chapter 2).61 The specific outreach and enrollment activities used as instruments for each subpopulation were those where we found significant differences between enrollees and nonenrollees in that group.
60 It is possible that home ownership could predict service use since enrollees can liquidate their assets, including
their home, in order to purchase health care services. We tested this by re-estimating our multivariate models for the probability of service use and expenditures for those with service use, adding a dummy variable for being a renter to this list of variables included in the multivariate models described in the preceding section. Based on the hypothesis that homeowners have greater assets, which can be used to purchase health care services, we would expect to find that being a renter has a negative impact on service use. Of the 16 regressions for the probability of service use, renting had a significant impact in two cases – the probability of outpatient hospital use and probability of any Part B use for the SSI population. Being a renter was significant in 2 the 16 expenditure regressions – office visit expenditures for the SSI population and inpatient expenditures for the standard QMB benefit population. For the SSI population, contrary to the hypothesized effect, the impact of renting was positive. Given that being a renter was generally not a significant predictor of service use, we used it as an instrument in our models.
61 The outreach and enrollment activities that were considered as potential instruments were: any type of live presentation, presentations at health fairs, small group presentations, one-on-one presentations, training outreach workers, partnerships with community health centers, partnerships with advocacy organizations, use of a shortened application, liberalization of asset tests, allowing self-declaration of income and assets, not requiring in-person interviews, automatic redetermination, and automatic screening for other programs.
Data on outreach activities were drawn from the state outreach survey for 1999, the earliest year collected, but after the time period covered in our MCBS analyses. As a result, the predictive power of these variables will be limited unless states were conducting the activities prior to 1999. Outreach and enrollment measures could also be correlated with prior years enrollment if the direction of causality is reversed – i.e., if states with low takeup rates are more likely to adopt outreach activities or simplify enrollments processes. Indeed, the state enrollment analysis (Chapter 5) and beneficiary survey analysis (Chapter 2) did identify this type of relationship.
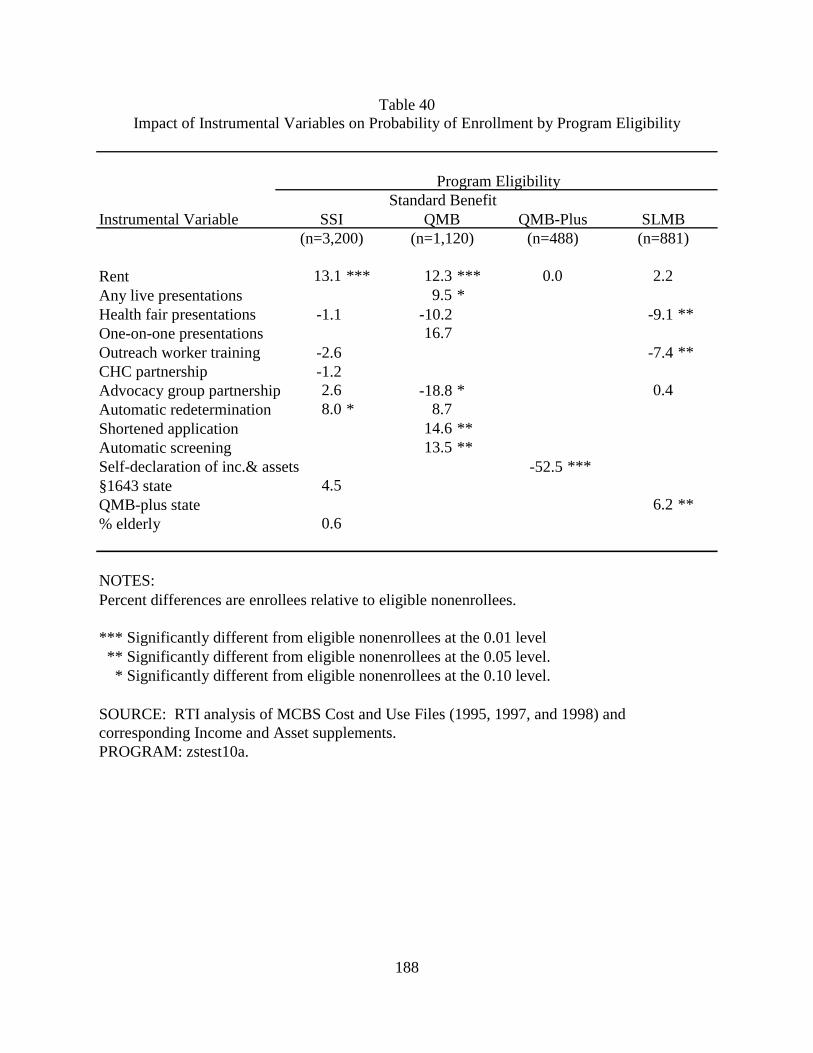
188
Table 40 Impact of Instrumental Variables on Probability of Enrollment by Program Eligibility
Instrumental Variable
Rent 13.1 *** 12.3 *** 0.0 2.2Any live presentations 9.5 *Health fair presentations -1.1 -10.2 -9.1 **One-on-one presentations 16.7Outreach worker training -2.6 -7.4 **CHC partnership -1.2 Advocacy group partnership 2.6 -18.8 * 0.4Automatic redetermination 8.0 * 8.7Shortened application 14.6 **Automatic screening 13.5 **Self-declaration of inc.& assets -52.5 *** §1643 state 4.5 QMB-plus state 6.2 **% elderly 0.6
NOTES: Percent differences are enrollees relative to eligible nonenrollees.
*** Significantly different from eligible nonenrollees at the 0.01 level ** Significantly different from eligible nonenrollees at the 0.05 level. * Significantly different from eligible nonenrollees at the 0.10 level.
SOURCE: RTI analysis of MCBS Cost and Use Files (1995, 1997, and 1998) and corresponding Income and Asset supplements.PROGRAM: zstest10a.
Program Eligibility
SSI QMB QMB-Plus SLMBStandard Benefit
(n=3,200) (n=1,120) (n=488) (n=881)
189
In addition, for the SSI analysis, we included a variable for the percent of the population in a state that is elderly. We hypothesized that enrollment might be higher in states with a large elderly population. In descriptive analyses, however, this variable only differed significantly between enrollees and nonenrollees for the SSI population. The set of instruments for the SSI population also included a variable for whether the beneficiary lives in a state has a §1634 agreement with the Social Security Administration to automatically buy all SSI beneficiaries into Medicaid. In these states, Medicare Savings Program enrollment among SSI recipients should be virtually 100% since Medicaid buy-in does not require any action by the beneficiary. The SLMB analysis included a variable for whether the beneficiary lives in a state that offers QMB-plus benefits. We hypothesized that beneficiaries in QMB-plus states have a greater incentive to apply for the Medicare Savings Programs because of the richer benefit package offered to QMBs. Although SLMBs receive the same benefit in all states, beneficiaries may not know which program they qualify for at the time they apply.
To test the power of our instruments, we estimated probit models for the probability of enrolling in the Medicare Savings Programs for each of the four subpopulations. The models included the specific instruments identified for each subpopulation, as well as the set of variables included in our service use regressions.62 Table 40 shows the impact of the instruments on the probability of enrollment for each subpopulation. In all cases the set of instruments for the subpopulation are jointly significant at p<.01. In addition, for each subpopulation at least one instrument is significant at p<.05 or better. The standard benefit QMB and SLMB subpopulations each have three instruments that are statistically significant at p<.05 or higher. Nonetheless, it is still possible that our instruments are not sufficiently strong predictors of enrollment.
We used bivariate probit to estimate the probability of using services, correcting for adverse selection in enrollment.63 Two-stage least squares was used to estimate expenditures for those with service use, again correcting for adverse selection.64 Both the bivariate probit and two-stage least squares models included the variables from our basic service use regressions, as well as the instruments for the specific subpopulation. The variable for having an income greater than the poverty level was omitted from the bivariate probit and two-stage least squares models because this variable was used to define the nonenrollee population. Therefore, it could not be used in the portion of these models that predicted program enrollment. To test the impact of excluding the income variable, we re-estimated our main service use models excluding this variable. In general, excluding the income variable had a minor impact on the estimated effect of program enrollment on service use. However, for consistency, we compare the results from our
62 The dummy variable for having an income greater than poverty was excluded from these models. Because
income was used to identify the eligible nonenrollee population, it was a perfect predictor of enrollment. 63 It is not possible to estimate bivariate probit models that fully correct for complex sample design in STATA.
Our bivariate probit models correct for clustering by primary sampling unit, but do not account for the stratification in sample selection. As a result, the standard errors in our bivariate probit analyses will tend to be somewhat smaller than those in the corresponding probit analyses, which fully corrected for the complex sample design in the MCBS.
64 We attempted to estimate a treatment effects model, which can be used to estimate the effect of a binary endogenous variable on a continuous variable. Because this model would not converge, we used two-stage least squares instrumental variable analysis instead.
190
bivariate probit and two-stage least squares models with results from probit and lognormal models that do not include the income variable.
Results of Instrumental Variable Analyses - Estimates of the impact of enrollment on service use from the bivariate probit and two-stage least squares models that control for adverse selection in enrollment are shown in Table 41. For comparison, we also show results from probit and lognormal models. If poorer health status or other characteristics of the enrollee population contribute to the finding that they use more services than nonenrollees, we would expect to find smaller differences in service use between these groups in models that control for adverse selection. For example, if there is no significant difference in service use between enrollees and nonenrollees after controlling for adverse selection, this suggests that differences found in models that do not correct for selection are explained entirely by beneficiary characteristics and program enrollment has no impact on utilization. A finding of a smaller, but significant, positive effect of enrollment on service use implies that enrollment in the Medicare Savings Programs increases service use, but the magnitude of the impact is overstated in models that do not correct for adverse selection. On the other hand, a larger positive effect of enrollment on service use after controlling for selection implies that Medicare Savings Programs enrollees are healthier or have other characteristics that make them less likely to seek care than nonenrollees. In this case, models that do not correct for selection understate the positive impact of enrollment on service use. Finally, a significant negative effect of enrollment on service use suggests that positive effects of enrollment found in models that do not control for selection are completely explained by beneficiary characteristics and program enrollment is actually associated with reductions in service use. Although this result generally is not expected, improved access to certain services might reduce utilization of other types of care. For example, increased utilization of outpatient services might lower inpatient admissions.
The impact of enrollment on service use is imprecisely estimated in our selection models, particularly in models of expenditures for beneficiaries with service use. 65 In a number of cases large estimated effects are insignificant (e.g., outpatient hospital expenditures for all four populations) and in others significant effects are implausibly large (e.g., models for Part B expenditures and office visit expenditures for the SSI population).
Given these results, it is difficult to assess whether selection explains differences in service use between enrollees and nonenrollees. For the SSI population, the results suggest that greater service use by enrollees compared to nonenrollees is not explained by differential selection in enrollment. With the exception of inpatient and outpatient hospital expenditures, we still find that enrollment has a significant, positive impact on service. If anything, the magnitude of the positive effect becomes larger in the selection models. Although the impact of enrollment
65 The bivariate probit results may be sensitive to the model’s assumption that the error terms in the probability of
enrollment and probability of use equations are distributed bivariate normal. To test the impact of this distributional assumption on the results of the bivariate probit models, we estimated ordinary least squares and two-stage least squares analogs of our probit and bivariate probit models. We then compared results from the two-stage least squares models with those from the ordinary least squares models, looking at the direction and general magnitude of the change in effect. The results from this set of analyses were generally consistent with those from the probit and bivariate probit models. Thus, it appears that our results are robust to the distributional assumptions of the bivariate probit model.
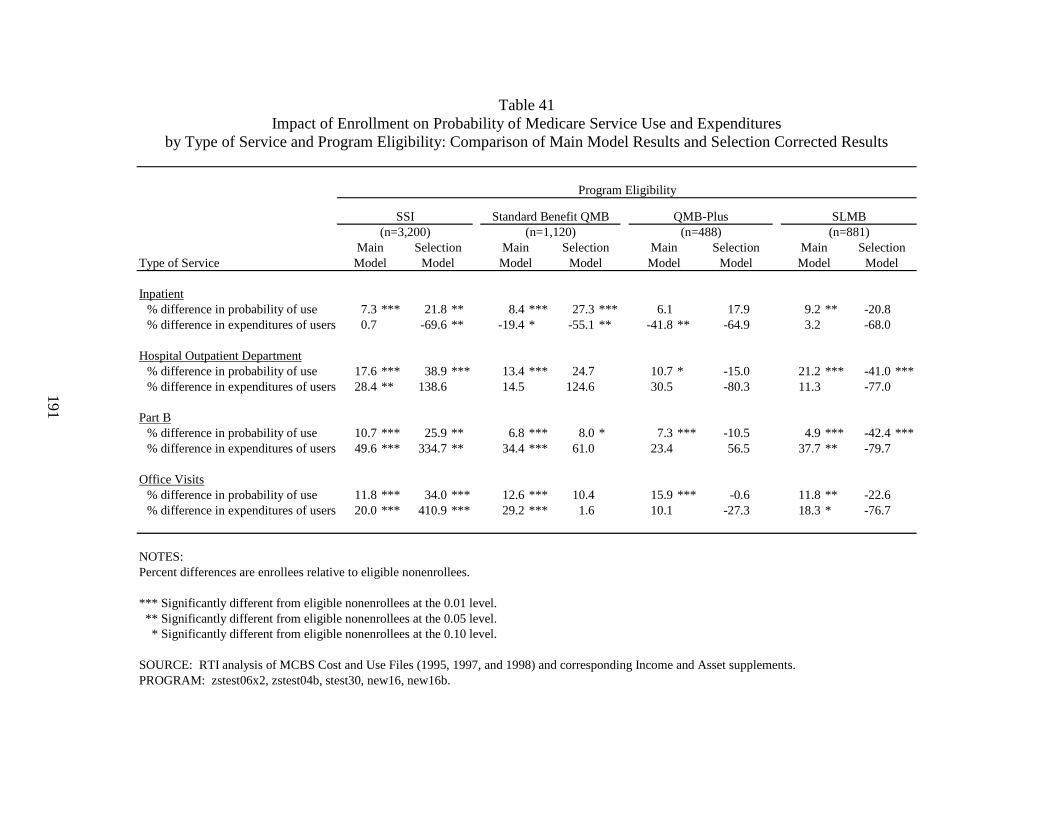
191
Table 41 Impact of Enrollment on Probability of Medicare Service Use and Expenditures
by Type of Service and Program Eligibility: Comparison of Main Model Results and Selection Corrected Results
Type of Service
Inpatient% difference in probability of use 7.3 *** 21.8 ** 8.4 *** 27.3 *** 6.1 17.9 9.2 ** -20.8% difference in expenditures of users 0.7 -69.6 ** -19.4 * -55.1 ** -41.8 ** -64.9 3.2 -68.0
Hospital Outpatient Department% difference in probability of use 17.6 *** 38.9 *** 13.4 *** 24.7 10.7 * -15.0 21.2 *** -41.0 ***% difference in expenditures of users 28.4 ** 138.6 14.5 124.6 30.5 -80.3 11.3 -77.0
Part B% difference in probability of use 10.7 *** 25.9 ** 6.8 *** 8.0 * 7.3 *** -10.5 4.9 *** -42.4 ***% difference in expenditures of users 49.6 *** 334.7 ** 34.4 *** 61.0 23.4 56.5 37.7 ** -79.7
Office Visits% difference in probability of use 11.8 *** 34.0 *** 12.6 *** 10.4 15.9 *** -0.6 11.8 ** -22.6% difference in expenditures of users 20.0 *** 410.9 *** 29.2 *** 1.6 10.1 -27.3 18.3 * -76.7
NOTES:Percent differences are enrollees relative to eligible nonenrollees.
*** Significantly different from eligible nonenrollees at the 0.01 level. ** Significantly different from eligible nonenrollees at the 0.05 level. * Significantly different from eligible nonenrollees at the 0.10 level.
SOURCE: RTI analysis of MCBS Cost and Use Files (1995, 1997, and 1998) and corresponding Income and Asset supplements.PROGRAM: zstest06x2, zstest04b, stest30, new16, new16b.
ModelModel Model ModelModel Model Model Model
(n=3,200) (n=1,120) (n=488)
Program Eligibility
SLMBSSI Standard Benefit QMB QMB-Plus
Selection Main Selection(n=881)
Main Selection Main MainSelection
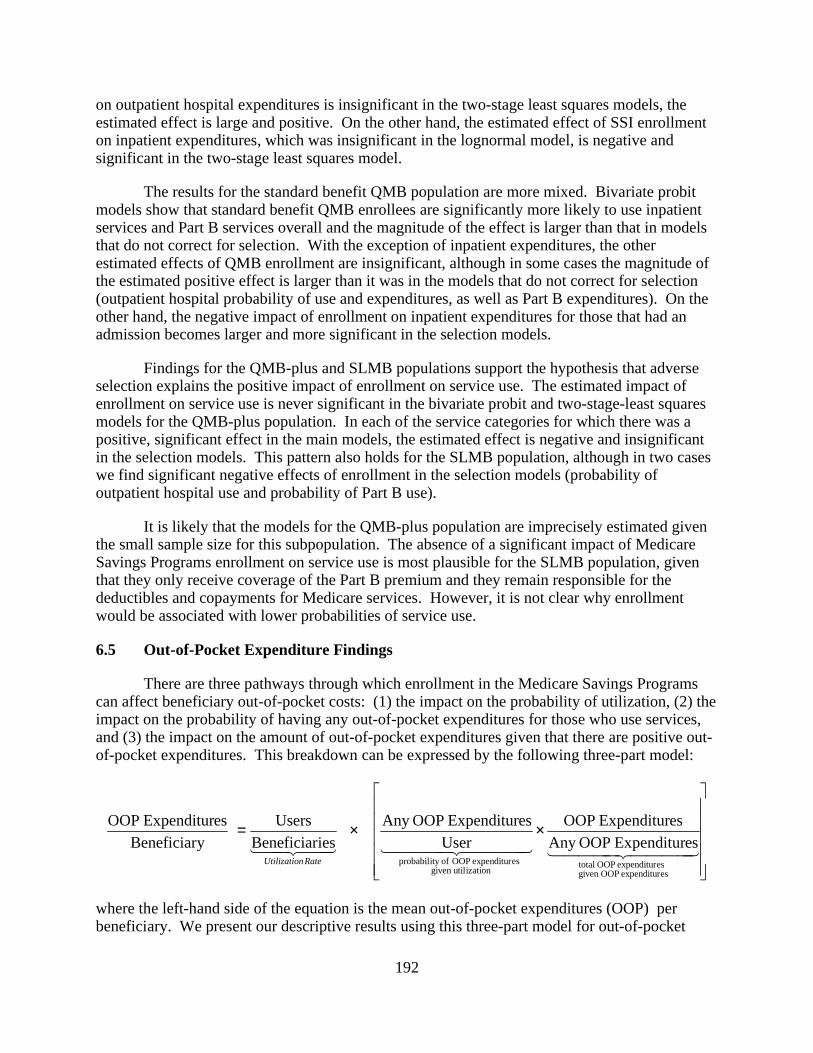
192
on outpatient hospital expenditures is insignificant in the two-stage least squares models, the estimated effect is large and positive. On the other hand, the estimated effect of SSI enrollment on inpatient expenditures, which was insignificant in the lognormal model, is negative and significant in the two-stage least squares model.
The results for the standard benefit QMB population are more mixed. Bivariate probit models show that standard benefit QMB enrollees are significantly more likely to use inpatient services and Part B services overall and the magnitude of the effect is larger than that in models that do not correct for selection. With the exception of inpatient expenditures, the other estimated effects of QMB enrollment are insignificant, although in some cases the magnitude of the estimated positive effect is larger than it was in the models that do not correct for selection (outpatient hospital probability of use and expenditures, as well as Part B expenditures). On the other hand, the negative impact of enrollment on inpatient expenditures for those that had an admission becomes larger and more significant in the selection models.
Findings for the QMB-plus and SLMB populations support the hypothesis that adverse selection explains the positive impact of enrollment on service use. The estimated impact of enrollment on service use is never significant in the bivariate probit and two-stage-least squares models for the QMB-plus population. In each of the service categories for which there was a positive, significant effect in the main models, the estimated effect is negative and insignificant in the selection models. This pattern also holds for the SLMB population, although in two cases we find significant negative effects of enrollment in the selection models (probability of outpatient hospital use and probability of Part B use).
It is likely that the models for the QMB-plus population are imprecisely estimated given the small sample size for this subpopulation. The absence of a significant impact of Medicare Savings Programs enrollment on service use is most plausible for the SLMB population, given that they only receive coverage of the Part B premium and they remain responsible for the deductibles and copayments for Medicare services. However, it is not clear why enrollment would be associated with lower probabilities of service use.
6.5 Out-of-Pocket Expenditure Findings
There are three pathways through which enrollment in the Medicare Savings Programs can affect beneficiary out-of-pocket costs: (1) the impact on the probability of utilization, (2) the impact on the probability of having any out-of-pocket expenditures for those who use services, and (3) the impact on the amount of out-of-pocket expenditures given that there are positive out-of-pocket expenditures. This breakdown can be expressed by the following three-part model:
××=4444 34444 214444 34444 214434421
esexpenditur OOPgiven esexpenditur OOP total
izationgiven util esexpenditur OOP ofity probabil
esExpenditur OOPAny esExpenditur OOP
UseresExpenditur OOPAny
iesBeneficiarUsers
yBeneficiaresExpenditur OOP
RatenUtilizatio
where the left-hand side of the equation is the mean out-of-pocket expenditures (OOP) per beneficiary. We present our descriptive results using this three-part model for out-of-pocket
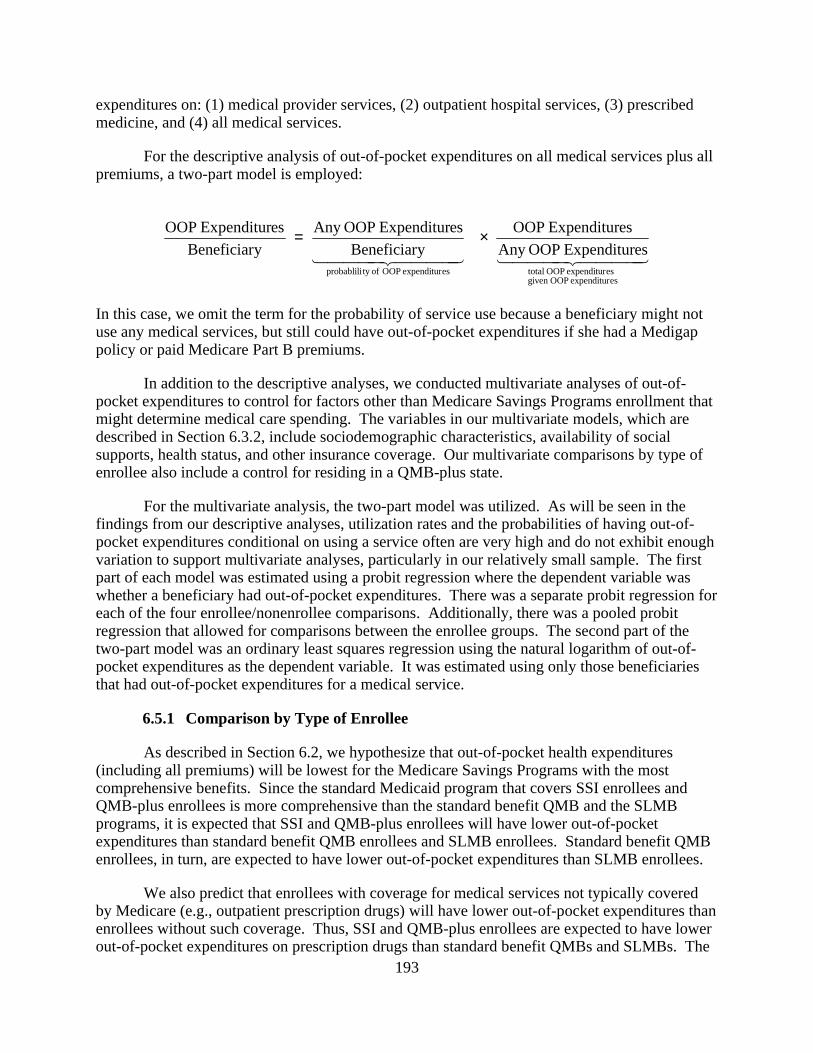
193
expenditures on: (1) medical provider services, (2) outpatient hospital services, (3) prescribed medicine, and (4) all medical services.
For the descriptive analysis of out-of-pocket expenditures on all medical services plus all premiums, a two-part model is employed:
4444 34444 214444 34444 21
esexpenditur OOPgiven esexpenditur OOP totalesexpenditur OOP ofty probablili
esExpenditur OOPAny
esExpenditur OOP
yBeneficiar
esExpenditur OOPAny
yBeneficiar
esExpenditur OOP ×=
In this case, we omit the term for the probability of service use because a beneficiary might not use any medical services, but still could have out-of-pocket expenditures if she had a Medigap policy or paid Medicare Part B premiums.
In addition to the descriptive analyses, we conducted multivariate analyses of out-of-pocket expenditures to control for factors other than Medicare Savings Programs enrollment that might determine medical care spending. The variables in our multivariate models, which are described in Section 6.3.2, include sociodemographic characteristics, availability of social supports, health status, and other insurance coverage. Our multivariate comparisons by type of enrollee also include a control for residing in a QMB-plus state.
For the multivariate analysis, the two-part model was utilized. As will be seen in the findings from our descriptive analyses, utilization rates and the probabilities of having out-of-pocket expenditures conditional on using a service often are very high and do not exhibit enough variation to support multivariate analyses, particularly in our relatively small sample. The first part of each model was estimated using a probit regression where the dependent variable was whether a beneficiary had out-of-pocket expenditures. There was a separate probit regression for each of the four enrollee/nonenrollee comparisons. Additionally, there was a pooled probit regression that allowed for comparisons between the enrollee groups. The second part of the two-part model was an ordinary least squares regression using the natural logarithm of out-of-pocket expenditures as the dependent variable. It was estimated using only those beneficiaries that had out-of-pocket expenditures for a medical service.
6.5.1 Comparison by Type of Enrollee
As described in Section 6.2, we hypothesize that out-of-pocket health expenditures (including all premiums) will be lowest for the Medicare Savings Programs with the most comprehensive benefits. Since the standard Medicaid program that covers SSI enrollees and QMB-plus enrollees is more comprehensive than the standard benefit QMB and the SLMB programs, it is expected that SSI and QMB-plus enrollees will have lower out-of-pocket expenditures than standard benefit QMB enrollees and SLMB enrollees. Standard benefit QMB enrollees, in turn, are expected to have lower out-of-pocket expenditures than SLMB enrollees.
We also predict that enrollees with coverage for medical services not typically covered by Medicare (e.g., outpatient prescription drugs) will have lower out-of-pocket expenditures than enrollees without such coverage. Thus, SSI and QMB-plus enrollees are expected to have lower out-of-pocket expenditures on prescription drugs than standard benefit QMBs and SLMBs. The
194
demand for prescription drugs by both standard benefit QMB and SLMB enrollees is influenced by a similar income effect due to reduced Part B premiums. However, even though the standard benefit QMB package does not include prescription drugs, the reduced co-insurance rates on Medicare covered services frees resources that allow standard benefit QMBs to possibly have a higher demand for prescription drugs than SLMBs. However, as discussed previously, differences between enrollee groups that are not controlled for in our analyses may also influence relative service use and out-of-pocket costs. For example, SLMBs by definition have higher incomes than QMBs. Thus, while SLMBs have greater liability for Medicare co-insurance, it is not clear that they have less income to spend on outpatient prescription drugs.
Descriptive Analyses - SSI enrollees had the lowest out-of-pocket health expenditures (including premiums) at $427 per beneficiary, followed by QMB-plus enrollees with $1,058 per beneficiary, standard benefit QMBs with $1,074 per beneficiary, and SLMB with $2,216 per beneficiary (Table 42). Except for the QMB-plus/standard benefit QMB comparison, all of the differences are statistically significant. The pattern of out-of-pocket health expenditures (including premiums) for those with some out-of-pocket expenditures is similar to that for per beneficiary expenditures. The most surprising result is that the out-of-pocket expenditures for QMB-plus enrollees are about the same as the out-of-pocket expenditures for standard benefit QMBs enrollees. This is possibly due to the fact that QMB-plus states have higher medical care prices than the standard benefit QMB states. We control for these cost differences in our multivariate analyses.
The pattern of out-of-pocket expenditures on medical care (excluding premiums) by type of enrollee is similar to that for all out-of-pocket expenditures. There are fewer significant differences by type of enrollee in out-of-pocket expenditures for medical providers and outpatient hospital services. However, these services also follow the pattern observed for total out-of-pocket costs.
For prescription drugs, not surprisingly, SSI and QMB-plus enrollees had much lower out-of-pocket expenditures than standard benefit QMB and SLMB enrollees. Standard benefit QMB enrollees have lower out-of-pocket expenditures for prescription drugs than SLMB enrollees, although neither group has coverage for outpatient prescription drugs. As described previously, it is not clear a priori whether QMBs or SLMBs would have higher out-of-pocket costs for prescriptions. We might have expected standard benefit QMBs to use more prescription drugs (and hence have higher out-of-pocket expenditures) than SLMBs because QMBs receive coverage of Medicare coinsurance and deductibles. This provides them with net income that can be used to purchase additional medical care services. Alternatively, differences between the QMB and SLMB populations, particularly the higher incomes of SLMBs, might result in greater prescription drug use and higher out-of-pocket costs for SLMBs. Our finding of greater out-of-pocket prescription drug costs for SLMBs suggest that the effects of their higher
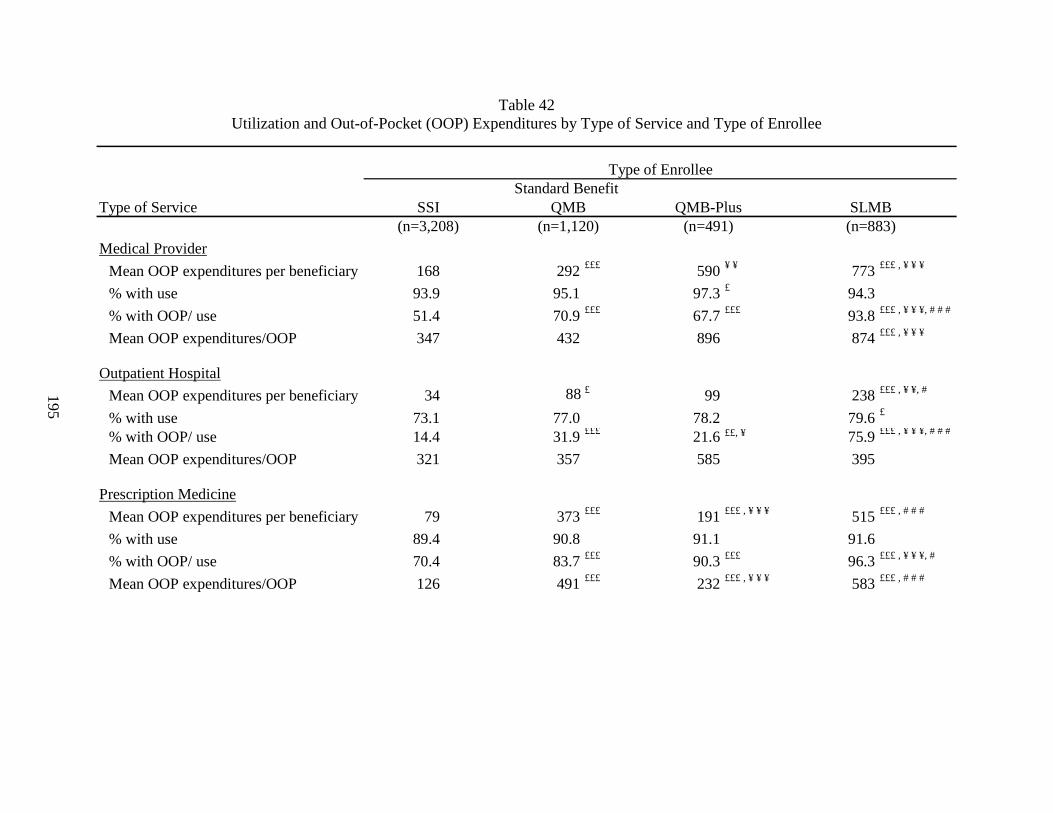
195
Table 42 Utilization and Out-of-Pocket (OOP) Expenditures by Type of Service and Type of Enrollee
Type of Service
Medical Provider
Mean OOP expenditures per beneficiary 168 292 £££ 590 ¥ ¥ 773 £££ , ¥ ¥ ¥
% with use 93.9 95.1 97.3 £ 94.3
% with OOP/ use 51.4 70.9 £££ 67.7 £££ 93.8 £££ , ¥ ¥ ¥, # # #
Mean OOP expenditures/OOP 347 432 896 874 £££ , ¥ ¥ ¥
Outpatient Hospital
Mean OOP expenditures per beneficiary 34 88 £ 99 238 £££ , ¥ ¥, #
% with use 73.1 77.0 78.2 79.6 £
% with OOP/ use 14.4 31.9 £££ 21.6 ££, ¥ 75.9 £££ , ¥ ¥ ¥, # # #
Mean OOP expenditures/OOP 321 357 585 395
Prescription Medicine
Mean OOP expenditures per beneficiary 79 373 £££ 191 £££ , ¥ ¥ ¥ 515 £££ , # # #
% with use 89.4 90.8 91.1 91.6
% with OOP/ use 70.4 83.7 £££ 90.3 £££ 96.3 £££ , ¥ ¥ ¥, #
Mean OOP expenditures/OOP 126 491 £££ 232 £££ , ¥ ¥ ¥ 583 £££ , # # #
Standard Benefit
(n=3,208) (n=1,120) (n=883)SSI QMB QMB-Plus SLMB
Type of Enrollee
(n=491)
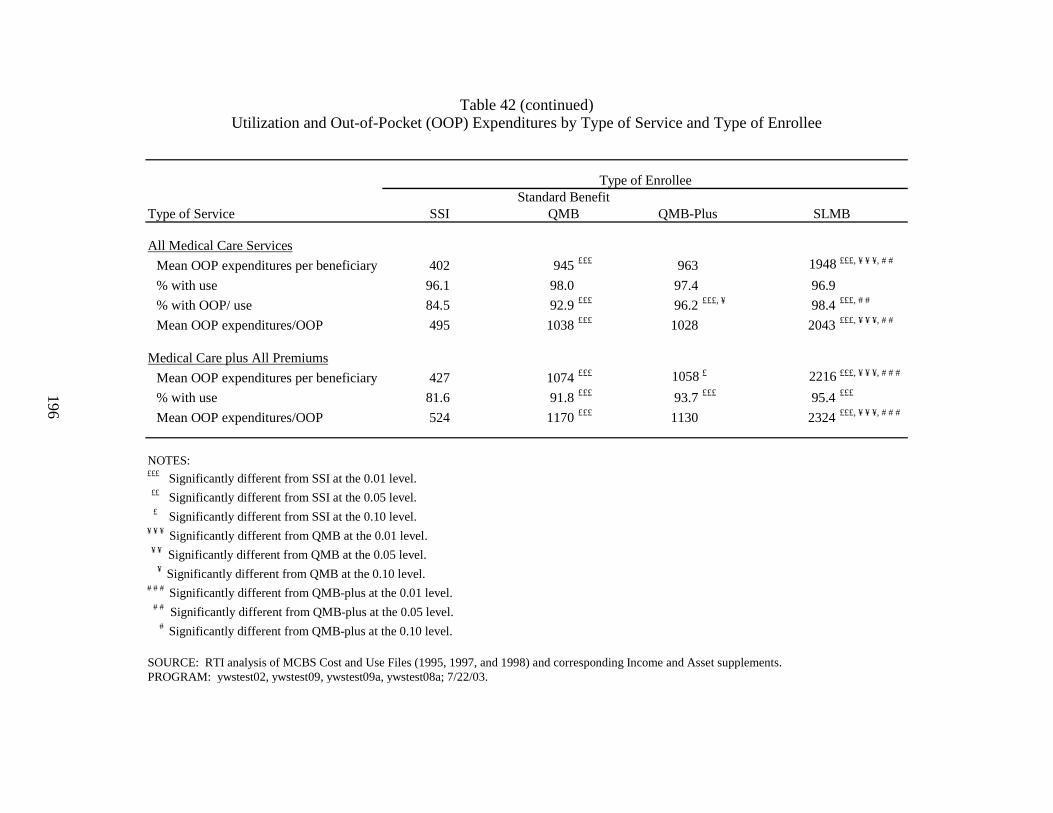
196
Table 42 (continued) Utilization and Out-of-Pocket (OOP) Expenditures by Type of Service and Type of Enrollee
Type of Service
All Medical Care Services
Mean OOP expenditures per beneficiary 402 945 £££ 963 1948 £££, ¥ ¥ ¥, # #
% with use 96.1 98.0 97.4 96.9
% with OOP/ use 84.5 92.9 £££ 96.2 £££, ¥ 98.4 £££, # #
Mean OOP expenditures/OOP 495 1038 £££ 1028 2043 £££, ¥ ¥ ¥, # #
Medical Care plus All Premiums
Mean OOP expenditures per beneficiary 427 1074 £££ 1058 £ 2216 £££, ¥ ¥ ¥, # # #
% with use 81.6 91.8 £££ 93.7 £££ 95.4 £££
Mean OOP expenditures/OOP 524 1170 £££ 1130 2324 £££, ¥ ¥ ¥, # # #
NOTES:£££ Significantly different from SSI at the 0.01 level. ££ Significantly different from SSI at the 0.05 level. £ Significantly different from SSI at the 0.10 level.¥ ¥ ¥ Significantly different from QMB at the 0.01 level. ¥ ¥ Significantly different from QMB at the 0.05 level. ¥ Significantly different from QMB at the 0.10 level.# # # Significantly different from QMB-plus at the 0.01 level. # # Significantly different from QMB-plus at the 0.05 level. # Significantly different from QMB-plus at the 0.10 level.
SOURCE: RTI analysis of MCBS Cost and Use Files (1995, 1997, and 1998) and corresponding Income and Asset supplements.PROGRAM: ywstest02, ywstest09, ywstest09a, ywstest08a; 7/22/03.
Type of Enrollee
SSI QMB SLMBQMB-PlusStandard Benefit
197
income levels and other differences in beneficiary characteristics offset the impact of the larger increase in net income for QMBs. This is confirmed by multivariate analyses (described in the following section), which show no significant difference between standard benefit QMBs and SLMBs in out-of-pocket expenditures for prescription drugs after controlling for beneficiary characteristics.
Differences in out-of-pocket costs are mainly driven by differences in the probability having out-of-pocket expenditures and, to a lesser extent, expenditures for those with some out-of-pocket costs, rather than differences in the probability of using services. For all medical care, the utilization rates ranged from 96% to 98% with none of the differences statistically significant. Utilization rates for individual types of medical care also did not usually have statistically significant differences. At 85%, SSI enrollees had the lowest probability of having out-of-pocket expenditures on any medical service while the other three groups had more than a 90% probability of having out-of-pocket expenditures. This basic difference is also found in each of the three specific types of medical services examined. However, the magnitude of the differences tends to be much larger and that SLMBs have much higher probabilities of out-of-pocket expenditures than the other three enrollee groups.
Multivariate Analyses - After controlling for the effects of other factors that influence out-of-pocket expenditures, the relative patterns of out-of-pocket expenditures remained similar across types of enrollees, although the magnitude of the differences sometimes changed (Table 43).66 Across all types of service SSI enrollees consistently have the lowest probability of having out-of-pocket expenditures and the lowest expenditures, followed by QMB-plus, standard benefit QMBs, and SLMBs. In addition, while there were few significant differences in the descriptive analyses between standard benefit QMB and QMB-plus beneficiaries other than for prescription drugs, in the multivariate analyses we find that standard benefit QMBs are more likely to have out-of-pocket expenditures for medical provider and outpatient hospital services.
The greatest differences between the multivariate and descriptive results were the magnitude of the differences between groups in out-of-pocket expenditures for those with some expenditures. For example, the multivariate results showed that standard benefit QMB enrollees had 322% higher total out-of-pocket expenditures than SSI enrollees, about double the magnitude found in the descriptive results. SLMB enrollees had 837% higher expenditures than SSI enrollees, an substantial increase in the expenditure differential of 343% found in the descriptive analysis. The gap between each of these groups and QMB-plus enrollees also became wider in the multivariate analyses. On the other hand, controlling for other factors reduced the differential between QMB-plus enrollees and SSI enrollees to 46%, compared to the 115% expenditure differential found in the descriptive analysis. The patterns in out-of-pocket expenditures on all medical care services (excluding premiums), medical provider services, and outpatient hospital services by enrollee class are similar to that for total out-of-pocket expenditures. Overall, differences between groups in out-of-pocket expenditures for those with service use were more likely to be significant in the multivariate analyses.
66 Complete regression results are shown in Appendix L (Tables L24-L28).
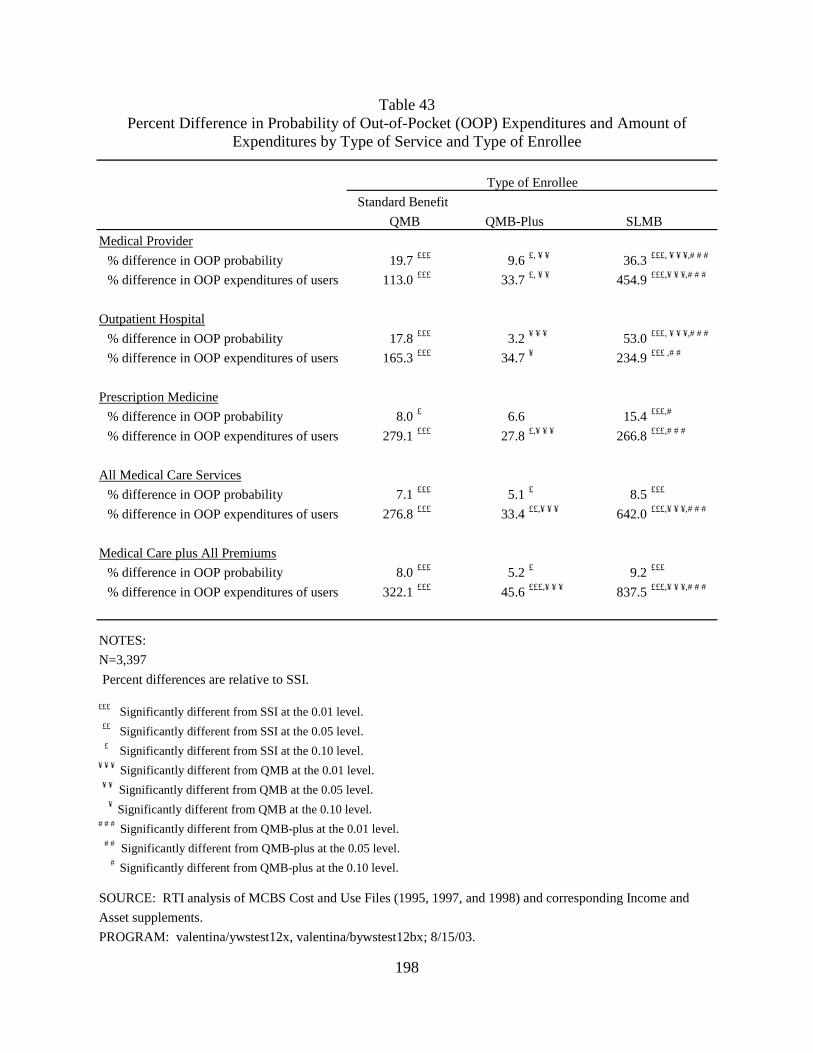
198
Table 43 Percent Difference in Probability of Out-of-Pocket (OOP) Expenditures and Amount of
Expenditures by Type of Service and Type of Enrollee
Medical Provider
% difference in OOP probability 19.7 £££ 9.6 £, ¥ ¥ 36.3 £££, ¥ ¥ ¥,# # #
% difference in OOP expenditures of users 113.0 £££ 33.7 £, ¥ ¥ 454.9 £££,¥ ¥ ¥,# # #
Outpatient Hospital
% difference in OOP probability 17.8 £££ 3.2 ¥ ¥ ¥ 53.0 £££, ¥ ¥ ¥,# # #
% difference in OOP expenditures of users 165.3 £££ 34.7 ¥ 234.9 £££ ,# #
Prescription Medicine
% difference in OOP probability 8.0 £ 6.6 15.4 £££,#
% difference in OOP expenditures of users 279.1 £££ 27.8 £,¥ ¥ ¥ 266.8 £££,# # #
All Medical Care Services
% difference in OOP probability 7.1 £££ 5.1 £ 8.5 £££
% difference in OOP expenditures of users 276.8 £££ 33.4 ££,¥ ¥ ¥ 642.0 £££,¥ ¥ ¥,# # #
Medical Care plus All Premiums
% difference in OOP probability 8.0 £££ 5.2 £ 9.2 £££
% difference in OOP expenditures of users 322.1 £££ 45.6 £££,¥ ¥ ¥ 837.5 £££,¥ ¥ ¥,# # #
NOTES:
N=3,397
Percent differences are relative to SSI.
£££ Significantly different from SSI at the 0.01 level. ££ Significantly different from SSI at the 0.05 level. £ Significantly different from SSI at the 0.10 level.¥ ¥ ¥ Significantly different from QMB at the 0.01 level. ¥ ¥ Significantly different from QMB at the 0.05 level. ¥ Significantly different from QMB at the 0.10 level.# # # Significantly different from QMB-plus at the 0.01 level. # # Significantly different from QMB-plus at the 0.05 level. # Significantly different from QMB-plus at the 0.10 level.
SOURCE: RTI analysis of MCBS Cost and Use Files (1995, 1997, and 1998) and corresponding Income and
Asset supplements.
PROGRAM: valentina/ywstest12x, valentina/bywstest12bx; 8/15/03.
QMB QMB-Plus SLMB
Type of Enrollee
Standard Benefit
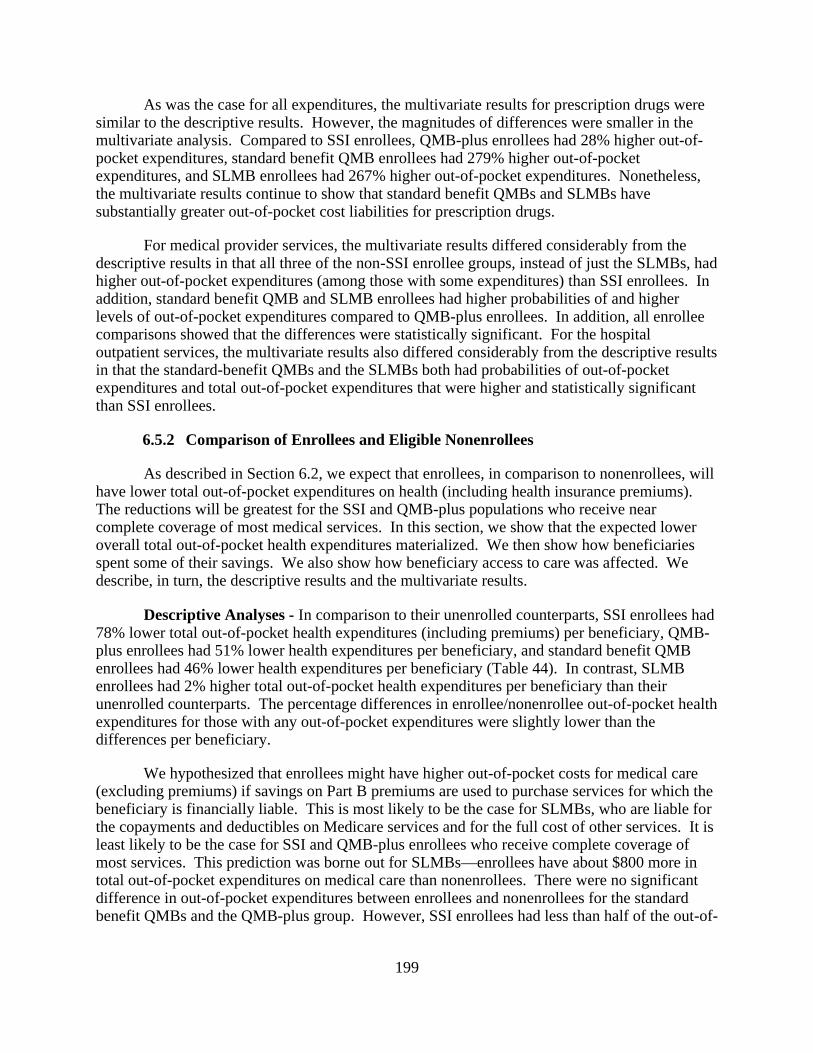
199
As was the case for all expenditures, the multivariate results for prescription drugs were similar to the descriptive results. However, the magnitudes of differences were smaller in the multivariate analysis. Compared to SSI enrollees, QMB-plus enrollees had 28% higher out-of-pocket expenditures, standard benefit QMB enrollees had 279% higher out-of-pocket expenditures, and SLMB enrollees had 267% higher out-of-pocket expenditures. Nonetheless, the multivariate results continue to show that standard benefit QMBs and SLMBs have substantially greater out-of-pocket cost liabilities for prescription drugs.
For medical provider services, the multivariate results differed considerably from the descriptive results in that all three of the non-SSI enrollee groups, instead of just the SLMBs, had higher out-of-pocket expenditures (among those with some expenditures) than SSI enrollees. In addition, standard benefit QMB and SLMB enrollees had higher probabilities of and higher levels of out-of-pocket expenditures compared to QMB-plus enrollees. In addition, all enrollee comparisons showed that the differences were statistically significant. For the hospital outpatient services, the multivariate results also differed considerably from the descriptive results in that the standard-benefit QMBs and the SLMBs both had probabilities of out-of-pocket expenditures and total out-of-pocket expenditures that were higher and statistically significant than SSI enrollees.
6.5.2 Comparison of Enrollees and Eligible Nonenrollees
As described in Section 6.2, we expect that enrollees, in comparison to nonenrollees, will have lower total out-of-pocket expenditures on health (including health insurance premiums). The reductions will be greatest for the SSI and QMB-plus populations who receive near complete coverage of most medical services. In this section, we show that the expected lower overall total out-of-pocket health expenditures materialized. We then show how beneficiaries spent some of their savings. We also show how beneficiary access to care was affected. We describe, in turn, the descriptive results and the multivariate results.
Descriptive Analyses - In comparison to their unenrolled counterparts, SSI enrollees had 78% lower total out-of-pocket health expenditures (including premiums) per beneficiary, QMB-plus enrollees had 51% lower health expenditures per beneficiary, and standard benefit QMB enrollees had 46% lower health expenditures per beneficiary (Table 44). In contrast, SLMB enrollees had 2% higher total out-of-pocket health expenditures per beneficiary than their unenrolled counterparts. The percentage differences in enrollee/nonenrollee out-of-pocket health expenditures for those with any out-of-pocket expenditures were slightly lower than the differences per beneficiary.
We hypothesized that enrollees might have higher out-of-pocket costs for medical care (excluding premiums) if savings on Part B premiums are used to purchase services for which the beneficiary is financially liable. This is most likely to be the case for SLMBs, who are liable for the copayments and deductibles on Medicare services and for the full cost of other services. It is least likely to be the case for SSI and QMB-plus enrollees who receive complete coverage of most services. This prediction was borne out for SLMBs—enrollees have about $800 more in total out-of-pocket expenditures on medical care than nonenrollees. There were no significant difference in out-of-pocket expenditures between enrollees and nonenrollees for the standard benefit QMBs and the QMB-plus group. However, SSI enrollees had less than half of the out-of-
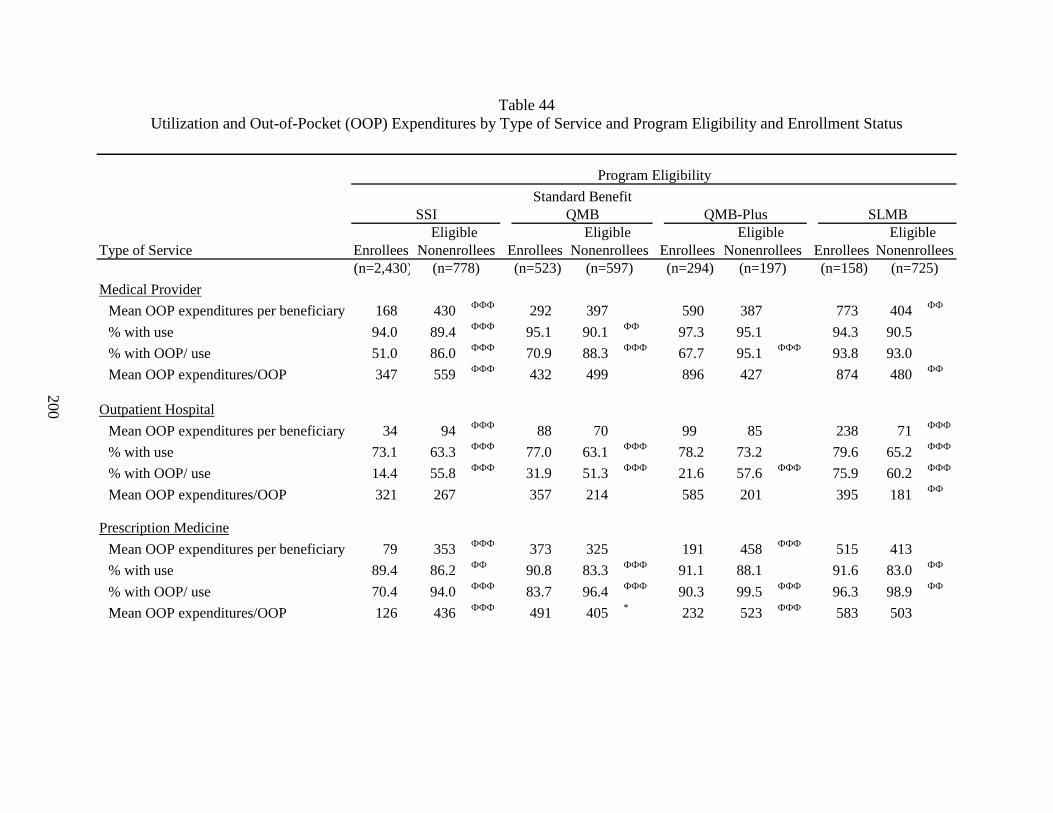
200
Table 44 Utilization and Out-of-Pocket (OOP) Expenditures by Type of Service and Program Eligibility and Enrollment Status
Type of Service Enrollees Enrollees Enrollees Enrollees(n=2,430) (n=523) (n=294) (n=158)
Medical Provider
Mean OOP expenditures per beneficiary 168 430 ФФФ 292 397 590 387 773 404 ФФ
% with use 94.0 89.4 ФФФ 95.1 90.1 ФФ 97.3 95.1 94.3 90.5
% with OOP/ use 51.0 86.0 ФФФ 70.9 88.3 ФФФ 67.7 95.1 ФФФ 93.8 93.0
Mean OOP expenditures/OOP 347 559 ФФФ 432 499 896 427 874 480 ФФ
Outpatient Hospital
Mean OOP expenditures per beneficiary 34 94 ФФФ 88 70 99 85 238 71 ФФФ
% with use 73.1 63.3 ФФФ 77.0 63.1 ФФФ 78.2 73.2 79.6 65.2 ФФФ
% with OOP/ use 14.4 55.8 ФФФ 31.9 51.3 ФФФ 21.6 57.6 ФФФ 75.9 60.2 ФФФ
Mean OOP expenditures/OOP 321 267 357 214 585 201 395 181 ФФ
Prescription Medicine
Mean OOP expenditures per beneficiary 79 353 ФФФ 373 325 191 458 ФФФ 515 413
% with use 89.4 86.2 ФФ 90.8 83.3 ФФФ 91.1 88.1 91.6 83.0 ФФ
% with OOP/ use 70.4 94.0 ФФФ 83.7 96.4 ФФФ 90.3 99.5 ФФФ 96.3 98.9 ФФ
Mean OOP expenditures/OOP 126 436 ФФФ 491 405 * 232 523 ФФФ 583 503
(n=778) (n=597) (n=197) (n=725)
Program Eligibility
Eligible Eligible
Standard Benefit
Nonenrollees
SSI QMB QMB-Plus SLMB
NonenrolleesEligible Eligible
Nonenrollees Nonenrollees
201
Table 44 (continued) Utilization and Out-of-Pocket (OOP) Expenditures by Type of Service and Program Eligibility and Enrollment Status
Type of Service Enrollees Enrollees Enrollees Enrollees
All Medical Care Services
Mean OOP expenditures per beneficiary 402 1,067 ФФФ 945 949 963 1,110 1,948 1,137 ФФФ
% with use 96.1 93.3 ФФ 98.0 93.8 ФФФ 97.4 97.4 96.9 93.7
% with OOP/ use 84.5 95.0 ФФФ 92.9 96.4 ФФ 96.2 97.2 98.4 98.2
Mean OOP expenditures/OOP 495 1,203 ФФФ 1,038 1,050 1,028 1,173 2,043 1,235 ФФФ
Medical Care plus All PremiumsMean OOP expenditures per beneficiary 427 1,902 ФФФ 1,074 1,989 ФФФ 1,058 2,137 ФФФ 2,216 2,177 % with OOP 81.6 96.2 ФФФ 91.8 98.8 ФФФ 93.7 98.9 ФФ 95.4 99.5 ФФФ
Mean OOP expenditures/OOP 524 1,977 ФФФ 1,170 2,014 ФФФ 1,130 2,160 ФФ 2,324 2,188
NOTES:ФФФ Significantly different from enrollees at the 0.01 level. ФФ Significantly different from enrollees at the 0.05 level. Ф Significantly different from enrollees at the 0.10 level.
SOURCE: RTI analysis of MCBS Cost and Use Files (1995, 1997, and 1998) and corresponding Income and Asset supplements.
PROGRAM: ywstest02, ywstest09, ywstest09a, ywstest08a; 7/22/03.
Nonenrollees Nonenrollees Nonenrollees NonenrolleesEligible Eligible Eligible Eligible
Program Eligibility
SSI QMB QMB-Plus SLMBStandard Benefit
202
pocket expenditures on medical care than nonenrollees. Findings for medical providers and outpatient hospital services were consistent with those for all medical services.
The impact of enrollment on out-of-pocket expenditures for prescription drugs differed depending on the benefit received through the Medicare Savings Programs. SSI and QMB-plus enrollees had much lower out-of-pocket expenditures on prescription medicine than nonenrollees. In contrast, for the standard benefit QMB and SLMB groups, there were mainly no significant differences between enrollees and nonenrollees in out-of-pocket expenditures for prescription drugs. In both groups, enrollees were more likely to use prescription drugs, but were less likely to have out-of-pocket expenditures. This could be due to the fact that a higher proportion of enrollees than nonenrollees has prescription drug coverage through public programs other than Medicaid.
In addition to the lower total out-of-pocket health expenditures found for three of the four Medicare Savings Programs categories, enrollment also strongly affected medical care utilization rates. Enrollees were almost always more likely to use services, although the differences were not always significant. In some cases, the differences were larger than 10 percentage points (e.g., 15 percentage points between SLMB enrollees and their unenrolled counterparts for outpatient hospital services).
In addition to increasing access to medical care, the Medicare Savings Programs typically decrease the likelihood of out-of-pocket expenditures. For instance, both SSI enrollees and standard benefit QMB enrollees were less likely than nonenrollees to have had out-of-pocket expenditures on medical care.
Multivariate Analyses - Some of the large differences in total out-of-pocket health expenditures between enrollees and nonenrollees found in the descriptive analysis might be partly due to confounding effects. In fact, in the multivariate analyses the effect of Medicare Savings Programs enrollment on out-of-pocket costs become larger for total health expenditures including premiums and for total medical care expenditures.
Enrollees in the SSI program, the standard benefit QMB program, and the SLMB program all had lower probabilities of having any out-of-pocket expenditures (including premiums) than nonenrollees (Table 45).67 SSI enrollees had 89% lower total out-of-pocket health expenditures than nonenrollees and standard benefit QMB enrollees had 69% lower out-of-pocket health expenditures than nonenrollees. SLMB enrollees also had lower total out-of-pocket health expenditures than nonenrollees, but the difference was not statistically significant.68 We were unable to estimate the probability of having any out-of-pocket expenditures including premiums for the QMB-plus population. This was due to the low co-variation of the dependent variable with the independent variables as a result of the small sample
67 Complete regression results are shown in Appendix L (Tables L29-L47). 68 For the QMB-plus comparison, we were unable to estimate a stable probit equation that had face validity. In
particular, the regression coefficients were not stable. This was due to the high percentage of beneficiaries having any out-of-pocket expenditures and the low co-variation of the dependent variable with the independent variables. The result was that obtaining a robust specification with face validity was not possible. Any specification that might have had stable regression coefficients would have been arbitrary.
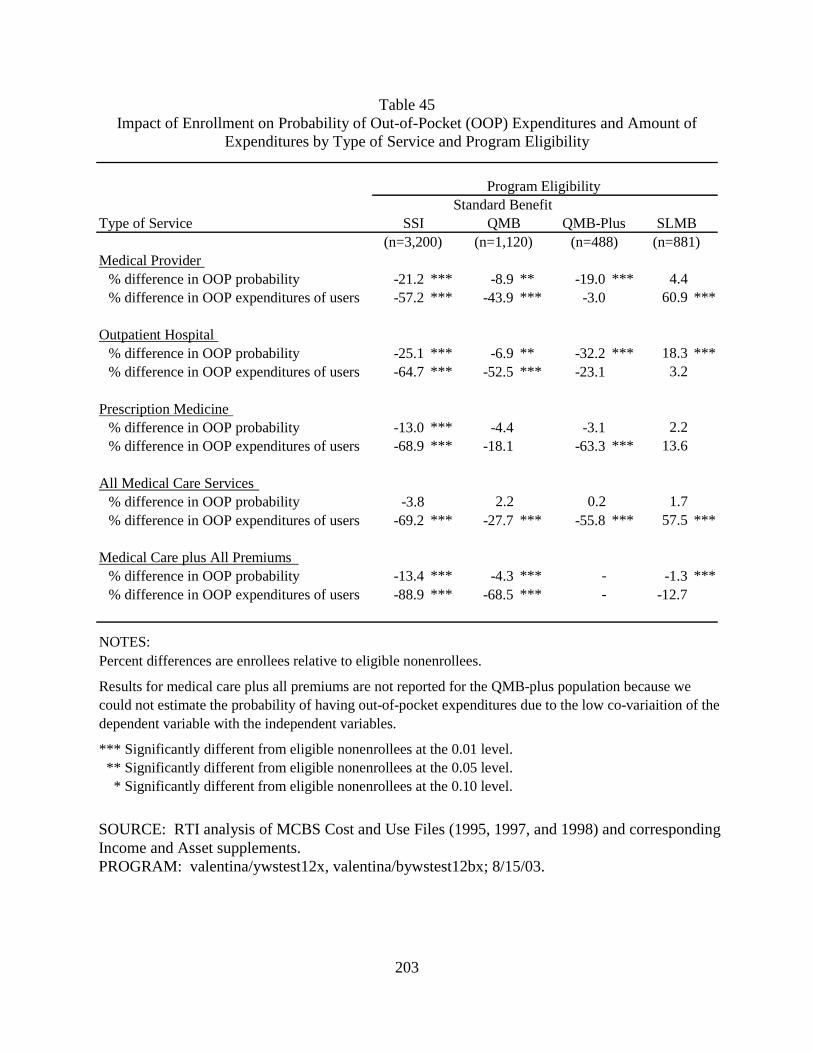
203
Table 45 Impact of Enrollment on Probability of Out-of-Pocket (OOP) Expenditures and Amount of
Expenditures by Type of Service and Program Eligibility
Type of Service
Medical Provider % difference in OOP probability -21.2 *** -8.9 ** -19.0 *** 4.4% difference in OOP expenditures of users -57.2 *** -43.9 *** -3.0 60.9 ***
Outpatient Hospital % difference in OOP probability -25.1 *** -6.9 ** -32.2 *** 18.3 ***% difference in OOP expenditures of users -64.7 *** -52.5 *** -23.1 3.2
Prescription Medicine % difference in OOP probability -13.0 *** -4.4 -3.1 2.2% difference in OOP expenditures of users -68.9 *** -18.1 -63.3 *** 13.6
All Medical Care Services% difference in OOP probability -3.8 2.2 0.2 1.7% difference in OOP expenditures of users -69.2 *** -27.7 *** -55.8 *** 57.5 ***
Medical Care plus All Premiums % difference in OOP probability -13.4 *** -4.3 *** - -1.3 ***% difference in OOP expenditures of users -88.9 *** -68.5 *** - -12.7
NOTES: Percent differences are enrollees relative to eligible nonenrollees.
Results for medical care plus all premiums are not reported for the QMB-plus population because we could not estimate the probability of having out-of-pocket expenditures due to the low co-variaition of the dependent variable with the independent variables.
*** Significantly different from eligible nonenrollees at the 0.01 level. ** Significantly different from eligible nonenrollees at the 0.05 level. * Significantly different from eligible nonenrollees at the 0.10 level.
SOURCE: RTI analysis of MCBS Cost and Use Files (1995, 1997, and 1998) and corresponding Income and Asset supplements. PROGRAM: valentina/ywstest12x, valentina/bywstest12bx; 8/15/03.
Program Eligibility
SSI QMB QMB-Plus SLMBStandard Benefit
(n=3,200) (n=1,120) (n=488) (n=881)
204
size and high probability of having out-of-pocket expenditures. However, among those with some out-of-pocket expenditures QMB-plus enrollees have 83% lower out-of-pocket costs than nonenrollees.
SSI enrollees, QMB-plus enrollees and standard benefit QMB enrollees all had lower total out-of-pocket medical care expenditures than nonenrollees. The SLMB enrollees, in contrast, had 57.9% higher total out-of-pocket medical care expenditures than nonenrollees. This suggests that SLMB enrollees spent part of their savings on from Part B premiums on medical care associated with significant total out-of-pocket expenditures.
Compared to nonenrollees, SSI, standard benefit QMB, and QMB-plus enrollees have lower probabilities of out-of-pocket expenditures and lower out-of-pocket expenditures for medical provider and outpatient hospital services. This is expected given that these categories are likely predominated by Medicare-covered services. In contrast, SLMB enrollees, who are liable for the cost-sharing on these services, are more likely to have out-of-pocket expenditures for medical provider services and have higher out-of-pocket expenditures for outpatient hospital services. Findings for prescription drugs also follow the patterns predicted by differences in the benefits to which different classes of enrollees are entitled. While there are no differences between enrollees and nonenrollees in out-of-pocket prescription drug expenditures for the standard benefit QMB or SLMB populations, SSI and QMB-plus enrollees have significantly lower out-of-pocket liabilities than their nonenrollee counterparts.
6.6 Discussion
The analyses presented in this chapter examined whether the Medicare Savings Programs achieve their two primary goals: (1) to improve access to care for low-income Medicare beneficiaries and (2) to reduce the out-of-pocket cost burden for this population. In addition, we looked at whether the impact of Medicare Savings Programs enrollment varied with the generosity of the benefit to which an enrollee was entitled. Overall, the findings confirm that the Medicare Savings Programs succeed in improving access to care and reducing beneficiary out-of-pocket costs. Furthermore, the magnitude of the impact is generally greater for beneficiaries who receive more comprehensive benefits. Below we summarize the findings on Medicare Savings Programs impacts on service use and out-of-pocket cost. We then describe limitations of the study and discuss study findings.
6.6.1 Summary of Findings
Service Use - Medicare Savings Programs enrollment increases the likelihood of using services. Compared to their eligible nonenrollee counterparts, enrollees in each of the four groups are more likely to use all types of service even after controlling for their poorer health status and other observable differences in beneficiary characteristics. While there are fewer significant impacts on expenditures among those with service use, enrollees generally have higher expenditures, particularly for Part B services overall and office visits. Medicare Savings Programs enrollment has the greatest impact on the probability of using outpatient hospital services and the probability of having an office visit. The positive impact on service use for SLMB enrollees is particularly notable given that they remain liable for Medicare copayments and deductibles and Medicare Savings Programs enrollment only affects their ability to purchase
205
services through their savings on the cost of the Part B premium. However, the Part B premium represents a substantial share of income for people that qualify for the SLMB program.
The strong impact on outpatient hospital use may reflect the disproportionately high copayments for these services during the time period covered by this study. Until August 2000, when outpatient prospective payment was implemented, the copayment for outpatient hospital services was based on billed charges. As a result, beneficiary cost-sharing for outpatient hospital services grew to 50% of total payments (MedPAC, 2001). The large impact on office visits likely reflects greater beneficiary discretion in the decision to use these services and, hence, greater sensitivity to price impacts. Medicare Savings Programs enrollment has the smallest impact of inpatient admissions, which are less subject to beneficiary discretion.
Patterns of service use across types of Medicare Savings Programs enrollee are generally consistent with the generosity of the benefit package to which they are entitled, although the findings for SSI beneficiaries are somewhat surprising. As expected given that they both receive full coverage of Medicare copayments and deductibles, we found few differences in Medicare service use between QMB-plus and standard benefit QMBs. However, QMB-plus beneficiaries were significantly more likely to have a visit with a physician or other Part B provider. These differences in service use may reflect spillover effects from differences in prescription drug coverage. As a result of receiving coverage through Medicaid, QMB-plus beneficiaries have greater use of prescription drugs than standard benefit QMBs. Beneficiaries who are taking prescription medications may need additional office visits to monitor their medications or to renew their prescription. In addition, findings from beneficiary focus groups reported in Chapter 2 indicated that beneficiaries without prescription drug coverage may avoid seeing a physician if they believe the visit will result in a prescription for medications that they are not able to afford. Consistent with their liability for Medicare copayments and deductibles, SLMBs are less likely than standard benefit QMB and QMB-plus beneficiaries to use most types of service.
QMB-plus and standard benefit QMB beneficiaries are more likely than SSI beneficiaries to use most types of Medicare services. In addition, SLMBs are as likely as or more likely than SSI recipients to use services. These results were unexpected since SSI, QMB-plus, and standard benefit QMB beneficiaries all receive full coverage of Medicare cost-sharing, while SLMBs have more restricted coverage than SSI recipients. Indeed, all else being equal we might have expected higher levels of service use in the SSI population given their lower income and presumably greater needs. While the NCH analyses did not control for beneficiary health status, the MCBS data showed no differences in self-reported health or functional status between SSI beneficiaries and other types of Medicare Savings Programs enrollees. While SSI enrollees are more likely to be non-white, our multivariate NCH analyses controlled for the impact of beneficiary race on service use. Nonetheless, there may remain unmeasured differences between these populations that explain lower levels of service use by SSI beneficiaries. Enrollment in the SSI program may be less subject to adverse selection than the other Medicare Savings Programs. Other categories of Medicare Savings Program enrollees apply specifically to receive medical benefits. SSI beneficiaries receive Medicaid coverage by virtue of their entitlement to SSI cash benefits. Thus, the decision to apply for SSI benefits may be less driven by medical needs than is enrollment in the other Medicare Savings Programs. While they are inconclusive, our adverse selection analyses did not find evidence of adverse selection in the SSI program, but suggest that there might be adverse selection in the other programs.
206
Out-of-pocket Costs - As expected, enrollment in the Medicare Savings Programs reduces beneficiary liability for out-of-pocket costs. Despite being in poorer health and using more services SSI, standard benefit QMB, and QMB-plus enrollees all had lower total out-of-pocket costs (including premiums) compared to their nonenrollee counterparts. On the other hand, multivariate analyses showed only a small difference between SLMB enrollees and eligible nonenrollees in the likelihood of having out-of-pocket costs including premiums and no difference in amount of out-of-pocket costs for those who had some. It appears that the more restricted SLMB benefit package does not provide these beneficiaries with protection against out-of-pocket liabilities. Nonetheless, our findings suggest that the savings SLMB beneficiaries realize on the Part B premium are used to purchase additional medical care. While there was no difference between SLMB enrollees and nonenrollees in the likelihood of having some out-of-pocket expenditure for medical care services, among those with some out-of-pocket costs, enrollees had nearly 60% higher expenditures than did eligible nonenrollees.
Findings for prescription medicine highlight the value of the benefit provided to SSI and QMB-plus beneficiaries. For the standard benefit QMB and SLMB populations there was no difference between enrollees and eligible nonenrollees in the likelihood of having out-of-pocket costs for prescription medicines or in the amount of the out-of-pocket costs. In contrast, SSI and QMB-plus enrollees had substantially lower out-of-pocket costs for prescriptions compared to nonenrollees.
Comparison of out-of-pocket expenditures by type of enrollee underscores the greater protection that SSI and QMB-plus beneficiaries receive. Both groups have substantially lower out-of-pocket costs compared to standard benefit QMB and, especially, SLMB enrollees. The SLMB population experiences the highest levels of out-of-pocket costs in each of the services analyzed. Differences in out-of-pocket expenditures appear to be driven by both Medicare services and non-Medicare services. However, the largest differences between SSI and QMB-plus enrollees compared to standard benefit QMB and SLMB enrollees were for prescription drugs, for which only SSI and QMB-plus beneficiaries receive coverage.
6.6.2 Study Limitations
These analyses represent the first attempt to differentiate the impact of Medicare Savings Programs enrollment based on the benefit package to which different types of enrollees are entitled. It is also the first assessment of the impact of Medicare Savings Programs enrollment on beneficiary liability for out-of-pocket costs. The findings from this study are generally consistent with our hypotheses about the impact of program enrollment and variation in the benefit provided. Nonetheless, there are certain limitations to the study, particularly with respect to the MCBS analyses.
Despite pooling three years of data, the sample sizes for the MCBS analysis remain relatively small, particularly for certain subpopulations. As a result, we were sometimes not able to estimate the effect of Medicare Savings Programs enrollment precisely. The effect of the small sample size on the precision of our estimates is seen most starkly in the adverse selection analyses.
As a result of the need to pool data across years and the lag in availability of survey results, the MCBS analyses were based on data that are five to eight years out-of-date. As
207
enrollment in the Medicare Savings Programs has grown over time, these findings may not be representative of the current population of enrollees. However, given that our results largely confirm the expected impact of program enrollment, it is unlikely that the qualitative findings would change in later years of data, although the magnitude of the effect might be different.
In identifying the eligible nonenrollee population, we ideally would have liked to adjust income and asset data for the types of exclusions used to make eligibility determinations. This was not possible due to limitations in the income and asset data in the MCBS. Instead we used gross income and assets. The approach has been used in previous studies (Pezzin and Kasper, 2002; GAO, 1999). Because we were not able to account for income and assets that are excluded in determining program eligibility, our eligible nonenrollee populations have lower income and assets than their enrollee counterparts. While this could affect our findings on differences in service use for enrollees and nonenrollees, our results were unchanged when we limited the enrollee population to the income ranges used to identify eligible nonenrollees.
There are many differences between enrollees and nonenrollees, as well as between types of enrollees, that undoubtedly influence patterns of service use and out-of-pocket expenditures. Our multivariate analyses control for those characteristics that can be observed in our data sets. The MCBS analyses include a particularly rich set of controls. Nonetheless, there undoubtedly remain unmeasured differences between the groups that influence our findings. The adverse selection analyses attempted to systematically control for unmeasured differences between the enrollee and nonenrollee populations. However, we could not determine conclusively the extent to which higher service use by enrollees is driven by Medicare Savings Programs benefits.
Finally, utilization represented in claims data was the only measure of access available for these analyses. As a result, we are not able to evaluate the extent to which access to needed services is jeopardized or the impact of changes in utilization on health outcomes. Nonetheless, the utilization measures included in our analyses are well-accepted indicators of access to health care (Institute of Medicine, 1993) and are believed to impact outcomes.
6.6.3 Conclusions
These analyses clearly demonstrate the value of the Medicare Savings Programs benefit. The Medicare Savings Programs improve access to care, as measured by service utilization, and provides protection from out-of-pocket costs for low-income Medicare beneficiaries. The value of Medicare Savings Programs enrollment is greatest for those beneficiaries that receive the most comprehensive coverage – SSI recipients and QMBs that live in states that offer QMB-plus benefits. However, it is notable that even the limited benefit provided to SLMBs appears to improve access to care. The Part B premium can consume a significant portion of the income of near-poor Medicare beneficiaries and relief from this expense provides them with disposable income that they use to purchase additional medical services.
Although the Medicare Savings Programs reduce beneficiary liability for out-of-pocket expenditures, most enrollees continue to incur some out-of-pocket costs. The burden is particularly large for SLMB enrollees, who average over $2,200 in out-of-pocket costs annually. Although SLMBs have slightly higher incomes than QMBs and SSI recipients, the differences between these groups are significant and may pose a substantial burden. For a single SLMB beneficiary whose income is 120% of poverty, this represents over 20% of her annual income.
208
Even the SSI and QMB populations remain liable for out-of-pocket costs, ranging from $400 to over $1,000 per year, that are likely to be a serious hardship for some beneficiaries. A better understanding of the sources of these remaining out-of-pocket costs, particularly for SSI and QMB beneficiaries, is needed to design policies to address these remaining gaps in coverage. Our findings also underscore the burden of out-of-pocket expenditures for prescription drugs. While the burden is greatest for standard benefit QMB and SLMB beneficiaries, SSI and, especially, QMB-plus beneficiaries continue to incur out-of-pocket costs despite having coverage of outpatient prescription drugs through Medicaid.
209
CHAPTER 7 CONCLUSIONS
The preceding chapters of this report discuss our findings on a broad range of issues about the Medicare Savings Programs, based on a wide variety of data sources and analytic methods. While some of these issues have been addressed in previous research, this study is the first attempt to distinguish experience of beneficiaries on their basis of entitlement and the benefits they receive.
A number of issues are addressed in several different components of our study. For example, impacts of program enrollment on service use and out-of-pocket costs are examined both in our beneficiary survey analyses, as well as our analyses of Medicare claims data and Medicare Current Beneficiary Survey (MCBS) data. Our beneficiary survey and our state outreach survey are both used to address the effects of state outreach activities and application procedures on program enrollment.
This chapter summarizes and synthesizes the findings across the different components of our study. In addition, we review some of the limitations of our study. The chapter concludes with a discussion of the policy implications of our study.
7.1 Summary of Findings
This section summarizes findings in four major areas:
• patterns of program enrollment,
• determinants of program enrollment, including state outreach activities and application procedures,
• impacts of enrollment on service use, and
• impacts of enrollment on beneficiary out-of-pocket costs.
These issues are discussed in turn in the following subsections.
7.1.1 Program Enrollment
Medicare Savings Programs enrollment has grown over time. Between 1999 and 2001, the percentage of eligible beneficiaries who were enrolled in the program, or the takeup rate, increased from 62% to 64% nationwide.69 There was substantial variation in the takeup rate across states, ranging from 26% in New Hampshire and North Dakota in 2001 to 88% in California.
Enrollment in the Medicare Savings Programs is fairly stable, certainly in comparison with other means-tested programs that similarly require periodic recertification of eligibility.
69 One of CMS’ GPRA goals was to increase enrollment in the Medicare Savings Programs by 4%. This goal,
which was achieved, was based on the increase in the number of enrollees from October 1, 1998, through September 30, 2000. In contrast, we report the change in the takeup rate and our data cover a later time period (1999-2001).

210
Despite anecdotal reports that substantial numbers of beneficiaries drop off the program at redetermination because they are unaware of the need to be recertified, we found little evidence that this is a problem. Although QMBs and SLMBs are more likely than SSI beneficiaries to lose eligibility at redetermination, only about 2% are disenrolled at their initial redetermination and the loss at each successive redetermination. Instead, there is a slow cumulative loss over time. At the end of five years, about 80% of SSI, 70% of QMB, and 60% of SLMB beneficiaries remain enrolled in one of the Medicare Savings Programs.
Beneficiaries with health problems are more likely to enroll in the Medicare Savings Programs. Although the specific measures that were significant varied across programs (i.e., SSI, QMB-plus, standard benefit QMB, and SLMB), enrollees have poorer self-reported health status, lower functional status, and more chronic conditions compared to eligible nonenrollees. In addition, enrollees were more likely to use non-medical services associated with decreased physical function, such as personal care and home making services. We also found strong evidence that enrollment in the QMB and SLMB programs may be precipitated by major health events such as hospitalizations.
7.1.2 Outreach Activities and Application Procedures
States have increased their outreach activities for the Medicare Savings Programs over time. They have increased their use of both printed materials and live presentations. In addition, nearly all states have formed some type of partnership with other state agencies, federal agencies or local organizations to promote outreach. The application, enrollment, and eligibility processes have also become easier. For example, 38 states had adopted a shortened application form for the Medicare Savings Programs by 2001.
Despite these efforts, we did not find evidence that variation in state outreach activities and application procedures explains differences in takeup rates across states. There are a number of limitations to this analysis that may explain this finding, including the limited time period of the analysis and the accuracy of some of the key variables. These limitations are discussed in greater depth in Section 7.2.4.
However, it is striking that, despite extensive outreach efforts in recent years, our survey showed the main reason eligible individuals do not enroll is that they are unaware of these programs. Although CMS and the states have invested in print, broadcast media, and presentations, few beneficiaries responding to the survey had learned about the programs these ways. Rather, enrollment was associated with learning about the program from social workers and health professionals. In addition, because there are high levels of illiteracy, as well as physical and cognitive impairment in the target population, printed materials are of limited value. We also found that helping professionals with whom beneficiaries come in contact and who could educate or encourage them to enroll are not consistently knowledgeable about the Medicare Savings Programs.
The study findings also point out the limited potential of presentations at community or senior centers as an approach to outreach. Only a small proportion of enrollees and eligible nonenrollees utilize these centers and only a small percentage of the enrollees indicated they had learned of the programs this way.
211
While focus groups comprised of social service professionals who work with low-income Medicare beneficiaries highly praised shortened applications, difficulties with the enrollment process itself may remain a barrier to enrollment. Although the majority of enrollees received help with the application and only a small percentage report it was very difficult, many still found it too long, too personal and too difficult. Fifteen to 20% of eligible nonenrollees overall cite the application as a barrier to enrollment.
Beyond the lack of beneficiary awareness that has led CMS and the states to invest in outreach activities, personal values or other considerations are often cited as impediments to enrollment. Our beneficiary survey results indicate close to 20% of eligible nonenrollees overall are concerned with estate recovery. While welfare stigma or the fierce commitment to self-sufficiency of the generation that lived through the Depression is one of the most often cited obstacles to enrollment, our survey indicates that only a few eligible nonenrollees do not want the assistance, and that many enrollees indicated they had enrolled because they deserve the benefits. If beneficiaries have heard of the programs, they do not enroll because they do not know how to apply or they assume they will not qualify for them.
7.1.3 Service Use
Enrollment in the Medicare Savings Programs improves access to medical care services, as measured by service utilization. After controlling for the poorer health status of enrollees and other differences in beneficiary characteristics, our analysis of MCBS data shows that enrollees are more likely than eligible nonenrollees to use inpatient services, outpatient hospital services, Part B services overall, and office visits. Similarly, our beneficiary survey showed that enrollees reported more physician visits than eligible nonenrollees.
We found greater service use by enrollees compared to eligible nonenrollees regardless of the benefits to which they are entitled under the Medicare Savings Programs. The positive impact for SLMBs is particularly noteworthy given that they remain liable for Medicare copayments and deductibles. As a result, enrollment only affects their ability to purchase services through their savings on the Part B premium. However, the Part B premium represents a substantial share of total income for SLMBs. In 2003, Part B premium payments would consume about 7% of the annual income a single person living at 120% of the federal poverty level (FPL) and about 10% of the income of a couple.
Greater service use by enrollees may reflect differences between enrollees and eligible nonenrollees in health status or other characteristics that affect the likelihood of seeking care. As discussed above, enrollees are in poorer health than nonenrollees. In addition, hospitalizations are an important precipitating event for enrollment in the QMB and SLMB programs. To the extent that beneficiaries were hospitalized for chronic conditions, this could predict higher levels of ongoing service use.
Although we controlled for measurable differences in health status, it is possible that there remain unobserved differences between enrollees and eligible nonenrollees that contribute to our finding of higher service use by enrollees. We attempted to measure the impact of adverse selection on utilization differences between enrollees and nonenrollees using instrumental variables analysis. In some cases the estimated effects of program enrollment on service use were implausibly large in our instrumental variable analyses; in others, large estimated effects

212
were insignificant. Although the instruments used in these analyses were significant predictors of enrollment, it is possible that they were not sufficiently powerful to identify the effects of adverse selection. As a result, we could not determine conclusively the extent to which higher service use by enrollees is determined by the protection from cost-sharing that they receive under the Medicare Savings Programs.
Findings on relative service use across types of Medicare Savings Programs enrollees are mainly consistent with differences in the generosity of the benefit package to which they are entitled. As expected, since they remain liable for Medicare copayments and deductibles, SLMBs are less likely than standard benefit QMB and QMB-plus beneficiaries to use most services. Some of the differences are quite large, particularly relative to QMB-plus beneficiaries.
Given that they both receive full coverage of Medicare copayments and deductibles, we expected and found few differences in Medicare service use between QMB beneficiaries living in standard QMB benefit states and those living in QMB-plus states. However, QMB-plus beneficiaries were significantly more likely to have a visit with a physician or other Part B provider. This may be related to coverage of prescription drugs that QMB-plus beneficiaries, but not standard benefit QMBs, receive through Medicaid. As discussed below, QMB-plus beneficiaries use more prescription drugs than those living in standard QMB benefit states. As a result, QMB-plus beneficiaries may need to see a doctor more often to monitor or renew their medications. In addition, beneficiary focus groups suggested that beneficiaries without prescription drug coverage may avoid seeing a physician if they think the result will be a prescription that they are unable to afford.
Service use by SSI beneficiaries relative to other Medicare Savings Programs enrollees was generally lower than expected in light of the broad coverage to which they are entitled. They were less likely than standard benefit QMB and QMB-plus beneficiaries to use most Medicare services and there were few significant differences from SLMBs. These lower than expected levels of service use may reflect differences in the characteristics of the enrollee groups that we were unable to control for in our analyses. For example, enrollment in SSI may be less subject to adverse selection than the other Medicare Savings Programs. While QMBs and SLMBs apply to the Medicare Savings Programs specifically to receive medical benefits, SSI beneficiaries receive Medicaid by virtue of their entitlement to SSI cash benefits. Thus, enrollment in the SSI program may be less driven my medical care needs. Although they are inconclusive, our analyses did not find evidence of adverse selection in the SSI program, but suggest that there may be adverse selection in the other programs.
7.1.4 Out-of-Pocket Costs
The key goal of the Medicare Savings Programs is to provide assistance to low-income Medicare beneficiaries in paying their out-of-pocket expenses for medical care services. Our findings clearly indicate that the Medicare Savings Programs succeed in achieving this goal. Although they decrease the financial burdens experienced by Medicare beneficiaries, they do not eliminate them.
SSI, standard benefit QMB, and QMB-plus enrollees are in poorer health and use more services than their nonenrollee counterparts. Despite this, enrollees in all three groups have lower out-of-pocket costs than eligible nonenrollees. As expected, SSI and QMB-plus
213
beneficiaries receive greater protection from out-of-pocket costs than standard benefit QMBs. In contrast, SLMB enrollees also use more services than eligible nonenrollees, but there are no differences between the groups in out-of-pocket costs. This suggests that they are using the savings on the Part B premium to purchase additional medical services. Nevertheless, more than half of SLMBs delay seeking care because of the cost.
Although the Medicare Savings Programs reduce beneficiary liability, the vast majority of enrollees continue to incur some out-of-pocket costs and the burden is particularly large for SLMBs. While a substantial proportion of standard benefit QMB and QMB-plus enrollees delay seeking medical care because of costs and have problems paying for their medications, SLMBs were even more likely to report these difficulties. Indeed, the average out-of-pocket costs for a SLMB beneficiary would consume about 20% of the annual income of an individual whose income is 120% of poverty.
Coverage of prescription drugs through Medicaid provides a valuable benefit to SSI and QMB-plus enrollees. SSI and QMB-plus enrollees have substantially lower out-of-pocket costs for prescription medicines than eligible nonenrollees, while there were no differences between standard benefit QMB and SLMB enrollees and their nonenrollee counterparts. SSI and QMB-plus enrollees also have significantly lower out-of-pocket costs for prescription drugs than standard benefit QMB and SLMB enrollees. In our beneficiary survey, QMB-plus beneficiaries were much less likely than standard benefit QMB or SLMB beneficiaries to report they had difficulties paying for prescriptions or used fewer medications than prescribed due to costs.
7.2 Study Limitations
7.2.1 Difficulty Identifying Type of Medicare Savings Programs Enrollee
This study highlights the importance of distinguishing among different categories of Medicare Savings Programs enrollees when assessing program operation and impacts. CMS’s TPEarth (or Third Party Buy-in) file is the only data source that can be used to differentiate SSI, QMB, and SLMB beneficiaries. However, there are limitations to the TPEarth data that make it difficult to categorize beneficiaries in this way.
First, it may be difficult to reliably differentiate SSI and QMB beneficiaries, except in auto-accrete states. Although the TPEarth file has separate eligibility codes for QMB and SSI, SSI beneficiaries are technically considered QMBs and some states may use the QMB code for SSI recipients. However, an additional code that identifies beneficiaries who are auto-accreted to Medicaid can be used to identify SSI beneficiaries in auto-accrete sates.
Second, it may be difficult to reliably identify transitions between eligibility categories within a period of continuous Medicaid buy-in. Although the TPEarth file is historical, a new record is usually not generated when a beneficiary changes eligibility status during a period of continuous coverage and previous eligibility codes are overwritten. As a result, even when we can reliably identify a beneficiary’s most current program eligibility, it is harder to identify their original eligibility. However, since a change between SSI and other types of enrollment will trigger a new record in auto-accrete states, we can reliably distinguish transitions between SSI and other types of eligibility in these states.
214
As a result of the limitations in the TPEarth file, most of our analyses exclude data from ten states where we could not reliably distinguish QMB from SSI beneficiaries. Some analyses that look back over a beneficiary’s eligibility history exclude additional states. The states that remain in our analyses may not be representative of all 50 states. Most importantly, all of the excluded states do not auto-accrete SSI beneficiaries into Medicaid. Our findings for SSI beneficiaries are, therefore, the most likely to suffer from any biases due to these exclusions.
7.2.2 Difficulty Identifying Eligible Nonenrollee Population
Ideally, in identifying the eligible nonenrollee population, we would have liked to have adjusted income and asset data for the types of exclusions that are used when making eligibility determinations. However, this was not possible due to limitations in reporting income and asset data in the MCBS and, instead, we used gross income and assets. Our beneficiary survey similarly relied on questions about gross income and assets to identify eligible nonenrollees. This approach has also been used in previous studies (Pezzin and Kasper, 2002; GAO, 1999).
Because we could not adjust for income and assets for these exclusions, the eligible nonenrollee populations used in our analyses have lower income and assets than their enrollee counterparts. While this could affect our findings on differences between enrollees and nonenrollees, we tested the sensitivity of the results of our MCBS analyses to this bias and found little impact. Our findings on service use were unchanged when we limited the enrollee population to the income ranges used to identify eligible nonenrollees.
7.2.3 Adverse Selection
There are many differences between enrollees and eligible nonenrollees, as well as between types of enrollees, that undoubtedly influence patterns of service use and out-of-pocket expenditures. Our multivariate analyses control for those characteristics that can be observed in our data sets. The MCBS analyses include a particularly rich set of controls. Nonetheless, there undoubtedly remain unmeasured differences between the groups that influence our findings. The adverse selection analyses attempted to systematically control for unmeasured differences between the enrollee and nonenrollee populations. However, we could not determine conclusively the extent to which higher service use by enrollees is driven by Medicare Savings Programs benefits.
7.2.4 Limitations in Outreach Assessment
Our study of state variation in program enrollment found no significant relationship between state outreach activities or application procedures and Medicare Savings Programs takeup rates. There are a number of limitations to the data that were used in this set of analyses that may explain these findings.
Some limitations are related to the limited time period for the study. There were only three years of data available for this portion of the study, which may not have been long enough to observe the impact of increasing outreach activities. In addition, variation in the takeup rate was limited in a number of states during this time period. The takeup rate in 20 states changed less than 2 percentage points between 1999 and 2001. It may also take time to observe the impact of new outreach initiatives on enrollment. Although our analyses primarily looked at the relationship between concurrent outreach efforts and enrollment, we nonetheless found similar
215
results when we tested the relationship between enrollment and prior year outreach. Finally, because the state is the unit of observation, the sample size was small even in the analyses that incorporated all three years of data.
Additional limitations are related to our ability to accurately measure the key variables used in these analyses. While we had hoped to measure the intensity of outreach efforts, it was not possible based on the responses to the state outreach survey and, for the most part, our analyses simply looked at the whether a state had undertaken a particular activity in a given year. As a result, our outreach variables may not have been refined enough to accurately identify enrollment impacts. In addition, the quality of some of the responses to the state outreach survey was poor. Errors in measuring the outreach variables could bias our analyses toward insignificant findings. It is also difficult to reliably estimate the number of Medicare beneficiaries that qualify for the Medicare Savings Programs so that our takeup rates may not be accurate. Finally, including SSI and medically needy beneficiaries in the takeup rate dilutes the impact of outreach activities because we expect their enrollment will be less affected by these efforts than that of QMBs and SLMBs.
7.3 Discussion
It is clear that the Medicare Savings Programs offer a valuable benefit to enrollees. Enrollment in the Medicare Savings Programs increases utilization of medical care services for low-income Medicare beneficiaries. While the benefit is greatest for those entitled to the broadest coverage, covering the Medicare Part B premium alone appears to increase service use for the SLMB population. Although it is a relatively modest benefit, this coverage may provide substantial financial relief for near-poor Medicare beneficiaries and free resources that enable them to purchase additional medical care services. Nonetheless, perhaps because of its more limited benefit, enrollment in the SLMB program has lagged behind that in other components of the Medicare Savings Programs and continued efforts are needed to promote the value of this program.
The Medicare Savings Programs also provide substantial protection from out-of-pocket costs. However, most enrollees continue to incur some out-of-pocket costs, particularly SLMBs, who have over $2,200 in out-of-pocket costs per year. Indeed, the average out-of-pocket costs for a SLMB beneficiary would consume about 20% of the annual income of a person living at 120% of poverty. Despite receiving very comprehensive benefits, the SSI and QMB-plus populations remain liable for out-of-pocket costs, ranging from $400 to over $1,000 per year, that are likely to be a serious hardship for some beneficiaries. Further research is needed to better understand the sources of these remaining out-of-pocket costs, particularly for SSI and QMB-plus beneficiaries. Our findings also highlight the substantial burden posed by out-of-pocket expenditures for prescription drugs. While the burden is greatest for standard benefit QMB and SLMB beneficiaries, SSI and, especially, QMB-plus beneficiaries continue to incur out-of-pocket costs despite having coverage of outpatient prescription drugs through Medicaid.
Many studies have shown that the Medicare Savings Programs are under-utilized and our findings indicate that lack of awareness, not motivation, is the main reason eligible beneficiaries have not enrolled. Furthermore, personal assistance is key to successfully educating and enrolling beneficiaries into the Medicare Savings Programs. These findings suggest that it may be most effective to target outreach efforts to those in the community that can identify potentially
216
eligible beneficiaries and assist them with the enrollment process. One strategy would be to focus education efforts on the many types of health and social service providers that have daily contact with potentially eligible Medicare beneficiaries, but often have little knowledge about the Medicare Savings Programs. A second strategy is to increase awareness among other helping professionals of the services available from SHIP, including assistance with the application process and answers to specific questions. SHIP workers should be encouraged to develop relationships with other helping professionals in their community. If more individuals seek assistance from SHIP, it will be necessary to increase investment and expand the SHIP program. A final strategy is to develop training on the Medicare Savings Programs for welfare office workers and to have welfare office staff that specializes in them. Although many enrollees receive help from local welfare office staff, our focus groups of beneficiaries and helping professionals reported that there is often limited staff in these offices to respond to calls about the program and the staff responsible for taking applications may have little knowledge about the programs themselves.
Despite significant strides toward simplification, our findings indicate that aspects of the application process and certain eligibility requirements remain impediments to enrollment. The application itself was cited as a barrier to enrollment by 15-20% of eligible nonenrollees and requiring documentation of income and assets decreased the likelihood of enrolling. Estate recovery was cited as a concern by 20% of eligible nonenrollees. Although the amount subject to estate recovery may be small, especially for SLMBs, beneficiaries often do not understand the limits of the estate recovery process. Finally, the current asset limits, which were established in 1989 and have not been updated since, exclude many low-income beneficiaries who would otherwise qualify for the program. In our survey, 45% of nonenrollee respondents with incomes under 120% of poverty had assets that exceeded the limits for the Medicare Savings Programs.
Our study highlights the importance of distinguishing among different categories of enrollees in the Medicare Savings Programs in order to understand how differences in eligibility pathways and benefit packages influence patterns of enrollment, service use, and out-of-pocket costs. However, it can be sometimes difficult to obtain some basic information about the Medicare Savings Programs because there is currently no centralized source of information about state policies. CMS is developing a web-based repository on state-plan information. It would be helpful for researchers and people in the policy community for this effort to be continued and resources invested to make this a user-friendly data source.
Our study was limited by the lack of data for certain states to reliably identify the benefits to which a Medicare Savings Programs enrollee is entitled and the basis of her eligibility. CMS has addressed these limitations through recent enhancements to the Medicaid Statistical Information System (MSIS). Beginning in 1999, MSIS includes detailed information on the type of dual benefits to which a beneficiary is entitled as well as basis of eligibility. Furthermore, MSIS now includes the Medicare Health Insurance Claim (HIC) number so that MSIS and Medicare data can be linked for dually eligible beneficiaries. This linkage to Medicare data is critical because Medicare is the primary payer for most services received by dually eligible beneficiaries and many analyses of the Medicare Savings Programs will focus primarily on Medicare data. However, this linkage, which requires researchers to work with quarterly MSIS files for each state, is cumbersome for Medicare analyses, particularly those that require data for multiple states. Although MSIS data are converted to MAXX files to be more accessible to

217
researchers, there are considerable lags before these files are available. CMS could remove barriers to incorporating accurate information on dual eligibility in Medicare analyses by continuing to support and expedite creation of the MAXX files. In addition, MSIS data could be merged to Medicare analytic files. CMS is currently working on developing a process for such a merge.
218
REFERENCES
Actuarial Research Corporation: Estimating the Universe of Medicare Beneficiaries Potentially Eligible for Medicaid Buy-In. Overview of HCFA Methodology, February 26, 1999.
Actuarial Research Corporation: Individuals Potentially Eligible for Medicaid Buy-In but not Bought In, January 20, 1999.
Actuarial Research Corporation: Dual Eligible Buy-In Status. Prepared for the Centers for Medicare & Medicaid Services, July 29, 2002.
Atkinson, A. and Sitglitz, J.: Lectures on Public Economics. New York: McGraw-Hill Book Company, 1980.
Barents Group, LLC: A Profile of QMB-Eligible and SLMB-Eligible Medicare Beneficiaries. Prepared for the Health Care Financing Administration. April 7, 1999.
Carpenter, L: Evolution of Medicaid Coverage for Medicare Cost Sharing. Health Care Financing Review, 20(2):11-18. Winter 1998.
Centers for Medicare & Medicaid Services: The Health and Health Care of the Medicare Population (1998): What Health Care Services Do Medicare Beneficiaries Receive? Accessed at <http://cms.hhs.gov/mcbs/MCBSsrc/1998/98cbc3c.pdf> on 5 December 2002.
Coughlin, T., Ku, L., and Holahan, J.: Medicaid Since 1980. Washington, DC: The Urban Press, 1984.
Craig, S. and Inman, R.: Education, Welfare and the ‘New’ Federalism: State Budgeting in a Federalist Public Economy. In Studies in State and Local Public Finance, edited by Harvey Rosen. Chicago: University of Chicago Press, 1986.
Cromwell, J., et al.: Equity of the Medicaid Programs to the Poor versus Taxpayers. Health Care Financing Review, 16(3): 75-104, Spring 1995.
Cromwell, J., et al.: Programmatic, Economic, and Demographic Forces Underlying Medicaid Enrollment Trends. Medical Care Research and Review, 54(2):150-175, June 1997.
Cromwell, J., et al.: Examining the Medicaid Fiscal Crisis. Final Report prepared under HCFA Cooperative Agreement No. 18-C-90028/1-02, Waltham, MA: Center for Health Economics Research, October 1994.
Cromwell, J., et al.: The Evolution of State Medicaid Programs. Grant No. 066A-83. Prepared for the Assistant Secretary’s Office for Planning and Evaluation, Department of Health and Human Services. Waltham, MA: Center for Health Economics Research, June 1984.
Cromwell, J., Hurdle, S., and Wedig, J.: Impacts of Economic and Programmatic Changes on Medicaid Enrollments. Review of Economics and Statistics, 68:2, May 1986.
219
Families USA: Shortchanged: Billions Withheld from Medicare Beneficiaries. Washington, DC: Families USA Foundation, 1998.
Gilman, B.H., Gage, B. and Mitchell, J.B.: Evaluation of Vermont Pharmacy Assistance Programs for Low Income Medicare Beneficiaries. Draft Final Report, CMS Contract No. 500-95-0040, September 10, 2002.
Hoover, S., Khatutsky, G., and Haber, S.: Evaluation of the Process and Impact of State Outreach and Enrollment Programs for Dual Eligibles. Final Report prepared under CMS contract No. 500-95-0058. November 20, 2002.
Inman, R.: Markets, Governments, and the ‘New’ Political Economy. Vol 2 Auerbach, A. and Feldstein, M. (editors), in Handbook of Public Economics,. Amsterdam: North-Holland, 1987.
Institute of Medicine, Committee on Monitoring Access to Personal Health Care Services: Access to Health Care in America. Washington, DC: National Academy Press, 1993.
MedPAC: Report to Congress: Medicare Payment Policy. Washington, DC: Medicare Payment Advisory Commission, March 2001.
Merrell, K., Colby, D.C., and Hogan, C.: Medicare Beneficiaries Covered by Medicaid Buy-In Agreements. Health Affairs, 16(1):175-184, January/February 1997.
Mitchell, J.B. and Haber, S.G.: State Payment Limitations on Medicare Cost-Sharing: Impacts on Dually Eligible Beneficiaries and their Providers. Final Report, CMS Contract No. 500-95-0058, TO#8, Waltham, MA:RTI International, July 2003.
Moon, M., Kuntz, C., and Pounder, L.: Protecting Low-Income Medicare Beneficiaries. Washington, DC: The Urban Institute, November 1996.
Moon, M., Brennan, N., and Segal, M.: Options for Aiding Low-Income Medicare Beneficiaries. Inquiry, 35:346-356, Fall 1998.
Nemore, P.B.: Variations in State Medicaid Buy-in Practices for Low-Income Medicare Beneficiaries. Washington, DC: National Senior Citizens Law Center, November 1997.
Nemore, P.B.: Variations in State Medicaid Buy-in Practices for Low-Income Medicare Beneficiaries: A 1999 Update. Washington, DC: National Senior Citizens Law Center, December 1999.
Neumann, P.J., et al.: Identifying Barriers to Elderly Participation in the Qualified Medicare Beneficiary Program. Prepared for the Health Care Financing Administration under Cooperative Agreement No. 17-C-90094/3-01. Bethesda, MD. Project Hope Center for Health Affairs, August 23, 1994.
Neumann, P.J., et al.: Participation in the Qualified Medicare Beneficiary Program. Health Care Financing Review, 17(2):169-178, Winter 1995.
220
Parente, S.T. and Evans, W.N.: Effect of Low-Income Elderly Insurance Copayment Subsidies. Health Care Financing Review, 20(2):19-37, Winter 1998.
Perry, M., Kannel, S., and Dulio, A.: Barriers to Medicaid Enrollment for Low-Income Seniors: Focus Group Findings. Washington, DC: The Kaiser Commission on Medicaid and the Uninsured, January 2002.
Pezzin, L.E. and Kasper, J.D.: Medicaid Enrollment among Elderly Medicare Beneficiaries: Individual Determinants, Effects of State Policy, and Impact on Service Use. Health Services Research, 37(4):827-847, August 2002.
Pope, G.C., Adamache, K.W., Walsh, E.G., et al.: Evaluating Alternative Risk Adjusters for Medicare. Final Report, HCFA Grant No. 17-C-90316/1-02, March 26, 1998.
Rosenbach, M. and Lamphere, J.: Bridging the Gaps Between Medicare and Medicaid: The Case of QMBs and SLMBs. Washington, DC: AARP, January 1999.
Shaner, H.: Dual Eligible Outreach and Enrollment: A View from the States. Report submitted by the American Public Human Services Association to HCFA, March 1999 ; available from http://www.hcfa.gov/medicaid/o&erpt.htm; Internet; accessed 27 May 1999.
Summer, L. and Friedland, R.: The Role of the Asset Test in Targeting Benefits for Medicare Savings Programs. The Commonwealth Fund, October 2002.
United States General Accounting Office: Many Eligible People Not Enrolled in Qualified Medicare Beneficiary Programs. Washington, DC, January 1994.
United States General Accounting Office: Low-Income Medicare Beneficiaries: Further Outreach and Administrative Simplification Could Increase Enrollment. Washington, DC, GAO/HEH-99-61, April 1999.
Walsh, E.G. and Clark, W.: Managed Care and Dual Eligible Beneficiaries: Challenges in Coordinating Across Medicare and Medicaid. Health Care Financing Review, 24(1):63-82. Fall 2002.