evaluation of puget sound hov lane hours of operation: one ... · location, sr 167 southbound in...
TRANSCRIPT

DRAFT
Technical Report Agreement T2695, Task 39 HOV lane Hours Evaluation
WA-RD 599.1
EVALUATION OF PUGET SOUND HOV LANE HOURS OF OPERATION: ONE-YEAR RESULTS
by
Mark E. Hallenbeck Director
Jennifer Nee John M. Ishimaru Research Engineer Senior Research Engineer
Jaime M. Kopf Research Engineer
Washington State Transportation Center (TRAC) University of Washington, Box 354802
University District Building 1107 NE 45th Street, Suite 535
Seattle, Washington 98105-4631
Washington State Department of Transportation Technical Monitor Pete Briglia, ITS Program Manager
WSDOT Advanced Technology Branch
Prepared for Washington State Transportation Commission
Department of Transportation and in cooperation with
U.S. Department of Transportation Federal Highway Administration
December 2004

DRAFT

DISCLAIMER
The contents of this report reflect the views of the authors, who are responsible
for the facts and the accuracy of the data presented herein. The contents do not
necessarily reflect the official views or policies of the Washington State Department of
Transportation. This report does not constitute a standard, specification, or regulation.
iii DRAFT

iv DRAFT

CONTENTS
EXECUTIVE SUMMARY ....................................................................................... ix SOV Use of the HOV Lane ................................................................................. ix Compliance with the New HOV Lane Policy...................................................... x Changes in Freeway Performance (Speed and Congestion) ................................ x Public Perception of the New HOV Lane Policy ................................................ xi
SECTION 1 INTRODUCTION ................................................................................ 1
SECTION 2 BACKGROUND................................................................................... 2 Evaluation Overview ........................................................................................... 2 Initial Activities ................................................................................................... 3
SECTION 3 METHDOLOGY DESCRIPTION........................................................ 5 Overview of the Data Collection Process ............................................................ 5 Data Collection Matrix ........................................................................................ 6
Performance Measures......................................................................................... 9 Limitations ........................................................................................................... 11
SECTION 4 GENERAL OBSERVATIONS............................................................. 12 HOV Lane Use by Single-Occupant Vehicles (SOVs) ....................................... 13 HOV Lane Compliance by Single-Occupant Vehicles........................................ 26 GP and HOV Lane Performance.......................................................................... 29
Public Perceptions................................................................................................ 65
SECTION 5 SUMMARY OF ONE-YEAR ANALYSES......................................... 68
v DRAFT

FIGURES Figure Page 3.1 Measurement Sites ....................................................................................... 8 4.1 Distribution of Vehicles by Lane (6:30-7:00 PM)......................................... 24 4.2 Distribution of Vehicles by Lane (7:00-7:30 PM)......................................... 24 4.3 SR 167 NB near Auburn, GP......................................................................... 31 4.4 SR 167 NB near Auburn, HOV ..................................................................... 31 4.5 SR 167 SB near Auburn, GP.......................................................................... 32 4.6 SR 167 SB near Auburn, HOV...................................................................... 32 4.7 SR 167 NB near Renton, GP.......................................................................... 33 4.8 SR 167 NB near Renton, HOV...................................................................... 33 4.9 SR 167 SB near Renton, GP .......................................................................... 34 4.10 SR 167 near Renton, HOV............................................................................. 34 4.11 SR 520 WB near Redmond, GP..................................................................... 35 4.12 SR 520 WB near Redmond, HOV ................................................................. 35 4.13 SR 520 EB near Redmond, GP ...................................................................... 36 4.14 SR 520 EB near Redmond, HOV .................................................................. 36 4.15 I-405 NB near Renton, GP............................................................................. 37 4.16 I-405 NB near Renton, HOV ......................................................................... 37 4.17 I-405 SB near Renton, GP ............................................................................. 38 4.18 I-405 SB near Renton, HOV.......................................................................... 38 4.19 I-405 NB near Newcastle, GP........................................................................ 39 4.20 I-405 NB near Newcastle, HOV .................................................................... 39 4.21 I-405 SB near Newcastle, GP ........................................................................ 40 4.22 I-405 SB near Newcastle, HOV..................................................................... 40 4.23 I-405 SB near Bellevue, GP........................................................................... 41 4.24 I-405 SB near Bellevue, HOV ....................................................................... 41 4.25 I-405 NB near Bothell, GP ............................................................................ 42 4.26 I-405 NB near Bothell, HOV......................................................................... 42 4.27 I-90 EB near Issaquah, GP............................................................................. 43 4.28 I-90 EB near Issaquah, HOV ......................................................................... 43 4.29 Performance Profile on SR 167 (May 8, 2003) ............................................. 49 4.30 Performance Profile on SR 167 (May 29, 2003) ........................................... 49 4.31 Performance Profile on SR 167 (May 19, 2004) ........................................... 50 4.32 Performance Profile on SR 167 (May 25, 2004) ........................................... 50 4.33 Performance Profile on I-405 (May 8, 2003) ................................................ 51 4.34 Performance Profile on I-405 (May 25, 2004) .............................................. 51 4.35 Performance Profile on I-405 (May 27, 2004) .............................................. 52 4.36 Change in Distribution of Average 5-Minute GP and HOV Speeds After 7:00
PM, I-405 SB and NE 12th St (2003 and 2004) ............................................. 55 4.37 Change in Distribution of Average 5-Minute GP and HOV Speeds After 7:00
PM, SR 520 WB at NE 148th (2003 and 2004).............................................. 56 4.38 Change in Distribution of Average 5-Minute GP and HOV Speeds After 7:00
PM, SR 167 SB at S. 208th (2003 and 2004) ................................................. 57 4.39 Change in Distribution of Average 5-Minute GP and HOV Speeds After 7:00
PM, I-405 SB at Cedar Ave (2003 and 2004)................................................ 58
vi DRAFT

4.40 Change in Performance at Control Site, I-5 NB GP at NE 145th (2003 and 2004) .............................................................................................................. 61 4.41 Change in Performance at Control Site, I-5 NB HOV at NE 145th (2003 and 2004) .............................................................................................................. 61 4.42 Change in Performance at Control Site, I-5 SB GP at NE 145th (2003 and 2004) .............................................................................................................. 62 4.43 Change in Performance at Control Site, I-5 SB HOV at NE 145th (2003 and 2004) .............................................................................................................. 62 4.44 Change in Performance at Control Site, I-5 NB GP at S. 216th (2003 and 2004) .............................................................................................................. 63 4.45 Change in Performance at Control Site, I-5 NB HOV at S. 216th (2003 and 2004) .............................................................................................................. 63 4.46 Change in Performance at Control Site, I-5 SB GP at S. 216th (2003 and 2004) .............................................................................................................. 64 4.47 Change in Performance at Control Site, I-5 SB HOV at S. 216th (2003 and 2004) .............................................................................................................. 64
vii DRAFT

TABLES Table Page 4.1 Percentage of SOVs in HOV Lanes by Time of Day .................................... 15 4.2 ACO and Vehicle Volumes in the HOV Lane............................................... 17 4.3 Share of Traffic in the HOV Lane during Weekdays (7:00-7:30 PM) .......... 19 4.4 Changes in ACO (SR 167 SB at S. 208th St, Renton).................................... 23 4.5a Changes in Vehicle Volumes during 7:00-7:30 PM (SR 167 SB at S. 208th
St, Renton) ..................................................................................................... 23 4.5b Changes in Vehicle Volumes during 5:00-7:00 PM (SR 167 SB at S. 208th
St, Renton) ..................................................................................................... 23 4.6 Vehicle Volume Distribution (SR 1657 SB at S. 108th St, Renton) .............. 23 4.7 Volume Distribution (I-405 at NE 30th in Newcastle, SB) ............................ 25 4.8 SOVs in the HOV Lane, AM and PM ........................................................... 28 4.9 Distribution of Average 5-Minute Speeds Before/After 7:00 PM in GP and
HOV Lanes (2003 and 2004)......................................................................... 53 4.10 Change in Average GP and HOV Speed Distribution Before/After 7:00 PM
(2003 and 2004) ............................................................................................. 54 4.11 Average GP and HOV Speeds Before/After 7:00 PM (2003 and 2004) ....... 59 4.12 HOV and GP Volumes on SR 167 SB Before/After 7:00 PM (2003 and
2004) .............................................................................................................. 60
viii DRAFT

EXECUTIVE SUMMARY
This report documents changes in the use and operational performance of the
Puget Sound freeway high occupancy vehicle (HOV) lane system one year after the hours
of operation for those facilities changed. It also describes the public’s attitude toward
those changes and HOV lanes in general.
In the summer of 2003, a two-year pilot program began that allows single-
occupant vehicles (SOVs) to use HOV lanes on four of the five primary corridors in the
region (I-405, SR 167, SR 520 east of I-405, and I-90 east of East Mercer Way on Mercer
Island) during the hours of 7:00 PM to 5:00 AM, seven days a week. Interstate 5’s HOV
lanes remain closed to SOVs at all times, and between 5:00 AM and 7:00 PM, seven days
a week, the entire Seattle-area freeway HOV lane network operates as an exclusive
HOV-only system.
This report uses data collected before the start of the pilot program, during the
first two months of operation after the change in operating policy, and after
approximately one year of operation, to describe changes that have occurred as a result of
the new operating policy. Preliminary results are discussed below.
SOV USE OF THE HOV LANE
On the basis of observed traffic volumes, some SOV travelers appeared to be
making use of the new hours of operation. The extent of use varied by location and time
of day, with evening use being greater than morning use. At some locations, there was a
noticeable increase in the percentage and number of SOVs using the HOV lanes in the
evening hours, and an increase in the share of all vehicles using the HOV lane after 7:00
PM. SOV use of the HOV lane was more noticeable on freeway segments with
established evening congestion, such as sections of SR 167 and I-405. The greatest
observed changes were on I-405 southbound at Newcastle, where the SOV percentage of
ix DRAFT

HOV lane volumes increased from about 7 percent before 7:00 PM to over 30 percent
after 7:00 PM, and on SR 167 southbound at Renton and Auburn, where the SOV
percentage increased by over 20 percentage points after 7:00 PM. Other locations
showed little change in SOV use of the HOV lane.
COMPLIANCE WITH THE NEW HOV LANE POLICY
Violations in the HOV lane (i.e., SOVs using the HOV lane from 5:00 AM to
7:00 PM) generally increased only slightly in the evening hours just before 7:00 PM
(when the revised HOV lane usage policy goes into effect each day) and also during the
early AM hours. Some locations saw small reductions in violation rates. During the
5:00 to 7:00 AM period, the percentage of vehicles violating the HOV-only policy ranged
from 1.3 to 7.5 percent before the start of the pilot program, and from 0.8 to 9.0 percent
after one year of operation, for selected locations. During the 6:45 to 7:00 PM period, just
before the HOV lane opens to all vehicles, the percentage of vehicles violating the HOV-
only policy ranged from 0.5 to 4.7 percent before the start of the pilot program and from
0.0 to 8.9 percent after one year of operation, for selected locations. One outlier
location, SR 167 southbound in Auburn, had AM violation rates ranging from 25.6
(before) to 30.3 percent (one year after) and PM rates of 16.6 percent (before) and 15.4
percent (one year after). However, this site has historically had high violation rates and
is atypical because of its location just before the end of the HOV lane network.
CHANGES IN FREEWAY PERFORMANCE (SPEED AND CONGESTION)
Traffic performance improvement after 7:00 PM as a result of the revised hours of
operation is difficult to determine from the data analyzed, in part because congestion
typically dissipates by that time on most days at most locations. However, an analysis of
the distribution of speeds before and after the pilot program start suggested a slight shift
toward higher speeds in the general purpose (GP) lanes after 7:00 PM, though the
x DRAFT

changes were no more than 1 to 3 mph on average. HOV lanes experienced little or no
change in speeds after 7:00 PM, even with the additional SOV volumes.
PUBLIC PERCEPTIONS OF THE NEW HOV LANE POLICY
A survey of freeway travelers explored public awareness of the new policy,
perceived effects on freeway conditions, and overall impressions of the policy.
1) Although traffic data suggested that some SOV travelers were making use of
the new HOV lane hours of operation, responses to a public opinion survey
suggested that awareness of the new hours was not high, with only 36 percent
of respondents indicating that they were aware of the new policy as of spring
2004.
2) Approximately 21 to 28 percent of survey respondents felt that freeway
conditions such as maneuverability, safety, or speeds were somewhat or much
better since the start of the new hours of operation. These percentages were
higher among those who had been aware of the new policy, and lower for
those who had been unaware. Approximately 31 to 39 percent of survey
respondents perceived no changes in freeway maneuverability, safety, or
speeds since the start of the new hours of operation. Approximately 31 to 38
percent of all respondents did not know.
3) A substantial majority (67 percent) of respondents either somewhat or
strongly agreed with the statement that the new policy was a good idea, while
17 percent somewhat or strongly disagreed. Respondents who typically
drove alone during peak hours were even more supportive, with 73 percent
either somewhat or strongly agreeing with the statement that the new policy
was a good idea, and 13 percent somewhat or strongly disagreeing. Among
those who used carpools, vanpools, or transit during peak periods, 59 percent
xi DRAFT

somewhat or strongly agreed with the new policy, while 23 percent somewhat
or strongly disagreed.
4) The new hours of operation affected the respondents’ overall opinion of the
HOV lane network, with 41 percent saying that they had a somewhat or
significantly more favorable opinion of the HOV lane network because of the
new policy, 10 percent expressing a less favorable opinion, and 50 percent
expressing no change in opinion. Among peak hour SOV users, 46 percent
had a somewhat or significantly more favorable opinion of the HOV lane
network because of the new policy, with 48 percent unchanged in their
opinion. Among HOV users, 32 percent had a more favorable opinion
because of the new policy, while 53 percent were unchanged in their opinion,
and 15 percent had a less favorable opinion.
These results will be reviewed and updated as additional data are collected in the
coming months. The next evaluation report will be produced following the end of the
second full year of operation.
xii DRAFT

SECTION 1 INTRODUCTION
This report documents the analytical results of research sponsored by the
Washington State Department of Transportation (WSDOT) to evaluate the effects of a
pilot program to implement specific hours of high-occupancy vehicle (HOV)-only
operation on selected corridors of the Seattle-area freeway HOV lane network. It
summarizes the results of a preliminary analysis performed after two months of operation
as well as analyses performed after one year of operation.
This document is organized as follows:
Background: A description of the research problem and the evaluation tasks
that were performed.
Methodology: A description of the data collection and analysis process used in
conducting tasks 1, 2, and 5 of the evaluation (evaluation of changes in
vehicle occupancy and traffic flow, and results of a public opinion
survey).
General Observations: An overview of the results from conducting tasks 1, 2,
and 5 after one year of pilot project operation, with selected notable
results from the data collected.
Summary of Analyses: A summary of results after one year of the pilot project.
This document is the second of a series of evaluation reports for this project and
describes results from tasks 1, 2, and 5 of the full evaluation effort, using available data
1 DRAFT

sets1. Other components of the evaluation will be documented separately as those results
become available.
1 This report is an updated and expanded version of a technical working paper prepared two months after the start of the pilot program. See Hallenbeck, Nee, and Ishimaru, “Evaluation of Puget Sound HOV Lane Hours of Operation: Initial Results for Tasks 1 and 2,” Washington State Transportation Center, 2003.
2 DRAFT

SECTION 2 BACKGROUND
Since its inception, the Puget Sound freeway HOV lane network has operated as
an exclusive HOV-only facility, 24 hours a day, seven days a week. In recent years,
discussions have taken place at the regional and state level regarding the potential use of
the HOV lane network by single-occupant vehicles (SOVs) during particular times of the
day or days of the week in an effort to maximize the use of existing facilities and enhance
overall freeway network performance. In the summer of 2003, a two-year pilot program
was begun to explore the potential costs and benefits of such a usage policy. Under
this pilot program, the freeway HOV lane network is available for use by all vehicles,
both HOVs and SOVs, during the hours of 7:00 PM to 5:00 AM, seven days a week, on
four of the five primary corridors in the region (I-405, SR 167, SR 520 east of I-405, and
I-90 east of East Mercer Way on Mercer Island). Interstate 5’s HOV lanes remain closed
to SOVs at all times, and between 5:00 AM and 7:00 PM, seven days a week, the entire
Seattle-area freeway HOV lane network operates as an exclusive HOV-only system.
EVALUATION OVERVIEW
In association with this pilot program, an evaluation effort was developed to
analyze the effects of this new policy. The focus of this effort is on the effects of the
change in hours of HOV lane operation on freeway usage and performance, safety, and
enforcement, as well as on public opinion. The overall evaluation effort consists of six
tasks:
1. Car occupancy analysis. The focus of this task is a review of changes in
per-car occupancy, particularly in the HOV lane, and changes in the violation
rate—or SOV usage rate—for the HOV lane during different times of the day.
The Washington State Transportation Center (TRAC) at the University of
Washington will perform this task.
3 DRAFT

2. Traffic flow analysis. This task involves an analysis of changes in freeway
usage and performance in both the HOV and general purpose (GP) lanes.
Principal measures include vehicle volumes, speeds, and congestion
frequency. TRAC is performing this task.
3. Safety evaluation. WSDOT will evaluate incident and accident data to
determine any changes in the number and frequency of those events during
the revised HOV lane hours of operation.
4. Enforcement evaluation. WSDOT will summarize enforcement activities
and analyze changes in HOV lane violation rates on the basis of Washington
State Patrol (WSP) and HERO data. These results will also be compared
with related data collected for Task 1.
5. Opinion Surveys. WSDOT and TRAC will perform opinion surveys of the
general public, public officials, and other stakeholders.
6. Report Generation. Periodic evaluation reports will be prepared by TRAC
and WSDOT. These reports will summarize TRAC and WSDOT analyses
for the tasks listed above.
The remainder of this paper focuses on initial (2003) and one-year (2004) results
for tasks 1, 2, and 5. Other task results will be documented separately by TRAC and/or
WSDOT as they become available.
INITIAL ACTIVITIES
The following activities were completed as part of this analytical effort for
evaluation tasks 1, 2 and 5:
• Collect data. Vehicle occupancy data were collected via direct field
observations. The data were then processed, filtered, and archived in a Web-
4 DRAFT

accessible database for subsequent analyses. WSDOT collected freeway
usage data (primarily vehicle volumes and lane occupancy percentage) from
its sensor (loop) network. The data were then archived onto CD for use with
TRAC’s performance estimation software.
• Compute performance measures. Selected data sets for specific locations
and time periods were extracted and processed to produce performance
measures.
• Analyze data for initial before/after comparisons. Comparisons were
made and analyzed of freeway traffic characteristics before and after the
revised hours of operation were implemented. The “before” period was
defined as the two months before the implementation time period. (The
implementation time period was defined as the approximately one month
during which the revised hours of operation were phased in across the four
affected corridors.) Two “after” periods are described in this report.
Preliminary “after” results were estimated two months after the
implementation period (summer 2003), while one-year “after” results were
estimated in spring and summer 2004 after approximately one year of
operation.
5 DRAFT

SECTION 3 METHODOLOGY DESCRIPTION
Below is a description of the data collection process, data collection matrix, and
computed performance measures used to perform tasks 1, 2, and 5 of this evaluation.
OVERVIEW OF THE DATA COLLECTION PROCESS
The following approach was used to collect data for tasks 1, 2, and 5 of this
evaluation.
Task 1 data: Vehicle occupancy was analyzed by using data collected by a field
data observer group. This data collection effort is normally part of a separate, ongoing,
WSDOT-sponsored project to monitor HOV lane network performance. Individuals in
the observer group collect data by directly observing the number of occupants per vehicle
at selected locations and time periods throughout the central Puget Sound freeway
network, and then electronically recording that information. With support from
WSDOT, the standard matrix of observation locations and times normally used by the
observer group was supplemented with additional locations and times to enable this HOV
hours of operation evaluation.
Task 2 data: Traffic flow analyses were performed with freeway surveillance
data collected by the WSDOT Northwest Region’s embedded freeway sensor loop
network (the FLOW system). These data consist primarily of vehicle volumes and lane
occupancy percentage values for each lane, at approximately 0.5-mile intervals, for 5-
minute periods, 24 hours a day, seven days a week, throughout the freeway network.
WSDOT archives these raw data, and TRAC analyzed them by using the TRAC-WSDOT
FLOW analysis process. This process, developed over the last eight years by TRAC, uses
specially developed software to compute detailed freeway performance measures.
Task 5 data: A public opinion survey was conducted in the spring of 2004 to
evaluate public awareness and perceptions of the revised HOV lane hours of operation.
6 DRAFT

This data collection effort was accomplished by adding questions to a survey that is
periodically distributed as part of the ongoing WSDOT project to monitor HOV lane
network performance. That project’s standard survey form was supplemented with
additional questions about the revised HOV hours of operation, with distribution and
collection of the survey performed with support from WSDOT..
TRAC performed tasks 1 and 2 in consultation with WSDOT staff, with data
collection support from the HOV Lane Evaluation project and WSDOT Northwest
Region. Staff of the HOV Lane Evaluation project collected survey data for Task 5, and
TRAC analyzed the results.
DATA COLLECTION MATRIX
The general analytical approach for evaluation tasks 1 and 2 involved the analysis
of vehicle occupancy data and sensor (loop) data for particular combinations of location
(e.g., I-5 at milepost 170), direction of travel (e.g., northbound), range of days (e.g.,
July through September 2002, weekdays), time period (e.g., PM peak period from 5:00
PM to 7:15 PM), and lane type (GP or HOV). Ideally, one would want to analyze as
many such combinations as possible, with dense geographic coverage of the freeway
network. The primary practical limiting factor for the data collection process was the
labor-intensive vehicle occupancy data collection effort, which requires human field
observations and manual data collection. In contrast, sensor loop data are generally
available at locations throughout the freeway network. For that reason, the matrix of
data collection measurements used in this project was constrained by the availability of
the more labor-intensive vehicle occupancy measurements.
Figure 3.1 shows the locations, times, and directions of travel of vehicle
occupancy measurements taken for this initial evaluation process, along with the date
when revised operating hours began. Measurements were taken at eleven locations that
were selected to sample each of the corridors affected by the revised hours of operation.
7 DRAFT

For each location, efforts were made to collect data during both AM and PM peak
periods (5:00-7:00 AM, 5:00-7:00 PM), with additional data collected from 7:00 PM to
7:15 PM, in both the GP and HOV lanes and usually in both directions of travel.
The resulting data set features 42 combinations of location, time, direction, and
lane type. Multiple days of data collection were scheduled for each location so that
results could be averaged. Measurements were made during both weekdays and
weekends, though for this initial evaluation effort, only weekday data were processed.
For each measurement of average vehicle occupancy, matching traffic flow (loop)
data were also extracted for the closest possible sensor location and time period.
The general analytical approach for task 5 involved analyzing public opinion via
an anonymous mailback questionnaire. Survey questions related to the new HOV lane
operating hours were added to WSDOT’s existing annual HOV public opinion survey.
Traffic observers for that project collected the license plate numbers of vehicles on GP
and HOV freeway lanes at the vehicle occupancy measurement sites and also collected
license plate numbers at park-and-ride lots. These license plate numbers were then sent
to Olympia for processing by the state Department of Licensing. The resulting address
list was used as the potential pool of survey recipients. Of the 5,349 surveys sent out,
1,209 surveys were returned and processed, for an overall response rate of approximately
23 percent. The survey was conducted during late winter and spring of 2004,
approximately half a year after the new hours of operation began in the summer of 2003.
8 DRAFT

5
405
520520
90405
1675
5
16
2
525
104
522
526
512
99
99
18
Everett
Renton
BellevueSeattle
BothellEdmonds
Issaquah
Redmond
Lynnwood
Lakewood
Tacoma
FederalWay
Auburn
Sea Tac
Snohomish Co. King Co.
Renton
Kitsap Co.Pierce Co.
King Co.Pierce Co.
HOV Lanes
Open to Traffic
Under Construction
Planned
N
0
0
5 miles
8 kms
I-405 NE 160th StAM SB GP/HOV 7/11PM NB GP/HOV 7/3
SR-520 148th Ave NEAM/PM EB/WB HOV 6/17
I-405 NE 12th StAM/PM SB HOV 7/11
I-90 Newport WayAM WB GP/HOV 6/27PM EB GP/HOV 6/25
I-405 NE 30th StPM NB GP/HOV 7/3PM SB GP/HOV 7/11
I-405 Cedar AveAM/PM NB HOV 7/3AM/PM SB HOV 7/11
SR-167 S 208th StAM/PM NB GP/HOV 6/18AM/PM SB GP/HOV 6/13
SR-167 37th St NWAM/PM NB GP/HOV 6/18AM/PM SB GP/HOV 6/13
Corridor LocationTime Dir. Lane Opening
Date
LEGEND
I-5 NE 145th StAM/PM NB/SB HOV
I-5 S 216th StAM/PM NB/SB GP/HOV
I-405 112th SE NewcastleAM NB GP/HOV 7/3AM SB GP/HOV 7/11
Control Site
Control Site
5
405
520520
90405
1675
5
16
2
525
104
522
526
512
99
99
18
Everett
Renton
BellevueSeattle
BothellEdmonds
Issaquah
Redmond
Lynnwood
Lakewood
Tacoma
FederalWay
Auburn
Sea Tac
Snohomish Co. King Co.
Renton
Kitsap Co.Pierce Co.
King Co.Pierce Co.
HOV Lanes
Open to Traffic
Under Construction
Planned
N
0
0
5 miles
8 kms
I-405 NE 160th StAM SB GP/HOV 7/11PM NB GP/HOV 7/3
SR-520 148th Ave NEAM/PM EB/WB HOV 6/17
I-405 NE 12th StAM/PM SB HOV 7/11
I-90 Newport WayAM WB GP/HOV 6/27PM EB GP/HOV 6/25
I-405 NE 30th StPM NB GP/HOV 7/3PM SB GP/HOV 7/11
I-405 Cedar AveAM/PM NB HOV 7/3AM/PM SB HOV 7/11
SR-167 S 208th StAM/PM NB GP/HOV 6/18AM/PM SB GP/HOV 6/13
SR-167 37th St NWAM/PM NB GP/HOV 6/18AM/PM SB GP/HOV 6/13
Corridor LocationTime Dir. Lane Opening
Date
LEGEND
I-5 NE 145th StAM/PM NB/SB HOV
I-5 S 216th StAM/PM NB/SB GP/HOV
I-405 112th SE NewcastleAM NB GP/HOV 7/3AM SB GP/HOV 7/11
Control Site
Control Site
Figure 3.1. Measurement Sites
9 DRAFT

As with the vehicle occupancy observations, the limiting factor for the survey
data collection process was the labor-intensive vehicle license plate data collection effort,
which requires human field observations and manual data collection. Nevertheless, a
significant number of survey responses were received.
PERFORMANCE MEASURES
The principal performance measures used in this initial evaluation were computed
for each element (combination of location/time/direction/lane type) in the data
measurement matrix. In general, individual observations were first averaged within each
time period for each data collection day (e.g., 5:00-7:00 AM, 5:00-7:00 PM) and then
averaged for longer periods (e.g., the average of all “before” data collection days). The
performance measures were as follows:
1. Average car occupancy (ACO). This performance measure summarized the
principal criterion for determining the eligibility of a vehicle to use the HOV
lane. The unit of measure was average number of occupants per vehicle.
2. SOV violation rate / SOV usage rate. Individual field observations of
vehicle occupancy were analyzed to determine the number and percentage of
vehicles in the HOV lane that were below the usual minimum occupancy
requirement. Because the HOV occupancy requirement is normally two or
more persons, the unit of measure was number or percentage of SOVs in
the HOV lane. Note that during the hours of 5:00 AM to 7:00 PM, this
measure was considered a violation rate, while from 7:00 PM to 5:00 AM
(when all vehicles can legally use the HOV lane), it was considered an SOV
“usage” rate.
10 DRAFT

3. Average vehicle volume. Volume data collected by sensor loops were
processed and averaged for locations and time periods that matched those of
the vehicle occupancy data as closely as possible. Units of measure were
average number of vehicles per time period (usually AM or PM peak
period), average number of vehicles per hour, or average number of
vehicles per lane per hour, depending on the type of analysis.
4. HOV lane share. Vehicle volume data for each lane at a location were
processed to determine the percentage of all vehicles using the HOV lane. The
unit of measure was number or percentage of vehicles using the HOV lane.
5. Average 24-hour traffic profile. While the measures listed above were
aggregated across a time period, the average 24-hour traffic profile was
intended to display the time-varying characteristics of traffic at a location,
including the average vehicle volume, average estimated vehicle speed, and
frequency of heavy congestion at 5-minute intervals throughout an average
24-hour day. Units of measure were vehicles per hour, miles per hour, and
likelihood (percentage) that heavy congestion occurs, respectively, each of
which varied by time of day. The averages were computed by processing all
applicable days of sensor data for a given period of time (e.g., “before” or
“after” weekday data).
6. Day-to-day profiles. Measures 1 through 4 were also displayed as a graph of
successive days to determine day-to-day variations, particularly those days
immediately before and after the hours of operation were implemented.
11 DRAFT

7. Public opinion. Public awareness and perception of the pilot program were
estimated by analyzing the results of a survey. Responses to survey
questions were based on a discrete scale of choices.
LIMITATIONS
Because of the labor-intensive data collection process for vehicle occupancy, the
number of occupancy data measurements was limited for any given site. Similarly, public
opinion survey responses were limited by the number of license plate numbers that could
be manually collected. Both processes were subject to potential error given the manual
collection methods employed. Sensor loop data were readily available but could vary in
quality or be affected by sensor hardware or communications problems. To overcome
these limitations as much as possible, efforts were made to review, filter, and verify all
data before their use for this evaluation.
12 DRAFT

SECTION 4 GENERAL OBSERVATIONS
The following is a summary of initial and one-year results for selected locations
in the Seattle area freeway network. Unless otherwise noted, results were usually based
on “before vs. after” comparisons, i.e., how did traffic characteristics change following
implementation of the new HOV lane hours of operation? Two types of before vs. after
comparisons were made: a short-term comparison immediately following
implementation, and a longer-term follow-up comparison to estimate the extent to which
observed short-term changes in traffic characteristics were sustained after one year of
operation. Before-and-after comparisons were based on three time periods. To
evaluate short-term changes, a “before” time period from April 2003 through June 12,
2003, and an “after” time period from mid-July 2003 through September 2003 were used.
These time periods preceded and followed the one-month period (June 13, 2003, through
July 11, 2003) during which the new operating hours were phased in. To evaluate longer-
term changes, another “after” time period during the spring and summer 2004 was used.
Estimation of public perceptions was based on surveys conducted approximately 6 to 8
months after the introduction of the revised hours of operation.
Occupancy and traffic flow measurements were taken at 11 freeway locations on
SR 167, SR 520, I-90 and I-405 (the corridors affected by the new operations policy).
Only weekday data were processed for this analysis. Public opinion surveys were
distributed on the basis of a sampling of vehicles at selected data collection locations.
The following observations are grouped into four categories: changes in HOV
lane use by SOVs, changes in occupancy compliance in the HOV lane, changes in
freeway performance, and public perceptions.
13 DRAFT

HOV LANE USE BY SINGLE-OCCUPANT VEHICLES (SOVS)
The first set of observations focuses on changes in the use of the HOV lane
following implementation of the new hours of operation. 1. Car occupancy data suggest that SOV travelers in the evening utilized the
new hours of HOV lane operation, though the extent of use varied by location.
Table 4.1 summarizes the results of an analysis of per-car person occupancy in
the HOV lanes during the evening, both before and after the revised hours of operation
began. Specifically, observers counted the percentage of vehicles in the HOV lane that
had one occupant (i.e., SOVs) during the 15-minute periods before and after the
operating hours changed (7:00 PM).
Before the start of the pilot program, when 24-hour HOV–only access was in
effect, the percentage of SOVs illegally using the HOV lane changed only slightly in
most locations after 7:00 PM. (Exceptions were on SR 167 at Auburn, where SOV
percentages have historically been unusually high, and on I-405 southbound at Cedar
Avenue, where a limited data sample was available.)
During the initial two-month period after initiation of the revised hours, an
analysis of per-car person occupancy in the HOV lanes showed that shortly after the
HOV lanes were opened to SOVs each weekday evening at 7:00 PM, the percentage of
vehicles in the HOV lane that were SOVs increased, with the amount varying by
location. Table 4.1 illustrates the average observed percentage of SOVs in the HOV
lane (labeled “After Operational Change (Initial)”) as time advances from the 6:45 PM-
7:00 PM period (only HOVs allowed) to the 7:00 PM-7:15 PM period (all vehicles
allowed) during the two-month “after” period. The SOV percentage in the HOV lane
increased noticeably after 7:00 PM, with the largest increases on SR 167 southbound and
on I-405 southbound near Newcastle. Increased SOV percentages of varying degrees
were seen across all measured locations and travel directions.
14 DRAFT

An analysis of per-car person occupancy in the HOV lanes one year after the
revised hours of operation began showed that the initial pattern of increase in the
percentage of SOVs in the HOV lane after 7:00 PM continued. (See the section of Table
4.1 labeled “After Operational Change (One-Year)”.) In most cases shown in the table,
the number of SOVs in the HOV lane after 7:00 PM versus before 7:00 PM increased by
10 percentage points or greater. The highest observed changes were on I-405
southbound at Newcastle, where the number of SOVs increased from about 7 percent
before 7:00 PM to over 30 percent after 7:00 PM, and on SR 167 southbound at Renton
and Auburn, where the number of SOVs increased by over 20 percentage points after
7:00 PM. The smallest observed changes in SOV percentage after 7:00 PM were on I-
405 southbound at NE 12th, where a limited data sample was available; on SR 167
northbound at Auburn (the northbound direction is opposite to the dominant traffic
direction and, therefore, there is less incentive for SOVs to use the HOV lane); and on I-
90 eastbound at Eastgate, when traffic is typically lighter and there is less need to use the
HOV lane.
Furthermore, the magnitude of the SOV share of HOV lane traffic after 7:00 PM
grew, on average. Initial results two months after the start of the program showed that the
percentage of SOVs in the HOV lane after 7:00 PM was 19 percent or higher at only two
of the 13 HOV locations evaluated. However, after one year of operation, seven of the
13 HOV lane locations evaluated had an SOV percentage of 19 percent or higher after
7:00 PM, while another location with limited data sampling was also above 19 percent.
There was some variability, however; SOVs in four of the 13 locations comprised a
smaller share of HOV traffic in 2004 (one-year) than in 2003 (initial), although two of
those four locations (SR 167 southbound) still saw significant increases.
15 DRAFT

Table 4.1. Percentage of SOVs in HOV Lane by Time of Day
Initial Change (2003)
One-Year Change (2004)
Corridor Location Direction6:45-7:00
PM7:00-7:15
PM Change6:45-7:00
PM7:00-7:15
PM Change6:45-7:00
PM7:00-7:15
PM Change7:00-7:15 PM
Change 7:00-7:15 PM
Change
I-405 NE 160th, Bothell N 1.5% 1.5% 0.0% 1.8% 5.7% 3.9% 4.5% 19.2% 14.7% 4.3% 17.7%I-405 NE 30th St, Newcastle N 0.5% 0.5% 0.0% 3.0% 8.7% 5.7% n/a n/a n/a 8.1% n/aI-405 Cedar Ave, Renton N 1.2% 0.3% -0.9% 0.9% 6.9% 6.0% 5.3% 14.9% 9.6% 6.6% 14.6%I-405 NE 12th St, Bellevue S 4.7% 3.4% -1.3% n/a n/a n/a 1.1% 6.6% 5.5% n/a 3.2%I-405 NE 30th St, Newcastle S 1.6% 8.7% 7.1% 1.5% 16.2% 14.7% 6.6% 30.4% 23.8% 7.5% 21.7%I-405 Cedar Ave, Renton S 1.8% 13.5% 11.7% 3.9% 13.2% 9.4% 8.0% 23.3% 15.3% -0.3% 9.8%I-90 Newport Way, Issaquah E 0.7% 0.8% 0.1% 1.3% 9.6% 8.3% 2.5% 7.2% 4.7% 8.8% 6.4%
SR 167 S 208th St, Renton N 2.6% 0.5% -2.1% 5.5% 14.0% 8.6% 8.1% 23.1% 15.0% 13.5% 22.6%SR 167 37th St. NW, Auburn N 1.8% 1.0% -0.8% 2.8% 10.4% 7.5% 0.0% 2.4% 2.4% 9.4% 1.4%SR 167 S 208th St, Renton S 2.4% 2.0% -0.4% 8.4% 31.7% 23.3% 8.9% 31.0% 22.1% 29.7% 29.0%SR 167 37th St. NW, Auburn S 16.6% 26.9% 10.3% 25.5% 45.1% 19.6% 15.4% 36.4% 21.0% 18.3% 9.5%SR 520 NE 148th, Redmond E 3.8% 5.7% 1.9% 2.0% 12.0% 10.0% 4.9% 19.4% 14.5% 6.3% 13.7%SR 520 NE 148th, Redmond W 3.0% 2.2% -0.8% 7.4% 12.5% 5.1% 8.5% 29.0% 20.5% 10.2% 26.8%
Before Operational Change (2003) After Operational Change (Initial) After Operational Change (One-Year)
16 DRAFT

One result of these changes in SOV use in the HOV lane was that average car
occupancy (ACO) in the HOV lane generally dropped after 7:00 PM following
implementation of the new hours (see Table 4.2). Shortly before the start of the pilot
program, only one of the 13 locations on the table had an average car occupancy below
2.0 after 7:00 PM (the minimum value expected when HOV-only usage is required).
Shortly after the start of the pilot program, five of the 13 locations had an average car
occupancy below 2.0. After one year, eight of the 13 sites had an ACO below 2.0.
As of 2004, the most notable example is on southbound SR 167 at Renton (S.
208th), where the ACO dropped to just under 1.8. (The ACO dropped below 1.7 on SR
167 at Auburn, but this is an atypical case for reasons related to location that will be
described shortly.)
2. The increase in the percentage of SOVs in the HOV lane was accompanied
by increases in the total HOV lane vehicle volumes during the 7:00 to 7:15 PM period (start of the new hours of operation).
In addition to increases in the percentage of SOVs in the HOV lane, as noted
above, before/after comparisons during the 7:00-7:15 PM and the 7:00-8:00 PM periods
showed that total vehicle volumes in the HOV lane at the selected locations consistently
increased as well (see Table 4.2). For the 7:00-7:15 PM time period, every location
showed a higher vehicle volume in the HOV lane shortly after the start of the pilot
program than shortly before the start of the program, with percentage increases in HOV
lane volume ranging from +28 percent on SR 520 westbound near Redmond to +94
percent on SR 167 southbound in Auburn. Furthermore, the trend continued over the
next year, with every location showing further volume increases. Therefore, the increase
in the percentage of SOVs in the HOV lane most likely corresponded to increased SOV
volume, and not to a drop in the number of HOVs relative to the number of SOVs.
17 DRAFT

Table 4.2. ACO and Vehicle Volumes in the HOV Lane HOV Vehicle Volume Trends
Corridor Location Dir. Before (2003)
After (2003)
After (2004)
(%) (number) (%) (number) Before (2003)
After (2003)
After (2004)
I-405 NE 160th, Bothell N 109 159 192 46% 50 76% 83 2.15 2.12 1.96I-405 NE 30th St, Newcastle N 142 215 245 51% 73 73% 103 2.06 2.18 n/aI-405 Cedar Ave, Renton N 130 205 226 58% 75 74% 96 2.17 2.18 1.95I-405 NE 12th St, Bellevue S 128 170 176 33% 42 38% 48 2.13 n/a 2.00I-405 NE 30th St, Newcastle S 203 317 352 56% 114 73% 149 2.09 1.99 1.93I-405 Cedar Ave, Renton S 147 259 316 76% 112 115% 169 2.06 1.99 2.00I-90 Newport Way, Issaquah E 56 77 97 38% 21 73% 41 2.14 2.09 2.16
SR 167 S 208th St, Renton N 94 130 139 38% 36 48% 45 2.35 2.04 1.86SR 167 37th St. NW, Auburn N 66 100 102 52% 34 55% 36 2.22 2.18 2.09SR 167 S 208th St, Renton S 126 213 238 69% 87 89% 112 2.13 1.82 1.79SR 167 37th St. NW, Auburn S 117 227 242 94% 110 107% 125 1.79 1.68 1.64SR 520 NE 148th, Redmond E 51 68 75 33% 17 47% 24 2.11 1.99 1.96SR 520 NE 148th, Redmond W 81 104 115 28% 23 42% 34 2.08 2.04 1.86
HOV Vehicle Volume Trends
Corridor Location Dir.Before (2003)
After (2003)
After (2004) (%) (number) (%) (number)
I-405 NE 160th, Bothell N 366 537 658 47% 171 80% 292I-405 NE 30th St, Newcastle N 526 789 900 50% 263 71% 374I-405 Cedar Ave, Renton N 481 738 839 53% 257 74% 358I-405 NE 12th St, Bellevue S 419 518 583 24% 99 39% 164I-405 NE 30th St, Newcastle S 677 1035 1239 53% 358 83% 562I-405 Cedar Ave, Renton S 499 834 1088 67% 335 118% 589I-90 Newport Way, Issaquah E 181 248 311 37% 67 72% 130
SR 167 S 208th St, Renton N 349 478 524 37% 129 50% 175SR 167 37th St. NW, Auburn N 240 366 387 53% 126 61% 147SR 167 S 208th St, Renton S 462 752 867 63% 290 88% 405SR 167 37th St. NW, Auburn S 416 783 865 88% 367 108% 449SR 520 NE 148th, Redmond E 194 250 283 29% 56 46% 89SR 520 NE 148th, Redmond W 276 357 425 29% 81 54% 149
Overall Vehicle Volume Trends
Corridor Location Dir. Before (2003)
After (2003)
After (2004)
(%) (number) (%) (number)
I-405 NE 160th, Bothell N 3817 4111 4211 8% 294 10% 394I-405 NE 30th St, Newcastle N 2826 3145 3201 11% 319 13% 375I-405 Cedar Ave, Renton N 3478 3889 3987 12% 411 15% 509I-405 NE 12th St, Bellevue S 4730 4903 4753 4% 173 0% 23I-405 NE 30th St, Newcastle S 3536 3867 4019 9% 331 14% 483I-405 Cedar Ave, Renton S 3392 3776 3981 11% 384 17% 589I-90 Newport Way, Issaquah E 2908 2881 3041 -1% -27 5% 133
SR 167 S 208th St, Renton N 2243 2461 2539 10% 218 13% 296SR 167 37th St. NW, Auburn N 2026 2243 2278 11% 217 12% 252SR 167 S 208th St, Renton S 3132 3307 3514 6% 175 12% 382SR 167 37th St. NW, Auburn S 2901 3122 3158 8% 221 9% 257SR 520 NE 148th, Redmond E 1695 1745 1773 3% 50 5% 78SR 520 NE 148th, Redmond W 2210 2250 2243 2% 40 1% 33
2003 Volume Change
Vehicle Volume
Vehicle Volume
All Lanes Combined (7:00-8:00 PM)2004 Volume
Change
2004 Volume Change
HOV Lane (7:00-7:15 PM)
2004 Volume Change
HOV Lane (7:00-8:00 PM)
ACO
2003 Volume Change
2003 Volume Change
Vehicle Volume
18 DRAFT

3. The percentage of all vehicles that used the HOV lane after 7:00 PM increased, but the magnitude varied noticeably by location.
Table 4.3 summarizes the percentage of all vehicle traffic that used the HOV lane
during two time periods (spring and summer) during each of the past three years (2002,
2003, 2004). Looking at the 2003 values, the share of traffic in the HOV lane was
higher during the 7:00 to 7:30 PM time period following the implementation of revised
hours (summer) than it was just before implementation (spring), but the amounts varied
considerably by location. Southbound locations on SR 167 and locations on I-405
between Renton and Bellevue showed the largest increases in vehicle use of the HOV
lane shortly after the 7:00 PM change in 2003.
A comparison of the same two periods (spring and summer) during 2002 and
2004 provide a better understanding of any seasonal trends that would normally be
present. Note that during the same two periods in the year 2002 the HOV lane’s share
of all traffic increased without any revised hours of operation; however, the magnitude of
the 2002 change was smaller than the corresponding change in 2003. A similar seasonal
pattern was seen in 2004; here also, the magnitude was smaller than that seen in 2003, the
year during which the pilot program was first implemented.
19 DRAFT

Table 4.3. Share of Traffic in the HOV Lane during Weekdays (7:00-7:30 PM)
Spring Traffic (7:00-7:30 PM)
NB/EB SB/WB NB/EB SB/WB NB/EB SB/WB
SR 167 S 208th St, Renton 22.92 19.7% 23.4% 15.8% 14.9% 16.2% 15.0%SR 167 37th St. NW, Auburn 17.37 15.2% 26.0% 12.3% 14.5% 12.4% 16.4%SR 520 NE 148th, Redmond 9.2 14.8% 17.9% 11.1% 12.6% 11.5% 11.4%I-90 Newport Way, Issaquah 13.44 9.9% 9.5% 6.5% 8.5% 7.3% 9.1%I-405 NE 160th, Bothell 22.46 16.5% 14.7% 9.9% 11.3% 10.1% 10.2%I-405 NE 12th St, Bellevue 14.25 10.3% 12.9% 8.1% 9.4% 7.7% 9.2%I-405 NE 30th St, Newcastle 6.52 25.5% 30.5% 18.8% 20.3% 19.4% 20.0%I-405 112th SE, Newcastle 8.92 23.5% 30.4% 17.5% 20.5% 17.7% 20.1%I-405 Cedar Ave, Renton 3.57 18.3% 23.0% 14.0% 15.8% 15.3% 16.6%
Summer Traffic (7:00-7:30 PM)
NB/EB SB/WB NB/EB SB/WB NB/EB SB/WBSR 167 S 208th St, Renton 22.92 20.7% 25.2% 19.7% 23.4% 16.7% 17.2%SR 167 37th St. NW, Auburn 17.37 17.1% 28.3% 16.7% 26.1% 14.7% 19.0%SR 520 NE 148th, Redmond 9.2 15.7% 18.8% 14.3% 16.0% 12.2% 12.8%I-90 Newport Way, Issaquah 13.44 10.8% 10.8% 9.0% 10.7% 8.7% 10.5%I-405 NE 160th, Bothell 22.46 16.6% 16.7% 13.7% 14.0% 11.7% 12.7%I-405 NE 12th St, Bellevue 14.25 11.2% 13.4% 10.3% 12.0% 9.1% 10.5%I-405 NE 30th St, Newcastle 6.52 28.6% 32.2% 25.5% 28.4% 22.1% 23.4%I-405 112th SE, Newcastle 8.92 25.9% 32.1% 23.2% 28.9% 20.1% 24.2%I-405 Cedar Ave, Renton 3.57 21.7% 29.5% 19.3% 24.2% 17.8% 24.4%
NB/EB SB/WB NB/EB SB/WB NB/EB SB/WBSR 167 S 208th St, Renton 22.92 1.0% 1.8% 3.9% 8.5% 0.5% 2.2%SR 167 37th St. NW, Auburn 17.37 1.9% 2.3% 4.4% 11.6% 2.3% 2.6%SR 520 NE 148th, Redmond 9.2 0.9% 0.9% 3.2% 3.4% 0.7% 1.4%I-90 Newport Way, Issaquah 13.44 0.9% 1.3% 2.5% 2.1% 1.3% 1.3%I-405 NE 160th, Bothell 22.46 0.1% 2.0% 3.7% 2.7% 1.6% 2.5%I-405 NE 12th St, Bellevue 14.25 0.9% 0.5% 2.2% 2.6% 1.4% 1.3%I-405 NE 30th St, Newcastle 6.52 3.2% 1.7% 6.7% 8.1% 2.8% 3.4%I-405 112th SE, Newcastle 8.92 2.4% 1.7% 5.6% 8.4% 2.4% 4.1%I-405 Cedar Ave, Renton 3.57 3.3% 6.5% 5.3% 8.5% 2.5% 7.9%
Change in HOV Lane share (Summer vs. Spring)2004 2003 2002
Share of All Traffic Using HOV Lane (July-September)2004 2003 2002Corridor Location Mile
Post
Corridor Location Mile Post
Corridor LocationMile Post
2003 2002
Share of All Traffic Using HOV Lane (April-June)
2004
20 DRAFT
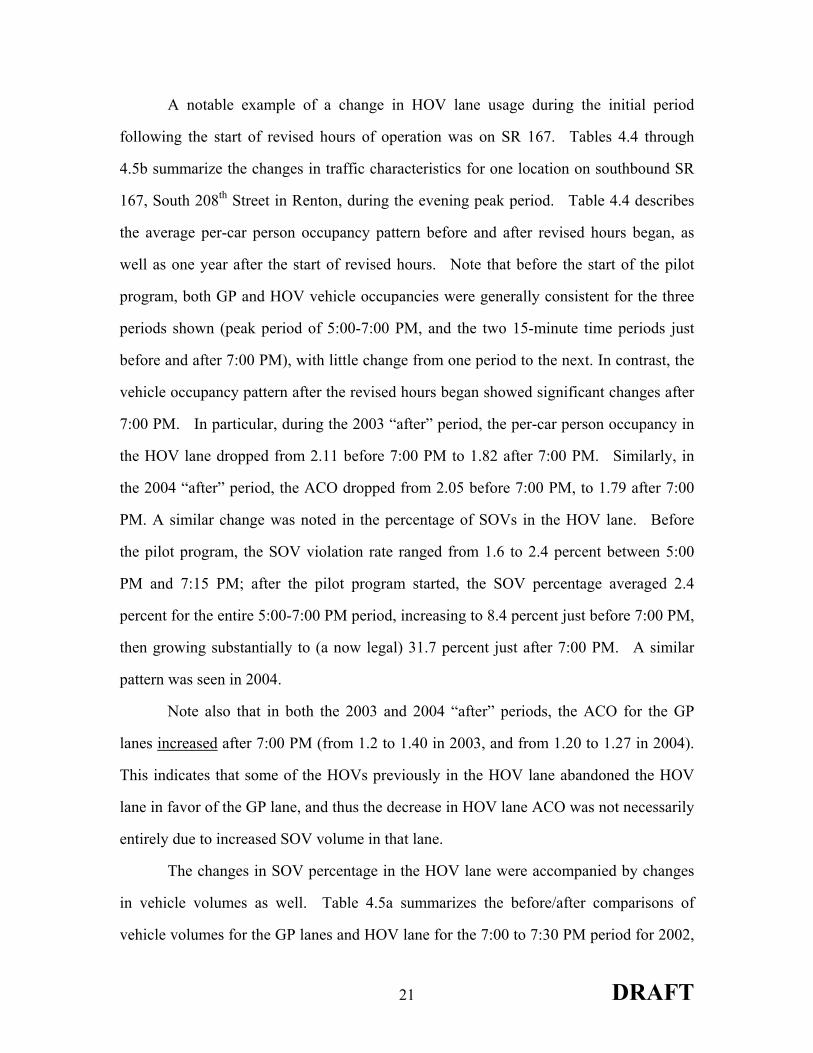
A notable example of a change in HOV lane usage during the initial period
following the start of revised hours of operation was on SR 167. Tables 4.4 through
4.5b summarize the changes in traffic characteristics for one location on southbound SR
167, South 208th Street in Renton, during the evening peak period. Table 4.4 describes
the average per-car person occupancy pattern before and after revised hours began, as
well as one year after the start of revised hours. Note that before the start of the pilot
program, both GP and HOV vehicle occupancies were generally consistent for the three
periods shown (peak period of 5:00-7:00 PM, and the two 15-minute time periods just
before and after 7:00 PM), with little change from one period to the next. In contrast, the
vehicle occupancy pattern after the revised hours began showed significant changes after
7:00 PM. In particular, during the 2003 “after” period, the per-car person occupancy in
the HOV lane dropped from 2.11 before 7:00 PM to 1.82 after 7:00 PM. Similarly, in
the 2004 “after” period, the ACO dropped from 2.05 before 7:00 PM, to 1.79 after 7:00
PM. A similar change was noted in the percentage of SOVs in the HOV lane. Before
the pilot program, the SOV violation rate ranged from 1.6 to 2.4 percent between 5:00
PM and 7:15 PM; after the pilot program started, the SOV percentage averaged 2.4
percent for the entire 5:00-7:00 PM period, increasing to 8.4 percent just before 7:00 PM,
then growing substantially to (a now legal) 31.7 percent just after 7:00 PM. A similar
pattern was seen in 2004.
Note also that in both the 2003 and 2004 “after” periods, the ACO for the GP
lanes increased after 7:00 PM (from 1.2 to 1.40 in 2003, and from 1.20 to 1.27 in 2004).
This indicates that some of the HOVs previously in the HOV lane abandoned the HOV
lane in favor of the GP lane, and thus the decrease in HOV lane ACO was not necessarily
entirely due to increased SOV volume in that lane.
The changes in SOV percentage in the HOV lane were accompanied by changes
in vehicle volumes as well. Table 4.5a summarizes the before/after comparisons of
vehicle volumes for the GP lanes and HOV lane for the 7:00 to 7:30 PM period for 2002,
21 DRAFT

2003, and 2004. (“Spring” and “Summer” refer to the same spring and summer months
used in Table 4.3; for 2003, they thus correspond to the time periods before and after the
implementation of revised hours of operation.) Looking at the HOV vehicle volume
trends, one can see that the number of vehicles in the HOV lane grew by over 66 percent
after the pilot program began. The analysis of 2002 HOV data for the same time periods
showed that seasonal differences alone would produce an expected increase of 19
percent. The rest of the 66 percent increase is presumed to be the result of the new
operating hours policy. The share of all traffic using the HOV lane grew from 15 percent
to over 23 percent shortly after the pilot program began; this is also greater than one
would expect, given seasonal changes in the 2002 data. Meanwhile, the total (GP+HOV)
directional roadway volume increased by over 5 percent.
These initial patterns were sustained over the following year. Note that HOV
volumes continued to increase in 2004, and the HOV lane share of 23 percent was
maintained and slightly increased in 2004. At the same time, the large increases in HOV
usage and lane share of 2003 did not occur to the same extent in 2004, further reinforcing
the idea that the changes in operational policy that occurred only in 2003 had a
significant role in these trends.
While this change in HOV lane use was occurring after 7:00 PM, it must be noted
(as can be seen in Table 4.5b) that while the HOV volume during the 5:00-7:00 PM peak
period rose by about 10 percent after the start of the pilot program in 2003, this increase
was actually less than the over 13 percent growth in PM peak period HOV volumes
observed in comparison to the same periods the year before or the year after.
While volumes were increasing in the HOV lane, including a significant number
of SOVs, the distribution of vehicles by lane also changed. Overall, the average volume
distribution for this location changed from 19-42-39 percent (left HOV lane, middle GP
lane, and right GP lane respectively) before 7:00 PM to 25-37-38 percent after 7:00 PM
(see Table 4.6). Figure 4.1 shows the distribution of vehicles on each lane for the 6:30
22 DRAFT

to 7:00 PM period for each weekday for a two-month period in 2004 (thus reflecting the
revised hours of operation). Figure 4.2 shows the corresponding data for the 7:00 to 7:30
PM period. A comparison of these graphs illustrates the increase in HOV lane use after
7:00 PM. Note also the definite day-of-week trend apparent in these graphs. The data
show a distinct increase in HOV lane use before 7:00 PM on Fridays. It is not clear
from the current analysis whether the cause is a greater number of HOV eligible vehicles
(e.g., couples headed out together on Friday night) or an increase in violations.
A second example of a change in HOV lane usage during the initial period
following the start of revised hours of operation was on I-405. Table 4.7 summarizes
the changes in traffic characteristics for one location on southbound I-405, at NE 30th
Street near Newcastle, during the evening peak period. The table describes the average
per-car person occupancy pattern before and after the revised hours policy began, as well
as one year after the start of revised hours. In comparison to the previous example of
SR 167, there was somewhat more variability in the GP and HOV vehicle occupancy,
especially shortly after the 5:00-7:00 PM peak period. However, after the hours were
revised, a change similar to that on SR 167 occurred. HOV vehicle occupancy dropped
from 2.12 before 7:00 PM to 1.99 shortly after 7:00 PM. After one year of operation,
the drop was larger, going from a 2.22 average vehicle occupancy before 7:00 PM to 1.93
shortly after 7:00 PM. The percentage of SOVs in the HOV lane also showed a
significant increase after 7:00 PM once the new hours began, increasing from 1.5 percent
before 7:00 PM to 16.2 percent after 7:00 PM in the initial 2003 before/after period, and
from 6.6 percent before 7:00 PM to 30.4 percent after 7:00 PM in 2004.
23 DRAFT

Table 4.4. Changes in ACO (SR 167 SB at S. 208th St, Renton)
ACO Before After (2003) After (2004) Before After (2003) After (2004) Before After (2003) After (2004)GP 1.22 1.20 1.14 1.20 1.19 1.20 1.22 1.40 1.27HOV 2.18 2.17 2.14 2.21 2.11 2.05 2.13 1.82 1.79SOV % in HOV lane 1.6% 2.4% 4.0% 2.4% 8.4% 8.9% 2.0% 31.7% 31.0%
7 to 7:15 PM5-7 PM 6:45 to 7 PM
Table 4.5a. Changes in Vehicle Volumes during 7:00-7:30 PM (SR 167 SB at S. 208th St, Renton)
HOV Lane Share2004 2003 2002 2004 2003 2002 2004 2003 2002 2004 2003 2002
Spring 1762 1664 1671 1350 1416 1421 412 248 250 23.4% 14.9% 15.0%Summer 1849 1757 1738 1383 1345 1439 466 412 299 25.2% 23.4% 17.2%Volume change 87 93 67 33 -71 18 54 164 49%change 4.9% 5.6% 4.0% 2.4% -5.0% 1.3% 13.1% 66.1% 19.6%
Vehicle Volume (7-7:30 PM)
GP HOVTotal
Table 4.5b. Changes in Vehicle Volumes during 5:00-7:00 PM (SR 167 SB at S. 208th St, Renton)
HOV Lane Share2004 2003 2002 2004 2003 2002 2004 2003 2002 2004 2003 2002
Spring 8146 8220 8200 6648 6725 6525 1498 1495 1675 18.4% 18.2% 20.4%Summer 8348 8160 8140 6649 6520 6235 1699 1640 1905 20.4% 20.1% 23.4%Volume change 202 -60 -60 1 -205 -290 201 145 230%change 2.5% -0.7% -0.7% 0.0% -3.0% -4.4% 13.4% 9.7% 13.7%
HOVVehicle Volume (5-7 PM)
Total GP
Table 4.6. Vehicle Volume Distribution (SR 167 SB at S. 208th St, Renton)
July-August 2004Average Average Average Average
Number of % of all Number of % of allVehicles Vehicles Vehicles Vehicles
L1 = right GP lane 762 38.9% 709 38.3%L2 = left GP lane 827 42.2% 674 36.5%HOV = inside HOV lane 371 18.9% 466 25.2%
6:30 - 7:00 PM 7:00-7:30 PM
24 DRAFT

Vehicle Distribution (7/1/04-8/31/04)SR 167 @ S 204th St
18:30-19:00
0%
5%
10%
15%
20%
25%
30%
35%
40%
45%
50%
07/0
1/04
(Thu
)
07/0
9/04
(Fri)
07/1
6/04
(Fri)
07/2
3/04
(Fri)
07/3
0/04
(Fri)
08/0
6/04
(Fri)
08/1
3/04
(Fri)
08/2
0/04
(Fri)
08/2
7/04
(Fri)
Vehi
cle
Dis
trib
utio
n
L1 L2HOV
Figure 4.1. Distribution of Vehicles by Lane (6:30-7:00PM)
Vehicle Distribution (7/1/04-8/31/04)SR 167 @ S 204th St
19:00-19:30
0%
5%
10%
15%
20%
25%
30%
35%
40%
45%
50%
07/0
1/04
(Thu
)
07/0
9/04
(Fri)
07/1
6/04
(Fri)
07/2
3/04
(Fri)
07/3
0/04
(Fri)
08/0
6/04
(Fri)
08/1
3/04
(Fri)
08/2
0/04
(Fri)
08/2
7/04
(Fri)
Vehi
cle
Dis
trib
utio
n
L1 L2HOV
Figure 4.2. Distribution of Vehicles by Lane (7:00-7:30PM)
25 DRAFT

Table 4.7. Volume Distribution (I-405 at NE 30th in Newcastle, southbound)
ACO Before After (2003) After (2004) Before After (2003) After (2004) Before After (2003) After (2004)GP 1.08 n/a 1.1 1.16 n/a 1.09 1.26 n/a 1.02HOV 2.16 2.15 2.26 2.19 2.12 2.22 2.09 1.99 1.93SOV % in HOV lane 0.9% 0.6% 3.2% 1.6% 1.5% 6.6% 8.7% 16.2% 30.4%
5-7 PM 6:45 to 7 PM 7 to 7:15 PM
26 DRAFT

HOV LANE COMPLIANCE BY SINGLE-OCCUPANT VEHICLES
Another area of interest is the extent to which use of the HOV lane by SOVs
occurs during hours when the HOV-only policy is in effect (5:00 AM to 7:00 PM). 4. SOV violation rates during the PM shoulder period did not change
significantly in most cases.
During the initial two-month period after the start of revised hours, a before-after
comparison during the period leading up to the start of open access to the HOV lanes
(6:45 to 7:00 PM) showed that the percentage of vehicles violating the HOV-only policy
did increase somewhat, possibly in anticipation of the 7:00 PM start of general HOV lane
use, though in most locations the difference was 3 percentage points or less (see Table
4.8). While the change was small at most locations (and sometimes statistically
insignificant), nine of the 12 locations with valid data did show an increase in violations
just before the 7:00 PM relaxation of the HOV eligibility rules. However, three of those
eight locations had an increase in violation rate of less than 1 percentage point. Overall,
only four of 12 locations had an “after” violation rate above 5 percent, and none were
above 9 percent, except one outlier location that will be discussed shortly.
After one year, the percentage of vehicles violating the HOV-only policy during
the 6:45 to 7:00 PM period had increased somewhat. Seven of the 12 locations had
violation rates above 5 percent, though none was above 9 percent except one outlier.
The highest overall violation rates of the sites analyzed were at SR 167 in Auburn and
Renton (southbound) and at SR 520 westbound at Overlake. (I-405 southbound at
Cedar Avenue and SR 167 northbound in Renton had similar values, but they were based
on limited data sampling.)
The most significant outlier to the pattern of SOV violation rates was SR 167
southbound in Auburn in the evening transition period, with a 9 percentage point increase
in the violation rate shortly after the start of the revised hours of operation (from 16.6 to
27 DRAFT

25.5 percent). This location is near the edge of the HOV lane network (the HOV lane
stops about 1 mile downstream from this site), and the direction of travel is outbound
toward the end of the HOV network. Locations near the end of HOV facilities
traditionally have the highest violation rates, as can be seen by the very high initial
violation rate of over 16 percent at this site. Consequently, the fact that the largest
increase in violations would occur at such a location is perhaps not surprising. Note,
though, that the rate dropped back to pre-pilot program levels in 2004.
This result does highlight the concern expressed by some Puget Sound Regional
Council HOV Committee members before the demonstration project began that high
violation rates tend to foster even more violations. That is, when violation rates are low,
drivers are reluctant to violate because they stand out. But as violation rates increase,
more and more drivers lose their reluctance to violate, thus dramatically increasing
violation rates. The fact that the largest increase in violation rates occurred at the site
that already had the highest violation rate before the demonstration began tends to
support this concern and warrants additional study as the demonstration progresses.
28 DRAFT

Table 4.8. SOVs in the HOV lane, AM and PM
PM
Corridor Location Dir Before After (2003) Initial SOV Shift
After (2004) One-Year SOV Shift
I-405 NE 160th, Bothell N 1.5% 1.8% 0.3% 4.5% 3.0%I-405 NE 30th St, Newcastle N 0.5% 3.0% 2.5% n/a n/aI-405 Cedar Ave, Renton N 1.2% 0.9% -0.3% 5.3% 4.1%I-405 NE 12th St, Bellevue S 4.7% n/a n/a 1.1% -3.6%I-405 NE 30th St, Newcastle S 1.6% 1.5% -0.1% 6.6% 5.0%I-405 Cedar Ave, Renton S 1.8% 3.9% 2.0% 8.0% 6.2%I-90 Newport Way, Issaquah E 0.7% 1.3% 0.7% 2.5% 1.9%
SR 167 S 208th St, Renton N 2.6% 5.5% 2.9% 8.1% 5.5%SR 167 37th St. NW, Auburn N 1.8% 2.8% 1.0% 0.0% -1.8%SR 167 S 208th St, Renton S 2.4% 8.4% 6.0% 8.9% 6.5%SR 167 37th St. NW, Auburn S 16.6% 25.5% 8.9% 15.4% -1.2%SR 520 NE 148th, Redmond E 3.8% 2.0% -1.8% 4.9% 1.1%SR 520 NE 148th, Redmond W 3.0% 7.4% 4.4% 8.5% 5.5%
AM
Corridor Location Dir (before) After (2003)Initial SOV
Shift After (2004)One-Year SOV
ShiftI-405 NE 160th, Bothell S 2.5% 2.7% 0.1% 0.8% -1.7%I-405 112th SE, Newcastle N 5.6% 4.2% -1.4% 9.0% 3.4%I-405 Cedar Ave, Renton N 2.6% 3.2% 0.6% 3.4% 0.8%I-405 NE 12th St, Bellevue S 4.4% n/a n/a 8.4% 4.0%I-405 NE 30th St, Newcastle S 3.2% 3.3% 0.1% n/a n/aI-405 Cedar Ave, Renton S 1.3% n/a n/a 0.9% -0.4%I-90 Newport Way, Issaquah W 5.3% 1.6% -3.6% 6.7% 1.5%
SR 167 S 208th St, Renton N 7.1% 2.6% -4.5% 3.9% -3.2%SR 167 37th St. NW, Auburn N 5.1% 1.7% -3.5% 3.5% -1.6%SR 167 S 208th St, Renton S 7.5% 4.5% -3.0% 2.9% -4.6%SR 167 37th St. NW, Auburn S 25.6% 16.5% -9.1% 30.3% 4.8%SR 520 NE 148th, Redmond E 1.4% 3.6% 2.2% 6.2% 4.8%SR 520 NE 148th, Redmond W 6.4% 7.3% 0.8% 2.3% -4.1%
6:45-7:00PM
5:00-7:00AM
29 DRAFT

5. SOV violation rates during the AM peak period did not change significantly in most cases.
The initial 2003 before-after comparison of SOV violation rates during the 5:00
AM to 7:00 AM period (i.e., following the 5:00 AM resumption of HOV-only access)
showed that the SOV violation rate either decreased or only increased modestly (less than
1 percentage point). In only one case (SR 520 at Overlake eastbound) did the violation
rate increase by more than 1 percentage point (from 1.4 percent to 3.6 percent), while in
several cases marked decreases in violation rates occurred (see Table 4.8). After one
year of operation, overall SOV violation rates had increased somewhat more, with five
locations having increases in their violation rates of more than 1 percentage point. The
highest increase was at SR 167 southbound at 37th Street NW, a location that historically
has high violation rates. Other locations saw violation rates increase by between 1.5 and
4.8 percentage points.
The amount of the one-year increase was several percentage points at most, and
half of the locations continued to show a drop in the SOV violation rate after one year of
operation; nevertheless, the one-year condition does represent a slight overall increase in
AM violation rates over the initial before/after comparison. While the data were not
conclusive, the pattern of increases relative to initial 2003 results could reflect the
increased awareness and legal use of the HOV lane by SOVs in the evening hours after
7:00 PM, followed by some “spillover” of those SOVs past 5:00 AM when the HOV-
only requirement is again in effect.
GP AND HOV LANE PERFORMANCE
Data were collected to analyze the extent to which open access to the HOV lane
during the revised hours of operation affected GP and HOV traffic performance. 6. Based on the initial and one-year (2004) data set, overall weekday freeway
performance characteristics generally did not change significantly. HOV lane volumes increased noticeably just after 7:00 PM at some locations.
30 DRAFT

In general, before/after comparisons did not show a significant change in freeway
performance at the measurement locations in terms of the general 24-hour pattern of
average speed, volume, and frequency of congestion. Figures 4.3 through 4.28 show the
average 24-hour GP and HOV performance graphs (overlaying 2003 “before” and 2004
“after” data) for each location. In the graphs, the overall characteristics of the before
and after patterns are usually similar to one another, though there can be differences
depending on time of day.2 A comparison of the patterns for the period of interest,
namely the PM peak period and the transition after 7:00 PM, shows that there were
changes in usage (vehicle volume) in the HOV lane at some locations, consistent with the
volume increases noted previously. Locations on SR 167 southbound showed the most
notable change in freeway usage, primarily in HOV volumes, which increased noticeably
immediately after 7:00 PM; some locations on I-405 and SR 520 also showed HOV
volume increases. Performance changes after 7:00 PM in terms of speed and congestion
were difficult to determine from these graphs alone, however (see observation #7 for
further discussion on this issue).
Interestingly, several HOV lane locations on SR 167 and I-405 northbound
showed volume increases beginning some time after 4:00 AM, followed by noticeable
volume drops around 5:00 AM. While the data are not conclusive, this could represent
SOVs using the HOV lane before 5:00 AM, then changing to the GP lanes at the
approach or start of 5:00 AM HOV-only operations.
2 Each figure displays two types of measures for each site: 1) a line curve showing average total vehicle volume by time of day, on an equivalent per-hour basis (use the vehicles/hour scale on the left axis of the figure) and 2) a graph showing the likelihood of encountering congestion (use the 0 to 100 percent probability scale on the right axis). The color lines are “before” conditions, while the black lines are “after” conditions. In addition, the “before” volume curve shows the average approximate “before” speed condition by time of day, using green for 55 mph and above, yellow for 45 to 55 mph, and red for less than 45 mph.
31 DRAFT

SR-167 43rd St NW GP NB
0
500
1000
1500
2000
2500
3000
3500
4000
4500
5000
12 AM 2 AM 4 AM 6 AM 8 AM 10 AM 12 PM 2 PM 4 PM 6 PM 8 PM 10 PM
Vehi
cles
Per
Hou
r (VP
H)
0
10
20
30
40
50
60
70
80
90
100
Con
gest
ion
Freq
uenc
y (%
)
Estimated Volume, Speed, and Reliability Conditions (2003-04)
Before (Spr.2003): ColorAfter (Spr. 2004): Black
Figure 4.3. SR 167 NB near Auburn, GP
SR-167 43rd St NW HOV NB
0
500
1000
1500
2000
2500
3000
3500
4000
4500
5000
12 AM 2 AM 4 AM 6 AM 8 AM 10 AM 12 PM 2 PM 4 PM 6 PM 8 PM 10 PM
Vehi
cles
Per
Hou
r (VP
H)
0
10
20
30
40
50
60
70
80
90
100
Con
gest
ion
Freq
uenc
y (%
)
Estimated Volume, Speed, and Reliability Conditions (2003-04)
Before (Spr.2003): ColorAfter (Spr. 2004): Black
Figure 4.4. SR 167 NB near Auburn, HOV
32 DRAFT

SR-167 43rd St NW GP SB
0
500
1000
1500
2000
2500
3000
3500
4000
4500
5000
12 AM 2 AM 4 AM 6 AM 8 AM 10 AM 12 PM 2 PM 4 PM 6 PM 8 PM 10 PM
Vehi
cles
Per
Hou
r (VP
H)
0
10
20
30
40
50
60
70
80
90
100
Con
gest
ion
Freq
uenc
y (%
)
Estimated Volume, Speed, and Reliability Conditions (2003-04)
Before (Spr.2003): ColorAfter (Spr. 2004): Black
Figure 4.5. SR 167 SB near Auburn, GP
SR-167 43rd St NW HOV SB
0
500
1000
1500
2000
2500
3000
3500
4000
4500
5000
12 AM 2 AM 4 AM 6 AM 8 AM 10 AM 12 PM 2 PM 4 PM 6 PM 8 PM 10 PM
Vehi
cles
Per
Hou
r (VP
H)
0
10
20
30
40
50
60
70
80
90
100
Con
gest
ion
Freq
uenc
y (%
)
Estimated Volume, Speed, and Reliability Conditions (2003-04)
Before (Spr.2003): ColorAfter (Spr. 2004): Black
Figure 4.6. SR 167 SB near Auburn, HOV
33 DRAFT

SR-167 S 204th St GP NB
0
500
1000
1500
2000
2500
3000
3500
4000
4500
5000
12 AM 2 AM 4 AM 6 AM 8 AM 10 AM 12 PM 2 PM 4 PM 6 PM 8 PM 10 PM
Vehi
cles
Per
Hou
r (VP
H)
0
10
20
30
40
50
60
70
80
90
100
Con
gest
ion
Freq
uenc
y (%
)
Estimated Volume, Speed, and Reliability Conditions (2003-04)
Before (Spr.2003): ColorAfter (Spr. 2004): Black
Figure 4.7. SR 167 NB near Renton, GP
SR-167 S 204th St HOV NB
0
500
1000
1500
2000
2500
3000
3500
4000
4500
5000
12 AM 2 AM 4 AM 6 AM 8 AM 10 AM 12 PM 2 PM 4 PM 6 PM 8 PM 10 PM
Vehi
cles
Per
Hou
r (VP
H)
0
10
20
30
40
50
60
70
80
90
100
Con
gest
ion
Freq
uenc
y (%
)
Estimated Volume, Speed, and Reliability Conditions (2003-04)
Before (Spr.2003): ColorAfter (Spr. 2004): Black
Figure 4.8. SR 167 NB near Renton, HOV
34 DRAFT

SR-167 S 204th St GP SB
0
500
1000
1500
2000
2500
3000
3500
4000
4500
5000
12 AM 2 AM 4 AM 6 AM 8 AM 10 AM 12 PM 2 PM 4 PM 6 PM 8 PM 10 PM
Vehi
cles
Per
Hou
r (VP
H)
0
10
20
30
40
50
60
70
80
90
100
Con
gest
ion
Freq
uenc
y (%
)
Estimated Volume, Speed, and Reliability Conditions (2003-04)
Before (Spr.2003): ColorAfter (Spr. 2004): Black
Figure 4.9. SR 167 SB near Renton, GP
SR-167 S 204th St HOV SB
0
500
1000
1500
2000
2500
3000
3500
4000
4500
5000
12 AM 2 AM 4 AM 6 AM 8 AM 10 AM 12 PM 2 PM 4 PM 6 PM 8 PM 10 PM
Vehi
cles
Per
Hou
r (VP
H)
0
10
20
30
40
50
60
70
80
90
100
Con
gest
ion
Freq
uenc
y (%
)
Estimated Volume, Speed, and Reliability Conditions (2003-04)
Before (Spr.2003): ColorAfter (Spr. 2004): Black
Figure 4.10. SR 167 SB near Renton, HOV
35 DRAFT

SR-520 148th Ave NE- GP WB
0
500
1000
1500
2000
2500
3000
3500
4000
4500
5000
12 AM 2 AM 4 AM 6 AM 8 AM 10 AM 12 PM 2 PM 4 PM 6 PM 8 PM 10 PM
Vehi
cles
Per
Hou
r (VP
H)
0
10
20
30
40
50
60
70
80
90
100
Con
gest
ion
Freq
uenc
y (%
)
Estimated Volume, Speed, and Reliability Conditions (2003-04)
Before (Spr.2003): ColorAfter (Spr. 2004): Black
Figure 4.11. SR 520 WB near Redmond, GP
SR-520 148th Ave NE- HOV WB
0
500
1000
1500
2000
2500
3000
3500
4000
4500
5000
12 AM 2 AM 4 AM 6 AM 8 AM 10 AM 12 PM 2 PM 4 PM 6 PM 8 PM 10 PM
Vehi
cles
Per
Hou
r (VP
H)
0
10
20
30
40
50
60
70
80
90
100
Con
gest
ion
Freq
uenc
y (%
)
Estimated Volume, Speed, and Reliability Conditions (2003-04)
Before (Spr.2003): ColorAfter (Spr. 2004): Black
Figure 4.12. SR 520 WB near Redmond, HOV
36 DRAFT

SR-520 148th Ave NE- GP EB
0
500
1000
1500
2000
2500
3000
3500
4000
4500
5000
12 AM 2 AM 4 AM 6 AM 8 AM 10 AM 12 PM 2 PM 4 PM 6 PM 8 PM 10 PM
Vehi
cles
Per
Hou
r (VP
H)
0
10
20
30
40
50
60
70
80
90
100
Con
gest
ion
Freq
uenc
y (%
)
Estimated Volume, Speed, and Reliability Conditions (2003-04)
Before (Spr.2003): ColorAfter (Spr. 2004): Black
Figure 4.13. SR 520 EB near Redmond, GP
SR-520 148th Ave NE- HOV EB
0
500
1000
1500
2000
2500
3000
3500
4000
4500
5000
12 AM 2 AM 4 AM 6 AM 8 AM 10 AM 12 PM 2 PM 4 PM 6 PM 8 PM 10 PM
Vehi
cles
Per
Hou
r (VP
H)
0
10
20
30
40
50
60
70
80
90
100
Con
gest
ion
Freq
uenc
y (%
)
Estimated Volume, Speed, and Reliability Conditions (2003-04)
Before (Spr.2003): ColorAfter (Spr. 2004): Black
Figure 4.14. SR 520 EB near Redmond, HOV
37 DRAFT

I-405 S 3rd St GP N
0
500
1000
1500
2000
2500
3000
3500
4000
4500
5000
12 AM 2 AM 4 AM 6 AM 8 AM 10 AM 12 PM 2 PM 4 PM 6 PM 8 PM 10 PM
Vehi
cles
Per
Hou
r (VP
H)
0
10
20
30
40
50
60
70
80
90
100
Con
gest
ion
Freq
uenc
y (%
)
Estimated Volume, Speed, and Reliability Conditions (2003-04)
Before (Spr.2003): ColorAfter (Spr. 2004): Black
Figure 4.15. I-405 NB near Renton, GP
I-405 S 3rd St HOV NB
0
500
1000
1500
2000
2500
3000
3500
4000
4500
5000
12 AM 2 AM 4 AM 6 AM 8 AM 10 AM 12 PM 2 PM 4 PM 6 PM 8 PM 10 PM
Vehi
cles
Per
Hou
r (VP
H)
0
10
20
30
40
50
60
70
80
90
100
Con
gest
ion
Freq
uenc
y (%
)
Estimated Volume, Speed, and Reliability Conditions (2003-04)
Before (Spr.2003): ColorAfter (Spr. 2004): Black
Figure 4.16. I-405 NB near Renton, HOV
38 DRAFT

I-405 S 3rd St GP SB
0
500
1000
1500
2000
2500
3000
3500
4000
4500
5000
12 AM 2 AM 4 AM 6 AM 8 AM 10 AM 12 PM 2 PM 4 PM 6 PM 8 PM 10 PM
Vehi
cles
Per
Hou
r (VP
H)
0
10
20
30
40
50
60
70
80
90
100
Con
gest
ion
Freq
uenc
y (%
)
Estimated Volume, Speed, and Reliability Conditions (2003-04)
Before (Spr.2003): ColorAfter (Spr. 2004): Black
Figure 4.17. I-405 SB near Renton, GP
I-405 S 3rd St HOV SB
0
500
1000
1500
2000
2500
3000
3500
4000
4500
5000
12 AM 2 AM 4 AM 6 AM 8 AM 10 AM 12 PM 2 PM 4 PM 6 PM 8 PM 10 PM
Vehi
cles
Per
Hou
r (VP
H)
0
10
20
30
40
50
60
70
80
90
100
Con
gest
ion
Freq
uenc
y (%
)
Estimated Volume, Speed, and Reliability Conditions (2003-04)
Before (Spr.2003): ColorAfter (Spr. 2004): Black
Figure 4.18. I-405 SB near Renton, HOV
39 DRAFT

I-405 NE 30th St-NB GP NB
0
500
1000
1500
2000
2500
3000
3500
4000
4500
5000
12 AM 2 AM 4 AM 6 AM 8 AM 10 AM 12 PM 2 PM 4 PM 6 PM 8 PM 10 PM
Vehi
cles
Per
Hou
r (VP
H)
0
10
20
30
40
50
60
70
80
90
100
Con
gest
ion
Freq
uenc
y (%
)
Estimated Volume, Speed, and Reliability Conditions (2003-04)
Before (Spr.2003): ColorAfter (Spr. 2004): Black
Figure 4.19. I-405 NB near Newcastle, GP
I-405 NE 30th St-NB HOV NB
0
500
1000
1500
2000
2500
3000
3500
4000
4500
5000
12 AM 2 AM 4 AM 6 AM 8 AM 10 AM 12 PM 2 PM 4 PM 6 PM 8 PM 10 PM
Vehi
cles
Per
Hou
r (VP
H)
0
10
20
30
40
50
60
70
80
90
100
Con
gest
ion
Freq
uenc
y (%
)
Estimated Volume, Speed, and Reliability Conditions (2003-04)
Before (Spr.2003): ColorAfter (Spr. 2004): Black
Figure 4.20. I-405 NB near Newcastle, HOV
40 DRAFT

I-405 NE 30th St-SB GP SB
0
500
1000
1500
2000
2500
3000
3500
4000
4500
5000
12 AM 2 AM 4 AM 6 AM 8 AM 10 AM 12 PM 2 PM 4 PM 6 PM 8 PM 10 PM
Vehi
cles
Per
Hou
r (VP
H)
0
10
20
30
40
50
60
70
80
90
100
Con
gest
ion
Freq
uenc
y (%
)
Estimated Volume, Speed, and Reliability Conditions (2003-04)
Before (Spr.2003): ColorAfter (Spr. 2004): Black
Figure 4.21. I-405 SB near Newcastle, GP
I-405 NE 30th St-SB HOV SB
0
500
1000
1500
2000
2500
3000
3500
4000
4500
5000
12 AM 2 AM 4 AM 6 AM 8 AM 10 AM 12 PM 2 PM 4 PM 6 PM 8 PM 10 PM
Vehi
cles
Per
Hou
r (VP
H)
0
10
20
30
40
50
60
70
80
90
100
Con
gest
ion
Freq
uenc
y (%
)
Estimated Volume, Speed, and Reliability Conditions (2003-04)
Before (Spr.2003): ColorAfter (Spr. 2004): Black
Figure 4.22. I-405 SB near Newcastle, HOV
41 DRAFT

I-405 NE 14th St GP SB
0
500
1000
1500
2000
2500
3000
3500
4000
4500
5000
5500
6000
6500
7000
7500
12 AM 2 AM 4 AM 6 AM 8 AM 10 AM 12 PM 2 PM 4 PM 6 PM 8 PM 10 PM
Vehi
cles
Per
Hou
r (VP
H)
0
10
20
30
40
50
60
70
80
90
100
Con
gest
ion
Freq
uenc
y (%
)
Estimated Volume, Speed, and Reliability Conditions (2003-04)
Before (Spr.2003): ColorAfter (Spr. 2004): Black
Figure 4.23. I-405 SB near Bellevue, GP
I-405 NE 14th St HOV SB
0
500
1000
1500
2000
2500
3000
3500
4000
4500
5000
5500
6000
6500
7000
7500
12 AM 2 AM 4 AM 6 AM 8 AM 10 AM 12 PM 2 PM 4 PM 6 PM 8 PM 10 PM
Vehi
cles
Per
Hou
r (VP
H)
0
10
20
30
40
50
60
70
80
90
100
Con
gest
ion
Freq
uenc
y (%
)
Estimated Volume, Speed, and Reliability Conditions (2003-04)
Before (Spr.2003): ColorAfter (Spr. 2004): Black
Figure 4.24. I-405 SB near Bellevue, HOV
42 DRAFT

I-405 NE 160th St-S GP NB
0
500
1000
1500
2000
2500
3000
3500
4000
4500
5000
5500
6000
6500
7000
7500
12 AM 2 AM 4 AM 6 AM 8 AM 10 AM 12 PM 2 PM 4 PM 6 PM 8 PM 10 PM
Vehi
cles
Per
Hou
r (VP
H)
0
10
20
30
40
50
60
70
80
90
100
Con
gest
ion
Freq
uenc
y (%
)
Estimated Volume, Speed, and Reliability Conditions (2003-04)
Before (Spr.2003): ColorAfter (Spr. 2004): Black
Figure 4.25. I-405 NB near Bothell, GP
I-405 NE 160th St-S HOV NB
0
500
1000
1500
2000
2500
3000
3500
4000
4500
5000
5500
6000
6500
7000
7500
12 AM 2 AM 4 AM 6 AM 8 AM 10 AM 12 PM 2 PM 4 PM 6 PM 8 PM 10 PM
Vehi
cles
Per
Hou
r (VP
H)
0
10
20
30
40
50
60
70
80
90
100
Con
gest
ion
Freq
uenc
y (%
)
Estimated Volume, Speed, and Reliability Conditions (2003-04)
Before (Spr.2003): ColorAfter (Spr. 2004): Black
Figure 4.26. I-405 NB near Bothell, HOV
43 DRAFT

I-90 W Lk Sam Pkwy GP EB
0
500
1000
1500
2000
2500
3000
3500
4000
4500
5000
5500
6000
6500
7000
7500
12 AM 2 AM 4 AM 6 AM 8 AM 10 AM 12 PM 2 PM 4 PM 6 PM 8 PM 10 PM
Vehi
cles
Per
Hou
r (VP
H)
0
10
20
30
40
50
60
70
80
90
100
Con
gest
ion
Freq
uenc
y (%
)
Estimated Volume, Speed, and Reliability Conditions (2003-04)
Before (Spr.2003): ColorAfter (Spr. 2004): Black
Figure 4.27. I-90 EB near Issaquah, GP
I-90 W Lk Sam Pkwy HOV EB
0
500
1000
1500
2000
2500
3000
3500
4000
4500
5000
5500
6000
6500
7000
7500
12 AM 2 AM 4 AM 6 AM 8 AM 10 AM 12 PM 2 PM 4 PM 6 PM 8 PM 10 PM
Vehi
cles
Per
Hou
r (VP
H)
0
10
20
30
40
50
60
70
80
90
100
Con
gest
ion
Freq
uenc
y (%
)
Estimated Volume, Speed, and Reliability Conditions (2003-04)
Before (Spr.2003): ColorAfter (Spr. 2004): Black
Figure 4.28. I-90 EB near Issaquah, HOV
44 DRAFT

7. Some changes in freeway performance were noted shortly after the 7:00 PM
start of revised hours. There was a small increase in average speed in the GP lanes after 7:00 PM at most of the analyzed locations. There was little or no change in the average HOV lane speeds after 7:00 PM.
One potential benefit opening the HOV lane to all traffic in the evening was
thought to be the ability to reduce the impact of congestion that had built up in the
afternoon peak period and had not yet dissipated by 7:00 PM. The average performance
profile graphs shown previously were inconclusive on this point; they showed that
congestion frequently began to dissipate before 7:00 PM at the measurement locations,
making it difficult to determine the potential effect of the HOV lane opening.
Therefore, two additional methods were used to analyze the possibility that the opening
of the HOV lane to general traffic might affect overall traffic performance.
First, performance profile graphs were prepared for specific days (rather than the
previous yearly averages) when significant congestion persisted shortly before 7:00 PM.
On those days, the pattern of volumes showed that the HOV volume usually increased at
7:00 PM, along with a decrease in GP volume and congestion. However, it was not
clear from these data alone that the former contributed to the latter.
For example, an analysis of differences in the dissipation of congestion was
performed at locations on SR 167 and on I-405, for selected days before and after the
start of the new hours of operation that showed congestion during the PM peak period
around 7:00 PM (see figures 4.29 through 4.35). At a location on SR 167 (southbound
at S. 204th Street near Renton), performance profiles were produced for May 8 and 29,
2003 (“before”) and May 19 and 25, 2004 (“after”). Results showed that on the “before”
days, both GP and HOV volumes were already trending downward before 7:00 PM.
Shortly after 7:00 PM, some intermittent and slight slowing dissipated after another 30
minutes or so. After one year of the new operating hours, the two days analyzed both
show a significant increase in HOV volumes at 7:00 PM; on May 25th, HOV volumes
increased over 60 percent, while on May 19th, volumes increased over 120 percent. In
45 DRAFT

the GP lanes, slight to moderate slowing led up to 7:00 PM, followed by a quick
dissipation of the slow condition shortly after 7:00 PM.
At a location on I-405 (southbound at NE 30th in Newcastle), profiles were
produced for May 8, 2003 (“before”), and May 25 and 27, 2004 (“after”). Results showed
that on the “before” day, slowing occurred briefly after 7:00 PM, but the location was
generally uncongested throughout the day. After implementation of the new hours, both
days showed a sharp spike in HOV volumes, and any congestion in the GP lanes
dissipated by 7:30 PM or so. In the case of May 25th, there was slight to moderate
congestion leading up to 7:00 PM.
While these examples are consistent with the possibility that the revised hours of
operation could have some effect on congestion dissipation by opening up the HOV lane
to all vehicles, the extent to which general access to the HOV lane promotes this
dissipation at 7:00 PM could not be determined from these profile graphs alone,
especially because dissipation normally occurred at about the same time even before the
start of the new policy in 2003.
A second analysis based on the distribution of 5-minute sample speeds at 7:00 PM
produced some indication of changes in performance. Weekday speeds were estimated
at 5-minute increments during the 15-minute periods just before and after 7:00 PM for a
two-month period in 2003 and 2004 (i.e., before and after the start of the pilot program).
The intent was to detect a shift in the distribution of 5-minute speeds at 7:00 PM that
could be related to the revised hours of operation. Table 4.9 summarizes the results for
both GP and HOV lanes. They show that approaching 7:00 PM, GP speeds at almost all
locations were usually operating near the speed limit (50 to 60 mph). GP speed
distributions after 7:00 PM were then skewed even more strongly toward the speed limit.
Figures 4.36 through 4.39 (based on 2004 GP data) show the shift in speed distribution
for the locations with the biggest increases in the 50-60 mph category after 7:00 PM.
46 DRAFT

The 2004 patterns were then compared with the corresponding 2003 results in an
effort to determine whether the patterns changed since the start of the pilot program.
Table 4.10 summarizes the magnitude and direction of the change in speeds in a
comparison of the speed distributions after 7:00 PM to those before 7:00 PM. While the
speed shifts in 2003 and 2004 were generally similar, there are some indications of
differences in the patterns of 2003 (before the start of the pilot program) versus 2004
(after the start). Note that the magnitude of the shifts in the GP lanes in 2004 was
somewhat higher than the shift detected during the same periods in 2003 before the
revised hours were implemented; this suggests the possibility that the change in GP
speeds after 7:00 PM that was observed in 2004 is more than what would normally occur
at that time of day as traffic becomes lighter. These changes could be attributed to the
revised hours of operation.
In the HOV lane, changes were less noticeable, in part because most HOV
facilities were operating at or near the speed limit even before 7:00 PM. Most HOV
locations did not experience noticeable upward shifts in speed distribution in 2004,
though in 2003, a small shift was noticeable at several locations.
While these data suggest that there was an upward shift in GP speeds after 7:00
PM beyond the shift that might be expected at that time of day, the magnitudes of the
shift were not large and reflect a change from a base level that was already high. Note
that the previous examples shown in figures 4.36 through 4.39 highlighted only the
locations with the largest estimated shifts toward higher speeds. For all the locations
analyzed, the percentage point shift in the 50-60 mph category ranged from –0.7 to 7.7
percent, meaning that in the highest instance, the facility was operating near the speed
limit about 100 percent of the time after 7:00 PM, compared to 92 percent of the time
before 7:00 PM. Another way to evaluate the significance of the changes indicated in
Table 4.10 is to note that a 2 percent increase in the 50-60 mph category corresponds to
47 DRAFT

about one additional weekday of near-speed limit conditions after 7:00 PM every two
months, based on the sample used in this analysis.
Note that a similar result can be seen if the change in speeds at 7:00 PM is
analyzed in terms of average speed (see Table 4.11). Average GP speeds increased by 1
to 3 mph at most locations, while average HOV speeds usually did not change after 7:00
PM (from a base level that was already at the speed limit in most cases). As with the
speed distribution results, any changes in the average speed after 7:00 PM were small,
especially given the corresponding changes during the 2003 “before” period.
Overall, these results suggest that GP lane users experienced a slight increase in
overall speeds after 7:00 PM at most of the locations analyzed, while HOV lane users
experienced little or no change in conditions. While the magnitudes of these speed
changes were not large, recall that there were noticeable, sometimes significant, increases
in HOV lane volumes just after 7:00 PM. This suggests that at least at some locations,
many travelers perceived a benefit from moving to the HOV lane.
These results also suggest that at the volumes measured, the presence of SOVs in
the HOV lane did not degrade performance in that lane. This is potentially significant,
because if SOV traffic in the HOV lane adversely affects HOV speed and reliability, this
might be a disincentive to form HOVs. To analyze this further, changes in observed
HOV counts, as measured by the estimated number of HOVs in all lanes, were computed
for 2003 versus 2004 on SR 167 southbound. While data are still tentative, they suggest
that for corridors such as SR 167 that have frequent evening GP congestion (a condition
that would tend to encourage SOV use of the HOV lane), the pattern of HOV volumes in
2004 was similar to that in 2003 (before the pilot program). Table 4.12 shows the HOV
count across all lanes before and after 7:00 PM, in both 2003 and 2004, for southbound
SR 167 in Renton and Auburn. It shows that HOV volumes have increased since 2003.
HOV formation trends will continue to be tracked during the second year of the pilot
program.
48 DRAFT

As part of the analyses of performance changes, two locations on I-5 (where the
revised hours of HOV lane operation are not in effect) were also monitored as control
sites to evaluate any performance changes that might have occurred on the freeway
network during the 2003-2004 period, independent of the revised hours of operation. At
those two sites, there was generally little or no change in performance from 2003 to 2004
at the transition times of approximately 5:00 AM and 7:00 PM (see figures 4.40-4.47).
In particular, performance changes that were observed at other locations that are subject
to the revised hours of operation (e.g., the noticeable volume increase in the HOV lane
shortly after 7 PM) were not evident at these control sites. This suggests that such
performance changes were more likely to be related to the revised hours of operation, and
less likely to be the result of year-to-year changes that would have occurred anyway,
regardless of the policy. The control sites will continue to be monitored during the
second year of the pilot program.
49 DRAFT

SR-167 S 204th St GP SB
0
500
1000
1500
2000
2500
12 AM 2 AM 4 AM 6 AM 8 AM 10 AM 12 PM 2 PM 4 PM 6 PM 8 PM 10 PM
Vehi
cles
Per
Lan
e Pe
r Hou
r (VP
LPH
)
GPHOV
Estimated Volume, Speed, and Reliability Conditions (5/8/2003)
Figure 4.29. Performance Profile on SR 167 (May 8, 2003)
SR-167 S 204th St GP SB
0
500
1000
1500
2000
2500
12 AM 2 AM 4 AM 6 AM 8 AM 10 AM 12 PM 2 PM 4 PM 6 PM 8 PM 10 PM
Vehi
cles
Per
Lan
e Pe
r Hou
r (VP
LPH
)
GPHOV
Estimated Volume, Speed, and Reliability Conditions (5/29/2003)
Figure 4.30. Performance Profile on SR 167 (May 29, 2003)
50 DRAFT

SR-167 S 204th St GP SB
0
500
1000
1500
2000
2500
12 AM 2 AM 4 AM 6 AM 8 AM 10 AM 12 PM 2 PM 4 PM 6 PM 8 PM 10 PM
Vehi
cles
Per
Lan
e Pe
r Hou
r (VP
LPH
)
GPHOV
Estimated Volume, Speed, and Reliability Conditions (5/19/2004)
Figure 4.31. Performance Profile on SR 167 (May 19, 2004)
SR-167 S 204th St GP SB
0
500
1000
1500
2000
2500
12 AM 2 AM 4 AM 6 AM 8 AM 10 AM 12 PM 2 PM 4 PM 6 PM 8 PM 10 PM
Vehi
cles
Per
Lan
e Pe
r Hou
r (VP
LPH
)
Estimated Volume, Speed, and Reliability Conditions (5/25/2004)
Figure 4.32. Performance Profile on SR 167 (May 25, 2004)
51 DRAFT
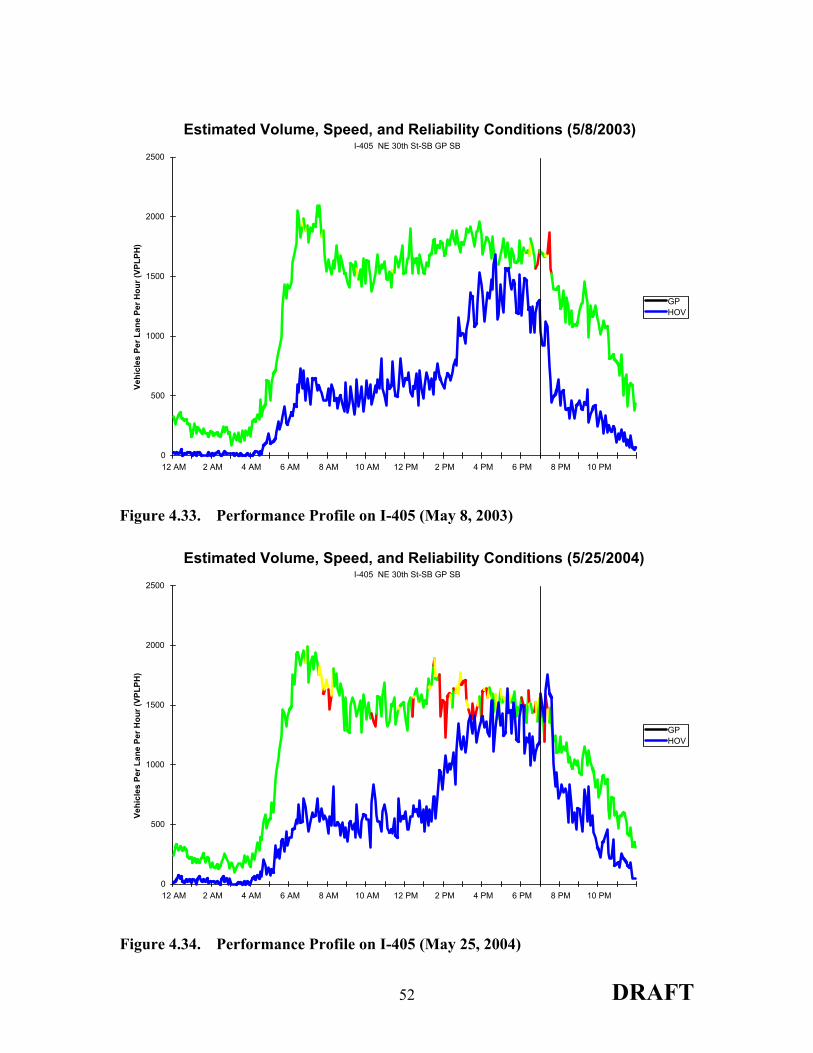
I-405 NE 30th St-SB GP SB
0
500
1000
1500
2000
2500
12 AM 2 AM 4 AM 6 AM 8 AM 10 AM 12 PM 2 PM 4 PM 6 PM 8 PM 10 PM
Vehi
cles
Per
Lan
e Pe
r Hou
r (VP
LPH
)
GPHOV
Estimated Volume, Speed, and Reliability Conditions (5/8/2003)
Figure 4.33. Performance Profile on I-405 (May 8, 2003)
I-405 NE 30th St-SB GP SB
0
500
1000
1500
2000
2500
12 AM 2 AM 4 AM 6 AM 8 AM 10 AM 12 PM 2 PM 4 PM 6 PM 8 PM 10 PM
Vehi
cles
Per
Lan
e Pe
r Hou
r (VP
LPH
)
GPHOV
Estimated Volume, Speed, and Reliability Conditions (5/25/2004)
Figure 4.34. Performance Profile on I-405 (May 25, 2004)
52 DRAFT

I-405 NE 30th St-SB GP SB
0
500
1000
1500
2000
2500
12 AM 2 AM 4 AM 6 AM 8 AM 10 AM 12 PM 2 PM 4 PM 6 PM 8 PM 10 PM
Vehi
cles
Per
Lan
e Pe
r Hou
r (VP
LPH
)
GPHOV
Estimated Volume, Speed, and Reliability Conditions (5/27/2004)
Figure 4.35. Performance Profile on I-405 (May 27, 2004)
53 DRAFT

Table 4.9. Distribution of Average 5-Minute Speeds Before/After 7:00 PM in GP and HOV Lanes (2003 and 2004). Spring 2004 (one yr of pilot program) Spring 2003 (before revised hours)
Corridor Location Dir. 50-60 40-50 30-40 20-3020 or less mph 50-60 40-50 30-40 20-30
20 or less mph Corridor Location Dir. 50-60 40-50 30-40 20-30
20 or less 50-60 40-50 30-40 20-30 20 or less
I-405 NE 160th, Bothell N 93% 1% 3% 1% 1% 96% 1% 0% 1% 1% I-405 NE 160th, Bothell N 99% 1% 1% 0% 0% 100% 0% 0% 0% 0%
I-405 NE 30th St, Newcastle N 100% 0% 0% 0% 0% 100% 0% 0% 0% 0% I-405 NE 30th St, Newcastle N 100% 0% 0% 0% 0% 100% 0% 0% 0% 0%
I-405 Cedar Ave, Renton N 95% 5% 0% 0% 0% 98% 2% 0% 0% 0% I-405 Cedar Ave, Renton N 93% 5% 0% 0% 2% 95% 3% 0% 0% 2%
I-405 NE 12th St, Bellevue S 92% 1% 3% 4% 0% 100% 0% 0% 0% 0% I-405 NE 12th St, Bellevue S 87% 1% 1% 3% 8% 94% 1% 1% 2% 2%
I-405 NE 30th St, Newcastle S 91% 7% 1% 1% 1% 93% 6% 1% 0% 0% I-405 NE 30th St, Newcastle S 95% 3% 1% 1% 0% 96% 4% 0% 0% 0%
I-405 Cedar Ave, Renton S 74% 11% 2% 9% 4% 79% 11% 1% 2% 7% I-405 Cedar Ave, Renton S 89% 6% 0% 2% 3% 93% 2% 0% 2% 2%
I-90 Newport Way, Issaquah E 98% 0% 0% 2% 0% 97% 1% 1% 1% 0% I-90 Newport Way, Issaquah E 96% 0% 0% 0% 4% 95% 0% 0% 1% 4%
SR 167 S 208th St, Renton N 100% 0% 0% 0% 0% 100% 0% 0% 0% 0% SR 167 S 208th St, Renton N 100% 0% 0% 0% 0% 100% 0% 0% 0% 0%
SR 167 37th St. NW, Auburn N 100% 0% 0% 0% 0% 100% 0% 0% 0% 0% SR 167 37th St. NW, Auburn N 100% 0% 0% 0% 0% 100% 0% 0% 0% 0%
SR 167 S 208th St, Renton S 88% 11% 1% 0% 0% 94% 6% 0% 0% 0% SR 167 S 208th St, Renton S 98% 2% 0% 0% 0% 100% 0% 0% 0% 0%
SR 167 37th St. NW, Auburn S 95% 4% 1% 0% 0% 99% 1% 0% 0% 0% SR 167 37th St. NW, Auburn S 96% 4% 0% 0% 0% 100% 0% 0% 0% 0%
SR 520 NE 148th, Redmond E 100% 0% 0% 0% 0% 100% 0% 0% 0% 0% SR 520 NE 148th, Redmond E 100% 0% 0% 0% 0% 100% 0% 0% 0% 0%
SR 520 NE 148th, Redmond W 93% 0% 1% 1% 6% 100% 0% 0% 0% 0% SR 520 NE 148th, Redmond W 96% 0% 0% 0% 4% 96% 0% 0% 1% 4%
Spring 2004 (one yr of pilot program) Spring 2003 (before revised hours)
Corridor Location Dir. 50-60 40-50 30-40 20-30 20 or less
mph 50-60 40-50 30-40 20-30 20 or less
mph Corridor Location Dir. 50-60 40-50 30-40 20-30 20 or less
50-60 40-50 30-40 20-30 20 or less
I-405 NE 160th, Bothell N 93% 0% 1% 1% 5% 92% 1% 0% 2% 5% I-405 NE 160th, Bothell N 96% 0% 0% 0% 4% 98% 0% 0% 0% 2%
I-405 NE 30th St, Newcastle N 100% 0% 0% 0% 0% 100% 0% 0% 0% 0% I-405 NE 30th St, Newcastle N 100% 0% 0% 0% 0% 100% 0% 0% 0% 0%
I-405 Cedar Ave, Renton N 100% 0% 0% 0% 0% 100% 0% 0% 0% 0% I-405 Cedar Ave, Renton N 100% 0% 0% 0% 0% 100% 0% 0% 0% 0%
I-405 NE 12th St, Bellevue S 96% 0% 1% 0% 3% 100% 0% 0% 0% 0% I-405 NE 12th St, Bellevue S 96% 0% 2% 0% 2% 100% 0% 0% 0% 0%
I-405 NE 30th St, Newcastle S 99% 0% 0% 1% 0% 100% 0% 0% 0% 0% I-405 NE 30th St, Newcastle S 100% 0% 0% 0% 0% 100% 0% 0% 0% 0%
I-405 Cedar Ave, Renton S 95% 2% 0% 3% 0% 91% 3% 1% 4% 1% I-405 Cedar Ave, Renton S 95% 4% 1% 0% 0% 96% 2% 2% 0% 0%
I-90 Newport Way, Issaquah E 100% 0% 0% 0% 0% 100% 0% 0% 0% 0% I-90 Newport Way, Issaquah E 100% 0% 0% 0% 0% 100% 0% 0% 0% 0%
SR 167 S 208th St, Renton N 100% 0% 0% 0% 0% 100% 0% 0% 0% 0% SR 167 S 208th St, Renton N 100% 0% 0% 0% 0% 100% 0% 0% 0% 0%
SR 167 37th St. NW, Auburn N 100% 0% 0% 0% 0% 100% 0% 0% 0% 0% SR 167 37th St. NW, Auburn N 100% 0% 0% 0% 0% 100% 0% 0% 0% 0%
SR 167 S 208th St, Renton S 100% 0% 0% 0% 0% 100% 0% 0% 0% 0% SR 167 S 208th St, Renton S 97% 3% 0% 0% 0% 100% 0% 0% 0% 0%
SR 167 37th St. NW, Auburn S 100% 0% 0% 0% 0% 100% 0% 0% 0% 0% SR 167 37th St. NW, Auburn S 95% 5% 0% 0% 0% 100% 0% 0% 0% 0%
SR 520 NE 148th, Redmond E 100% 0% 0% 0% 0% 100% 0% 0% 0% 0% SR 520 NE 148th, Redmond E 100% 0% 0% 0% 0% 100% 0% 0% 0% 0%
SR 520 NE 148th, Redmond W 100% 0% 0% 0% 0% 100% 0% 0% 0% 0% SR 520 NE 148th, Redmond W 100% 0% 0% 0% 0% 100% 0% 0% 0% 0%
6:45-7:00 PM 7:00-7:15 PM
GP Speed Distribution
6:45-7:00 PM 7:00-7:15 PM
HOV Speed DistributionHOV Speed Distribution
6:45-7:00 PM 7:00-7:15 PM
GP Speed Distribution
6:45-7:00 PM 7:00-7:15 PM
54 DRAFT

Table 4.10. Change in Average GP and HOV Speed Distribution Before/After 7:00 PM (2003 and 2004). GP Spring Data
Corridor Location Dir. 50-60 40-50 30-40 20-30 20 or less
mph 50-60 40-50 30-40 20-30 20 or less
mph
I-405 NE 160th, Bothell N 3.0% (0.0%) (3.0%) (0.0%) (0.0%) 1.5% (0.7%) (0.7%) 0.0% 0.0%
I-405 NE 30th St, Newcastle N 0.0% 0.0% 0.0% 0.0% 0.0% 0.0% 0.0% 0.0% 0.0% 0.0%
I-405 Cedar Ave, Renton N 3.0% (3.0%) 0.0% 0.0% 0.0% 1.5% (2.3%) 0.0% 0.0% 0.8%
I-405 NE 12th St, Bellevue S 7.7% (0.9%) (2.6%) (4.3%) 0.0% 6.8% 0.0% 0.0% (0.8%) (6.1%)
I-405 NE 30th St, Newcastle S 2.3% (0.8%) 0.0% (0.8%) (0.8%) 1.5% 0.7% (1.5%) (0.7%) 0.0%
I-405 Cedar Ave, Renton S 5.1% 0.0% (1.0%) (7.1%) 3.0% 3.8% (3.8%) 0.0% 0.8% (0.8%)
I-90 Newport Way, Issaquah E (0.7%) 0.7% 0.7% (0.7%) 0.0% (0.7%) 0.0% 0.0% 0.7% 0.0%
SR 167 S 208th St, Renton N 0.0% 0.0% 0.0% 0.0% 0.0% 0.0% 0.0% 0.0% 0.0% 0.0%
SR 167 37th St. NW, Auburn N 0.0% 0.0% 0.0% 0.0% 0.0% 0.0% 0.0% 0.0% 0.0% 0.0%
SR 167 S 208th St, Renton S 6.1% (5.3%) (0.8%) 0.0% 0.0% 2.2% (2.2%) 0.0% 0.0% 0.0%
SR 167 37th St. NW, Auburn S 4.0% (3.2%) (0.8%) 0.0% 0.0% 3.7% (3.7%) 0.0% 0.0% 0.0%
SR 520 NE 148th, Redmond E 0.0% 0.0% 0.0% 0.0% 0.0% 0.0% 0.0% 0.0% 0.0% 0.0%
SR 520 NE 148th, Redmond W 7.4% 0.0% (0.7%) (0.7%) (5.9%) 0.0% 0.0% 0.0% 0.7% (0.7%)
HOV Spring Data
Corridor Location Dir. 50-60 40-50 30-40 20-30 20 or less
mph 50-60 40-50 30-40 20-30 20 or less
mph
I-405 NE 160th, Bothell N (0.7%) 0.7% (0.7%) 0.7% 0.0% 1.5% 0.0% 0.0% 0.0% (1.5%)
I-405 NE 30th St, Newcastle N 0.0% 0.0% 0.0% 0.0% 0.0% 0.0% 0.0% 0.0% 0.0% 0.0%
I-405 Cedar Ave, Renton N 0.0% 0.0% 0.0% 0.0% 0.0% 0.0% 0.0% 0.0% 0.0% 0.0%
I-405 NE 12th St, Bellevue S 4.3% 0.0% (0.9%) 0.0% (3.4%) 3.8% 0.0% (2.3%) 0.0% (1.5%)
I-405 NE 30th St, Newcastle S 0.8% 0.0% 0.0% (0.8%) 0.0% 0.0% 0.0% 0.0% 0.0% 0.0%
I-405 Cedar Ave, Renton S (4.0%) 1.0% 1.0% 1.0% 1.0% 0.8% (2.3%) 1.5% 0.0% 0.0%
I-90 Newport Way, Issaquah E 0.0% 0.0% 0.0% 0.0% 0.0% 0.0% 0.0% 0.0% 0.0% 0.0%
SR 167 S 208th St, Renton N 0.0% 0.0% 0.0% 0.0% 0.0% 0.0% 0.0% 0.0% 0.0% 0.0%
SR 167 37th St. NW, Auburn N 0.0% 0.0% 0.0% 0.0% 0.0% 0.0% 0.0% 0.0% 0.0% 0.0%
SR 167 S 208th St, Renton S 0.0% 0.0% 0.0% 0.0% 0.0% 3.0% (3.0%) 0.0% 0.0% 0.0%
SR 167 37th St. NW, Auburn S 0.0% 0.0% 0.0% 0.0% 0.0% 5.2% (5.2%) 0.0% 0.0% 0.0%
SR 520 NE 148th, Redmond E 0.0% 0.0% 0.0% 0.0% 0.0% 0.0% 0.0% 0.0% 0.0% 0.0%
SR 520 NE 148th, Redmond W 0.0% 0.0% 0.0% 0.0% 0.0% 0.0% 0.0% 0.0% 0.0% 0.0%
Change in Speed Distribution (7:00-7:15 PM vs. 6:45-7:00 PM2004 (one year after start of revised hours)
Change in Speed Distribution (7:00-7:15 PM vs. 6:45-7:00 PM2004 (one year after start of revised hours)
2003 (before start of revised hours)
2003 (before start of revised hours)
55 DRAFT

NE 12th St, Bellevue
2004 Speed Distribution (GP)
0%
10%
20%
30%
40%
50%
60%
70%
80%
90%
100%
50-60 40-50 30-40 20-30 20 or less
Speed Categories (mph)
6:45-7:00 PM7:00-7:15 PM
2003 Speed Distribution (GP)
0%
10%
20%
30%
40%
50%
60%
70%
80%
90%
100%
50-60 40-50 30-40 20-30 20 or less
Speed Categories (mph)
6:45-7:00 PM7:00-7:15 PM
2004 Speed Distribution (HOV)
0%
10%
20%
30%
40%
50%
60%
70%
80%
90%
100%
50-60 40-50 30-40 20-30 20 or less
Speed Categories (mph)
6:45-7:00 PM7:00-7:15 PM
2003 Speed Distribution (HOV)
0%
10%
20%
30%
40%
50%
60%
70%
80%
90%
100%
50-60 40-50 30-40 20-30 20 or less
Speed Categories (mph)
6:45-7:00 PM7:00-7:15 PM
Figure 4.36. Change in Distribution of Average 5-Minute GP and HOV Speeds After 7:00 PM, I-405 SB at NE 12th Street (2003 and 2004).
56 DRAFT
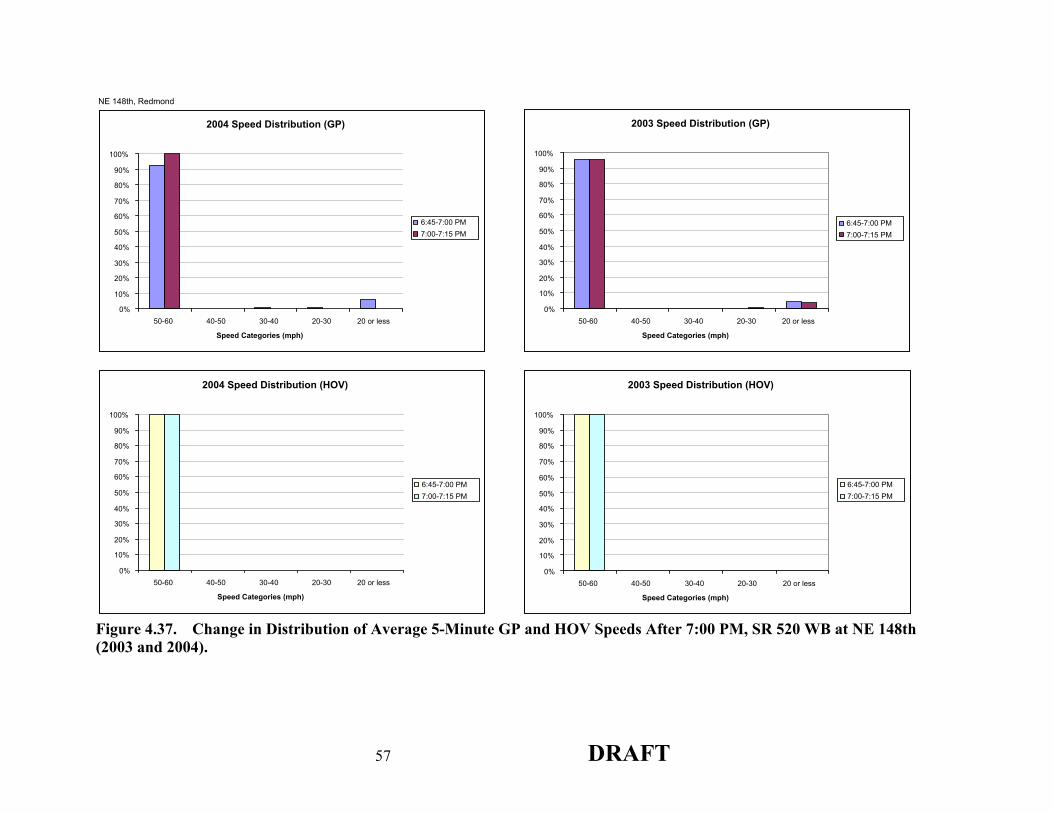
NE 148th, Redmond
2004 Speed Distribution (GP)
0%
10%
20%
30%
40%
50%
60%
70%
80%
90%
100%
50-60 40-50 30-40 20-30 20 or less
Speed Categories (mph)
6:45-7:00 PM7:00-7:15 PM
2003 Speed Distribution (GP)
0%
10%
20%
30%
40%
50%
60%
70%
80%
90%
100%
50-60 40-50 30-40 20-30 20 or less
Speed Categories (mph)
6:45-7:00 PM7:00-7:15 PM
2004 Speed Distribution (HOV)
0%
10%
20%
30%
40%
50%
60%
70%
80%
90%
100%
50-60 40-50 30-40 20-30 20 or less
Speed Categories (mph)
6:45-7:00 PM7:00-7:15 PM
2003 Speed Distribution (HOV)
0%
10%
20%
30%
40%
50%
60%
70%
80%
90%
100%
50-60 40-50 30-40 20-30 20 or less
Speed Categories (mph)
6:45-7:00 PM7:00-7:15 PM
Figure 4.37. Change in Distribution of Average 5-Minute GP and HOV Speeds After 7:00 PM, SR 520 WB at NE 148th (2003 and 2004).
57 DRAFT

S 208th St, Renton
2004 Speed Distribution (GP)
0%
10%
20%
30%
40%
50%
60%
70%
80%
90%
100%
50-60 40-50 30-40 20-30 20 or less
Speed Categories (mph)
6:45-7:00 PM7:00-7:15 PM
2003 Speed Distribution (GP)
0%
10%
20%
30%
40%
50%
60%
70%
80%
90%
100%
50-60 40-50 30-40 20-30 20 or less
Speed Categories (mph)
6:45-7:00 PM7:00-7:15 PM
2004 Speed Distribution (HOV)
0%
10%
20%
30%
40%
50%
60%
70%
80%
90%
100%
50-60 40-50 30-40 20-30 20 or less
Speed Categories (mph)
6:45-7:00 PM7:00-7:15 PM
2003 Speed Distribution (HOV)
0%
10%
20%
30%
40%
50%
60%
70%
80%
90%
100%
50-60 40-50 30-40 20-30 20 or less
Speed Categories (mph)
6:45-7:00 PM7:00-7:15 PM
Figure 4.38. Change in Distribution of Average 5-Minute GP and HOV Speeds After 7:00 PM, SR 167 SB at S. 208th (2003 and 2004).
58 DRAFT

Cedar Ave, Renton
2004 Speed Distribution (GP)
0%
10%
20%
30%
40%
50%
60%
70%
80%
90%
100%
50-60 40-50 30-40 20-30 20 or less
Speed Categories (mph)
6:45-7:00 PM7:00-7:15 PM
2003 Speed Distribution (GP)
0%
10%
20%
30%
40%
50%
60%
70%
80%
90%
100%
50-60 40-50 30-40 20-30 20 or less
Speed Categories (mph)
6:45-7:00 PM7:00-7:15 PM
2004 Speed Distribution (HOV)
0%
10%
20%
30%
40%
50%
60%
70%
80%
90%
100%
50-60 40-50 30-40 20-30 20 or less
Speed Categories (mph)
6:45-7:00 PM7:00-7:15 PM
2003 Speed Distribution (HOV)
0%
10%
20%
30%
40%
50%
60%
70%
80%
90%
100%
50-60 40-50 30-40 20-30 20 or less
Speed Categories (mph)
6:45-7:00 PM7:00-7:15 PM
Figure 4.39. Change in Distribution of Average 5-Minute GP and HOV Speeds After 7:00 PM, I-405 SB at Cedar Avenue (2003 and 2004).
59 DRAFT

Table 4.11. Average GP and HOV Speeds Before/After 7:00 PM (2003 and 2004). Spring data
Corridor Location Dir. 6:45-7:00 PM
7:00-7:15 PM
Change 6:45-7:00 PM
7:00-7:15 PM
Change
I-405 NE 160th, Bothell N 58 59 1 60 60 0I-405 NE 30th St, Newcastle N 60 60 0 60 60 0I-405 Cedar Ave, Renton N 56 57 1 55 55 0I-405 NE 12th St, Bellevue S 58 60 2 55 58 3I-405 NE 30th St, Newcastle S 57 58 1 58 59 1I-405 Cedar Ave, Renton S 50 52 2 54 55 1I-90 Newport Way, Issaquah E 59 59 0 58 58 0
SR 167 S 208th St, Renton N 60 60 0 60 60 0SR 167 37th St. NW, Auburn N 60 60 0 60 60 0SR 167 S 208th St, Renton S 55 58 3 56 58 2SR 167 37th St. NW, Auburn S 58 60 2 58 59 1SR 520 NE 148th, Redmond E 60 60 0 60 60 0SR 520 NE 148th, Redmond W 57 60 3 58 58 0
Spring data
Corridor Location Dir. 6:45-7:00 PM
7:00-7:15 PM
Change 6:45-7:00 PM
7:00-7:15 PM
Change
I-405 NE 160th, Bothell N 57 57 0 58 59 1I-405 NE 30th St, Newcastle N 60 60 0 60 60 0I-405 Cedar Ave, Renton N 60 60 0 60 60 0I-405 NE 12th St, Bellevue S 58 60 2 59 60 1I-405 NE 30th St, Newcastle S 60 60 0 60 60 0I-405 Cedar Ave, Renton S 59 57 -1 59 59 0I-90 Newport Way, Issaquah E 60 60 0 60 60 0
SR 167 S 208th St, Renton N 60 60 0 60 60 0SR 167 37th St. NW, Auburn N 60 60 0 60 60 0SR 167 S 208th St, Renton S 60 60 0 60 60 0SR 167 37th St. NW, Auburn S 60 60 0 60 60 0SR 520 NE 148th, Redmond E 60 60 0 60 60 0SR 520 NE 148th, Redmond W 60 60 0 60 60 0
2004 2003
Average GP Speed2004 2003
Average HOV Speed
60 DRAFT

Table 4.12. HOV and GP Volumes on SR 167 Southbound Before/After 7:00 PM (2003 and 2004)
2004 SpringCorridor Location Direction HOV GP HOV GP
SR 167 S 208th St, Renton S 274 650 265 634SR 167 37th St. NW, Auburn S 271 601 261 564
2003 SpringCorridor Location Direction HOV GP HOV GP
SR 167 S 208th St, Renton S 267 645 249 599SR 167 37th St. NW, Auburn S 230 626 196 610
2004 vs 2003Corridor Location Direction HOV GP HOV GP
SR 167 S 208th St, Renton S 7 5 16 35SR 167 37th St. NW, Auburn S 40 -24 65 -46
6:45-7:00 PM 7:00-7:15 PM
6:45-7:00 PM 7:00-7:15 PM
6:45-7:00 PM 7:00-7:15 PM
61 DRAFT

I-5 NE 145th St-N GP NB
0
1000
2000
3000
4000
5000
6000
7000
8000
9000
10000
12 AM 2 AM 4 AM 6 AM 8 AM 10 AM 12 PM 2 PM 4 PM 6 PM 8 PM 10 PM
Vehi
cles
Per
Hou
r (VP
H)
0
10
20
30
40
50
60
70
80
90
100
Con
gest
ion
Freq
uenc
y (%
)
Estimated Volume, Speed, and Reliability Conditions (2003)
Before (Spr. 2003): colorAfter (Spr. 2004): black
Note: Maximum vertical scale=10000
Figure 4.40. Change in 24-Hour Performance at Control Site, I-5 NB GP at NE 145th (2003 and 2004).
I-5 NE 145th St-N HOV NB
0
500
1000
1500
2000
2500
12 AM 2 AM 4 AM 6 AM 8 AM 10 AM 12 PM 2 PM 4 PM 6 PM 8 PM 10 PM
Vehi
cles
Per
Hou
r (VP
H)
0
10
20
30
40
50
60
70
80
90
100
Con
gest
ion
Freq
uenc
y (%
)
Estimated Volume, Speed, and Reliability Conditions (2003)
Before (Spr. 2003): colorAfter (Spr. 2004): black
Figure 4.41. Change in 24-Hour Performance at Control Site, I-5 NB HOV at NE 145th (2003 and 2004).
62 DRAFT

I-5 NE 145th St-S GP SB
0
1000
2000
3000
4000
5000
6000
7000
8000
9000
10000
12 AM 2 AM 4 AM 6 AM 8 AM 10 AM 12 PM 2 PM 4 PM 6 PM 8 PM 10 PM
Vehi
cles
Per
Hou
r (VP
H)
0
10
20
30
40
50
60
70
80
90
100
Con
gest
ion
Freq
uenc
y (%
)
Estimated Volume, Speed, and Reliability Conditions (2003)
Before (Spr. 2003): colorAfter (Spr. 2004): black
Note: Maximum vertical scale=10000
Figure 4.42. Change in 24-Hour Performance at Control Site, I-5 SB GP at NE 145th (2003 and 2004).
I-5 NE 145th St-S HOV SB
0
500
1000
1500
2000
2500
12 AM 2 AM 4 AM 6 AM 8 AM 10 AM 12 PM 2 PM 4 PM 6 PM 8 PM 10 PM
Vehi
cles
Per
Hou
r (VP
H)
0
10
20
30
40
50
60
70
80
90
100
Con
gest
ion
Freq
uenc
y (%
)
Estimated Volume, Speed, and Reliability Conditions (2003)
Before (Spr. 2003): colorAfter (Spr. 2004): black
Figure 4.43. Change in 24-Hour Performance at Control Site, I-5 SB HOV at NE 145th (2003 and 2004).
63 DRAFT

I-5 S 216th St GP NB
0
1000
2000
3000
4000
5000
6000
7000
8000
9000
10000
12 AM 2 AM 4 AM 6 AM 8 AM 10 AM 12 PM 2 PM 4 PM 6 PM 8 PM 10 PM
Vehi
cles
Per
Hou
r (VP
H)
0
10
20
30
40
50
60
70
80
90
100
Con
gest
ion
Freq
uenc
y (%
)
Estimated Volume, Speed, and Reliability Conditions (2003)
Before (Spr. 2003): colorAfter (Spr. 2004): black
Note: Maximum vertical scale=10000
Figure 4.44. Change in 24-Hour Performance at Control Site, I-5 NB GP at S. 216th (2003 and 2004).
I-5 S 216th St HOV NB
0
500
1000
1500
2000
2500
12 AM 2 AM 4 AM 6 AM 8 AM 10 AM 12 PM 2 PM 4 PM 6 PM 8 PM 10 PM
Vehi
cles
Per
Hou
r (VP
H)
0
10
20
30
40
50
60
70
80
90
100
Con
gest
ion
Freq
uenc
y (%
)
Estimated Volume, Speed, and Reliability Conditions (2003)
Before (Spr. 2003): colorAfter (Spr. 2004): black
Figure 4.45. Change in 24-Hour Performance at Control Site, I-5 NB HOV at S. 216th (2003 and 2004).
64 DRAFT

I-5 S 216th St GP SB
0
1000
2000
3000
4000
5000
6000
7000
8000
9000
10000
12 AM 2 AM 4 AM 6 AM 8 AM 10 AM 12 PM 2 PM 4 PM 6 PM 8 PM 10 PM
Vehi
cles
Per
Hou
r (VP
H)
0
10
20
30
40
50
60
70
80
90
100
Con
gest
ion
Freq
uenc
y (%
)
Estimated Volume, Speed, and Reliability Conditions (2003)
Before (Spr. 2003): colorAfter (Spr. 2004): black
Note: Maximum vertical scale=10000
Figure 4.46. Change in 24-Hour Performance at Control Site, I-5 SB GP at S. 216th (2003 and 2004).
I-5 S 216th St HOV SB
0
500
1000
1500
2000
2500
12 AM 2 AM 4 AM 6 AM 8 AM 10 AM 12 PM 2 PM 4 PM 6 PM 8 PM 10 PM
Vehi
cles
Per
Hou
r (VP
H)
0
10
20
30
40
50
60
70
80
90
100
Con
gest
ion
Freq
uenc
y (%
)
Estimated Volume, Speed, and Reliability Conditions (2003)
Before (Spr. 2003): colorAfter (Spr. 2004): black
Figure 4.47. Change in 24-Hour Performance at Control Site, I-5 SB HOV at S. 216th (2003 and 2004).
65 DRAFT

PUBLIC PERCEPTIONS
A public opinion survey was performed to gauge the level of awareness of the
revised hours of operation; perceived changes in freeway conditions such as driving
maneuverability, safety, and speeds after the new HOV lane hours of operation began;
and overall impressions of the new operational policy and the HOV system in general.
The overall response rate was almost 23 percent (1,209 received out of 5,349 mailed
surveys).
The responses to the 2004 survey are summarized below. 8. The level of awareness of the new HOV lane hours of operation was not high
among survey respondents.
Survey participants were asked to indicate whether they were aware of the new
HOV lane hours of operation on the affected freeways. While vehicle volume data and
vehicle occupancy data showed changes in HOV lane volumes and patterns of vehicle
occupancy at 7:00 PM, suggesting that at least some travelers were aware of the revised
hours of operation and were using the HOV lanes differently as a result, the survey
results revealed that only 36 percent of the respondents were aware of the new hours of
operation. Existing signage and public discussion of the new policy was apparently not
sufficient to expand awareness of the new policy as much as desired. 9. Survey respondents perceived some improvements in freeway conditions
following the start of the new hours of operation.
Survey participants were asked to compare freeway conditions after the start of
the new hours of operation policy to conditions before the policy began. They indicated
their answers on a 5-point scale (significantly worse than before, somewhat worse than
before, unchanged, somewhat better than before, and significantly better than before, as
well as “don’t know”) in the areas of a) driving maneuverability in the GP lanes (e.g.,
ability to change lanes), b) overall safety, and c) speeds in the HOV and GP lanes during
the evening hours of 7:00 PM to 9:00 PM. The survey results showed that respondents
66 DRAFT

perceived some improvements in freeway conditions following the start of the new HOV
lane hours. Overall, responses to each of the questions about driving conditions were
similar, with 21 to 28 percent of respondents saying that the freeway conditions
(maneuverability, safety, or speed) were somewhat better or much better than before, 31
to 39 percent saying that conditions were unchanged, and 3 to 4 percent saying
conditions were somewhat worse or much worse, with 31 to 38 percent saying that they
did not know.
The response pattern was different among the subset of respondents who were
aware of the policy change, with more positive responses overall. About 42 percent of
those who were aware of the new policy thought that driving maneuverability was
improved, 31 percent thought overall safety had improved, and 34 percent thought
average speeds in the HOV and GP lanes were faster during the evening hours. About
39 to 48 percent thought conditions were unchanged, while 1 to 5 percent thought
conditions were worse. About 10 to 21 percent were unsure.
By comparison, respondents who were unaware of the policy change had a higher
degree of uncertainty about changes in freeway conditions, with 43 to 52 percent
responding “not sure”. There were also fewer responses indicating improved freeway
conditions (13 to 23 percent) or unchanged conditions (26 to 36 percent). 10. Most survey respondents had a positive reaction to the new hours of
operation.
Survey participants were asked for their overall impression of the new HOV lane
hours of operation. Approximately 67 percent of the respondents either somewhat agreed
or strongly agreed with the statement that opening the HOV lanes to both SOVs and
HOVs from 7:00 PM and 5:00 AM was a good idea, while 17 percent somewhat or
strongly disagreed. The response was positive whether survey participants were already
aware of the new policy (74 percent positive), or were just learning about the changes
from the survey (64 percent positive). Respondents who typically drove alone during
67 DRAFT

peak hours were generally very supportive, with 73 percent either somewhat or strongly
agreeing that the new policy was a good idea, and 13 percent somewhat or strongly
disagreeing. Respondents who used carpools, vanpools, or transit during peak periods
were also supportive, though somewhat less so, with about 59 percent answering
positively and 23 percent disagreeing.
11. For a significant number of survey respondents, the new HOV lane policy
has improved their overall opinion of the HOV lane network.
Survey participants were asked whether the new HOV lane hours policy had
affected their overall opinion of the HOV lane network. Approximately 41 percent of
survey respondents had a somewhat more favorable or significantly more favorable
opinion of the HOV lane network because of the change in HOV lane policy, and only 10
percent had a less favorable opinion. About 50 percent had no change in opinion.
Respondents who typically drove alone during peak hours were more supportive, with 46
percent having a somewhat or strongly more favorable opinion of the overall HOV
system, while 48 percent were unchanged in their opinion. Respondents who used
carpools, vanpools, or transit during peak periods were somewhat less supportive, with
about 32 percent answering that their opinion of the HOV system was more favorable,
while 53 percent were unchanged in their opinions, and 15 percent had a somewhat or
significantly less favorable opinion of the HOV network.
68 DRAFT

SECTION 5 SUMMARY OF ONE-YEAR ANALYSES
The data processed thus far suggest that some travelers appear to be aware of the
revised hours of operation and are taking advantage of the new policy. The percentage
and number of SOVs using the HOV lane at the start of the revised hours (7:00 PM)
increased at many of the locations evaluated, and the percentage of all traffic using the
HOV lane after 7:00 PM increased. In some locations, notably on SR 167, there is a
significant increase in SOV usage of the HOV lane after 7:00 PM. At the same time,
survey results suggest that only slightly more than one-third of travelers are aware of the
revised hours of operation.
The results also suggest that at some locations there is an increase in SOV
violation rates in the HOV lane during the transition periods (6:45 PM to 7:00 PM, and
after 5:00 AM); the increases are generally not large but are somewhat higher after one
year of operation than they were shortly after the new policy began. This is true for both
the AM peak period and the PM peak transition period.
Traffic performance improvement after 7:00 PM as a result of the revised hours of
operation is difficult to determine from the data analyzed. However, an analysis of the
distribution of speeds before and after the pilot program start suggests that there was a
slight shift toward higher speeds in the GP lanes after 7:00 PM, though there was almost
no change in the HOV lane after 7:00 PM (which was generally already operating at or
near the speed limit by that time). At the same time, survey results suggest that among
travelers who were already aware of the new policy, anywhere from 31 to 42 percent
associate the new hours of operation with perceived improvements in maneuverability,
safety, and speeds, though a significant percentage of people surveyed also did not
perceive any change in freeway performance. Of those survey respondents who were
not previously aware of the new policy, there was more uncertainty about the
69 DRAFT

70 DRAFT
performance effects, with only 13 to 23 percent associating the new policy with
improvements in freeway conditions, and 43 to 52 percent responding that there was no
change.
Nevertheless, there was a sizeable level of support for the program among both
SOV and HOV travelers, with 67 percent of respondents either somewhat or strongly
agreeing that it is a good idea. Furthermore, a significant number of respondents (41
percent) had a more favorable opinion of the HOV system as a whole because of the new
hours of operation.
The results described in this paper are based on data collected after one year of
operation of the pilot program, and they will be reviewed and updated as additional data
are collected in the coming months. The next evaluation report will be produced
following the end of the second full year of operation.