evaluation of organophosphate insecticides on …
TRANSCRIPT

EVALUATION OF ORGANOPHOSPHATE INSECTICIDES
ON PERFORMANCE OF TRANSGENIC AND
CONVENTIONAL COTTON
A Thesis
by
CHRISTOPHER ALAN HUNDLEY
Submitted to the Office of Graduate Studies of Texas A&M University
in partial fulfillment of the requirements for the degree of
MASTER OF SCIENCE
May 2004
Major Subject: Agronomy

EVALUATION OF ORGANOPHOSPHATE INSECTICIDES
ON PERFORMANCE OF TRANSGENIC AND
CONVENTIONAL COTTON
A Thesis
by
CHRISTOPHER ALAN HUNDLEY
Submitted to Texas A&M University in partial fulfillment of the requirements
for the degree of
MASTER OF SCIENCE
Approved as to style and content by: ___________________________ ___________________________ J. Tom Cothren Frank M. Hons (Chair of Committee) (Member) ___________________________ ___________________________ Stephen W. Searcy Mark A. Hussey (Member) (Head of Department)
May 2004
Major Subject: Agronomy

iii
ABSTRACT
Evaluation of Organophosphate Insecticides on Performance of
Transgenic and Conventional Cotton. (May 2004)
Christopher Alan Hundley, B.S., Texas A&M University
Chair of Advisory Committee: Dr. J. Tom Cothren
Genetically modified cotton (Gossypium hirsutum L.) acreage has increased
dramatically over the last six years. Reports of variable results in fiber quality and yield
have arisen in these cultivars. Some changes in production practices have occurred
coincident with the introduction of transgenic technology, such as reduced use of broad-
spectrum insecticides, including organophosphates (OP) that could potentially influence
the growth and yield of cotton. One factor that might affect these parameters is the
difference in the amount of foliarly-applied phosphorus (P) between an OP and non-
phosphate (NP) insecticide regime. Therefore, a study was conducted to investigate
selected growth characteristics, yield, and fiber quality of genetically modified and
conventional cotton as influenced by OP and foliar phosphorus (FP) applications.
A four replication strip-plot experimental design was utilized with cultivar
serving as the whole plot and insecticide regime as the sub-plot. Three cultivars of the
same recurrent parent (ST4892BR, ST4793R, and ST474) were planted in 2001 and
2002 under irrigated conditions in Burleson County, TX on a Weswood silty clay loam
(fine-silty, mixed, thermic Fluventic Ustochrept). The insecticide regime consisted of

iv
NP, NP+FP, and OP treatments. The FP was applied at P2O5 weight equivalent to the P
component in the concurrent OP application.
ST4892BR had greater lint yield than ST4793R and ST474. The yield increase
can be explained through plant mapping analysis which showed ST4892BR producing
larger bolls and greater boll numbers. In addition, evaluation of fruiting distribution
showed ST4892BR contained more lint on sympodial branches 6 through 10. The
insecticide regime effect on lint yield resulted in higher yield (P=0.08) for the NP+FP
regime. Examination of yield components revealed NP+FP increased second position
bolls, predominantly at sympodial branches 6 through 10. Leaf tissue analysis revealed
increased levels of P for the OP and NP+FP over that of the NP insecticide regime,
which indicates a potential for plants to acquire P from OP insecticides. Furthermore,
the considerable yield response to small amounts of FP is not clearly understood. While
conclusive evidence exists regarding cultivar yield differences, this study does not
provide sufficient evidence to conclude that OP insecticides influence growth, yield, or
fiber quality characteristics of these cotton cultivars.

v
DEDICATION
This thesis is dedicated to my loving wife, Leah, whose unconditional love,
patience, and support gave me the strength and drive to complete this degree.

vi
ACKNOWLEDGEMENTS
I would like to extend appreciation to the following individuals and organizations
for their support, input, and guidance that made it possible for me to complete the
requirements for this degree.
My graduate committee is recognized for their advice and assistance throughout
this research project and graduate curriculum. The Department of Soil & Crop Sciences
and Department of Biology at Texas A&M University, the Texas Agricultural
Experiment Station, Biological Research Service, Inc., Buffalo Ranch, T-Systems
International, Inc., and Stoneville Pedigreed Seed are acknowledged for their financial
support and material contributions.
The following individuals did not serve on my graduate committee but provided
support and enriched my educational experience: Dr. C. Wayne Smith, Texas A&M
University; Dr. Scott Senseman, Texas A&M University; Dr. Michael Speed, Texas
A&M University; Dr. Ty Witten, Monsanto Corporation; Mr. Jess McCrory and Mr.
Jimmy Killebrew, Buffalo Ranch; and Mr. Roger Horn, Texas A&M University.
I would also like to extend thanks to the Cotton Physiology Workgroup at Texas
A&M University for their hard work and generosity in accomplishing field research
tasks. Thanks are also given to my sisters, Denise and Lauren, for assisting me with this
project. My wife, Leah Hundley, is especially appreciated for all the afternoons and
evenings spent assisting me in collection of scientific data for this study.

vii
Special appreciation is extended to Dr. J. Tom Cothren, the chair of my graduate
committee, for his patience, generosity, and unwavering support throughout my
academic and research endeavors.
Finally, I would like to thank my parents, Mike and Linda Hundley, for instilling
a solid work ethic and drive in me from a young age. Their continuous support and love
have provided the tools needed to complete this degree.

viii
TABLE OF CONTENTS
ABSTRACT………………………………... …………………………………….
DEDICATION……………………………………….…………………………...
ACKNOWLEDGEMENTS…………………………..………………………......
TABLE OF CONTENTS……………………………..…………………………..
LIST OF FIGURES…………………………….……...……………...………….
LIST OF TABLES……………………………………….……………………….
INTRODUCTION………………………………………………………………..
OBJECTIVES……………….………………….………………………... MATERIALS AND METHODS……..……………….………………………… FIELD STUDY…………………………………………………..………. GREENHOUSE STUDY………………….……………….…...………... RESULTS AND DISCUSSION…………………………….…………..……….. FIELD STUDY……………….………………..………………………… Yield………………………………..………….........................…. Lint Quality Characteristics…………………………………….... Leaf Tissue Nutrient Analysis……………………………….…… Plant Growth Parameters………………………………………… Plant Biomass Partitioning – Peak Bloom……………………….. Plant Mapping – Harvest………………………………………… GREENHOUSE STUDY………………………………………………… Yield…………………………………………………...…………. Leaf Tissue Nutrient Analysis……………………...……………. Plant Growth Parameters.……………………………..…………. Plant Biomass Partitioning and Plant Mapping – Cutout…….….. Plant Mapping – Harvest……………………..…………………..
CONCLUSIONS…………………………………………………………………
REFERENCES…………………………………………………...........................
Page
iii
v
vi
viii
x
xviii
1
7
8
8 18
22
22 22 28 33 44 62 88
124 124 127 132 146 155
168
173

ix
APPENDIX A………………………………………………………….………… APPENDIX B…………………………………….……………………...………. VITA……………………………………………………………………………...
Page
180
184
187

x
LIST OF FIGURES
FIGURE
1 Precipitation and irrigation from 1 Apr. to 31 Oct. for 2001 and 2002…..
2 Cotton lint yield for the 2001 and 2002 field studies……………………..
3 Cotton lint yield combined over years as related to cultivar for the field study …..………………………………….……………………………....
4 Cotton lint yield combined over years as related to insecticide regime
(IR) treatments for the field study………………………………………... 5 Seedcotton yield combined over years as related to insecticide regime
(IR) treatments for the field study………………………………………... 6 Percent ginout of cotton combined over years as related to insecticide
regime (IR) treatments for the field study………………..……….……… 7 Phosphorus (P) concentration in leaf tissue combined over years for
insecticide regime (IR) treatments in the field study……..………………
8 Potassium (K) concentration in leaf tissue combined over years for insecticide regime (IR) treatments in the field study………..……………
9 Phosphorus (P) concentration in leaf tissue combined over years for two
cotton cultivars in the field study………..………………………………..
10 Height trends combined over years for three cotton cultivars from 70 to 100 days after planting in the field study…………………………………
11 Plant height combined over years for three cotton cultivars at mid-
bloom, peak bloom, and cutout in the field study………………………...
12 Height trends combined over years for insecticide regime (IR) treatments from 70 to 100 days after planting in the field study………....
13 Number of main-stem nodes combined over years for three cotton
cultivars at mid-bloom, peak bloom, and cutout in the field study…….....
14 Number of main-stem nodes combined over years for insecticide regime (IR) treatments at mid-bloom, peak bloom, and cutout in the field study..
Page
23
24
26
27
29
30
36
41
43
45
46
47
49
50

xi
FIGURE
15 Average internode length combined over years for three cultivars at mid-bloom, peak bloom, and cutout in the field study………………..………
16 Average internode length trends combined over years for three cotton
cultivars from 70 to 100 days after planting in the field study……........... 17 Average internode lengths combined over years for insecticide regime
(IR) treatments at mid-bloom, peak bloom, and cotton cutout in the field study…………………………………………………………………
18 Average internode length trends combined over years for insecticide
regime (IR) treatments from 70 to 100 days after planting in the field study.……………………………………………………………………...
19 Average nodes above first position white flower (NAWF) trends from 70
to 105 days after planting for the 2001 and 2002 field studies…………...
20 Cumulative precipitation for the 2001 and 2002 field studies from planting to harvest………………………………………………………...
21 Daily growing degree days (DD60s) for the 2001 and 2002 field studies
from planting to harvest…………………………………………………..
22 Cumulative growing degree days (DD60s) for the 2001 and 2002 field studies from planting to harvest.…………………………..……………...
23 Average nodes above first position white flower (NAWF) trends
combined over years for three cotton cultivars from 70 to 105 days after planting in the field study.……………………………………...………...
24 Average nodes above first position white flower (NAWF) trends
combined over years for insecticide regime (IR) treatments from 70 to 105 days after planting in the field study.….……………………………..
25 Dry weight of leaf tissue per plant combined over years for three cotton
cultivars at peak bloom in the field study.………………………………..
26 Dry weight of stem tissue per plant combined over years for three cotton cultivars at peak bloom in the field study.………………………………..
27 Dry weight of leaf tissue per plant combined over years for insecticide
regime (IR) treatments at peak bloom in the field study.…………..……..
Page
51
53
54
55
57
59
60
61
63
64
65
66
67

xii
FIGURE
28 Dry weight of stem tissue per plant combined over years for insecticide regime (IR) treatments at peak bloom in the field study.…………………
29 Total square dry weight per plant at peak bloom for the 2001 and 2002
field studies………………………………………………………………. 30 Total number of squares per plant at peak bloom for the 2001 and 2002
field studies………………………………………………………………. 31 Total number of bolls per plant at peak bloom for the 2001 and 2002
field studies……………………………………………………………….
32 Total dry weight of bolls per plant at peak bloom for the 2001 and 2002 field studies……………………………………………………………….
33 Total square dry weight per plant combined over years at peak bloom for
three cotton cultivars in the field study.…………..………………….......
34 Mean square dry weight per plant combined over years at peak bloom for three cotton cultivars in the field study.……….……………………...
35 Total number of squares per plant combined over years at peak bloom
for three cotton cultivars in the field study.…………….………………...
36 Total boll dry weight per plant combined over years at peak bloom for three cotton cultivars in the field study.…………………………………..
37 Mean boll dry weight per plant combined over years at peak bloom for
three cotton cultivars in the field study.…………………………………..
38 Total number of bolls per plant combined over years at peak bloom for three cotton cultivars in the field study.…………………………………..
39 Total square dry weight per plant combined over years at peak bloom for
insecticide regime (IR) treatments in the field study.………….…………
40 Total number of squares per plant combined over years at peak bloom for insecticide regime (IR) treatments in the field study.……………..….
41 Mean square dry weight per plant combined over years at peak bloom
for insecticide regime (IR) treatments in the field study.………………...
Page
68
70
71
72
73
74
75
76
77
78
79
81
82
83

xiii
FIGURE
42 Total number of bolls per plant combined over years at peak bloom for insecticide regime (IR) treatments in the field study.…………………….
43 Mean boll dry weight per plant combined over years at peak bloom for
insecticide regime (IR) treatments in the field study.…………………..... 44 Total boll dry weight per plant combined over years at peak bloom for
insecticide regime (IR) treatments in the field study.…………….……… 45 Percent of total plant biomass partitioned as fruit combined over years at
peak bloom for insecticide regime (IR) treatments in the field study.……
46 Percent of total plant biomass partitioned as fruit combined over years at peak bloom for three cotton cultivars in the field study…….……………
47 Plant height combined over years at harvest for three cotton cultivars in
the field study……………………………………………………………..
48 Number of main-stem nodes combined over years at harvest for three cotton cultivars in the field study………………………………………....
49 Average internode length combined over years at harvest for three cotton
cultivars in the field study………………………………………………...
50 Plant height combined over years at harvest for insecticide regime (IR) treatments in the field study.……………………………………………...
51 Number of main-stem nodes combined over years at harvest for
insecticide regime (IR) treatments in the field study.…….………………
52 Average internode length combined over years at harvest for insecticide regime (IR) treatments in the field study.………………………..……….
53 Seedcotton yield per plant combined over years at harvest for three
cotton cultivars in the field study………………………………………....
54 Seedcotton yield per plant combined over years at harvest for insecticide regime (IR) treatments in the field study.………………………..……….
55 Number of harvestable bolls per plant at harvest for 2001 and 2002 field
studies…………………………………………………………………….
Page
84
85
86
87
89
92
93
94
96
97
98
99
100
102

xiv
FIGURE 56 Mean seedcotton weight per boll at harvest for 2001 and 2002 field
studies…………………………………………………………………….
57 Number of harvestable bolls per plant combined over years at harvest for three cotton cultivars in the field study…………………………………...
58 Mean seedcotton weight per boll combined over years at harvest for
three cotton cultivars in the field study……………………....…………...
59 Number of harvestable bolls per plant combined over years at harvest for insecticide regime (IR) treatments in the field study………………..……
60 Mean seedcotton weight per boll combined over years at harvest for
insecticide regime (IR) treatments in the field study…………..………… 61 Number of harvestable bolls located at fruiting positions 1, 2, and 3 per
plant at harvest for the 2001 and 2002 field studies…………………...…
62 Number of harvestable bolls located at fruiting positions 1, 2, and 3 per plant combined over years at harvest for three cotton cultivars in the field study…………………………………………………………………
63 Number of harvestable bolls located at fruiting positions 1, 2, and 3 per
plant combined over years at harvest for insecticide regime (IR) treatments in the field study.……………………………………….……..
64 Number of harvestable bolls located at the second fruiting position
throughout sympodia 6 through 10 combined over years at harvest for insecticide regime (IR) treatments in the field study.…………………….
65 Number of harvestable bolls per plant separated according to distribution
on sympodia 3 through 25 at harvest for the 2001 and 2002 field studies.
66 Number of harvestable bolls per plant separated according to distribution on sympodia 3 through 25 combined over years at harvest for the three cotton cultivars in the field study.………………………………….……..
67 Number of harvestable bolls per plant separated according to distribution
on sympodia 3 through 25 combined over years at harvest for insecticide regime (IR) treatments in the field study.……………………………..….
Page
103
106
107
108
110
111
112
113
115
117
118
119

xv
FIGURE 68 Seedcotton contribution of sympodial ranges as a percentage of final
yield combined over years for three cotton cultivars in the field study...... 69 Seedcotton contribution of sympodial ranges as a percentage of final
yield combined over years for insecticide regime (IR) treatments in the field study…………………………………………………………………
70 Seedcotton yield per plant for three cotton cultivars in the greenhouse
study……………………………………………………………………… 71 Seedcotton weight per plant for insecticide regime (IR) treatments in the
greenhouse study.……….………………………………………………...
72 Phosphorus (P) concentration in leaf tissue for insecticide regime (IR) treatments in the greenhouse study.………………………………………
73 Phosphorus (P) concentration in leaf tissue for two cotton cultivars in the
greenhouse study.…………………………….…………………………... 74 Height trends for three cotton cultivars from 38 DAP until harvest (146
DAP) in the greenhouse study.…………..……………………………….
75 Plant height at cotton cutout and harvest for three cotton cultivars in the greenhouse study.………………….……………………………………...
76 Plant height at cotton cutout and harvest for insecticide regime (IR)
treatments in the greenhouse study.………………………………………
77 Height trends for insecticide regime (IR) treatments from 38 DAP until harvest (146 DAP) in the greenhouse study.……………..……………….
78 Number of main-stem nodes at cotton cutout and harvest for three cotton
cultivars in the greenhouse study.………………………..……………….
79 Average internode length trends for three cotton cultivars from 38 DAP until harvest (146 DAP) in the greenhouse study...……………………...
80 Average internode length at cotton cutout and harvest for three cotton
cultivars in the greenhouse study…………………………………………
81 Average internode length trends for insecticide regime (IR) treatments from 38 DAP until harvest (146 DAP) in the greenhouse study…..……..
Page
121
122
125
126
128
130
134
135
136
137
138
139
141
142

xvi
FIGURE 82 Comparison of daily growing degree days (DD60s) for the 2001 and
2002 field and the 2003 greenhouse studies from planting to harvest…… 83 Comparison of cumulative growing degree days (DD60s) for the 2001
and 2002 field and the 2003 greenhouse studies from planting to harvest.
84 Dry weight of stem tissue per plant at cutout for three cotton cultivars in the greenhouse study……………………………………………………...
85 Dry weight of leaf tissue per plant at cutout for three cotton cultivars in
the greenhouse study……………………………………………………...
86 Leaf area per plant at cutout for three cotton cultivars in the greenhouse study………………………………………………………………………
87 Percent of total plant biomass partitioned as fruit at cutout for three
cotton cultivars in the greenhouse study……...………………...………... 88 Total number of bolls per plant at cutout for three cotton cultivars in the
greenhouse study …………….…………………………………………...
89 Mean boll dry weight per plant at cutout for three cotton cultivars in the greenhouse study.……………….………………………………………...
90 Number of bolls located at fruiting positions 1 through 3 per plant at
cutout for three cotton cultivars in the greenhouse study………………...
91 Number of vegetative bolls per plant at cutout for three cotton cultivars in the greenhouse study…………………………………………………...
92 Dry weight of stem tissue per plant at cutout for insecticide regime (IR)
treatments in the greenhouse study……………………………………….
93 Dry weight of leaf tissue per plant at cutout for insecticide regime (IR) treatments in the greenhouse study……………………………………….
94 Leaf area per plant at cutout for insecticide regime (IR) treatments in the
greenhouse study………..………………………………………………...
95 Number of harvestable bolls located at fruiting positions 1 through 3 per plant for three cotton cultivars in the greenhouse study………………….
Page
144
145
147
148
149
150
151
152
153
154
156
157
158
159

xvii
FIGURE
96 Mean seedcotton weight for bolls located at fruiting positions 1 through 3 for three cotton cultivars in the greenhouse study,,,…………………....
97 Number of harvestable bolls located on sympodia 6 through 15 per plant
for three cotton cultivars in the greenhouse study………………………..
98 Seedcotton contribution of sympodial ranges as a percentage of final yield for three cotton cultivars in the greenhouse study………………….
99 Number of harvestable bolls located at fruiting positions 1 through 3 per
plant for insecticide regime (IR) treatments in the greenhouse study…….
100 Mean seedcotton weight for bolls located at fruiting positions 1 through 3 for insecticide regime (IR) treatments in the greenhouse study………...
101 Seedcotton contribution of sympodial ranges as a percentage of final
yield for insecticide regime (IR) treatments in the greenhouse study....….
Page
161
162
163
165
166
167

xviii
LIST OF TABLES
TABLE
1 Timing of insecticide regime (IR) applications with corresponding phenological stages of cotton growth……………………………………..
2 Insecticides and corresponding rates composing insecticide regime (IR)
treatments for each of nine applications (APP)…………………………..
3 Effect of year on lint quality characteristics for 2001 and 2002 field studies………………………………………………………………..…...
4 Cultivar effects on lint quality characteristics combined over years for
the field study………………………………………………….…………. 5 Insecticide regime (IR) effects on lint quality characteristics combined
over years for the field study.…………………………………………….. 6 Amount of phosphorus (P) applied through individual NP+FP foliar
treatments for nine insecticide regime (IR) treatment applications in the field study…..……………………………………………………………..
7 Amount of potassium (K) applied through individual NP+FP foliar
treatments for nine insecticide regime (IR) treatment applications in the field study……………..…………………………………………………..
8 Amount of nitrogen (N) applied through individual NP+FP foliar
treatments for nine insecticide regime (IR) treatment applications in the field study…..……………………………………………………………..
9 Amount of phosphorus (P) applied through individual NP+FP foliar
treatments for seven insecticide regime (IR) treatment applications in the greenhouse study…..……………………………………………………...
Page
10
11
32
34
34
37
39
42
129

1
INTRODUCTION
Pest management in cotton (Gossypium hirsutum L.) constitutes a major
challenge for the production of a successful crop. Beginning early in the growing
season, producers put forth great efforts to minimize weed competition and insect
pressure. This challenge ensues for the duration of the cotton growing season. With the
evolution of technology, the agronomic world encountered a valuable tool: transgenic
technology. With the advent of this technology, producers could make broad-spectrum
herbicide applications to a once vulnerable crop now equipped with the insertion of the
Roundup Ready® gene. Insect management was also redefined through the
implementation of a new tool.
In the late 1980’s, Monsanto began development of Bollgard® (Bt) insect-
protected cotton by transformation with a construct containing the cry1Ac gene from
Bacillus thuringensis var. kurstaki, a naturally occurring soil bacterium (Peferoen, 1997;
Adkisson et al., 1999). When target pests, such as key lepidopteran species, ingest the
toxin, the Bt protein interferes with the insect’s digestive system and causes death.
Due to the onset of this technology, the seed market has experienced a shift in the
demand between conventional and transgenic cultivars. Genetically modified cotton
hectarage has increased dramatically over the last six years. In 2002, Texas planted 1.2
million genetically modified cotton hectares and U.S. hectarage reached 4.3 million
(NASS, USDA Agricultural Statistics, 2002). Upland cotton planted in Texas,
encompassing all technology types, totaled 5.6 million hectares in 2002. Concern has
This thesis follows the style and format of Crop Science.

2
been expressed recently by many segments of the industry regarding yield and quality
trends for some regions of the U.S. Cotton Belt (Kerby et al., 2002).
Reports of variable results in fiber quality and yield have arisen in genetically
modified cultivars. Bryant et al. (2000), in conjunction with the University of Arkansas,
have conducted economic evaluations of transgenic cotton systems since 1996. In 2000,
Bryant et al. reported mixed results regarding yield depending on the year of
comparison, cultivars involved, location, and the management practices utilized. For
example, evaluation of Bollgard® cultivars at the Southwest Arkansas location resulted
in a positive change in profit every year, with the exception of one observation. Six
cultivars were evaluated at the Southeast Arkansas location, resulting in a conventional
cultivar producing yields and returns that were statistically greater than the remaining
cultivars. A stacked-gene cultivar at that location resulted in significantly less yield and
return than the other five cultivars. All six cultivars at the Northwest Arkansas location
resulted in non-significant differences. Evaluation at the South Central and Central
Arkansas locations resulted in Bollgard® cultivars having negative changes in profit
(resulting from lower yield). In 1997, ReJesus et al. conducted a study on the economic
analysis of insect management strategies for transgenic Bt cotton production at two
locations in South Carolina. This study found that one location resulted in higher actual
experimental yield for Bt cotton than non-Bt cotton though statistical analysis exhibited
no significant differences between the two sites. Lege’ et al. (2001) found no consistent
trends for lint yield, staple length, fiber strength, or micronaire with regard to technology
type, which parallels conclusions of Kerby et al. (2000) and Ethridge and Hequet (2000).

3
Some studies have shown insecticides to exhibit plant growth regulator
properties. In 1990, Bauer and Cothren reported the effects of chlordimeform, [N’-(4-
chloro-o-tolyl)-N,N-dimethylformamidine], on the physiological activity of radish
(Raphanus sativa L.) seedlings. This study showed chlordimeform to possess growth
promoting characteristics similar to the natural plant hormone, cytokinin. Another
study, conducted by Reddy et al. (1997), involved the plant growth regulator
characteristics exhibited by a member of the carbamate class of insecticides. In 1997,
Reddy et al. showed that aldicarb [2-methyl-2-(methylthio)propionaldehyde O-
(methylcarbamoyl)oxime] increased early season vegetative growth of cotton at certain
day/night temperature combinations. Other results indicated that the treated plants had
increased root growth, greater root length densities, and higher root/shoot ratios than
control plants at all temperature ranges. Summary results for this study showed that
aldicarb promoted cotton earliness by enhancing growth rates and promoting deeper root
penetration into the soil.
Some changes in production practices have occurred coincident with the
introduction of transgenic technology, such as reduced use of broad-spectrum
insecticides including organophosphates (OP), as well as less cultivation (Edge et al.,
2001), that could potentially influence the growth and yield of cotton. One factor that
might affect these parameters is the difference in the amount of foliarly-applied
phosphorus (P) between an OP and non-OP insecticide regime. The reduced use of
broad-spectrum OP insecticides negates any beneficial effects the P component common
to the chemical structure of all OPs have on the plant. Considered a macronutrient, P is

4
an integral component of key compounds of plant cells. This includes the sugar-
phosphate intermediates of respiration and photosynthesis, and the phospholipids that
make up plant membranes (Taiz and Zeiger, 1998). It is also a component of nucleotides
used in plant energy metabolism and in DNA and RNA (Taiz and Zeiger, 1998).
Adenosine di- and triphosphates (ADP and ATP) act as “energy currency” within plants
(Havlin et al., 1999). When the terminal phosphate molecule from either ADP or ATP is
split off, a relatively large amount of energy (12,000 cal mol-1) is liberated (Havlin et al.,
1999). Energy obtained from photosynthesis and metabolism of carbohydrates is stored
in phosphate compounds for subsequent use in growth and reproductive processes
(Havlin et al., 1999). Almost every metabolic reaction of any significance proceeds via
phosphate derivatives (Havlin et al., 1999). Because of its vital role in biological
functions within the plant, P deficiencies can have a major impact on plant health.
Plants uptake P by absorbing either H2PO4- or HPO4
2- orthophosphate ions, with H2PO4-
absorption greatest at low pH values and HPO42- greatest at higher soil pH values
(Havlin et al., 1999). Plants may also absorb certain soluble organic phosphates;
however, their importance as sources of P for higher plants is limited (Havlin et al.,
1999). Phosphorus is one of the least available of all essential nutrients in the soil and
its concentration is generally below that of many other micronutrients (Barber et al.,
1963). Additionally, because of the unique interaction of P with other elements, up to
80% of applied P may be fixed in the soil (Barrow, 1980; Holford, 1997). A study was
conducted in Pakistan to determine the effect of P on growth, yield, and fiber quality of
two cotton cultivars. The results of this study showed a significant increase in seed

5
cotton yield due to P fertilizer application (Makhdum et al., 2001). Nelson (1949)
studied cotton under conditions of a yield response to applied nutrients and reported
increased seedcotton yields with soil-applied P applications of up to 56 kg P2O5 ha-1.
However, Hons et al. (1990a) conducted a study on a soil testing high in available P and
reported that soil-applied P had no influence on lint or seed yields.
Research has shown that cotton uptakes approximately 17 to 19 kg P ha-1 during
the growing season, depending on soil type (Bassett et al., 1970; Mullins and Burmester,
1990). Olson and Bledsoe (1942) reported that mature cotton plants grown on three soil
types removed 4.4 kg P 100 kg-1 lint produced. Work by Bassett et al. (1970) found
mature plants contained 1.3 kg P 100 kg-1 lint for irrigated cotton in California, while
Halevy (1976) reported 2.6 to 2.7 kg P 100 kg-1 lint produced from two cotton cultivars
under irrigated conditions in Israel. Bassett et al. (1970) reported that the removal of P
from the field at harvest was 9 to 12 kg ha-1 in the seed, which represents between 52
and 62 % of the total P recovered from mature plants. The work of Mullins and
Burmester (1990), who reported approximately 52.8 % of total plant P was distributed
within the seed, supports the findings of Bassett et al. (1970). Furthermore, Bassett et al.
(1970) found that the P content of seed was approximately 0.56 to 0.61 % P. Olsen and
Bledsoe (1942) reported P accumulation within the plant peaked from 90 to 105 days
after emergence. During this period a maximum accumulation rate of 0.74 kg P ha-1 d-1
was reached with cotton grown on a Cecil soil (clayey, kaolinitic, thermic Typic
Hapluduts).

6
Due to the large quantity required by plants, foliar feeding of P has generally not
been found to be practical. This is primarily because frequent application of small
amounts is required to avoid injury to the leaves. Lancaster and Savatli (1965) found
that solutions of monoammonium and of sodium polyphosphate (mixture of
orthophosphoric acid and sodium pyrophosphate) containing as little as 1.5 % P2O5
caused some leaf injury. Careful consideration must be made regarding the strength of
solutions for foliar application. Some research has shown potential for yield increases
from foliar P applications; however, results have been variable. Lancaster and Savatli
(1965) reported that foliar application of P during the latter part of the fruiting period at
one location did not increase yield, while at another location, a yield increase was
observed. Other work, as reported by Kuepper (2003), has shown potential benefits
related to the increased uptake of additional nutrients from the soil as a response to foliar
fertilization. Kuepper (2003) contends that the logic behind this theory is based on the
belief that foliar fertilization causes the plant to pump more sugars and exudates from its
roots into the rhizosphere. The increased availability of these exudates stimulates
beneficial microbial populations in the root zone. The enhanced biological activity
potentially results in greater availability of nutrients, disease suppressive biochemicals,
vitamins, and other beneficial constituents conducive to plant growth.

7
OBJECTIVES
Studies were conducted over a three-year period with field and greenhouse
experiments in accordance to the following objectives: (i) to ascertain if the
organophosphate class of insecticides exhibit plant growth regulator characteristics, (ii)
determine the effects of foliar phosphorus and organophosphate applications on selected
growth parameters, yield, and fiber quality (iii) evaluate differences in cultivar response
to foliar treatments, and (iv) assess variations in yield and fiber quality of genetically
modified and conventional cotton.

8
MATERIALS AND METHODS
FIELD STUDY
A four replication strip-plot experimental design was utilized with cultivar
serving as the whole plot and insecticide regime as the sub-plot. A strip-plot is like a
split-plot experimental design but with differently constructed experimental units
(Milliken and Johnson, 1992). The subunit treatments are applied in strips across an
entire replication of main plot treatments. In the case of this study, the strip-plot design
was chosen for practicality considerations regarding foliar treatment application and drift
concerns. The study was sectioned into four quadrants, each making one repetition.
Each repetition was surrounded on two sides with an eight-row border of FiberMax
989BR cotton. A 7.62-m alleyway was located at the front and back sides of each
repetition. It was necessary to incorporate this degree of spatial separation to prevent
drift contamination of treatments during application. The experimental design provided
for nine treatments with a total of 36 four-row test plots 15.24 m in length.
Three cotton cultivars of the same recurrent parent (cv. Stoneville Pedigreed
Seed (ST): ST4892BR, ST4793R, and ST474) were planted April 11, 2001 and 2002 on
1.02 m row-spacing at uniform populations under irrigated conditions in Burleson
County near College Station, TX. ST4892BR represents the Bollgard® + Roundup
Ready® stacked-gene cultivar, ST4793R is the Roundup Ready® cultivar, and ST474
represents the conventional cultivar. ST4892BR and ST4793R are transgenic cultivars
and ST474 is the recurrent parent of the two transgenic lines. The soil type, classified as
Weswood silty clay loam (fine-silty, mixed, thermic Fluventic Ustochrept), is an alluvial

9
soil in the Brazos River floodplain. The insecticide regime (IR) consisted of three
unique application regimes. In the first regime, all insecticides consisted of the
organophosphate OP group, which served as the phosphate-based insecticide application.
The second regime utilized applications of non-phosphate (NP) insecticides and served
as an experimental control. The third regime (NP+FP) consisted of NP plus additional
foliar phosphorus (FP) applied as 12-48-08, in the form of a water soluble fertilizer
(RSA MicroTech, LLC, Marysville, WA). The 12-48-08 fertilizer utilized ammonium
phosphate as a source of P. The FP was applied at an equivalent P2O5 weight as the
concurrent OP application. To calculate the amount of FP to apply as P2O5, the amount
of the P component contained in an individual OP insecticide was ascertained from the
chemical formula for each of the OP insecticides used. Recommended insecticide rates,
attained from the chemical label, were followed for each application on all regimes.
Nine applications of this IR were made during the season at key phenological stages
commencing with pinhead square through ten percent open bolls (Table 1). The rates for
each of the nine IR applications are listed in Table 2.
Specific definitions were followed to assess the stage of growth for the IR
treatment timings. Pinhead square and matchhead square occur when the size of squares
on the cotton plant are equivalent to the size of a pinhead and matchhead, respectively.
First bloom was determined by the appearance of at least one white flower in the study.
Early bloom was marked by the appearance of 5 to 6 white flowers per 7.62 m of row.
Mid-bloom period was defined by approximately 3 weeks of flowering (Ohlendorf et al.,
1996). Peak bloom was determined by counting the number of white flowers per 7.62 m

10
Table 1. Timing of insecticide regime (IR) applications with corresponding phenological stages of cotton growth.
IR Application Number Stage of Growth
1 Pinhead Square
2 Matchhead Square
3 First Bloom
4 Early Bloom
5 Mid-Bloom
6 Peak Bloom
7 Cutout
8 First Open Boll
9 10 % Open Bolls

11
Table 2. Insecticides and corresponding rates composing insecticide regime (IR) treatments for each of nine applications (APP).
IR Treatment†
APP NP NP+FP‡ OP
1 Capture® 2EC (0.30 L ha-1) 12-48-08 (0.13 kg ha-1) Guthion® 2L (1.17 L ha-1)
2 Capture® 2EC (0.30 L ha-1) 12-48-08 (0.13 kg ha-1) Guthion® 2L (1.17 L ha-1)
3 Capture® 2EC (0.30 L ha-1) 12-48-08 (0.13 kg ha-1) Guthion® 2L (1.17 L ha-1)
4 Capture® 2EC (0.30 L ha-1) 12-48-08 (0.13 kg ha-1) Guthion® 2L (1.17 L ha-1)
5 Fury® 1.5EC (0.22 L ha-1) 12-48-08 (0.26 kg ha-1) Bidrin® 8 (0.44 L ha-1)
6 Fury® 1.5EC (0.22 L ha-1) 12-48-08 (0.33 kg ha-1) Curacron® 8E (0.88 L ha-1) Fury® 1.5EC (0.15 L ha-1)
7 Fury® 1.5EC (0.22 L ha-1) 12-48-08 (0.33 kg ha-1) Curacron® 8E (0.88 L ha-1) Fury® 1.5EC (0.15 L ha-1)
8 Fury® 1.5EC (0.22 L ha-1) 12-48-08 (0.33 kg ha-1) Curacron® 8E (0.88 L ha-1) Fury® 1.5EC (0.15 L ha-1)
9 Fury® 1.5EC (0.22 L ha-1) 12-48-08 (0.44 kg ha-1) Curacron® 8E (0.1.17 L ha-1)
†The following designations were used to denote IR treatments: NP, non-phosphate insecticide treatment (control); NP+FP, non-phosphate + foliar phosphorus treatment; and OP, organophosphate insecticide treatment.
‡The quantity listed represents the amount of fertilizer product applied.

12
of row. The point at which the white flower count is highest before declining is
designated as peak bloom. Cutout occurs when the cotton reaches 5 average nodes
above the first position white flower (Oosterhuis et al., 1996). The first open boll stage
of growth was determined by at least 50 percent of the plots in the study having an open
boll (Ohlendorf et al., 1996). The 10 percent open boll stage was determined by
conducting open and closed boll counts throughout the field and calculating the percent
of open bolls.
All border rows were treated with NP at every IR spray interval. The Boll
Weevil Eradication Program was in progress concurrent with the study dates and locale
for this experiment. This presented a unique challenge in maintaining the integrity of the
experiment. Because the Program uses Malathion ULV (O,O-dimethyl
phosphorodithioate of diethyl mercaptosuccinate), an OP material, collaboration was
necessary to meet their treatment requirements and timings to preclude IR adulteration.
In response to this and other pest concerns, broadcast NP applications were made,
outside of the IR protocol, to all treatments as called for by scouting results based on
threshold levels for the conventional cultivar to minimize pest pressure (Appendix A).
All field plots were subjected to seed treatment with Gaucho® 480 (5.2 ml kg-1), and
Temik® 15G (4.48 kg ha-1) was applied in-furrow at planting.
Determination of residual macronutrients at the test site was acquired through
soil analysis. Prior to cotton planting, soil was sampled, at a depth of 15 to 20 cm, from
plots and mixed to procure a uniform sample. The soil analysis was conducted by the
Texas A&M University Soil, Water, and Forage Testing Laboratory located on the

13
Texas A&M University campus in College Station, TX. Determination of residual soil
NO3-N was based on methods by Keeney and Nelson (1982), while soil P2O5 and K2O
determinations were based on methods by Hons et al. (1990b). Residual NO3-N, P2O5,
and K2O were 17.9, 430.6, and 1134.8 kg ha-1, respectively. Cotton was seeded at a rate
of 11 to 12 seed per meter of row, at a depth of 3.2 cm, using an eight-row John Deere
Max-Emerge® planter. In 2001, irrigation was provided using a pivot overhead sprinkler
system. Subsurface drip irrigation was installed before planting in 2002. The irrigation
T-Tape® was provided by T-Systems International, Inc. The T-Tape® was placed on
2.03 m furrow centers throughout the study. Approximately 2 cm (pivot) and the
equivalent of 2 cm (subsurface) of water was applied at each irrigation interval. All
other maintenance inputs were based on current local agronomic practices. In addition
to hand hoeing, chemical methods were used to control weeds. These chemicals are
listed in Appendix A.
Applications of IR treatments were made using a Hahn® self-propelled boom
sprayer equipped with two additional spray tanks. The sprayer control was modified to
accommodate all three tanks. In addition, a flush valve and manifold were incorporated
to prevent bypass and line contamination between treatments. The boom effectively
covered twelve rows allowing three plots to be sprayed at one time. The spray nozzles
used were Tee Jet® XR8002VS flat fan nozzles. Prior to spraying, all nozzles were
calibrated to deliver within five percent of the targeted volume. All IR treatments were
delivered at a volume of 93.5 L ha-1.

14
Characteristic growth data collected during the growing season consisted of plant
height and number of nodes (average of six randomly selected representative plants per
plot), collected at biweekly intervals, commencing just prior to initial insecticide
application. Stage of growth was evaluated in terms of nodes above white flower
(NAWF). Measurements of NAWF were collected on six randomly selected
representative plants per plot at mid-bloom [75 and 71 days after planting (DAP) for
2001 and 2002, respectively] and continued at weekly intervals until first open boll.
Biomass partitioning was assessed one week prior to peak bloom (85 and 81
DAP, in 2001 and 2002, respectively) to determine plant height, number of nodes, and
fruiting and biomass distribution. Six representative plants were cut below the
cotyledonary scars on the main stem from rows one and four of each plot, and after
visual examination, the least uniform plant was discarded. Dry weight data for the
resulting five plants were recorded for stems, leaves, squares, and bolls as well as counts
for number of squares and bolls.
Tissue analysis was conducted to determine the concentration of P in the leaf
tissue. Due to financial considerations, tissue analysis was conducted on two of the
three cultivars. It was determined that samples would be taken from the transgenic
stacked-gene and conventional cultivars, ST4892BR and ST474, respectively. At 114
and 116 DAP in 2001 and 2002, respectively, a total of ten leaves were removed at
random from rows two and three of each plot, collectively. Criteria for collecting a
sample leaf involved removing the fourth leaf below the plant terminal, counting at least
a quarter-size terminal leaf as zero. Leaf petiole tissue was not included in the sampling.

15
The timing for tissue sampling occurred approximately 7 to 8 days after the eighth IR
treatment. Consequently, the leaves chosen for removal were young terminal leaves at
the time of the eighth IR treatment. In essence, this results in all sampled leaves being of
approximately the same age, size, and IR exposure. The site for leaf removal in
conjunction with the sampling date were chosen to provide sufficient time for the young
terminal leaf, exposed to the target IR treatment, to mature to a reasonable sample size,
yet permit removal prior to the following IR treatment. The leaf samples were analyzed
for nutrient content by the Texas A&M Soil, Water, and Forage Testing Laboratory
located on the Texas A&M University campus in College Station, TX. Determination of
nutrient concentration in leaf tissue was based on methods by Feagley et al. (1994). The
results of this procedure allow the determination of P concentration comparisons
between the respective IR treatments. Evidence from this analysis is important to
ascertain if FP uptake was observed from the NP+FP and OP treatments.
Plant mapping was conducted at harvest to determine plant height, number of
nodes, and fruiting patterns at the conclusion of the growing season. The plant mapping
technique and program constructed for this project were based on an adaptation of the
methods developed by Landivar (1993) and Jenkins and McCarty (1995). On the day of,
but prior to harvest, ten representative plants were removed from rows one and four of
each plot. After visual examination, six uniform plants were selected for analysis. Boll
distribution and seedcotton weight were recorded by sympodial zone (e.g. vegetative, 3-
5, 6-10, 11-15, 16-20, and 21-25) and fruiting position. For the purposes of reporting
plant mapping data, the sympodial zones are indicative of main-stem nodes counted
16
from the cotyledonary scars. The cotyledonary scars are counted as node zero. Fruit
obtained from monopodial branches are included in the vegetative grouping. The
predominant branch-type for the designated nodal groupings are sympodial
(reproductive) branches. These data were imported into statistical software and program
code was written to accommodate this data for analysis.
Harvest aids (Appendix A) were utilized in both years to prepare the crop for
harvest. The application and timing of these chemicals were based on current local
agronomic practices. Harvest aids were applied when the crop averaged 60% open bolls.
Yield in 2001 and 2002 was acquired through the use of a two-row spindle cotton picker.
Cotton was harvested from the two center rows in each plot and collected into burlap
sacks via a modified chute system. Due to machine complications in 2002, only one
center row was harvested. The entire length of 15.24 m was harvested for yield
calculations. As a cautionary measure, between plots, the spindle and blower
mechanism was operated, absent of cotton, to clear chutes of remaining seedcotton. The
blower chutes were also visually checked and cleared, if necessary, to prevent cross plot
contamination of seedcotton. If any cotton was collected during this process, it was
placed in the sack for the respective plot. During harvest operations, seedcotton weight
for each sack was recorded using a calibrated load cell connected to a computer. The
sack weight was recorded in electronic and hardcopy forms. Empty weights of all burlap
sacks were recorded and sacks were assigned unique plot identification numbers prior to
harvest. This data was used to calculate actual seedcotton yield on a hectare basis for
each plot. Following documentation of seedcotton weights, sub-samples were collected

17
to determine percent ginout and lint yield. A small saw-type, hand-fed, 10-blade
research gin (Dennis Manufacturing, Inc., Athens, TX) was used to separate lint and
seed. Lint obtained from the sample was weighed and divided by initial seedcotton
weight to determine percent ginout. This data was subsequently used to calculate total
lint yield per hectare. A 50 g sub-sample of lint from each plot was acquired and sent to
the Texas Tech University International Textile Center, in Lubbock, Texas, for High
Volume Instrument (HVI) testing to determine lint quality characteristics for each
sample. Treatments effects on lint quality were determined from HVI data.
Statistical analysis was conducted on all appropriate data presented in this
document. Some exploratory analysis of data was performed through the use of SPSS®
(version 11.01) statistical software for computer systems running the Windows®
platform (SPSS Inc., 1989-2001). In particular, the SPSS® software was used for
developing profile plots, examination of homogeneity and normalcy of residuals, and
statistical model development and comparison. The SAS® (version 8.1) statistical
software was used for all final data analysis (SAS Institute, 1999-2000). Data was
subjected to the Mixed Models Procedure with degrees of freedom estimated using the
Satterthwaite approximation (Satterthwaite, 1946). Means were separated by the Tukey-
Kramer procedure to determine statistical differences at α=0.05 significance level,
unless otherwise noted. In the absence of year interactions, data for the 2001 and 2002
studies were combined. All graphical displays of data in this document were produced
with Microsoft® Excel® 2002 (version 10.4302.4219-SP-2) spreadsheet software
(Microsoft Corporation, 1985-2001).

18
GREENHOUSE STUDY
A greenhouse study was conducted to evaluate selected parameters under
controlled conditions. The greenhouse provided an environment where the effect of
differences in the efficacy of NP and OP insecticides on insect pressures could be
minimized. Three cotton cultivars (cv. Stoneville Pedigreed Seed: ST4892BR,
ST4793R, and ST474) were potted in one hundred and eight individual 18.9-L pots. The
study utilized Metro-Mix™ 200 (Scotts-Sierra Horticultural Company, Marysville, OH)
as a growing medium. The study was comprised of four replications of nine treatments
in a strip-plot experimental design. Cultivar served as the whole plot, and foliar IR
treatment composed the sub-plot. Each plot in this experiment was composed of three
plants to allow for harvest of mid-season biomass with two plants per plot available for
end-of-season harvest data collection. The IR treatments followed the same protocol as
the field study, with the exception of the last two applications. Due to large plant size
and potential damage from movement, only seven IR applications were made to this
study. To eliminate extraneous variables, 0-30-0 liquid foliar fertilizer (Growth
Products, Ltd., White Plains, NY) was utilized for NP+FP treatments instead of 12-48-
08. The 0-30-0 fertilizer utilized phosphoric acid as a source of P. The IR treatments
were applied using a hand-held two-row boom at a spray volume of 93.5 L ha-1. The
spray nozzles used were Tee Jet® TXVS-12 Cone Jet nozzles.
Specific definitions were followed to assess the stage of growth for the IR
treatment timings. Pinhead square and matchhead square occur when the size of squares
on the cotton plant are equivalent to the size of a pinhead and matchhead, respectively.

19
First bloom was determined by the appearance of at least one white flower in the study.
Early bloom was marked by the appearance of 5 to 6 white flowers per 100 plants. Mid-
bloom period was defined by approximately 3 weeks of flowering (Ohlendorf et al.,
1996). Peak bloom was determined by counting the number of white flowers per 100
plants. The point at which the white flower count is highest before declining is
designated as peak bloom. Cutout occurs when the cotton reaches 5 average nodes
above the first position white flower (Oosterhuis et al., 1996).
Data collection consisted of plant height, number of nodes, and NAWF
measurements made at weekly intervals on each plant commencing prior to the first IR
application and continuing for the duration of the study. Assessment of growth
parameters included plant mapping and biomass partitioning at cutout, followed by post-
season plant mapping and yield assessment. The plant mapping technique and program
constructed for this project were based on an adaptation of the methods developed by
Landivar (1993) and Jenkins and McCarty (1995). At cotton cutout, one plant from each
plot was cut below the cotyledonary scars on the main stem. Dry weight data for each
plant was recorded for stems, leaves, squares, and bolls as well as counts for number of
squares and bolls. In addition, biomass partitioning data includes measurements for leaf
area.
Fruiting distribution data and numerical counts were acquired through plant
mapping at the end of the season. At harvest, the remaining two plants per plot were
mapped to determine fruiting distribution and seedcotton yield.

20
Tissue analysis was conducted to determine the concentration of P in the leaf
tissue. Due to financial considerations, tissue analysis was conducted on two of the
three cultivars. It was determined that samples would be taken from the stacked-gene
and conventional cultivars, ST4892BR and ST474, respectively. Due to limitations in
the greenhouse, it was necessary to deviate from the sampling procedure utilized in the
field study. The limited space of the greenhouse resulted in a small sample size from
which leaf tissue was collected. In order to provide sufficient tissue weight for
performing the analysis, all leaves were collected from the entire plant of each plot at 79
DAP. The plants used for leaf tissue analysis were those that were destroyed for
collection of biomass partitioning data. Leaf petiole tissue was not included in the
sampling. The timing for tissue sampling occurred approximately 2 days after the
seventh IR treatment. The leaf samples were analyzed for nutrient content by the Texas
A&M Soil, Water, and Forage Testing Laboratory located on the Texas A&M
University campus in College Station, TX. Determination of nutrient concentration in
leaf tissue was based on methods by Feagley et al. (1994). The results of this procedure
allow the determination of P concentration comparisons between the respective IR
treatments. Evidence from this analysis is important to ascertain if FP uptake was
observed from the NP+FP and OP treatments.
Soil moisture levels were monitored daily by visual observation. Plants were
protected from water stress through high-frequency irrigation with reverse osmosis
water. A standard fertilizer regiment consistent with greenhouse practices for cotton was
followed. Plant nutrient requirements were met through biweekly soil application of

21
maintenance fertilizer, followed by weekly treatments commencing after first flower.
The maintenance fertilizers used were Peters Professional® water soluble fertilizer 20-
20-20 (Scotts-Sierra Horticultural Products Company, Marysville, OH) and Scotts®
STEM™ (soluble trace element mix) (Scotts-Sierra Horticultural Products Company,
Marysville, OH). Insects were monitored by scouting and pressures minimized using
broadcast NP insecticide applications, outside of the IR protocol, performed by the
greenhouse technical staff (Appendix B). Greenhouse temperature data was recorded
using a HOBO® Pro data logger (model: H08-032-08) (Onset Computer Corporation,
Bourne, MA).
Statistical analysis was conducted on all appropriate data for this study. Some
exploratory analysis of data was performed through the use of SPSS® (version 11.01)
statistical software for computer systems running the Windows® platform (SPSS Inc.,
1989-2001). In particular, the SPSS® software was used for developing profile plots,
examination of homogeneity and normalcy of residuals, and statistical model
development and comparison. The SAS® (version 8.1) statistical software was used for
all final data analysis (SAS Institute, 1999-2000). Data was subjected to the Mixed
Models Procedure with degrees of freedom estimated using the Satterthwaite
approximation (Satterthwaite, 1946). Means were separated by the Tukey-Kramer
procedure to determine statistical differences at α=0.05 significance level, unless
otherwise noted. All graphical displays of data in this document were produced with
Microsoft® Excel® 2002 (version 10.4302.4219-SP-2) spreadsheet software (Microsoft
Corporation, 1985-2001).

22
RESULTS AND DISCUSSION
FIELD STUDY
Quantity of precipitation from planting until harvest for the two years differed by
approximately 175.8 cm (231.89 cm in 2001 and 56.08 cm in 2002) (Fig. 1).
Furthermore, the distribution of rainfall throughout the growing season between the two
years was different. Several irrigations were required in 2001 from the period of peak
bloom to first open boll due to a lack of precipitation. A large amount of precipitation at
the end of the growing season in 2001 resulted in a delayed harvest. To minimize yield
losses due to drought and insect pressures, all field plots were irrigated and NP broadcast
insecticide applications were made as called for by scouting.
Data for the field study were combined over years as a result of the absence of
statistical interaction between main effects and year. Additionally, no significant
cultivar by IR treatment interactions were detected for the data presented in this
document.
Yield
In general, yields from this field study reflected those produced in this area in
previous years. Lint yields in 2002 were greater than those from 2001. Lint yield
differed by 692 kg ha-1 between the two years with yield averaging 1015 and 1707 kg
lint ha-1 in 2001 and 2002, respectively (Fig. 2). A planter problem in 2001 resulted in
inconsistent seeding rates across the study. To homogenize the plant population, all
plots were hand-thinned at the first true-leaf stage to a final population of 56,007 plants
ha-1. In 2002, planting was uneventful and subsequent stand counts were consistent in

23
Fig. 1. Precipitation and irrigation from 1 Apr. to 31 Oct. for 2001 and 2002.
0
50
100
150
200
250
300
350
400
1-Apr 1-May 1-Jun 1-Jul 1-Aug 1-Sep 1-Oct
2001Pr
ecip
itatio
n (m
m)
Irrig
atio
n
Irrig
atio
nIrr
igat
ion
0
50
100
150
200
250
300
350
400
1-Apr 1-May 1-Jun 1-Jul 1-Aug 1-Sep 1-Oct
2002
Prec
ipita
tion
(mm
)
Irrig
atio
n
Irrig
atio
n

24
1707a
1015b
500
750
1000
1250
1500
1750
2000
2001 2002
Year
Lint
yie
ld (k
g ha-1
)P<0.0001
Fig. 2. Cotton lint yield for the 2001 and 2002 field studies. Means followed by the same letter are not statistically different at P<0.05 according to the Tukey-Kramer procedure.

25
all plots resulting in a final population of 114,408 plants ha-1.
Although 2002 presented an excellent year for growing cotton, the primary
reason for the discrepancy in yield was likely the difference in plant population densities
between the two years. A review of literature revealed inconsistent results regarding
population density effects on cotton yield. Hernandez-Jasso and Guitierrez-Zamoran
(2000) and Burris et al. (2001) reported significant lint yield reduction in cotton planted
at populations as low as 50,000 and 32,277 plants ha-1, respectively, compared to
densities of 100,000 plants ha-1. However, work by other authors reported no significant
decrease in lint yield at population densities ranging from 19,700 to 37,050 plants ha-1
compared to densities reaching 251,000 plants ha-1 (Leffler, 1983; Boquet and Coco,
1996; Jones and Wells, 1998; Bednarz et al., 2000; Galadima et al., 2003). Cotton has
remarkable ability to compensate for variable spacing (Kerby et al., 1996); previous
research documents this characteristic. However, based on the studies reporting yield
reduction from low populations, the low plant density in 2001 could be the potential
cause for the yield discrepancy between the 2001 and 2002 field studies.
Cultivar was an important factor affecting yield. The yields for the three
cultivars averaged across all IR treatments were 1233, 1320, and 1529 kg lint ha-1 for
ST474, ST4793R, and ST4892BR, respectively (Fig. 3). ST4892BR produced greater
lint yield than the other two cultivars. The yield for ST4793R was numerically greater
than that of ST474, but was not statistically different. Yields for the IR treatments
averaged across all cultivars were 1304, 1320, and 1458 kg lint ha-1, for the OP, NP, and
NP+FP treatments, respectively (Fig. 4). Though not significant at α=0.05, yields for

26
1233b
1320b
1529a
1000
1200
1400
1600
ST4892BR ST4793R ST474
Cultivar
P<.0001Li
nt y
ield
(kg
ha-1)
Fig. 3. Cotton lint yield combined over years as related to cultivar for the field study. Means followed by the same letter are not statistically different at P<0.05 according to the Tukey-Kramer procedure.

27
1304b
1458a
1320b
1200
1300
1400
1500
NP‡ NP+FP OP
Insecticide regime
P=0.0843Li
nt y
ield
(kg
ha-1)
Fig. 4. Cotton lint yield combined over years as related to insecticide regime (IR) treatments for the field study. Means followed by the same letter are not statistically different at P<0.10 according to the Tukey-Kramer procedure. ‡The following designations were used to denote IR treatments: NP, non-phosphate insecticide treatment (control); NP+FP, non-phosphate + foliar phosphorus treatment; and OP, organophosphate insecticide treatment.

28
the individual IR treatments exhibited a defined trend. If α=0.10 is permitted, a
statistical yield difference is realized. Subsequently, it can be concluded that NP+FP
produced a greater yield response (P=0.0843) than both the NP and OP treatments.
Yields for the NP and OP treatments were not different. An interesting characteristic
regarding IR yield differences is observed in the evaluation of seedcotton yield.
Stronger statistical differences, based on the p-value, are evident between seedcotton
yields of the respective IR treatments (Fig. 5). However, investigation of percent lint
ginout revealed no significant differences between treatments (Fig. 6). The variability
introduced by ginout differences between plots for the respective IR treatments may
have increased the error associated with lint yield statistical analysis. This could
potentially moderate statistical differences observed for the lint yields of IR treatments.
The yield results for the cultivars studied support the results of Moser et al.
(2001) who reported that stacked-gene cultivars produced lint yields that were equal to
or significantly greater than lint yields of their respective conventional parents, while
Roundup Ready® cultivars produced lint yields that were similar to their conventional
parent. The increased yield for ST4892BR is further supported by total boll numbers,
mean boll weight, and fruiting distribution. Yield results regarding the IR treatments are
substantiated through total boll numbers and fruiting distribution data. These data are
presented in the end of season plant mapping section of this document.
Lint Quality Characteristics
Lint quality characteristics varied little between the 2001 and 2002 field studies
for most of the lint classification parameters evaluated, with the exception of color grade

29
3029b
3367a
3042b
2500
2750
3000
3250
3500
NP‡ NP+FP OP
Insecticide regime
P=0.0059Se
edco
tton
yiel
d (k
g ha-1
)
Fig. 5. Seedcotton yield combined over years as related to insecticide regime (IR) treatments for the field study. Means followed by the same letter are not statistically different at P<0.05 according to the Tukey-Kramer procedure. ‡The following designations were used to denote IR treatments: NP, non-phosphate insecticide treatment (control); NP+FP, non-phosphate + foliar phosphorus treatment; and OP, organophosphate insecticide treatment.

30
43.24a
43.63a43.76a
42.0
42.5
43.0
43.5
44.0
44.5
45.0
NP‡ NP+FP OP
Insecticide regime
P=0.7295Pe
rcen
t gi
nout
Fig. 6. Percent ginout of cotton combined over years as related to insecticide regime (IR) treatments for the field study. Means followed by the same letter are not statistically different at P<0.05 according to the Tukey-Kramer procedure. ‡The following designations were used to denote IR treatments: NP, non-phosphate insecticide treatment (control); NP+FP, non-phosphate + foliar phosphorus treatment; and OP, organophosphate insecticide treatment.

31
and reflectance (Rd), and fiber strength (Table 3). With respect to the color
characteristics of cotton, the values for Rd and yellowness in this study are within the
normal ranges. Yellowness (+b) was numerically greater in 2001. Rd, sometimes
referred to as grayness, was slightly greater in 2001. The various combinations of gray
and yellow can be converted into a color grade by using the Nickerson-Hunter color
diagram (USDA-AMS, 1993). Color grade was reduced in 2001. This could be
attributed to the large amount of rainfall that subsequently delayed harvest in 2001 (Fig.
1). When mature cotton bolls first open, the lint is white and clean due to the highly
reflective nature of cellulose and the lack of microbial degradation (Hake et al., 1996a).
When lint is exposed to moisture, fungi start to multiply on the surface of the lint
resulting in the deposit of dark colored microscopic fungal spores (Hake et al., 1996a).
These spores cause the lint to become gray and dull, resulting in lower Rd reflectance
values and reduced color grade. Though the Rd values in 2001 were deemed statistically
greater than those from 2002, they only differed by approximately 2.5 points. This
observation seems to go against the previous reasoning for the variance in color grade.
However, it is the combination of +b and Rd values that result in color grade
determination. That is why the rainfall remains the primary cause of reduced color grade
in 2001. This conclusion is further supported by Williford et al. (1988) who found that
rainfall can dramatically reduce color grade, especially if the cumulative amount exceeds
2 inches (50.8 mm) after the boll has opened.
Year also had an effect on fiber strength (Table 3). An increase of 2.66 g tex-1
was noted in 2002. Based on the 2002-2003 Commodity Credit Corporation (CCC) loan

32
Table 3. Effect of year on lint quality characteristics for 2001 and 2002 field studies. Year Leaf grade Color grade Fiber strength Rd +b
g/tex
2001 2.06 a† 64.37 b 27.65 b 57.79 a 8.58 a 2002 2.44 a 71.06 a 30.31 a 55.15 b 8.27 a
† Means within a column followed by the same letter are not statistically different at P<0.05 according to the Tukey-Kramer procedure.

33
rates for upland cotton, the increase in fiber strength in the 2002 study would have
earned a 77 point kg-1 premium. Year did not affect leaf grade, micronaire, fiber length,
or uniformity.
Lint quality characteristics between the three cultivars were not different for most
parameters. Fiber length is the only parameter in which statistical differences between
cultivars were noted. ST474 produced longer fibers than ST4793R, measuring 2.76 and
2.73 cm, respectively (Table 4). ST4892BR fiber length was not different from either
ST474 or that of ST4793R. Based on CCC loan rate criteria for these length
measurements, ST474 could have received a lesser discount than ST4793R. Though
ST4892BR did not vary statistically from the other two cultivars, its numerically higher
length value could have also placed it in the same discount category as ST474.
The insecticide application regime did not affect lint quality characteristics
(Table 5). All fiber quality parameters for cultivar and IR effects were within normal
lint classification ranges and reflected expected values of cotton produced locally. Lint
quality characteristics were not significantly affected by cultivar or IR treatments.
Leaf Tissue Nutrient Analysis
Quantifying leaf tissue nutrient content is important for explaining potential IR
treatment effects on plant growth, yield, and fiber quality characteristics. The tissue
nutrient analyses were performed to answer specific questions regarding the main effects
of this study: 1) Are plants acquiring P from OP insecticides?; 2) Were foliar P
applications providing P at an equivalent rate as OP insecticides?; and 3) Does cultivar
technology type have an influence on leaf P concentration?

34
Table 4. Cultivar effects on lint quality characteristics combined over years for the field study.
Cultivar Micronaire Fiber length Fiber strength Uniformity Leaf grade cm
g/tex ST4892BR 5.29 a† 2.75 ab 29.09 a 84.01 a 2.41 a ST4793R 5.18 a 2.73 b 29.07 a 83.86 a 2.10 a ST474 5.07 a 2.76 a 28.77 a 83.67 a 2.25 a † Means within a column followed by the same letter are not statistically different at
P<0.05 according to the Tukey-Kramer procedure.
Table 5. Insecticide regime (IR) effects on lint quality characteristics combined over years for the field study.
IR Micronaire Fiber length Fiber strength Uniformity Leaf grade cm
g/tex NP‡ 5.24 a† 2.76 a 29.00 a 83.97 a 2.32 a NP+FP 5.16 a 2.74 a 29.03 a 83.71 a 2.15 a OP 5.14 a 2.75 a 28.90 a 83.85 a 2.32 a † Means within a column followed by the same letter are not statistically different at
P<0.05 according to the Tukey-Kramer procedure. ‡ The following designations were used to denote IR treatments: NP, non-phosphate
insecticide treatment (control); NP+FP, non-phosphate + foliar phosphorus treatment; and OP, organophosphate insecticide treatment.

35
Analytical results for leaf tissue nutrient concentrations of the IR treatments
revealed the concentrations of P in the tissue for NP, NP+FP, and OP treatments were
2.49, 2.94, and 3.12 g P kg-1, respectively (Fig. 7). The tissue samples were acquired
after eight IR applications; therefore, the P levels from tissue nutrient analysis reflect a
cumulative applied amount of 0.3743 kg P ha-1 (Table 6). Total kg P ha-1 applied from
nine applications of the IR regime (NP+FP and OP treatments) amounted to 0.4675 kg P
ha-1. The cumulative amount of P applied in nine IR applications for this study is
somewhat less than the amounts reported in other foliar nutrient studies. Work by
Bednarz et al. (1998) and Bednarz et al. (1999) failed to show a significant yield
response in cotton to 1.12 kg P ha-1 applied from three separate foliar applications of
0.373 kg P ha-1. Conversely, Lancaster and Savatli (1965) reported that, in field
experiments, 1.12 kg ha-1 phosphorus applied to the leaves gave a higher increase in
yield than when applied to the soil. However, their results clearly indicated that foliar
feeding of phosphorus during periods of high nutrient needs, as may be engendered by
development of a heavy boll load, is not necessary for obtaining maximum yield. They
further contend that the roots of the cotton plant have the capacity to absorb all the
phosphorus needed by the above-ground portion of the plant during stress periods and
that levels of soil phosphorus adequate to supply these needs may occur naturally or as a
result of proper fertilization practices.
In the 2001 and 2002 field studies, plants acquired P from OP insecticides.
Applications of OP insecticides increased leaf P concentration by 0.63 g P kg-1
(P=0.004) compared to NP insecticides. Furthermore, NP+FP increased leaf P

36
3.12a
2.94a
2.49b
1.5
2.0
2.5
3.0
3.5
NP‡ NP+FP OP
Insecticide regime
P (g
kg -1
)P=0.0040
Fig. 7. Phosphorus (P) concentration in leaf tissue combined over years for insecticide regime (IR) treatments in the field study. Means followed by the same letter are not statistically different at P<0.05 according to the Tukey-Kramer procedure. ‡The following designations were used to denote IR treatments: NP, non-phosphate insecticide treatment (control); NP+FP, non-phosphate + foliar phosphorus treatment; and OP, organophosphate insecticide treatment.

37
Table 6. Amount of phosphorus (P) applied through individual NP+FP foliar treatments for nine insecticide regime (IR) treatment applications in the field study.
IR Application Number kg 12-48-08 ha-1 kg P2O5 ha-1 kg P ha-1
1 0.1307 0.0627 0.0274
2 0.1307 0.0627 0.0274
3 0.1307 0.0627 0.0274
4 0.1307 0.0627 0.0274
5 0.2626 0.1260 0.0550
6 0.3335 0.1601 0.0699
7 0.3335 0.1601 0.0699
8 0.3335 0.1601 0.0699
9 0.4446 0.2134 0.0932
Total 2.2302 1.0705 0.4675

38
concentration 0.45 g P kg-1 compared to the NP treatment. These results are consistent
with Bednarz et al. (1999), who reported that foliar P applications increased leaf P
concentration 0.80 g P kg-1 over the untreated check.
Increases in P from the NP+FP and OP treatments were consistent. A difference
in P concentration of 0.18 g P kg-1 exists between the treatments and was determined
insignificant through statistical analysis. These results indicate that the NP+FP
treatments provided P at an equivalent rate as the OP treatments.
The results from the P concentration of leaf tissue samples reveal an interesting
phenomenon with this study. Lint yields for the IR treatments showed the NP+FP yields
were significantly increased over NP treatments. Since the increase in P concentrations
for NP+FP and OP were similar and significantly greater than the NP treatment, it was
expected that the OP yields would also reflect the increase in P concentration. However,
this was not the case. OP applications had little effect on lint yield. Two variables
concerning the foliar fertilizer of choice could not be controlled in the field experiment.
Problems obtaining a fertilizer containing only phosphorus for foliar IR use resulted in
selection of the 12-48-08 fertilizer for the NP+FP treatment. The amount of nitrogen (N)
and potassium (K) in this fertilizer were thought to be insignificant when considering the
rates applied; however, in an effort to explain this discrepancy, leaf K concentrations
were evaluated. A total of 0.0741 kg K ha-1 was applied through nine NP+FP
applications (Table 7). Approximately 0.0593 kg K ha-1 was applied from the eight IR
applications at the time the leaf tissue was sampled. Although slight numerical
differences are apparent in leaf K concentrations between treatments, no statistical

39
Table 7. Amount of potassium (K) applied through individual NP+FP foliar treatments for nine insecticide regime (IR) treatment applications in the field study.
IR Application Number kg 12-48-08 ha-1 kg K2O ha-1 kg K ha-1
1 0.1307 0.0105 0.0043
2 0.1307 0.0105 0.0043
3 0.1307 0.0105 0.0043
4 0.1307 0.0105 0.0043
5 0.2626 0.0210 0.0087
6 0.3335 0.0267 0.0111
7 0.3335 0.0267 0.0111
8 0.3335 0.0267 0.0111
9 0.4446 0.0356 0.0148
Total 2.2302 0.1784 0.0741

40
differences exist (Fig. 8). The NP, NP+FP, and OP treatments had 11.38, 11.82, and
12.20 g K kg-1 leaf tissue, respectively. Based on these results, it is improbable that the
additional K applied in the NP+FP treatments had an effect on yield. Due to limited
financial resources, analysis of leaf N concentration was not performed. A total of
0.2677 kg N ha-1 was applied through nine NP+FP applications (Table 8). Although
foliar feeding of nutrients can potentially alleviate nutrient stress during peak demand
periods, it is unlikely that this small amount of foliar applied N could have affected yield
to the extent observed. McConnell et al. (1998) conducted a study involving soil-applied
and foliar-applied nitrogen. Treatments with an additional 33.6 kg N ha-1 applied to
foliage produced a yield response. However, yield responses to foliar N tended to differ
between years and between irrigated and dry land cotton production conditions. They
found that, generally, foliar-applied N applications resulted in increased yield when soil-
applied N was less than optimal. The findings of McConnell et al. (1998) are important
to evaluating the likelihood that additional N applied in this study could explain the yield
increase for the NP+FP treatment. McConnell et al. (1998) found variable yield results
when applying 126 times the amount of N that was applied in our study. Therefore, it is
reasonable to conclude that the small amount of N applied through the use of 12-48-08
fertilizer did not influence the yields of the NP+FP treatment.
The leaf P concentration between the two cultivars sampled was similar.
Phosphorus concentrations in the leaf tissue for ST4892BR and ST474 were 2.82 and
2.88 g P kg-1, respectively (Fig. 9), which indicates that technology type does not
influence leaf P concentrations in the cultivars studied.

41
12.20a
11.82a
11.38a
10.0
10.5
11.0
11.5
12.0
12.5
13.0
NP‡ NP+FP OP
Insecticide regime
K (g
kg -1
)P=0.6920
Fig. 8. Potassium (K) concentration in leaf tissue combined over years for insecticide regime (IR) treatments in the field study. Means followed by the same letter are not statistically different at P<0.05 according to the Tukey-Kramer procedure. ‡The following designations were used to denote IR treatments: NP, non-phosphate insecticide treatment (control); NP+FP, non-phosphate + foliar phosphorus treatment; and OP, organophosphate insecticide treatment.

42
Table 8. Amount of nitrogen (N) applied through individual NP+FP foliar treatments for nine insecticide regime (IR) treatment applications in the field study.
IR Application Number kg 12-48-08 ha-1 kg N ha-1
1 0.1307 0.0157
2 0.1307 0.0157
3 0.1307 0.0157
4 0.1307 0.0157
5 0.2626 0.0315
6 0.3335 0.0400
7 0.3335 0.0400
8 0.3335 0.0400
9 0.4446 0.0534
Total 2.2302 0.2677

43
2.88a2.82a
1.5
2.0
2.5
3.0
3.5
ST4892BR ST474
Cultivar
P (g
kg -1
)P=0.6273
Fig. 9. Phosphorus (P) concentration in leaf tissue combined over years for two cotton cultivars in the field study. Means followed by the same letter are not statistically different at P<0.05 according to the Tukey-Kramer procedure.

44
Plant Growth Parameters
Several of the parameters in this study were assessed on periodic intervals during
the growing season. Plant height, nodes, internode length, and NAWF were monitored
to compare growth trends and to determine if differences existed at specific stages in the
season. Analysis of covariance (ANCOVA) was used to compare the slopes of the main
effects and establish whether the slopes were different. The analysis of covariance
procedure is used as a method of comparing a series of regression models – one for each
of the levels of a factor or combinations of levels of factors being studied (Milliken and
Johnson, 2002).
The rate at which plant height increased for the three cultivars was similar from
mid-bloom (70 DAP) to cutout (99 DAP) (Fig. 10). ST4793R had a slightly greater rate
of height increase than the other two cultivars; however, all slopes were statistically
equal (P=0.1252). Among all individual sampling dates, ST4792BR had greater height
than the conventional cultivar. At mid-bloom, ST4892BR was taller (P=0.0608) than
ST4793R and ST474 with plant heights measuring 76.6, 72.2, and 72.6 cm, respectively
(Fig. 11). ST4793R and ST474 did not differ in height at this sampling point. As
illustrated previously (Fig. 10), a slightly greater slope for ST4793R results in a smaller
height contrast between it and the other two cultivars at peak bloom and cutout (Fig. 11).
Application of IR treatments had little effect on plant height. Height trends over
the reported period of time revealed no differences in rate of increase (Fig. 12).

45
y = 0.8466x + 13.007R2 = 0.9981
y = 0.9514x + 5.8048R2 = 0.999
y = 0.895x + 13.365R2 = 0.9949
65
75
85
95
105
60 70 80 90 100 110
ST4892BR
ST4793R
ST474
Days after planting
Plan
t hei
ght (
cm)
P=0.1252
Fig. 10. Height trends combined over years for three cotton cultivars from 70 to 100 days after planting in the field study. The P-value displayed is associated with the test for equality of slopes. The slopes for the regression lines are statistically different at P<0.05 according to the analysis of covariance procedure.

46
87.48a
76.57a
102.49a
86.23ab
72.15b
99.76ab
83.51b
72.59b
97.12b
50
60
70
80
90
100
110
120
Mid-bloom Peak bloom Cutout
Growth stageST4892BRST4793RST474
P=0.0089Pl
ant h
eigh
t (cm
)P=0.0608 P=0.0418
Fig. 11. Plant height combined over years for three cotton cultivars at mid-bloom, peak bloom, and cutout in the field study. Means followed by the same letter are not statistically different at P<0.10 (mid-bloom), and P<0.05 (peak bloom and cutout) according to the Tukey-Kramer procedure.

47
y = 0.8876x + 11.985R2 = 0.9999
y = 0.8952x + 10.789R2 = 0.9962
y = 0.9104x + 9.3976R2 = 0.9999
65
75
85
95
105
60 70 80 90 100 110
NP‡
NP+FP
OP
Days after planting
Plan
t hei
ght (
cm)
P=0.9369
Fig. 12. Height trends combined over years for insecticide regime (IR) treatments from 70 to 100 days after planting in the field study. The P-value displayed is associated with the test for equality of slopes. The slopes for the regression lines are statistically different at P<0.05 according to the analysis of covariance procedure. ‡The following designations were used to denote IR treatments: NP, non-phosphate insecticide treatment (control); NP+FP, non-phosphate + foliar phosphorus treatment; and OP, organophosphate insecticide treatment.

48
Furthermore, lack of height differences for IR main effects at individual sampling dates
suggests no apparent influence of IR applications on plant height.
The total number of nodes per plant varied little during the season for the three
cultivars (Fig 13). At mid-bloom, ST474 had approximately 0.5 more nodes (P=0.0543)
than ST4793R. However, this difference was mitigated as the season continued. No
differences were detected at peak bloom and cutout.
Similarly, IR treatments had no effect on total node numbers. At mid-bloom,
approximately 17 nodes per plant were recorded for each of the IR treatments (Fig. 14).
The same trend continued for the duration of the season with approximately 19.5 and
20.5 recorded nodes at peak bloom and cutout, respectively.
Average internode length can also be utilized to evaluate crop vegetative growth
rate. This parameter takes into consideration the direct correlation between plant height
and internode length. Average internode length is determined by dividing plant height
by the total number of nodes. A comparatively large value is indicative of a more robust
plant and possibly fewer potential fruiting branches. Comparing the slope of the
regression lines for average internode length over time can provide insight about the
behavior of the crop throughout the growing season.
At mid-bloom, ST4892BR had a longer internode length than both ST4793R and
ST474 with values of 4.5, 4.3, and 4.2 cm, respectively (Fig. 15). ST4793R and ST474
had similar average internode lengths. The measurements at peak bloom showed similar
trends with the exception of ST4793R; the contrast between ST4793R and ST4892BR
dissipated, resulting in no statistical difference. Furthermore, there was not enough of

49
17.08ab
19.52a
22.42a
16.88b
19.81a
22.55a
17.29a
19.85a
22.70a
10
12
14
16
18
20
22
24
26
Mid-bloom Peak bloom Cutout
Growth stageST4892BRST4793RST474
P=0.6768N
umbe
r of n
odes
pla
nt -1
P=0.0543 P=0.1164
Fig. 13. Number of main-stem nodes combined over years for three cotton cultivars atmid-bloom, peak bloom, and cutout in the field study. Means followed by the same letter are not statistically different at P<0.10 according to the Tukey-Kramer procedure.

50
17.09a
19.71a
22.49a
16.99a
19.74a
22.62a
17.17a
19.72a
22.57a
10
12
14
16
18
20
22
24
26
Mid-bloom Peak bloom Cutout
Growth stageNP‡NP+FPOP
P=0.9255P=0.6706 P=0.9801N
umbe
r of n
odes
pla
nt -1
Fig. 14. Number of main-stem nodes combined over years for insecticide regime (IR) treatments at mid-bloom, peak bloom, and cutout in the field study. Means followed by the same letter are not statistically different at P<0.05 according to the Tukey-Kramer procedure. ‡The following designations were used to denote IR treatments: NP, non-phosphate insecticide treatment (control); NP+FP, non-phosphate + foliar phosphorus treatment; and OP, organophosphate insecticide treatment.

51
4.48a 4.48a4.57a
4.27b4.35ab
4.43a
4.20b 4.20b4.27b
3.0
3.2
3.4
3.6
3.8
4.0
4.2
4.4
4.6
4.8
5.0
Mid-bloom Peak bloom Cutout
Growth stageST4892BRST4793RST474
P=0.0388In
tern
ode
leng
th (c
m)
P=0.0266 P=0.0018
Fig. 15. Average internode length combined over years for three cultivars at mid-bloom, peak bloom, and cutout in the field study. Means followed by the same letter are not statistically different at P<0.05 according to the Tukey-Kramer procedure.

52
an increase in average internode length compared to that of ST474 to result in a
difference, either. At peak bloom, ST4892BR and ST474 internode length did not
change from the value recorded at mid-bloom. The trend reflected in the previous two
sampling periods was mirrored at cutout. ST474 exhibited the smallest internode length,
while ST4793R and ST4892BR had the largest with lengths of 4.3, 4.4, and 4.6 cm,
respectively. The reduced internode length is a result of ST474 having a decreased
height while maintaining the same number of nodes, which suggests a potentially greater
shift in carbohydrate translocation from vegetative to reproductive growth compared to
the transgenic cultivars. Evaluating the trends across all three sampling periods further
illustrates the previous remarks. The slopes for the three cultivars across all dates were
statistically equal (P=0.4076) (Fig. 16). However, a slightly greater slope for ST4793R
(Fig. 16) explains the changes in mean groupings throughout the sampling period (Fig
15). Overall, the growth rates of the three cultivars, as indicated by average internode
length regression model comparison, were similar from mid-bloom to cutout.
Application of IR treatments had little effect on average internode length. The
values for NP+FP fluctuated slightly throughout the sampling period (Fig. 17). None of
the treatments exhibited significantly different mean internode length values at any
sampling date, which is confirmed by the comparing slopes across the sampling period.
Growth trends were similar for all three treatments (Fig. 18).
Stage of growth for any crop is an important factor on which management
decisions are based. Periodic monitoring of this parameter can provide insight about
development and maturation, in terms of the progression towards physiological cutout,

53
y = 0.0023x + 4.0344R2 = 0.7614
y = 0.0055x + 3.8899R2 = 0.9976
y = 0.003x + 4.2593R2 = 0.7559
4.0
4.2
4.4
4.6
4.8
60 70 80 90 100 110
ST4892BR
ST4793R
ST474
Days after planting
Inte
rnod
e le
ngth
(cm
)P=0.4076
Fig. 16. Average internode length trends combined over years for three cotton cultivars from 70 to 100 days after planting in the field study. The P-value displayed is associated with the test for equality of slopes. The slopes for the regression lines are statistically different at P<0.05 according to the analysis of covariance procedure.

54
4.29a4.35a
4.41a4.35a 4.31a
4.42a4.32a
4.38a4.44a
3.0
3.2
3.4
3.6
3.8
4.0
4.2
4.4
4.6
4.8
5.0
Mid-bloom Peak bloom Cutout
Growth stageNP‡NP+FPOP
P=0.9464P=0.7289 P=0.5098In
tern
ode
leng
th (c
m)
Fig. 17. Average internode lengths combined over years for insecticide regime (IR) treatments at mid-bloom, peak bloom, and cotton cutout in the field study. Means followed by the same letter are not statistically different at P<0.05 according to the Tukey-Kramer procedure. ‡The following designations were used to denote IR treatments: NP, non-phosphate insecticide treatment (control); NP+FP, non-phosphate + foliar phosphorus treatment; and OP, organophosphate insecticide treatment.

55
y = 0.004x + 4.0384R2 = 0.9989
y = 0.0034x + 4.0668R2 = 0.6215
y = 0.0034x + 4.0662R2 = 0.9988
4.2
4.3
4.4
4.5
60 70 80 90 100 110
NP‡
NP+FP
OP
Days after planting
Inte
rnod
e le
ngth
(cm
)P=0.6183
Fig. 18. Average internode length trends combined over years for insecticide regime (IR) treatments from 70 to 100 days after planting in the field study. The P-value displayed is associated with the test for equality of slopes. The slopes for the regression lines are statistically different at P<0.05 according to the analysis of covariance procedure. ‡The following designations were used to denote IR treatments: NP, non-phosphate insecticide treatment (control); NP+FP, non-phosphate + foliar phosphorus treatment; and OP, organophosphate insecticide treatment.

56
for cotton (Bourland et al, 1992). Cutout is defined as the point during the growing
season at which the number of nodes above white flower (NAWF) averages five
(Oosterhuis et al., 1996). At this stage of crop maturity, the terminal growth slows to the
point that the first position white flower is at the fifth node below the most recently
unfurled leaf (Andrews et al., 2001). In addition, a diameter criterion of at least 2.5 cm
must be met for consideration of the young leaf in this measurement. The physiology
underlying the occurrence of cutout in cotton is related to carbohydrate demand. Cutout
occurs when boll load consumes all available carbohydrates produced by the leaves
(Kerby and Hake, 1996). The white blooms present at cutout are considered the last boll
population that will effectively contribute to yield. Furthermore, typical management
practices will cease additional insecticide applications targeted at protecting these
developing bolls when the accumulation of heat units after cutout reaches 350 to 400
degree day units (Andrews et al., 2001). Degree day units (DD60s) are calculated by
averaging the daily maximum and minimum temperatures and subtracting a baseline
temperature for cotton of 60° C (Mauney, 1986).
Regression lines for NAWF versus days after planting (DAP) were constructed to
examine differences in the progression towards cutout between years, cultivars, and IR.
There is evidence that the progression rate for cutout was greater for the 2001 crop (Fig.
19). The slopes for 2001 and 2002 are not equal (P<0.0001). This analysis indicates
that the 2001 study was a slightly faster maturing crop. Because temperature and
moisture can have a dramatic impact on rate of maturity, differences in DD60s and

57
y = -0.0992x + 14.265R2 = 0.9999
y = -0.1808x + 22.14R2 = 0.9889
2
4
6
8
10
60 65 70 75 80 85 90 95 100 105 110
2001
2002
Days after planting
Nod
es a
bove
whi
te fl
ower
P<0.0001
Fig. 19. Average nodes above first position white flower (NAWF) trends from 70 to 105 days after planting for the 2001 and 2002 field studies. The P-value displayed is associated with the test for equality of slopes. The slopes for the regression lines are statistically different at P<0.05 according to the analysis of covariance procedure.

58
precipitation amounts between 2001 and 2002 were investigated as a possible
explanation for this anomaly.
Cumulative precipitation for both years differed dramatically. A greater amount
of precipitation was received in 2001 compared to 2002 (Fig. 20). At 100 DAP, the
cumulative precipitation in 2001 was 2.5 times that recorded for 2002. The precipitation
data showed that a large proportion of the total cumulative precipitation at 100 DAP for
2001 was received prior to 60 DAP. Approximately 200 mm of irrigation was provided
53 DAP in 2002. The amount of precipitation from 60 to 100 DAP was 336 and 306
mm for 2001 and 2002, respectively. Ultimately, it was determined the moisture
received from the combined precipitation and irrigation amounts were equivalent for
both years.
Temperature is important in controlling growth rates (Gipson, 1986; Ohlendorf et
al., 1996). The trends for daily DD60s and cumulative DD60s differed between years
(Figs. 21 and 22). The increased rate of DD60 accumulation for 2001 from 60 to 100
DAP (Fig. 22) provides a potential explanation for the steeper rate approaching cutout
observed in 2001 (Fig.19). In 2001, 1,865 and 1,927 DD60s had accumulated at 100
DAP for 2001 and 2002, respectively. The increase from 60 to 100 DAP was greater for
2001, with 946 DD60s accumulating during that period. In 2002, 853 DD60s had
accumulated from 60 to 100 DAP. The increase in heat unit accumulation for 2001
provides evidence to corroborate the steeper slope observed for rate of 2001 crop
maturity. Relative to this point, both crops achieved five NAWF at 95 DAP.

59
0
500
1000
1500
2000
2500
0 10 20 30 40 50 60 70 80 90 100 110 120 130 140 150 160 170
2001 Cumulative precipitation (mm)2002 Cumulative precipitation (mm)
Cum
ulat
ive
prec
ipita
tion
(mm
)
Days after planting
Fig. 20. Cumulative precipitation for the 2001 and 2002 field studies from planting to harvest.

60
0
5
10
15
20
25
30
35
40
0 10 20 30 40 50 60 70 80 90 100 110 120 130 140 150 160 170
DD60s (2001)DD60s (2002)
Dai
ly D
D60
s
Days after planting
Fig. 21. Daily growing degree days (DD60s) for the 2001 and 2002 field studies from planting to harvest.
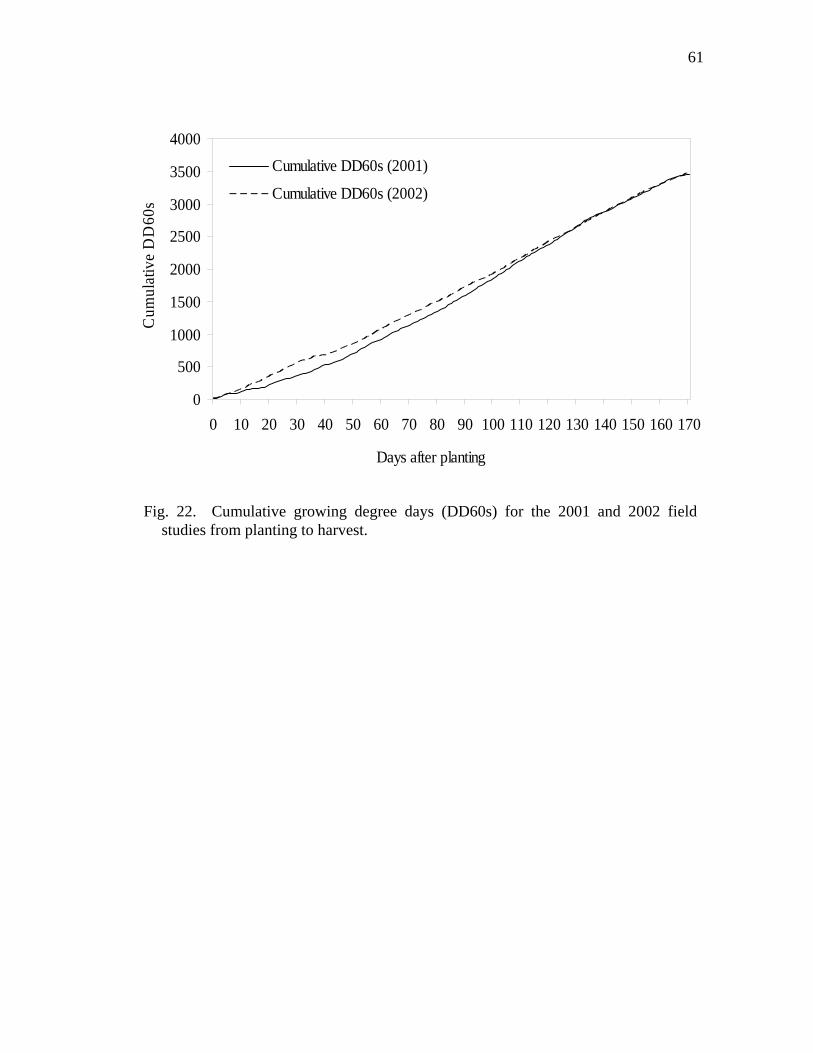
61
0
500
1000
1500
2000
2500
3000
3500
4000
0 10 20 30 40 50 60 70 80 90 100 110 120 130 140 150 160 170
Cumulative DD60s (2001)
Cumulative DD60s (2002)
Cum
ulat
ive
DD
60s
Days after planting
Fig. 22. Cumulative growing degree days (DD60s) for the 2001 and 2002 field studies from planting to harvest.

62
Neither cotton cultivar nor IR treatments had any effect on NAWF throughout
the growing season (Figs. 23 and 24, respectively). The slopes for the regression lines of
the three cultivars and IR treatments were not different. In addition, the value for
NAWF did not differ at any time during the season for either cultivar or IR main effects.
Plant Biomass Partitioning – Peak Bloom
Partitioning of plant biomass was evaluated one week prior to peak bloom (85
and 81 DAP, in 2001 and 2002, respectively) to assess the effects of cultivar and IR
treatments on accumulated biomass and differential partitioning throughout the plant. In
addition, this data provides an early assessment about yield trends regarding boll
numbers, mean boll weight, and total boll weight. Parameters evaluated included dry
weight of leaves, stems, squares, and bolls. Additionally, number of squares and bolls
were also recorded.
Leaf dry weight was 2.6 g plant-1 greater (P=0.0938) for ST4793R compared to
ST474 (Fig. 25). ST892BR was not different from either of the other two cultivars. A
similar trend was evident with stem biomass. ST4793R partitioned 4.4 g more biomass
plant -1 into the stem than ST474 (Fig. 26). Again, ST4892BR was not different from
either ST4793R or ST474.
Neither leaf nor stem biomass were affected by IR applications (Figs. 27 and 28,
respectively). Slight numerical differences exist for these parameters, favoring NP+FP
and OP over NP; however high variability in the data resulted in a lack of statistical
significance. Leaf biomass ranged from 23.69 to 25.37 g plant-1 for NP and OP,

63
y = -0.1276x + 17.177R2 = 0.9975
y = -0.1269x + 17.143R2 = 0.9955
y = -0.1372x + 17.957R2 = 0.9999
4
5
6
7
8
9
60 65 70 75 80 85 90 95 100 105 110
ST4892BR
ST4793R
ST474
Days after planting
Nod
es a
bove
whi
te fl
ower
p=0.2381
Fig. 23. Average nodes above first position white flower (NAWF) trends combined over years for three cotton cultivars from 70 to 105 days after planting in the field study. The P-value displayed is associated with the test for equality of slopes. The slopes for the regression lines are statistically different at P<0.05 according to the analysis of covariance procedure.

64
y = -0.1371x + 18.203R2 = 0.9984
y = -0.1275x + 17.04R2 = 0.9984
y = -0.1271x + 17.034R2 = 0.9995
4
5
6
7
8
9
60 65 70 75 80 85 90 95 100 105 110
NP‡
NP+FP
OP
Days after planting
Nod
es a
bove
whi
te fl
ower
p=0.6353
Fig. 24. Average nodes above first position white flower (NAWF) trends combined over years for insecticide regime (IR) treatments from 70 to 105 days after planting in the field study. The P-value displayed is associated with the test for equality of slopes. The slopes for the regression lines are statistically different atP<0.05 according to the analysis of covariance procedure. ‡The following designations were used to denote IR treatments: NP, non-phosphate insecticide treatment (control); NP+FP, non-phosphate + foliar phosphorus treatment; and OP, organophosphate insecticide treatment.

65
23.45b
26.06a
23.72ab
15
18
21
24
27
30
ST4892BR ST4793R ST474
Cultivar
Leaf
tiss
ue (g
pla
nt -1
)P=0.0938
Fig. 25. Dry weight of leaf tissue per plant combined over years for three cotton cultivars at peak bloom in the field study. Means followed by the same letter are not statistically different at P<0.10 according to the Tukey-Kramer procedure.

66
30.29ab
32.28a
27.86b
20
25
30
35
40
ST4892BR ST4793R ST474
Cultivar
P=0.0348St
em ti
ssue
(g p
lant
-1)
Fig. 26. Dry weight of stem tissue per plant combined over years for three cotton cultivars at peak bloom in the field study. Means followed by the same letter are not statistically different at P<0.05 according to the Tukey-Kramer procedure.

67
25.37a24.18a
23.69a
15
18
21
24
27
30
NP‡ NP+FP OP
Insecticide regime
P=0.4638Le
af ti
ssue
(g p
lant
-1)
Fig. 27. Dry weight of leaf tissue per plant combined over years for insecticide regime (IR) treatments at peak bloom in the field study. Means followed by the same letter are not statistically different at P<0.05 according to the Tukey-Kramer procedure. ‡The following designations were used to denote IR treatments: NP, non-phosphate insecticide treatment (control); NP+FP, non-phosphate + foliar phosphorus treatment; and OP, organophosphate insecticide treatment.

68
31.15a30.07a
29.20a
20
25
30
35
40
NP‡ NP+FP OP
Insecticide regime
P=0.6371St
em ti
ssue
(g p
lant
-1)
Fig. 28. Dry weight of stem tissue per plant combined over years for insecticide regime (IR) treatments at peak bloom in the field study. Means followed by the same letter are not statistically different at P<0.05 according to the Tukey-Kramer procedure. ‡The following designations were used to denote IR treatments: NP, non-phosphate insecticide treatment (control); NP+FP, non-phosphate + foliar phosphorus treatment; and OP, organophosphate insecticide treatment.

69
respectively. Stem biomass for NP, NP+FP, and OP was 29.20, 30.07, and 31.15 g
plant-1, respectively.
Biomass partitioning of leaves and stems did not differ between the two years
(Data not shown). At peak bloom, total square biomass and number of squares were
significantly greater in 2001 (Figs. 29 and 30, respectively). However, the 2002 crop
had more bolls present at peak bloom (Fig. 31). Averaged across cultivar and IR
treatments, mean boll weight plant-1 was approximately 0.65 g for both years. The
significant increase in boll numbers plant-1 observed for the 2002 crop resulted in greater
total boll biomass plant-1 (Fig. 32).
Dry weight of total squares plant-1 for each cultivar was 2.15, 2.50, and 2.12 g for
ST4892BR, ST4793R, and ST474, respectively (Fig. 33). Approximately 0.4 g more
(P=0.0898) dry weight plant-1 was partitioned into squares for ST4793R than for the
other two cultivars. Dry weight for squares was not different for ST4893BR and ST474.
Mean square weight plant-1 was approximately 0.1 g for all three cultivars (Fig. 34).
Total square numbers plant-1 for the three cultivars were not different (P=0.1375),
although numerical trends are evident (Fig. 35). This data follows the same trend
exhibited by total square biomass indicating that the numerical increase in square
numbers for ST4793R led to the significant increase observed for total square weight.
At peak bloom, ST4892BR had 1.1 g greater (P=0.0867) total boll dry weight
plant -1 than the other two cultivars (Fig. 36). Mean boll weight plant-1 was
approximately 0.7 g for all three cultivars (Fig. 37). Cultivar effect on total boll
numbers was not statistically different (Fig. 38). However, the positive numerical trend

70
2.51a
2.01b
1.0
1.5
2.0
2.5
3.0
2001 2002Year
P=0.0048Sq
uare
dry
wei
ght (
g pl
ant
-1)
Fig. 29. Total square dry weight per plant at peak bloom for the 2001 and 2002 field studies. Means followed by the same letter are not statistically different at P<0.05 according to the Tukey-Kramer procedure.

71
27.33a
22.08b
20
22
24
26
28
30
2001 2002
Year
P=0.0175N
umbe
r of s
quar
es p
lant
-1
Fig. 30. Total number of squares per plant at peak bloom for the 2001 and 2002 field studies. Means followed by the same letter are not statistically different at P<0.05 according to the Tukey-Kramer procedure.

72
5.71b
11.04a
4
6
8
10
12
14
2001 2002Year
P=0.0048N
umbe
r of b
olls
plan
t -1
Fig. 31. Total number of bolls per plant at peak bloom for the 2001 and 2002 field studies. Means followed by the same letter are not statistically different at P<0.05 according to the Tukey-Kramer procedure.

73
3.80b
7.02a
0
2
4
6
8
2001 2002Year
P=0.0220B
oll d
ry w
eigh
t (g
plan
t -1)
Fig. 32. Total dry weight of bolls per plant at peak bloom for the 2001 and 2002 field studies. Means followed by the same letter are not statistically different at P<0.05 according to the Tukey-Kramer procedure.

74
2.12b
2.50a
2.15b
1.0
1.5
2.0
2.5
3.0
ST4892BR ST4793R ST474
Cultivar
P=0.0898Sq
uare
dry
wei
ght (
g pl
ant
-1)
Fig. 33. Total square dry weight per plant combined over years at peak bloom for three cotton cultivars in the field study. Means followed by the same letter are not statistically different at P<0.10 according to the Tukey-Kramer procedure.

75
0.088a0.094a0.093a
0.00
0.05
0.10
0.15
0.20
ST4892BR ST4793R ST474
Cultivar
P=0.2084M
ean
squa
re w
eigh
t (g
plan
t -1)
Fig. 34. Mean square dry weight per plant combined over years at peak bloom for three cotton cultivars in the field study. Means followed by the same letter are not statistically different at P<0.05 according to the Tukey-Kramer procedure.

76
24.02a
26.78a
23.31a
20
22
24
26
28
30
ST4892BR ST4793R ST474
Cultivar
P=0.1375N
umbe
r of s
quar
es p
lant
-1
Fig. 35. Total number of squares per plant combined over years at peak bloom for three cotton cultivars in the field study. Means followed by the same letter are not statistically different at P<0.05 according to the Tukey-Kramer procedure.

77
5.04b5.05b
6.14a
0
2
4
6
8
ST4892BR ST4793R ST474
Cultivar
Bol
l dry
wei
ght (
g pl
ant
-1)
P=0.0867
Fig. 36. Total boll dry weight per plant combined over years at peak bloom for three cotton cultivars in the field study. Means followed by the same letter are not statistically different at P<0.10 according to the Tukey-Kramer procedure.

78
0.63a0.65a0.67a
0.0
0.2
0.4
0.6
0.8
1.0
ST4892BR ST4793R ST474
Cultivar
P=0.4784M
ean
boll
wei
ght (
g pl
ant
-1)
Fig. 37. Mean boll dry weight per plant combined over years at peak bloom for three cotton cultivars in the field study. Means followed by the same letter are not statistically different at P<0.05 according to the Tukey-Kramer procedure.

79
8.20a7.88a
9.06a
5
6
7
8
9
10
ST4892BR ST4793R ST474
Cultivar
P=0.2534N
umbe
r of b
olls
plan
t -1
Fig. 38. Total number of bolls per plant combined over years at peak bloom for three cotton cultivars in the field study. Means followed by the same letter are not statistically different at P<0.05 according to the Tukey-Kramer procedure.

80
in boll numbers plant-1 for ST4892BR and the equal mean boll weights for all cultivars
suggest that the trend in boll numbers translated to increased total boll dry weight plant-1
for ST4892BR.
Applications of IR treatments slightly affected total square biomass. NP+FP had
approximately 0.4 g greater (P=0.1011) total square weight plant-1 than NP and OP (Fig.
39). Though no statistical differences exist for total square numbers (Fig. 40), the
numerical trends likely translated into the results observed for total square biomass. IR
treatments had no effect on mean square weight plant-1 (Fig. 41).
Boll numbers and mean boll weight plant-1 of cotton at peak bloom were not
significantly affected by applications of IR treatments (Figs. 42 and 43, respectively).
This observation is further supported by the lack of variation in total boll dry weight
plant-1 between IR treatments (Fig. 44). A numerical trend existed for NP+FP, with that
treatment having approximately one more additional boll per plant than the other IR
treatments. At peak bloom, this trend had no influence on ultimate total boll biomass;
however, if the NP+FP treatment matures one additional boll plant-1, a substantial yield
increase could be realized. In a population of 114,000 plants ha-1, the one boll plant-1
(assuming a 4 g boll-1 mean weight) could mean a 456 kg ha-1 increase in seedcotton
yield for the NP+FP treatment. The trend for additional fruit plant-1 is further reflected
in fruit dry weight as a percent of total plant biomass. Though not statistically different,
NP+FP had a numerically greater percent of biomass partitioned to fruit than NP and
OP, with values of 12.8, 12.5, and 11.8 percent, respectively (Fig. 45).

81
2.13b
2.50a
2.14b
1.0
1.5
2.0
2.5
3.0
NP‡ NP+FP OP
Insecticide regime
Squa
re d
ry w
eigh
t (g
plan
t -1)
P=0.1011
Fig. 39. Total square dry weight per plant combined over years at peak bloom for insecticide regime (IR) treatments in the field study. Means followed by the same letter are not statistically different at P<0.10 according to the Tukey-Kramer procedure. ‡The following designations were used to denote IR treatments: NP, non-phosphate insecticide treatment (control); NP+FP, non-phosphate + foliar phosphorus treatment; and OP, organophosphate insecticide treatment.
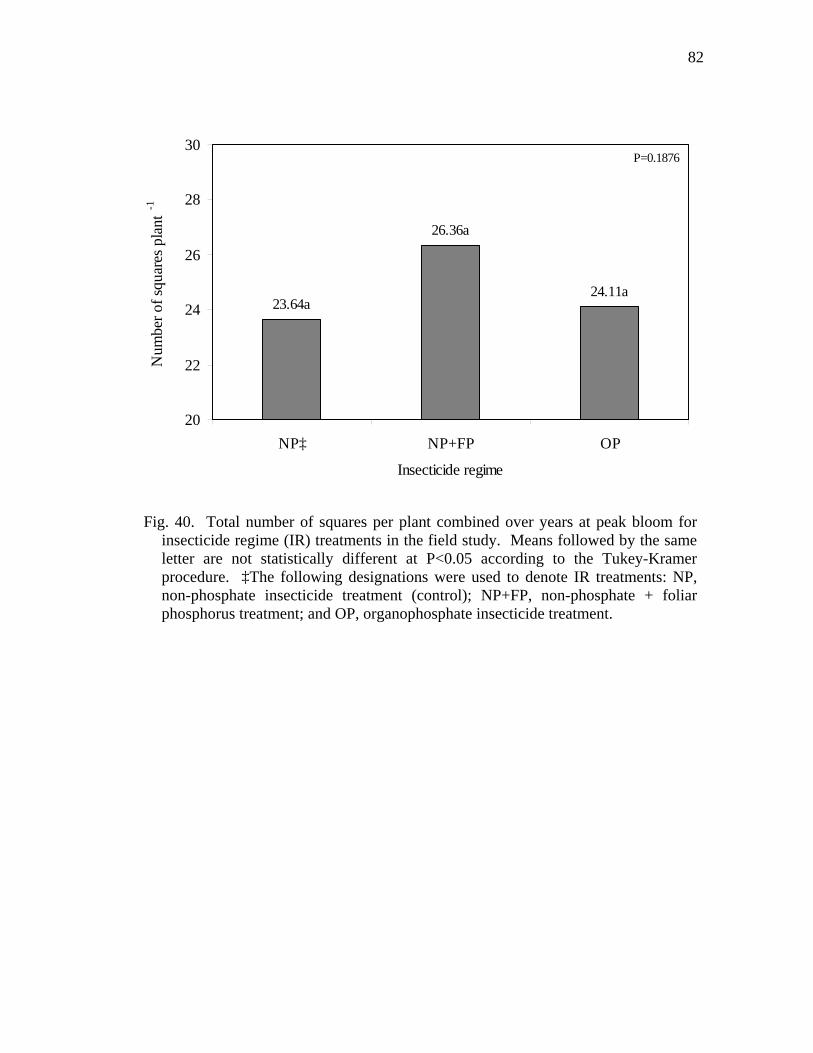
82
24.11a
26.36a
23.64a
20
22
24
26
28
30
NP‡ NP+FP OP
Insecticide regime
P=0.1876N
umbe
r of s
quar
es p
lant
-1
Fig. 40. Total number of squares per plant combined over years at peak bloom for insecticide regime (IR) treatments in the field study. Means followed by the same letter are not statistically different at P<0.05 according to the Tukey-Kramer procedure. ‡The following designations were used to denote IR treatments: NP, non-phosphate insecticide treatment (control); NP+FP, non-phosphate + foliar phosphorus treatment; and OP, organophosphate insecticide treatment.

83
0.089a0.095a0.090a
0.00
0.05
0.10
0.15
0.20
NP‡ NP+FP OP
Insecticide regime
P=0.1830M
ean
squa
re w
eigh
t (g
plan
t -1)
Fig. 41. Mean square dry weight per plant combined over years at peak bloom for insecticide regime (IR) treatments in the field study. Means followed by the same letter are not statistically different at P<0.05 according to the Tukey-Kramer procedure. ‡The following designations were used to denote IR treatments: NP, non-phosphate insecticide treatment (control); NP+FP, non-phosphate + foliar phosphorus treatment; and OP, organophosphate insecticide treatment.

84
8.04a
8.90a
8.19a
5
6
7
8
9
10
NP‡ NP+FP OP
Insecticide regime
P=0.3849N
umbe
r of b
olls
plan
t -1
Fig. 42. Total number of bolls per plant combined over years at peak bloom for insecticide regime (IR) treatments in the field study. Means followed by the same letter are not statistically different at P<0.05 according to the Tukey-Kramer procedure. ‡The following designations were used to denote IR treatments: NP, non-phosphate insecticide treatment (control); NP+FP, non-phosphate + foliar phosphorus treatment; and OP, organophosphate insecticide treatment.

85
0.66a0.63a0.66a
0.0
0.2
0.4
0.6
0.8
1.0
NP‡ NP+FP OP
Insecticide regime
P=0.7901M
ean
boll
wei
ght (
g pl
ant
-1)
Fig. 43. Mean boll dry weight per plant combined over years at peak bloom for insecticide regime (IR) treatments in the field study. Means followed by the same letter are not statistically different at P<0.05 according to the Tukey-Kramer procedure. ‡The following designations were used to denote IR treatments: NP, non-phosphate insecticide treatment (control); NP+FP, non-phosphate + foliar phosphorus treatment; and OP, organophosphate insecticide treatment.

86
5.32a5.56a5.35a
0
2
4
6
8
NP‡ NP+FP OP
Insecticide regime
P=0.8872B
oll d
ry w
eigh
t (g
plan
t -1)
Fig. 44. Total boll dry weight per plant combined over years at peak bloom for insecticide regime (IR) treatments in the field study. Means followed by the same letter are not statistically different at P<0.05 according to the Tukey-Kramer procedure. ‡The following designations were used to denote IR treatments: NP, non-phosphate insecticide treatment (control); NP+FP, non-phosphate + foliar phosphorus treatment; and OP, organophosphate insecticide treatment.

87
11.76a
12.77a12.46a
10
11
12
13
14
15
NP‡ NP+FP OP
Insecticide regime
P=0.3884Pe
rcen
t fru
it bi
omas
s pla
nt -1
Fig. 45. Percent of total plant biomass partitioned as fruit combined over years at peak bloom for insecticide regime (IR) treatments in the field study. Means followed by the same letter are not statistically different at P<0.05 according to the Tukey-Kramer procedure. ‡The following designations were used to denote IR treatments: NP, non-phosphate insecticide treatment (control); NP+FP, non-phosphate + foliar phosphorus treatment; and OP, organophosphate insecticide treatment.

88
Generally, cultivar had a greater effect on the partitioning of plant biomass than
IR treatments. At peak bloom, data reflects yield trends observed at harvest to a large
extent. ST4892BR had approximately 1.5 % more (P=0.0853) biomass partitioned to
fruit than ST4793R (Fig. 46). ST474 was not significantly different from the other two
cultivars in the amount of fruit biomass. However, ST474 had a numerically lower
percent of biomass partitioned as fruit than did ST4892BR. Noting this disparity is
important as it becomes more exaggerated as the season progresses and ultimately
results in the statistical differences observed in yield at harvest.
Plant Mapping - Harvest
Examining plant biomass partitioning at peak bloom provided insight into
allocation of carbon into vegetative and reproductive biomass. The results from that
assessment indicated potential yield trends based on the amount of fruit biomass present
for the respective treatments. However, trends are indications at best and must continue
until harvest for realization of yield differences. Many factors, including environmental
effects, can alter fruiting patterns and distribution between peak bloom and harvest.
Factors such as insect pressure and water stress were controlled as best possible to
reduce these variables as sources affecting the performance of cultivar and efficacy of IR
treatments.
Knowledge of developmental patterns of fruiting structures throughout the
growing season is important to understanding the variation in boll numbers and size
among fruiting branches and intra-sympodial fruiting sites. New fruiting branches are
produced at approximately 3-day intervals, and initiation of fruiting positions on the

89
12.21ab
11.66b
13.12a
10
11
12
13
14
15
ST4892BR ST4793R ST474
Cultivar
P=0.0853Pe
rcen
t fru
it bi
omas
s pla
nt -1
Fig. 46. Percent of total plant biomass partitioned as fruit combined over years at peak bloom for three cotton cultivars in the field study. Means followed by the same letter are not statistically different at P<0.10 according to the Tukey-Kramer procedure.

90
same fruiting branch is about 6 days apart (Kerby and Hake, 1996). The location of
bolls within the plant architecture has a substantial effect on their size. Bolls located on
lower sympodia are generally larger than those positioned higher on the plant. Boll
position on any given sympodial branch also affects their size. First position bolls are
the strongest sink for carbon allocation, and therefore have potentially greater impact on
crop yield (Ashley, 1972; Wullschleger and Oosterhuis, 1990). The physiological effect
of sink strength causes bolls at more distal positions to be successively smaller (Kerby
and Ruppenicker, 1992; Parvin and Atkins, 1997). Research by Jenkins et al. (1990a)
attributed the reduced size of second and third position bolls to preferential partitioning
of photosynthate to first position fruit during development. The effect of location on
boll size is related to the morphological sequence in which cotton initiates flowers from
lower to higher sympodia and also out to successive positions on sympodial nodes. In
mid-South cotton, the bolls at first and second position fruiting sites on sympodial
branches typically produce from 50 to 75% and 15 to 20%, respectively, of the total
yield, with the remaining 5 to 15% occurring at more distal positions and on monopodial
branches (Jenkins et al., 1990b; Boquet et al., 1994). Furthermore, Boquet and Moser
(2003) suggested that the competitive edge exhibited by first position bolls may also be
related to enhanced access to nutrients and water because of their proximity to the main
stem, which results in larger and more efficient subtending leaves. Demonstration of
this relationship was made using 14C labeling technology to illustrate that the
predominant source of photosynthate for a boll was its subtending leaf and the primary
sink on a given sympodium was first position fruit (Benedict and Kohel, 1975).

91
Plant mapping at harvest more clearly documents the fruiting architecture
contributing to any yield variations found in this study. Specifically, this mapping
technique dissects the distribution of yield components into nodal and fruiting positions.
Mapping data is collected by separating harvestable bolls into plastic buckets assigned a
designated fruiting position number and nodal range. This plant mapping technique is
alternatively called box mapping because of the use of “boxes” to separate and collect
the bolls for analysis. The number of bolls and total weight of seedcotton for each nodal
range and position within the range were recorded during the procedure. In addition,
plant height, number of nodes, and first reproductive node were also documented.
Examination of trends in plant growth during the season from cutout until harvest
resulted in little difference in plant height between the three cultivars. No statistical
differences existed (P=0.1177); however, numerical trends followed those defined in the
data at cutout with ST4892BR, ST4793R, and ST474 having heights of 105.4, 98.9, and
99.5 cm, respectively (Fig. 47). Increases in the number of nodes per plant for the three
cultivars were also consistent during this period, resulting in no differences between
cultivars at harvest. All three cultivars had approximately 26 nodes at harvest (Fig. 48).
The numerical differences in plant height at harvest culminated in statistical differences
in average internode length. ST4892BR had a longer internode length than ST474 with
values of 4.0 and 3.8, respectively (Fig. 49). ST4793R internode length was not
different from either of the other two cultivars having an average internode length of 3.9
cm. The trends for average internode length are similar to those observed at cotton
cutout.

92
99.48a98.87a105.38a
50
60
70
80
90
100
110
120
130
ST4892BR ST4793R ST474
Cultivar
P=0.1177Pl
ant h
eigh
t (cm
)
Fig. 47. Plant height combined over years at harvest for three cotton cultivars in the field study. Means followed by the same letter are not statistically different atP<0.05 according to the Tukey-Kramer procedure.

93
25.90a25.64a26.30a
0
5
10
15
20
25
30
35
40
ST4892BR ST4793R ST474
Cultivar
P=0.8380N
umbe
r of n
odes
pla
nt -1
Fig. 48. Number of main-stem nodes combined over years at harvest for three cotton cultivars in the field study. Means followed by the same letter are not statistically different at P<0.05 according to the Tukey-Kramer procedure.

94
3.82b3.87ab4.03a
2.0
2.5
3.0
3.5
4.0
4.5
5.0
ST4892BR ST4793R ST474
Cultivar
P=0.0418In
tern
ode
leng
th (c
m)
Fig. 49. Average internode length combined over years at harvest for three cotton cultivars in the field study. Means followed by the same letter are not statistically different at P<0.05 according to the Tukey-Kramer procedure.

95
Applications of IR treatments did not affect end of season plant height, number
of nodes, or average internode length (Figs. 50, 51, and 52, respectively). These
statistics are consistent with early and mid-season observations.
The total seedcotton weight recorded through the box mapping procedure
includes reproductive as well as vegetative bolls in the calculation. The total seedcotton
weight per plant collected from the mapping procedure was consistent with yield trends
for all three cultivars. ST4892BR had approximately 10.5 and 11.7 g more seedcotton
plant-1 than ST4793R and ST474, respectively (Fig. 53). ST4793R and ST474 were not
different from each other and produced 57.9 and 56.7 g seedcotton plant-1, respectively.
Application of IR treatments resulted in no statistical differences in seedcotton
weights as acquired through box mapping. The numerical trends, however, reflect those
observed from harvest data, with NP+FP having the largest seedcotton weight at 63.9 g
plant-1, followed by OP and NP with 60.1 and 59.0 g plant-1, respectively (Fig. 54). The
data for total seedcotton weight plant-1 should reflect measurements of seedcotton yield
harvested from the field. However, some instances exhibit larger inherent variability
due to the relatively small sample size obtained for the mapping procedure compared to
the sample size represented by yield measurements acquired through machine harvest.
In research, better estimates of the true mean of a population are acquired by increasing
sample size (Ott and Longnecker, 2001). Because of the time and labor involved in box
mapping, sample size (six plants) per plot to provide practical and reasonable estimates
of the components contributing to final yield was limited. The number of observations
included in the sample is a compromise between the desired accuracy of the sample

96
101.42a101.64a100.68a
50
60
70
80
90
100
110
120
130
NP‡ NP+FP OP
Insecticide regime
P=0.9586Pl
ant h
eigh
t (cm
)
Fig. 50. Plant height combined over years at harvest for insecticide regime (IR) treatments in the field study. Means followed by the same letter are not statistically different at P<0.05 according to the Tukey-Kramer procedure. ‡The following designations were used to denote IR treatments: NP, non-phosphate insecticide treatment (control); NP+FP, non-phosphate + foliar phosphorus treatment; and OP, organophosphate insecticide treatment.

97
25.81a26.11a25.93a
0
5
10
15
20
25
30
35
40
NP‡ NP+FP OP
Insecticide regime
P=0.8343N
umbe
r of n
odes
pla
nt -1
Fig. 51. Number of main-stem nodes combined over years at harvest for insecticide regime (IR) treatments in the field study. Means followed by the same letter are not statistically different at P<0.05 according to the Tukey-Kramer procedure. ‡The following designations were used to denote IR treatments: NP, non-phosphate insecticide treatment (control); NP+FP, non-phosphate + foliar phosphorus treatment; and OP, organophosphate insecticide treatment.

98
3.95a3.92a3.86a
2.0
2.5
3.0
3.5
4.0
4.5
5.0
NP‡ NP+FP OP
Insecticide regime
P=0.7406In
tern
ode
leng
th (c
m)
Fig. 52. Average internode length combined over years at harvest for insecticide regime (IR) treatments in the field study. Means followed by the same letter are not statistically different at P<0.05 according to the Tukey-Kramer procedure. ‡The following designations were used to denote IR treatments: NP, non-phosphate insecticide treatment (control); NP+FP, non-phosphate + foliar phosphorus treatment; and OP, organophosphate insecticide treatment.

99
56.68b57.91b
68.44a
40
45
50
55
60
65
70
75
ST4892BR ST4793R ST474
Cultivar
P=0.0007Se
edco
tton
(g p
lant
-1)
Fig. 53. Seedcotton yield per plant combined over years at harvest for three cotton cultivars in the field study. Means followed by the same letter are not statistically different at P<0.05 according to the Tukey-Kramer procedure.

100
60.14a
63.90a
58.99a
40
45
50
55
60
65
70
NP‡ NP+FP OP
Insecticide regime
P=0.2680Se
edco
tton
(g p
lant
-1)
Fig. 54. Seedcotton yield per plant combined over years at harvest for insecticide regime (IR) treatments in the field study. Means followed by the same letter are not statistically different at P<0.05 according to the Tukey-Kramer procedure. ‡The following designations were used to denote IR treatments: NP, non-phosphate insecticide treatment (control); NP+FP, non-phosphate + foliar phosphorus treatment; and OP, organophosphate insecticide treatment.

101
statistic as an estimation of the population parameter (i.e. mean) and the required time
and cost to achieve this degree of accuracy (Ott and Longnecker, 2001). This limitation
in sample size could potentially explain the lack of significant differences for
total seedcotton weight plant-1 of individual IR treatments acquired from box mapping
compared to those obtained through field harvest. For example, the standard error of the
seedcotton weight estimates for both cultivar and IR main effects was, on a relative
basis, twice as high as that from the seedcotton yield analysis from the machine harvest.
The box mapping results for the cultivars were different enough to generate a small
probability value. However, less contrast in IR treatments consequently resulted in a
non-significant probability estimate for that parameter. Regardless of a lack of statistical
differences, the same recurring trend appears in total seedcotton weight per plant as was
observed in lint yield and other parameters previously discussed.
The most important contributors to yield are boll number and boll size. At
harvest, the 2001 and 2002 crop had similar number of total bolls per plant (Fig. 55).
Though no statistical difference exists, the 2002 crop had a numerical increase of
approximately 1.5 bolls plant-1. In spite of the excellent compensatory qualities of
cotton (Sadras, 1995), the primary contribution to the increase in 2002 yield was likely
due to increased plant densities. However, the larger boll size observed for the 2002
crop contributed substantially to final yields. The average boll weight was
approximately 0.6 g boll-1 greater than that of the 2001 crop (Fig. 56). A possible
explanation for this increase could be that 2002 presented excellent growing conditions,
in terms of rainfall distribution and temperatures, for cotton. Furthermore, the

102
12.38a
13.92a
10
11
12
13
14
15
2001 2002
Year
P=0.1744N
umbe
r of b
olls
plan
t -1
Fig. 55. Number of harvestable bolls per plant at harvest for 2001 and 2002 field studies. Means followed by the same letter are not statistically different at P<0.05 according to the Tukey-Kramer procedure.

103
4.31b
4.90a
3.0
3.5
4.0
4.5
5.0
5.5
6.0
2001 2002
Year
P<0.0001Se
edco
tton
(g b
oll -1
)
Fig. 56. Mean seedcotton weight per boll at harvest for 2001 and 2002 field studies. Means followed by the same letter are not statistically different at P<0.05 according to the Tukey-Kramer procedure.

104
subsurface drip irrigation could have promoted increased rooting depth, subsequently
resulting in more favorable moisture levels and increased nutrient uptake. This theory is
supported by Phene (1999) who stated that subsurface drip irrigation has been shown to
promote deeper crop rooting than surface irrigation in hybrid sweet corn (Zea Mays L.,
cv. Supersweet Jubilee). Phene (1999) stated that the root length densities of hybrid
sweet corn grown under subsurface drip irrigation were greater from a depth of
approximately 30 to 200 cm below the soil surface. In addition, he contended that a root
system under subsurface drip irrigation usually will operate under a cooler constant
temperature environment, thereby resulting in lower root respiration. In turn, he asserts
that this causes an increase in net photosynthesis. He maintains that similar rooting
patterns have been characterized for cotton and tomato, and in general, found that
maximum root length density occurs at the depth of the water source, at least down to 60
cm. The yield increase for the 2002 crop is supported by the findings of Wilson et al.
(1984) who revealed that converting to drip irrigation from furrow irrigation on sandy
soils reduced water applications from about 170 cm to 90 cm and increased cotton yield
by approximately 280.4 kg lint ha-1. In another study with conditions more closely
related to those of this study, Smith et al. (1991) compared a buried drip system, a low-
energy precision application (LEPA) system, and a furrow system on a clay loam soil.
They found that a yield increase of 616.8 kg lint ha-1 was observed for the drip system
over the other two systems. The LEPA and furrow system produced equivalent yields.
The end-of-season box mapping data confirmed the numerical differences in boll
number trends observed between cultivars at peak bloom. Those trends were enhanced

105
as the season progressed, resulting in statistical differences at harvest. The yield
increase for ST4892BR can primarily be attributed to greater boll numbers. This
cultivar produced approximately 1.5 more bolls per plant than ST4793R and ST474 (Fig.
57), which reflects the positive trend that was initially observed at peak bloom for
ST4892BR in terms of numerical differences. It is apparent that ST4892BR continued
to set more bolls as the season progressed. An additional contribution to the increased
yield of ST4892BR was boll size. The mean weight per boll produced by ST4892BR
was approximately 6% greater than that of ST4793R and ST474, with the three cultivars
averaging 4.8, 4.6, and 4.5 g boll-1, respectively (Fig. 58). Though peak bloom biomass
partitioning did not reveal differences in boll size among cultivars, end-of-season
mapping indicated that the larger boll size of ST4892BR was attributed to bolls set prior
to, as well as after, peak bloom. Consequently, it can be argued that boll enlargement
was consistent for all three cultivars at least until peak bloom. Following peak bloom, a
point was reached where ST4793R and ST474 ceased boll enlargement while
ST4892BR continued. These results indicate that the stacked-gene cultivar can produce
higher yields than the Roundup Ready® and conventional counter parts through setting
more and larger bolls.
The trend for total boll numbers of the IR treatments at peak bloom showed a
numerical increase for NP+FP, which was maintained throughout the season. Box
mapping at harvest revealed the primary constituent for the yield increase of NP+FP was
boll numbers. Though no statistical differences were evident (P=0.1115), a numerical
increase of approximately 1.1 bolls plant-1 for NP+FP was observed (Fig. 59).

106
12.62b12.73b
14.10a
10
11
12
13
14
15
ST4892BR ST4793R ST474
Cultivar
P=0.0123N
umbe
r of b
olls
plan
t -1
Fig. 57. Number of harvestable bolls per plant combined over years at harvest for three cotton cultivars in the field study. Means followed by the same letter are not statistically different at P<0.05 according to the Tukey-Kramer procedure.

107
4.46b4.55b
4.82a
4.0
4.2
4.4
4.6
4.8
5.0
ST4892BR ST4793R ST474
Cultivar
P=0.0093Se
edco
tton
(g b
oll -1
)
Fig. 58. Mean seedcotton weight per boll combined over years at harvest for three cotton cultivars in the field study. Means followed by the same letter are not statistically different at P<0.05 according to the Tukey-Kramer procedure.

108
12.73a
13.90a
12.82a
10
11
12
13
14
15
NP‡ NP+FP OP
Insecticide regime
P=0.1115N
umbe
r of b
olls
plan
t -1
Fig. 59. Number of harvestable bolls per plant combined over years at harvest for insecticide regime (IR) treatments in the field study. Means followed by the same letter are not statistically different at P<0.05 according to the Tukey-Kramer procedure. ‡The following designations were used to denote IR treatments: NP, non-phosphate insecticide treatment (control); NP+FP, non-phosphate + foliar phosphorus treatment; and OP, organophosphate insecticide treatment.

109
Treatments of OP did not increase boll numbers over NP. The IR treatments had little
effect on boll size. Mean boll weights for NP, NP+FP, and OP were 4.6, 4.6, and 4.7 g
boll-1, respectively (Fig. 60). Treatments of OP numerically increased mean weight by
0.1 g boll-1; however, this slight gain did not impact overall yield.
The primary contribution to the increase in total boll numbers for the 2002 crop
came from first and second position bolls. The 2002 crop had approximately 1.8 and 1.1
more first and second position bolls, respectively, than the 2001 crop (Fig. 61). The
number of third position bolls was not different between years.
The number of first position bolls was dependent upon cultivar. The increase in
total bolls per plant for ST4892BR was primarily due to an increase in the number of
first position bolls. ST4892BR had approximately one more first position boll than the
other two cultivars (Fig. 62). The number of second and third position bolls was not
different among the three cultivars.
Application of IR treatments did not affect the number of first position bolls.
The NP, NP+FP, and OP treatments averaged 6.6, 6.6, and 6.4 first position bolls per
plant, respectively (Fig. 63). The increase in total bolls for the NP+FP treatment at
harvest was primarily due to an increase in the number of second position bolls. The
addition of foliar phosphorus added approximately one more boll per plant than
treatment with NP alone. Second position boll numbers for the OP treatment was not
different from that of NP or NP+FP. The number of third position bolls was not affected
by any IR treatment. Further examination of boll distribution throughout the plant
revealed that the primary source of the increase in second position bolls for the NP+FP
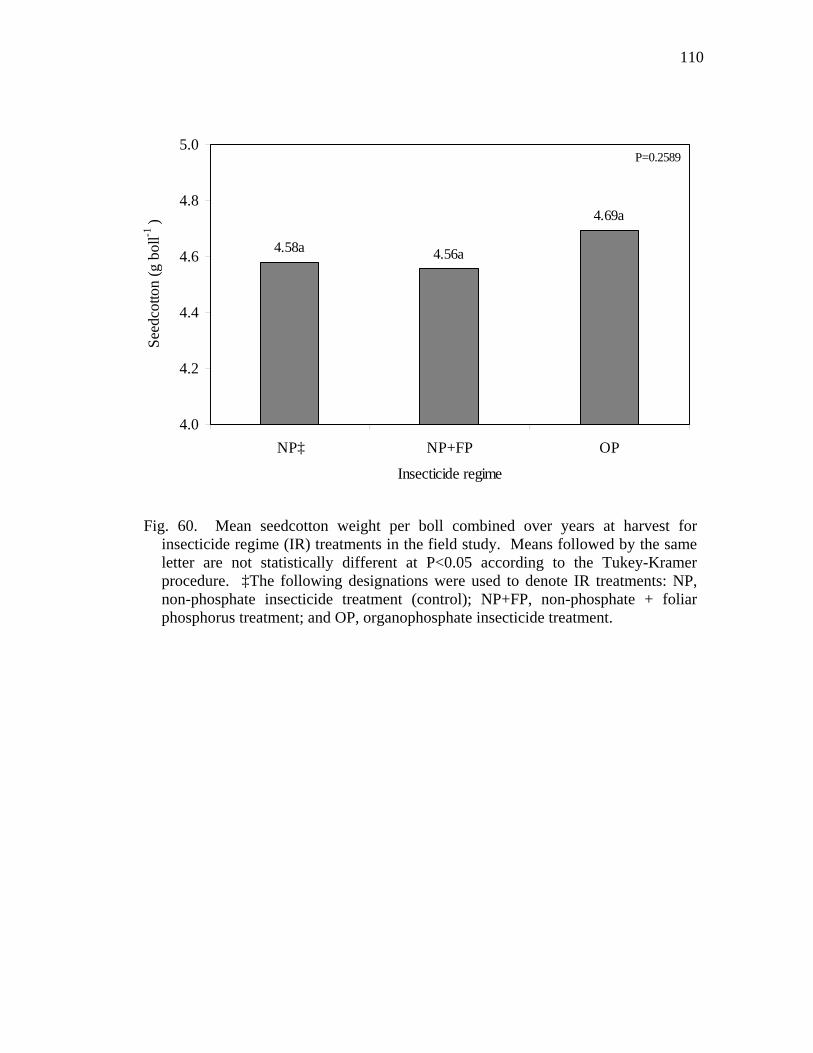
110
4.69a
4.56a4.58a
4.0
4.2
4.4
4.6
4.8
5.0
NP‡ NP+FP OP
Insecticide regime
P=0.2589Se
edco
tton
(g b
oll -1
)
Fig. 60. Mean seedcotton weight per boll combined over years at harvest for insecticide regime (IR) treatments in the field study. Means followed by the same letter are not statistically different at P<0.05 according to the Tukey-Kramer procedure. ‡The following designations were used to denote IR treatments: NP, non-phosphate insecticide treatment (control); NP+FP, non-phosphate + foliar phosphorus treatment; and OP, organophosphate insecticide treatment.

111
5.59b
3.03b
1.54a
7.43a
4.10a
1.99a
0
2
4
6
8
10
Position 1 Position 2 Position 3
2001
2002
Num
ber o
f bol
ls pl
ant
-1P=0.0017 P=0.0259 P=0.2335
Sympodial position
Fig. 61. Number of harvestable bolls located at fruiting positions 1, 2, and 3 per plant at harvest for the 2001 and 2002 field studies. Means followed by the same letter are not statistically different at P<0.05 according to the Tukey-Kramer procedure.

112
7.24a
3.71a
1.78a
6.17b
3.43a
1.72a
6.11b
3.56a
1.78a
0
1
2
3
4
5
6
7
8
9
Position 1 Position 2 Position 3
Sympodial positionST4892BRST4793RST474
P=0.9022P=0.0001 P=0.5310
Num
ber o
f bol
ls pl
ant -1
Fig. 62. Number of harvestable bolls located at fruiting positions 1, 2, and 3 per plant combined over years at harvest for three cotton cultivars in the field study. Means followed by the same letter are not statistically different at P<0.05 according to the Tukey-Kramer procedure.

113
6.58a
3.07b
1.65a
6.56a
4.05a
1.92a
6.38a
3.57ab
1.71a
0
1
2
3
4
5
6
7
8
9
Position 1 Position 2 Position 3
Sympodial positionNP‡NP+FPOP
P=0.4451N
umbe
r of b
olls
plan
t -1P=0.7100 P=0.0463
Fig. 63. Number of harvestable bolls located at fruiting positions 1, 2, and 3 per plant combined over years at harvest for insecticide regime (IR) treatments in the field study. Means followed by the same letter are not statistically different at P<0.05 according to the Tukey-Kramer procedure. ‡The following designations were used to denote IR treatments: NP, non-phosphate insecticide treatment (control); NP+FP, non-phosphate + foliar phosphorus treatment; and OP, organophosphate insecticide treatment.

114
treatment was predominantly within sympodial range 6 through 10 (Fig. 64). The
addition of FP increased (P=0.0533) second position bolls by 0.6 bolls plant-1 over the
NP treatment. The remaining 0.4 bolls that account for the total increase in second
position bolls for NP+FP (Fig. 63) are accounted for in numerical increases distributed
throughout sympodia 16 through 25 (Data not shown). The reason for the increase in
second position bolls for the NP+FP treatment is not clearly understood. However, a
possible explanation is that the small amount of FP provided during boll fill may have
compensated for nutrient requirements not met through soil uptake and/or alleviated
demand from competition for nutrients with first position fruit. Crozier (2004) stated
that under conditions of heavy fruiting, the plant directs most of its resources into boll
development rather than into new root and shoot growth. He also indicates that root
uptake can be less than required to meet peak nutrient demands. Furthermore, Taiz and
Zeiger (1998) contend that foliar nutrition can reduce the lag time between application
and uptake by the plant, which could be important during a phase of rapid growth. This
explanation, however, does not account for the lack of yield response for the OP
treatment which had P levels similar to NP+FP. In addition, no visual P deficiencies
were observed in any of the treatments during the boll-fill period. Though this
explanation could be plausible, it cannot be confirmed by the data from this study.
The evaluation of fruit distribution at harvest is vital to understanding the
contribution of individual components to final yield. Bolls set lower on the plant are
typically larger and potentially contribute more to yield than those set higher on the plant
(Kerby et al., 1987; Gerik et al., 1989; Jenkins et al., 1990a; Boquet et al., 1993; Boquet

115
1.17ab
1.57a
1.06b
0.0
0.5
1.0
1.5
2.0
NP‡ NP+FP OP
Insecticide regime
P=0.0533N
umbe
r of s
econ
d fru
iting
pos
ition
bol
lson
sym
podi
a 6
- 10
plan
t -1
Fig. 64. Number of harvestable bolls located at the second fruiting position throughout sympodia 6 through 10 combined over years at harvest for insecticide regime (IR) treatments in the field study. Means followed by the same letter are not statistically different at P<0.10 according to the Tukey-Kramer procedure. ‡The following designations were used to denote IR treatments: NP, non-phosphate insecticide treatment (control); NP+FP, non-phosphate + foliar phosphorus treatment; and OP, organophosphate insecticide treatment.

116
et al., 1994; Kerby and Hake, 1996). Total boll numbers were not different between
2001 and 2002 for sympodial ranges 3 through 5 and 6 through 10 (Fig. 65). The
predominant contribution to the numerical increase in total boll numbers for 2002 was
from sympodia 11 and above. The 2002 crop had consistently more bolls than 2001 in
this region of plant architecture. The substantial increase in lint for the top crop in 2002
further reflects the sensitivity of cotton to environmental limitations. As discussed
earlier, this increase may also reflect more favorable growing conditions under
subsurface drip irrigation and its impact on boll load.
Cultivar and IR treatments had little effect on the number of bolls on sympodia 3
through 5, 11 through 15, and 16 through 20 (Figs. 66 and 67, respectively). The
sympodial range that contributed most to the yield increase for ST4892BR was 6
through 10 (Fig. 66). ST4892BR produced approximately 0.8 and 1.2 more bolls in this
range than ST4793R and ST474, respectively. The conventional cultivar produced more
bolls (P=0.0518) than ST4793R on sympodia 21 through 25. ST4892BR did not differ
in boll numbers from the other two cultivars.
The IR treatments had little effect on boll numbers in sympodial range 6 through
10 (Fig. 67). However, the positive numerical trend for boll numbers follows the
documented yield increase observed for NP+FP. Application of IR treatments affected
boll numbers within sympodial range 16 through 25. The data suggests that additional
FP increased boll numbers over the NP treatment in this region of the plant architecture.
However, the individual contribution of this sympodial range to final yield is limited
(Hake et al., 1996b). Though boll numbers are relatively small in this sympodial range,

117
0.07b
1.27b
4.71b
4.08a
0.04a
0.77a
2.89a
5.81a
3.97a
0.07a0
1
2
3
4
5
6
7
3 ~ 5 6 ~ 10 11 ~ 15 16 ~ 20 21 ~ 25
Sympodial branch range2001
2002
Num
ber o
f bol
ls pl
ant -1
P=0.3037 P=0.0101P=0.0062P=0.0177P=0.7041
Fig. 65. Number of harvestable bolls per plant separated according to distribution on sympodia 3 through 25 at harvest for the 2001 and 2002 field studies. Means followed by the same letter are not statistically different at P<0.05 according to the Tukey-Kramer procedure.

118
2.05a
5.51a
4.67a
0.09a0.43ab
1.91a
5.25a
3.89b
0.03a0.28b
2.29a
5.03a
3.50b
0.05a
0.55a
0
1
2
3
4
5
6
7
3 ~ 5 6 ~ 10 11~15 16 ~ 20 21 ~ 25
Sympodial branch rangeST4892BRST4793RST474
P=0.2245P=0.2780 P=0.0017N
umbe
r of b
olls
plan
t -1P=0.0518P=0.1889
Fig. 66. Number of harvestable bolls per plant separated according to distribution on sympodia 3 through 25 combined over years at harvest for the three cotton cultivars in the field study. Means followed by the same letter are not statistically different at P<0.10 according to the Tukey-Kramer procedure.

119
0.05a
3.97a
5.00a
1.99a
0.28b0.04a
4.27a
5.47a
2.19a
0.58a
0.07a
3.83a
5.31a
2.07a
0.40ab
0
1
2
3
4
5
6
7
3 ~ 5 6 ~ 10 11~15 16 ~ 20 21 ~ 25
Sympodial branch rangeNP‡NP+FPOP
P=0.2393N
umbe
r of b
olls
plan
t -1P=0.5874 P=0.4496 P=0.0302P=0.5283
Fig. 67. Number of harvestable bolls per plant separated according to distribution on sympodia 3 through 25 combined over years at harvest for insecticide regime (IR) treatments in the field study. Means followed by the same letter are not statistically different at P<0.05 according to the Tukey-Kramer procedure. ‡The following designations were used to denote IR treatments: NP, non-phosphate insecticide treatment (control); NP+FP, non-phosphate + foliar phosphorus treatment; and OP, organophosphate insecticide treatment.

120
the recognizable positive trend for the NP+FP treatment throughout the plant ultimately
culminated in a favorable yield response.
The largest contribution to yield for cultivar and IR main effects was attributed to
sympodial range 11 through 15, with a substantial amount also coming from sympodia 6
through 10. As a percentage of final yield, sympodia 6 through 10 and 11 through 15
accounted for approximately 37 and 47%, respectively, for cultivar and IR main effects
(Figs. 68 and 69, respectively). Approximately 14% of final yield was contributed by
sympodia 16 through 20 for both cultivar and IR treatments.
Cultivar did not affect percent yield contribution of sympodia 3 through 15 (Fig.
68). The conventional cultivar contributed approximately 3 and 2% more yield from
sympodia 16 through 20 and sympodia 21 through 25, respectively, compared to the
other two cultivars. The two transgenic cultivars were not different across all sympodial
ranges.
IR treatments had little effect on percent yield contribution of sympodia 3
through 20 (Fig. 69). However, a significant IR treatment effect was observed for
sympodia 21 through 25. Addition of FP resulted in 1.5 times the yield contribution
from sympodia 21 through 25 than NP alone, which confirms the observation for
increased boll numbers for NP+FP in this sympodial range. The OP treatment did not
significantly affect the distribution of seedcotton as a percentage of final yield for any
sympodial range.
Box mapping provided effective insight about the components contributing to
yield differences between the two years. The predominant factor that contributed to

121
45.8
12.6b
1.4b
39.2a
0.5a
13.3b
1.1b
47.8a
37.6a
0.2a
16.3a
2.4a
47.0a
33.9a
0.4a0
10
20
30
40
50
60
3 ~ 5 6 ~ 10 11 ~ 15 16 ~ 20 21 ~ 25
Sympodial branch rangeST4892BRST4793RST474
Perc
ent o
f fin
al y
ield
pla
nt -1
P=0.1175 P=0.5793 P=0.0513P=0.3696 P=0.0744
Fig. 68. Seedcotton contribution of sympodial ranges as a percentage of final yield combined over years for three cotton cultivars in the field study. Means followed by the same letter are not statistically different at P<0.10 according to the Tukey-Kramer procedure.

122
0.5a
38.6a
46.1a
13.9a
1.0b0.2a
36.1a
46.0a
14.9a
2.5a0.5a
35.9a
48.5a
13.5a
1.4b0
10
20
30
40
50
60
3 ~ 5 6 ~ 10 11 ~ 15 16 ~ 20 21 ~ 25
Sympodial branch rangeNPNP+FPOP
Perc
ent o
f fin
al y
ield
pla
nt -1
P=0.6042 P=0.5323 P=0.5213P=0.5202 P=0.0227
Fig. 69. Seedcotton contribution of sympodial ranges as a percentage of final yield combined over years for insecticide regime (IR) treatments in the field study. Means followed by the same letter are not statistically different at P<0.05 according to the Tukey-Kramer procedure. ‡The following designations were used to denote IR treatments: NP, non-phosphate insecticide treatment (control); NP+FP, non-phosphate + foliar phosphorus treatment; and OP, organophosphate insecticide treatment.

123
higher yields in 2002 was larger boll size. Furthermore, the numerical increase of 1.5
bolls plant-1 for the 2002 crop contributed to the yield increase. In addition, the end-of-
season mapping confirmed many of the trends observed at peak bloom for cultivar and
IR main effects. The stacked-gene transgenic cultivar out-yielded its Roundup Ready®
and conventional counterparts through increased boll size and total boll numbers.
Applications of OP insecticides did not offer any benefits over use of NP. Addition of
FP tended to increase total boll numbers, especially second position bolls. This increase
is reflected in greater final yields for NP+FP than for NP. These results support those of
Lancaster and Savatli (1965) who reported yield increases with foliar applied P.
However, the application rate used in their study was 8.72 kg P ha-1, a much greater
amount than was used in this study. In addition, they found that a sufficient soil
application of P could negate any benefits of foliar applied P. While there is evidence
that foliar applications can increase yield, there is some question as to whether the
amounts used in this study corroborate those results. The application of OP insecticides
did not influence any of the fruiting distribution or position characteristics studied. No
significant cultivar by IR treatment interactions were detected for the data presented in
the field study section of this document, which suggests that the three cultivars
responded similarly to all levels of IR treatment applications.

124
GREENHOUSE STUDY
In addition to examining cultivar and IR treatments under field conditions, these
variables were also tested on cotton grown under greenhouse conditions. Many benefits
are associated with conducting a trial in a controlled environment including improved
pest, fertility, and water management. However, the study of larger crops in this
environment presents limitations, especially in the magnitude of sample size for data
collection. This reduced sample size could lead to a high degree of variability in the data
resulting in a failure to detect significant differences. The primary source of variability
in greenhouse studies is probably due to the inherent differences between plants within a
genetic line, which was observed during the greenhouse study. This phenomenon was
expected and efforts were taken to maximize the number of observational units in order
to increase sample size. In spite of attempts to increase the sample size, the number of
replicates was still small relative to the field trial. Even with this potential limitation, the
greenhouse study provides further opportunity to investigate the selected parameters on
cotton under more intensive observation.
Yield
The study was harvested 146 DAP and seedcotton was collected and weighed on
a per plant basis. No differences in seedcotton yield plant-1 were observed for cultivar
and IR main effects. The seedcotton yields for ST4892BR, ST4793R, and ST474 were
126.6, 124.8, and 125.6 g plant-1, respectively (Fig. 70). The NP, NP+FP, and OP
treatments yielded 125.7, 126.2, and 125.1 g plant-1 (Fig. 71).

125
125.56a124.83a
126.57a
120
122
124
126
128
130
ST4892BR ST4793R ST474
Cultivar
P=0.9167Se
edco
tton
(g p
lant
-1)
Fig. 70. Seedcotton yield per plant for three cotton cultivars in the greenhouse study. Means followed by the same letter are not statistically different at P<0.05 according to the Tukey-Kramer procedure.

126
125.10a
126.19a125.67a
120
122
124
126
128
130
NP‡ NP+FP OP
Insecticide regime
P=0.9677Se
edco
tton
(g p
lant
-1)
Fig. 71. Seedcotton weight per plant for insecticide regime (IR) treatments in the greenhouse study. Means followed by the same letter are not statistically different at P<0.05 according to the Tukey-Kramer procedure. ‡The following designations were used to denote IR treatments: NP, non-phosphate insecticide treatment (control); NP+FP, non-phosphate + foliar phosphorus treatment; and OP, organophosphate insecticide treatment.

127
Residual analysis of yield data revealed a substantial amount of variability.
Consequently, it is reasonable to postulate that the absence of statistical differences in
yield could be attributed to this variability.
Leaf Tissue Nutrient Analysis
Foliar P was applied to the plots designated as the NP+FP treatment in the field
study as 12-48-08. To eliminate extraneous variables in the greenhouse study, liquid
phosphorus fertilizer, in the form of 0-30-0, was acquired from Growth Products, Ltd.
(White Plains, NY). Calculations for the required P2O5 amounts equivalent to the
concurrent OP treatments were performed in the same manner as the procedure used in
the field study. The leaf samples for this tissue analysis were collected after all seven IR
treatments were applied.
Leaf tissue analyses for nutrient content failed to provide concrete evidence
about the influence on leaf P levels for the IR treatments. The concentration of P in the
tissue for NP, NP+FP, and OP treatments was 8.52, 8.65, and 8.75 g P kg-1, respectively,
and were not significantly different, although the OP treatment had the largest numerical
increase in leaf P (Fig. 72). The total kg P applied from the seven IR applications
amounted to 0.3042 kg P ha-1 (Table 9).
The leaf P concentrations between the two cultivars were not significantly
different. The P concentration in the leaf tissue of ST4892BR and ST474 were 8.55 and
8.73 g P kg-1, respectively (Fig. 73). The magnitude of difference between cultivars,
approximately 0.17 g P kg-1, was greater than the difference of 0.13 g P kg-1 observed for
the NP and NP+FP treatments.

128
8.75a
8.65a
8.52a
8.0
8.2
8.4
8.6
8.8
9.0
NP‡ NP+FP OP
Insecticide regime
P=0.9075P
(g k
g-1)
Fig. 72. Phosphorus (P) concentration in leaf tissue for insecticide regime (IR) treatments in the greenhouse study. Means followed by the same letter are not statistically different at P<0.05 according to the Tukey-Kramer procedure. ‡The following designations were used to denote IR treatments: NP, non-phosphate insecticide treatment (control); NP+FP, non-phosphate + foliar phosphorus treatment; and OP, organophosphate insecticide treatment.

129
Table 9. Amount of phosphorus (P) applied through individual NP+FP foliar treatments for seven insecticide regime (IR) treatment applications in the greenhouse study.
IR Application Number L 0-30-0 ha-1 kg P2O5 ha-1 kg P ha-1
1 0.1796 0.0627 0.0274
2 0.1796 0.0627 0.0274
3 0.1796 0.0627 0.0274
4 0.1796 0.0627 0.0274
5 0.3605 0.1258 0.0549
6 0.4585 0.1600 0.0699
7 0.4585 0.1600 0.0699
Total 1.9959 0.6966 0.3042

130
8.72a
8.55a
8.0
8.2
8.4
8.6
8.8
9.0
ST4892BR ST474
Cultivar
P (g
kg -1
)P=0.6706
Fig. 73. Phosphorus (P) concentration in leaf tissue for two cotton cultivars in the greenhouse study. Means followed by the same letter are not statistically different at P<0.05 according to the Tukey-Kramer procedure.

131
Leaf P concentrations in our greenhouse study (8.52 to 8.75 g kg-1) were
substantially greater than leaf P concentrations (3 to 6.4 g kg-1) reported in other work
(Sabbe and Zelinski, 1990; Bednarz et al., 1999). However, leaf P concentrations in the
field study (2.49 to 3.12 g kg-1) were consistent with those reported in the work of these
authors.
A unique finding revealed by comparing greenhouse and field leaf P data was the
magnitude of difference between leaf P concentrations between the two studies. Leaf P
concentrations in the greenhouse study were approximately three times greater than that
of the field trial. Mullins and Burmester (1990) reported that, with exception to seed, P
concentrations in the cotton plant tended to decrease with age. They also reported that P
distribution within the plant averaged 11.7% shoots, 19.5% leaves, 16% burs, and 52.8%
seed. Bassett et al. (1970), while examining dry matter accumulation and nutrient
uptake in irrigated cotton, reported evidence of considerable translocation of nutrients
from the vegetative tissue into the bolls in late season. It is unlikely that sampling leaf
tissue 35 days earlier for the greenhouse study compared to the field study sampling date
could have influenced leaf P concentrations to the extent observed in the greenhouse
study, even though some nutrient translocation has been reported to occur.
Under field conditions, soil application of nutrients was not provided after the
side-dress application of N prior to first bloom in our study. Consequently, if uptake of
nutrients did not meet the requirements of the developing fruit, some nutrients would
have been transported from other non-reproductive plant parts, including the leaves.
Conversely, in the greenhouse study, this possibility was minimized because of the

132
frequent application of soil fertilizer to the pots. The excellent growing conditions of the
greenhouse environment resulted in vigorous plant growth creating a high nutrient
demand. To avoid plant nutrient stress, frequent soil-applied fertilizer applications were
made during the fruit-set and boll-fill period. Therefore, the difference in leaf P
concentrations observed may partially be attributed to different fertilizer regimes
followed for the two studies.
Results from the field study regarding cultivar and IR main effects and their
influence on leaf P levels were more conclusive than the findings for the greenhouse
study. The high variability in the greenhouse data, combined with the absence of
significant mean differences, negated circumstantial evidence that foliar P and OP
insecticides affected leaf P concentrations under greenhouse conditions. Based on the
data analysis, it could not be ascertained if plants acquired P from OP insecticides in the
greenhouse. Furthermore, the greenhouse study did not provide evidence of cultivar
differential response to FP treatments on leaf P concentrations.
Plant Growth Parameters
Growth measurements were made periodically during the season to determine
cultivar differences and influence of IR treatments on cotton under greenhouse
conditions. These measurements also allowed for comparison of cotton behavioral
response to field and greenhouse environments.
Cotton grown in this study reached maximum height at approximately 100 DAP,
with only a slight increase in height thereafter until harvest. Cultivar had little effect on
plant heights during the growing season. ANCOVA was used to determine if the slopes

133
for height modeled over time of each cultivar were different. Height trends for cultivars
from 38 DAP until harvest (146 DAP) gave slopes that were equal (P=0.0915)
throughout the growing season (Fig. 74). Furthermore, with the exception of cutout,
height means were not different at any individual point at which measurements were
obtained during the season. Height measurements acquired three days after cutout
indicated that both transgenic cultivars were significantly taller than the conventional
cultivar (Fig. 75). However, this height contrast for cultivars was not present at harvest.
Application of IR treatments had little effect on plant height at any point during
the growing season. Plant heights recorded three days after cutout for the IR treatments
ranged between 144.2 and 147.6 cm (Fig. 76). ANCOVA was performed on height data
recorded from 38 to 79 DAP and confirmed the absence (P=0.7352) of IR treatment
effects on plant height from 38 to 79 DAP (Fig. 77).
Differences in number of nodes were detected between cultivars at cutout.
ST474 had approximately 0.5 more nodes plant-1 than ST4892BR (Fig. 78). ST4793R
was not different from the other two cultivars. However these differences in nodal
number were not realized at harvest. Application of IR treatments did not affect the
number of nodes at any point during the growing season (Data not shown).
Cotton grown in this study achieved maximum internode length at approximately
83 DAP (one week post-cutout). Fig. 79 illustrates average internode length trends for
the three cotton cultivars. The ANCOVA procedure did not detect differences in the
slope of average internode lengths between the three cultivars. However, during the
growing season, ST474 generally had a smaller average internode length than the other

134
y = 0.0002x3 - 0.0832x2 + 10.007x - 234.46R2 = 0.9984
y = 0.0002x3 - 0.0828x2 + 9.8135x - 225.85R2 = 0.9978
y = 0.0002x3 - 0.0758x2 + 9.188x - 214.33R2 = 0.9978
y = 2.7069x - 54.37R2 = 0.9636
y = 2.5232x - 49.682R2 = 0.963
y = 2.5789x - 47.633R2 = 0.9601
20
60
100
140
180
220
30 50 70 90 110 130 150
ST4892BR
ST4793R
ST474
Days after planting
Plan
t hei
ght (
cm)
P=0.0915
38 - 146 DAP 38 - 79 DAP
Fig. 74. Height trends for three cotton cultivars from 38 DAP until harvest (146 DAP) in the greenhouse study. The P-value displayed is associated with the test for equality of slopes. The slopes for the regression lines (38 to 79 DAP) are statistically different at P<0.05 according to the analysis of covariance procedure.

135
147.3a
170.1a
150.3a
174.7a
141.0b
166.8a
100
125
150
175
200
Cutout Harvest
Growth stageST4892BRST4793RST474
Plan
t hei
ght (
cm)
P=0.0189 P=0.1407
Fig. 75. Plant height at cotton cutout and harvest for three cotton cultivars in the greenhouse study. Means followed by the same letter are not statistically different at P<0.05 according to the Tukey-Kramer procedure.

136
146.9a
167.2a
144.2a
169.8a
147.6a
174.5a
100
125
150
175
200
Cutout Harvest
Growth stageNP‡NP+FPOP
Plan
t hei
ght (
cm)
P=0.5922 P=0.3082
Fig. 76. Plant height at cotton cutout and harvest for insecticide regime (IR) treatments in the greenhouse study. Means followed by the same letter are not statistically different at P<0.05 according to the Tukey-Kramer procedure. ‡The following designations were used to denote IR treatments: NP, non-phosphate insecticide treatment (control); NP+FP, non-phosphate + foliar phosphorus treatment; and OP, organophosphate insecticide treatment.

137
y = 0.0002x3 - 0.0713x2 + 8.9155x - 208.85R2 = 0.9982
y = 0.0003x3 - 0.0892x2 + 10.349x - 239.51R2 = 0.9978
y = 0.0002x3 - 0.0813x2 + 9.7447x - 226.3R2 = 0.998
y = 2.5871x - 51.958R2 = 0.9693
y = 2.621x - 50.491R2 = 0.9589
y = 2.6008x - 49.232R2 = 0.958
20
60
100
140
180
220
30 50 70 90 110 130 150
NP‡
NP+FP
OP
Days after planting
Plan
t hei
ght (
cm)
P=0.7352
38 - 146 DAP 38 - 79 DAP
Fig. 77. Height trends for insecticide regime (IR) treatments from 38 DAP until harvest (146 DAP) in the greenhouse study. The P-value displayed is associated with the test for equality of slopes. The slopes for the regression lines (38 to 79 DAP) are statistically different at P<0.05 according to the analysis of covariance procedure. ‡The following designations were used to denote IR treatments: NP, non-phosphate insecticide treatment (control); NP+FP, non-phosphate + foliarphosphorus treatment; and OP, organophosphate insecticide treatment.

138
17.0b
24.5a
17.4ab
25.0a
17.5a
25.2a
10
15
20
25
30
Cutout Harvest
Growth stageST4892BRST4793RST474
Num
ber o
f nod
es p
lant
-1P=0.0463 P=0.3384
Fig. 78. Number of main-stem nodes at cotton cutout and harvest for three cotton cultivars in the greenhouse study. Means followed by the same letter are not statistically different at P<0.05 according to the Tukey-Kramer procedure.

139
y = 9E-06x3 - 0.0036x2 + 0.4132x - 6.3251R2 = 0.9665
y = 1E-05x3 - 0.0037x2 + 0.4181x - 6.2819R2 = 0.963
y = 7E-06x3 - 0.0029x2 + 0.3535x - 5.0858R2 = 0.9644
y = 0.0879x + 1.9318R2 = 0.8929
y = 0.0811x + 1.9099R2 = 0.8829
y = 0.0873x + 2.0385R2 = 0.905
4
5
6
7
8
9
10
30 50 70 90 110 130 150
ST4892BR
ST4793R
ST474
Days after planting
Inte
rnod
e le
ngth
(cm
)P=0.5223
38 - 146 DAP 38 - 79 DAP
Fig. 79. Average internode length trends for three cotton cultivars from 38 DAP until harvest (146 DAP) in the greenhouse study. The P-value displayed is associated with the test for equality of slopes. The slopes for the regression lines (38 to 79 DAP) are statistically different at P<0.05 according to the analysis of covariance procedure.

140
two cultivars. This observation is confirmed by evaluating this parameter at cutout and
harvest. At both cutout and harvest, ST474 had significantly smaller internode length
than the other cultivars (Fig. 80).
Application of IR treatments had minimal effect on average internode length at
any point during the season, which was expected based on the lack of response of plant
height and number of nodes to the IR treatments. The test for equality of slopes among
the IR treatments revealed unequal slopes (P=0.0364) (Fig. 81). The NP treatment had a
greater slope than the NP+FP and OP treatments, suggesting that treatments containing P
slightly affected plant vigor. Lancaster and Savatli (1965) found, in a preliminary
experiment of foliar P applications, that spray solutions of monoammonium phosphate
containing 2% percent P2O5 and solutions of orthophosphoric acid containing 0.5 %
P2O5 caused noticeable burning of cotton leaves, which could affect plant vigor. In the
greenhouse experiment, spray solutions of phosphoric acid used on the NP+FP
treatments had percentages of P2O5 considerably lower than those reported by Lancaster
and Savatli (1965), with ranges of 0.06 to 0.15 % P2O5 for the NP+FP treatments used in
our study. Therefore, the source of variation in slopes for average internode length
trends of IR treatments is not clearly understood. Peak internode length was observed
approximately 83 DAP and begins to decline after 90 DAP. Fruit growth has a higher
priority for carbohydrates than does vegetative growth (Kerby and Hake, 1996).
Coincidentally, the observed peak in internode length corresponds in proximity to the
timing of plant cutout, and the shift in carbohydrate allocation that occurs at this time.

141
8.66a
6.97a
8.67a
6.97a
8.07b
6.63b
5
6
7
8
9
10
Cutout Harvest
Growth stageST4892BRST4793RST474
Inte
rnod
e le
ngth
(cm
)P=0.0021 P=0.0450
Fig. 80. Average internode length at cotton cutout and harvest for three cotton cultivars in the greenhouse study. Means followed by the same letter are not statistically different at P<0.05 according to the Tukey-Kramer procedure.

142
y = 6E-06x3 - 0.0026x2 + 0.3344x - 4.625R2 = 0.9731
y = 1E-05x3 - 0.0037x2 + 0.4238x - 6.5934R2 = 0.9686
y = 1E-05x3 - 0.0039x2 + 0.4303x - 6.5656R2 = 0.9463
y = 0.084x + 1.8746R2 = 0.9105
y = 0.0822x + 2.2387R2 = 0.8413
y = 0.0903x + 1.7614R2 = 0.9171
4
5
6
7
8
9
10
30 50 70 90 110 130 150
NP‡
NP+FP
OP
Days after planting
Inte
rnod
e le
ngth
(cm
)P=0.0364
38 - 146 DAP 38 - 79 DAP
Fig. 81. Average internode length trends for insecticide regime (IR) treatments from 38 DAP until harvest (146 DAP) in the greenhouse study. The P-value displayed is associated with the test for equality of slopes. The slopes for the regression lines (38 to 79 DAP) are statistically different at P<0.05 according to the analysis of covariance procedure. ‡The following designations were used to denote IR treatments: NP, non-phosphate insecticide treatment (control); NP+FP, non-phosphate + foliar phosphorus treatment; and OP, organophosphate insecticide treatment.

143
Cotton cutout in the greenhouse study was reached at approximately 76 DAP.
Neither cultivar nor IR main effects influenced the timing of cotton cutout. The most
interesting finding regarding this parameter was the difference between the cutout dates
for cotton grown under field and greenhouse conditions. Cutout occurred approximately
19 days earlier in the greenhouse study. Investigation of greenhouse growing conditions
provided insight into this occurrence. In general, the daily DD60s during the trial were
consistently greater than those for the field study (Fig. 82). Furthermore, this trend
resulted in a substantial increase in cumulative DD60s compared to the field study (Fig.
83). In both the field and greenhouse studies, it took approximately 1700 heat units to
reach cutout. However, the rapid accumulation of heat units in the greenhouse
environment resulted in the plants reaching cutout 19 days earlier. The data regarding
heat unit accumulation in the greenhouse environment helps explain growth differences
observed in greenhouse cotton compared to that grown in a field situation. Plants under
greenhouse conditions achieved substantially greater height than those under field
conditions. Plant heights ranged from 70 to 80 cm taller in the greenhouse. Mepiquat
chloride was used in both field and greenhouse experiments to control plant height
(Appendices A and B, respectively). Furthermore, plants in the greenhouse had
approximately 2.5 more nodes than those in the field study. The average internode
length was approximately two times greater in cotton grown in the greenhouse. These
characteristic growth differences can be attributed to factors inherent to greenhouse
conditions such as lack of plant competition, optimal water and fertility management,
quality of light, and absence of stresses from unfavorable weather conditions and pests.

144
0
5
10
15
20
25
30
35
40
45
0 10 20 30 40 50 60 70 80 90 100 110 120 130 140 150 160 170
DD60s (2001)
DD60s (2002)
DD60s (Greenhouse 2003)
Dai
ly D
D60
s
Days after planting
Fig. 82. Comparison of daily growing degree days (DD60s) for the 2001 and 2002 field and the 2003 greenhouse studies from planting to harvest.
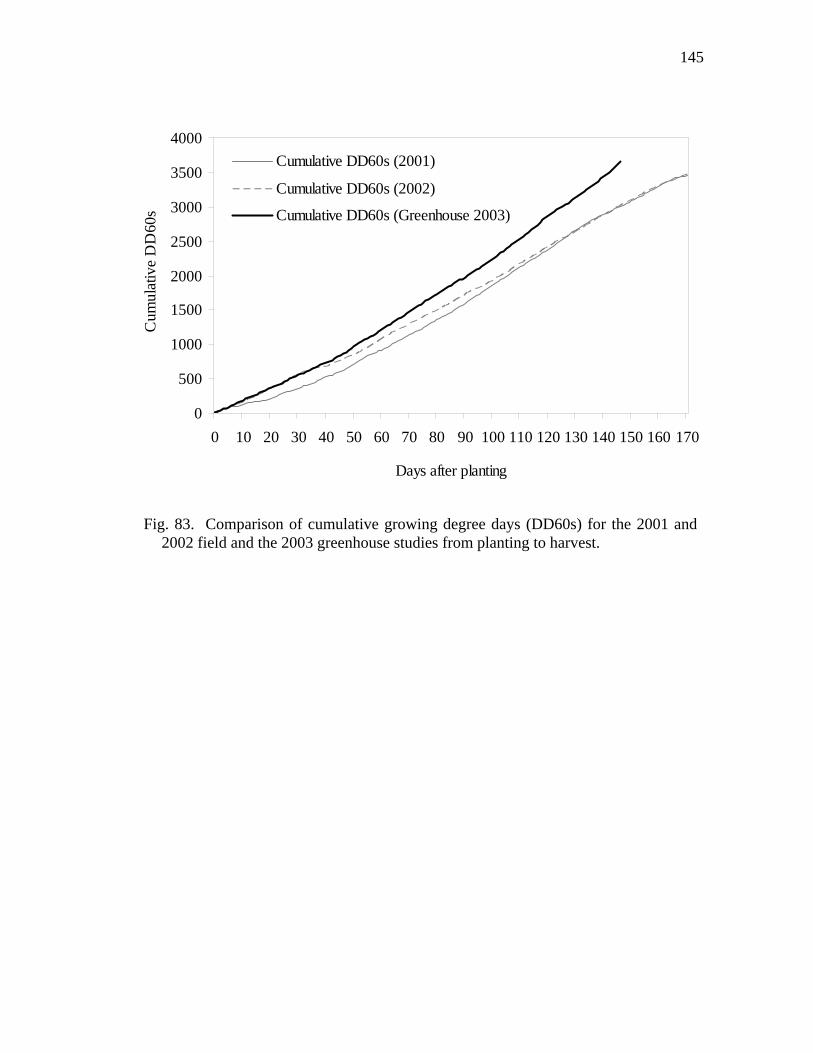
145
0
500
1000
1500
2000
2500
3000
3500
4000
0 10 20 30 40 50 60 70 80 90 100 110 120 130 140 150 160 170
Cumulative DD60s (2001)
Cumulative DD60s (2002)
Cumulative DD60s (Greenhouse 2003)
Cum
ulat
ive
DD
60s
Days after planting
Fig. 83. Comparison of cumulative growing degree days (DD60s) for the 2001 and 2002 field and the 2003 greenhouse studies from planting to harvest.

146
Plant Biomass Partitioning and Plant Mapping – Cutout
Biomass partitioning for the greenhouse study was evaluated two days after
cotton cutout, which occurred 76 DAP. The cultivar differences observed in plant height
at cutout are confirmed by examining stem dry weights. ST4892BR had greater stem
weight than ST474 (Fig. 84). ST4793R had numerically greater stem weight than ST474
but was not different from either ST4892BR or ST474. Leaf biomass was also different
among cultivars. Both transgenic cultivars had greater leaf dry weight per plant (Fig.
85). The leaf area follows this same trend, although the differences were not significant
(Fig. 86). The partitioning of fruit as a percentage of total plant dry weight was not
different between cultivars with all cultivars allocating approximately 19 to 21 percent
of biomass into fruiting structures (Fig. 87).
Cultivar had an effect on total boll production with ST4892BR and ST4793R
producing approximately 3.8 and 3.0 more bolls plant-1, respectively than ST474 (Fig.
88). The mean boll dry weight was approximately 1.2 g boll-1 for all cultivars (Fig. 89).
Furthermore, boll numbers at fruiting positions 1, 2, and 3 did not differ significantly
between cultivars (Fig. 90). The increase in total boll numbers (Fig. 88) for ST4892BR
and ST4793R reflects the numerical increases apparent at each of these fruiting sites
(Fig. 90). A significant contribution to ST4892BR yield originated from vegetative bolls
(Fig. 91). The percentage of total fruit retained for fruiting positions 1 through 4
throughout all sympodia averaged approximately 93 % for transgenic and conventional
cultivars (Data not shown).

147
48.06b
54.92ab
58.66a
40
45
50
55
60
65
ST4892BR ST4793R ST474
Cultivar
P=0.0150St
em ti
ssue
(g p
lant
-1)
Fig. 84. Dry weight of stem tissue per plant at cutout for three cotton cultivars in the greenhouse study. Means followed by the same letter are not statistically different at P<0.05 according to the Tukey-Kramer procedure.

148
38.73a
37.56a
32.93b
30
32
34
36
38
40
ST4892BR ST4793R ST474
Cultivar
Leaf
tiss
ue (g
pla
nt -1
)P=0.0218
Fig. 85. Dry weight of leaf tissue per plant at cutout for three cotton cultivars in the greenhouse study. Means followed by the same letter are not statistically different at P<0.05 according to the Tukey-Kramer procedure.

149
0.96a1.05a1.04a
0.0
0.2
0.4
0.6
0.8
1.0
1.2
1.4
ST4892BR ST4793R ST474
Cultivar
Leaf
are
a (m
2 pl
ant -
1 )P=0.1697
Fig. 86. Leaf area per plant at cutout for three cotton cultivars in the greenhouse study. Means followed by the same letter are not statistically different at P<0.05 according to the Tukey-Kramer procedure.

150
19.12a20.78a20.58a
0
5
10
15
20
25
30
ST4892BR ST4793R ST474
Cultivar
P=0.1598Pe
rcen
t fru
it bi
omas
s pla
nt -1
Fig. 87. Percent of total plant biomass partitioned as fruit at cutout for three cotton cultivars in the greenhouse study. Means followed by the same letter are not statistically different at P<0.05 according to the Tukey-Kramer procedure.

151
15.75b
18.83a19.58a
10
12
14
16
18
20
22
24
ST4892BR ST4793R ST474
Cultivar
P=0.0213N
umbe
r of b
olls
plan
t -1
Fig. 88. Total number of bolls per plant at cutout for three cotton cultivars in the greenhouse study. Means followed by the same letter are not statistically different at P<0.05 according to the Tukey-Kramer procedure.

152
1.12a1.23a1.23a
0.0
0.2
0.4
0.6
0.8
1.0
1.2
1.4
1.6
ST4892BR ST4793R ST474
Cultivar
P=0.4602M
ean
boll
wei
ght (
g pl
ant
-1)
Fig. 89. Mean boll dry weight per plant at cutout for three cotton cultivars in the greenhouse study. Means followed by the same letter are not statistically different at P<0.05 according to the Tukey-Kramer procedure.
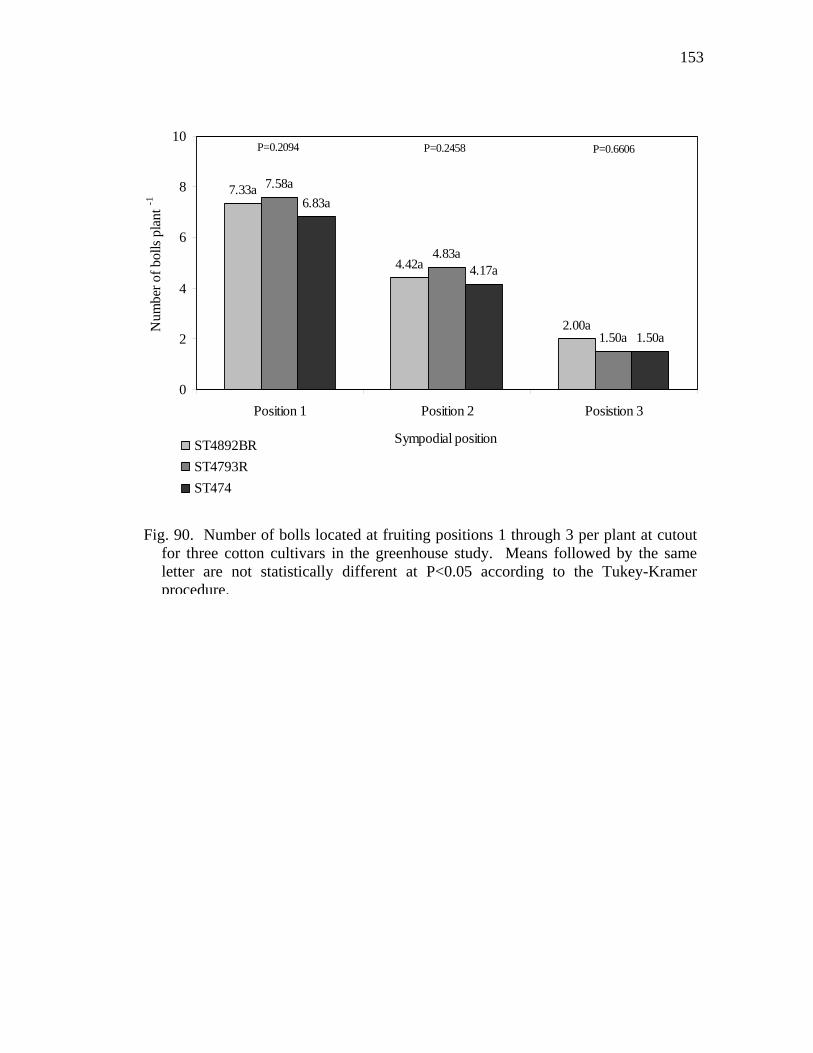
153
2.00a
4.42a
7.33a
1.50a
4.83a
7.58a
1.50a
4.17a
6.83a
0
2
4
6
8
10
Position 1 Position 2 Posistion 3
ST4892BRST4793RST474
Num
ber o
f bol
ls pl
ant
-1P=0.2094 P=0.2458 P=0.6606
Sympodial position
Fig. 90. Number of bolls located at fruiting positions 1 through 3 per plant at cutout for three cotton cultivars in the greenhouse study. Means followed by the same letter are not statistically different at P<0.05 according to the Tukey-Kramer procedure.

154
3.17b
4.83ab
5.58a
0
1
2
3
4
5
6
7
ST4892BR ST4793R ST474
Cultivar
P=0.0163N
umbe
r of v
eget
ativ
e bo
lls p
lant
-1
Fig. 91. Number of vegetative bolls per plant at cutout for three cotton cultivars in the greenhouse study. Means followed by the same letter are not statistically different at P<0.05 according to the Tukey-Kramer procedure.

155
The results for biomass partitioning of IR treatments generally reflected those
observed in the field study. Application of IR treatments had little effect on stem dry
weight (Fig. 92) and total amount of biomass partitioned as leaf tissue (Fig. 93). Both
parameters showed slight numerical reductions in biomass for the NP+FP treatment.
This trend contradicts the pattern for stem and leaf dry weights observed in the field
study. Based on the numerical reduction in biomass (Fig. 92), the trend for shorter
average internode length of the NP+FP treatment from 38 to 90 DAP (Fig. 81) may have
been attributed to plant stress from NP+FP applications in the greenhouse. If addition of
FP resulted in plant stress, the consequence could be reduction in dry matter production.
Neither the internode length nor stem and leaf biomass was significantly reduced as a
result of NP+FP treatments. The trends for leaf area reflected those for leaf dry weights
indicating that IR applications did not affect leaf size or thickness (Fig. 94). The
partitioning of fruit as a percentage of total plant dry weight was not different between
IR treatments with all treatments allocating approximately 20 percent of total plant
biomass into fruiting structures (Data not shown). Generally, these data show that IR
applications did not affect the partitioning of biomass within the plant at cutout.
Plant Mapping – Harvest
Plant mapping at harvest did not reveal any substantial differences for cultivar
and IR main effects. Total boll numbers plant-1 and mean boll weight were not different
among cultivar and IR treatments. There were differences in boll distribution among
sympodial positions for cultivars. ST474 and ST4793R had significantly more first
position bolls than ST4892BR (Fig. 95). These data contradict that from the field study
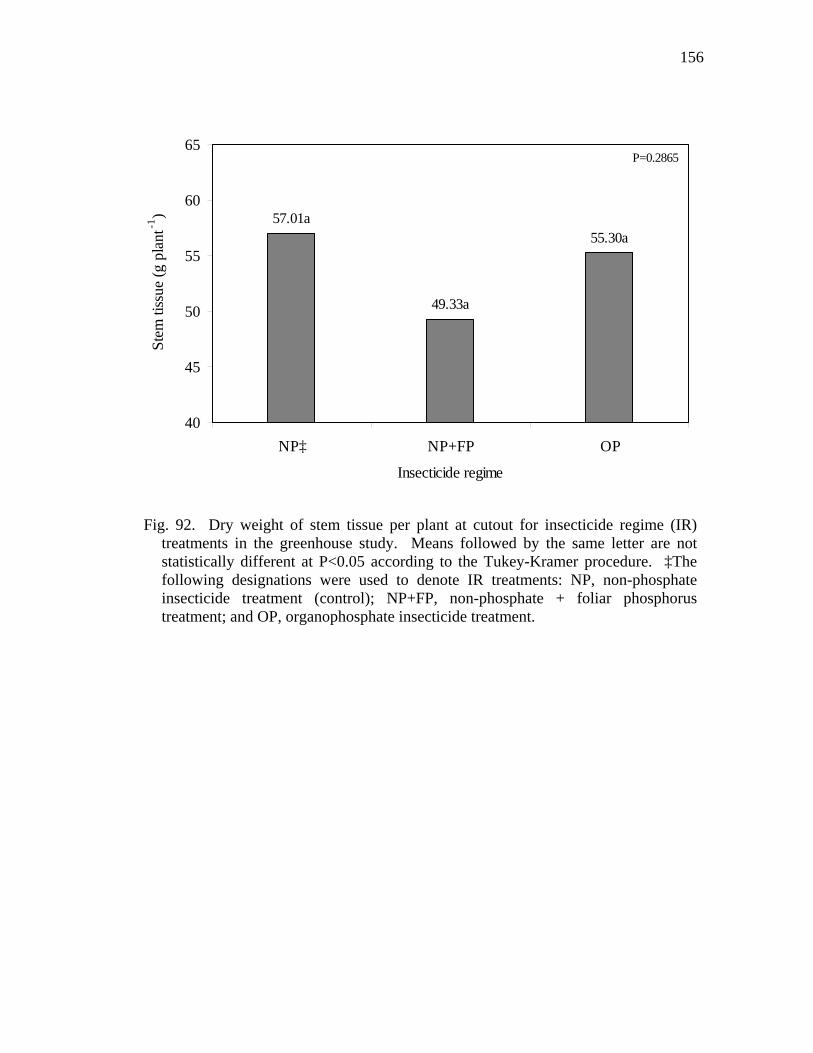
156
55.30a
49.33a
57.01a
40
45
50
55
60
65
NP‡ NP+FP OP
Insecticide regime
P=0.2865St
em ti
ssue
(g p
lant
-1)
Fig. 92. Dry weight of stem tissue per plant at cutout for insecticide regime (IR) treatments in the greenhouse study. Means followed by the same letter are not statistically different at P<0.05 according to the Tukey-Kramer procedure. ‡The following designations were used to denote IR treatments: NP, non-phosphate insecticide treatment (control); NP+FP, non-phosphate + foliar phosphorus treatment; and OP, organophosphate insecticide treatment.

157
36.79a
34.82a
37.61a
30
32
34
36
38
40
NP‡ NP+FP OP
Insecticide regime
P=0.5072Le
af ti
ssue
(g p
lant
-1)
Fig. 93. Dry weight of leaf tissue per plant at cutout for insecticide regime (IR) treatments in the greenhouse study. Means followed by the same letter are not statistically different at P<0.05 according to the Tukey-Kramer procedure. ‡The following designations were used to denote IR treatments: NP, non-phosphate insecticide treatment (control); NP+FP, non-phosphate + foliar phosphorus treatment; and OP, organophosphate insecticide treatment.

158
1.06a0.98a1.01a
0.0
0.2
0.4
0.6
0.8
1.0
1.2
1.4
NP‡ NP+FP OP
Insecticide regime
P=0.4893Le
af a
rea
(m 2 p
lant
-1)
Fig. 94. Leaf area per plant at cutout for insecticide regime (IR) treatments in the greenhouse study. Means followed by the same letter are not statistically different at P<0.05 according to the Tukey-Kramer procedure. ‡The following designations were used to denote IR treatments: NP, non-phosphate insecticide treatment (control); NP+FP, non-phosphate + foliar phosphorus treatment; and OP, organophosphate insecticide treatment.

159
7.63b
4.71a
1.46a
8.66a
4.86a
1.72a
9.22a
5.33a
1.80a
0
2
4
6
8
10
12
Position 1 Position 2 Posistion 3
ST4892BRST4793RST474
Num
ber o
f bol
ls pl
ant
-1P=0.0025 P=0.7857P=0.4092
Sympodial position
Fig. 95. Number of harvestable bolls located at fruiting positions 1 through 3 per plant for three cotton cultivars in the greenhouse study. Means followed by the same letter are not statistically different at P<0.05 according to the Tukey-Kramer procedure.
160
which showed ST4892BR having significantly more first position bolls than ST4793R
and ST474. Furthermore, under field conditions, ST4892BR produced more total bolls
than the other two cultivars. Mean boll weights at fruiting positions 1, 2, and 3 were not
different among the cultivars in the greenhouse study (Fig. 96).
Examination of boll numbers in sympodial ranges 6 through 10 failed to show
any differences (Fig. 97). However, ST474 contained approximately one more boll
within sympodial range 11 through 15. This is further reflected in assessing the
seedcotton contribution of sympodial ranges as a percentage of final yield. ST474 had a
larger (P=0.0580) percentage of seedcotton contribution from sympodia 11 through 15
than ST4892BR (Fig. 98). ST4793R was not different from the other cultivars in this
sympodial range. There were no significant cultivar differences in seedcotton
contribution for sympodia 6 through 10 or 16 through 20. However, the numerical
trends for sympodia 6 through 10 reflect those increases observed in the yield for
ST4892BR.
This evaluation revealed the difference in fruit distribution for greenhouse
compared to field conditions. In the greenhouse, approximately 60 and 40 percent of
seedcotton was distributed in sympodial ranges 6 through 10 and 11 through 15,
respectively. In the field study, the largest percentage of yield contribution came from
sympodial range 11 through 15. The shift in yield distribution from lower sympodia to
mid-plant sympodial branches, in the field, may be a response to leaf shading of lower
sympodia (Kerby and Hake, 1996) as well as indications of early season fruit loss to
insects.

161
4.09a
5.09a
5.48a
4.30a
5.01a5.21a
4.04a
4.73a
5.21a
3.0
4.0
5.0
6.0
7.0
Position 1 Position 2 Position 3
Sympodial positionST4892BRST4793RST474
P=0.9154P=0.4251 P=0.2264Se
edco
tton
(g b
oll -1
pla
nt -1
)
Fig. 96. Mean seedcotton weight for bolls located at fruiting positions 1 through 3 for three cotton cultivars in the greenhouse study. Means followed by the same letter are not statistically different at P<0.05 according to the Tukey-Kramer procedure.

162
8.38a
5.33b
8.85a
5.89ab
9.17a
6.65a
0
2
4
6
8
10
12
14
6 ~ 10 11 ~ 15
Sympodial branch rangeST4892BRST4793RST474
P=0.3247 P=0.0635N
umbe
r of b
olls
plan
t -1
Fig. 97. Number of harvestable bolls located on sympodia 6 through 15 per plant for three cotton cultivars in the greenhouse study. Means followed by the same letter are not statistically different at P<0.10 according to the Tukey-Kramer procedure.
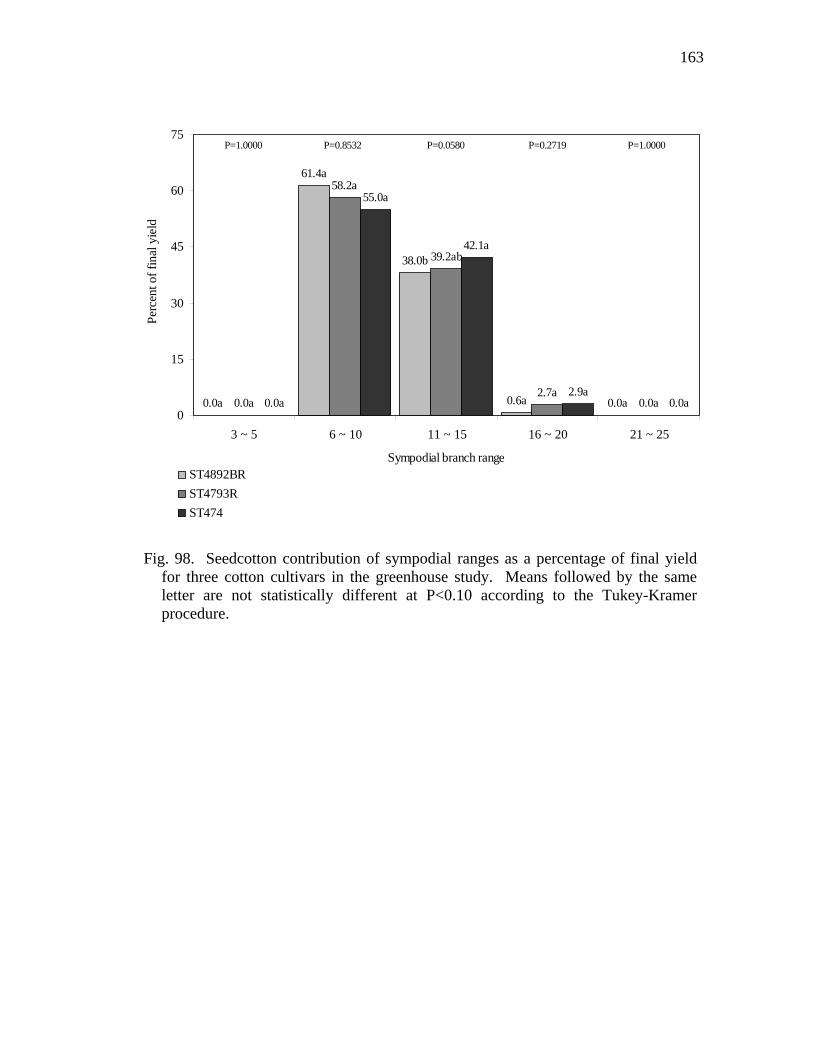
163
0.6a
38.0b
61.4a
0.0a0.0a
58.2a
2.7a0.0a0.0a
39.2ab
55.0a
2.9a0.0a0.0a
42.1a
0
15
30
45
60
75
3 ~ 5 6 ~ 10 11 ~ 15 16 ~ 20 21 ~ 25
Sympodial branch rangeST4892BRST4793RST474
Perc
ent o
f fin
al y
ield
P=0.8532 P=0.0580 P=0.2719P=1.0000 P=1.0000
Fig. 98. Seedcotton contribution of sympodial ranges as a percentage of final yield for three cotton cultivars in the greenhouse study. Means followed by the same letter are not statistically different at P<0.10 according to the Tukey-Kramer procedure.

164
IR treatments had a significant impact on the number of bolls at fruiting positions
1 and 2 (Fig. 99). Addition of FP added approximately one more (P=0.1050) first
position boll compared to NP alone. Conversely, use of FP reduced (P=0.0796) second
position bolls by approximately one boll compared to NP. This may be the primary
reason for yield similarities between NP and NP+FP. Cotton response to OP was not
different from NP or NP+FP relative to boll numbers at fruiting positions one through
three. Mean boll weights at fruiting positions 1 through 3 did not respond significantly
to any IR treatment, although numerical trends reflecting those observed in yield were
evident (Fig. 100). Furthermore, the seedcotton distribution among sympodia was not
affected by IR treatments (Data not shown). Some differences were found in boll
distribution among fruiting positions for NP and NP+OP. Therefore, seedcotton
contribution of sympodial ranges as a percentage of final yield was examined to
investigate the magnitude of this effect across plant architecture (Fig. 101). This
assessment confirmed that the differences in fruiting position characteristics were not
localized to a specific sympodial range. Generally, the NP+FP treatment only appeared
to increase the number of first position bolls; however, the reduction in second position
bolls negated any yield increase over NP. No significant cultivar by IR treatment
interactions were detected for the data presented in the greenhouse study section of this
document, which suggests that the three cultivars responded similarly to all levels of IR
treatment applications.

165
8.08b
5.63a
1.79a
8.79a
4.54b
1.50a
8.63ab
4.74ab
1.68a
0
2
4
6
8
10
12
Position 1 Position 2 Posistion 3
NP‡NP+FPOP
P=0.7528P=0.0796P=0.1050
Sympodial position
Num
ber o
f bol
ls pl
ant
-1
Fig. 99. Number of harvestable bolls located at fruiting positions 1 through 3 per plant for insecticide regime (IR) treatments in the greenhouse study. Means followed by the same letter are not statistically different at P<0.10 according to the Tukey-Kramer procedure. ‡The following designations were used to denote IR treatments: NP, non-phosphate insecticide treatment (control); NP+FP, non-phosphate + foliar phosphorus treatment; and OP, organophosphate insecticide treatment.

166
5.25a
4.76a
4.17a
5.44a5.17a
3.69a
5.20a4.90a
4.56a
3.0
4.0
5.0
6.0
7.0
Position 1 Position 2 Position 3
Sympodial positionNP‡NP+FPOP
P=0.3865Se
edco
tton
(g b
oll -1
pla
nt -1
)P=0.6040 P=0.1458
Fig. 100. Mean seedcotton weight for bolls located at fruiting positions 1 through 3 for insecticide regime (IR) treatments in the greenhouse study. Means followed by the same letter are not statistically different at P<0.05 according to the Tukey-Kramer procedure. ‡The following designations were used to denote IR treatments: NP, non-phosphate insecticide treatment (control); NP+FP, non-phosphate + foliar phosphorus treatment; and OP, organophosphate insecticide treatment.

167
1.0a
39.5a
59.5a
0.0a0.0a2.8a
40.9a
56.2a
0.0a0.0a2.5a
39.0a
58.5a
0.0a0.0a0
15
30
45
60
75
3 ~ 5 6 ~ 10 11 ~ 15 16 ~ 20 21 ~ 25
Sympodial branch rangeNPNP+FPOP
Perc
ent o
f fin
al y
ield
P=0.7066 P=0.7845 P=0.2742P=1.0000 P=1.0000
Fig. 101. Seedcotton contribution of sympodial ranges as a percentage of final yield for insecticide regime (IR) treatments in the greenhouse study. Means followed by the same letter are not statistically different at P<0.05 according to the Tukey-Kramer procedure. ‡The following designations were used to denote IR treatments: NP, non-phosphate insecticide treatment (control); NP+FP, non-phosphate + foliar phosphorus treatment; and OP, organophosphate insecticide treatment.
168
CONCLUSIONS
Genetically modified cotton acreage has increased dramatically over the last six
years. Reports of variable results in fiber quality and yield have arisen regarding
transgenic cultivars. Previous research exhibits inconsistencies in performance of
stacked-gene and Roundup Ready® cultivars compared to the respective recurrent parent
cultivar. Some changes in production practices have occurred coincident with the
introduction of transgenic technology, such as reduced use of broad-spectrum
insecticides including organophosphates and less cultivation that could potentially
influence the growth and yield of cotton. One factor that might affect these parameters
is the difference in the amount of foliar-applied P between an OP and NP insecticide
regime. Therefore, a study was conducted under field and greenhouse conditions to
investigate performance of transgenic and conventional cotton and determine the
efficacy of OP and NP treatments on growth characteristics, yield, and fiber quality of
cotton.
Cotton lint yield in the field study was substantially affected by cultivar.
ST4892BR produced greater lint yields than ST4793R and ST474. These results are
consistent with Bosch et al. (2002) who reported cultivars containing the Bollgard®
transgene had consistent yield advantages compared to non-Bollgard® cultivars.
Furthermore, Moser et al. (2001) found that stacked-gene cultivars produced lint yields
that were equivalent to or significantly greater than lint yields of their respective
conventional counterparts. In the field study, the lint yields for ST4793R were
significantly less than ST4892BR but not different from ST474. This finding supports

169
the work of Moser et al. (2001) who reported Roundup Ready® cultivars produced lint
yields that were similar to their conventional parent. Analysis of yield components
revealed the stacked-gene cultivar had significantly larger bolls and contained
considerably more bolls per plant than the other two cultivars. The increase in total bolls
for ST4892BR was predominantly isolated to sympodia 6 through 10. Furthermore, a
significant increase in the number of first position bolls was observed for ST4892BR.
As a result, this may have substantially influenced mean boll weight since bolls on lower
sympodia and those closer to the main stem, compared to distal positions, are larger and
therefore contribute more towards yield (Ashley, 1972; Wullschleger and Oosterhuis,
1990; Kerby and Ruppenicker, 1992; Parvin and Atkins, 1997).
Application of IR treatments exerted some influence on lint yields in the field
study. Although the differences were not significant at the 5% level, there was evidence
that cotton treated with FP responded with a yield increase compared to NP and OP
treatments. OP had no effect on lint yields or yield components. Examination of yield
components revealed the yield increase for NP+FP was primarily due to an increase in
the number of second position bolls. Furthermore, the increase in second position boll
numbers was predominantly isolated to sympodial branches 6 through 10. Cotton also
responded to NP+FP by significantly increasing the number of bolls located on
sympodia 21 through 25. While yield from this sympodial range does not contribute
significantly to final yield (approximately 1.6% of yield), this increase suggests that the
additional P may have affected boll set. Coincidentally, the NP+FP treatments
containing the greatest amount of P per treatment were applied during fruit set in this

170
nodal range. Furthermore, it suggests that plants receiving NP+FP may have been able
to maintain the boll load without shedding fruit. In this trial, fruit set in this range
coincided with cotton cutout, a period when all available photosynthate is consumed by
developing fruit resulting in cessation of vegetative growth.
Cultivar had little effect on lint quality in this study. The conventional cultivar
produced longer fibers than the Roundup Ready® line, and because the values were in
the discounted range, the conventional cultivar could have resulted in a smaller discount.
Fiber length of ST4892BR was not different from its counterparts, although its mean
length was slightly greater than ST4793R. The fiber results for the cultivars studied
support the conclusions of Moser et al. (2001) who reported that fiber length of some
transgenic cultivars was shorter than that of their conventional parents. IR treatments
did not significantly affect any of the fiber quality characteristics examined.
Plant height at peak bloom and cutout was greater for ST4892BR compared to
ST474, while each cultivar maintained the same number of main-stem nodes. In turn,
ST474 had a shorter average internode length than ST4892BR. Although this change in
internode length could suggest a possible shift in allocation of carbohydrates from
vegetative to reproductive growth, this response did not result in a yield advantage for
ST474. ST4793R was similar in height and number of nodes to both counterparts. End-
of-season plant height and nodes were equivalent for all cultivars. ST4793R partitioned
more plant biomass into leaf and stem tissue than ST474 by peak bloom, which
coincides with the visual observation that ST4793R had a more rank appearance
compared to ST474 during the season.

171
Leaf tissue analysis revealed similar leaf P concentrations for NP+FP and OP
treatments, suggesting that plants acquire P from OP insecticides. Based on the yield
response to NP+FP, yields from OP treatment should have been similar to that of NP+FP
if plants were utilizing the P intrinsic to OP compounds as efficiently as may have been
the case with the NP+FP treatment. However, lint yield was not influenced by OP
applications. The lack of response may be evidence that the P component of OP is not
utilized as effectively as that contained in foliar fertilizers. No differences were
observed regarding leaf tissue P concentrations for ST4892BR and ST474.
Results from the greenhouse study did not provide conclusive support of the field
observations for either cultivar or IR main effects. Although slight variations in yield
component and distribution characteristics were observed, a yield advantage did not
result from cultivar or IR main effects. Both transgenic versions accumulated more leaf
and stem biomass than the conventional cultivar by cotton cutout, although the ST4793R
stem biomass increase was not significant. The stem weight contrast was primarily a
function of increased height over the conventional parent. None of the early-season
plant growth characteristics associated with a particular technology type contributed to a
yield advantage. IR applications did not exert any influence on growth parameters or
biomass partitioning elements during the growing season.
This research study showed definitive benefits of stacked-gene transgenic cotton
over its Roundup Ready® and conventional parent for this Stoneville seed line,
especially in terms of lint yield. Cultivar response to foliar IR treatments was similar for
all growth, yield, and fiber quality parameters presented in this document. OP

172
insecticides did not influence the growth, yield, or fiber quality characteristics of cotton.
Results from this study indicate a potential benefit from FP use in cotton, even when
adequate soil-test P levels are present. While conclusive evidence exists regarding
cultivar yield differences, this study does not provide sufficient evidence to conclude
that OP insecticides influence growth, yield, or fiber quality characteristics of these
cotton cultivars.

173
REFERENCES
Adkisson, P., T. Archer, J. Benedict, R. Frisbie, P. Morrison, P. Pietrantonio, and G. Teetes. 1999. Position statement on insect-resistant transgenic crops: Potential benefits and risks. Available at: http://agfacts.tamu.edu/~jbenedic/TRANS.htm
Andrews, G., B. Atkins, C. Collison, D. Boykin, D. Hardee, A. Harris, B. Layton, W.
McCarty, P. McKibben, J. Phelps, J. Reed, J. Robbins, G. Snodgrass, S. Stewart, and M. Williams. 2001. Cotton insect control guide 2001. Mississippi State Univ. Ext. Service, Mississippi State, MS. pub. 343.
Ashley, D.A. 1972. 14C-labeled photosynthate translocation and utilization in cotton
plants. Crop Sci. 12:69-74. Barber, S.A., J.M. Walker, and E.H. Vasey. 1963. Mechanisms for the movement of
plant nutrients from the soil and fertilizer to the plant root. J. Agric. Food Chem. 11:204-207.
Barrow, N.J. 1980. Evaluation and utilization of residual phosphorus in soils. p. 335-
355. In The role of phosphorus in soils. F.E. Khasawneh, E.C. Sample, and E.J. Kamprath, eds. Madison, WI. Am. Soc. Agron.
Bassett, D.M., W.D. Anderson, and C.H.E. Werkhoven. 1970. Dry matter production
and nutrient uptake in irrigated cotton (Gossypium hirsutum). Agron. J. 62:299-303.
Bauer, P.J. and Cothren, J.T. 1990. Growth-promoting activity of chlordimeform.
Agron. J. 82:73-75. Bednarz, C.W., N.W. Hopper, and M.G. Hickey. 1998. Effects of foliar fertilization of
Texas Southern High Plains cotton: Leaf nitrogen and growth parameters. J. Prod. Agric. 11:80-84.
Bednarz, C.W., N.W. Hopper, and M.G. Hickey. 1999. Effects of foliar fertilization of
Texas Southern High Plains cotton: Leaf phosphorus, potassium, zinc, iron, manganese, boron, calcium, and yield distribution. J. Plant Nutr. 22(6):863-875.
Bednarz, C.W., D.C. Bridges, and S.M. Brown. 2000. Analysis of cotton yield stability
across population densities. Agron. J. 92:128-135. Benedict, C.R., and R.J. Kohel. 1975. Export of 14C-assimilates in cotton leaves. Crop
Sci. 15:367-372.

174
Bosch, J., S. Fuchs, D. Pustejovsky, and D. Albers. 2002. Yield and economic comparison of Bollgard varieties in the Texas gulf coast region. Proc. Beltwide Cotton Conf., National Cotton Council Am., Memphis, TN. Available on: cdrom.
Boquet, D.J., E.B. Moser, and G.A. Breitenbeck. 1993. Nitrogen effects on boll retention
of field-grown cotton. Agron. J. 85:34-39. Boquet, D.J., E.B. Moser, and G.A. Breitenbeck. 1994. Boll weight and within-plant
yield distribution in field-grown cotton given different levels of nitrogen. Agron. J. 86:20-26.
Boquet, D.J., and A.B. Coco. 1996. Yield response of irrigated and rainfed cotton to row
spacing, N rate and plant population density. Proc. Beltwide Cotton Conf., National Cotton Council Am., Memphis, TN. 2:1384-1386.
Boquet, D.J. and E.B. Moser. 2003. Boll retention and boll size among intrasympodial
fruiting sites in cotton. Crop Sci. 43:195-201. Bourland, F.M., D.M. Oosterhuis, and N.P. Tugwell. 1992. Concept for monitoring the
growth and development of cotton plants using main-stem node counts. J. Prod. Agric. 5:532-538.
Bryant, K.J., W.C. Robertson, G. Lorenz, C.T. Allen, F.M. Bourland, and L. Earnest.
2000. Economic evaluation of transgenic cotton systems in Arkansas. p. 38-43. Proc. Cotton Research Meeting. AAES Special Report 198.
Burris, E., G.B. Padgett, J. Price, and K. Sanders. 2001. Assessing the effects of planting
date, seeding rate and fungicide on cotton stand and yield. Proc. Beltwide Cotton Conf., National Cotton Council Am., Memphis, TN. 1:150-151.
Crozier, C.R. 2004. 2004 North Carolina cotton production guide. p. 52. North Carolina
Cooperative Extension Service, North Carolina State Univ., Raleigh, NC. Available at: http://ipm.ncsu.edu/Production_Guides/cotton/chptr7.pdf.
Edge, J.M., J.H. Benedict, J.P. Carroll, and K.H. Reding. 2001. Contemporary Issues:
Bollgard cotton: An assessment of global economic, environmental, and social benefits. J. Cotton Sci. 5:121-136.
Ethridge, M.D., and E.F. Hequet. 2000. Fiber properties and textile performance of
transgenic cotton versus parent varieties. Proc. Beltwide Cotton Conf., National Cotton Council Am., Memphis, TN. 1:731-737.

175
Feagley, S.E., M.S. Valdez, and W.H. Hudnall. 1994. Papermill sludge, phosphorus, potassium, and lime effect on clover grown on a mine soil. J. Environmental Quality. 23(4):759-765.
Galadima, A., S.H. Husman, and J.C. Silvertooth. 2003. Plant population effect on yield
and fiber quality of three upland cotton varieties at Maricopa Agricultural Center, 2002. Arizona Cotton Report, Univ. of Arizona College of Agric. and Life Sci., Tucson, AZ. Available at: http://cals.arizona.edu/pubs/crops/az1312.
Gerik, T.J., W.D. Rosenthal, C.O. Stockle, and B.S. Jackson. 1989. Analysis of cotton
fruiting, boll development, and fiber properties under nitrogen stress. Proc. Beltwide Cotton Conf., National Cotton Council Am., Memphis, TN. 1:64-67.
Gipson, J.R. 1986. Temperature effects on growth, development, and fiber properties. p.
48-49. In Cotton physiology. J.R. Mauney and J.McD. Stewart, eds. The Cotton Foundation. Memphis, TN.
Hake, K.D., D.M. Bassett, T.A. Kerby, and W.D. Mayfield. 1996a. Producing quality
cotton. p. 134-149. In Cotton production manual. S.J. Hake, T.A. Kerby, and K.D. Hake, eds. Univ. of California Division of Agriculture and Natural Resources, Oakland, CA. pub. 3352.
Hake, S.J., K.D. Hake, and T.A. Kerby. 1996b. Early- to mid-bloom decisions. p. 51-63.
In Cotton production manual. S.J. Hake, T.A. Kerby, and K.D. Hake, eds. Univ. of California Division of Agriculture and Natural Resources, Oakland, CA. pub. 3352.
Halevy, J. 1976. Growth rate and nutrient uptake of two cotton cultivars grown under
irrigation. Agron. J. 68:701-705. Havlin, J.L., J.D. Beaton, S.L. Tisdale, and W.L. Nelson. 1999. Soil fertility and
fertilizers, 6th ed. p. 155-156. Prentice Hall, Upper Saddle River, NJ. Hernandez-Jasso, A., and J. Gutierrez-Zamoran. 2000. Response to plant density in
cotton cultivars, yield and yield components. Yaqui Valley, Sonora Mexico. Proc. Beltwide Cotton Conf., National Cotton Council Am., Memphis, TN. 1:568-570.
Holford, I.R.C. 1997. Soil phosphorus: Its measurement, and its uptake by plants. Aust.
J. Soil Res. 35:227-239. Hons, F.M., N.W. Hopper, and T.V. Hicks. 1990a. Applied phosphorus and potassium
effects on the emergence, yield, and planting seed quality of cotton. J. Prod. Agric. 3:337-340.
176
Hons, F.M., L.A. Larson-Vollmer, and M.A. Locke. 1990b. NH4Oac-EDTA extractable phosphorus as a soil test procedure. Soil Sci. 149:249-256.
Jenkins, J.N., J.C. McCarty, Jr., and W.L. Parrott. 1990a. Fruiting efficiency in cotton:
Boll size and boll set percentage. Crop Sci. 30:857-860. Jenkins, J.N., J.C. McCarty, Jr., and W.L. Parrott. 1990b. Effectiveness of fruiting sites
in cotton: Yield. Crop Sci. 30:365-369. Jenkins, J.N., and J.C. McCarty. 1995. Useful tools in managing cotton production: End
of season plant maps. Mississippi Agriculture and Forestry Exp. Stn. Bull. 1024. Jones, M.A., and R. Wells. 1998. Fiber yield and quality of cotton grown at two
divergent population densities. Crop Sci. 38:1190-1195. Keeney, D.R., and D.W. Nelson. 1982. Nitrogen-inorganic forms. p. 643-698. In
Methods of soil analysis. Agronomy Monograph 9, Part 2, 2nd ed. Page, Miller, and Keeney, eds. Am. Soc. Agron., Madison, WI.
Kerby, T.A., M. Keely, and S. Johnson. 1987. Growth and development of Acala cotton.
Univ. of Calif. Agric. Exp. Stn. Bull. 1921. Kerby, T.A., and G. Ruppenicker. 1992. Canopy architecture and fiber quality variation
by branch location. Proc. Beltwide Cotton Conf., National Cotton Council Am., Memphis, TN. 3:1069.
Kerby, T.A., and K.D. Hake. 1996. Monitoring cotton’s growth. p. 335-355. In Cotton
production manual. S.J. Hake, T.A. Kerby, and K.D. Hake, eds. Univ. of California Division of Agriculture and Natural Resources, Oakland, CA. pub. 3352.
Kerby, T.A., S.J. Hake, K.D. Hake, L.M. Carter, and R.H. Garber. 1996. Seed quality
and planting environment. p. 203-209. In Cotton production manual. S.J. Hake, T.A. Kerby, and K.D. Hake, eds. Univ. of California Division of Agriculture and Natural Resources, Oakland, CA. pub. 3352.
Kerby, T., B. Hugie, K. Howard, M. Bates, J. Burgess, and J. Mahaffey. 2000. Fiber
quality comparisons among varieties for conventional, Bollgard, and Roundup Ready versions. Proc. Beltwide Cotton Conf., National Cotton Council Am., Memphis, TN. 1:484-488.
Kerby, T., D. Albers, K. Lege’, and J. Burgess. 2002. Changes in yield and fiber quality
due to variety grown. Proc. Beltwide Cotton Conf., National Cotton Council Am., Memphis, TN. Available on: cdrom.

177
Kuepper, G. 2003. Foliar fertilization. Appropriate Technology Transfer for Rural Areas (ATTRA). Available at: http://attra.ncat.org/attra-pub/pdf/foliar.pdf.
Lancaster, J.D., and Z.A. Savatli. 1965. Foliar application of phosphorus for cotton.
Mississippi State Univ. Agric. Exp. Stn. Bull. 708. Landivar, J.A. 1993. A plant map analysis program for cotton – PMAP. Texas
Agriculture Exp. Sta. MP. 1740. Texas Agric. Exp. Stn., College Station, TX. Leffler, H.R. 1983. Population density affects the development of plant structure and
yield. Proc. Beltwide Cotton Conf., National Cotton Council Am., Memphis, TN. 1:45.
Lege’, K.E., T.A. Kerby, D.A. Albers, and T.R. Speed. 2001. Yield and fiber quality
comparisons between transgenic and conventional varieties. Proc. Beltwide Cotton Conf., National Cotton Council Am., Memphis, TN. 1:405-408.
Makhdum, M., M. Malik, S. Din, and F. Chaudhry. 2001. Effect on growth, yield, and
fibre quality of two cotton cultivars. J. Res. Sci. Multan, Pakistan. 12:140-146. Mauney, J.R. 1986. Vegetative growth and fruit development. p. 27. In Cotton
physiology. J.R. Mauney and J.McD. Stewart, eds. The Cotton Foundation. Memphis, TN.
McConnell, J.S., W.H. Baker, and R.C. Kirst, Jr. 1998. Soil and plant nutrition: Yield
and petiole nitrate concentrations of cotton treated with soil-applied and foliar-applied nitrogen. J. Cotton Sci. 2:143-152.
Microsoft Corporation. 1985-2001. Microsoft Excel 2002 for Windows, Release
10.4302.4219-SP-2. Microsoft Corporation. Redmond, WA. Milliken, G.A., and D.E. Johnson.1992. Analysis of messy data vol. 1: Designed
experiments. Chapman and Hall. New York, NY. Milliken, G.A., and D.E. Johnson. 2002. Analysis of messy data vol. 3: Analysis of
covariance. Chapman and Hall, CRC Press. Boca Raton, FL. Moser, H.S., W.B. McCloskey, and J.C. Silvertooth. 2001. Performance of transgenic
cotton varieties in Arizona. Proc. Beltwide Cotton Conf., National Cotton Council Am., Memphis, TN. 1:420-423.
Mullins, G.L., and C.H. Burmester. 1990. Dry matter, nitrogen, phosphorus, and
potassium accumulation by four cotton varieties. Agron. J. 82:729-736

178
NASS, USDA Agricultural Statistics. 2002. Field crops: Final estimates 1997-2002. Available at: http://www.usda.gov/nass/pubs/histdata.htm.
Nelson, W.L. 1949. The effect of nitrogen, phosphorus, and potash on certain lint and
seed properties of cotton. Agron. J. 41:289-293. Ohlendorf, B.L., P.A. Rude, J.K. Clark, and M.L. Flint. 1996. Integrated pest
management for cotton, 2nd ed. p. 17-23. Univ. of California Division of Agriculture and Natural Resources, Oakland, CA. pub. 3305.
Olsen, L.C., and R.P. Bledsoe. 1942. The chemical composition of the cotton plant and
the uptake of nutrients at different stages of growth. Georgia Agric. Exp. Stn., Athens, GA. Bull. 222.
Oosterhuis, D.M., F.M. Bourland, N.P. Tugwell, and M.J. Cochran. 1996. Terminology
and concepts related to COTMAN crop monitoring system. Ark. Agric. Exp. Stn. Spec. Rep. 174, Fayetteville, AR.
Ott, R.L., and M. Longnecker. 2001. An introduction to statistical methods and data
analysis, 5th ed. p. 204-220. Wadswoth Group. Pacific Grove, CA. Parvin, D., and R. Atkins. 1997. Comparative value per acre by fruiting site for two plant
growth regulators. Proc. Beltwide Cotton Conf., National Cotton Council Am., Memphis, TN. 1:336-338.
Peferoen, M. 1997. Insect control with transgenic plants expressing Bacillus thuringensis
crystal protein. p. 21-48. In Advances in insect control: The role of transgenic plants. N. Carozzi and M. Koziel, eds. Taylor & Francis, Bristol, PA.
Phene, C.J. 1999. Subsurface drip irrigation part 1: Why and how?. Irrigation Journal.
(April) Available at: http://www.greenmediaonline.com/ij/1999/0499/499sub.asp.
Reddy, V.R., Z. Wang, and K.R. Reddy. 1997. Growth responses of cotton to aldicarb
and temperature. Environ. Exp. Bot. 38:39-48. ReJesus, R.M., J.K. Greene, M.D.Hammig, and C.E. Curtis. 1997. Economic analysis of
insect management strategies for transgenic Bt cotton production in South Carolina. Proc. Beltwide Cotton Conf., National Cotton Council Am., Memphis, TN. 1:247-251.
Sabbe, W.E., and L.J. Zelinski. 1990. Plant analysis as an aid in fertilizing cotton. p.
469-493. In Soil testing and plant analysis, 3rd ed. R.L. Westerman, ed. SSSA Book Series 3. SSSA, Madison, WI.

179
Sadras, V.O. 1995. Compensatory growth in cotton after loss of reproductive organs. Field Crops Res. 40:1-18.
SAS Institute. 1999-2000. The SAS System for Windows, Release 8.1. SAS Institute
Inc. SAS Campus Dr., Cary, NC. Satterthwaite, F.E. 1946. An approximate distribution of estimates of variance
components. Biometrics 2:110-114. Smith, R.B., J.D. Oster, and C.J. Phene. 1991. Subsurface drip produced highest net
return in Westlands area study. Calif. Agric. 45(2):8-10. SPSS. 1989-2001. SPSS for Windows, Release 11.0.1. SPSS Inc. Chicago, IL. Taiz, L., and E. Zeiger. 1998. Plant physiology, 2nd ed. p. 110-113. Sinauer Associates,
Inc. Sunderland, MA. USDA, Agricultural Marketing Service, Cotton Division. 1993. The classification of
cotton. USDA-ARS. pub. 566. Williford, J.R., W.R. Meredith, Jr., and W.S. Anthony. 1988. Production, harvesting,
and ginning to preserve color and grade. Proc. Beltwide Cotton Conf., National Cotton Council Am., Memphis, TN. 1:60-62.
Wilson, P., H. Air, and G. Snider. 1984. Drip irrigation for cotton. USDA Economic
Research Center. Agricultural Economic Report no. 517. Wullschleger, S.D., and D.M. Oosterhuis. 1990. Photosynthetic carbon production and
use by developing cotton leaves and bolls. Crop Sci. 30:1259-1264.

180
APPENDIX A
CROP PRODUCTION PRODUCTS USED IN
2001 AND 2002 FIELD STUDY
The following products were used at the rates specified for control of the indicated pests.
Early Season Thrips (Thrips tabaci) Pythium spp. and Rhizoctonia solani Broadleaf weeds (primarily Ipomea sp.) Cotton Aphid (Aphis gossypii) Cotton Fleahopper (Pseudatomoscelis seriatus)
Temik® 15G – aldicarb: 4.48 kg ha-1 [2-methyl-2-(methylthio)propionaldehyde O-(methylcarbamiyl)] Gaucho® 480 – imidacloprid: 5.2 ml kg-1 1-[(6-chloro-3-pyridinyl)methyl]-N-nitro-2-imidazolidinimine Ridomil® Gold PC – pentachloronitrobenzene (PCNB): 8.97 kg ha-1
(R)-2-[(2,6-dimethylphenyl)-methoxyacetylamino]propionoic acid methyl ester Cotoran® 4L – fluometuron: 4.68 L ha-1 1,1 dimethyl-3-(α,α,α-trifluoro-m-tolyl)unrea Trimax™ – imidacloprid: 0.07 L ha-1 1-[(6-chloro-3-pyridinyl)methyl]-N-nitro-2-imidazolidinimine Trimax™ – imidacloprid: 0.07 L ha-1 1-[(6-chloro-3-pyridinyl)methyl]-N-nitro-2-imidazolidinimine

181
Overwintered Boll Weevil (Anthonomus grandis) Mid to Late Season Boll Weevil (Anthonomus grandis) Cotton Aphid (Aphis gossypii)
Guthion® 2L – azinphosmethyl: 1.17 L ha-1 O,O-dimethyl S-[(4-oxo-1,2,3-benzotrian-3(4H)-yl)methyl] phosphorodithioate Capture® 2EC – bifenthrin: 0.30 L ha-1 (2 methyl[1,1’-biphenyl]-3-yl)methyl 3-(2-chloro-3,3,3-trifluoro-1-propenyl)-2,2-dimethylcyclopropanecarboxylate Karate® with Zeon™ Technology – lambda-cyhalothrin: 0.30 L ha-1 [1α(S*),3α(Z)]-(±)-cyano-(3-phenoxy-phenyl)methyl-3-(2-chloro-3,3,3-trifluoro-1-propenyl)-2,2-dimethylcyclo-propanecarboxylate Guthion® 2L – azinphosmethyl: 1.17 L ha-1 O,O-dimethyl S-[(4-oxo-1,2,3-benzotrian-3(4H)-yl)methyl] phosphorodithioate Capture® 2EC – bifenthrin: 0.30 L ha-1 (2 methyl[1,1’-biphenyl]-3-yl)methyl 3-(2-chloro-3,3,3-trifluoro-1-propenyl)-2,2-dimethylcyclopropanecarboxylate Karate® with Zeon™ Technology – lambda-cyhalothrin: 0.30 L ha-1 [1α(S*),3α(Z)]-(±)-cyano-(3-phenoxy-phenyl)methyl-3-(2-chloro-3,3,3-trifluoro-1-propenyl)-2,2-dimethylcyclopropane carboxylate Vydate® C-LV – oxamyl: 0.78 L ha-1 [methyl N,N’-dimethyl-N-[(methyl-carbamoyl)oxy]-1-thiooxamimidate] Bidrin® 8 – dicrotophos: 0.44 L ha-1 Dimethyl phosphate of 3-hydroxy-N,N-dimethyl-cis-crotonamide

182
Cotton Bollworm (Heliothis zea) Broadleaf weeds (primarily Ipomea sp.)
Curacron® 8E – profenofos: 1.17 L ha-1 O-(4-bromo-2-chlorophenyl) O-ethyl-S-propyl phosphorothioate Provado® 1.6F – imidacloprid: 0.27 L ha-1 1-[(6-chloro-3-pyridinyl)methyl]-N-nitro-2-imidazolidinimine Centric® 40WG – thiamethoxam: 0.14 kg ha-1
3-[(2-chloro-5-thiazolyl)methyl]tetrahydro-5-methyl-N-nitro-4H-1,3,5-oxadiazin-4-imine Curacron® 8E – profenofos: 0.88 L ha-1 O-(4-bromo-2-chlorophenyl) O-ethyl-S-propyl phosphorothioate Ammo® 2.5EC – cypermethrin: 0.37 L ha-1
and 0.15 L ha-1 in tank-mix (±) α-cyano (3-phenoxyphenyl)methyl (±) cis/trans 3-(2,2-dichloroethenyl)-2,2 dimethylcyclopropane carboxylate Fury® 1.5EC – zeta-cypermethrin: 0.22 L ha-1 and 0.15 L ha-1 in tank-mix S-cyano (3-phenoxyphenyl)methyl (±) cis/trans 3-(2,2-dichloroethenyl)-2,2 dimethylcyclopropane carboxylate Larvin® 3.2 – thiodicarb: 0.37 L ha-1 Dimethyl N,N’-[thiobis[(methylimino) carbonyloxy]]bis[ethanimidothioate] Caparol® 4L – prometryn: 2.34 L ha-1 2,4-bis(isopropylamino)-6-(methylthio)-S-triazine Clean Crop® MSMA 6 Plus – MSMA: 0.31 L ha-1 monosodium acid methanearsonate

183
Annual grasses (primarily Panicum texanum) Plant Growth Regulators Harvest Aids
Fusilade® DX – fluazifop-P-butyl: 0.88 L ha-1 Butyl (R)-2-[4-[[5-(trifluoromethyl)-2-pyridinyl]oxy]phenoxy]propanoate PGR-IV® – 0.30 L ha-1 Mixture of indolebutyric acid and gibberellic acid Pix® Plus – mepiquat chloride: 0.44 L ha-1, 0.58 L ha-1, and 0.88 L ha-1 N,N-dimethylpiperidinium chloride Bacillus cerus, strain BP01 Dropp® 50WP – thidiazuron: 0.11 kg ha-1 N-phenyl-N’-1,2,3-thiadiazol-5-ylurea Def® 6 – tribufos: 0.58 L ha-1 and 0.94 L ha-
1 S,S,S-tributyl phosphorotrithioate Cyclone® Max – paraquat dichloride: 1.46 L ha-1 1,1’-dimethyl-4,4’-bipyridinium dichloride Leafless® – dimethipin and thidiazuron: 0.88 L ha-1 dimethipin: 2,3-dihydro-5,6-dimethyl-1,4-dithiin-1,1,4,4-tetraoxide thidiazuron: N-phenyl-N’-1,2,3-thiadiazol-5-ylurea Prep® – ethephon: 0.58 L ha-1 (2-chloroethyl) phosphonic acid

184
APPENDIX B
CROP PRODUCTION PRODUCTS USED IN
2003 GREENHOUSE STUDY
The following products were used for insect pests at the rates indicated.
Early Season Overwintered Boll Weevil (Anthonomus grandis) Spider Mites (Tetranychus spp.) Thrips (Thrips tabaci)
Guthion® 2L – azinphosmethyl: 1.17 L ha-1 O,O-dimethyl S-[(4-oxo-1,2,3-benzotrian-3(4H)-yl)methyl] phosphorodithioate Capture® 2EC – bifenthrin: 0.30 L ha-1 (2 methyl[1,1’-biphenyl]-3-yl)methyl 3-(2-chloro-3,3,3-trifluoro-1-propenyl)-2,2-dimethylcyclopropanecarboxylate Avid® 0.15EC – abamectin: 1.09 and 0.90 L ha-1
Mixture of avermectins containing primarily Avermectin B1a and Avermectin B1b Sanmite® – pyridaben: 0.68 L ha-1
2-tert-5-(4-tert-butylbenzyl-thio)-4-chloropyridazin-3(2H)-one Conserve® SC – spinosad: 0.64 L ha-1 Spinosyn A and Spinosyn D Talstar® GC Flowable – bifenthrin: 5.47 and 4.23 L ha-1
(2-methyl[1,1’-biphenyl]-3-yl)methyl 3-(2-chloro-3,3,3-trifluoro-1-propenyl)-2,2-dimethylcyclopropanecarboxylate

185
Mid to Late Season Boll Weevil (Anthonomus grandis) Cotton Aphid (Aphis gossypii) Spider Mites (Tetranychus spp.)
Guthion® 2L – azinphosmethyl: 1.17 L ha-1 O,O-dimethyl S-[(4-oxo-1,2,3-benzotrian-3(4H)-yl)methyl] phosphorodithioate Capture® 2EC – bifenthrin: 0.30 L ha-1 (2 methyl[1,1’-biphenyl]-3-yl)methyl 3-(2-chloro-3,3,3-trifluoro-1-propenyl)-2,2-dimethylcyclopropanecarboxylate Bidrin® 8 – dicrotophos: 0.44 L ha-1 Dimethyl phosphate of 3-hydroxy-N,N-dimethyl-cis-crotonamide Fury® 1.5EC – zeta-cypermethrin: 0.22 L ha-1 S-cyano (3-phenoxyphenyl)methyl (±) cis/trans 3-(2,2-dichloroethenyl)-2,2 dimethylcyclopropane carboxylate Talstar® GC Flowable – bifenthrin: 4.11 L ha-1
(2-methyl[1,1’-biphenyl]-3-yl)methyl 3-(2-chloro-3,3,3-trifluoro-1-propenyl)-2,2-dimethylcyclopropanecarboxylate Akari™ 5SC – fenpyroximate: 2.44 L ha-1 Tert-butyl(E)-(-(1,3-dimethyl-5-phenoxypyrazol-4-ylmethyleneaminoxy)-p-toluate Avid® 0.15EC – abamectin: 0.82 L ha-1 Mixture of avermectins containing primarily Avermectin B1a and Avermectin B1b Sanmite® – pyridaben: 0.51 L ha-1 2-tert-5-(4-tert-butylbenzyl-thio)-4-chloropyridazin-3(2H)-one

186
Thrips (Thrips tabaci) Silverleaf Whitefly (Bemisia argentifolii) Cotton Bollworm (Heliothis zea) Plant Growth Regulators
Conserve® SC – spinosad: 0.62 L ha-1 Spinosyn A and Spinosyn D Talstar® GC Flowable – bifenthrin: 4.11 L ha-1 (2-methyl[1,1’-biphenyl]-3-yl)methyl 3-(2-chloro-3,3,3-trifluoro-1-propenyl)-2,2-dimethylcyclopropanecarboxylate Marathon® II – imidacloprid: 0.19 L ha-1 1-[(6-chloro-3-pyridinyl)methyl]-N-nitro-2-imidazolidinimine Curacron® 8E – profenofos: 0.88 L ha-1 O-(4-bromo-2-chlorophenyl) O-ethyl-S-propyl phosphorothioate Fury® 1.5EC – zeta-cypermethrin: 0.22 L ha-1 and 0.15 L ha-1 in tank-mix S-cyano (3-phenoxyphenyl)methyl (±) cis/trans 3-(2,2-dichloroethenyl)-2,2 dimethylcyclopropane carboxylate PGR-IV® – 0.30 L ha-1 Mixture of indolebutyric acid and gibberellic acid Pix® Plus – mepiquat chloride: 0.44 L ha-1, 0.29 L ha-1, and 0.44 L ha-1 N,N-dimethylpiperidinium chloride Bacillus cerus, strain BP01

187
VITA
Christopher Alan Hundley, son of Dennis Michael and Linda Sue Hundley, was
born in Biloxi, Mississippi on July 12, 1977. He graduated from Judson High School in
Converse, Texas on May 24, 1995. He received his Bachelor of Science degree in
Agricultural Systems Management from Texas A&M University on December 16, 2000.
Christopher entered the Master of Science program in January of 2001 to pursue a
graduate degree in Agronomy. During his graduate career, he was employed as a
Research Specialist with Biological Research Service, Inc. Additionally, as a Graduate
Teaching Assistant at Texas A&M University, he taught several laboratory courses in
the Biology and Soil and Crop Sciences departments. While completing graduate
education, he met his wife, Leah Nicole Wall. They were married on May 31, 2003 and
now reside at 725 San Saba Drive, College Station, TX 77845. Christopher currently
holds a Research Specialist position with Bayer CropScience.