evaluation of nitrite oxidizing bacteria (nob) activity in...
TRANSCRIPT

Water and Environmental EngineeringDepartment of Chemical EngineeringMaster Thesis 2016
Emine Gülce Hepdarcan
Evaluation of nitrite oxidizing bacteria (NOB) activity in the nitritation reactor of a two-stage partial nitritation-anammox (PNA) system
operating at mainstream conditions

Postal address Visiting address TelephoneP.O. Box 124 Naturvetarvägen 14 +46 46-222 82 85SE-221 00 Lund, Sweden +46 46-222 00 00Web address Telefaxwww.vateknik.lth.se +46 46-222 45 26
Evaluation of nitrite oxidizing bacteria(NOB) activity in the nitritation reactor of a two-stage partial nitritation-anammox (PNA) system operating at mainstream
conditions
by
Emine Gülce Hepdarcan
Master Thesis number: 2016-6
Water and Environmental EngineeringDepartment of Chemical Engineering
Lund University
May 2016
Supervisors:Senior lecturer Åsa DavidssonResearch Leader David Gustavsson, Sweden Water ResearchResearch Assistant Gabriel Persson, VA SYDExaminer: Associate senior lecturer Michael Cimbritz
Picture on front page: Nitritation reactor, Photo by Emine Gülce Hepdarcan.

Postal address Visiting address TelephoneP.O. Box 124 Naturvetarvägen 14 +46 46-222 82 85SE-221 00 Lund, Sweden +46 46-222 00 00Web address Telefaxwww.vateknik.lth.se +46 46-222 45 26

Preface
This Master´s thesis project is collaborated in between VA SYD, Sweden Water Research and Water and Environmental Engineering group of Chemical Engineering Department at Lund University. The experiments have been carried out at Sjölunda WWTP, Malmö, Sweden. This project was supervised by Åsa Davidsson who is a senior lecturer at the Chemical Engineer-ing at Lund University, David Gustavsson who is a research leader at Sweden Water Research and Gabriel Persson who is a research assistant at the wastewater Department of Wastewater at VA SYD. The examiner of this project was Michael Cimbritz who is an associate senior lecturer at the Department of Chemical Engineering at Lund University.
I would like to thank my supervisors, David Gustavsson, Åsa Davidsson and Gabriel Perssonfor their valuable inputs which improved the quality of my work and guided me through the writing process. I would like to thank David Gustavsson and Åsa Davidsson for giving me the chance of being part of this interesting project and sharing their expertise with me. I would like to thank Gabriel Persson for his daily support and guidance which considerably contrib-uted to my work and understanding of the operation.
Finally, I would like to thank my family and friend Mercedes Altuna for their great supportduring this project.

Abstract
Nitrification-denitrification process, which is the most commonly used method for nitrogen removal from wastewaters, is energy demanding and contributes very much to the the carbon footprint of wastewater treatment. One of the alternative methods for nitrogen removal is the nitritation-anammox process. Nitritation-anammox has been implemented successfully insludge liquor streams and industrial wastewaters with high temperature and high ammonium concentrations. However, implementation of nitritation-anammox is challenging in main-stream municipal wastewater treatment due to low temperature and low ammonium concen-trations.
Competition between different microbial groups determines the fate of nitritation-anammox process. It is of great importance to maintain nitrite oxidizing bacteria (NOB) repression for the success of operation. The aim of this study was to evaluate the activity of the NOB in the nitritation reactor of a two-stage nitritation-anammox pilot system operating under main-stream conditions at Sjölunda Wastewater Treatment Plant, Malmö, Sweden. With this aim, ex-situ batch tests were designed and performed to determine the microbial acitivity on AnoxKaldnesTM Z-200 carriers collected from the pilot plant moving bed biofilm reactor (MBBR). Laboratory scale activity test results were further correlated to results obtained from the Nanammox pilot plant operation.
Activity test results showed that 50 mg N L-1 of nitrite and ammonium concentrations were suitable to perform lab scale experiments with Z-200 carriers. A better mixing was provided with 27 carriers in the lab scale batch reactor whereas the activity results were more stable with 107 carriers. NOB repression was observed for a very short period of time at the begin-ning of the pilot operation when ammonium concentration in the inlet stream of the nitritationreactor was between 50-60 mg L-1 and the dissolved oxygen concentration to ammonium con-centration ratio (DO:NH4
+) was around 0.08. A decrease in ammonium concentration (without decreasing the DO concentration) resulted in an increase in NOB activity which may indicate the high sensitivity of microbial population structure to a change in substrate concentration.


List of Abbreviations
Anammox Anaerobic Ammonium Oxidation
AOB Ammonia Oxidizing Bacteria
COD Chemical Oxygen Demand
DO Dissolved Oxygen
FA Free Ammonia
FNA Free Nitrous Acid
HB Heterotrophic Bacteria
HLAS High Loaded Activated Sludge
MBBR Moving Bed Biofilm Reactor
Mp1 Nitritation reactor of the Nanammox pilot plant
Mp2 Anammox reactor of the Nanammox pilot plant
Nanammox Nitritation-anammox pilot plant at Sjölunda WWTP
NOB Nitrite Oxidizing Bacteria
OUR Oxygen Uptake Rate
PNA Partial Nitritation Anammox
SRT Solid Retention Time
VSS Volatile Suspended Solids
WWTP Wastewater Treatment Plant


Table of Contents
1 Background 1
1.1 Aim 2
2 Theory 3
2.1 Nitrogen transformation and removal mechanisms 3
2.2 Microorganisms involved in the nitritation-anammox process 5
2.3 NOB repression strategies 8
2.4 Partial nitritation-anammox (PNA) technology in full scale 11
2.5 Moving Bed Biofilm Reactor (MBBR) technology 13
3 Sjölunda WWTP 15
3.1 Nanammox pilot plant 16
4 Materials and methods 19
4.1 Experimental Overview 19
4.2 Sampling 19
4.3 Oxygen Uptake Rate – OUR 20
5 Results and Discussion 27
5.1 Experimental Results 27
5.2 Operational Results 33
6 Conclusion 45
7 Suggestions for further work 47
8 References 49
9 Appendices 57


1
1 Background
Eutrophication, which is caused by the excessive load of nutrients such as phosphorus and nitrogen, poses a major threat to life in aquatic environments. Leaching from agricultural lands, effluent discharge from wastewater treatment plants (WWTPs) and industrial activities can be counted as the main sources of eutrophication. In Sweden, the Öresund coastal area is identified as an environment that is sensitive to nitrogen release (Swedish Environmental Protection Agency, 2012). In response to the joint action plan (Baltic Sea Action Plan) includ-ing the Öresund strait, Sweden aims to reduce its annual nitrogen discharge by 9240 tons per year by 2021 (HELCOM, 2016). According to this, Sjölunda WWTP, Malmö, Sweden, aimsto enhance its nitrogen removal capacity (Gustavsson et al., 2015).Conventional nitrogen re-moval is conducted by the nitrification-denitrification process which is very energy demand-ing and dependent on organics in the wastewater or/and added chemicals (e.g. methanol) that contribute much to the carbon footprint (Gustavsson & Tumlin, 2013). The nitritation-anammox process is an economically and environmentally enhanced alternative to the tradi-tional nitrification-denitrification process for nitrogen removal at municipal wastewater treat-ment plants (Kartal et al., 2010). This process is considered to be advantageous as it does not require organic carbon for nitrogen reduction and since it is able to cover its own energy de-mands by biogas production. It has been implemented successfully in sludge liquor streams at warm temperatures and in industrial wastewaters (Lackner et al., 2014). In this process, about half of the ammonium is converted into nitrite by ammonia oxidizing bacteria (AOB) while the remaining ammonium along with produced nitrite is converted into nitrogen gas by anaer-obic ammonium oxidizing (anammox) bacteria. Under anaerobic conditions, anammox bacte-ria utilize nitrite as electron acceptor and ammonium as energy source. Aerobic AOB use ammonium as energy source and oxygen as electron acceptor and competes with nitrite oxi-dizing bacteria (NOB) for oxygen. Heterotrophic denitrifiers and NOB compete with anam-mox bacteria for nitrite. Hence, activity of different species is of great importance in deter-mining the success of the nitritation-anammox process.
Long solid retention time (SRT) and NOB repression are crucial to accomplish high nitrogen removal rates in the nitritation-anammox process (Gustavsson et al., 2014). Long SRT is re-quired to support the growth of slow growing anammox bacteria. NOB repression is essential for minimizing the competition of NOBs on substrates such as dissolved oxygen and nitrite. Several strategies have been suggested in order to create conditions which favor the growth of anammox bacteria and the suppression of NOBs in moving bed biofilm reactors (MBBRs).
The main challenge regarding this process is its adaptation to mainstream wastewater treat-ment plants in which conditions are unfavorable with low temperature and low ammonium concentrations (Gustavsson et al., 2014). The nitritation-anammox process can be considered as successful at Sjölunda WWTP if an effluent ammonium concentration lower than 5 mg L-1
and a nitrogen removal rate higher than 0.1 kg m-3d-1 is achieved while operational tempera-ture is lower than 20°C and influent ammonium concentration is between 10-40 mg L-1. Pre-viously, projects were performed at Sjölunda WWTP in order to estimate the chance of im-plementation of this process in one-stage MBBRs. In one-stage MBBR, both nitritation and anammox processes take place in one reactor. Pilot plant studies were focused on NOB re-pression strategies such as intermittent aeration and exchange of the carriers between the sludge liquor and mainstream reactors in order to figure out the possibility of a one-stage ni-tritation-anammox process implementation. Results indicated that an intermittent aeration

2
strategy was not adequate enough to achieve desired NOB repression in the system studied (Gustavsson et al., 2015). It was also concluded that recirculation of carriers by exchanging them between reactors was not sufficient for an effective NOB supression (Gustavsson et al., 2014). As a result, these pilot plant studies indicated that it was not likely to achieve full NOB repression and high nitrogen removal rate in the one-stage MBBR process.
It was suggested that optimal conditions for the activity of desired species could be achieved more easily in a two-stage system since it would be possible to provide NOB repression and high AOB activity without damaging the anammox population (Ma et al., 2011). This is in-vestigated through the Nanammox pilot plant project that is held in 2016 at Sjölunda WWTP. In distinction to the Manammox project, the nitritation-anammox process is implemented in a two-stage MBBR system. In the first stage, nitritation of ammonium to nitrite is taking place under aerobic conditions. In the second stage, nitrite and remaining ammonium is oxidized under anoxic conditions. Efforts will be put in finding the suitable conditions which give de-sired NOB repression. It is aimed to provide 57% of inlet ammonium oxidation in nitritation reactor in order to improve the process in anammox reactor, as suggested (Strous et al., 1998). In the nitritation reactor, Anox-Kaldnes Z-200 carriers with a grid wall height of 200 μm will be used. These carriers are expected to supply high oxygen availability throughout the biofilmand to prevent NOB growth in deeper biofilm layers while improving nitritation rates and washing out of NOB from the biofilm (Piculell et al., 2015).
1.1 Aim This Master´s thesis focused on the competition on dissolved oxygen (DO) between AOB and NOB. The initial aim was to design oxygen uptake rate (OUR) batch tests for determining specific NOB activity on Z-200 carriers. Factors such as substrate concentration, diffusion limitation, carrier number and mixing efficiency were considered while designing lab scale ex-situ batch tests. The specific total OUR, NOB and endogenous activities were then moni-tored and linked to operational results. The change in NOB activity with respect to ammoni-um concentration in the nitritation reactor of the pilot plant was investigated.
It was expected that the results of this Master´s project will show the possibility of nitrite oxi-dizing bacteria (NOB) repression in the two-stage MBBR systems. The result of this study will contribute to the knowledge of implementing the nitritation-anammox process in Sjölun-da WWTP.

3
2 Theory
2.1 Nitrogen transformation and removal mechanismsWastewater treatment can be conducted through physical, chemical, physicochemical and biological methods. Poor sustainability and problems that are faced during control of contam-inants make physical-chemical processes less and less attractive (Rao et al., 2013). Addition-ally, physical-chemical methods were shown to be more expensive for nitrogen removal (Siegrist, 1996). Considering this, the preference is given to biological methods for nitrogen removal from wastewaters.
Biological nitrogen removal methods, which depend on the microbial nitrogen cycle, are known to be eligible in treating wastewaters with different characteristics and to be cost effec-tive. Mechanisms of nitrogen removal mainly consist of nitrification, denitrification and anammox.
Figure 1. Simplified representation of the nitrogen cycle.
In order to meet the new, more stringent effluent discharge requirements with a conventional nitrification-denitrification process, long retention time, high level of oxygen and an external carbon source is required. This eventually contributes to the operational cost and has a nega-tive impact on the environment. In order to overcome these problems, more energy efficienttechnologies have been developed (Zhu et al., 2008). Simultaneous nitrification and denitrifi-cation (SND), anaerobic ammonium oxidation (ANAMMOX), partial nitritation-anammox (PNA) and short cut nitrification and denitrification (SHARON) can be given as the examplesto such novel technologies. In the following sections, nitrogen removal mechanisms involved in conventional and novel technologies will be discussed in more detail.
2.1.1 NitrificationNitrification is an autotrophic process which occurs in two steps. In the first step of nitrifica-tion (nitritation) ammonium is oxidized into nitrite by AOB. Then, nitrite is converted into nitrate by NOB in the second step (nitratation). The step which is performed by the activity of AOB is considered to be rate limiting (Sinha & Annachhatre, 2007). For the conversions to be efficient, an adequate oxygen supply is required. The reactions of first step take place in the

4
presence of membrane bound ammonia monooxygenase (reaction 1) and hydroxylamine (re-action 2) while membrane bound nitrite oxidoreductase is present in the second step (reaction3). In general, nitrifying bacteria are chemolititrophs which can cover their carbon need by CO2 fixation through carbon cycle while using ammonium or nitrite as the energy source. Not all of the ammonium is nitrified by nitrifying bacteria since some of it is utilized for cell growth (Ge et al., 2015). Relevant reactions are represented below (Zhu et al., 2008).NH + O + 2H OH + H O (1)OH + 0.5 O + 2H + 2 (2)NO + 0.5 O NO (3)
2.1.2 DenitrificationIn anoxic denitrification, oxidized form of nitrogen is reduced to nitrogen gas by hetero-trophic denitrifying bacteria. In this process, compounds such as acetate, methanol and organ-ic matters found in wastewater are used as electron donors. Transfer of electrons from such carbon sources to electron acceptors occurs during denitrification. Depending on the process conditions, addition of an external carbon source such as methanol may be required. Denitri-fying microorganisms can use both oxygen and nitrogen oxides such as nitrite, nitrate, nitrite oxide and nitrous oxide as the electron acceptor. Denitrification occurs effectively only when nitrogen oxide compounds are used as the oxidizing agent. Thus, for an efficient denitrifica-tion anoxic conditions are needed. Below, reactions involved in denitrification are indicated(Zhu et al., 2008).2NO + 10 + 10H 4H O + N + 2OH (4)2NO + 6 + 6H 2H O + N + 2OH (5)2.1.3 AnammoxBased on thermodynamic calculations, presence of chemolithotrophic bacteria which could oxidize ammonia to nitrogen gas was predicted in 1977(Broda, 1977). However, existence of such autotrophic bacteria and process was not revealed until the 90´s. Introduction of anam-mox process was proceeded when the utilization of ammonium as an electron donor for deni-trification was discovered (Mulder, 1995). In this process, oxidation of ammonium and pro-duction of nitrogen gas occurs under anaerobic conditions where nitrite serves as an electron acceptor. There exists several advantages of the anammox process over conventional nitrifici-ation-denitrification. The low biomass yield of anammox bacteria (0.11g VSS/NH4
+-N) leads to a longer start-up period yet it brings along the advantage of reduced sludge treatment costs (Daverey et al., 2015). In addition to this, the need of external carbon source is eliminated as anammox bacteria can use carbon dioxide in the form of bicarbonate as the main source of carbon (van Graaf et al., 1996).
The reactions of the anammox process are represented in Equation 6 (Zhu et al., 2008). As indicated, nitrite is oxidized into nitrate and the released electrons are used throughout this reaction. Two intermediates, namely, nitric oxideand hydrazine are present in the conversion of nitrite and ammonium into nitrogen gas. Proposed ammonium oxidation mechanism involves reduction of nitrite to nitric oxide by nitrite reductase; conversion of nitric oxide and ammonium to hydrazine by hydrazine hydrolase; and the oxidation of hydrazine to dinitrogen gas (Kartal et al., 2011).

5
NH + 1.31 NO + 0.066HCO + 0.13H1.02 + 0.26 + 0.066CH . . + 2.03 (6)2.1.4 DeammonificationDeammonification is a two-step process where partial nitritation is combined with anammox. In the first step of this coupled process, half of the ammonium is oxidized to nitrite by AOBs. In the second step, remaining ammonium is converted into nitrogen gas through the mecha-nism which was explained in the previous section (2.1.3). In the anammox step of deammonification process, 11% of oxidized ammonium is converted into nitrate.
In deammonification process, the aim is to eliminate the nitratation step of nitrification in or-der to maintain nitrite accumulation. By doing so,nitrite which is in excess can be consumed by anammox bacteria and converted into nitrogen gas directly. This brings along the ad-vantage of a decrease in aeration requirements by 60% with decreased oxygen consumption (Siegrist et al., 2003). The complex biochemical reactions, sensitivity of anammox bacteria to oxygen and the slow growth rate of them makes the deammonification process challenging(Fux et al., 2002). However, it has been observed that the anammox process is more success-ful in nitrogen removal when it is combined with partial nitritation (Jetten et al., 1997). Hence, deammonification is promising as it enhances the adventageoues anammox process.
2.2 Microorganisms involved in the nitritation-anammox processSuccess of nitritation-anammox depends on the competition between different microbial groups. Anammox bacteria, AOB, NOB and heterotrophic bacteria (aerobic heterotrophs and denitrifiers) can be counted as microorganisms which are involved in this process. The selec-tion of desired population on biofilms is challenging due to the competition between these microorganisms on substrates such as ammonium, nitrite and oxygen. NOB compete for ni-trite and oxygen with anammox bacteria and AOB, respectively. When oxygen is present in the environment, heterotrophic bacteria competes with AOB and NOB for oxygen whereas when oxygen is absent, they are involved in a competition with anammox bacteria for nitrite. Figure 2 summarizes the competition between different microbial groups. In a two-stage ni-tritation-anammox process, the aerated nitritation process and the non-aerated anammox pro-cess are conducted in two different reactors. Hence in such a system, competition between anammox bacteria and AOBs for ammonium is eliminated.

6
Figure 2. Competition of different microbial groups for different substrates.
2.2.1 Nitrifying BacteriaAOB and NOB are referred to as nitrifiers and they are found in nitrification reactions (sec-tion 2.1.1). In the deammonification process, the aim is to supply partial conversion of am-monium to nitrite while avoiding nitrate production. Therefore, finding the conditions that give the right type of nitrifiers a competitive advantage is extremely important.
The five different genera of AOBs namely; Nitrosococcus, Nitrosolobus, Nitrosomonas, Ni-trosospira and Nitrosovibrio differs in their cell morphologies and means of mobility (Woese et al., 1984). Among these, Nitrosospira and Nitrosomonas have been studied most (Harms et al., 2003). The species of these two genera displays different affinities towards substrates (NH4
+, NH3) and in general, affinity of Nitrosospira species to NH4+ is higher (Ge et al.,
2015). At low ammonium concentrations, Nitrosospira species and Nitrosomonas oligotropha dominate while at high ammonium concentrations Nitrosomonas europaea is abundant (Fukushima et al., 2013). Even though presence of oxygen is required for the growth of most of the AOB species, some of them can also grow under anaerobic conditions (i.e; Nitrosomo-nas eutropha) (Schmidt & Bock, 1997). These facultative anaerobes give different products depending on the environment they are grown in. Under the conditions where DO < 0.8 mg/L, Nitrosomonas eutropha can produce nitrite, nitric oxides and nitrogen gas whereas it produces solely nitrite when DO > 0.8 mg/L (Schmidt & Bock, 1997). The enzyme `copper type nitrite reductase´ which is found in the periplasm of Nitrosomonas initiates the electron transfer from electron donors (such as hydrogen, acetate etc.) to nitrite under anoxic conditions (Jetten et al., 2002). Another factor that determines the supremacy of specific AOB populations is the amount of inorganic carbon found in wastewater. Nitrosomonas nitrosa is prevalent at high inorganic carbon concentrations while Nitrosomonas eurapaea is found more at low inorganic carbon conditions (Fukushima et al., 2013).

7
Nitrobacter, Nitrococcus, Nitrospira and Nitrospina are the four phylogenetically different groups of gram-negative nitrite oxidizing bacteria. Among these, Nitrospira and Nitrobacterhas received the most attention since they were the most common NOB found in wastewater treatment plants, soil and drinking water systems (Ge et al., 2015). The dominance of different NOB populations depends on environmental and operational conditions. Nitrospiraand Nitrobacter are dominant at high and low inorganic carbon concentrations, respectively (Fukushima et al., 2013). Nitrospira species were hyptothesized to be K-strategists with their high nitrite and oxygen affinity while Nitrobacter were considered to be r-strategists with their low nitrite and oxygen affinity and higher growth rates (Schramm et al., 1999). This hyptothesis was confirmed with another study in which the specific nitrite oxidation activities of Nitrobacter and Nitrospira were found to be 93.8 and 10.5 mg g-1.h-1, respectively (Kim & Sun-Hee, 2006). Since this is the case, Nitrospira is favored over Nitrobacter under substrate limiting conditions such as in mainstream wastewaters. It was also revealed that Nitrospirahad positive correlation with temperature while Nitrobacter could grow better at lower temperatures and temperature was very effective in changing the balance between nitrifying polulation (Huang et al., 2010; Siripong & Rittmann, 2007). A study conducted with the enriched cultures of Nitrospira and Nitrobacter found that the optimal pH for their growth were around pH 8-8.3 and 7.8, respectively (Blackburne et al., 2007).
In general, nitrifiers are known to be growing slowly. Nitrosomonas europaea is the fastest growing AOB with a doubling time of 8 h at a temperature range of 25-30°C (Belser, 1980). Specific growth rate of Nitrobacter was found as 0.20 h-1 by a study conducted at 22°C(Vadivelu et al., 2006c). The highest activity of pure Nitrosomonas was observed at 35°C while Nitrobacter were most active at 38°C (Grunditz & Dalhammar, 2001). Additionally,,growth rate of AOB were 2.56 times higher than that of NOB under low dissolved oxygen concentrations(Tokutomi, 2004). Since variations in operational and environmental conditions have different effects on different nitrifiers, the activity of an individual community can be arranged by regulating such conditions. More specifically, substrate (nitrite and ammonium),oxygen and inorganic carbon concentrations, SRT, temperature, pH and the presence of toxic compounds can be determinative in selecting desired nitrifying populations.
2.2.2 Anaerobic Ammonium Oxidizing Bacteria (Anammox)The discovered species of anammox bacteria belonging to Brocadiales order are considered to be branching within the planctomycete lineage (Jetten et al., 2002). These species are classi-fied under five genera which can be counted as; Kuenenia, Brocadia, Anammoxoglobus, Jet-tenia and Scalindua (Kartal et al., 2012). Since it is branched under Planctomycetes, the cell structure of anammox bacteria is intricate. `Anammoxosome´ containing hydroxylamine oxidoreductase, `ripoblasm´ including nucleid and ribosomes and `paryphoplasm´ are the compartments of an anammox bacterium cell (Jetten et al., 2002).
Unlike some AOB species which can survive under both aerobic and anaerobic conditions, anaerobic ammonium oxidizing bacteria are obligate anaerobs. The growth rate of Brocadia anammoxidans, Brocadia sinica and Kuenenia stuttgartiensis is 0.0027 h-1, 0.0041 h-1 and 0.0026-0.0035 h-1 , respectively (Kartal et al., 2012). Since the growth rates of anammox bacteria are very low, they may be outcompeted by AOB if they exist in the same environment. With a half saturation constant of Km < 5 μM and 0.2 < Km < 3 μM Brocadia anammoxidans and Kuenenia Stuttgartiensis acquire higher nitrite affinity than Brocadia sinica (Kartal et al., 2012). Specific activity of anammox bacteria has been found to decrease with a decrease in temperature (Lotti et al., 2014).
8
2.2.3 Heterotrophic BacteriaThe utilization of COD under both aerobic and anoxic conditions are caused by the activity of heterotrophic microorganisms. The difference between these processes that takes place under aerobic and anoxic conditions (denitrification) is that in the latter case instead of oxygen ni-trate is used as the electron acceptor (Moussaa et al. , 2009). In aerobic nitrifying systems autotrophic nitrifiers (AOB and NOB) excrete soluble microbial products which promotes the existence of heterotrophic bacteria under carbon-limited conditions (Kindaichi et al., 2004).In the presence of external organic carbon source, heterotrophic bacteria outcompetes nitrifi-ers since they attain higher growth rates and biomass yields (Bassin et al.., 2015). In accord-ance with this, it was shown that heterotrophic bacteria have the advantage over nitrifiers in the consumption of dissolved oxygen when the conditions were in their favor (presence of external carbon source) (Wang et al., 2016). Besides the COD content, ammonium loading rate was also suggested to be affecting the microbial diversity (Bassin et al., 2015). Studies which used FISH technique revealed that in a nitrifying system, heterotrophic populations were mostly consisting of Alfa-proteobacteria, Beta-proteobacteria and microorganisms of Bacteroidetes phylum (Bassin et al., 2015; Kindaichi et al., 2004; Dolinšek et al., 2013).
2.3 NOB repression strategiesIn the nitritation-anammox process, an adequate population of anammox bacteria can be supplied by nitrite accumulation. The performance of this process is threatened by NOB de-velopment as NOB consume nitrite produced by the activities of AOB. Competition on nitrite between anammox and NOB favors NOB as a result of lower growth rates of anammox bacte-ria (section 2.2). In order to enhance the nitritation-anammox process, it is essential to supply a nitrite to ammonium ratio of 1.3 in the nitritation step (equation 6). It is also crucial to maintain a sufficient amount of AOB in order to achieve partial nitritation. As a consequence, accumulation of nitrite and AOB along with the washout of NOBs is required. Several studies have focused on factors and methods to suppress NOB activity (Ge et al., 2014; Blackburne et al. 2007; Isanta et al., 2015). In general, NOB repression can be achieved by regulatingdissolved oxygen concentration, temperature, pH, SRT, inhibitors and aeration patterns.
2.3.1 Dissolved oxygenOne possible way to achieve NOB repression is by creating an oxygen limiting environment.It was shown that at low dissolved oxygen (DO) concentrations, AOB were more dominant and the recovery of NOB was not achievable even at high DO exposures (Guo et al., 2009).Such results were correlated with lower affinity of nitrite oxidizers for oxygen. In spite of this,different studies have suggested different relationships between oxygen affinity constant of AOB and NOB. According to Guisasola et.al. (2005) oxygen affinity constants of AOBs and NOB were equal (0.74 mg N L-1) while Regmi et al. (2014) reported a higher oxygen affinity for NOB with a lower half saturation coefficient (KO2, NOB = 0.16 mg N/L, KO2, AOB = 0.74 mg N L-1). A simulation based study which examined the outcomes of these differences demon-strated that NOB repression under low DO concentrations would be probable only if the oxy-gen half saturation coefficient of NOB are higher (Isanta et al., 2015). Another study pointed out that under oxygen limiting conditions, NOB were repressed more than AOB which result-ed with a successful suppression of nitratation (Lotti et al., 2014). In addition to this, inhibition of nitrite oxidation was observed when DO < 0.5 mg L-1 in a suspended growth reactor (Hanaki & Wantawin, 1990).

9
2.3.2 Aeration pattern controlAeration pattern control is one of the strategies that was proposed for achieving a successful partial nitritation. Turk & Mavinic (1986) found that the aeration duration was inversely pro-portional with partial nitritation. According to this, at longer aeration times partial nitritation was becoming complete nitrification, yielding a decrease in nitrite accumulation. Alternating anoxic and aerobic conditions which results in transient anoxia has been considered as a promising approach for NOB washout (Ma et al., 2016). Under anoxic conditions nitrite can be converted into nitrogen gas by the activity of heterotrophic or anammox bacteria. This may result in the reduction of NOB growth rate since available nitrite in the environment becomes limited (Ma et al., 2015a). On the other hand under aerobic conditions, ammonium oxidation is achieved faster than nitrite oxidation. Hence, accumulation of nitrite can be accomplished if aeration is stopped before the start of nitrite oxidation. However, it was suggested that inter-mittent aeration could lead to the formation of toxic intermediates (e.g. nitrite oxide) as a re-sult of interrupted metabolic conversion (Wett et al., 2013).
One study pointed out that intermittent aeration was creating a decrease in NOB activity without affecting the activity of AOBs(Yang & Yang, 2011). In agreement with this, Ge et al.(2014) found that compared to continuous aeration, ammonium oxidation occurred at higher rates than nitrite oxidation under intermittent conditions. However, intermittent aeration strat-egies were not successful in complete suppression of nitrite oxidation under low temperatures.Gustavsson et al. (2015) investigated the effect of different fractions and time length of non-aerated periods on NOB repression at mainstream temperatures. Results indicated that the anoxic periods shorter than 15 minutes were not adequate for NOB suppression (Gustavsson et al., 2015). Another study which compared the continuous and intermittent aeration strate-gies in an MBBR system operating at mainstream temperature pointed out that only usingintermittent aeration was not adequate to achieve successful NOB suppression in one-stage system (Trojanowicz et al., 2015).
2.3.3 Ratio Control StrategyIt has been suggested that maintaining the right balance between DO and ammonium concen-tration in the reactor bulk liquid is crucial for repressing NOB activity on biofilms (Bartroli et al., 2010). The strong oxygen limiting conditions are considered to be related to low DO to total ammonia nitrogen (DO/ TAN < 1 where TAN = NH4
+-N + NH3-N) ratio in the reactorwhich can be supplied by an excess in ammonium concentration. Bartroli et al.(2010) showed that DO to total ammonia nitrogen (TAN) ratio control was effective in maintaining areversible, fast and complete nitritation. Additionally, they indicated that NOB washout was not necessary for a succesful nitritation if the adequate DO/TAN ratio was achieved. Likewise, low DO/TAN was demonstrated to be an important parameter in repressing NOBs both at higher (30° C) and lower (12.5°C) temperatures, even though more time was required under latter conditions (Isanta et al. 2015). Isanta et al. (2015) kept the TAN concentration at desired levels by regulating the inflow rate. Their results pointed out that rather than DO, high TAN concentrations were more effective in obtaining a low DO/TAN ratio. They have specu-lated that the residual ammonium concentration was suppressing the kinetic limitation of AOB growth which could enhance the abundancy of AOBs. For NOBs to be outcompeted by AOBs, a dissolved oxygen to ammonium ratio (DO:NH4
+) of 0.08 was suggested by a model based study (Perez et al., 2014). On the other hand, Corbalá-Robles et al. (2015) demonstrated that low DO/TAN ratio strategy was not applicable in one-stage nitritation-anammox processsince low DO was yielding with low nitritation rates.

10
2.3.4 Influence of pH on free ammonia, free nitrous acid and free hydroxylamine concentration
Another way to keep NOBs repressed is to arrange pH for manipulating free ammonia (NH3)and free nitrous acid (HNO2) concentration. Free ammonia is the non-oxidized form of ammonium and the formation of it is proportional to the pH increase. Activity of nitrite oxidoreductase and hence nitrite oxidation is hindered by free ammonia which acts as a competitive inhibitor. Besides NOBs, free ammonia can also inhibit the activity of AOBs. It was noted that a free ammonia concentration higher than 24 mg L-1 was inhibiting for AOBs and NOBs while both could be recovered with a concentration below the threshold limit (Peng & Zhu, 2006). Process conditions such as pH determines the inhibitory effect of free ammonia on different bacterial groups.
Another inhibitor is free nitrous acid which donates a proton and acts as an uncoupler inside the cell(Peng & Zhu, 2006). Contrary to free ammonia, free nitrous acid formation is associated with a decrease in pH. In other words, equilibrium shifts towards free nitrous acid at low pH while NH4
+/NH3 equilibrium shifts towards free ammonia at high pH. Thus,distribution of free ammonia and free nitrous acid is linked with a change in pH.Correspondingly, increase of pH from 7.5 to 8.5 results in the formation of free ammonia while a decrease from pH 7.5 to pH 6 yields nitrous acid production(Sinha & Annachhatre, 2007). Equilibrium reactions of NH4
+/NH3 and NO2-/HNO2 acid are represented in equation 7
and 8 .NH + OH NH + H O (7) + (8)It was revealed that a lower concentration of free ammonia (0.04-0.08 mg NH3-N/L) and free nitrous acid (0.03 mg HNO2-N/L) was enough to inhibit the activity of the K-strategist Nitrospira species compared to Nitrobacter (Blackburne et al., 2007). It was suggested to keep the free ammonia concentration that would inhibit Nitrobacter species as low as possible in order to maintain high rates of nitritation. The optimal conditions which would inhibit Nitrobacter species without affecting Nitrosomonas was determined to be pH 8.5, 20°C and 5 mg NH3-N/L (Abeling & Seyfried, 1992).
Nitrite accumulation is also related to the presence of toxic intermediate hydroxylamine which is produced by the activity of AOBs during nitrification. Oxygen limitation, high pH and a high ammonia to ammonium ratio promotes hydroxylamine accumulation which irreversibly decrease NOB activity(Stüven et al., 1992).
2.3.5 SRTConsidering different growth rates of different NOB species, it is possible to control themicrobial community in suspended growth systems with the help of alterations in solid retention time (SRT). At low SRT, washout is inevitable for K-strategists which are known to posses lower growth rates but higher substrate affinities. NOB can be repressed and be outcompeted by AOB better, if r-strategists (e.g. Nitrobacter) are more abundant in the reactor. The reason for this is the lower substrate affinities of r-strategists (section 2.2.1). Munz et al. (2011) have reported somewhat higher growth rates of AOB than that of NOB within an SRT range of 2-5 days. The minimum SRT was determined to be 1.6 days for AOB whereas it was 1.9 days for NOBs in an SBR operated at 15 °C(Yuan & Oleszkiewicz, 2011).A decrease in nitrite to nitrate ratio (from 0.9 to a value lower than 0.8) along with a

11
significant reduction in free ammonia concentration was pointed out when SRT was diminished below 40 days under oxygen limiting conditions (Aslan et al., 2009). However, it is challenging to apply such strategies in MBBR systems since the undefined SRT and sub-strate gradients result in the growth of microorganisms with different growth kinetics on bio-films (Bryers, 2000).
2.3.6 Inhibitor addition It is possible to inhibit NOB activity via the addition of heavy metals, sulfide, oxidants, salts, organic chemicals or disinfectors (Cl2 and Br2). Heavy metals that are involved in inhibition are cadmium, nickel, copper, chromium, zinc and lead. The required amount for an inhibition varies among different heavy metals as their effect on NOB activity is divergent (Peng & Zhu, 2006). Low concentrations of nickel (0.7 mg L-1) was found to be more effective in NOB in-hibition (Randall & Buth, 1984) while in another study effect of nickel was deduced to be insignificant (Lee et al., 1997). According to Wang (1984) copper demonstrated the least tox-ic effect whereas the toxicity of nickel and cadmium on NOBs were moderate and high, re-spectively. In a study conducted with nitrifying SBR, the maximum NO2
--N to NO3--N ratio
was found to be 0.75 when the reactor was dozed with 45 mg L-1 of sulfide (Erguder et al.,2008). In the same study it was also reported that NOBs were more sensitive to pulsed sulfide doses compared to AOBs. Oxidants namely, chlorite and chlorate, are known to be the specif-ic inhibitors of NOB activity. It was shown that 10 mM of sodium chlorate was enough to repress Nitrobacter species without modifying the Nitrosomonas europaea activity(Belser & Mays, 1980). Salinity of inlet stream is another factor that is involved in NOB repression since NOBs are known to be sensitive to the salt concentration (Sinha & Annachhatre, 2007).Nitrobacter species were found to be inhibited by 100 mg L-1 of p-Nitrobenzaldehyde, p-nitroaniline and n-methylaniline (Hockenbury et al., 1977). Ginestet et al. (1998) proclaimed that less than 24μM of azide was capable of selective NOB inhibition in a mixed bacterial population. NOBs are also sensitive to phenol, aniline and ortho-cresol (Peng & Zhu, 2006).
2.3.7 TemperatureAOB and NOB exhibit divergent activities at different temperatures. The specific growth rate of NOB was found to be higher than the specific growth rate of AOB at temperatures lower than 20°C (Hunik et al., 1994). On the other hand, AOB attained slightly higher specific growth rates than NOBs at 20°C and became dominant at 35°C (Hellinga et al., 1998). Even though elevated temperatures are advantageous, nitrite accumulation can be obtained also at lower temperatures if other necessary conditions for NOB repression are provided (Ge et al.,2015). The indirect effect of temperature on NOB activity comes from its ability to modifyfree ammonia and free nitrous acid equilibrium. It was demonstrated that at 25°C, free nitrous acid was the main inhibitor while free nitrous acid and free ammonia and were bothcontributing to inhibition at 35°C (Ge et al., 2015). In addition to this, it was demonstrated that only a high free ammonia concentration by itself was not sufficient to maintain NOB repression at low temperatures (Balmelle et al., 1992).
2.4 Partial nitritation-anammox (PNA) technology in full scaleSince the discovery of the anammox process, many studies have been performed with the aim of improving the process to become more efficient in nitrogen removal. Considering requirements to provide a desired microbiological balance, efforts have been made toestablish a combined nitritation-anammox process that can be applied in full scale.

12
Today, the partial nitritation-anammox process receives great attention in Europe and North America for wastewater treatment applications. Currently, sequencing batch reactor (SBR)technology is the most common method used in full scale sludge liquor treatment and is fol-lowed by granular sludge reactors and MBBR technology (Gustavsson et al., 2010). It is pos-sible to perform partial nitritation and anammox steps in one reactor as well as in two differ-ent reactors, separately. Reduced operational and investment costs can be counted as the main advantage of one-stage system. On the other hand, it is easier to provide process control anddesired conditions in a two-stage process. Although initial studies were mostly focused on the development of two-stage systems, one-stage PNA is more common (88%) in full scale treatment of municipal and industrial wastewaters (Lackner et al., 2014). Success of the PNA process was achieved in full scale sludge liquor treatments even though it has been faced with several operational problems related with foaming, settling (in SBRs and granular sludge sys-tems), solid retention and separation (Lackner et al., 2014). However, implementation of this process in mainstream wastewater still remains as a challenge due to unfavorable temperature and nitrogen concentrations.
2.4.1 Application of PNA in mainstream wastewaterIn order to prevent a reduction in deammonification capacity and nitrogen removal rate, min-imum temperature and nitrogen concentration should be kept above 16°C (Persson et al.,2014) and 45 mg L-1 (Sultana, 2014), respectively. Despite the fact that mainstream conditions may fail to achieve these threshold levels, previous studies have presented the possibility of nitrogen removal from mainstream wastewaters through PNA in MBBR systems (Sultana, 2014). Moreover, a comparison between SBR and MBBR operating at low temperature (low-er than 12°C) revealed that MBBR was better in maintaining a stable performance (Lackner et al., 2015). Such studies have encouraged the use of two-stage systems for nitritation-anammox application.
The two-stage PNA process was reported to be more promising for a stable nitrogen removal in mainstream wastewater (Pérez et al., 2015). Control of the DO:NH4+ ratio which is im-portant for NOB repression becomes easier when partial nitritation and anammox processes are separated. The possibility of supplying high nitrite concentrations assures the selection of Nitrobacter species in the nitritation reactor of a two-stage reactors system (Blackburne et al.,2007). Since Nitrobacter are known to have lower affinity towards dissolved oxygen (Schramm et al., 1999), the competition on oxygen favors AOB under such conditions. More-over, by handling the nitritation process in a separate aerated reactor, competition of anam-mox and AOBs on ammonium is avoided. In agreement with this, lab scale studies pointed out the successful NOB repression obtained with a two-stage system (Isanta et al., 2015).However, daily and seasonal fluctuation of the flow rate and inflow ammonium concentration is a challenge that can be faced when upgrading this system to full scale. In a recently con-ducted model based study, a control strategy dependent on the standardized variations (Alexet al., 2008) was developed and the feasibility of a two-stage system in full scale was illus-trated (Pérez et al., 2015). In this study, sludge liquor was introduced to the nitritation reactor with the aim of maintaining a desired level of ammonium concentration as it was previously shown that residual ammonium concentration was crucial in supplying NOB repression (Isanta et al., 2015). Even though it is more costly due to the need for more space and energy,the two-stage system holds the potential for a full scale implementation.
13
2.5 Moving Bed Biofilm Reactor (MBBR) technology MBBRs are systems where biofilm grow on the carriers circulating inside the reactor. Due to this property, the reactor provides a large surface area for bacterial growth. The shape of car-riers can be vary and is designed in such way that abrasion is minimized. Some of the ad-vantages of MBBR system can be counted as; reduced need of space, utilization of the entire tank volume, eliminated backwash and sludge recycling (Huang et al., 2010). Biomass reten-tion is an important parameter that should be supplied when working with slow growing bac-teria. MBBRs are beneficial for PNA as the long biomass retention time empowers the growth of anammox bacteria. The high solid retention time of MBBRs also supply the enrichment of nitrifiers.
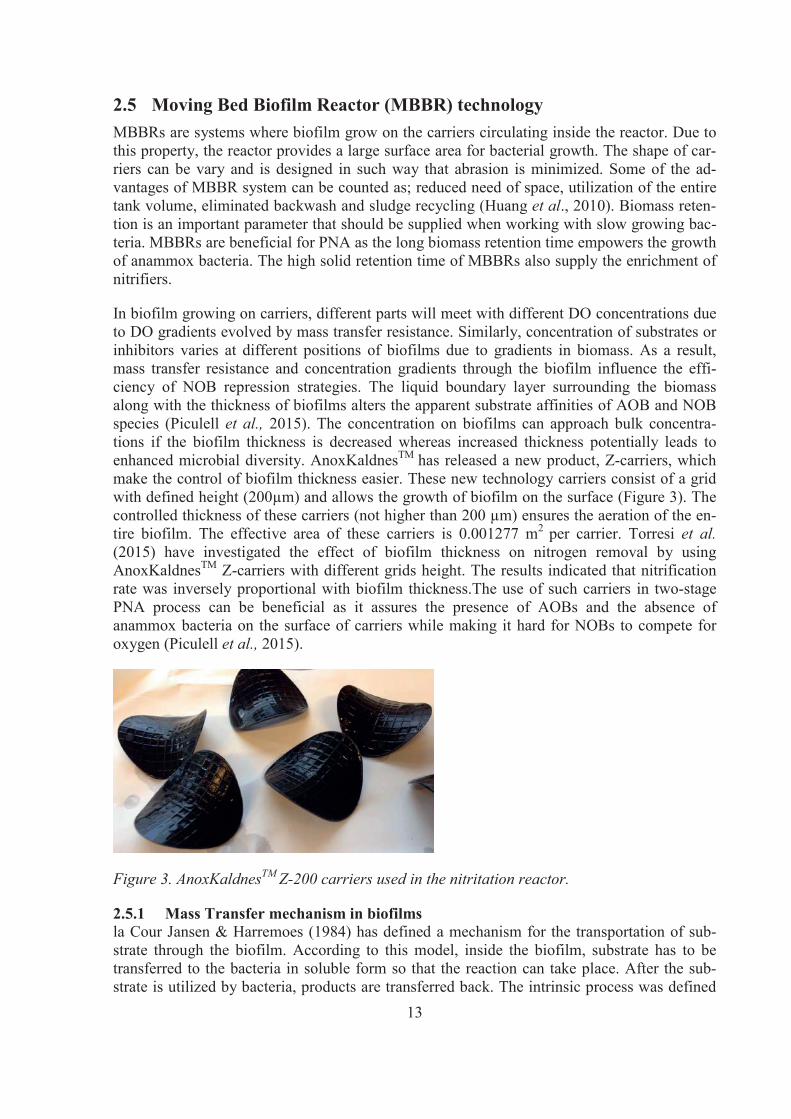
In biofilm growing on carriers, different parts will meet with different DO concentrations due to DO gradients evolved by mass transfer resistance. Similarly, concentration of substrates or inhibitors varies at different positions of biofilms due to gradients in biomass. As a result, mass transfer resistance and concentration gradients through the biofilm influence the effi-ciency of NOB repression strategies. The liquid boundary layer surrounding the biomass along with the thickness of biofilms alters the apparent substrate affinities of AOB and NOB species (Piculell et al., 2015). The concentration on biofilms can approach bulk concentra-tions if the biofilm thickness is decreased whereas increased thickness potentially leads to enhanced microbial diversity. AnoxKaldnesTM has released a new product, Z-carriers, which make the control of biofilm thickness easier. These new technology carriers consist of a grid with defined height (200μm) and allows the growth of biofilm on the surface (Figure 3). The controlled thickness of these carriers (not higher than 200 μm) ensures the aeration of the en-tire biofilm. The effective area of these carriers is 0.001277 m2 per carrier. Torresi et al.(2015) have investigated the effect of biofilm thickness on nitrogen removal by using AnoxKaldnesTM Z-carriers with different grids height. The results indicated that nitrification rate was inversely proportional with biofilm thickness.The use of such carriers in two-stage PNA process can be beneficial as it assures the presence of AOBs and the absence of anammox bacteria on the surface of carriers while making it hard for NOBs to compete for oxygen (Piculell et al., 2015).
Figure 3. AnoxKaldnesTM Z-200 carriers used in the nitritation reactor.
2.5.1 Mass Transfer mechanism in biofilms la Cour Jansen & Harremoes (1984) has defined a mechanism for the transportation of sub-strate through the biofilm. According to this model, inside the biofilm, substrate has to be transferred to the bacteria in soluble form so that the reaction can take place. After the sub-strate is utilized by bacteria, products are transferred back. The intrinsic process was defined
14
by Monod kinetics where in most cases Monod constant was negligible and hence the reaction rate was zero order (Harremoes, 1978a). On the other hand, it was shown that a simplified zero order (Equation 9) and a half-order (Equation 10) reaction was enough to define the mass transfer phenomena of bulk process(la Cour Jansen & Harremoes, 1984).= = valid for = . 1 (9)
= = 2 valid for < 1 (10)Where
ra: removal rate per unit area biofilm surface (g.m-2.s-1 )
k0a: zero order removal rate per unit area (g.m-2.s-1)
k1/2a: half order rate constant per unit area (g-1/2.m-1/2 .s-1 )
k0f : intrinsic zero order removal rate in the biofilm (g.m-3.s-1 )
L: thickness of the biofilm (m)
D: coefficient of molecular diffusion in the biomass (m2.s-1)
C*: bulk concentration at the surface of the biofilm (g.m-3)
Equation 9 is applicable when the bulk concentration is sufficient and the penetration of sub-strate into biofilm is complete. When substrate is partially penetrated into the biofilm due to diffusion limitations which are a result of lower bulk concentrations, the reaction rate be-comes half-order (Equation 10)(la Cour Jansen & Harremoes, 1984). The half order descrip-tion is obtained by the combination of zero order reaction inside the biofilm and diffusion through the biofilm (Hem et al., 1994). When the diffusional resistance is significant, reactionrate becomes first order whereas half order kinetics refers to the situation where diffusional resistance is not as significant.
15
3 Sjölunda WWTP
Sjölunda WWTP, one of the largest wastewater treatment plants in Sweden, was taken into operation in 1963. It is connected to 300,000 residents and receives water from several munic-ipalities including Malmö, Burlöv, Lomma, Staffanstorp and Svedala.
At Sjölunda WWTP, nitrogen removal comes after pre-precipitation in pre-settlers and COD removal in high-loaded activated sludge plant (HLAS) (Figure 4). The HLAS which consists of six parallel lines is fed with pre-precipitated and pre-treated wastewater and treated sludge liquor (Gustavsson et al., 2013). Nitrification takes place in four trickling filters in an aerobic environment. These four trickling filters are operated in parallel and have a total volume of 8,640 m3. A nitrification rate of 1.75 g NH4
+ m-2 d-1 is maintained to treat the entire wastewater in these trickling filters (Hanner et al., 2003). The flow from mainstream trickling filters is recycled back to the HLAS for pre-denitrification. Post denitrification is performed in MBBRs with a filling ratio of 50%. Methanol is added as external carbon and energy source at this stage and anoxic basins are kept mixed with mechanical mixers. The total reac-tor volume is 6,300m3 and the designed denitrification rate is 1.2 g NO3
- -N m-2 d-1 at 10°C (Hanner et al., 2003). The volumetric design rate for the total nitrogen removal is 0.13 kg N m-3 d-1.
The current nitrogen removal capacity at Sjölunda WWTP is limited. In addition to this, ni-trogen loading rates are expected to increase rapidly in five years due to a close down of aneighboring WWTP and the projected population increase in Malmö (Gustavsson et al.,2015). In order to overcome increasing loading rates, an enhancement in the current nitrifica-tion capacity is required. Improvement of the capacity could be done either by an upgrade using conventional technology or by the implementation of a novel technology. The upgrade of conventional technology can be carried out by the addition of MBBR rectors to improve nitrification. However, this would still end up with a high contribution to the carbon footprint due to the use of methanol as an external carbon source in the post-denitrification process. Forthis reason, studies have been conducted in the pilot plant to make the implementation of a novel technology (nitritation-anammox process) possible at Sjölunda WWTP.

16
Figure 4. Configuration of Sjölunda WWTP. ST is the grid removal, PS is the primary settler, HLAS is the high loaded activated sludge, WWF is the wet weather flow basin, NTF is the nitrifying tickling filter, MBBR is the moving bed biofilm reactor, DAF is the dissolved air floatation, SBR is the sequencing batch reactor, GT is the gravity thickening, BGT is the band gravity thickening, AD is the anaerobic digestion tank, CF is the centrifuge.
3.1 Nanammox pilot plantBetween the years 2012-2015, the `Manammox´ pilot plant project was performed in the ex-isting facility to investigate the possibility of nitritation-anammox process implementation in a one-stage biofilm system where the nitritation and the anammox steps take place in the same reactor. Results of the Manammox pilot plant operation implied that the nitritation-anammox process in a one-stage biofilm system was not successful and hence the implementation of it in full scale was not possible (Gustavsson et al., 2014; 2015). Currently, the`Nanammox´ pro-ject is being operated in the pilot plant. Unlike the Manammox operation, the nitritation-anammox process is carried out in a two-stage biofilm system in the Nanammox pilot plant.In a two-stage biofilm system, nitritation and anammox steps of the process are conducted separately in two different reactors.
The pilot plant consists of two 2.6 m3 MBBRs in series. The nitritation reactor has a filling degree of 40 % of AnoxKaldnesTM Z-200 carriers. In the second reactor, an anammox process is taking place and 55% of the volume is filled with KaldnesTM K1 carriers. The HLAS efflu-ent and the sludge liquor first enter equalization tanks and are then sent to process reactors. A representative scheme of the pilot plant is given in figure 5. Each reactor includes sensors for the online measurements of ammonium, oxygen, nitrate and temperature. Additionally, the nitritation reactor also includes a pH sensor. The data collected from online measurements are sent to a database and operational results are monitored. The computer programs, UniView and eWaste, allows simultaneous tracking of process conditions. Three to five days a week, 24-hour-flow-proportional samples are taken for analysis of suspended solids (SS), volatile suspended solids (VSS), biological oxygen demand (BOD7), chemical oxygen demand (COD), alkalinity, ammonium (NH4
+-N), nitrite and nitrate (NO2,3--N), nitrite (NO2
--N) and

17
total nitrogen and phosphorus concentrations found in influent and effluent of nitritation reac-tor. Grab samples are also analyzed twice a week for the control and calibration of online sen-sors.
Figure 5. Nanammox pilot plant set up
The flow rate of the HLAS effluent is fixed while the sludge liquor flow is regulated to keep the ammonium concentration in the nitritation reactor at a specific set-point. The DO:NH4
+
ratio can be arranged by changing the ammonium concentration in the nitritation reactor(Mp1). The DO set point (2.6 mg O2 L-1) is controlled by the air flow.

18

19
4 Materials and methods
4.1 Experimental OverviewThe activity of microorganisms involved in the nitritation-anammox process was determined by the lab scale ex-situ batch tests. Samples to be used in the experiment were collected from the nitritation reactor (Mp1) of the Nanammox pilot plant (Figure 5). The depletion of oxy-gen, when different substrates were introduced into lab scale batch reactors, was measured to determine the oxygen uptake rate (OUR). OUR measurement method was developed by Hagman & la Cour Jansen (2007) and modified by Llano & Galkin (2014) and Olofsson (2014). During OUR experiments, the maximum possible activity instead of the actual activi-ty was obtained since the conditions (e.g. pH control, substrate that is not limiting) were op-timal. These results were then coupled to operational results in order to evaluate the effect of operational conditions on endogenous, NOB and AOB activities. Conditions which were ben-eficial for the repression of undesired species (NOB) were investigated to achieve process improvement. The experimental overview is given in Figure 6.
Figure 6. Experimental Overview.
4.2 SamplingIn the nitritation pilot reactor, some of the carriers were floating on the surface and the mixing was not very efficient. This could have had an effect on the accuracy of lab scale batch exper-

20
iments since the activity of microorganisms is highly dependent on the position of carriers inside the reactor. In order to overcome this problem, samples were taken from the reactor after the carriers on the surface was put aside manually with the help of a bucket. This method was followed until the 24th of March. After 24th of March, a tool which would help to reach the carriers on the deeper part of the reactor was used to collect the carrier samples (Figure 7).
Figure 7. Tool that was used to collect carriers from the nitritation reactor.
4.3 Oxygen Uptake Rate – OUROUR refers to consumption of oxygen during a certain interval of time. OUR measurements can be used to gain knowledge about wastewater characteristics, aerobic degradation process and activity of bacteria involved in such processes (Reference).
The method for determining OUR consists of the steps as indicated (la Cour Jansen & Harremoes, 1984).
1. Decrease in oxygen level during a non-aeration phase is measured.2. Slope of time vs. oxygen concentration is determined (The relationship between de-
crease in oxygen level and time is expected to be linear).3. With the help of this slope, OUR is calculated.4. Time vs. OUR is plotted.
The aim of performing OUR experiments was to determine the activity of microorganismsfound on the carriers taken from the nitritation reactor of the pilot plant. With this aim, differ-ent substrates and an inhibitor were added into the lab scale batch reactors. Endogenous activ-ity was determined when there was no substrate addition (la Cour Jansen & Harremoes, 1984)(Hagman & la Cour Jansen, 2007). In order to obtain the activity of AOB and NOB, batch reactors were fed with ammonium and nitrite solutions. Right before the addition of nitrite solution, ATU (ammonium oxidation inhibitor allylthiourea) which is the inhibitor of AOB activity (Ginestet et al., 1998), was introduced into reactors. Substrates and the inhibitor were added at specific cycles.

21
4.3.1 Experimental setup for OUR testsExperiments were performed with the carriers collected from the nitritation reactor (Mp1) of the pilot plant. Prior to start of experiment, carriers were washed under tap water in order to get rid of particulate matters and reactor liquid. 500 mL beakers were then filled with 107 Z-200 carriers, unless otherwise stated. Following this, beakers were filled with 400 mL of tap water and provided with a magnetic stir bar. The beakers were place in a water bath with a temperature set at 17°C in order to resemble pilot plant conditions. The stirring speed of the mixer was set at 350 rpm. Once the beakers were placed on the magnetic stirrers in the water bath, a HACH HQ 4d (Loveland, Colarado, USA) DO sensor and an aeration stone was added to the beakers. The sensor and aeration stone was placed as far down in the beaker as possible without touching the mixer or each other. Once the temperature became stable continuous aeration was started. After 1.5 hours of continuous aeration, a non-aeration/aeration cycle was started. Each cycle consisted of 5.07 minutes of non-aeration and 5.08 minutes of aeration. 5.5 mL of phosphate buffer (32.35 g Na2HPO4.2H2O and 2.84 g NaH2PO4 in 200 mL distilled water) and 4 mL of ammonium solution (11.80 g (NH4)2SO4 in 500 mL distilled water) was added into the beakers 30 seconds before the start of the cycle 4. 1 mL of ATU (correspond-ing to a final concentration of 86μM in the batch reactor) was added when the aeration had been on for 30 seconds in the 6th cycle. This was followed by the addition of 4 mL nitrite so-lution (12.42 g NaNO2 in 500 mL distilled water) 30 seconds before the start of cycle 7. The experiment was terminated when 10 cycles of non-aeration/aeration had been performed. Ta-ble 1 gives the summary of the procedure followed during the non-aeration/aeration cycles.
Table 1. Summary of the non-aeration/aeration cycles.
CycleTime [h:min:s] Aeration Comments
1 00:00:00 OFF00:05:07 ON
2 00:10:15 OFF00:15:22 ON
3 00:20:30 OFF0:25:37 ON
4 0:30:45 OFFAt 00:30:15 add 5.5 mL buffer solution and 4 mL ammoniumsolution
0:35:52 ON5 00:41:00 OFF
00:46:07 ON6 00:51:15 OFF
00:56:22 ON At 00:56:53 add 1 mL ATU7 01:01:30 OFF At 01:01:00 add 4 mL nitrite solution
01:06:38 ON8 01:11:46 OFF
01:16:53 ON9 01:22:01 OFF
01:27:08 ON10 01:32:16 OFF
01:37:23 ON

22
All of the experiments were performed the same day the carriers were taken from the reactors.The experimental set-up is represented in Figure 8.
Figure 8. Experimental set-up including lab scale batch reactors (beakers) filled with carri-ers, dissolved oxygen probes, aeration stones and water bath.
4.3.2 Experimental designThe experiments were conducted based on the procedure described in section 4.1.1. Experi-mental design were made by changing some parts of this procedure as indicated in the follow-ing sections.
Comparison of K1 and Z-200 carriers
Here, the aim was to compare the activity of microorganisms growing on Z-200 and K1 carri-ers. K1 carriers were transferred from a one-stage nitritation-anammox (Manammox) reactor to the anammox reactor of a two-stage nitritiation-anammox MBBR system at the start-up of the Nanammox pilot project. Hence, it was important to perform this experiment at the very beginning of the process. This experiment was conducted with the carriers collected from nitritation (Mp1) and anammox (Mp2) reactors of the current pilot plant. After being rinsed with tap water, 107 carriers (Z-200) taken from the Mp1 reactor were put into 500 mL beaker so that it would correspond to a filling ratio of 40%. The second 500 mL beaker was filledwith 176 carriers (K1) from the Mp2 reactor in order to provide the filling ratio of 55%. The ratios of 40% and 55% were corresponding to the filling ratios of nitritation and anammox reactors of the pilot plant, respectively. The procedure given in section 4.1.1 was followed for the rest of the experiment.
Relation between substrate concentration and OUR
These experiments were carried out to determine the effect of substrate concentration (NH4 +
and NO2-) on maximum, and maximum-endogenous OUR. It was necessary to find the con-
centration at which oxygen transfer was not suffering from substrate limitation so that the maximum activity could be measured. With this aim, different substrate concentrations were introduced into 500 mL reactors throughout the batch activity tests. Differences were made in the procedure (section 4.1.1) regarding ammonium and nitrite concentrations.
In all experiments, 500 mL beakers were filled with Z-200 carriers. In each experiment, sub-strate concentrations given in section 4.1.1 was introduced to the first beaker, which served as a control, while different amounts of substrates were introduced to the second beaker in each

23
experiment. In the first experiment, 75 mg L-1 of NH4+-N and NO2
- -N solutions were added into the second batch reactor. In order to obtain a curve where one could see the substrate’s effect on OUR, it was added 25 mg L-1 of NH4
+-N and NO2- - N solutions into the second
batch reactor in the second experiment. In the following experiments, 12.5 mg L-1 and 100 mgL-1 of NH4
+-N and NO2--N solutions were added into the second reactor.
Effect of ammonium and nitrite on microbial activity
These experiments were conducted in order to investigate the effect of each substrate on the activity measurements, separately. One batch reactor was supplied with solely ammonium as the substrate and to another only nitrite was added. The amount of ammonium added into the first reactor was 50 mg L-1 and to the second batch reactor 50 mg L-1 of nitrite was added. These substrate concentrations were chosen since previous experiments had been conducted successfully at these concentrations without being affected by the diffusion limitation in the Manammox pilot project (Olofsson, 2014).
Effect of carrier number on activity
The aim of this experiment set was to detect the change in OUR with respect to a change in the number of carriers. Another aim was to find the number of carriers that would maintain better mixing conditions in the batch reactor.
In this experiment set, one batch reactor was always filled with 107 of Z-200 carriers and was used as the reference. On experiments 1, 2 and 3 the second reactor was filled with 53, 27 and 15 carriers, respectively. Apart from the change in number of carriers the given in section 4.1.1 was followed for the rest of these experiments. Experiments were filmed in order to ob-serve the differences in the motion of the different number of carriers.
4.3.3 CalculationsDuring the experiments, the DO concentration was measured and recorded every 30 seconds(Figure 10). From this, a two-minute slope was calculated for every measurement point (Fig-ure 11). With this aim, the slope function of Microsoft Excel was used. A time interval of two minutes included four DO concentration data points. Once the slope in each cycle was deter-
mined, the minimum slope amongst them was selected. After the minimum slope , of each cycle was found, these values were used to calculate the OUR of each cycle (Figure 9).
, = 60 × , ×. (11)Where,
OURmax,i : maximum oxygen uptake rate of ith cycle (g O2 m-2 h-1)
, minimum time derivative of the concentration of oxygen in solution
(g L-1 min-1)
Vl: volume of the liquid phase (L)

24
Ae: effective area of a carrier (m2)
x: number of carriers
Figure 9. A typical plot of the maximum OUR.
Equations represented below were used to determine the endogenous, maximum-endogenous and NOB activities. Maximum-endogenous activity corresponds to the activity of AOB and a portion of NOB activity if NOB are active. The maximum activity is determined during cycle 4, 5 and 6 where the nitrite (substrate for NOB) is limited. Therefore, the maximum OUR and the maximum-endogenous OUR does not involve the maximum NOB OUR. Instead, during cycle 4-6, a portion of NOB OUR is contributing to maximum OUR if NOB are not repressedin the batch reactor. The abbreviations OURend, OURAOB, OURNOB stands for the oxygen up-takes caused by the activities of endogenous bacteria, AOB and NOB, respectively.
= , (12) + = , , (13) = , , (14)
0
10
20
30
40
50
60
70
80
90
0 2 4 6 8 10 12
OU
R [m
gL-1
h-1]
Aeration cycle

25
Figure 10. A typical plot representing the change in dissolved oxygen level with time.
Figure 11. A typical plot representing the slope obtained within a time interval of two minutes.
0
1
2
3
4
5
6
7
8
9
10
0 50 100 150 200 250
Oxy
gen
leve
l [m
g L-1
]
Time [min]
-1
-0,5
0
0,5
1
1,5
0 50 100 150 200 250Slop
e [m
g L
-1m
in-1
]
2 min time interval end [min]

26

27
5 Results and Discussion
5.1 Experimental Results
5.1.1 Activity comparison on different carriersThe very first experiment was conducted (02/02/2016) one week after the start-up of the Nanammox pilot plant (25/01/2016). In this experiment the aim was to detect the differences between maximum-endogenous (AOB and a portion of NOB), NOB and endogenous activi-ties on different types of carriers. When NOB are not active, maximum-endogenous activity corresponds only to the activity of AOB. Figure 12 represents the variation in the activities of different microorganisms on AnoxKaldnesTM K1 and Z-200 carriers. K1 carriers were previ-ously used in a one-stage MBBR during the operation of the Manammox pilot plant while Z-200 carriers were previously used in the AnoxKaldnes pilot plant in which sludge liquor treatment for nitritation performed. K1 and Z-200 carriers are currently being used in the anammox (Mp2) and the nitritation (Mp1) reactors of the Nanammox pilot plant, respectively.
Figure 12. Comparison of maximum (max), maximum-endogenous (max-end) and NOB ac-tivities on K1 and Z-200 carriers. Experiments were conducted with 50 mg L-1 of NH4
+-N and NO2
- -N solutions. Number of Z-200 and K1 carriers were 107 and 176, respectively.
As can be seen in Figure 12, the maximum activity on K1 carriers was higher than that of Z-200 carriers. In Figure 12, the difference between `max´ and `max-end´ bars indicates the presence of endogenous activity as the `max-end´ is the abbreviation for the maximum activi-ty excluding the endogenous activity. In the case of Z-200 carriers, where NOB were re-pressed, the difference between `max-end´ and `NOB´ bars corresponds to OUR caused by the activity of AOB. In the case of K1 carriers, `max-end´ corresponds to the activity of AOB with a portion of NOB activity since NOB were not repressed. Considering this, the activity of all three species (endogenous, NOB, AOB) were detected on K1 carriers. This points out that under anoxic conditions which lasted for a week, NOB were able to survive on K1 carri-ers. Results reveal that at the start of the Nanammox operation, the most abundant species found on Z-200 carriers were AOB while NOB activity was very low and endogenous activity
0
0,5
1
1,5
2
2,5
3
3,5
4
4,5
5
max max-end NOB
OU
R (g
O2
m-2
d -1
)
K1 Z-200

28
was almost absent. This points out that during sludge liquor treatment where ammonium con-centration was high, the repression of NOB activity was achieved successfully.
5.1.2 Initial experiments and diffusion limitationIn order to find the optimal nitrite and ammonium concentrations to be used in further exper-iments, the effect of different substrate concentrations on oxygen uptake rate was investigat-ed. Under optimal substrate concentrations, there exists no diffusion limitation and hence the reaction rate is expected to be of zero order. Therefore, the stable OUR values obtained at different substrate concentrations indicates the absence of diffusion limitation.
In Figure 13, change in the maximum OUR (max) and the max-end OUR at different sub-strate concentrations, is represented. Here, `max´ refers to total OUR caused by the activity of AOB, a portion of NOB and endogenous activity. Results of the first experiment (`max, 2016-02-10´ and `max-end, 2016-02-10´) pointed out that at nitrite and ammonium concentrations of 50-75 mg N L-1, the reaction rate was zero order. The second experiment (2016-02-12) was performed with 25 mg N L-1 and 50 mg N L-1 of substrate (ammonium and nitrite) concentra-tions. Results of the second experiment demonstrated that the `max´ and `max-end´ OUR ob-tained at these two different substrate concentrations were similar to each other. This was an indication of a zero order reaction and the absence of diffusion limitation as the OUR was not varying with changing substrate concentrations. On the other hand, results of the experiment conducted on the 19th of February showed that OUR obtained at the substrate concentrations of 12.5 mg N L-1 and 50 mg N L-1 were significantly different than each other. This implies that at the lower concentration (12.5 mg L-1 of NH4
+-N, NO2- -N), penetration of substrates
into biofilm is conducted partially and hence the reaction is half-order. Furthermore, a slight decrease in the max and max-endogenous activity at the substrate concentrations between 50-100 mg N L-1 can be observed in Figure 13.
It should be noted that just before the initial experiment the mainstream pump stopped work-ing and the nitritation reactor was fed with only sludge liquor for one day. Besides, the exper-iments between 14-29th of February were performed while the sludge liquor pump was bro-ken. In that period only mainstream flow, which has lower ammonium concentration, was introduced into nitritation reactor. In addition to this, in most of the part of this study the flow of sludge liquor into nitritation reactor was not continuous (Figure 22). Therefore, it is possi-ble that the results in Figure 13 are not reliable as it is very likely that problems related with the pilot plant pumps affected the activities of present species (AOB, NOB, endogenous) in the nitritation reactor. The variety in the OUR results when the same amount of substrate (50 mg N L-1) was introduced on different days is an evidence of the erroneousness of these re-sults. As this was the case, further experiments were performed with a substrate concentration of 50 mg N L-1 since previous experiments in the Manammox project had been conducted successfully at this concentration (Olofsson, 2014).

29
Figure 13. Activity of microorganisms at different ammonium and nitrite concentrations. Amounts of substrates (NH4
+-N, NO2- -N) added on different experiments to one batch reactor
were 12.575 mg L-1, 25 mg L-1 and 75 mg L-1, 100 mg L-1, respectively. In each experiment, 50 mg/L of substrate solution was added into another batch reactor. In all of the experiments, beakers were filled with 107 carriers.
5.1.3 Effect of nitrite and ammonium on microbial activityEffect of nitrite and ammonium on the microbial activity was investigated separately. Figure 14a belongs to the experiment where only ammonium was added as the substrate into thebeaker. The difference between the OUR obtained at cycles 10 and 3 corresponds to the NOB activity. As represented, NOB are active even when no nitrite is added in to the batch reactor. This indicates the presence of nitrite which is produced by the activity of AOB in the beaker. Figure 14b represents the result of the experiment where only nitrite was added as the sub-strate into the reactor. In this case, a higher activity was obtained on cycle 7 right after the addition of nitrite. This demonstrates the presence of NOB in the reactor. When only ammo-nium was added into the reactor, NOB activity was 0.11 g O2 m-2 d-1 whereas when only ni-trite was added into the reactor the activity of NOB was 0.19 g O2 m-2 d-1 (Figure 15). This shows that NOB activity was affected from the diffusion limitation in the first case (only am-monium addition). In the latter case (only nitrite addition), until the introduction of nitrite not any other substrate was added into the reactor. Therefore in this case, AOB were not active. This explains the reason why not any max-end activity was detected until the addition of ni-trite (Figure 15). It should also be noted that the maximum activity was higher (Figure 15) when only ammonium was added into the beaker. This points out that AOB activity was much higher than NOB activity at the time (23rd of February) these experiments were conducted.
0
0,5
1
1,5
2
2,5
0 20 40 60 80 100 120
OU
R (g
O2
m-2
d -1
)
Substrate concentration (mg/l)
max, 2016-02-10 max-end, 2016-02-10 max, 2016-02-12 max-end, 2016-02-12max, 2016-02-19 max-end, 2016-02-19 max, 2016-02-26 max-end, 2016-02-26

30
Figure 14. OUR vs. aeration cycle. a) Only ammonium (50 mg L-1 NH4+-N) was added into
the batch reactor as substrate b) Only nitrite (50 mg L-1 NO2--N) was added into the batch
reactor as substrate. The carrier number was 107.
Figure 15. Change in max, max-end (maximum-endogenous) and NOB OUR when only am-monium and only nitrite solution was added as substrate.
5.1.4 Relationship between carrier number, mixing efficiency and OURThe aim of these experiments was to find the right number of carriers to be used in further experiments. It was speculated that the number of carriers inside the lab scale batch reactors (beakers) could be affecting the OUR measurements as the amount of microorganisms found in the beakers is proportional with the carrier number. In addition to this, it was also speculat-ed that the number of carriers could be affecting the mixing efficiency in the batch reactor which would eventually affect the OUR measurements. Figures 16 and 17 give the change in OUR with respect to carrier numbers. In these figures, maximum refers to maximum total (AOB + a portion of NOB OUR + endogenous) OUR while max-end refers to maximum AOB plus a portion of NOB OUR.
0
20
40
60
80
100
120
0 5 10 15
OU
R [m
g L-1
h-1]
Aeration cycle
a
0
20
40
60
80
100
120
0 5 10 15
OU
R [m
g L-1
h-1]
Aeration cycle
b
0
0,2
0,4
0,6
0,8
1
1,2
1,4
1,6
1,8
2
max max-end NOB
OU
R (g
O2
m-2
d -1
)
Ammonium Nitrite

31
Figure 16. Change in the maximum (max) OUR with respect to carrier number. Number of carriers in the reactors were 15, 27, 53 and 107.
Figure 17. Change in the maximum-endogenous (max-end) OUR with respect to carrier num-ber. Number of carriers in the reactors were 15, 27, 53 and 107.
As indicated, maximum and maximum-endogenous OUR are inversely proportional with car-rier number. Experiments were conducted with the same amount of substrate (50 mg L-1
NH4+-N, NO2
- -N) and hence substrate per microorganism was variable in each beaker with different carrier numbers. The highest oxygen uptake rates were detected with 15 carriers which pointed to a high microbial activity in the beaker. It is possible that the actual microbial activity could not be reached with high carrier numbers in the beaker due to substrate limita-tion. In addition to this, the lack of mixing was observed with increasing carrier numbers. Further experiments were performed with 107 and 27 carriers in two separate reactors. The number of 107 was chosen in order to achieve a consistency in the comparison as many of the
0
0,5
1
1,5
2
2,5
3
3,5
0 20 40 60 80 100 120
OU
R (g
O2
m-2
d -1
)
Number of carriers
max, 16-03-04 max, 16-03-08 max, 16-03-11 max, 16-03-18 max, 16-03-24max, 16-04-01 max, 16-04-06 max, 16-04-15 max, 16-04-22 max, 16-04-29
0
0,5
1
1,5
2
2,5
3
3,5
0 20 40 60 80 100 120
OU
R (g
O2
m-2
d -1
)
Number of carriers
max-end, 16-03-04 max-end, 16-03-08 max-end, 16-03-11 max-end, 16-03-18 max-end, 16-03-24max-end, 16-04-01 max-end, 16-04-06 max-end, 16-04-15 max-end, 16-04-22 max-end, 16-04-29

32
previous experiments were conducted with this number of carriers. 27 carriers were chosen since with this amount of carriers, a proper mixing was achieved in the lab scale batch reactor. The change in the activity of microorganisms throughout the experimental period of this the-sis is given in Figures 18 and 19.
Figure 18. Change in the maximum (max) OUR, maximum-endogenous (max-end)) OUR, NOB OUR and endogenous OUR throughout the operation. Lab scale experiments were con-ducted with 50 mg L-1 of NH4
+-N and NO2- -N solutions in a reactor filled with 107 carriers
unless otherwise stated.
0
0,5
1
1,5
2
2,5
3
3,5
16-01-31 16-02-10 16-02-20 16-03-01 16-03-11 16-03-21 16-03-31 16-04-10 16-04-20 16-04-30 16-05-10
OU
R (g
O2
m-2
d -1
)
Date max max-endNOB endogenousNOB (Only 50 mg/L of NH4-N added as substrate) NOB (Only 50mg/L of NO2-N added as substrate)
0
0,5
1
1,5
2
2,5
3
3,5
16-01-31 16-02-10 16-02-20 16-03-01 16-03-11 16-03-21 16-03-31 16-04-10 16-04-20 16-04-30 16-05-10
OU
R (g
O2
m-2
d -1
)
Date max max-end NOB Endogenous
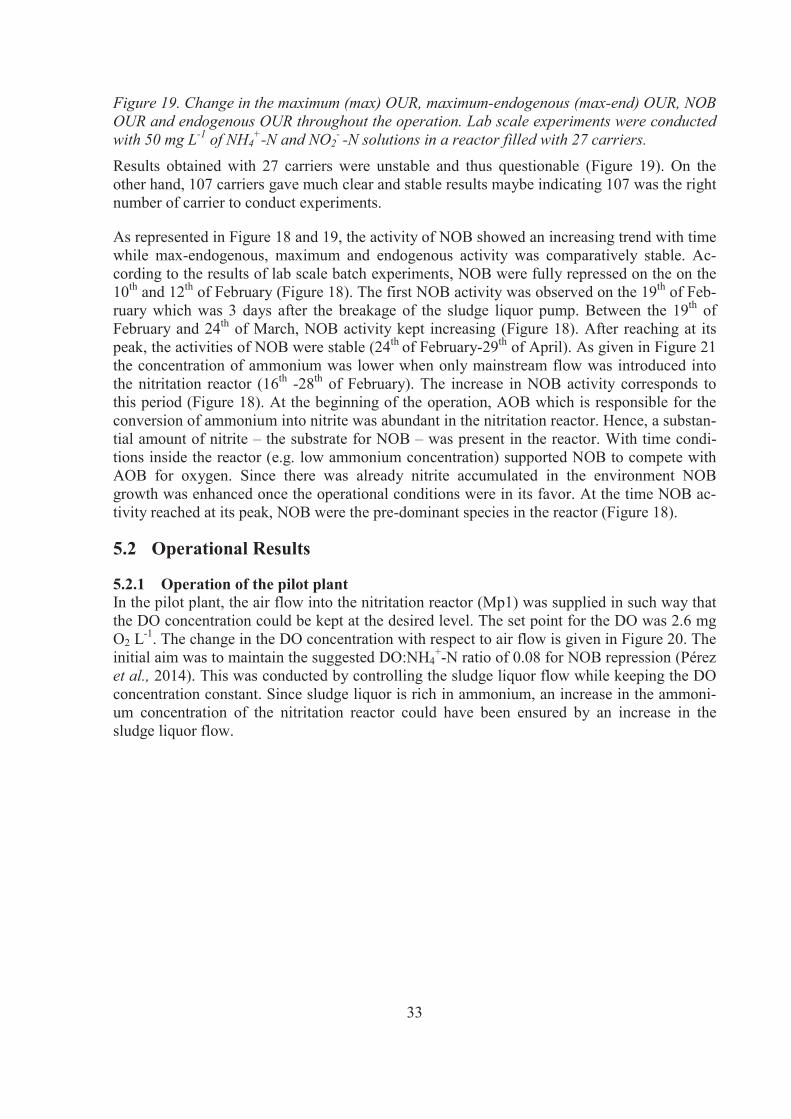
33
Figure 19. Change in the maximum (max) OUR, maximum-endogenous (max-end) OUR, NOB OUR and endogenous OUR throughout the operation. Lab scale experiments were conducted with 50 mg L-1 of NH4
+-N and NO2- -N solutions in a reactor filled with 27 carriers.
Results obtained with 27 carriers were unstable and thus questionable (Figure 19). On the other hand, 107 carriers gave much clear and stable results maybe indicating 107 was the right number of carrier to conduct experiments.
As represented in Figure 18 and 19, the activity of NOB showed an increasing trend with time while max-endogenous, maximum and endogenous activity was comparatively stable. Ac-cording to the results of lab scale batch experiments, NOB were fully repressed on the on the 10th and 12th of February (Figure 18). The first NOB activity was observed on the 19th of Feb-ruary which was 3 days after the breakage of the sludge liquor pump. Between the 19th of February and 24th of March, NOB activity kept increasing (Figure 18). After reaching at its peak, the activities of NOB were stable (24th of February-29th of April). As given in Figure 21 the concentration of ammonium was lower when only mainstream flow was introduced into the nitritation reactor (16th -28th of February). The increase in NOB activity corresponds to this period (Figure 18). At the beginning of the operation, AOB which is responsible for the conversion of ammonium into nitrite was abundant in the nitritation reactor. Hence, a substan-tial amount of nitrite – the substrate for NOB – was present in the reactor. With time condi-tions inside the reactor (e.g. low ammonium concentration) supported NOB to compete with AOB for oxygen. Since there was already nitrite accumulated in the environment NOB growth was enhanced once the operational conditions were in its favor. At the time NOB ac-tivity reached at its peak, NOB were the pre-dominant species in the reactor (Figure 18).
5.2 Operational Results
5.2.1 Operation of the pilot plantIn the pilot plant, the air flow into the nitritation reactor (Mp1) was supplied in such way that the DO concentration could be kept at the desired level. The set point for the DO was 2.6 mg O2 L-1. The change in the DO concentration with respect to air flow is given in Figure 20. The initial aim was to maintain the suggested DO:NH4
+-N ratio of 0.08 for NOB repression (Pérez et al., 2014). This was conducted by controlling the sludge liquor flow while keeping the DO concentration constant. Since sludge liquor is rich in ammonium, an increase in the ammoni-um concentration of the nitritation reactor could have been ensured by an increase in the sludge liquor flow.

34
Figure 20. Change in dissolved oxygen (DO) concentration with respect to air flow in the nitritation reactor (Mp1).
Figure 21. Change in ammonium concentration in the nitritation reactor (Mp1) and sludge liquor flow.
At the beginning of the operation, sludge liquor and mainstream flow was rather proportional (Figure 22). However, this trend was not kept for the rest of the operation due to fluctuations in the flow of the sludge liquor (Figure 21). On the 9th of February, the mainstream pump stopped working for about one day and during that time Mp1 was fed only with sludge liquor. This is the reason for the higher flow rate and ammonium concentrations observed at the be-ginning of operation (Figure 21). After the 15th of February, the sludge liquor pump stopped working. Between the 16th and 28th of February, Mp1 was introduced only received main-stream flow. During this period, the mainstream flow rate was 4 times higher (2 m3 h-1) than usual in order to maintain a high ammonium load in the reactor. When ammonium load was increased, COD also increased. This could end up with an increase in heterotrophic activity and change the relation between the activities of AOB and NOB. It was assumed that this was not the case since the biodegradable part of suspended COD has been determined to be very
00,20,40,60,811,21,41,61,82
0
0,5
1
1,5
2
2,5
3
3,5
16-01-11 16-01-31 16-02-20 16-03-11 16-03-31 16-04-20 16-05-10
Air f
low
(N m
3 h-1
)
DO c
once
ntra
tion
(mg
L-1)
Date O2 Air flow
0
0,005
0,01
0,015
0,02
0,025
0,03
0,035
0,04
16-01-11 16-01-31 16-02-20 16-03-11 16-03-31 16-04-20 16-05-100102030405060708090100
Date
Flow
Rat
e (m
3 h-1
)
NH 4
+ -N c
once
ntra
tion
(mg
L-1)
Ammonium concentration (daily) Ammonium concentration (grab) Sludge Liquor

35
low and stable (Persson, 2015). After the 28th of February, problem related with the sludge liquor pump was partially solved. After this point, the sludge liquor pump was periodically working and hence the addition of sludge liquor was not constant.
Figure 22. Change in the mainstream and the sludge liquor flow throughout the operation of the nitritation reactor (Mp1).
As expected, the ammonium concentration changed proportionally with the sludge liquor flow, in general. The difference between the ammonium concentration of the grab and daily samples were significant on the 3rd and 6th of March as there was a problem with the sampling equipment which was used for daily sample collection. On the 17th of March, another devia-tion occurred since grab samples were collected right after the start of the sludge liquor pump. In general, when grab samples were collected only mainstream water was present in the ni-tritation reactor. Thus at the instant where grab samples were collected ammonium concentra-tion in the reactor was still low. On the other hand, when daily samples were collected someparts of the reactor liquid were consisting of sludge liquor. This is the reason for the higher ammonium concentrations obtained with the daily samples. Results observed after the 5th of April were not reliable as the deviation between different samples were considerably high for similar reasons.
Figure 23 gives the ratio of ammonium from sludge liquor in Mp1. As indicated, this percent-age was around 35-50% at the beginning of the operation. Since between 16th – 28thof Febru-ary no sludge liquor was introduced to Mp1 all of the ammonium was coming from the main-stream flow during this period. With the increase in sludge liquor flow (Figure 22) the per-centage of ammonium from sludge liquor increased at the later stage. On the 10th of February the ratio of ammonium from sludge liquor was 74% in the nitritation reactor. This higher val-ue was obtained right after the operation of pilot plant only with sludge liquor for one day.
0
0,005
0,01
0,015
0,02
0,025
0,03
0,035
0,04
0
0,5
1
1,5
2
2,5
16-01-11 16-01-31 16-02-20 16-03-11 16-03-31 16-04-20 16-05-10
Slud
ge L
iquo
r Flo
w ra
te (m
3 h-1
)
Mai
nstr
eam
flow
rate
(m3 h
-1)
Date Mainstream flow Sludge Liquor
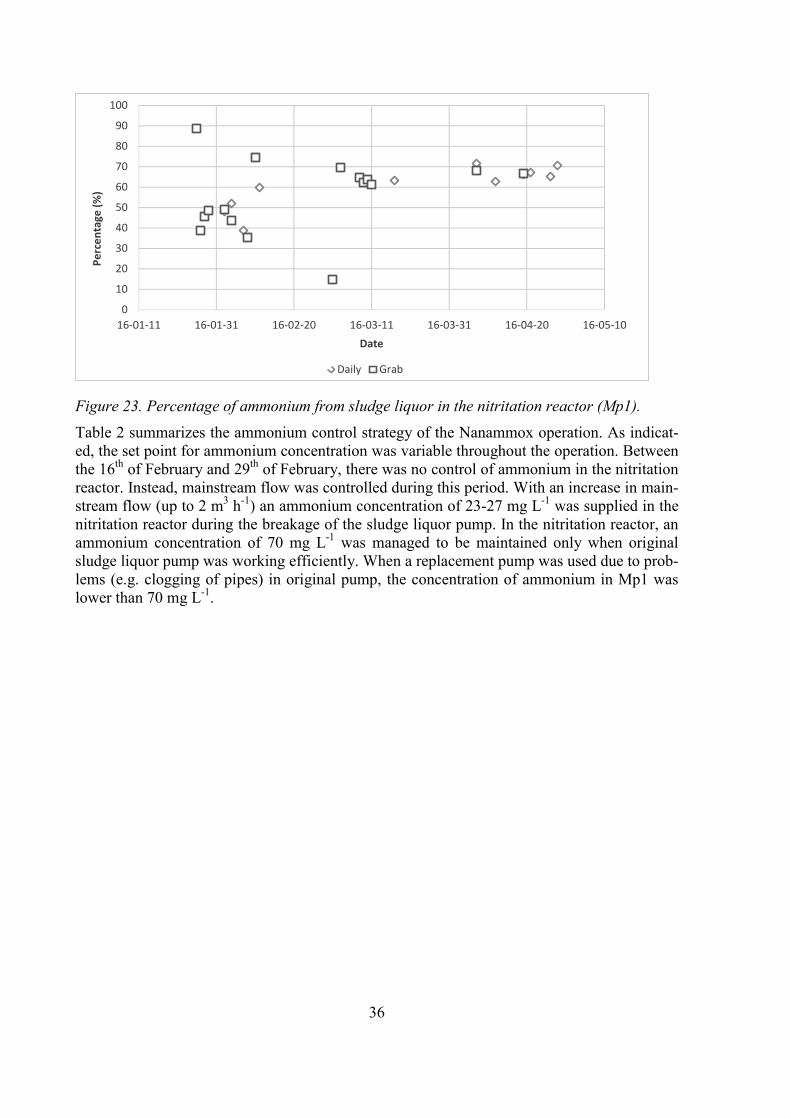
36
Figure 23. Percentage of ammonium from sludge liquor in the nitritation reactor (Mp1).
Table 2 summarizes the ammonium control strategy of the Nanammox operation. As indicat-ed, the set point for ammonium concentration was variable throughout the operation. Between the 16th of February and 29th of February, there was no control of ammonium in the nitritation reactor. Instead, mainstream flow was controlled during this period. With an increase in main-stream flow (up to 2 m3 h-1) an ammonium concentration of 23-27 mg L-1 was supplied in the nitritation reactor during the breakage of the sludge liquor pump. In the nitritation reactor, an ammonium concentration of 70 mg L-1 was managed to be maintained only when original sludge liquor pump was working efficiently. When a replacement pump was used due to prob-lems (e.g. clogging of pipes) in original pump, the concentration of ammonium in Mp1 was lower than 70 mg L-1.
0
10
20
30
40
50
60
70
80
90
100
16-01-11 16-01-31 16-02-20 16-03-11 16-03-31 16-04-20 16-05-10
Perc
enta
ge (%
)
Date
Daily Grab
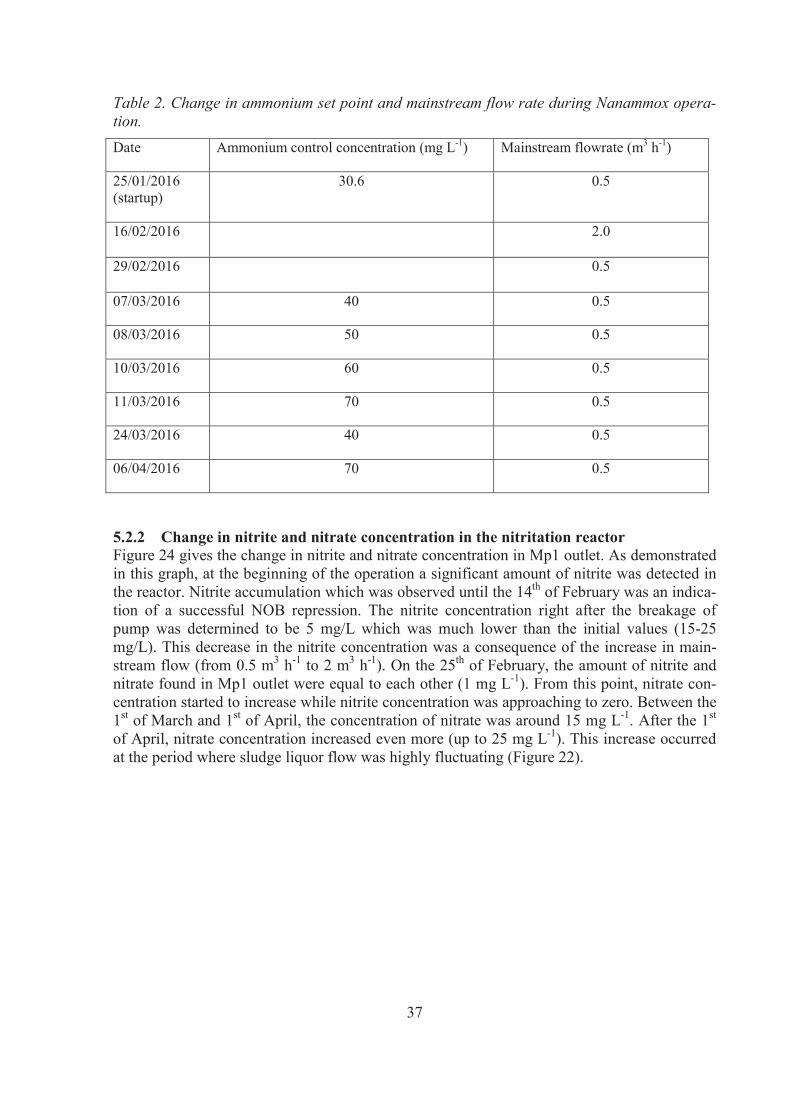
37
Table 2. Change in ammonium set point and mainstream flow rate during Nanammox opera-tion.Date Ammonium control concentration (mg L-1) Mainstream flowrate (m3 h-1)
25/01/2016 (startup)
30.6 0.5
16/02/2016 2.0
29/02/2016 0.5
07/03/2016 40 0.5
08/03/2016 50 0.5
10/03/2016 60 0.5
11/03/2016 70 0.5
24/03/2016 40 0.5
06/04/2016 70 0.5
5.2.2 Change in nitrite and nitrate concentration in the nitritation reactorFigure 24 gives the change in nitrite and nitrate concentration in Mp1 outlet. As demonstrated in this graph, at the beginning of the operation a significant amount of nitrite was detected in the reactor. Nitrite accumulation which was observed until the 14th of February was an indica-tion of a successful NOB repression. The nitrite concentration right after the breakage of pump was determined to be 5 mg/L which was much lower than the initial values (15-25 mg/L). This decrease in the nitrite concentration was a consequence of the increase in main-stream flow (from 0.5 m3 h-1 to 2 m3 h-1). On the 25th of February, the amount of nitrite and nitrate found in Mp1 outlet were equal to each other (1 mg L-1). From this point, nitrate con-centration started to increase while nitrite concentration was approaching to zero. Between the 1st of March and 1st of April, the concentration of nitrate was around 15 mg L-1. After the 1st
of April, nitrate concentration increased even more (up to 25 mg L-1). This increase occurred at the period where sludge liquor flow was highly fluctuating (Figure 22).

38
Figure 24. Change in NO2--N and NO3
--N concentrations in the nitritation reactor (Mp1)outlet.
Figure 25 and 26 demonstrates the change in nitrite and nitrate concentrations with respect to NOB activity. As represented in Figure 25, nitrite concentration decreases with increasing NOB activity. On the other hand, Figure 26 indicates the direct proportion between the activi-ty of NOB and nitrate concentration. These results were as expected since NOB utilize nitrite as a substrate and converts it into nitrate.
Figure 25. Change in NOB activity and nitrite (NO2--N) concentration in the nitritation reac-
tor (Mp1).
0
10
20
30
40
50
60
70
80
90
100
16-01-11 16-01-31 16-02-20 16-03-11 16-03-31 16-04-20 16-05-10
Conc
entr
atio
n (m
g L-1
)
Date
NO2-N (daily) NO3-N (daily) NO2-N (grab) NO3-N (grab)
0
0,5
1
1,5
2
2,5
0
10
20
30
40
50
60
70
80
90
100
16-01-11 16-01-31 16-02-20 16-03-11 16-03-31 16-04-20 16-05-10
OU
R (g
O2
m-2
d -1
)
Conc
entr
atio
n (m
g L-1
)
Date NO2-N (daily) NO2-N (grab) NOB OUR

39
Figure 26. Change in NOB activity and nitrate (NO3- -N) concentration in the nitritation reac-
tor (Mp1).
Figure 25 and 26 are in parallel with Figure 18 which demonstrates that NOB were repressed at the start of the operation. When NOB were repressed, AOB were dominant in the nitritation reactor and nitrite concentration was much higher than nitrate concentration. The structure of microbial community changed with time due to operational problems. Once NOB became abundant, they started to consume all of the nitrite produced by the activity of AOB. The high nitrate concentration along with the absence of nitrite at the later stage is the proof of this sit-uation (Figure 24).
5.2.3 Effect of ammonium residual on NOB activityFigure 27 represents the change in the maximum-endogenous and NOB OUR according to ammonium concentration. As can be seen in this graph, at the beginning when the ammonium concentration was between 50-60 mg L-1, NOB activity was close to zero. Between 20th of February and 26th of February max-endogenous activity started to decrease while NOB activi-ty was increasing. This denominates the decrease in AOB activity. When the ammonium con-centration was between 20-30 mg L-1 (11th of March-5th of April), NOB became the pre-dominant species in the reactor (Figure 27). This indicates that at lower ammonium concen-trations, the competition between NOB and AOB on dissolved oxygen favored NOB. Such results were in good agreement with the study of Isanta et al. (2015) where it was revealed that high residual concentration was crucial to prevent the kinetic limitation of AOB growth. It is hard to comment on the relation between ammonium concentration and the activity of NOB with the values obtained in April as they were highly variable, but the ammonium con-centration was not constantly as high as in the beginning of the study.
The max-endogenous OUR was rather stable throughout the operation while NOB activity was increasing (Figure 27). Furthermore, nitrite accumulation started to diminish with time while the concentration of nitrate in the reactor was increasing (Figure 24). This suggests that at the beginning of the operation where NOB were totally repressed, max-endogenous OUR was caused by the activity of AOB. As NOB became pre-dominant in the reactor, the max-endogenous OUR probably included a significant portion of NOB activity along with AOB activity.
0
0,5
1
1,5
2
2,5
0
10
20
30
40
50
60
70
80
90
100
16-01-11 16-01-31 16-02-20 16-03-11 16-03-31 16-04-20 16-05-10
OU
R (g
O2
m-2
d -1
)
Conc
entr
atio
n (m
g L-1
)
Date NO3-N (daily) NO3-N (grab) NOB OUR

40
As indicated in Figure 23, almost 50% of the ammonium in Mp1 was coming from the sludge liquor flow at the beginning of the operation. During this period, NOB were repressed in the reactor. Between the 16th and 28th of February, Mp1 was only fed with the mainstream flow. Figure 25 indicates that on the 19th of February, the first rather higher NOB activity was de-tected in the nitritation reactor. It is possible that such increase in NOB activity would have been observed even if there was no problem with the sludge liquor pump. However, it is more likely that this increase was an indication of a fast response of NOB to the decrease in ammo-nium concentration. During the period with low ammonium concentration, NOB activity kept increasing which supports the previous speculation. On the 1st of March 15% of the ammoni-um was supplied by the sludge liquor flow (Figure 23). This value (15%) was obtained right after the period where Mp1 was only fed with mainstream flow. On the 3rd of March, the ratio of ammonium from sludge liquor was around 70% and this value remained the same at the rest of the operation (Figure 23). At that time (3rd of March), OUR caused by the activity of NOB was 0.77g O2 m-2 d-1 and this value reached up to 1.3 g O2 m-2 d-1 by the end of the oper-ation. Considering these results it can be said that the response of NOB to a decrease in am-monium concentration is faster than their response to an increase in ammonium concentration. At Sjölunda WWTP, the mainstream receives around 15% of the ammonium in the effluent from the high-loaded activated sludge from sludge liquor. On the other hand, in the pilot plant the percentage of ammonium from the sludge liquor and hence the concentration of ammoni-um in the mainstream reactor (Mp1) was much higher (50-70%). In real life operation, the ammonium concentration is variable due to weather conditions. Considering the fast response of NOB to a decrease in ammonium concentration, the stability of the system could be one of the problems that is going to be faced during the scale-up of the Nanammox process.
Figure 27. Change in NOB activity and ammonium concentration in the nitritation reac-tor(Mp1).
5.2.4 Effect of DO:NH4+-N ratio on NOB activityAs indicated in Figure 28, at the beginning of the operation prior to the problems faced with the pumps, DO:NH4
+-N ratio was able to be maintained around 0.08. At this ratio, NOBs were repressed in the reactor. When the Mp1 reactor started to be fed only with mainstream flow,
0
0,5
1
1,5
2
2,5
0
10
20
30
40
50
60
70
80
90
100
16-01-11 16-01-31 16-02-20 16-03-11 16-03-31 16-04-20 16-05-10
OU
R (g
O2
m-2
d -1
)
NH 4
+ -N c
once
ntra
tion(
mg
L-1)
Date
Ammonium concentration (daily) Ammonium concentration (grab) NOB OUR max-end OUR

41
ammonium concentration started to decrease to a range of 20-30 mg L-1 (Figure 28). At this range of ammonium concentration, DO:NH4
+-N was higher than 0.08. Due to continued pump related problems in the pilot plant, the DO:NH4
+-N ratio was not able to be kept stable throughout the operation. Correspondingly, the NOB activity kept increasing.
Figure 28. Relation between DO: NH4+-N ratio and NOB activity.
5.2.5 Pilot plant performanceThe period at which the nitritation reactor was fed only with mainstream flow corresponds to the period where ammonium load was increased up to 1.3 g N m-2 d-1). At this period, the in-crease in the load was caused by the increase in the mainstream flow rate (Figure 22). Eventhough ammonium load was increased the ammonium oxidation decreased at the very same period due to the low hydraulic retention time of the mainstream flow. At the beginning of the operation, ammonium oxidation reached up to 0.35 g N m-2 d-1 in the nitritation reactor (Fig-ure 29). When Mp1 started to be fed with sludge liquor again (after the 28th of February), the ammonium oxidation started to increase indicating an increase in the activity of microorgan-isms as a result of higher ammonium concentrations. As represented in Figure 29 at the later stage ammonium oxidation was as high as at the beginning of the operation. It is possible that re-introduction of the sludge liquor which provided higher ammonium concentrations in the nitritation reactor boosted the activity of AOB. Once there was more AOB in the reactor the more ammonium was oxidized into nitrite. Following to this, availability of nitrite in the reac-tor improved the growth of NOB which were already abundant in the reactor. Hence, most of the oxidized ammonium was eventually converted into nitrate by NOB at this later stage (Fig-ure 30).
0
0,5
1
1,5
2
2,5
0
0,05
0,1
0,15
0,2
0,25
0,3
0,35
16-01-11 16-01-31 16-02-20 16-03-11 16-03-31 16-04-20 16-05-10
OU
R (g
O2
m-2
d -1
)
Ratio
(mg
mg-1
)
Date DO/NH4 (daily) DO/NH4 (grab) NOB OUR

42
Figure 29. Change in ammonium oxidation and ammonium load in the nitritation reactor (Mp1).
Figure 30 represents the percentage of produced nitrate per oxidized ammonium of the overall Nanammox pilot system. At the start of the operation, nitrate produced per oxidized ammoni-um was around 20% while NOB were repressed in the nitritation reactor. This indicates the activity of NOB in the anammox reactor (Mp2) at the beginning of the operation. This con-clusion is supported by the lab scale batch result which showed the activity of NOB on K1 carriers (Figure 12). For a while (Between 28th of January and 10th of February), the percent-age of produced nitrate per oxidized ammonium decreased in the Nanammox system. This may be the sign of NOB repression in the second reactor (Mp2) due to anoxic conditions. Fol-lowing to the problems in the pilot plant, this percentage started to increase again indicating an increase in the activity of NOB in Mp1.
Figure 30. Percentage of produced nitrate per oxidized ammonium in the Nanammox system.
Anammox bacteria which can convert nitrite into nitrogen gas was present in the second reac-tor (Mp2). Hence instead of nitrate, nitrite accumulation was required in Mp1 to achieve a
0
0,2
0,4
0,6
0,8
1
1,2
1,4
0
0,05
0,1
0,15
0,2
0,25
0,3
0,35
0,4
16-01-11 16-01-26 16-02-10 16-02-25 16-03-11 16-03-26 16-04-10 16-04-25 16-05-10
Load
(g N
m2
d-1
)
Oxi
datio
n (g
N m
2 d-1
)
Date NH4-N oxidation (grab) NH4-N oxidation (daily) NH4 load (daily) NH4 load (grab)
0102030405060708090
100
16-01-11 16-01-31 16-02-20 16-03-11 16-03-31 16-04-20 16-05-10
Perc
enta
ge (%
)
Date Daily Grab

43
successful nitrogen removal. Since this was not the case, Nanammox pilot plant demonstrated a poor performance throughout its operation. Figure 31 represents the change in the nitrogen removal rate with time. The current nitrogen removal rate is 0.13 kg N m-3 d-1 (0.39 g N m-2 d-
1) at Sjölunda WWTP. Thus, at least a nitrogen removal rate of 0.39 g N m-2 d-1 should be achieved in a successful Nanammox operation. As represented in Figure 29, the highest nitro-gen removal rate (0.29 g N m-2 d-1) was obtained at the beginning of the operation. After this point, the nitrogen removal rate started to decrease. Between the 28th of February and the 7th
of April, nitrogen removal rates were low (0.01-0.065 g N m-2 d-1) and far from the target. In addition to this, a stable nitrogen removal was not accomplished as a consequence of opera-tional problems.
Figure 31. Change in the nitrogen removal rate with time in the Nanammox system.
0
0,05
0,1
0,15
0,2
0,25
0,3
0,35
0,4
16-01-11 16-01-31 16-02-20 16-03-11 16-03-31 16-04-20 16-05-10
N re
mov
al ra
te (g
N m
2 .d-1
)
Date Daily Grab

44

45
6 Conclusion
At ammonium (NH4+-N) and nitrite (NO2
--N) concentrations of 50 mg L-1, no diffu-sion limitation was observed. Therefore, a substrate concentration of 50 mg L-1 is suit-able to detect total OUR, NOB and endogenous activities on Z-200 carriers in the studied nitritation system.Mixing of carriers in the batch reactors were more efficient with 27 carriers and show-ing higher reaction rates than with higher numbers of carriers. However, the activity results obtained with 107 carriers were more stable than the results obtained with 27 carriers. Considering this, 107 carriers which gives more consistent results seems more suitable to be used even though activity values obtained with this number of car-riers can be underestimated. NOB repression was achieved in the initial period of the study when the ammonium concentration in the inlet stream was between 50-60 mg L-1 and the DO:NH4
+-N ratio was around 0.08 in the nitritation reactor. At this period, up to 25 mg L-1 of nitrite ac-cumulation was observed in the nitritation reactor.NOB activity increased with time due to operational problems related with the sludge liquor and the mainstream pumps of the pilot plant. As a result, nitrite concentration decreased with time while nitrate concentration was increasing.Due to operational problems, a stable nitrogen removal was not achieved. The highest nitrogen removal rate was 0.29 g N m-2 d-1. This value was obtained at the beginning of the operation.

46

47
7 Suggestions for further work
Mixing in the lab scale batch reactor was supplied by the magnetic stir bar. Thus, carriers in the batch reactor were mixed through the vortex created by the magnetic stirrer. However, due to the specific shape of the Z-200 carriers the turbulence created in the batch reactor was not sufficient to supply an efficient mixing. Moreover, as the carrier number increased, the mix-ing efficiency decreased. On the other hand, higher numbers of carriers were giving more stable results in the activity test. Considering this, it would be suitable to use 107 carriers dur-ing ex-situ batch tests if the mixing in the lab scale reactor is improved. One way to supply a better mixing in the lab scale batch reactor could be using a lab scale mixer instead of the magnetic stirrer. The mixing in the lab scale reactor may resemble the mixing in the nitritation reactor of the pilot plant if a lab scale mixer is used in the further experiments.
In this study, substrate concentrations were considered while designing ex-situ batch tests. The aim was to find the optimal substrate concentration that would not result with diffusion limitation on Z-200 carriers. However, these experiments were affected from operational problems. Therefore, the experiments to find the change in the microbial activity with respect to substrate concentrations can be repeated in the further studies. In addition to different sub-strates, an inhibitor (ATU) was also added to regulate the activities of different microbial groups during the experiments. In this study, the experiments were conducted with 86μM of ATU in 400 ml of water. According to Ginestet et al.(1998), 86μM of ATU gives the opti-mum results (selective, instantaneous inhibition, no toxicity) when the substrate (NH4
+-N and NO2
- -N) concentrations are between 10-20 mg L-1 and the pH is 7.6. In the future studies, the optimum ATU concentrations which would inhibit the growth of AOB on Z-200 carriers at the optimum substrate concentration (which is 50 mg L-1 of NH4
+-N and NO2- -N according to
this study) can be investigated. Moreover, the future experiments can be conducted while the pH is also measured. By doing this, interpreting the change in the activity results of different cycles can be facilitated. In the further studies, the effect of a change in pH on microbial ac-tivity and structure can also be investigated.
In the pilot plant, operational problems resulted with a change in the ammonium concentra-tions of the nitritation reactor. During the time at which ammonium concentration was low, an increase in NOB activity was observed. This may be the indication of the high sensitivity of the microbial population structure to a change in ammonium concentration. This speculation should be investigated in the further studies in order to evaluate the stability of the operation.
The lab scale batch results should be conducted in parallel with the operation of the pilot plant. By doing so, the response of NOB for the regulation of sludge liquor flow in the pilot plant can be observed. The control strategy based on the ammonium concentration should be continued until the pump related problems are completely solved in order to observe the effect of this strategy on NOB repression.

48
.

49
8 References
Abeling, U. & Seyfried, C., 1992. Anaerobic-aerobic treatment of high-strength ammonium wastewater nitrogen removal via nitrite.. Water Science and Technology, 26(5-6), p. 1007–1015.
Alex, J. et al., 2008. Benchmark Simulation Model no. 1 (BSM1), Lund, Sweden: Dept. ofIndustrial Electrical Engineering and Automation, Lund University.
Aslan, S., Miller, L. & Dahab, M., 2009. Ammonium oxidation via nitrite accumulation under limited oxygen concentration in sequencing batch reactors. Bioresource Technology, 100(2), p. 659–664.
Balmelle, B. et al., 1992. Study of factors controlling nitrite build-up in biological processes for water nitrification.. Water Science and Technology, 26(5-6), p. 1017–1025.
Bartroli, A., Perez, J. & Carrera, J., 2010. Applying Ratio control in a continuous granular Reactor to Achieve Full Nitritation under Stable Operating Conditions. Environmental Science & Technology, 44(23), p. 8930–8935.
Bassin, J. et al., 2015. Tracking the dynamics of heterotrophs and nitrifiers in moving-bed biofilm reactors operated at different COD/N ratios. Bioresource Technology,192, p. 131–141.
Belser, L., 1981. Growth and oxidation kinetics of 3 genera of ammonia oxidizing nitrifiers. FEMS Microbiology Letters, 7(3), p. 211–216..
Belser, L. & Mays, E., 1980. Specific inhibition of nitrite oxidation by chlorate and its use in assessing nitrification in soils and sediments. Applied Environmental Microbiology, 39(3), p. 505–510.
Blackburne, R., Vadivelua, V. M., Yuana, Z. & Kellera, J., 2007. Kinetic characterisation of an enriched Nitrospira culture with comparison to Nitrobacter. Water Research, 41(14), p. 3033 – 3042.
Broda, E., 1977. Two kinds of litotrophs missing in nature. Zeitschrift für allgemeine Mikrobiologie, 17(6), p. 491-493.
Bryers, J., 2000. Biofilms II: Process Analysis and Applications, Ecological and Applied Microbiology. s.l.:Wiley-Liss.
Corbalá-Robles, L., Picioreanu, C. & van Loosdrecht, M. C. M. &. P. J., 2015. Analysing the effects of the aeration pattern and residual ammonium concentration in a partial nitritation-anammox process. Environmental Technology, 37(6),DOI: 10.1080/09593330.2015.1077895.
Daverey, A. et al., 2015. Start-up of simultaneous partial nitrification, anammox and denitrification (SNAD) process in sequencing batch biofilm reactor using novel biomass carriers. Bioresource Technology,190, p. 480-486.

50
Dolinšek, J. et al., 2013. Interactions of nitrifying bacteria and heterotrophs: Identification of a micavibrio-like putative predator of Nitrospira spp. Applied and Environmental Microbiology, 79(6), p. 2027–2037.
Erguder, T. H., Boon, N., Vlaeminck, S. E. & Verstraete, W., 2008. Partial nitrification achieved by pulse sulfide doses in a sequential batch reactor. Environmental Science and Technology, 42(23), p. 8715–8720.
Fukushima, T. et al., 2013. Nitrifying bacterial community structures and their nitrification performance under sufficient and limited inorganic carbon conditions. Applied Microbiology and Biotechnology, 97(14), p. 6513–6523.
Fux, C. et al., 2002. Biological treatment of ammonium-rich wastewater by partial nitritation and subsequent anaerobic ammonium oxidation (anammox) in a pilot plant. Journal of Biotechnology, 99(3), p. 295-306.
Ge, S. et al., 2014. Complete nitrogen removal from municipal wastewater via partial nitrification by appropriately alternating anoxic/aerobic conditions in a continuous plug-flow step feed process. Water Research, 55, p. 95-105.
Ge, S. et al., 2015. Detection of nitrifiers and evaluation of partial nitrification for wastewater treatment: A review. Chemosphere, 140, p. 85-98.
Ginestet, P., Audic, J.-M., Urbain, V. & Block, J.-C., 1998. Estimation of Nitrifying bacterial activities by measuring oxygen uptake in the presence of the metabolic inhibitors allylthiourea and azide. Applied and Environmental Microbiology, 64(6), p. 2266–2268.
Grunditz, C. & Dalhammar, G., 2001. Development of nitrification inhibition assays using pure cultures of nitrosomonas and nitrobacter. Water Research, 35(2), p. 433–440..
Guisasola, A. et al., 2005. Respirometric estimation of the oxygen affinity constants for biological ammonium and nitrite oxidation. Journal of Chemical Technology and Biotechnology, 80(4), p. 388-396.
Guo, J. et al., 2009. Long-term effect of dissolved oxygen on partial nitrification performance and microbial community structure. Bioresource Technology, 100(11), p. 2796–2802.
Gustavsson, D., Aspegren, H., Stålhandske, L. & la Cour Jansen, J., 2013. Mainstream anammox at Sjölunda Wastewater Treatment Plant – pilot operation of sludge liquor treatment and start-up of the full process. Malmö, Sweden, 13th Nordic wastewaterConference, NordIWA, p. 8-10.
Gustavsson, D. J. I., 2010. Biological sludge liquor treatment at municipal wastewater treatment plants - a review. Vatten, 66, p. 179–192.
Gustavsson, D. J. I., Persson, F., Jansen & Cour, J. l., 2014. Manammox – mainstream anammox at Sjölunda WWTP. Lisbon, Portugal, Proceedings of IWA World Water Congress and Exhibition, p. 21-26.
Gustavsson, D. et al., 2015. Experiences of repression of nitrate production in nitritation-anammox in municipal wastewater. Gdansk, Poland, IWA Specialist Conference, p. 230-237.
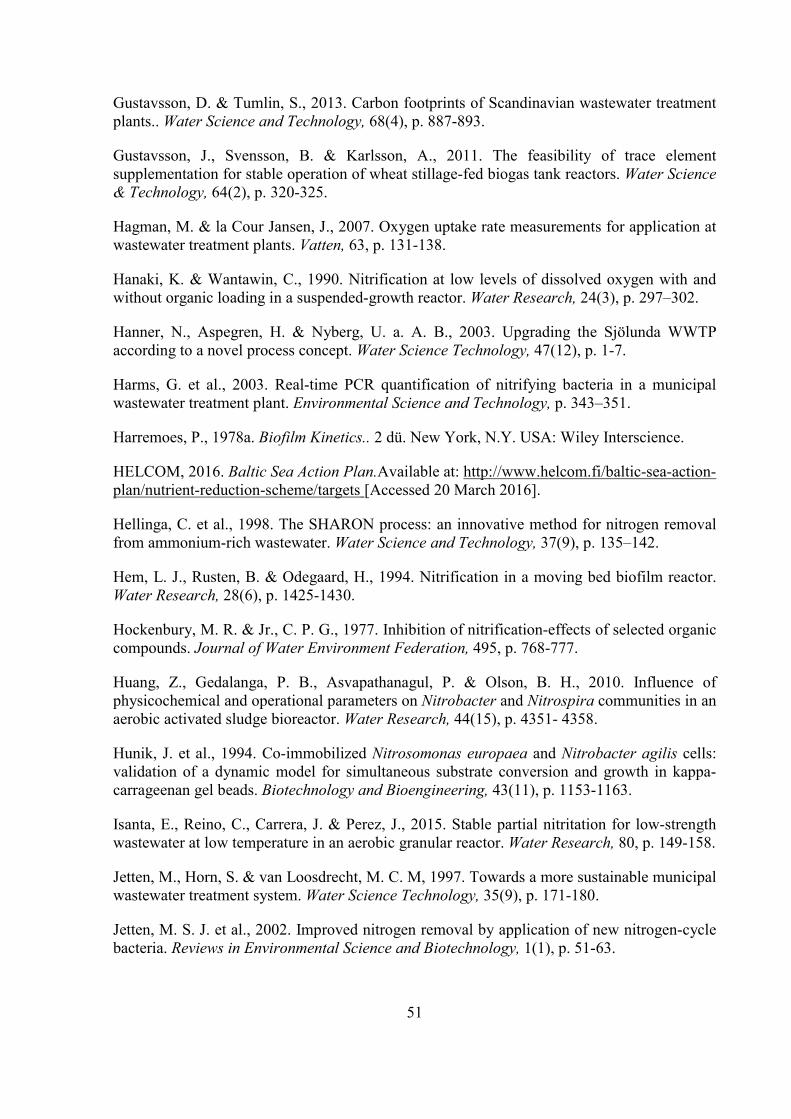
51
Gustavsson, D. & Tumlin, S., 2013. Carbon footprints of Scandinavian wastewater treatment plants.. Water Science and Technology, 68(4), p. 887-893.
Gustavsson, J., Svensson, B. & Karlsson, A., 2011. The feasibility of trace element supplementation for stable operation of wheat stillage-fed biogas tank reactors. Water Science & Technology, 64(2), p. 320-325.
Hagman, M. & la Cour Jansen, J., 2007. Oxygen uptake rate measurements for application at wastewater treatment plants. Vatten, 63, p. 131-138.
Hanaki, K. & Wantawin, C., 1990. Nitrification at low levels of dissolved oxygen with and without organic loading in a suspended-growth reactor. Water Research, 24(3), p. 297–302.
Hanner, N., Aspegren, H. & Nyberg, U. a. A. B., 2003. Upgrading the Sjölunda WWTP according to a novel process concept. Water Science Technology, 47(12), p. 1-7.
Harms, G. et al., 2003. Real-time PCR quantification of nitrifying bacteria in a municipal wastewater treatment plant. Environmental Science and Technology, p. 343–351.
Harremoes, P., 1978a. Biofilm Kinetics.. 2 dü. New York, N.Y. USA: Wiley Interscience.
HELCOM, 2016. Baltic Sea Action Plan.Available at: http://www.helcom.fi/baltic-sea-action-plan/nutrient-reduction-scheme/targets [Accessed 20 March 2016].
Hellinga, C. et al., 1998. The SHARON process: an innovative method for nitrogen removal from ammonium-rich wastewater. Water Science and Technology, 37(9), p. 135–142.
Hem, L. J., Rusten, B. & Odegaard, H., 1994. Nitrification in a moving bed biofilm reactor. Water Research, 28(6), p. 1425-1430.
Hockenbury, M. R. & Jr., C. P. G., 1977. Inhibition of nitrification-effects of selected organic compounds. Journal of Water Environment Federation, 495, p. 768-777.
Huang, Z., Gedalanga, P. B., Asvapathanagul, P. & Olson, B. H., 2010. Influence of physicochemical and operational parameters on Nitrobacter and Nitrospira communities in an aerobic activated sludge bioreactor. Water Research, 44(15), p. 4351- 4358.
Hunik, J. et al., 1994. Co-immobilized Nitrosomonas europaea and Nitrobacter agilis cells: validation of a dynamic model for simultaneous substrate conversion and growth in kappa-carrageenan gel beads. Biotechnology and Bioengineering, 43(11), p. 1153-1163.
Isanta, E., Reino, C., Carrera, J. & Perez, J., 2015. Stable partial nitritation for low-strength wastewater at low temperature in an aerobic granular reactor. Water Research, 80, p. 149-158.
Jetten, M., Horn, S. & van Loosdrecht, M. C. M, 1997. Towards a more sustainable municipal wastewater treatment system. Water Science Technology, 35(9), p. 171-180.
Jetten, M. S. J. et al., 2002. Improved nitrogen removal by application of new nitrogen-cycle bacteria. Reviews in Environmental Science and Biotechnology, 1(1), p. 51-63.

52
Kartal, B., Kuenen, J. & van Loosdrecht, M. C. M., 2010. Sewage treatment with anammox. SCIENCE, 328(5979), p. 702-703.
Kartal, B. et al., 2012. Anammox—Growth Physiology, cell biology and metabolism. Advances in Microbial Physiology, 60(212), p. 211-262.
Kim, D.-J. & Sun-Hee, K., 2006. Effect of nitrite concentration on the distribution and competition of nitrite-oxidizing bacteria in nitratation reactor systems and their kinetic characteristics. Water Research, 40(5), p. 887 – 894.
Kindaichi, T., Ito, T. & Okabe, S., 2004. Ecophysiological Interaction between nitrifying bacteria and heterotrophic Bacteria in autotrophic nitrifying biofilms as determined by microautoradiography-fluorescence in Situ hybridization. Applied and Environmental Microbiology, 70(3), p. 1641–1650.
la Cour Jansen, J. & Harremoes, P., 1984. Removal of substrates in fixed films. Water Science and Technology, 17(2-3), p. 1-14.
Lackner, S. et al., 2014. Full-scale partial nitritation/anammox experiences. Water Research, 55, p. 292-303.
Lackner, S., Welker, S., Gilbert, E. M. & Horn, H., 2015. Influence of seasonal temperature increase on PN/A reactors for mainstream wastewater treatment. Water Science and Technology, 72(8), p. 237-240.
Lee, Y., Ong, S. & Sato, C., 1997. Effects of heavy metals on nitrifying bacteria. Water Science and Technology, 165(1-3), p. 69–74.
Llano, N. & Galkin, V., 2014. Evaluation of bacteria population dynamics in mainstream anammox. Master thesis, 2014-07, Lund University.
Lotti, T. et al., 2014. Simultaneous partial nitritation and anammox at low temperature with granular sludge. Water Research, 66, p. 111-121.
Ma, B. et al., 2015a. Suppressing nitrite oxidizing bacteria growth to achieve nitrogen removal from domestic wastewater via anammox using intermittent aeration with low dissolved oxygen. Scientific Reports, 5, [e-journal] Available through: //dx.doi.org/10.1038/srep13048.
Ma, B. et al., 2016. Biological nitrogen removal from sewage via anammox: Recent advances. Bioresource Technology, 200, p. 981–990.
Moussaa, M. et al., 2009. Modelling nitrification, heterotrophic growth and predation in activated sludge. Water Research, 39(20), p. 5080–5098.
Mulder, A., Robertson, L. A., van Graaf, A. & Kuenen, J., 1995. Anaerobic ammonium oxidation discovered in a denitrifying fluidized-bed reactor. FEMS Microbiology Ecology, 16(3), p. 177-184.
Munz, G., Lubello, C. & Oleszkiewicz, J. A., 2011. Factors affecting the growth rates of ammonium and nitrite oxidizing bacteria. Chemosphere, 83(5), p. 720–725.
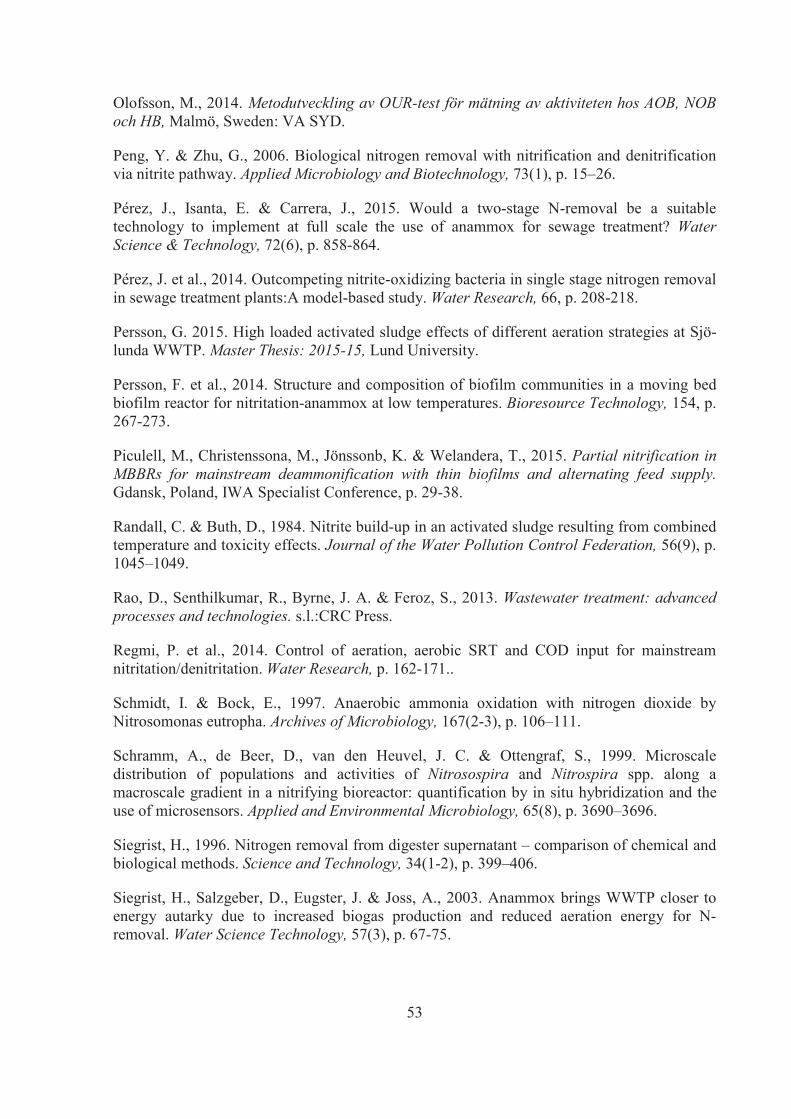
53
Olofsson, M., 2014. Metodutveckling av OUR-test för mätning av aktiviteten hos AOB, NOB och HB, Malmö, Sweden: VA SYD.
Peng, Y. & Zhu, G., 2006. Biological nitrogen removal with nitrification and denitrification via nitrite pathway. Applied Microbiology and Biotechnology, 73(1), p. 15–26.
Pérez, J., Isanta, E. & Carrera, J., 2015. Would a two-stage N-removal be a suitable technology to implement at full scale the use of anammox for sewage treatment? Water Science & Technology, 72(6), p. 858-864.
Pérez, J. et al., 2014. Outcompeting nitrite-oxidizing bacteria in single stage nitrogen removal in sewage treatment plants:A model-based study. Water Research, 66, p. 208-218.
Persson, G. 2015. High loaded activated sludge effects of different aeration strategies at Sjö-lunda WWTP. Master Thesis: 2015-15, Lund University.
Persson, F. et al., 2014. Structure and composition of biofilm communities in a moving bed biofilm reactor for nitritation-anammox at low temperatures. Bioresource Technology, 154, p. 267-273.
Piculell, M., Christenssona, M., Jönssonb, K. & Welandera, T., 2015. Partial nitrification in MBBRs for mainstream deammonification with thin biofilms and alternating feed supply. Gdansk, Poland, IWA Specialist Conference, p. 29-38.
Randall, C. & Buth, D., 1984. Nitrite build-up in an activated sludge resulting from combined temperature and toxicity effects. Journal of the Water Pollution Control Federation, 56(9), p. 1045–1049.
Rao, D., Senthilkumar, R., Byrne, J. A. & Feroz, S., 2013. Wastewater treatment: advanced processes and technologies. s.l.:CRC Press.
Regmi, P. et al., 2014. Control of aeration, aerobic SRT and COD input for mainstream nitritation/denitritation. Water Research, p. 162-171..
Schmidt, I. & Bock, E., 1997. Anaerobic ammonia oxidation with nitrogen dioxide by Nitrosomonas eutropha. Archives of Microbiology, 167(2-3), p. 106–111.
Schramm, A., de Beer, D., van den Heuvel, J. C. & Ottengraf, S., 1999. Microscale distribution of populations and activities of Nitrosospira and Nitrospira spp. along a macroscale gradient in a nitrifying bioreactor: quantification by in situ hybridization and the use of microsensors. Applied and Environmental Microbiology, 65(8), p. 3690–3696.
Siegrist, H., 1996. Nitrogen removal from digester supernatant – comparison of chemical and biological methods. Science and Technology, 34(1-2), p. 399–406.
Siegrist, H., Salzgeber, D., Eugster, J. & Joss, A., 2003. Anammox brings WWTP closer to energy autarky due to increased biogas production and reduced aeration energy for N-removal. Water Science Technology, 57(3), p. 67-75.

54
Sinha, B. & Annachhatre, A. P., 2007. Partial nitrification—operational parameters and microorganisms involved. Reviews in Environmental Science and Biotechnology, 6(4), p. 285–313.
Siripong, S. & Rittmann, B. E., 2007. Diversity study of nitrifying bacteria in full-scale municipal wastewater treatment plants. Water Research, 41(5), p. 1110 – 1120.
Stefansdottir, D., 2014. Manometric method for evaluation of anammox activity in mainstream anammox at Sjölunda WWTP. Master thesis, 2014:09, Lund University.
Strous, M., Heijnen, J. & Jetten, J. K. &. M., 1998. The sequencing batch reactor as a powerful tool for the study of slowly growing anaerobic ammonium-oxidizing microorganisms. Applied Microbiology and Biotechnology, 50(5), p. 589–596.
Stüven, R., Vollmer, M. & Bock, E., 1992. The impact of organic matter on nitric oxide formation by Nitrosomonaseuropaea. Archieves Microbiology, 158(6), p. 39–44.
Sultana, R., 2014. Partial Nitritation/Anammox process in a moving bed biofilm reactor operated at low temperatures. Licentiate thesis, 2014:05, Royal Institute of Technology.
Swedish Environmental Protection Agency, 2012. Wastewater treatment in Sweden. Available at: https://www.naturvardsverket.se/Om-Naturvardsverket/Publikationer/ISBN/8700/978-91-620-8704-3/[Accesed 15 February 2016].
Tokutomi, T., 2004. Operation of a nitrite-type airlift reactor at low DO concentration.. Water Science and Technology, 49(5-6), p. 81–88.
Torresi, E. et al., 2015. Influence of biofilm thickness on micropollutants removal in nitrifying MBBRs. Abstract from Micropol and Ecohazard 2015, Singapore, Singapore.
Trojanowicz, K., Plaza, E. & Trela, J., 2015. Pilot scale studies on nitritation-anammox process for mainstream wastewater at low temperature. Gdansk, Poland, IWA Specialist Conference, p. 160-165.
Turk, O. & Mavinic, D., 1986. Preliminary assessment of a shortcut in nitrogen removal from wastewater. Canadian Journal of Civil Engineering, 13(6), p. 600–605.
Vadivelu, V., Yuan, Z., Fux, C. & Keller, J., 2006c. Stoichiometric and kinetic characterisation of Nitrobacter in mixed culture by decoupling the growth and energy generation processes. Biotechnology and Bioengineering, 94(6), p. 1176–1188.
van Graaf, A. et al., 1996. Autotrophic growth of anaerobic, ammonium-oxidising micro-organisms in a fluidized bed reactor. Microbiology, 142(8), p. 2187–2196.
Wang, B. et al., 2016. Formation and performance of partial nitrification granular sludge treating domestic sewage. Desalination and Water Treatment, 57(8), p. 3430-3439.
Wang, W., 1984. Time Response of Nitrobacter to toxicity. Environment International, 10(1), p. 21-26.
55
Wett, B. et al., 2013. Going for mainstream deammonification from bench to full scale for maximized resource efficiency. Water Science and Technology, 68(2), p. 283-289..
Woese, C. et al., 1984. The phylogeny of purple bacteria: the beta subdivision. Systematic and Applied Microbiology, 5(3), p. 327–336.
Yang, S. & Yang, F., 2011. Nitrogen removal via short-cut simultaneous nitrification and denitrification in an intermittently aerated moving bed membrane bioreactor. Journal of Hazardous Materials, 16(5), p. 318– 323.
Yuan, Q. & Oleszkiewicz, J. A., 2011. Low temperature biological phosphorus removal and partial nitrification in a pilot sequencing batch reactor system. Water Science and Technology, 63(12), p. 2802-2807.
Zhu, G. et al., 2008. Biological removal of nitrogen from wastewater. Reviews of Environmental Contamination and Technology,192, p. 159–195.

56

57
9 Appendices
Appendix I OUR method
Appendix II Experimental data
Appendix III Figures from lab scale batch experiments
Appendix IV Additional figures from operational results

58

59
Appendix I OUR method1) Fill up the water bath and set the temperature to 17°C.2) Collect carriers from the nitritation reactor of the pilot plant.3) Rinse the carriers carefully with tap water.4) Count 107 carriers and put them in a 500 mL beaker.5) Add 400 mL of tap water to the beaker.6) Add a magnetic stir bar to the beaker.7) Place the beaker on the magnetic stirrer in the water bath. 8) Start the magnetic stirrer with a stirring speed of 350 rpm.9) Place the DO sensor and the aeration stone in the beaker.10)Start the data logging and continuous aeration.11) When the solution has been continuously aerated for 1.5 h, stop the continuous aera-
tion and start the non-aeration/aeration cycle.12)Add 5.5 mL of phosphate buffer (32.35 g Na2HPO4.2H2O & 2.84 g NaH2PO4 in 200
mL distilled water) and 4 mL of ammonium solution (11.80 g (NH4)2SO4 in 500 mL distilled water) with a syringe 30 s before cycle 4.
13)Add 1 mL of ATU with a syringe when the aeration has been on for 30 s in cycle 6.14)Add 4 mL of nitrite solution with a syringe 30 s before cycle 7.15)After 10 non-aeration/aeration cycles terminate the experiment.16)Transfer data from the logger to an USB.17) Rinse the carriers with the tap water and return them to the nitritation reactor in the pi-
lot plant.

60

61
Appendix II Experimental dataDate Experi-
ment
Number
NH4+ - N
added
(mg L-1)
NO2-- N
added
(mg L-1)
Carrier number
max
(mg O2 m-2h-1)
max-end
(mg O2 m-2h-1)
NOB
(mg O2 m-2h-1)
Batch Reactor 1
2016-02-10
1 50 50 107 83,79 79,93 1,23
2016-02-12
2 50 50 107 70,49 66,97 0,85
2016-02-19
3 50 50 107 85,95 81,38 3,81
2016-02-23
4 50 - 107 74,44 67,42 4,62
2016-02-26
5 50 50 107 61,49 54,47 13,72
2016-03-04
6 50 50 107 83,07 76,05 31,92
2016-03-08
7 50 50 107 82,36 73,92 40,35
2016-03-11
8 50 50 107 71,57 64,54 45,39
2016-03-18
9 50 50 107 80,20 58,42 38,28
2016-03-24
10 50 50 107 81,28 75,31 53,36
2016-04-01
11 50 50 107 85,23 78,56 52,30
2016-04-06
12 50 50 107 75,52 70,25 51,88
2016-04-15
13 50 50 107 78,76 71,73 64,32
2016-04-22
14 50 50 107 84,51 76,08 52,00

62
2016-04-29
15 50 50 107 84,51 74,33 54,24
Batch Reactor 2
2016-02-10
1 75 75 107 82,76 79,24 0,16
2016-02-12
2 25 25 107 69,41 65,89 0,13
2016-02-19
3 12.5 12.5 107 60,77 54,81 0,22
2016-02-23
4 - 50 107 6,83 0 7,92
2016-02-26
5 100 100 107 78,4 69,26 12,34
2016-03-04
6 50 50 53 118,34 106,99 37,15
2016-03-08
7 50 50 27 129,69 112,99 51,10
2016-03-11
8 50 50 15 139,53 120,99 65,55
2016-03-18
9 50 50 27 121,14 107,22 63,97
2016-03-24
10 50 50 27 105,46 95,72 68,16
2016-04-01
11 50 50 27 * * *
2016-04-06
12 50 50 27 104,04 95,69 73,88
2016-04-15
13 50 50 27 104,04 94,30 85,47
2016-04-22
14 50 50 27 123,99 103,11 94,53
2016-04-29
15 50 50 27 133,97 120,05 88,50

63
*Results were not reliable as a consequence of unstable DO logger measurement.
Appendix III Figures from lab scale batch experiments
Experiment 1In Figure A1, the OUR values for cycle 4, 5 and 6 are 82, 84 and 83 mg/L. h respectively. Hence, the difference between cycle 4, 5 and 6 can be neglected. The insignificant fluctua-tions between these values could be due to inefficient mixing. The value obtained at cycle 7 is much higher than the values obtained between cycles 8-10. The minimum slope of 7th cycle is the initial slope value obtained on cycle 7. Hence, in its calculation oxygen concentrations from the aeration part of cycle 6 were included. This may be the reason for such high activityresults obtained on cycle 7.
Figure A 1. OUR vs aeration cycle. This curve belongs to experiment where 50 mg L-1 of NH4
+-N and NO2- -N were added into batch reactor. Carrier number is 107.
When 75 mg/l of substrate is introduced into the beaker, the max OUR values obtained be-tween cycles 4-6 were 91.43, 89.26 and 82.75 mg/L. h, respectively (Figure A2). In Figure A2, the difference between the values of cycle 4-6 cannot be explained mathematically as the calculation of minimum slopes does not include values from the changing phase of aeration and non-aeration. It is likely that the activity of AOB were very high in the reactor initially. The highest OUR obtained (cycle 5) right after the addition of ammonium solution can be explained by previous reasoning. The high oxygen uptake rate could be related with fast con-sumption of substrate which in the end results with the accumulation of nitrite in the envi-ronment. It is possible that nitrite accumulation demonstrated toxic effects on AOB (Peng & Zhu, 2006) and hence the total activity decreased towards cycle 6. If pH was not maintained in the optimum range (lower than 7.5), free nitrous acid accumulation could be the reason for AOB inhibition. On the other hand, activity decrease towards cycle 6 may also be the indica-tion of a substrate limitation. A similar decrease in OUR towards 5th and 6th cycle was also observed in Figure A3 and A6.
0
10
20
30
40
50
60
70
80
90
0 2 4 6 8 10 12
OU
R [m
gL-1
h-1]
Aeration cycle

64
In figure A2, the OUR of cycle 7 is higher than the OUR of cycles 8-10. The minimum slope which was used to calculate the OUR of 7th cycle was the initial value of cycle 7. In other words, the minimum slope was determined when the aeration of cycle 6 was changing into non-aeration of cycle 7. This may explain such higher results obtained on cycle 7 in Figure A2. The same trend is also observed in Figure A3 and A4.
Figure A 2. OUR vs aeration cycle. This curve belongs to experiment where 75 mg L-1 of NH4
+-N and NO2- -N were added into batch reactor. Carrier number is 107.
Experiment 2In figure A3, even though the minimum slope of 7th cycle was not the initial slope, the calcu-lation of it still includes values from the aeration of cycle 6. This is because the minimum value is close to the edge of cycle change (where cycle 6 stops and cycle 7 starts).
0
10
20
30
40
50
60
70
80
90
100
0 2 4 6 8 10 12
OU
R [m
gL-1
h-1]
Aeration cycle
0
10
20
30
40
50
60
70
80
90
0 2 4 6 8 10 12
OU
R [m
gL-1
h-1]
Aeration cycle

65
Figure A 3. OUR vs aeration cycle. This curve belongs to experiment where 25 mg L-1 of NH4
+-N and NO2- -N were added into batch reactor. Carrier number is 107.
In figure A4, the difference in OUR between cycle 4-6 is insignificant.
Figure A 4. OUR vs aeration cycle. This curve belongs to experiment where 50 mg L-1 of NH4
+-N and NO2- -N were added into batch reactor. Carrier number is 107.
.
Experiment 3 Experiment 3 and 4 was conducted after the problem in sludge liquor pump was occurred. Hence, in these experiments it was expected to observe higher activities of NOB.
In figure A5, even though the difference between cycle 4-6 is not substantial, OUR tends to increase towards cycle 6 which implies an increase in the total maximum activity. It is possi-ble that after the addition of nitrite, the total OUR increased slightly as the activity of NOB were boosted. Such thing can be true if one assumes that AOB were not repressed instantane-ously with the addition of ATU and instead more time was required for their inhibition. An-other explanation could be related with the possibility of an increase in the activity of NOB since AOB consume ammonium and convert it into nitrite.
0
10
20
30
40
50
60
70
80
0 2 4 6 8 10 12
OU
R [m
gL-1
h-1]
Aeration cycle
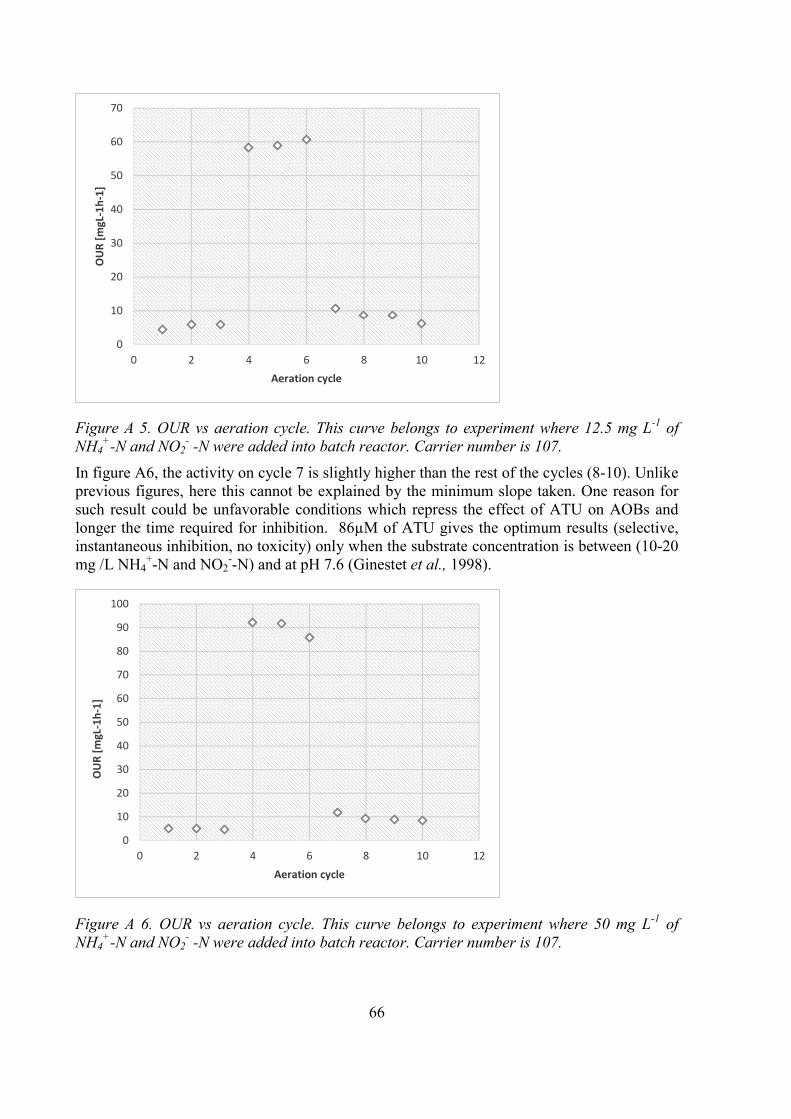
66
Figure A 5. OUR vs aeration cycle. This curve belongs to experiment where 12.5 mg L-1 of NH4
+-N and NO2- -N were added into batch reactor. Carrier number is 107.
In figure A6, the activity on cycle 7 is slightly higher than the rest of the cycles (8-10). Unlike previous figures, here this cannot be explained by the minimum slope taken. One reason for such result could be unfavorable conditions which repress the effect of ATU on AOBs and longer the time required for inhibition. 86μM of ATU gives the optimum results (selective, instantaneous inhibition, no toxicity) only when the substrate concentration is between (10-20 mg /L NH4
+-N and NO2--N) and at pH 7.6 (Ginestet et al., 1998).
Figure A 6. OUR vs aeration cycle. This curve belongs to experiment where 50 mg L-1 of NH4
+-N and NO2- -N were added into batch reactor. Carrier number is 107.
0
10
20
30
40
50
60
70
0 2 4 6 8 10 12
OU
R [m
gL-1
h-1]
Aeration cycle
0
10
20
30
40
50
60
70
80
90
100
0 2 4 6 8 10 12
OU
R [m
gL-1
h-1]
Aeration cycle

67
Experiment 5In this experiment, there was a problem with the introduction of phosphate buffer. The sy-ringe did not work properly which was likely caused by the crystallization of ions. Instead of 30 seconds before cycle 4, phosphate buffer was added during non-aeration of 4th cycle.
In Figure A7, the OUR value of 4th cycle is not close to edges where aeration is changing into non-aeration. The slope values on cycle 5th and 6th are more consistent within and with each other while the minimum value of cycle 4 deviates from the rest of the slopes on cycle 4.
Figure A 7. OUR vs aeration cycle. This curve belongs to experiment where 50 mg L-1 of NH4
+-N and NO2- -N were added into batch reactor. Carrier number is 107.
Figure A 8. OUR vs aeration cycle. This curve belongs to experiment where 100 mg L-1 of NH4
+-N and NO2- -N were added into batch reactor. Carrier number is 107.
0
10
20
30
40
50
60
70
80
90
0 2 4 6 8 10 12
OU
R [m
gL-1
h-1]
Aeration cycle
0
10
20
30
40
50
60
70
80
90
0 2 4 6 8 10 12
OU
R [m
gL-1
h-1]
Aeration cycle
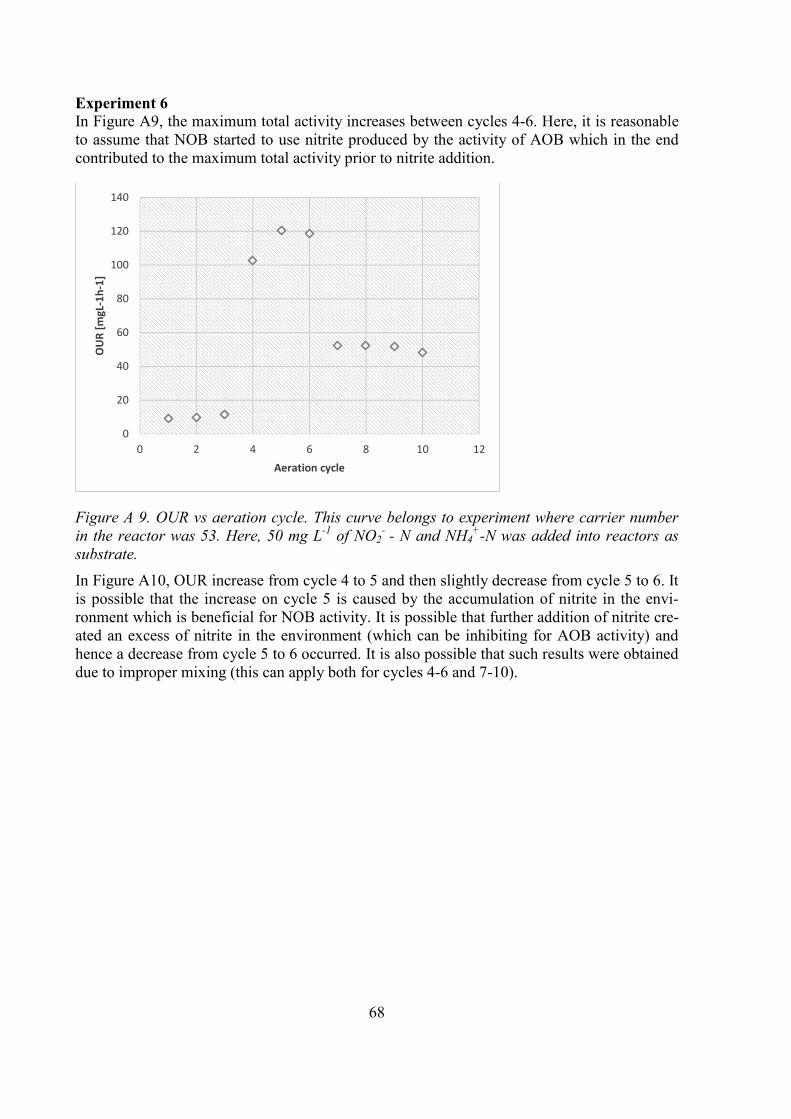
68
Experiment 6In Figure A9, the maximum total activity increases between cycles 4-6. Here, it is reasonable to assume that NOB started to use nitrite produced by the activity of AOB which in the end contributed to the maximum total activity prior to nitrite addition.
Figure A 9. OUR vs aeration cycle. This curve belongs to experiment where carrier number in the reactor was 53. Here, 50 mg L-1 of NO2
- - N and NH4+-N was added into reactors as
substrate.
In Figure A10, OUR increase from cycle 4 to 5 and then slightly decrease from cycle 5 to 6. It is possible that the increase on cycle 5 is caused by the accumulation of nitrite in the envi-ronment which is beneficial for NOB activity. It is possible that further addition of nitrite cre-ated an excess of nitrite in the environment (which can be inhibiting for AOB activity) and hence a decrease from cycle 5 to 6 occurred. It is also possible that such results were obtained due to improper mixing (this can apply both for cycles 4-6 and 7-10).
0
20
40
60
80
100
120
140
0 2 4 6 8 10 12
OU
R [m
gL-1
h-1]
Aeration cycle

69
Figure A 10. OUR vs aeration cycle. This curve belongs to experiment where carrier number in the reactor was 107. Here, 50 mg L-1 of NO2
- - N and NH4+-N was added into reactors as
substrate.
Experiment 7
Figure A 11. OUR vs aeration cycle. This experiment was carried out with 27 carriers. 50 mg L-1 of NO2
- - N and NH4+-N was added into the reactor as substrate.
0
10
20
30
40
50
60
70
80
90
100
0 2 4 6 8 10 12
OU
R [m
gL-1
h-1]
Aeration cycle
0
20
40
60
80
100
120
140
0 2 4 6 8 10 12
OU
R [m
gL-1
h-1]
Aeration cycle
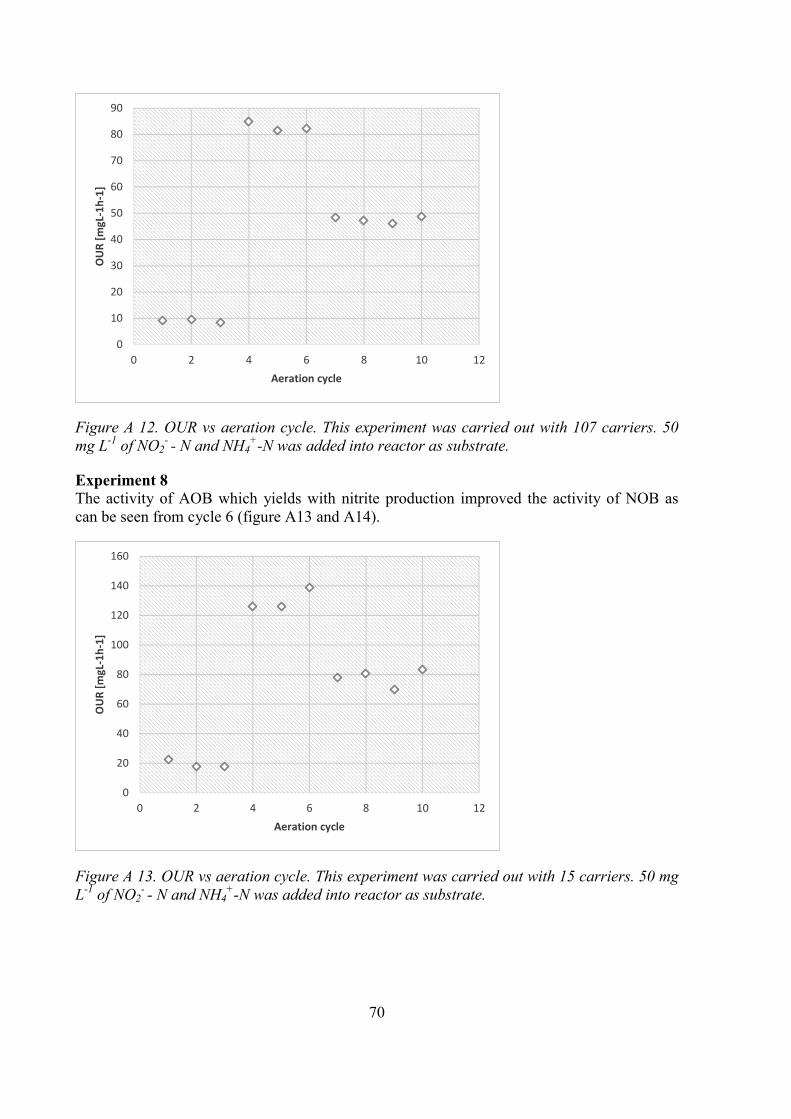
70
Figure A 12. OUR vs aeration cycle. This experiment was carried out with 107 carriers. 50 mg L-1 of NO2
- - N and NH4+-N was added into reactor as substrate.
Experiment 8The activity of AOB which yields with nitrite production improved the activity of NOB as can be seen from cycle 6 (figure A13 and A14).
Figure A 13. OUR vs aeration cycle. This experiment was carried out with 15 carriers. 50 mg L-1 of NO2
- - N and NH4+-N was added into reactor as substrate.
0
10
20
30
40
50
60
70
80
90
0 2 4 6 8 10 12
OU
R [m
gL-1
h-1]
Aeration cycle
0
20
40
60
80
100
120
140
160
0 2 4 6 8 10 12
OU
R [m
gL-1
h-1]
Aeration cycle

71
Figure A 14. OUR vs aeration cycle. This experiment was carried out with 107 carriers. 50 mg L-1 of NO2
- - N and NH4+-N was added into reactor as substrate.
Experiment 9
Figure A 15. OUR vs aeration cycle. This experiment was carried out with 107 carriers. 50 mg L-1 of NO2
- - N and NH4+-N was added into reactor as substrate.
0
10
20
30
40
50
60
70
80
90
0 2 4 6 8 10 12
OU
R [m
gL-1
h-1]
Aeration cycle
0
10
20
30
40
50
60
70
80
90
100
0 2 4 6 8 10 12
OU
R [m
gL-1
h-1]
Aeration cycle

72
Figure A 16. OUR vs aeration cycle. This experiment was carried out with 27 carriers. 50 mg L-1 of NO2
- - N and NH4+-N was added into reactor as substrate.
.
Experiment 10
Figure A 17. OUR vs aeration cycle. This experiment was carried out with 27 carriers. 50 mg L-1 of NO2
- - N and NH4+-N was added into reactor as substrate.
0
20
40
60
80
100
120
140
0 2 4 6 8 10 12
OU
R [m
gL-1
h-1]
Aeration cycle
0
20
40
60
80
100
120
0 2 4 6 8 10 12
OU
R [m
gL-1
h-1]
Aeration cycle

73
Figure A 18. OUR vs aeration cycle. This experiment was carried out with 107 carriers. 50 mg L-1 of NO2
- - N and NH4+-N was added into reactor as substrate.
Experiment 11
Figure A 19. OUR vs aeration cycle. This experiment was carried out with 107 carriers. 50 mg L-1 of NO2
- - N and NH4+-N was added into reactor as substrate.
0
10
20
30
40
50
60
70
80
90
0 2 4 6 8 10 12
OU
R [m
gL-1
h-1]
Aeration cycle
0
10
20
30
40
50
60
70
80
90
0 2 4 6 8 10 12
OU
R [m
gL-1
h-1]
Aeration cycle

74
Experiment 12
Figure A 20. OUR vs aeration cycle. This experiment was carried out with 107 carriers. 50 mg L-1 of NO2
- - N and NH4+-N was added into reactor as substrate.
Figure A 21. OUR vs aeration cycle. This experiment was carried out with 27 carriers. 50 mg L-1 of NO2
- - N and NH4+-N was added into reactor as substrate.
0
10
20
30
40
50
60
70
80
0 2 4 6 8 10 12
OU
R [m
gL-1
h-1]
Aeration cycle
0
20
40
60
80
100
120
0 2 4 6 8 10 12
OU
R [m
gL-1
h-1]
Aeration cycle
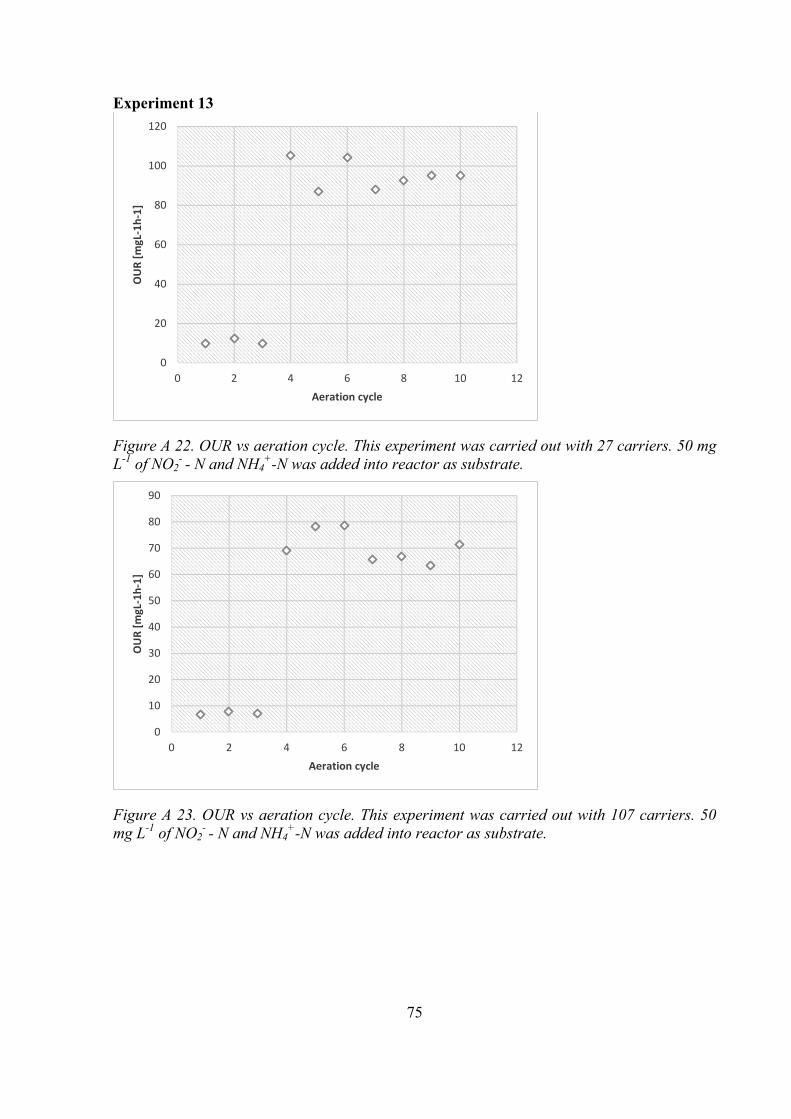
75
Experiment 13
Figure A 22. OUR vs aeration cycle. This experiment was carried out with 27 carriers. 50 mg L-1 of NO2
- - N and NH4+-N was added into reactor as substrate.
Figure A 23. OUR vs aeration cycle. This experiment was carried out with 107 carriers. 50 mg L-1 of NO2
- - N and NH4+-N was added into reactor as substrate.
0
20
40
60
80
100
120
0 2 4 6 8 10 12
OU
R [m
gL-1
h-1]
Aeration cycle
0
10
20
30
40
50
60
70
80
90
0 2 4 6 8 10 12
OU
R [m
gL-1
h-1]
Aeration cycle

76
Experiment 14
Figure A 24. OUR vs aeration cycle. This experiment was carried out with 27 carriers. 50 mg L-1 of NO2
- - N and NH4+-N was added into reactor as substrate.
Figure A 25. OUR vs aeration cycle. This experiment was carried out with 107 carriers. 50 mg L-1 of NO2
- - N and NH4+-N was added into reactor as substrate.
Until this experiment, the same DO probe was used for the reactor filled with the same num-bers of carriers. In other words, the reactor filled with 107 carriers were always measured with the same DO probe and the other probe was always used to measure the DO level in the reac-tor with 27 carriers. In this experiment, the place of the probes were changed.
0
20
40
60
80
100
120
140
0 2 4 6 8 10 12
OU
R [m
gL-1
h-1]
Aeration cycle
0
10
20
30
40
50
60
70
80
90
100
0 2 4 6 8 10 12
OU
R [m
gL-1
h-1]
Aeration cycle

77
Experiment 15
Figure A 26. OUR vs aeration cycle. This experiment was carried out with 107 carriers. 50 mg L-1 of NO2
- - N and NH4+-N was added into reactor as substrate.
Figure A 27. OUR vs aeration cycle. This experiment was carried out with 27 carriers. 50 mg L-1 of NO2
- - N and NH4+-N was added into reactor as substrate.
0
20
40
60
80
100
120
0 2 4 6 8 10 12
OU
R [m
gL-1
h-1]
Aeration cycle
0
20
40
60
80
100
120
140
160
0 2 4 6 8 10 12
OU
R [m
gL-1
h-1]
Aeration cycle

78
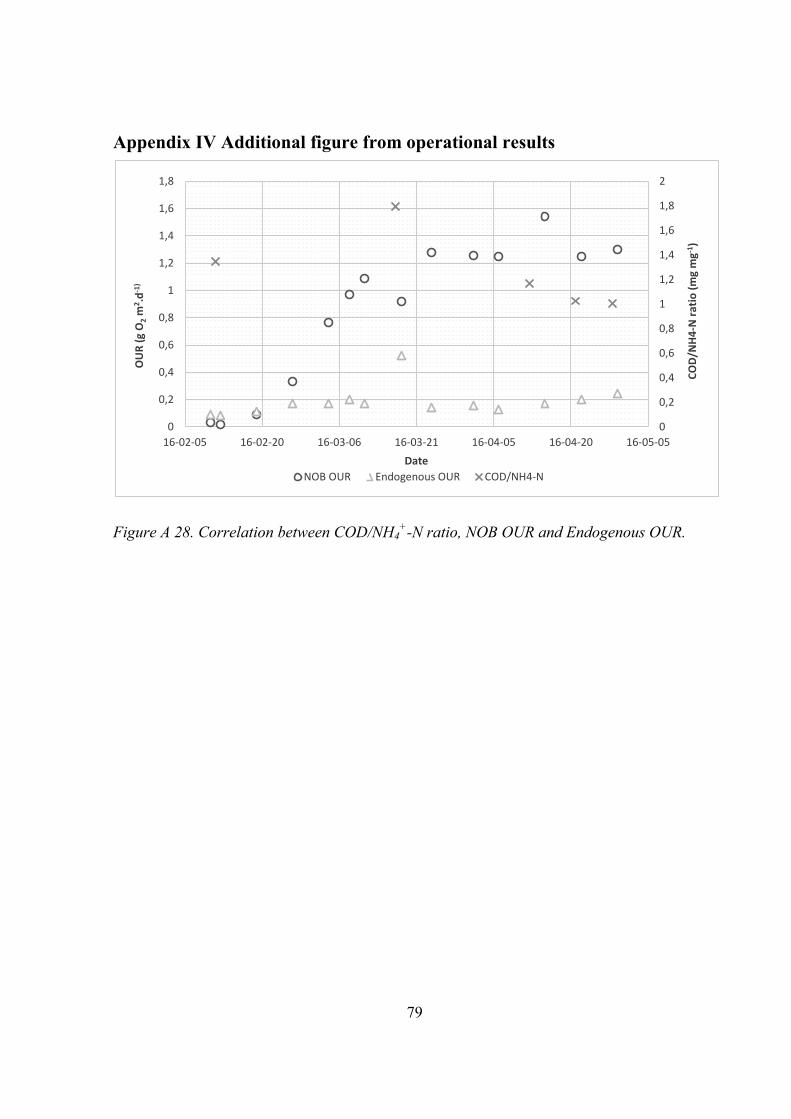
79
Appendix IV Additional figure from operational results
Figure A 28. Correlation between COD/NH4+-N ratio, NOB OUR and Endogenous OUR.
0
0,2
0,4
0,6
0,8
1
1,2
1,4
1,6
1,8
2
0
0,2
0,4
0,6
0,8
1
1,2
1,4
1,6
1,8
16-02-05 16-02-20 16-03-06 16-03-21 16-04-05 16-04-20 16-05-05
COD/
NH4
-N ra
tio (m
g m
g-1)
OU
R (g
O2 m
2 .d-1
)
Date NOB OUR Endogenous OUR COD/NH4-N

80

81
Nitritation-Anammox: a successful technology for mainstream wastewater treatment?
The discharge of wastewater with high amount of nitrogen is a major threat to life in aquatic ecosystem. Conventional method of nitrogen removal is highly energy de-manding. Nitritation-Anammox is a new and eco-friendly approach which seems to solve this issue.
Total population of the world is increasing every day and that is also the case in Malmö, the third largest city in Sweden. One of the problems accompanying the increase of the popula-tion in Malmö is the wastewater generated. It is even more complicated after Sweden has signed the Baltic Sea Action plan which aims to limit the nitrogen discharge. This action plan includes the Öresund strait where the wastewater from Malmö is discharged to. Nitrogen con-taining wastewater if it is not treated properly will cause algal bloom in the water streams. Algal bloom is a phenomenon when algae (a group of microorganisms) grows very fast so that they cover the surface of the water blocking the sun light. Without the sun light, life un-der water will be gone. At the moment, there are several wastewater treatment plants (WWTPs) which treat the wastewater in Malmö region. However, some of the plants will be closed down in the future leaving most of the burden to Sjölunda WWTP. With the existing capacity of Sjölunda WWTP, it is harder to cover the target set by the joint agreement.
Nitritation-anammox is a newly introduced method in removing nitrogenous compound from the wastewater. The nitritation-anammox method addresses the main issue in the conventional treatment of nitrogen containing wastewater: high amount of energy consumption. In the con-ventional approach, ammonium (compound that are usually found in cleaning solutions) is converted to nitrite then to nitrate in the process called nitrification. Nitrate will later be con-verted to nitrogen gas, the most abundant gas in the air in the process called denitrification; this process needs external carbon sources, e.g. sugar. In the nitritation-anammox process, half of the ammonium is converted to nitrite first, then the remaining ammonium together with newly formed nitrite will be converted to the nitrogen gas. The nitritation-anammox pro-cess will lower the energy consumption significantly and eliminate the need of additional sug-ar.
The successful implementation of the nitritation-anammox process in the large scale, for ex-ample in Sjölunda WWTP, depends on the relation of different microbial groups. Environ-ment surrounding them contribute to the composition of this microbial population. Low tem-perature and low ammonium concentration found in the mainstream wastewater is not good for maintaining the desired microbial composition in the reactor. As a result of this, it is chal-lenging to supply an efficient nitritation-anammox operation. The number of carriers (“house” of bacteria) was an important parameter to be tested because the carrier helps to retain the bacteria responsible for the nitritation-anammox process in the wastewater treatment plant. Too high or too low amount of ammonium and nitrite (“food”of bacteria) would result in inef-ficiency while determining microbial activity. This work has contributed to the knowledge of implementing the nitritation-anammox process for industrial application and has pointed out the possible problems that could be faced in the future.

82