evaluation of michigan’s 1003(g) by districts and schools ... section 1003(g) ... government...
TRANSCRIPT
Evaluation of Michigan’s 1003(g) School Improvement Grants
Implementation Trends in the First Year
Submitted to: Mark Coscarella Office of Education Improvement & Innovation Michigan Department of Education
Submitted by:
Juan Carlos Bojorquez John Rice Jerry Hipps Jian Li
January 2012

Table of Contents
Executive Summary ............................................................................................................................1
Introduction and Background .............................................................................................................3 Background on School Improvement Grants ........................................................................................... 3 Michigan’s School Improvement Grants .................................................................................................. 6
Description of Michigan’s 2010 SIG Grantees ...................................................................................... 6 Overview of the Evaluation of Michigan’s SIGs ........................................................................................ 9
The Current Report ............................................................................................................................. 10
Methodology ................................................................................................................................... 11 Implementation Indicators and Interview Protocols .............................................................................. 11 Data Collection ....................................................................................................................................... 12
Interviews with District and School Staff ............................................................................................ 12 Benchmarking Tools ........................................................................................................................... 14
Data Analysis........................................................................................................................................... 15
Findings - SIG Implementation in Year One ....................................................................................... 16 Summary of the Findings ........................................................................................................................ 16
District and School Governance and Leadership ................................................................................ 16 Staff Recruitment and Selection ......................................................................................................... 17 Performance Evaluation, Incentives, and Staff Removal ................................................................... 17 Professional Development and Coaching ........................................................................................... 18 Monitoring by Districts and Schools ................................................................................................... 18
Detailed Discussion of the Findings ........................................................................................................ 19 Governance and Leadership ............................................................................................................... 19 Staff Recruitment and Selection ......................................................................................................... 23 Performance Evaluation, Incentives, and Staff Removal ................................................................... 26 Professional Development and Coaching ........................................................................................... 28 Monitoring by Districts and Schools ................................................................................................... 34 Successes and Obstacles in the First Year of SIG Implementation ..................................................... 38
Next Steps ....................................................................................................................................... 41
References ....................................................................................................................................... 43
Appendices ...................................................................................................................................... 44

List of Exhibits
Exhibit 1: SIG Model Requirements ................................................................................................ 5
Exhibit 2: SIG School Information Sheet 1 ...................................................................................... 7
Exhibit 3: SIG School Information Sheet 2 ...................................................................................... 8
Exhibit 4: School Distribution for Different SIG Models ................................................................. 9
Exhibit 5: Role of Year One Interviewees in SIG Schools and Districts ......................................... 12
Exhibit 6: Principal Replacement by Intervention Model and School Level ................................. 24
Exhibit 7: Specificity of Competencies by Intervention Model and School Level ........................ 25
Exhibit 8: Strategies Involved in Removing Teachers ................................................................... 28
Exhibit 9: Level of Teacher Professional Development by Intervention Model and School Level ....................................................................................................................................................... 30
Exhibit 10: Level of Principal Professional Development by Intervention Model and School Level....................................................................................................................................................... 31
Exhibit 11: Comparison—Levels of Teacher and Principal Professional Development ................ 32
Exhibit 12: Level of Teacher Coaching by Intervention Model and School Level ......................... 32
Exhibit 13: Level Principal Coaching by Intervention Model and School Level ............................ 33
Exhibit 14: Comparison—Level of Teacher and Principal Coaching ............................................. 34

Page 1
Executive Summary This report summarizes implementation trends for the first year of WestEd’s three-year evaluation of the
18 districts and 28 schools in Michigan that were awarded 1003(g) School Improvement Grants (SIGs) in
fall 2010. This phase of the evaluation was guided by a subset of SIG implementation indicators that SIG
districts and schools were expected to implement during the first year, including: recruiting and selecting
staff; professional development and training; coaching; performance evaluation; decision support data
systems; facilitative administration; leadership; system interventions; and assessment.
Data were collected through semi-structured telephone interviews with 51 individuals who were heavily
involved with SIG planning and implementation, including district-level SIG administrators and principals
of SIG schools. The interview data were supplemented with benchmarking tools completed by SIG
monitors. The interview data were coded through an iterative process whereby an initial set of codes were
developed and then revised based on the level of agreement between different coders. The coded
interviews were examined for themes and generalizations, then analyzed and synthesized by SIG model
(turnaround, transformation) and school level (elementary, middle and high). Supplemental data from the
benchmarking tool were examined during analysis and synthesis of the interview data.
A number of trends were found across the SIG districts and schools in the following domains:
Governance and Leadership
SIG schools made appreciable modifications to both governance structures and leadership by the end of the first year. The most common modifications were changes to school schedules and increases in shared or distributed leadership.
Changes in governance and leadership at the district level during the first year were much more limited compared to the changes in governance and leadership at schools.
All schools reported they were allowed some degree of freedom and flexibility by districts, most commonly in the areas of staff reassignment and scheduling. Principals felt the most constraints from districts in the areas of budgeting and curricula selection.
Recruitment and Staffing
Overall, SIG schools met all the fundamental staffing requirements of SIG in the first year.
In general, districts reported that they frequently relied on their standard hiring processes when screening staff for SIG schools. Only about a fifth of all SIG schools (and none of the turnaround schools) could identify highly specific critical skills or competencies that they used (or planned to use) for hiring in the first year.
Performance Evaluation, Incentives, and Staff Removal
Districts and schools were in the process of developing new staff performance evaluation systems and, for the most part, had not yet changed the conditions under which principals and teachers could be removed. About half of the schools made performance incentives available to the principal and teachers.
Page 2
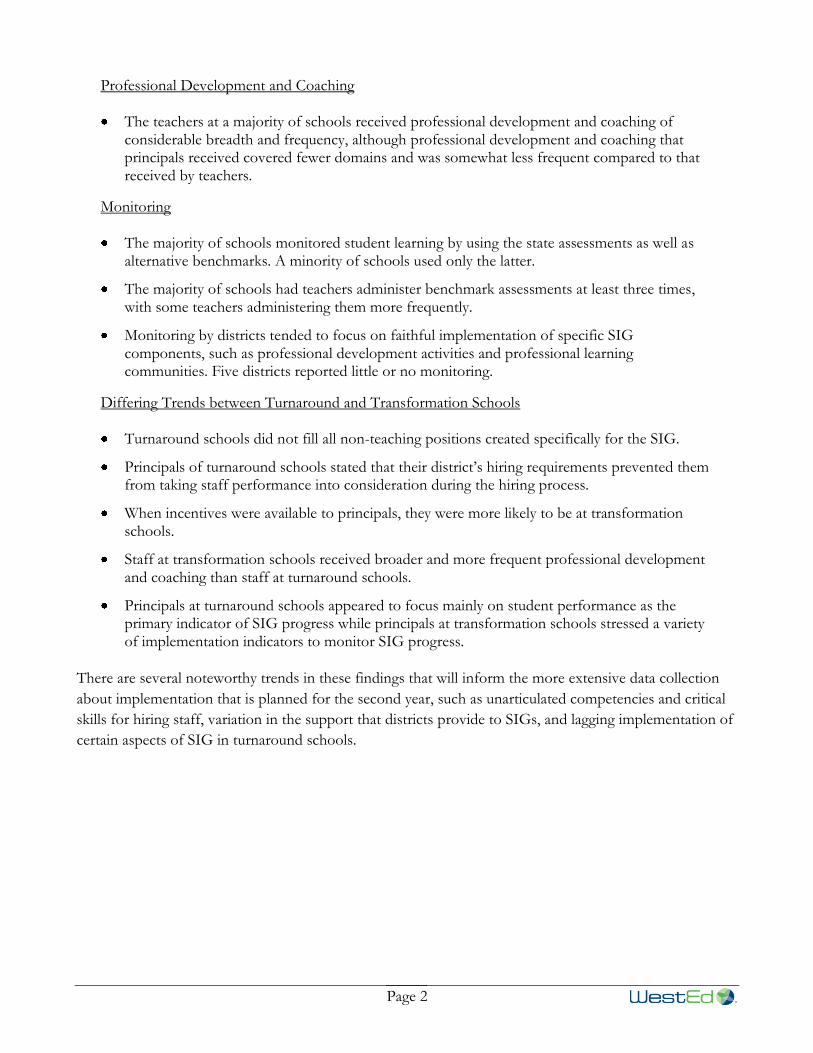
Professional Development and Coaching
The teachers at a majority of schools received professional development and coaching of considerable breadth and frequency, although professional development and coaching that principals received covered fewer domains and was somewhat less frequent compared to that received by teachers.
Monitoring
The majority of schools monitored student learning by using the state assessments as well as alternative benchmarks. A minority of schools used only the latter.
The majority of schools had teachers administer benchmark assessments at least three times, with some teachers administering them more frequently.
Monitoring by districts tended to focus on faithful implementation of specific SIG components, such as professional development activities and professional learning communities. Five districts reported little or no monitoring.
Differing Trends between Turnaround and Transformation Schools
Turnaround schools did not fill all non-teaching positions created specifically for the SIG.
Principals of turnaround schools stated that their district’s hiring requirements prevented them from taking staff performance into consideration during the hiring process.
When incentives were available to principals, they were more likely to be at transformation schools.
Staff at transformation schools received broader and more frequent professional development and coaching than staff at turnaround schools.
Principals at turnaround schools appeared to focus mainly on student performance as the primary indicator of SIG progress while principals at transformation schools stressed a variety of implementation indicators to monitor SIG progress.
There are several noteworthy trends in these findings that will inform the more extensive data collection
about implementation that is planned for the second year, such as unarticulated competencies and critical
skills for hiring staff, variation in the support that districts provide to SIGs, and lagging implementation of
certain aspects of SIG in turnaround schools.

Page 3
Introduction and Background This report summarizes trends from the first year of implementation of Michigan’s 1003(g) School
Improvement Grants (SIGs)1, 2 using information collected primarily from staff in districts and schools
that received SIG funds. The findings are from the first phase of WestEd’s three-year evaluation of SIGs
for the Michigan Department of Education (MDE). The first phase was guided by a subset of SIG
implementation indicators on which progress was expected during the first year. Data were collected
through semi-structured telephone interviews with the individuals who were most involved with SIG
planning and implementation. The first phase of evaluation data collection had two broad purposes: 1)
provide MDE with an independent snapshot of implementation progress in year one, and 2) allow the
evaluation team to gather perspective and context around key elements of early implementation of SIGs.
The full three-year evaluation will include a more comprehensive examination (both in terms of scope and
number of data sources) of implementation, program impact, and the relationship between the two.
In this first report, we provide a brief overview of SIGs, background information on the recipients of
Michigan’s SIGs in 2010, and a summary of our evaluation approach. Next, we provide information on the
method and instruments used for collecting and analyzing data on SIG implementation. Then we
summarize the findings for each implementation indicator and follow with a discussion of the findings in
greater detail. In the final section, we discuss next steps for the SIG evaluation in the second year, based
on the implementation trends found in the first year.
BACKGROUND ON SCHOOL IMPROVEMENT GRANTS
SIGs are authorized under Title I, Section 1003(g) of the Elementary and Secondary Education Act of
1965. SIGs are awarded by the U.S. Department of Education (USED) to state educational agencies
(SEAs) who, in turn, award subgrants to local educational agencies (LEAs). LEAs are then responsible for
distributing funds to struggling schools. The goal is to enable struggling schools to make adequate yearly
progress (AYP) and exit from improvement status. Regular appropriations for SIGs increased from $125
million in 2007 to $546 million in 2009. However, in 2009, SIG funding was greatly supplemented through
the American Recovery and Reinvestment Act (ARRA), which added $3 billion for SIGs (U.S.
Government Accountability Office, 2011). In order to receive a subgrant, LEAs must demonstrate that
they are committed to using these funds to raise student achievement in their persistently lowest achieving
schools. SEAs may award an LEA up to $2,000,000 per year for each qualified school in the district.
Eligible schools in 2010 needed to meet the requirements for one of three tiers:
Tier I – Title I schools in improvement, corrective action, or restructuring that were (1) the lowest-achieving five percent in the state, or (2) high schools with a graduation rate under 60 percent. Elementary schools could also be eligible if they were achieving at the same rates as the
1 Although the 1003(a) and 1003(g) SIGs are distinct and separate funding streams, the use of “SIG” in this report refers to the latter only.
2 The focus of the evaluation and the current report is the 28 schools in Michigan that received 1003(g) SIG funds beginning in fall 2010. Additional schools have received SIG awards since then; however, they are outside the scope of the current evaluation.

Page 4
persistently lowest achieving schools and had not made AYP for two years or were in the lowest 20 percent of schools based on proficiency.
Tier II – Secondary schools that were eligible for but did not receive Title I funds, and (1) were among the five percent lowest-achieving secondary schools in the state, or (2) had a graduation rate under 60 percent. Secondary schools were also eligible if they were achieving no higher than the highest-achieving school identified as persistently low-achieving, or had a graduation rate under 60 percent and had not made AYP for two years or were in the lowest 20 percent of schools based on proficiency.
Tier III – Title I schools in improvement, corrective action, or restructuring that did not meet the criteria for Tier I. Additionally, Title I schools that did not meet the criteria for Tier I or II and had not made AYP for two years or were in the lowest 20 percent of schools based on proficiency
could be classified as Tier III3.
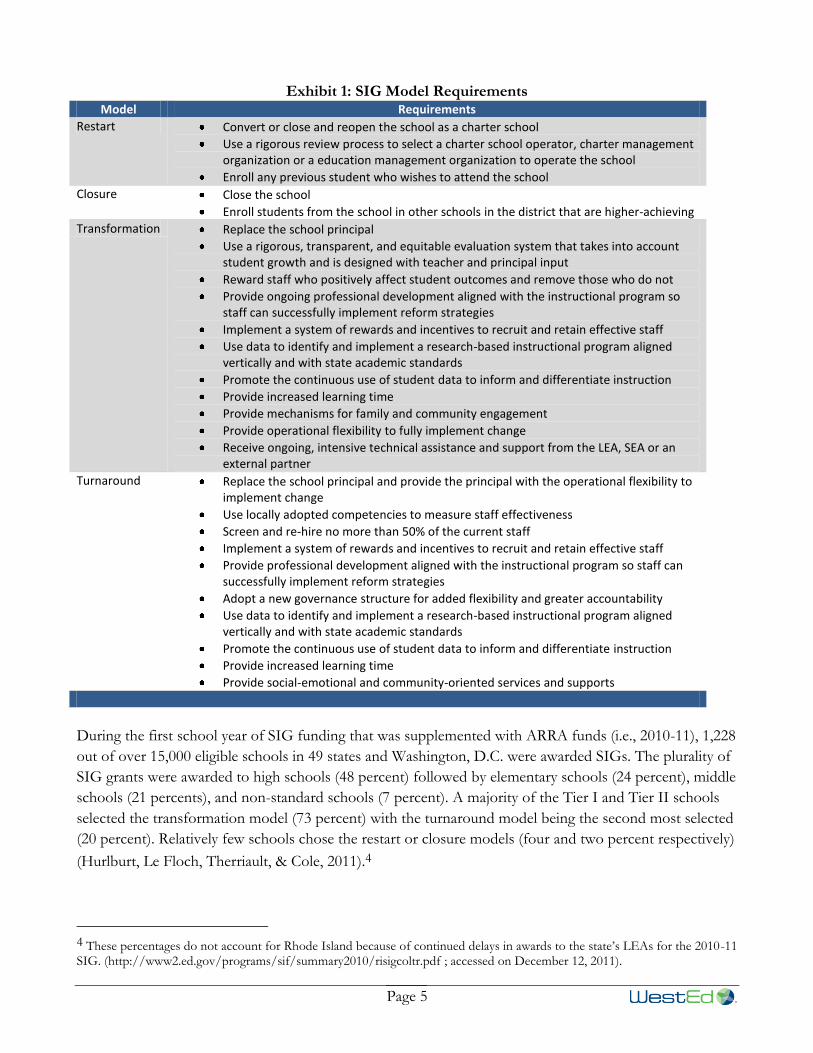
Eligible Tier I and Tier II schools that received funding were required to implement one of four SIG
models: restart, school closure, transformation, or turnaround. Each model includes a specific set of
required as well as permissible activities. Exhibit 1 outlines the required activities for each of the four
models.
3 Tier III sites were only eligible for SIG program funds after all Tier I and Tier II schools within the district were served.
Page 5
Exhibit 1: SIG Model Requirements Model Requirements
Restart Convert or close and reopen the school as a charter school
Use a rigorous review process to select a charter school operator, charter management organization or a education management organization to operate the school
Enroll any previous student who wishes to attend the school
Closure Close the school
Enroll students from the school in other schools in the district that are higher-achieving
Transformation Replace the school principal
Use a rigorous, transparent, and equitable evaluation system that takes into account student growth and is designed with teacher and principal input
Reward staff who positively affect student outcomes and remove those who do not
Provide ongoing professional development aligned with the instructional program so staff can successfully implement reform strategies
Implement a system of rewards and incentives to recruit and retain effective staff
Use data to identify and implement a research-based instructional program aligned vertically and with state academic standards
Promote the continuous use of student data to inform and differentiate instruction
Provide increased learning time
Provide mechanisms for family and community engagement
Provide operational flexibility to fully implement change
Receive ongoing, intensive technical assistance and support from the LEA, SEA or an external partner
Turnaround Replace the school principal and provide the principal with the operational flexibility to implement change
Use locally adopted competencies to measure staff effectiveness
Screen and re-hire no more than 50% of the current staff
Implement a system of rewards and incentives to recruit and retain effective staff
Provide professional development aligned with the instructional program so staff can successfully implement reform strategies
Adopt a new governance structure for added flexibility and greater accountability
Use data to identify and implement a research-based instructional program aligned vertically and with state academic standards
Promote the continuous use of student data to inform and differentiate instruction
Provide increased learning time
Provide social-emotional and community-oriented services and supports
During the first school year of SIG funding that was supplemented with ARRA funds (i.e., 2010-11), 1,228
out of over 15,000 eligible schools in 49 states and Washington, D.C. were awarded SIGs. The plurality of
SIG grants were awarded to high schools (48 percent) followed by elementary schools (24 percent), middle
schools (21 percents), and non-standard schools (7 percent). A majority of the Tier I and Tier II schools
selected the transformation model (73 percent) with the turnaround model being the second most selected
(20 percent). Relatively few schools chose the restart or closure models (four and two percent respectively)
(Hurlburt, Le Floch, Therriault, & Cole, 2011).4
4 These percentages do not account for Rhode Island because of continued delays in awards to the state’s LEAs for the 2010-11 SIG. (http://www2.ed.gov/programs/sif/summary2010/risigcoltr.pdf ; accessed on December 12, 2011).

Page 6
MICHIGAN’S SCHOOL IMPROVEMENT GRANTS
In 2010, Michigan received the seventh-largest ARRA-supplemented SIG grant in the nation, $115 million.
A portion of these funds, $86.25 million, was available for immediate grant awards (Scott, 2011).5 There
were 228 Tier I, II, and III schools in Michigan that were eligible to apply for the SIG grants in Michigan
in 2010, 108 of which were Tier I and II schools. These schools were deemed eligible based on their state
testing data from the 2007-2008 and 2008-2009 school years (Hurlburt, Le Floch, Therriault, & Cole,
2011).
Eighty-four of the eligible schools applied for SIG funds. MDE used a variety of factors in reviewing
applications. First, MDE reviewed student academic performance on the Michigan Educational
Assessment Program (MEAP) and Michigan Merit Examination (MME) in the three preceding academic
years. MDE also reviewed each school’s Comprehensive Needs Assessment tool, or similar instruments or
analysis of school and student needs. Michigan required that applicants submit evidence of engagement on
the part of community stakeholders, including parents, unions, and the local school board. The selected
schools were expected to set rigorous, achievable goals to increase academic performance each year, and to
use interim assessments to provide regular achievement progress reports. For high schools, ACT’s PLAN
and EXPLORE were required for assessment of college readiness.
DESCRIPTION OF MICHIGAN’S 2010 SIG GRANTEES
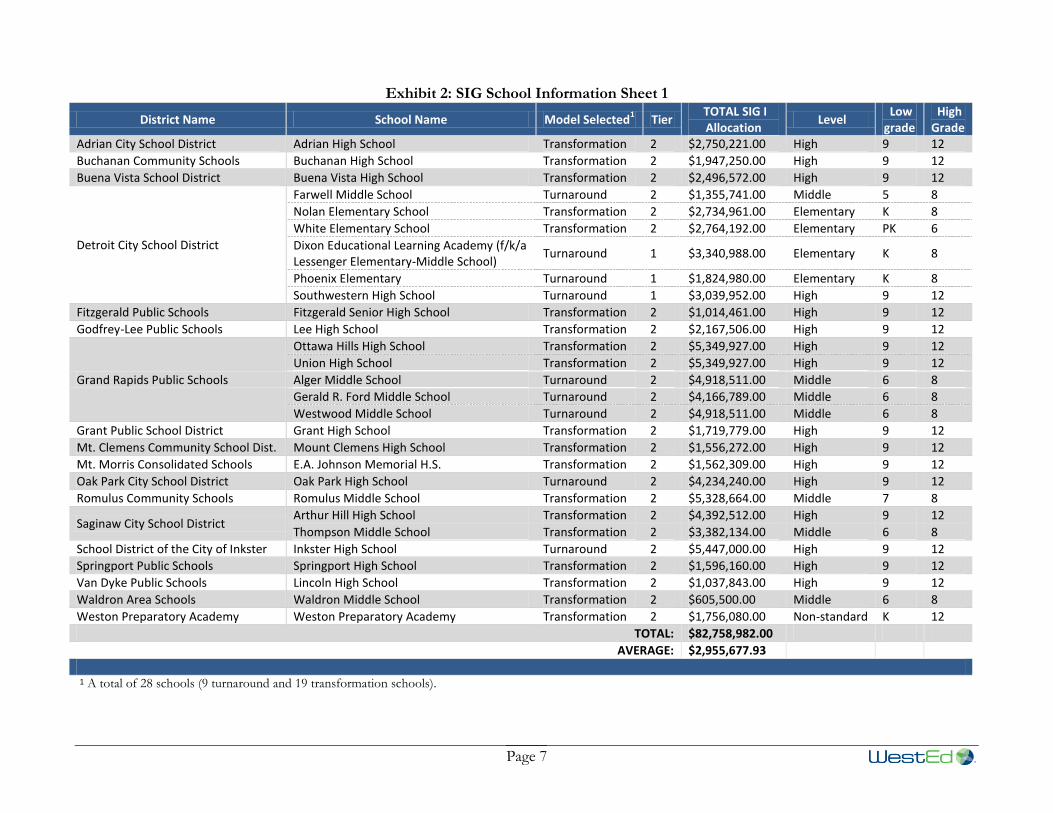
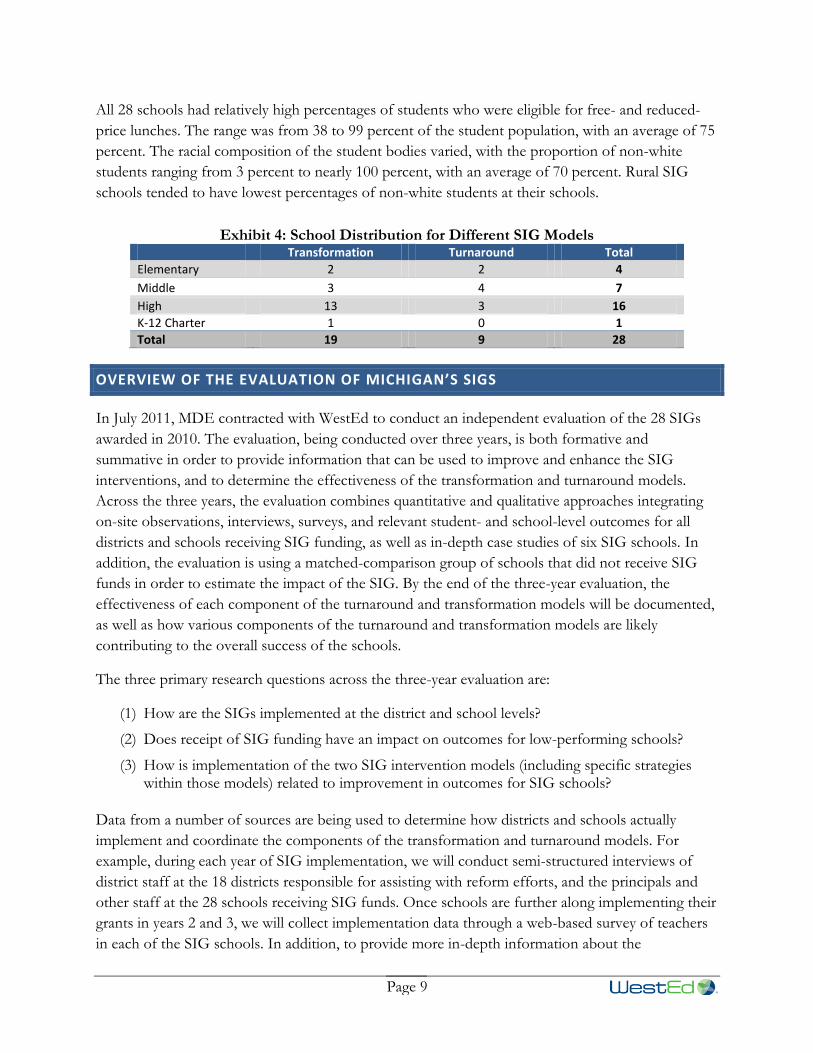
MDE awarded funds to 28 of the 84 applicants in 2010. The characteristics of these schools appear in
Exhibits 2 and 3. The schools are located in 18 school districts. Each district has a single SIG school
except for three urban districts with multiple schools that were awarded SIGs. These include the Detroit
City School District with six schools, Grand Rapids Public Schools with five schools, and Saginaw City
School District with two schools. In addition to the 13 SIG schools in these three urban districts, there are
four other SIG schools in other urban areas, and six and five SIG schools located in suburban and rural
communities, respectively. Individual grants ranged in size from approximately $605,000 to $4.9 million,
with an average grant per school of $3 million, to be expended over three years. Nineteen of the SIG
schools selected the transformation model while nine opted for the turnaround model. Michigan selected
16 high schools, seven middle schools, four elementary schools, and one K-12 charter school. All of the
elementary schools are in a single district. The number of schools at each level that adopted either the
transformation or turnaround model can be found in Exhibit 4.
5 The remainder of the $115 million was rolled into a subsequent round of SIGs awarded to additional schools in 2011, which are not included in the current evaluation.
Page 7
Exhibit 2: SIG School Information Sheet 1
District Name School Name Model Selected1 Tier
TOTAL SIG I Allocation
Level Low grade
High Grade
Adrian City School District Adrian High School Transformation 2 $2,750,221.00 High 9 12
Buchanan Community Schools Buchanan High School Transformation 2 $1,947,250.00 High 9 12
Buena Vista School District Buena Vista High School Transformation 2 $2,496,572.00 High 9 12
Detroit City School District
Farwell Middle School Turnaround 2 $1,355,741.00 Middle 5 8
Nolan Elementary School Transformation 2 $2,734,961.00 Elementary K 8
White Elementary School Transformation 2 $2,764,192.00 Elementary PK 6
Dixon Educational Learning Academy (f/k/a Lessenger Elementary-Middle School)
Turnaround 1 $3,340,988.00 Elementary K 8
Phoenix Elementary Turnaround 1 $1,824,980.00 Elementary K 8
Southwestern High School Turnaround 1 $3,039,952.00 High 9 12
Fitzgerald Public Schools Fitzgerald Senior High School Transformation 2 $1,014,461.00 High 9 12
Godfrey-Lee Public Schools Lee High School Transformation 2 $2,167,506.00 High 9 12
Grand Rapids Public Schools
Ottawa Hills High School Transformation 2 $5,349,927.00 High 9 12
Union High School Transformation 2 $5,349,927.00 High 9 12
Alger Middle School Turnaround 2 $4,918,511.00 Middle 6 8
Gerald R. Ford Middle School Turnaround 2 $4,166,789.00 Middle 6 8
Westwood Middle School Turnaround 2 $4,918,511.00 Middle 6 8
Grant Public School District Grant High School Transformation 2 $1,719,779.00 High 9 12
Mt. Clemens Community School Dist. Mount Clemens High School Transformation 2 $1,556,272.00 High 9 12
Mt. Morris Consolidated Schools E.A. Johnson Memorial H.S. Transformation 2 $1,562,309.00 High 9 12
Oak Park City School District Oak Park High School Turnaround 2 $4,234,240.00 High 9 12
Romulus Community Schools Romulus Middle School Transformation 2 $5,328,664.00 Middle 7 8
Saginaw City School District Arthur Hill High School Transformation 2 $4,392,512.00 High 9 12
Thompson Middle School Transformation 2 $3,382,134.00 Middle 6 8
School District of the City of Inkster Inkster High School Turnaround 2 $5,447,000.00 High 9 12
Springport Public Schools Springport High School Transformation 2 $1,596,160.00 High 9 12
Van Dyke Public Schools Lincoln High School Transformation 2 $1,037,843.00 High 9 12
Waldron Area Schools Waldron Middle School Transformation 2 $605,500.00 Middle 6 8
Weston Preparatory Academy Weston Preparatory Academy Transformation 2 $1,756,080.00 Non-standard K 12
TOTAL: $82,758,982.00
AVERAGE: $2,955,677.93
1 A total of 28 schools (9 turnaround and 19 transformation schools).

Page 8
Exhibit 3: SIG School Information Sheet 2
District Name School Name Model Selected1 Tier
TOTAL SIG I Allocation
Locale Enroll-ment
2
% FRPL
3
% non-white
4
Adrian City School District Adrian High School Transformation 2 $2,750,221.00 Urban fringe 1,111 50.81 32.12
Buchanan Community Schools Buchanan High School Transformation 2 $1,947,250.00 Urban fringe 500 37.68 10.79
Buena Vista School District Buena Vista High School Transformation 2 $2,496,572.00 Rural 359 87.11 98.97
Detroit City School District
Farwell Middle School Turnaround 2 $1,355,741.00 Central city 513 90.00 99.35
Nolan Elementary School Transformation 2 $2,734,961.00 Central city 626 94.06 99.76
White Elementary School Transformation 2 $2,764,192.00 Central city 586 91.92 83.72
Dixon Educational Learning Academy (f/k/a Lessenger Elementary-Middle School)
Turnaround 1 $3,340,988.00 Central city 400 86.86 98.63
Phoenix Elementary Turnaround 1 $1,824,980.00 Central City 652 98.69 73.64
Southwestern High School Turnaround 1 $3,039,952.00 Central city 653 46.83 83.99
Fitzgerald Public Schools Fitzgerald Senior High School Transformation 2 $1,014,461.00 Central city 1,035 66.88 52.42
Godfrey-Lee Public Schools Lee High School Transformation 2 $2,167,506.00 Central city 342 86.48 80.56
Grand Rapids Public Schools
Ottawa Hills High School Transformation 2 $5,349,927.00 Central city 833 87.84 95.64
Union High School Transformation 2 $5,349,927.00 Central city 824 86.32 75.09
Alger Middle School Turnaround 2 $4,918,511.00 Central city 473 92.54 93.88
Gerald R. Ford Middle School Turnaround 2 $4,166,789.00 Central city 342 96.05 96.71
Westwood Middle School Turnaround 2 $4,918,511.00 Central city 329 94.62 79.03
Grant Public School District Grant High School Transformation 2 $1,719,779.00 Rural 637 41.02 18.42
Mt. Clemens Community School Dist. Mount Clemens High School Transformation 2 $1,556,272.00 Urban fringe 534 82.39 73.42
Mt. Morris Consolidated Schools E.A. Johnson Memorial H.S. Transformation 2 $1,562,309.00 Rural 765 63.55 25.07
Oak Park City School District Oak Park High School Turnaround 2 $4,234,240.00 Urban fringe 1,338 59.10 96.81
Romulus Community Schools Romulus Middle School Transformation 2 $5,328,664.00 Urban fringe 553 70.62 65.51
Saginaw City School District Arthur Hill High School Transformation 2 $4,392,512.00 Central city 1,408 76.84 85.28
Thompson Middle School Transformation 2 $3,382,134.00 Central city 948 90.26 81.60
School District of the City of Inkster Inkster High School Turnaround 2 $5,447,000.00 Urban fringe 1,592 65.59 99.29
Springport Public Schools Springport High School Transformation 2 $1,596,160.00 Rural 315 50.45 4.15
Van Dyke Public Schools Lincoln High School Transformation 2 $1,037,843.00 Central city 889 65.82 50.88
Waldron Area Schools Waldron Middle School Transformation 2 $605,500.00 Rural 73 70.51 2.56
Weston Preparatory Academy Weston Preparatory Academy Transformation 2 $1,756,080.00 Central city 471 79.56 99.51
TOTAL: $82,758,982.00 AVERAGE: 75.37 69.89
AVERAGE: $2,955,677.93
1A total of 28 schools (9 turnaround and 19 transformation schools); 2Enrollment in 2010 – 11; 3 percent free-and reduced-price lunch eligible in 2009-10; 4 percent non-
white students in 2009-10.
Page 9
All 28 schools had relatively high percentages of students who were eligible for free- and reduced-
price lunches. The range was from 38 to 99 percent of the student population, with an average of 75
percent. The racial composition of the student bodies varied, with the proportion of non-white
students ranging from 3 percent to nearly 100 percent, with an average of 70 percent. Rural SIG
schools tended to have lowest percentages of non-white students at their schools.
Exhibit 4: School Distribution for Different SIG Models Transformation Turnaround Total
Elementary 2 2 4
Middle 3 4 7
High 13 3 16
K-12 Charter 1 0 1
Total 19 9 28
OVERVIEW OF THE EVALUATION OF MICHIGAN’S SIGS
In July 2011, MDE contracted with WestEd to conduct an independent evaluation of the 28 SIGs
awarded in 2010. The evaluation, being conducted over three years, is both formative and
summative in order to provide information that can be used to improve and enhance the SIG
interventions, and to determine the effectiveness of the transformation and turnaround models.
Across the three years, the evaluation combines quantitative and qualitative approaches integrating
on-site observations, interviews, surveys, and relevant student- and school-level outcomes for all
districts and schools receiving SIG funding, as well as in-depth case studies of six SIG schools. In
addition, the evaluation is using a matched-comparison group of schools that did not receive SIG
funds in order to estimate the impact of the SIG. By the end of the three-year evaluation, the
effectiveness of each component of the turnaround and transformation models will be documented,
as well as how various components of the turnaround and transformation models are likely
contributing to the overall success of the schools.
The three primary research questions across the three-year evaluation are:
(1) How are the SIGs implemented at the district and school levels?
(2) Does receipt of SIG funding have an impact on outcomes for low-performing schools?
(3) How is implementation of the two SIG intervention models (including specific strategies within those models) related to improvement in outcomes for SIG schools?
Data from a number of sources are being used to determine how districts and schools actually
implement and coordinate the components of the transformation and turnaround models. For
example, during each year of SIG implementation, we will conduct semi-structured interviews of
district staff at the 18 districts responsible for assisting with reform efforts, and the principals and
other staff at the 28 schools receiving SIG funds. Once schools are further along implementing their
grants in years 2 and 3, we will collect implementation data through a web-based survey of teachers
in each of the SIG schools. In addition, to provide more in-depth information about the
Page 10
implementation of the SIG models and their components, we will conduct a site visit at each of the
28 schools during year two. During year three, we will identify three schools that have shown the
most progress on SIG implementation and student outcomes, and three schools that have shown
the least progress on implementation and/or declines on student outcomes. We will conduct case
studies at these six schools.
THE CURRENT REPORT
The current report addresses the first research question: How are the SIGs implemented at the district and
school levels? Specifically, this interim report focuses on how the 18 districts and 28 schools have
implemented their transformation and turnaround strategies during the first grant year (2010-11
school year). Subsequent reports will update findings related to the first research question and will
address the second and third research questions as well. This interim report does not address student
academic outcomes at SIG schools because of Michigan’s cycle for assessing achievement for
elementary and middle school students. The MEAP is administered each fall to assess proficiency
for the previous academic year. As a consequence, an assessment of any given elementary or middle
school’s progress on standardized state assessments cannot be ascertained until the following spring.
MEAP scores for the 2010-2011 academic years (the first year that the SIG was implemented) were
not available to analyze for this interim report. Likewise, associations between specific strategies and
improvement in outcomes cannot be addressed without the 2010-11 student outcome data; thus,
they will not be discussed in this report.6
The findings for this first interim report are derived from the analysis of interviews with: district-
level SIG administrators, principals of SIG schools and (to a lesser extent) school-level SIG
specialists (i.e., the primary individual at each school who was responsible for assisting the principal
with SIG administration in the first year of implementation). Where applicable, these findings were
supplemented with data obtained from the state monitors. Details on data collection and analysis
can be found in the Methodology section. Findings focus on the nature of staffing changes made by
SIG recipients in their first year as well as the nature of the activities that were implemented, such as
professional development and coaching activities. The report also focuses on the challenges with
implementing the various components of school improvement efforts. The findings are reported in
the aggregate across all districts and schools, as well as disaggregated by improvement model
(turnaround, transformation) and by school level (elementary, middle, high) when differences among
these subgroups of schools were detected.
6 At this time, MME scores for high school are available for the 17 SIG high schools. However, because high schools compose only a portion of the study sample, the impact of the SIG cannot be estimated at this time. An analysis of SIG impacts based on both MME and MEAP scores will be included in the next report.

Page 11
Methodology
IMPLEMENTATION INDICATORS AND INTERVIEW PROTOCOLS
We created implementation indicators for both the district and school levels based on the core
components that are critical for program implementation as identified by Finsen, Naomi, Blasé, and
Wallace (2007), MDE’s School Improvement Framework, and best practices of school turnaround
as identified by WestEd’s School Turnaround Center. The complete set of indicators is:
Recruiting and staffing
Professional development/training
Coaching
Performance evaluation
Decision support data systems
Facilitative administration
Leadership
System interventions
Stakeholder involvement and accountability
Family/Community engagement
School environment/climate
Curriculum
Instruction
Assessment
Alignment of fiscal and human resources
A complete description of each indicator is in Appendix A. These indicators form the framework
for the entire evaluation and all data collection instruments. Over the course of the three-year
evaluation, each indicator will be addressed comprehensively. Data on these indicators will be
collected in stages throughout the evaluation beginning with the interviews conducted for this first-
year evaluation.
Data collection for the current report focused on the following indicators only: (1) recruiting and
selecting staff; (2) professional development and training; (3) coaching; (4) performance evaluation;
(5) decision support data systems; (6) facilitative administration; (7) leadership; (8) system
interventions; and (9) assessment.

Page 12
Our evaluation focused on these indicators because they represent critical first steps in the adoption
of school reform models. Subsequent data collection will provide information on the complete set
of indicators.
DATA COLLECTION
WestEd staff conducted interviews with district-level SIG administrators, principals of SIG schools,
and school-level SIG specialists. The interview protocols can be found in Appendix B. Interviews
were conducted by WestEd staff with experience collecting data from telephone interviews. For
each interview, the staff member prepared by reviewing the SIG application for that particular
district and school. At the beginning of each interview, the interviewer introduced himself or herself
as an employee at WestEd who had been contracted by MDE to assess the SIGs. Because of the
number of initiatives, state and federal statutory requirements, and funding streams related to school
improvement and persistently lowest-achieving schools, each interviewee was reminded that the
discussion would pertain only to the first year’s implementation of the SIG awarded in 2010.
Interviewees were told that for this particular interview, WestEd was collecting information about
the decisions and strategies that schools and districts undertook in year one related to SIG, and
about any constraints they faced as they worked to implement intervention models intended to
improve student outcomes. They were also told that WestEd was conducting the same interviews
with representatives from each school and district that received SIG funds in 2010. Finally,
respondents were told that the information from these interviews would be reported in the
aggregate to MDE and that specific responses to questions would not be identifiable. Responses to
interview questions were typed during the interviews, and interviewers made additional notes on the
forms after completing each interview.
INTERVIEWS WITH DISTRICT AND SCHOOL STAFF
We conducted telephone interviews with 51 district SIG administrators, SIG school principals, and
SIG school specialists in fall 2011. The number of individuals we interviewed who were in each role
in the 2010-11 school year is displayed in Exhibit 5. Several interviewees filled more than one of
these roles in 2010-11. For two SIG schools, the district administrator was the same individual as the
principal, and the same person acted as the district administrator and the school specialist for two
other SIG schools.
Exhibit 5: Role of Year One Interviewees in SIG Schools and Districts Role(s) of the Interviewee Number
District administrator only 13
School principal only 24
School specialist only 10
District administrator and school specialist 2
District administrator and school principal 2
Total Individuals Interviewed 51

Page 13
DISTRICT SIG ADMINISTRATORS
We also attempted to interview someone from each of the 18 districts. These district SIG
administrators were the individuals who had the primary responsibility for overseeing administration
of the SIGs at the district level in 2010-11. We interviewed 17 of the 18 district administrators. All
but one of these individuals served as a SIG administrator in 2010-11. Ten of the district
administrators reported they were the individual primarily responsible for implementation of the
SIG at the district level, while five district administrators were members of a district-level SIG
administration team. In one district, we spoke to members of a consulting firm that was hired to
organize that district’s SIG effort. In two instances, the district SIG administrator was also the
principal of the SIG school and, in two other cases, the district administrator was also the school’s
SIG specialist. The actual job descriptions of the district administrators varied considerably. Three
of the district administrators were district superintendents, three were assistant superintendents, and
three were in charge of districtwide school transformation or reform efforts. Others described
themselves as SIG coaches, members of the governance team, or administrative consultants. Several
district SIG administrators did not provide their formal title.
The specific roles and duties of the district administrator varied from district to district, with the
majority of the district administrators focused on coaching the school principals on grant
requirements and monitoring the school improvement plan to confirm the plan was implemented as
written. About a third of the administrators wrote the grant, planned timelines, and selected the
model used. Also, approximately one third of the district administrators viewed their role as being
responsible for district oversight of the grant’s budget, coordination between the business office and
the school, and helping prioritize funds and activities. Findings indicated the other major tasks of
the district administrators were attending networking meetings at district, county and state levels,
and being the contact person for the MDE. By networking with others, they were able to learn from
each other and stay abreast of change in SIG grant requirements. Overall the district administrators
informed the school staff of grant requirements by presenting an overview of the grant as well as the
specifics, and helping staff to discern what to do when the rules changed and to remain focused on
increasing student achievement.
SIG SCHOOL PRINCIPALS
WestEd staff attempted to interview individuals who were SIG school principals during 2010-11. In
most cases, this individual was still at the same SIG school. In a few cases, the principal from year
one was no longer at the SIG school. Given that these individuals were in the best position to
discuss SIG implementation at their former schools, we made an additional effort to interview them.
When that was not possible, we interviewed the current principals at the SIG schools. Because the
interviews were conducted in fall 2011, it was assumed that new principals would still be able to
provide valuable information about implementation progress in the previous year.
We interviewed 26 SIG school principals, 20 of whom were principals during 2010-11 and 2011-12
at the same schools. Three principals had been SIG school principals during the 2010-11 school

Page 14
year, but were no longer at the school by time we conducted the interview in fall 2011. One of these
principals had retired, another was on medical leave, and the third had been removed from the
school. Three other current principals had not been the principal during the 2010-11 school year.
We interviewed these individuals nonetheless because we could not reach the former principal and
we determined that the current principals could still provide important information about SIG
implementation in the previous year. We were not able to interview anyone in the role of principal
despite repeated attempt to schedule interviews for two SIG schools.
The majority of the principals stated that their role during 2010-11 was to ensure fidelity of
implementation and monitor implementation of all SIG requirements. Half of the principals
discussed hiring staff to make certain that all personnel and programs were in place to support the
SIG grant. They instituted programs and ideas in the school to meet the goals of the SIG grant, such
as starting professional learning communities, and hiring and monitoring external service providers.
They oversaw different departments within the school to ensure everyone was involved and working
together to meet the goals set by the SIG team. The principals facilitated communication among the
district, the school improvement teams, teachers, students, and parents. A small number of the
principals discussed being involved in reviewing student benchmark data, observing teachers in their
classrooms, and “clearing the path so [teachers and students] can get down to the business of
teaching and learning.” Only three principals mentioned controlling the budget and approving
expenses as roles they played regarding the SIG.
SIG SCHOOL SPECIALISTS
We also attempted to interview the SIG school specialist. In some cases, we were told that the
principal did not choose a designated SIG specialist or those duties were distributed among many
individuals. We interviewed 12 individuals who were SIG specialists during 2010-11 school year.
One school SIG specialist was not available for an interview. Fifteen SIG schools did not have
anyone designated as the primary individual, other than the principal, who was responsible for
coordinating SIG implementation. The majority of the school specialists focused on making sure all
resources, such as external providers, coaching, and professional development, were coordinated
and aligned with the school improvement goals. They accomplished this goal by acting as leadership
coaches to principals, supporting teachers through classroom observations, and providing
professional development. Less than half discussed how their role included ensuring benchmark
assessments were completed, and focusing on monitoring student achievement. They also oversaw
other projects, ensuring that all components fit seamlessly with the school improvement plan and
other reform measures. Several discussed serving as the liaison between the district and the state,
with the focus on communicating SIG grant information from the state back to the school.
BENCHMARKING TOOLS
Michigan is one of eight states to monitor its SIG schools at least once a month in order to assess
progress towards SIG goals (Hurlburt, Le Floch, Therriault, & Cole, 2011). Michigan hired monitors
Page 15
to conduct visits to each SIG school weekly during the beginning of the grant period, and monthly
as the year progressed. The data collected by monitors during site visits were synthesized into
benchmarking tools. The completed benchmarking tools (one for each school, updated three times
annually) were shared by MDE with the evaluation team and were used as a supplemental source of
data on recruiting and selecting staff, and performance evaluation.
DATA ANALYSIS
Interview responses were coded by WestEd staff with experience coding, analyzing, and synthesizing
similar data. We developed a preliminary set of codes for each indicator based on prior research and
by coding samples of the data. Codes were assigned to statements based on these categories. In
order to assure inter-rater reliability, a subset of the indicators was coded by a second researcher.
These codes were then modified as necessary to increase agreement. Then, key themes that were
expressed as words and phrases were listed and counted according to the frequency of their
occurrence within the qualitative data. Using this iterative process, codes were modified and data re-
examined throughout the entire coding process. During analysis, staff examined the codes for
themes and generalizations. This involved taking one piece of data (e.g., one statement in an
interview regarding a specific implementation indicator) and comparing it with others.
Once coding was completed, the data were analyzed and summarized across schools, and by model
(turnaround and transformation) and school level (elementary, middle, and high). Notable
differences between models or school levels are discussed in the findings. Supplemental data from
the benchmarking tool were examined during analysis and synthesis of the interview data.
Page 16
Findings - SIG Implementation in Year One This section of the report presents findings from our analyses of data from the semi-structured
telephone interviews with district and school staff, supplemented with data from the state’s
monitoring benchmarking tool. First, we present a summary of the trends for each indicator we
examined in the first implementation year. We discuss trends in the aggregate across all 28 schools
and 18 districts, highlighting diverging trends between SIG models or school levels where warranted.
The next section discusses these trends in more detail. Data collection during this first phase of the
evaluation focused on the subset of indicators that represent critical first steps in the adoption of
school reform models. Findings in subsequent reports will focus on the full set of indicators and
discuss the trends found for the current indicators over the three years of SIG implementation.
SUMMARY OF THE FINDINGS
DISTRICT AND SCHOOL GOVERNANCE AND LEADERSHIP
We found that SIG schools made appreciable modifications to both governance structures and
leadership by the end of the first year. The most common modifications were changes to school
schedules (namely, extension of the school day) and principals exercising shared or distributed
leadership so that school staff played a larger role in key decisions regarding school policies and
practices. Standing SIG teams often provided the opportunity for shared leadership at the schools.
These teams set the parameters for SIG implementation and operationalized progress indicators. In
addition, a common theme at schools was increased teacher empowerment through creation of
department heads and professional learning communities, and through the provision of professional
development and coaching in areas such as data use and instruction.
Changes in governance and leadership at the district level during the first year were much more
limited compared to the changes at schools. In fact, staff from most districts and schools claimed
that their districts had yet to modify their culture to a degree that significantly improved the
functioning of SIG schools. However, despite the dearth of wholesale structural or procedural
changes at the district level, all schools reported they were allowed some degree of freedom and
flexibility by districts - most commonly in the areas of staff reassignment and scheduling. Principals
felt the most constraints from districts with budgeting and selecting curricula. Finally, districts
reported that they helped empower teachers by offering professional development and fostering
development of professional learning communities.
The most frequently mentioned obstacle to SIG implementation during the first year involved
district bureaucracy. This seemed to be more of an impediment at turnaround schools compared to
transformation schools. Specifically, individuals spoke of delays in the release of SIG funds, as well
as lengthy multi-step approval processes required by the district, both of which led to substantial
delays in obtaining technologies, materials, and staff. Many respondents claimed this was at least part
Page 17
of the reason why SIG plans for the first year were not fully implemented and that they could not
spend all of the funds allocated for that year.
STAFF RECRUITMENT AND SELECTION
By and large, SIG schools met all the fundamental staffing requirements under SIG in the first year.
For example, all SIG schools replaced the school principal and all but one of the turnaround schools
screened their staff and rehired no more than 50 percent of teachers. However, turnaround schools
fell short of filling all non-teaching positions created specifically for the SIG. Generally, we found
that principals of turnaround schools felt their district’s hiring requirements, which gave priority to
retaining teachers on the basis of seniority, prevented them from taking staff performance into
consideration during the hiring process. In addition, turnaround principals expressed frustration that
the SIG awards were announced near (or at) the beginning of the 2010-11 school year, which
prevented them from being able to hire new, non-teaching staff before the start of the school year.
Only about a fifth of all SIG schools could identify very specific critical skills or competencies that
were used - or that they planned to use - for hiring. The use of locally adopted skills and
competencies is required for turnaround schools; however, these were less fully developed or
articulated at turnaround schools compared to transformation schools. In general, districts reported
that they frequently relied on their standard hiring processes when screening staff for SIG schools.
When more specific skills and competencies were described by district school staff, they usually
revolved around technology use in the classroom, data-driven instruction, and the ability to work in
a collaborative environment.
PERFORMANCE EVALUATION, INCENTIVES, AND STAFF REMOVAL
In 2010-11, most districts and schools were developing new staff performance evaluation systems;
very few districts had comprehensively modified their procedures for principal and teacher
evaluation. Only two districts specifically referred to modifying their principal evaluation processes
in response to SIG requirements. At one school, the evaluation process changed to include
reviewing records of actual SIG implementation against grant plans. At the second, the process
changed to include data on student achievement. Findings indicated that most districts and schools
had not yet changed the conditions under which principals and teachers could be removed. There
appeared to be no common elements (e.g., critical skills for removal) across the evaluation systems
for principals. About half of the schools made a performance incentive available to the principal.
When such incentives were available, they were almost always tied to student performance and they
were more likely to be aimed at transformation school principals.
The most common element of the teacher evaluation process in 2010-11 was classroom observation.
Student academic growth was an element at several schools. The district’s standard procedure for
removing teachers was in place at about a third of the schools while new procedures were being
developed (but not in place) at several other schools. Incentives for staff other than principals were
in place at about half the schools with many district and school staff indicating their implementation

Page 18
was delayed due to negotiations between the district and the teachers’ bargaining unit. Indeed,
respondents cited difficulty implementing some SIG requirements (e.g., hiring, scheduling,
implementing plans for performance evaluation, provisions for staff incentives and removal) when
they necessitated negotiations with unions representing teachers and other staff. Teacher unions
were cited as impediments to implementation in seven schools (four in a single large district), with
three of these schools having had adopted the turnaround model.
PROFESSIONAL DEVELOPMENT AND COACHING
SIGs provided for significant training in support of school reform. Overall, we ranked the majority
of schools as either high or medium on the breadth and frequency of professional development and
coaching delivered to both teachers and principals, although professional development and coaching
that principals received covered fewer domains and was less frequent compared to that received by
teachers. In addition, principals and teachers at transformation schools received broader and more
frequent professional development and coaching than staff at turnaround schools.
Teachers received professional development in a variety of areas, including: instructional strategies,
curriculum and content standards, support for struggling students, instruction for English learners,
behavior management, peer observation, data use, and classroom observation. Principals received
professional development that reflected their leadership roles and the fact that they managed SIG
activities. The content of coaching for principals focused on supporting effective SIG
implementation (e.g., aligning curriculum, instruction, and assessments; monitoring teachers;
leadership skills). Coaching content for teachers primarily focused on literacy or mathematics
content.
MONITORING BY DISTRICTS AND SCHOOLS
All schools and districts monitored SIG implementation to some degree; however, the form and
frequency of monitoring varied greatly. Not surprisingly, principals in general tended to engage in
monitoring on a more regular basis than districts, often on a monthly to weekly (and sometimes
daily) basis.
Overall, monitoring by districts focused on faithful implementation of specific SIG components
such as professional development activities and professional learning communities. The methods
that districts used to monitor schools ranged from classroom observations to reviewing reports
submitted by the schools. Most districts monitored on a quarterly or monthly basis. The majority of
districts used student performance on state assessments and benchmarking tools to identify gaps in
the curricula and re-design them. However, five districts reported little or no monitoring in 2010-11.
The majority of schools monitored student learning by using the state assessments as well as
alternative benchmarks, while a minority of schools used only the latter. The majority of schools had
teachers administer benchmark assessments at least three times in the first year and some teachers
administering them even more frequently (e.g., monthly). In addition, the majority of schools often

Page 19
used meetings between the administration and teams of teachers to make data-informed decisions
about instruction. In the first year, principals at turnaround schools appeared to take a somewhat
comprehensive approach to monitoring but focused mainly on student performance as the primary
indicator. Principals at transformation schools, on the other hand, incorporated a greater variety of
implementation indicators including parent and student surveys, and monitored instruction with less
emphasis on student performance as a measure of implementation.
DETAILED DISCUSSION OF THE FINDINGS
GOVERNANCE AND LEADERSHIP
This section provides an overview of modifications that were made to governance and leadership
during the first year of SIG implementation at both the school and district levels. In this section, we
first review shifts in governance and leadership at the SIG schools. This is followed by a discussion
of shifts in these same areas at the district level.
CHANGES IN GOVERNANCE AND LEADERSHIP AT THE SCHOOL LEVEL
Large-scale changes are intended to accompany both the transformation and turnaround models in
SIG schools. Consequently, modifications in both governance and leadership usually are required to
facilitate these changes. School and district staff were asked about any modifications in schools’
organizational structures following adoption of the SIG. The most common modification discussed
was changes to school schedules, namely extension of the school day. In addition, staff at one-fourth
of the schools cited adding staff (mainly experts in data analysis and data-driven decision making),
using existing staff in new capacities, creating professional learning communities, and hiring coaches
and facilitators as significant changes in organizational structure. Finally, staff mentioned that
principals utilized shared or distributed leadership, resulting in major changes. In these cases, shared
leadership included the creation of SIG teams, identification of content team leads or department
heads, or reformulation of governance boards to include teachers, counselors and other
administrative staff.
The creation of a SIG leadership team is one way that school principals can expand and share
leadership, increasing staff input into reforms and changes that are implemented in schools.
Formulation of a standing SIG team provided schools with consistent leadership and decision-
making. Twenty-one schools reported forming teams before or during the first year of the SIG. In
several cases, these were school transition teams that were formed before the SIG award and
maintained after receipt of SIG funding. These teams usually comprised at least one school
administrator (most often the principal or an assistant principal), subject content leaders, grade-level
leaders, or departmental heads. Most of the school-level SIG teams also included other school staff
such a data specialist, special education staff, instructional coaches, or school counselors. Only a few
teams included students, parents, or other stakeholders from the community. The most commonly
reported role of the school-level SIG teams was designing the SIG plan, setting goals for SIG

Page 20
implementation, and creating indicators of progress. Several teams were charged with integrating the
SIG plan with the school improvement plans that preceded SIG. Other schools reported their SIG
teams were responsible for assessing progress towards goals by reviewing data from formative
assessments and other benchmarks, or that they actively supported teachers by planning teacher
professional development, advising instructional initiatives, coaching teachers, or communicating
with their internal professional learning communities.
CHANGES IN GOVERNANCE AND LEADERSHIP AT THE DISTRICT LEVEL
Any major shifts in governance and leadership related to SIGs are expected mainly at the school
level. Schools are the targets of the transformation or turnaround models, and are responsible for
adhering to the models’ requirements. However, because LEAs apply for the grants on behalf of the
schools, the district is expected to provide support to and monitoring of SIG recipients. Because
districts are expected to serve both these functions, both district and school staff were asked about
the extent to which the district modified organizational structures to better support principals and
teachers at SIG schools. The most frequent response from both district and school staff was that the
district had yet to modify its culture to a degree that improved the functioning of the SIG schools.
However, interviewees in a number of districts did report some positive changes. For example,
school staff from about a quarter of the schools mentioned that the district provided coaches and
facilitators in the first year. In addition, other staff reported that a few of the districts had negotiated
with unions so that school staff had more flexibility in scheduling and, less frequently, hiring. Other
school staff noted that the communication process with and requests from the district had been
streamlined. In only one school did the staff feel that the changes initiated by the district (e.g.,
shifting principals between different schools in the district including a SIG school) had negatively
impacted the school.
Similar to modifications in school governance, the formation of a district-level SIG team is one way
in which districts attempt to better fulfill SIG roles. Approximately half of the districts formed a
SIG team with permanent membership to help administer SIG and support SIG schools. These
teams included staff who played a number of other roles in the districts or schools, and almost
always the district superintendent or assistant superintendent as well as the SIG schools’ principal or
assistant principal. A number also included teachers and representatives from external providers. We
found that these district-level SIG teams, in general, acted as liaisons between schools and district
offices. Many also played an administrative role by writing the SIG grant applications or reviewing
the schools’ implementation plans, helping schools interpret the SIG requirements and the necessary
processes and procedures for SIG implementation, and assessing progress in implementation.
However, only a small number of district SIG teams reported playing an active role in monitoring
SIG implementation or student progress on outcomes.
Finally, a little over half of the districts influenced daily instruction at these schools by choosing the
school’s core curricula. Some of these decisions had been made prior to SIG award using the
Michigan or Common Core State Standards, while other districts chose curricula during the first year
of SIG implementation by aligning the curricula with Michigan’s standards, the Common Core State
Page 21
Standards, or the ACT or other college readiness criteria. Although a few districts made decisions
about curricula collaboratively with the SIG schools, a little over half of districts chose schools’
curricula without school-level input. Districts with SIG high schools or that had SIG schools using
the turnaround model tended to take a more active role in curriculum selection.
SHIFTING CONTROL FROM THE DISTRICT TO THE SCHOOL
One way in which a district can modify its culture is by providing schools with more autonomy and
less top-down decision making, which frees the school from a number of constraints usually
imposed by the district. When districts provide schools with more discretion in areas such as
curriculum selection, staff hiring, and scheduling it allows schools to accept more responsibility for
making substantive changes to their own climate, teacher performance, and student academic
outcomes. This section focuses on the extent to which districts allowed SIG schools to work under
minimal constraints.
Through our interviews, we found that all 28 SIG schools were allowed by their districts to exercise
some degree of freedom and flexibility in implementing SIG. A small number of principals reported
that they were able to exercise complete freedom over SIG implementation. One principal reported
there was complete autonomy to run the school as long as the Board and the Superintendent were
kept informed. On the other hand, a small group of principals reported they possessed severely
limited or virtually no freedom over SIG implementation; the majority of these were from one
school district. These limitations were typically related to the school calendar or budget.
More commonly the amount of freedom and flexibility granted by the district fell somewhere in
between the two extremes. The most common flexibility granted school principals was that of
reassigning teachers and staff into other positions, different grade levels, or leadership roles.
Principals reassigned teachers and staff primarily in an effort to benefit students and positively
impact student achievement. Less frequently, principals could also reassign teachers who were
underperforming, or they could create new positions and hire staff such as instructional specialists,
data analysts, English language arts (ELA) teachers, and coaches to assist in areas of need.
Approximately half of the principals had the freedom to change the school schedule. In the majority
of the cases, principals changed the school schedule to allow for extended learning time. Principals
extended the school day, added after school programming and Saturday school programming, and
also increased the school year. The primary reason for changing the schedule was to provide more
intervention and enrichment opportunities to students struggling in English language arts and
mathematics. Respondents discussed implementing intervention courses such as Read 180,
Corrective Reading, Renaissance Learning, and math labs to meet the needs of these students. Some
principals reported making scheduling changes to improve the school environment. For example,
one principal changed the master schedule in order to combat gang fighting at the middle school.
Less than half of the respondents reported that principals had freedom and flexibility with the
budget. Principals who had flexibility with the budget focused on improving teaching and learning

Page 22
by allocating funds to intervention strategies, teacher professional development, technology, and
instructional materials such as ELA books. Some principals also received specific guidance from the
district office on how to manage the SIG budget. The interview results suggest that principals who
had flexibility with the budget became increasingly comfortable with managing SIG, such as
understanding allowable and unallowable use of funds.
Finally, districts also moved away from top-down decision-making by empowering school
stakeholders other than the principal. Ten district administrators (representing 15 schools) stated
that their district helped empower teachers through the district’s direct creation and support of
professional learning communities, allowing teachers to choose the content of district-sponsored
professional development, and providing them the training to interpret and act on student
performance data. Less commonly, districts referred to empowering students and their parents by
allowing them to express their views through surveys. Districts considered this feedback, thus
allowing students and parents to inform and shape school policy.
WORKING WITH EXTERNAL PROVIDERS
Just as shifts in governance and leadership are key components of SIG interventions, so is working
with outside entities that provide schools with systemic interventions where the schools or districts
lack the capacity to do so on their own. The role of the service provider is key in supporting the
work of schools and districts, and clarity about a provider’s role is essential to ensure different
stakeholders are able to hold providers accountable. Like all states, Michigan was required to make
available to districts a list of approved service providers. Michigan was one of 18 states to focus on
providing quality control measures for identifying external providers and one of eight states to
facilitate setting up a support network at a state and regional level of SIG schools to improve
capacity (Hurlburt, Le Floch, Therriault, & Cole, 2011).
We found that the schools in this study used external service providers to help them hire staff,
provide professional development, coach and mentor teachers and principals, and monitor SIG
implementation. The purpose of this section is to describe how external service providers were
selected, the specific services they provided, roles they played in year one, and the relationships
between the SIG recipients and providers.
In Michigan, SIG schools or their districts are required to select external providers. Usually, these
are selected from a pre-approved list. Districts or schools may select a provider not on the list;
however, in these cases, the external provider must go through the MDE approval process. For the
2010-2011 school year, external providers included several Intermediate School Districts and
Regional Educational Service Agencies, for-profit entities (e.g., Pearson, Successline, HOPE
Foundation), and universities (e.g., the University of Michigan, Central Michigan University,
Michigan State University).
Interviewees stated that the district selected external providers for about a quarter of schools.
Reasons given by district administrators for selecting providers included that the district already had

Page 23
a working relationship between the district and the provider, or that those providers would give the
schools the flexibility required to implement the vision outlined in the SIG. Several schools reported
working with multiple external providers simultaneously depending on the providers’ specialty.
The relationship between schools and external providers is key for successful implementation of
services. Several schools reported having an overall positive relationship with their external
provider(s). Respondents shared that external providers established relationships with the school,
were supportive of reform efforts, collaborated with staff at meetings, and held the school
accountable for SIG implementation. However, staff from two turnaround and three
transformations schools indicated the schools were dissatisfied with their external providers.
Respondents reported their external providers were ineffective, offered no support, lacked
communication, and had not met schools’ expectations.
While most SIG recipients did not report changing their providers, there were a few instances where
districts or schools removed one of their original external providers. The few schools who changed
their external provider reported they were unhappy with the services being provided or that the
providers were unresponsive to school requests. In one case, the school shifted focus and therefore
decided to contract with a new provider.
STAFF RECRUITMENT AND SELECTION
Staff recruitment and selection is key to the successful implementation of SIGs in both the
turnaround and transformation models. Both models affect staffing by requiring the replacement of
principals and the implementation of strategies to recruit and retain staff with the specific skills
needed to assist students. The turnaround model goes beyond the requirements of the
transformation model by requiring LEAs to replace at least 50 percent of the teachers at a school
and use locally adopted competencies to measure the effectiveness of staff when screening and
rehiring existing staff and selecting new staff.
This section reviews how SIG recipients approached the process of recruiting and selecting staff.
We begin by examining what we learned about replacing principals, move to a discussion of the
critical skills and locally adopted competencies that were identified as critical when hiring new staff,
and end with a discussion of the extent to which schools rehired existing staff and hired new staff.
Overall, each SIG school met the requirement for replacing the school principal. Regarding the need
to identify locally adopted competences, we found only a few schools that had specifically identified
competencies. Turnaround schools were less successful than transformation schools at identifying
competencies or critical skills, and therefore less successful at selecting new staff based on local
competencies or critical skills. Nonetheless, all but one of the turnaround schools screened their
staff and rehired no more than 50 percent of teachers. Further, while all the classroom teachers were
in place in SIG schools, some SIG positions (e.g., data and community specialist) went unfilled at
both district and school levels.

Page 24
REPLACING PRINCIPALS
Replacing the school principal is a requirement of both the SIG turnaround and transformation
models. Exhibit 6 presents data on replacing principals at SIG schools, showing the school year
when a principal began working at a school. Each school met the requirement for replacing its
principal. In general, most principals (65 percent) have been in their position since the beginning of
the 2010-11 school year. A breakdown by intervention model indicates that since 2010-11, LEAs
replaced principals at 89 percent of turnaround and 53 percent of transformation schools.
Exhibit 6: Principal Replacement by Intervention Model and School Level
Year of Placement
SIG Model School Level Total N (%)
Turnaround N (%)
Transformation N (%)
Elementary N (%)
Middle N (%)
High N (%)
K-12 N (%)
2011-12 1 (11) 2 (11) 1 (25) 1 (14) 1 (6) 0 (00) 3 (11)
2010-11 7 (78) 8 (42) 3 (75) 4 (57) 7 (44) 1 (100) 15 (54)
2009-10 1 (11) 2 (11) 0 (00) 0 (00) 3 (19) 0 (00) 3 (11)
2008-09 0 (00) 4 (21) 0 (00) 2 (29) 2 (13) 0 (00) 4 (14)
2007-08 0 (00) 3 (16) 0 (00) 0 (00) 3 (19) 0 (00) 3 (11)
Total 9 (100) 19 (100) 4 (100) 7 (100) 16 (100) 1 (100) 28 (100)
CRITICAL SKILLS AND LOCALLY ADOPTED COMPETENCIES
SIG requirements call for turnaround schools to use locally adopted competencies to measure the
effectiveness of staff who work to meet the needs of students. This section examines what we
learned from our interviews involving both turnaround and transformation schools.
Interviews with district staff and principals asked respondents to “Describe the staff qualifications,
criteria, and skills identified by the district as critical to SIG-related school improvement efforts.”
The prompt elicited a wide range of responses regardless of the change model guiding reform
efforts at the school. Frequently, districts used their standard hiring practices to screen staff for SIG
schools. Many respondents also often mentioned they sought teachers who were highly qualified,
adding that it is a statewide requirement in Michigan. Charlotte Danielson’s framework for teaching
practice formed a part of hiring rubrics at 25 percent of schools.
While some respondents could only speak about qualifications on a general level, others could speak
of very specific criteria and skills for staff. The more specific areas mentioned reflected important
areas tied to school reform. These areas included knowledge of data use and the ability to work with
technology in the classroom, a desire to work with colleagues, the ability to connect with struggling
students, and the ability to embrace change. Several respondents referred to the importance of staff
being knowledgeable about school reform or the SIG and willingness to both participate in
professional development and work extended hours. Some schools discussed the job demands their
staff must fulfill working at a SIG school, and one school asked its staff to sign a letter of
commitment and agree to comply with the increased job demands of the SIG school.
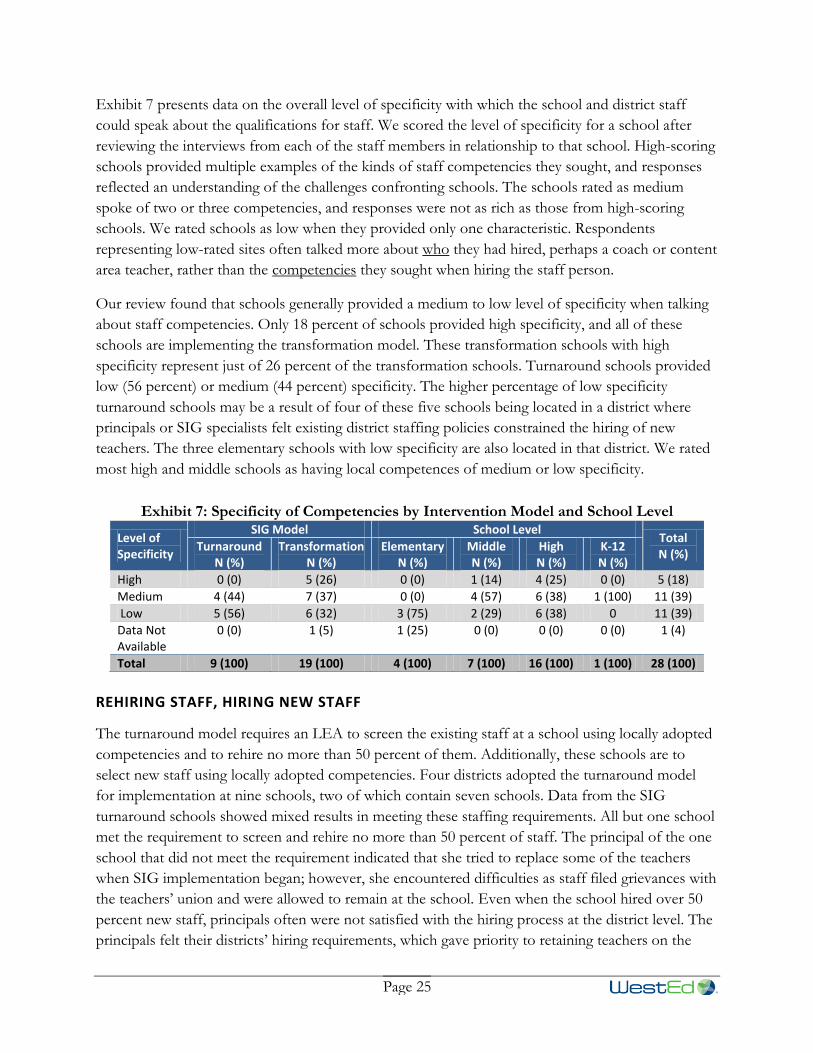
Page 25
Exhibit 7 presents data on the overall level of specificity with which the school and district staff
could speak about the qualifications for staff. We scored the level of specificity for a school after
reviewing the interviews from each of the staff members in relationship to that school. High-scoring
schools provided multiple examples of the kinds of staff competencies they sought, and responses
reflected an understanding of the challenges confronting schools. The schools rated as medium
spoke of two or three competencies, and responses were not as rich as those from high-scoring
schools. We rated schools as low when they provided only one characteristic. Respondents
representing low-rated sites often talked more about who they had hired, perhaps a coach or content
area teacher, rather than the competencies they sought when hiring the staff person.
Our review found that schools generally provided a medium to low level of specificity when talking
about staff competencies. Only 18 percent of schools provided high specificity, and all of these
schools are implementing the transformation model. These transformation schools with high
specificity represent just of 26 percent of the transformation schools. Turnaround schools provided
low (56 percent) or medium (44 percent) specificity. The higher percentage of low specificity
turnaround schools may be a result of four of these five schools being located in a district where
principals or SIG specialists felt existing district staffing policies constrained the hiring of new
teachers. The three elementary schools with low specificity are also located in that district. We rated
most high and middle schools as having local competences of medium or low specificity.
Exhibit 7: Specificity of Competencies by Intervention Model and School Level
Level of Specificity
SIG Model School Level Total N (%)
Turnaround N (%)
Transformation N (%)
Elementary N (%)
Middle N (%)
High N (%)
K-12 N (%)
High 0 (0) 5 (26) 0 (0) 1 (14) 4 (25) 0 (0) 5 (18)
Medium 4 (44) 7 (37) 0 (0) 4 (57) 6 (38) 1 (100) 11 (39)
Low 5 (56) 6 (32) 3 (75) 2 (29) 6 (38) 0 11 (39)
Data Not Available
0 (0) 1 (5) 1 (25) 0 (0) 0 (0) 0 (0) 1 (4)
Total 9 (100) 19 (100) 4 (100) 7 (100) 16 (100) 1 (100) 28 (100)
REHIRING STAFF, HIRING NEW STAFF
The turnaround model requires an LEA to screen the existing staff at a school using locally adopted
competencies and to rehire no more than 50 percent of them. Additionally, these schools are to
select new staff using locally adopted competencies. Four districts adopted the turnaround model
for implementation at nine schools, two of which contain seven schools. Data from the SIG
turnaround schools showed mixed results in meeting these staffing requirements. All but one school
met the requirement to screen and rehire no more than 50 percent of staff. The principal of the one
school that did not meet the requirement indicated that she tried to replace some of the teachers
when SIG implementation began; however, she encountered difficulties as staff filed grievances with
the teachers’ union and were allowed to remain at the school. Even when the school hired over 50
percent new staff, principals often were not satisfied with the hiring process at the district level. The
principals felt their districts’ hiring requirements, which gave priority to retaining teachers on the

Page 26
basis of seniority, “stunted progress” in the words of one principal, preventing principals from
taking staff performance into consideration. By and large, turnaround schools were not successful in
selecting new staff using locally adopted competencies. Examining the benchmarking tools, we
found that only three out of nine turnaround schools fully met this requirement by the end of the
2010-11 school year. The other schools made some progress on this requirement.
Finally, while it appears that all classroom teachers were in place, efforts lagged on filling new
positions created by SIGs at both turnaround and transformation schools. At three schools, the
delay appeared to be at the district level where the LEA was working to fill two positions: the district
literacy specialist and the technology specialist. The remaining sites had yet to fill one or more SIG
positions like a community engagement specialist, a content specialist, a data specialist, or a
counselor. Our interviews indicated that the relatively late notification of SIGs awards impacted how
quickly schools were able to hire staff for SIG positions. In some cases, external providers
functioned in the unfilled SIG roles for at least part of the year.
PERFORMANCE EVALUATION, INCENTIVES, AND STAFF REMOVAL
SIGs provide provisions for the retention of staff who help increase student achievement and
graduation rates at low-performing schools. Two important elements in this process that are
highlighted by SIG requirements include: (1) implementing strategies such as financial incentives and
opportunities for career growth that help recruit and retain staff; and (2) using quality systems to
evaluate the performance of teachers and principals. WestEd gathered data related to these areas
during interviews with district and school staff. We also reviewed the benchmarking tools data
prepared by site monitors regarding the inclusion of student data in staff evaluation and information
about available incentives.
Overall, in 2010-11 districts and schools developed, but did not implement, new systems to
incentivize and evaluate performance. Additionally, systems related to teacher evaluation were
further developed than those for principal evaluation. Frequently used approaches to teacher
evaluation included classroom observation and an evaluation rubric adapted from the work of
Charlotte Danielson. Most schools using the turnaround model worked on adopting sets of
competencies to measure staff effectiveness. Only about a third of schools using the transformation
model included student achievement data in teacher evaluations.
Performance incentives were available to the principal at approximately half of the SIG schools.
When available, such incentives were almost always tied to student performance. Districts and
schools developed incentives for their staff at each school; however, these incentives were
operational at only half of the school sites in 2010-11. The site visits WestEd conducts in 2011-12
will be an opportunity to examine performance evaluation in greater detail to help MDE understand
how systems are being further developed and implemented.

Page 27
PERFORMANCE EVALUATION, INCENTIVES, AND REMOVAL OF PRINCIPALS
Principals, serving as the administrative and instructional leaders at their schools, play a key role in
SIG implementation. We asked how districts monitored the performance of principals and district
staff, with the responses providing insights into principal evaluation. Overall, it appears that very
few districts modified their procedures for principal evaluation to take into account the demands of
SIG implementation. Interviewees referred to modified principal evaluation processes in only two
districts. In one of these districts, the review process at SIG schools included reviewing SIG
implementation against the grant plan. In the second, the district’s approach to principal evaluation
changed for 2010-11 to include data on student achievement. For six districts, interviewees
specifically mentioned that student achievement data were included in the evaluation process. In
addition, three districts used a principal review process that involved assessing how well the
principal achieved a set of goals established at the beginning of the school year.
We examined whether there were specific incentives in place for the principals of SIG schools. For
the 22 schools with available data, we found about half made incentives available to principals. With
one exception, principal incentives were tied to student performance. Incentives made available to
principals were about twice as likely at transformation schools compared to turnaround schools.
Incentives were available to principals at half of the SIG high schools compared to only 29 percent
of SIG middle school principals.
The interviews provided limited insight into the issue of principal removal. Additionally, there
appeared to be no common element (i.e., critical skills for removal) interwoven into the evaluation
systems. For example, five principals told us that student performance is the key element in deciding
whether a principal remains in his or her position; two stated that the superintendent reviews their
performance; and three other principals indicated that the issue of replacing principals is handled
through the districts’ standard employment procedures. Interestingly, six principals stated that they
did not know or were unsure of the criteria for their removal.
PERFORMANCE EVALUATION, INCENTIVES, AND REMOVAL OF TEACHERS
A number of schools used the same approach to evaluating teachers in 2010-11 as they had during
the prior year. Observing teachers in the classroom was the most common system of evaluation, in
place at 12 schools. Six schools used an evaluation rubric based on the work of Charlotte Danielson.
Student academic growth was part of the evaluation process at six transformation schools and a
single turnaround school. The district with this turnaround school adopted a rubric for evaluating
teachers that took multiple criteria into account, including student achievement. Three other districts
with turnaround schools were moving toward implementing a similar process using multiple criteria.
Two additional districts with turnaround schools were negotiating with teachers’ unions to develop
new teacher evaluation systems that included student performance data. Finally, schools using the
turnaround model are to use locally adopted competencies to measures staff effectiveness. We
found that districts with turnaround schools made progress toward meeting this requirement during
2010-11, but only one district completed it by the end of the year.

Page 28
The findings on teacher evaluation systems mirror those on teacher incentives and reward systems.
Most SIG schools are in early stages of putting incentive and reward systems in place. Incentives for
staff other than principals were in place at 13 of the 28 schools. These incentives were usually
monetary and linked to criteria other than student achievement, including: allowing for scheduling
flexibility; serving as a committee leader, department head, or SIG specialist; participating in staff
development; working with students during extended learning time; or collaborating with colleagues.
According to interviewees, frequently the effective date of the incentives had been delayed because
of negotiations with teachers’ bargaining units. A number of schools were developing plans for
linking incentives to student performance in the 2011-12 school year. Overall, 15 schools had
incentives planned that were contingent, at least in part, on student achievement. The only sites that
planned to offer incentives linked exclusively to student achievement were five transformation
schools, four of which were high schools. Ten schools planned to offer incentives related to both
increased student achievement and other criteria. However, most schools were still planning to offer
incentives to staff in 2011-12 based solely on criteria other than student performance.
As Exhibit 8 shows, the district’s standard procedure for removing teachers was in place at ten
schools. Four schools reported using a coaching or developmental approach to removing teachers.
This includes a process that identifies weak or struggling teachers and provides support from SIG
coaches in an effort to improve instruction. Teachers are replaced only after they have received
support and still are not considered effective. Staff from one site claimed teacher removal was not
an issue because they had already replaced 50 percent of their staff.
Exhibit 8: Strategies Involved in Removing Teachers Strategy Number of Schools
Use Standard District Procedures 10
Procedure is Being Developed 7
Use a Coaching or Developmental Approach 4
Teacher Replacement Has Occurred 2
Other 2
Use Transformation Model—Replacement Not an Issue 1
No Information Available 2
Total 28
PROFESSIONAL DEVELOPMENT AND COACHING
Achieving the improvement goals of SIGs requires providing learning supports that strengthen the
practices of both teachers and principals. The requirements for both the turnaround and
transformation SIG models call for staff to receive high quality, job-embedded professional
development aligned with the school’s instructional program. A recent report published by the
National Staff Development Council (NSDC; Darling-Hammond, Wei, Andree, Richardson, &
Orphanos, 2009) highlighted features of effective teacher professional development.
During interviews with school and district staff working with the SIG program, WestEd gathered
data about the extent to which both teachers and principals participated in professional development

Page 29
and received coaching to work effectively with students and implement school reform strategies. We
asked separate questions about both professional development and coaching. The answers we
received showed that some staff use the terms “coaching” and “professional development”
interchangeably. In our analyses, when someone spoke about these terms as if they are synonymous,
we paid attention to the context within which respondents talked about the support received. We
decided whether the support was professional development or coaching based on how the support
was provided.
WestEd staff reviewed the interviews with school and district staff to determine the level of
professional development and coaching the teachers and principals at SIG schools received. We
considered both the range of topic or content areas covered by the professional development and
coaching activities and how frequently they occurred. Based on this holistic review, we rated the
level of professional development and coaching that staff received at each SIG school as either high,
medium, or low.
Schools received high ratings when staff reported participating in professional development that
covered multiple content or topic areas, and coaching occurred on a regular basis. The professional
development could be related to specific areas of instruction, data use, positive behavior supports,
or specific academic interventions. Teachers at some of these schools also participated in
professional learning communities. Some of the coaching also included regular walkthroughs or
“instructional rounds” conducted by principals or staff.
Schools ranked as medium had staff who reported receiving professional development and
coaching. However, these schools differed from high-ranked schools because the supports were not
as extensive. For example, professional development covered fewer topics or teachers received
professional development or coaching less frequently. Schools received a ranking of low on
professional development or coaching when interviews indicated that such support existed, but was
limited.
Overall, 93 percent of schools were rated as either high or medium on teacher professional
development, and 75 percent of schools were rated as either high or medium on principal
professional development. Principals at two schools reported receiving little or no professional
development to support SIG efforts. In addition, schools received lower ratings for coaching than
for professional development. Seventy-five percent of SIG schools were rated either high or
medium on coaching provided to teachers, and 57 percent were rated either high or medium on
coaching provided to principals. These results demonstrate that SIG grants allowed both teachers
and principals to receive a moderate to substantial level of support through a combination of
professional development and coaching.
TEACHER PROFESSIONAL DEVELOPMENT
Exhibit 9 shows the level of professional development teachers received, breaking out the results by
both the SIG model and school level. Teachers received either a high or medium level of

Page 30
professional development at all but one of the 27 schools for which data were available. This finding
means grants allowed significant levels of training in support of school reform. According to
interviewees, the single school that scored low for teacher professional development had difficulty
putting a contract in place with its chosen external provider.
There were some differences in levels of teacher professional development between schools using
the turnaround versus transformation reform models. The percentage of transformation schools
with high levels of professional development was over twice the percentage of turnaround schools,
where teachers more likely received a medium level of professional development. Looking at results
by school level, teachers at high schools were more likely to receive a high level of professional
development than teachers at elementary or middle schools.
Exhibit 9: Level of Teacher Professional Development by
Intervention Model and School Level
Level Turnaround
N (%) Transformation
N (%) Elementary
N (%) Middle N (%)
High N (%)
K-12 N (%)
Total N (%)
High 2 (22) 10 (53) 1 (25) 2 (29) 8 (50) 1 (100) 12 (43)
Medium 7 (78) 7 (37) 1 (25) 5 (71) 8 (50) 0 14 (50)
Low 0 (0) 1 (5) 1 (25) 0 (0) 0 (0) 0 (0) 1 (4)
None 0 (0) 0 (0) 0 (0) 0 (0) 0 (0) 0 (0) 0 (0)
Data Not Available
0 (0) 1 (5) 1 (25) 0 (0) 0 (0) 0 (0) 1 (4)
Total 9 (100) 19 (100) 4 (100) 7 (100) 16 (100) 1 (100) 28 (100)
Teachers received professional development in a variety of areas including: instructional strategies,
curriculum and content standards, supporting struggling students, working with English learners,
behavior management, peer observation, using data, data warehouses, and instructional rounds.
Professional development occurred in multiple venues such as state SIG meetings, conferences both
in and outside Michigan, faculty meetings held prior to the school year or scheduled regularly during
the school year, meetings of school-level professional learning communities, and through peer
observations or instructional rounds. Frequently, a site’s external provider conducted professional
development. However, other providers included a school’s Intermediate School District, the SIG
specialist at the site, or a district-level curriculum or data specialist.
PRINCIPAL PROFESSIONAL DEVELOPMENT
Principals did not receive as extensive professional development as teachers, as shown in Exhibit 10.
Both overall and for each of the reform models, principals were more likely to receive a medium
level than a high or low level of professional development. Unlike with teachers, there were two
principals who indicated they received no professional development whatsoever during 2010-11.

Page 31
Exhibit 10: Level of Principal Professional Development by
Intervention Model and School Level Level
SIG Model School Level Total N (%)
Turnaround N (%)
Transformation N (%)
Elementary N (%)
Middle N (%)
High N (%)
K-12 N (%)
High 0 (0) 4 (21) 0 (0) 0 (0) 4 (25) 0 (0) 4 (14)
Medium 6 (67) 11 (58) 0 (0) 7 (100) 10 (63) 0 (0) 17 (61)
Low 2 (22) 1 (5) 1 (25) 0 (0) 2 (13) 0 (0) 3 (11)
None 1 (11) 1 (5) 1 (25) 0 (0) 0 (0) 1 (100) 2 (7)
Data Not Available
0 (0) 2 (11) 2 (50) 0 (0) 0 (0) 0 (0) 2 (7)
Total 9 (100) 19 (100) 4 (100) 7 (100) 16 (100) 1 (100) 28 (100)
Professional development for principals focused on a range of areas. In many instances, teachers
and principals participated in the same professional development. These areas included topics such
as reading/literacy, mathematics, and other curriculum content areas, instructional strategies, data
use, and technology. Additional professional development for principals included areas that reflected
their roles as leaders at their schools and as managers of SIG activities: monitoring grant
implementation, budgeting, leadership, and teacher evaluation.
Principals received professional development through many different sources including the principal
leadership academies sponsored by MDE. Almost 50 percent of principals mentioned these
meetings, which included an orientation meeting during the SIG application process as well as
regularly scheduled meetings during the school year for SIG grantees. Principals valued these
meetings for providing information they found helpful and allowing them to learn from other
grantees.
External providers were a frequent source of principal professional development, with many
principals specifically referring to the Principal Fellowship at Michigan State University (MSU) that
provided training for principals and other staff members from their sites. Principals received
professional development at other conferences in the state or from a regional group, frequently a
school’s Intermediate School District.
Exhibit 11 provides data comparing the levels of professional development that teachers and
principals received. The exhibit shows that principals received less professional development than
teachers, as noted earlier. Only one-third of principals at schools where teachers participated in a
high level of professional development also had a high level of professional development
themselves. Additionally, there were two schools where the principal reported having no
professional development during 2010-11 even though their teachers received a high level of
professional development.

Page 32
Exhibit 11: Comparison—Levels of Teacher and Principal Professional Development
Level of Teacher Professional Development
Level of Principal Professional Development
Total N (%)
None (%)
Low N (%)
Medium N (%)
High N (%)
Data Not Available
N (%)
High 2 (17) 0 (0) 6 (50) 4 (33) 0 (0) 12 (100)
Medium 0 (0) 3 (21) 11 (79) 0 (0) 0 (0) 14 (100)
Low 0 (0) 0 (0) 0 (0) 0 (0) 1 (100) 1 (100)
Data Not Available 0 (0) 0 (0) 0 (0) 0 (0) 1(100) 1 (100)
Total 2 (100) 3 (100) 17 (100) 4 (100) 2 (100) 28 (100)
TEACHER COACHING
Coaching was an important way that teachers at SIG schools received job-embedded professional
development. Content specialists, usually in literacy or mathematics, provided support at a majority
of schools. Coaches generally worked with teachers individually or in small groups by modeling
teaching practices in the classroom. These coaches would then observe teachers and provide
feedback designed to improve teachers’ skills. Coaches sought to ensure teachers were appropriately
implementing an intervention they learned when participating in professional development.
Teachers at a few schools received support from a data or technology coach. In some instances, a
data coach focused on ensuring teachers could use data to focus their work with students.
We reviewed the interviews with school and district staff to identify the level of coaching teachers
received. Our review as displayed in Exhibit 12 found there was generally a medium or high level of
teacher coaching at SIG schools. Overall, 36 percent had a high level of teacher coaching while
about another 39 percent had a medium level. There was a low level of coaching at only 18 percent
of schools.
Exhibit 12: Level of Teacher Coaching by Intervention Model and School Level
Level SIG Model School Level
Total N (%)
Turnaround N (%)
Transformation N (%)
Elementary N (%)
Middle N (%)
High N (%)
K-12 N (%)
High 1 (11) 9 (47) 0 (0) 3 (43) 7 (44) 0 (0) 10 (36)
Medium 5 (56) 6 (32) 2 (50) 1 (14) 7 (44) 1 (100) 11 (39)
Low 2 (22) 3 (16) 1 (25) 2 (29) 2 (13) 0 (0) 5 (18)
None 0 (0) 0 (0) 0 (0) 0 (0) 0 (0) 0 (0) 0 (0)
Data Not Available
1 (11) 1 (5) 1 (25) 1 (14) 0 (0) 0 (0) 2 (7)
Total 9 (100) 19 (100) 4 (100) 7 (100) 16 (100) 1 (100) 28 (100)
A comparison of schools based on reform model shows a high level of teacher coaching at 47
percent of transformation schools but at only 11 percent of turnaround schools. At turnaround
schools, coaching was more likely at a medium level. An analysis by school level shows high levels of
teacher coaching at a greater percentage of middle and high schools compared to elementary
schools. Elementary schools tended to have medium or low levels of teacher coaching.

Page 33
PRINCIPAL COACHING
Like teachers, principals received coaching to support their work at SIG schools. The content of the
coaching focused on helping principals support effective implementation of the SIG. This area
involved aligning curriculum, instruction, and assessment as well as monitoring instruction in the
classroom. Principals also received coaching on effective leadership and general support for their
positions. External providers, district-level coaches, retired school administrators, and the school-
level SIG specialists coached principals. In some cases, principals indicated they received “coaching”
from their SIG monitor. While perhaps not coaching per se, many principals found their monitors’
input very helpful.
In general, principals received less coaching than the teachers at their schools. As Exhibit 13 shows,
principals received a high level of coaching support at only 18 percent of schools. A medium
amount of coaching occurred at just over twice as many schools. Fourteen percent of principals said
they received no coaching during 2010-11. As with teacher coaching, transformation schools are
more likely than turnaround schools to have high levels of principal coaching.
Exhibit 13: Level Principal Coaching by Intervention Model and School Level
Level
SIG Model School Level Total N (%)
Turnaround N (%)
Transformation N (%)
Elementary N (%)
Middle N (%)
High N (%)
K-12 N (%)
High 0 (0) 5 (26) 0 (0) 0 (0) 5 (31) 0 (0) 5 (18)
Medium 5 (56) 6 (32) 1 (25) 4 (57) 5 (31) 1 (100) 11 (39)
Low 2 (22) 4 (21) 2 (50) 0 (0) 4 (25) 0 (0) 6 (21)
None 1 (11) 3 (16) 0 (0) 3 (43) 1 (6) 0 (0) 4 (14)
Data Not Available
1 (11) 1 (5) 1 (25) 0 (0) 1 (6) 0 (0) 2 (7)
Total 9 (100) 19 (100) 4 (100) 7 (100) 16 (100) 1 (100) 28 (100)
There are apparent differences between middle and high schools related to principal coaching. High
school principals are more likely to receive a high level of coaching compared to middle schools,
where principals more likely received a medium level of coaching. Interestingly, three middle school
principals (43 percent) received no coaching. These schools are located in different districts, and so
it is not indicative of a pattern in one LEA.
There is a stronger relationship between the level of coaching teachers and principals received than
the level of professional development both groups received. As Exhibit 14 shows, 50 percent of the
principals at schools with high levels of teacher coaching also received a high level of coaching
themselves. When teachers received a medium level of coaching, about two-thirds of their principals
received a medium level also. Low levels of teacher coaching were generally related to low levels of
principal coaching.
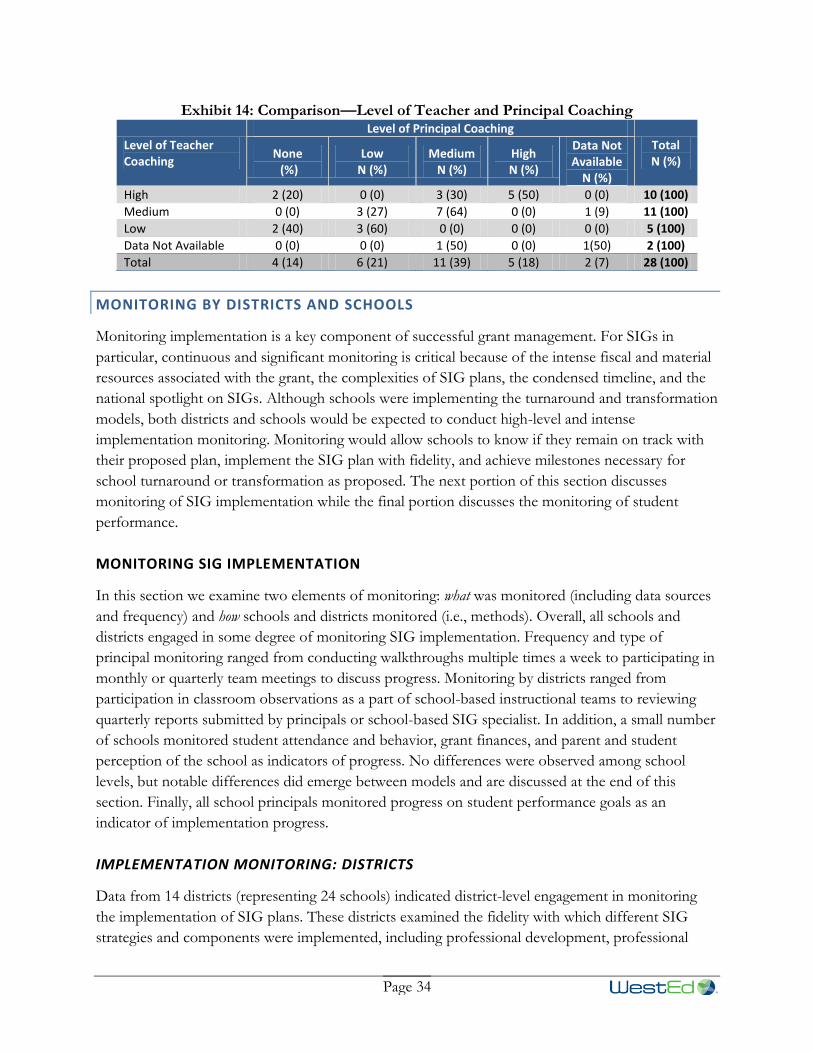
Page 34
Exhibit 14: Comparison—Level of Teacher and Principal Coaching
Level of Teacher Coaching
Level of Principal Coaching
Total N (%)
None (%)
Low N (%)
Medium N (%)
High N (%)
Data Not Available
N (%)
High 2 (20) 0 (0) 3 (30) 5 (50) 0 (0) 10 (100)
Medium 0 (0) 3 (27) 7 (64) 0 (0) 1 (9) 11 (100)
Low 2 (40) 3 (60) 0 (0) 0 (0) 0 (0) 5 (100)
Data Not Available 0 (0) 0 (0) 1 (50) 0 (0) 1(50) 2 (100)
Total 4 (14) 6 (21) 11 (39) 5 (18) 2 (7) 28 (100)
MONITORING BY DISTRICTS AND SCHOOLS
Monitoring implementation is a key component of successful grant management. For SIGs in
particular, continuous and significant monitoring is critical because of the intense fiscal and material
resources associated with the grant, the complexities of SIG plans, the condensed timeline, and the
national spotlight on SIGs. Although schools were implementing the turnaround and transformation
models, both districts and schools would be expected to conduct high-level and intense
implementation monitoring. Monitoring would allow schools to know if they remain on track with
their proposed plan, implement the SIG plan with fidelity, and achieve milestones necessary for
school turnaround or transformation as proposed. The next portion of this section discusses
monitoring of SIG implementation while the final portion discusses the monitoring of student
performance.
MONITORING SIG IMPLEMENTATION
In this section we examine two elements of monitoring: what was monitored (including data sources
and frequency) and how schools and districts monitored (i.e., methods). Overall, all schools and
districts engaged in some degree of monitoring SIG implementation. Frequency and type of
principal monitoring ranged from conducting walkthroughs multiple times a week to participating in
monthly or quarterly team meetings to discuss progress. Monitoring by districts ranged from
participation in classroom observations as a part of school-based instructional teams to reviewing
quarterly reports submitted by principals or school-based SIG specialist. In addition, a small number
of schools monitored student attendance and behavior, grant finances, and parent and student
perception of the school as indicators of progress. No differences were observed among school
levels, but notable differences did emerge between models and are discussed at the end of this
section. Finally, all school principals monitored progress on student performance goals as an
indicator of implementation progress.
IMPLEMENTATION MONITORING: DISTRICTS
Data from 14 districts (representing 24 schools) indicated district-level engagement in monitoring
the implementation of SIG plans. These districts examined the fidelity with which different SIG
strategies and components were implemented, including professional development, professional

Page 35
learning communities, and assessments. A few of them monitored finances as an indicator of
progress on implementation as well. These districts gathered insight into the implementation of SIG
plans from a variety of data sources, including:
SIG coaches
Participation in governance boards and instructional audits
Participation in school-based meetings (with teachers, principals, and other staff)
Classroom observations
Observations of professional development
Reports from school staff or external providers
The frequency with which district staff engaged in monitoring implementation varied depending on
the source of data used for monitoring. Overall, districts that contained approximately two-thirds of
the SIG schools monitored implementation on a monthly to quarterly basis. Some district SIG
coaches were on school grounds on a weekly basis working with principals and teachers in an
ongoing manner: participating in team meetings, observing classrooms, reviewing SIG plans,
reviewing timelines, and generally assisting with the implementation of professional development
strategies. Governance board meetings were held a fixed number of times per year and included
district representation (e.g., governance boards occurred four times per year at five schools). In
some cases, school staff or external providers submitted reports on school progress to the district or
school board on a monthly or quarterly basis.
IMPLEMENTATION MONITORING: SCHOOLS
Data from 23 schools indicated the principal monitored the implementation of the SIG plan. Of the
five for which we do not have evidence of monitoring, in two schools the principal arrived after the
2010-11 school year and was unfamiliar with whether SIG plans were monitored the prior year. In
two other cases, we did not interview school principals. In one school, principal feedback implied a
reliance on district monitoring of SIG implementation instead of site-level monitoring.
Data indicated principals examined fidelity of SIG implementation by focusing on the same SIG
strategies as districts (e.g., professional development, professional learning communities,
assessments, instruction); however, a few principals also examined implementation progress using
indicators of school culture and climate. Five principals noted they surveyed students and/or parents
about their perceptions of school. A few principals also focused on teacher instruction as an
indicator of implementation progress. In one school, the principal indicated they video recorded
teachers during classroom instruction and then, as a group, peer teachers reviewed the videotape and
offered feedback.
Principals gathered insight into SIG implementation not only from the same data sources as
districts, but also from school-based coaches (either instructional coaches or mentors),
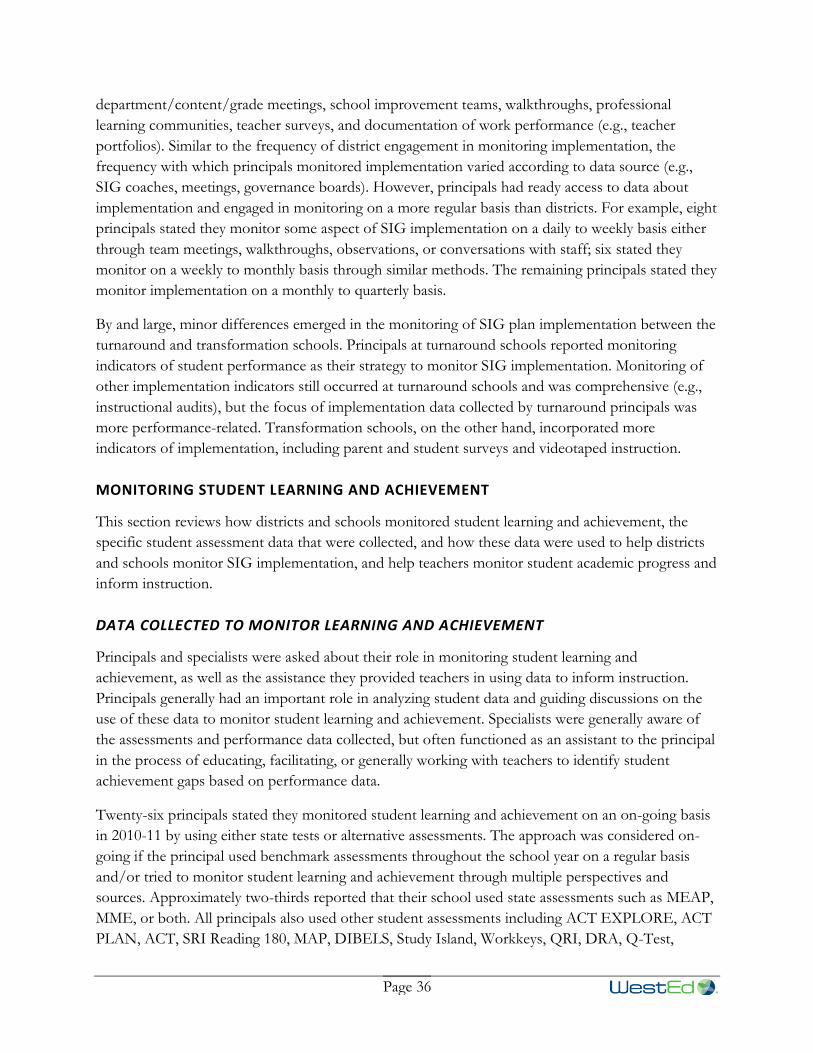
Page 36
department/content/grade meetings, school improvement teams, walkthroughs, professional
learning communities, teacher surveys, and documentation of work performance (e.g., teacher
portfolios). Similar to the frequency of district engagement in monitoring implementation, the
frequency with which principals monitored implementation varied according to data source (e.g.,
SIG coaches, meetings, governance boards). However, principals had ready access to data about
implementation and engaged in monitoring on a more regular basis than districts. For example, eight
principals stated they monitor some aspect of SIG implementation on a daily to weekly basis either
through team meetings, walkthroughs, observations, or conversations with staff; six stated they
monitor on a weekly to monthly basis through similar methods. The remaining principals stated they
monitor implementation on a monthly to quarterly basis.
By and large, minor differences emerged in the monitoring of SIG plan implementation between the
turnaround and transformation schools. Principals at turnaround schools reported monitoring
indicators of student performance as their strategy to monitor SIG implementation. Monitoring of
other implementation indicators still occurred at turnaround schools and was comprehensive (e.g.,
instructional audits), but the focus of implementation data collected by turnaround principals was
more performance-related. Transformation schools, on the other hand, incorporated more
indicators of implementation, including parent and student surveys and videotaped instruction.
MONITORING STUDENT LEARNING AND ACHIEVEMENT
This section reviews how districts and schools monitored student learning and achievement, the
specific student assessment data that were collected, and how these data were used to help districts
and schools monitor SIG implementation, and help teachers monitor student academic progress and
inform instruction.
DATA COLLECTED TO MONITOR LEARNING AND ACHIEVEMENT
Principals and specialists were asked about their role in monitoring student learning and
achievement, as well as the assistance they provided teachers in using data to inform instruction.
Principals generally had an important role in analyzing student data and guiding discussions on the
use of these data to monitor student learning and achievement. Specialists were generally aware of
the assessments and performance data collected, but often functioned as an assistant to the principal
in the process of educating, facilitating, or generally working with teachers to identify student
achievement gaps based on performance data.
Twenty-six principals stated they monitored student learning and achievement on an on-going basis
in 2010-11 by using either state tests or alternative assessments. The approach was considered on-
going if the principal used benchmark assessments throughout the school year on a regular basis
and/or tried to monitor student learning and achievement through multiple perspectives and
sources. Approximately two-thirds reported that their school used state assessments such as MEAP,
MME, or both. All principals also used other student assessments including ACT EXPLORE, ACT
PLAN, ACT, SRI Reading 180, MAP, DIBELS, Study Island, Workkeys, QRI, DRA, Q-Test,

Page 37
Accelerated Reader, Read Naturally, STAR Reading or Math, Pre-Campus, and common classroom
assessments. The ACT tests were most widely utilized; 15 schools indicated they used at least one of
the three ACT tests. One principal stated the school was not able to monitor student learning and
achievement on an on-going basis in 2010-11 because the year was devoted to developing
benchmarks. The frequency with which the assessment data were collected varied across schools.
For example, more than half of the principals noted their teachers administered alternative student
assessments at least twice a year. One administered student tests in a pre- and post-test manner;
eight gave student tests in a pre-, mid-, and post-year approach; and eight others used the tests more
frequently, such as quarterly or twice a month. Finally, some schools also monitored student
attendance and behavior data in addition to student achievement data.
We also asked school representatives how they ensured assessments were aligned to state standards
and curricular content. Respondents from a number of schools indicated they administered
assessments designed to be aligned with the curriculum and state standards so that no additional
action was necessary to ensure alignment. However, an almost equal number of schools indicated
that they took additional steps to ensure alignment of assessments with curriculum and standards.
Feedback revealed a primary method principals used for ensuring alignment was recruiting coaches,
lead teachers, professional learning communities, or department heads to examine the alignment
between assessments and state standards and take the necessary steps to address gaps. Two
principals also reported using outside providers to evaluate assessments, identify gaps in curriculum,
and guide the alignment process.
INSTRUCTIONAL DECISIONS AND GUIDANCE BASED ON STUDENT ASSESSMENT DATA
SIG requirements specify that one of the key reasons that schools are to closely monitor progress in
student learning is so that findings can be used to guide instruction. In all, respondents from 22
schools indicated the principal or specialist played a role in ensuring assessment data informed
instruction: twenty indicated the principal or the specialist shared and discussed data continuously
with teachers about the identified student achievement gaps through organized meetings or group
conversations; nine reported that their school instituted processes (e.g., team or department
meetings) where teachers must review assessment results; and eight indicated their school helped
teachers create lesson plans or action plans based on the areas of need as identified by assessment
data. In addition, several of these schools reported that their principal conducted classroom
observations to ensure the lesson plan was delivered as informed by assessment data, and two other
principals indicated they provided tutoring or one-on-one instruction to the targeted students in
need. Finally, several schools indicated they relied on support software data management services
(e.g., Class-A, DataDirector, SuccessLine, ExamView, Grade Book) to help them compile, manage,
and use data to inform instruction.
THE DISTRICT ROLE IN MONITORING STUDENT LEARNING AND ACHIEVEMENT
Interviews with district administrators indicated that the majority of districts monitored student
learning and achievement on an on-going basis in 2010-11, meaning the district managed and

Page 38
analyzed student assessment data, helped schools and teachers understand the data, and provided
guidance to align assessment data with state standards on a regular basis throughout the school year.
Overall, 12 districts (representing 22 schools) used a variety of benchmarking tools and the state test
results to make data-driven decisions about curriculum, including identifying gaps in curriculum and
re-designing curriculum to be better aligned with state standards. Most of the district SIG
administrators shared their analyses of student assessment data with teachers to help teachers inform
instruction. In addition, four of these districts were continuously working with teachers to develop
formative and summative student assessments or re-align instruction.
The methods used to monitor student learning and achievement data varied across districts. For
example, one district (representing five schools) relied on governance board and instructional audits
to monitor student performance. Other districts (representing eight schools) employed online data
management and assessment systems, such as DataDirector or ExamView, to monitor student
performance, engage teachers with assessment data to improve their understanding of student needs,
and align student assessments with state standards. The other districts seemed to depend on school
staff to track student assessment data and examine trends in student achievement.
Data also indicated that five districts engaged in minimal to no monitoring of student performance.
All five of the schools represented by these districts were high schools implementing the
transformation model.
SUCCESSES AND OBSTACLES IN THE FIRST YEAR OF SIG IMPLEMENTATION
At the end of each interview, individuals were asked about the biggest successes and obstacles in the
first year of the SIG. The most common successes mentioned were changes in school climate and
student attitudes toward school and learning, increased collaboration among stakeholders, and
tangible improvements in student achievement. The most commonly cited barriers to SIG
implementation were district-level bureaucracy, union difficulties, and time constraints. Each of
these is discussed in detail below.
NOTED SUCCESSES IN THE FIRST YEAR
The most common success in year one, mentioned by respondents from 18 schools, was an
appreciable change in school climate and students’ attitudes about school. Most of these comments
were to the effect that both student and teachers attitudes shifted in a positive direction. Specifically,
teachers realized that the SIG meant “it was not business as usual,” schools shifted from a teacher-
focused to a more student-focused environment, teachers took extra time to perform tasks that were
not necessarily part of their job descriptions, and teachers became even more committed to raising
student achievement. For students, this manifested itself in increased engagement in school, more
student-led projects and initiatives, and fewer disciplinary infractions during the first year of SIG
compared to previous years.
Page 39
An additional reported success was an increase in collaboration among stakeholders, which was cited
by interviewees from a dozen schools. Most frequently, this involved collaboration among teachers
and other staff through team teaching, professional learning communities, and information
supports, but also pertained to increased cooperation between administration and staff through their
shared leadership roles.
Another commonly cited success was improvement in student achievement as measured by either
benchmark assessments such as the ACT, or growth on standardized assessments such as the MME.
These improvements, which were noted by respondents from 14 schools, tended to motivate these
schools even in cases when the results were not sufficient for the schools to make AYP or be
removed from the list of persistently lowest-achieving schools.
NOTED OBSTACLES IN THE FIRST YEAR
When asked about the most formidable obstacles in the first year, the most frequent responses
pertained to bureaucratic hurdles or impediments at the district level. In all, respondents
representing 13 SIG schools mentioned these types of problems. This seemed to be more of an
obstacle at turnaround schools, where two-thirds cited this issue compared to transformation
schools where about 40 percent cited it. This may be due to the fact that four of these turnaround
schools were in a single large district. The majority of respondents who identified this barrier spoke
of delays in the release of SIG funds as well as lengthy and multi-step approval processes required
from the district, both of which led to substantial delays in receipt of technologies, materials, and
staff that were in the SIG plans for year one. Thus, their SIG plans were not fully implemented and
that they could not spend down all the funds allocated for the year. For example, one principal
claimed that the district simply would not provide the needed support, that it made unfulfilled
promises regarding purchasing, and that consequently the principal’s flexibility was impeded
tremendously. A school specialist claimed that, at one point during the year, the district considered
closing the SIG school in which she worked and SIG funds were frozen by the district. Even though
the school did not close, the fact that the funds had been frozen meant that only a portion of the
year-one SIG plan was implemented.
These district-related impediments and hurdles also explain the most common theme that emerged
when interviewees were asked about additional supports they would like from MDE. Specifically,
school staff asked for MDE to do more to leverage its authority over districts so that districts would
not impede SIG implementation. Principals or school specialists from eight different schools
provided feedback to this effect, six of which resided in two school districts. Some specific areas of
requested assistance included: MDE helping break down district barriers to purchasing and staffing,
MDE pushing districts to follow the agreements they made in the SIG applications, MDE
encouraging districts to allow principals more freedoms and flexibilities, and MDE taking away
control of the funding from the districts and allowing SIG schools to have more direct control.
In addition to impediments due to district action and inaction, respondents cited difficulty fully
implementing SIG because some requirements necessitated negotiations with unions representing

Page 40
teachers and other staff. Problems due to unions were cited in seven schools (four of them in one
large district) with three of these schools having adopted the turnaround model. That a third of the
schools implementing the turnaround model cited issues with the unions, while only about a fifth of
transformation schools did, is likely due to the fact that the turnaround model requires replacing at
least half of the school staff. For example, one district administrator claimed that the Michigan
Education Association filed so many lawsuits against MDE that the state eventually became more
accommodating to union demands and eased up on some SIG requirements. Further, individuals at
two separate schools mentioned they could not remove teachers or retain successful staff members
due to objections from the Michigan Education Association. One principal contended that he could
not hire the school improvement administrator due to disagreement with the union and eventually
had to have the school board intervene. In contrast with the extent of impediment SIG schools
identified due to district hurdles, only four schools mentioned any hurdles posed by federal- or state-
level restrictions on how SIG funds could be spent.
Time constraints in the first year were cited as an obstacle by 14 respondents. Several individuals
mentioned their school was not informed of their SIG award until very late in the summer, with
several respondents indicating they were notified the day before the school year began or after the
first day of school. According to the district and school staff interviewed, late notification rendered
it difficult or impossible to sufficiently prepare teachers for the amount of change that was expected
to take place during the year. This was especially true for certain aspects of the SIG plans that
required extensive teacher professional development such as those relying heavily on technology.

Page 41
Next Steps The trends discussed in this report provide MDE with a snapshot of SIG implementation during the
first year. Many of these trends are evidence of substantial progress in SIG implementation. These
include the fulfilling basic SIG requirements (e.g., principal replacement), providing professional
development and coaching of moderate to high breadth and frequency, placing teachers in
leadership roles, and empowering school staff. In short, with few exceptions, it was not “business as
usual” at these schools in 2010-11. However, as might be expected, several parts of the SIG were
implemented more fully than others by the end of the first year. In this section, we highlight several
areas where the findings suggested less than full implementation of certain parts of SIG. We will pay
particular attention to these as we carry out the more extensive data collection planned for the
second year.
Development and Use of Critical Skills and Competences. It is still unclear the extent to which both
turnaround and turnaround schools identified, articulated, and used locally adopted competences
and critical skills in their hiring processes. This is a concern because reform at the level and intensity
required by SIGs necessitates that educators and leaders possess competencies that are well matched
with the needs of the school. When competencies and critical skills are not identified (or poorly
articulated) prior to screening, selecting, or rehiring staff, there are implications for progress on
other indicators such as staff evaluation, professional development, and coaching. Some of this lack
of identification and articulation may be due to the fact that schools received notification of SIG
awards relatively late (as late as the beginning of the school year). Also, while there appears to be
progress in developing systems for staff evaluations (more for teachers than principals), the
incentives and removal components of these systems do not always seem well formulated.
A related issue is the alignment of professional development and coaching with schools’ specific
needs. Although there appears to be progress in the delivery of professional development and
coaching, the degree to which they are aligned with schools’ specific needs remains unclear. In
addition, the extent to which professional development and coaching are provided in a coherent and
cogent manner that is integrally linked to the SIG remains to be seen. This could be a function of
poorly articulated competencies and critical skills or lack of a coherent professional development
plan. We will pay particularly close attention to schools’ continued progress on the development of
skills and competences in the second year. We will also look closely at the extent they are used in
subsequent hiring, evaluation, incentives, and removal, and how they align with supports to teachers
and students.
Details on SIG Monitoring Processes. Schools and districts seem to be engaged in monitoring of
both SIG implementation and student outcomes. However, the exact processes for both types of
monitoring (conducted by districts and schools) remain unclear. We will follow up on the
procedures that schools and districts use in order to more closely examine how systematically
schools and districts monitor results, the data collected, and the extent to which the findings from

Page 42
monitoring are used to inform elements of plan implementation (e.g., professional development,
coaching, instruction, and other teacher and student support strategies).
Variation in District Supports Provided to SIG Schools. In the first year, the extent to which
districts supported and facilitated the implementation of SIG seemed limited. For example, several
staff claimed their district had yet to modify its culture to a degree that significantly improved the
functioning of SIG schools. In addition, many principals felt constrained by districts with regards to
budgeting and curricula selection. Also, bureaucratic hurdles at the district level reportedly hindered
full implementation of year one SIG plans in a few districts. All of this is of particular concern
because districts have a key role in not only administering grants but supporting schools in their
implementation. During year two, we plan to follow-up with districts to examine any changes in
leadership, policies, and procedures that increase support to SIG schools
Implementation Progress in Turnaround Schools. Thus far, implementation progress appears to be
more comprehensive in transformation schools compared to turnaround schools. For example,
although most turnaround school requirements appear to have been met (i.e., schools are in
compliance with model requirement), these schools seem to have made less progress on
implementation of indicators (e.g., using critical skills in hiring and staffing), the level of district
support, and providing performance incentives. Seven of the nine turnaround schools were in two
school districts, so model type and district may be somewhat confounded. Nevertheless, during year
two we will continue our documentation of progress in SIG schools and will pay close attention to
progress that might be driven by model components or by the characteristics of schools that were
more likely to adopt one type of model over the other.
Page 43
References Darling-Hammond, L., Wei, R. C., Andree, A., Richardson, N., & Orphanos, S. (2009). Professional
learning in the learning profession: A status report on teacher development in the United States and abroad. Dallas, TX: National Staff Development Council.
Fixsen, D. L., Naoom, S. F., Blasé, K. A., & Wallace, F. (2007). Implementation: The missing link between research and practice. American Professional Society on the Abuse of Children (APSAC) Advisor, 19(1 & 2), 3-11.
Hurlburt, S., Le Floch, K. C., Therriault, S. B., & Cole, S. (2011). Baseline Analyses of SIG Applications and SIG-eligible and SIG-awarded Schools NCEE 2011-4019). Washington, DC: National Center for Education Evaluation and Regional Assistance, Institute of Education Sciences, U.S. Department of Education.
Scott, C. (2011, February). Changing tires en route: Michigan rolls out millions in School Improvement Grants. Washington, DC: Center on Education Policy.
U.S. Government Accountability Office. (2011). School Improvement Grants – Early implementation under way, but reforms affected by short time frames (GAO Publication No. GAO-11-741).

Page 44
Appendices

Page 45
Appendix A: Description of SIG Implementation Indicators
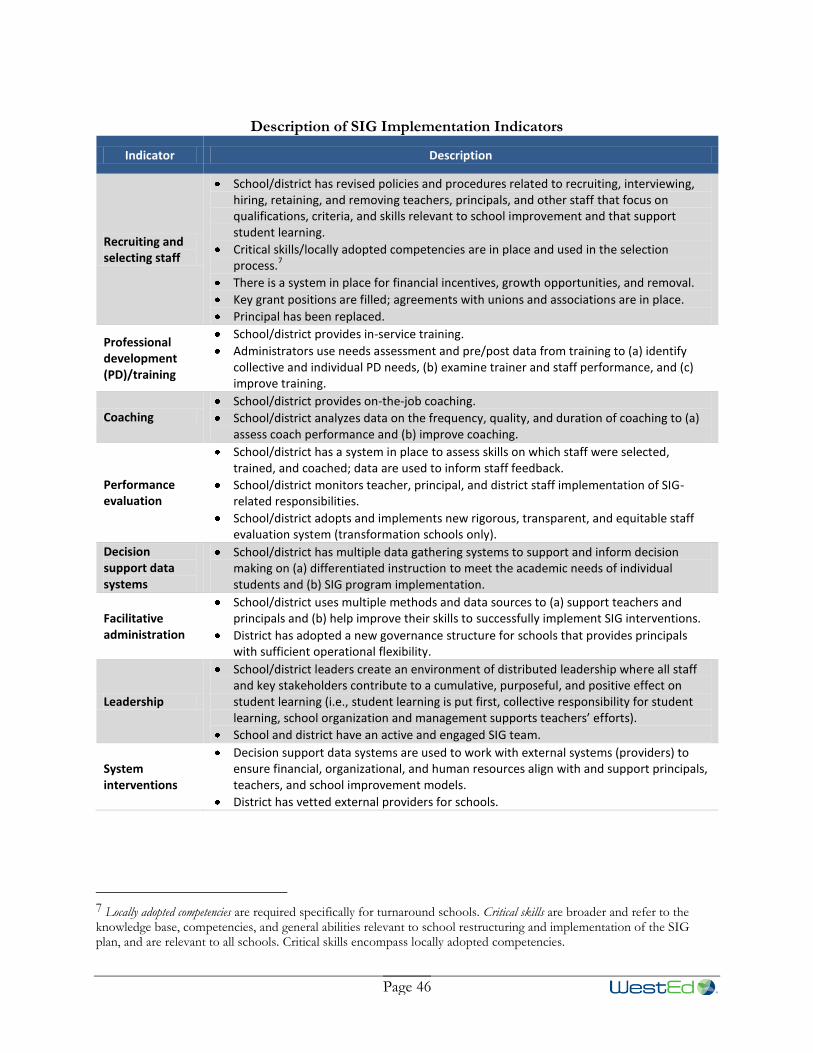
Page 46
Description of SIG Implementation Indicators
Indicator Description
Recruiting and selecting staff
School/district has revised policies and procedures related to recruiting, interviewing, hiring, retaining, and removing teachers, principals, and other staff that focus on qualifications, criteria, and skills relevant to school improvement and that support student learning.
Critical skills/locally adopted competencies are in place and used in the selection process.
7
There is a system in place for financial incentives, growth opportunities, and removal.
Key grant positions are filled; agreements with unions and associations are in place.
Principal has been replaced.
Professional development (PD)/training
School/district provides in-service training.
Administrators use needs assessment and pre/post data from training to (a) identify collective and individual PD needs, (b) examine trainer and staff performance, and (c) improve training.
Coaching School/district provides on-the-job coaching.
School/district analyzes data on the frequency, quality, and duration of coaching to (a) assess coach performance and (b) improve coaching.
Performance evaluation
School/district has a system in place to assess skills on which staff were selected, trained, and coached; data are used to inform staff feedback.
School/district monitors teacher, principal, and district staff implementation of SIG-related responsibilities.
School/district adopts and implements new rigorous, transparent, and equitable staff evaluation system (transformation schools only).
Decision support data systems
School/district has multiple data gathering systems to support and inform decision making on (a) differentiated instruction to meet the academic needs of individual students and (b) SIG program implementation.
Facilitative administration
School/district uses multiple methods and data sources to (a) support teachers and principals and (b) help improve their skills to successfully implement SIG interventions.
District has adopted a new governance structure for schools that provides principals with sufficient operational flexibility.
Leadership
School/district leaders create an environment of distributed leadership where all staff and key stakeholders contribute to a cumulative, purposeful, and positive effect on student learning (i.e., student learning is put first, collective responsibility for student learning, school organization and management supports teachers’ efforts).
School and district have an active and engaged SIG team.
System interventions
Decision support data systems are used to work with external systems (providers) to ensure financial, organizational, and human resources align with and support principals, teachers, and school improvement models.
District has vetted external providers for schools.
7 Locally adopted competencies are required specifically for turnaround schools. Critical skills are broader and refer to the knowledge base, competencies, and general abilities relevant to school restructuring and implementation of the SIG plan, and are relevant to all schools. Critical skills encompass locally adopted competencies.
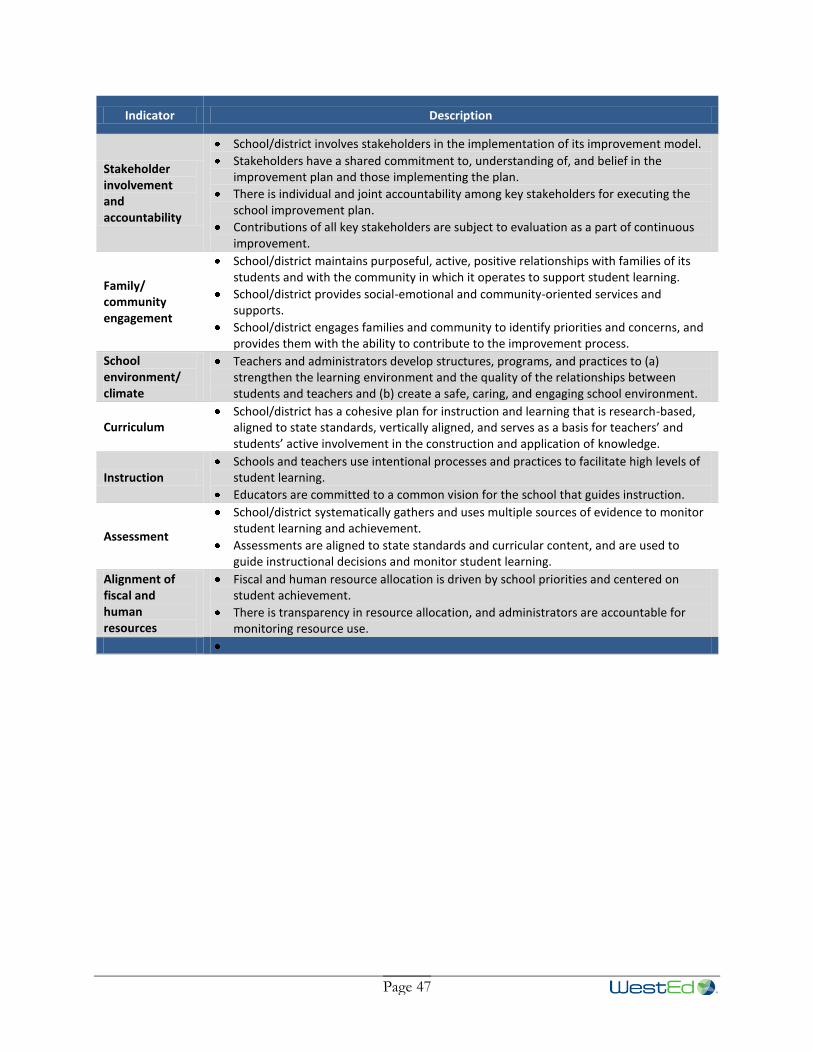
Page 47
Indicator Description
Stakeholder involvement and accountability
School/district involves stakeholders in the implementation of its improvement model.
Stakeholders have a shared commitment to, understanding of, and belief in the improvement plan and those implementing the plan.
There is individual and joint accountability among key stakeholders for executing the school improvement plan.
Contributions of all key stakeholders are subject to evaluation as a part of continuous improvement.
Family/ community engagement
School/district maintains purposeful, active, positive relationships with families of its students and with the community in which it operates to support student learning.
School/district provides social-emotional and community-oriented services and supports.
School/district engages families and community to identify priorities and concerns, and provides them with the ability to contribute to the improvement process.
School environment/ climate
Teachers and administrators develop structures, programs, and practices to (a) strengthen the learning environment and the quality of the relationships between students and teachers and (b) create a safe, caring, and engaging school environment.
Curriculum School/district has a cohesive plan for instruction and learning that is research-based,
aligned to state standards, vertically aligned, and serves as a basis for teachers’ and students’ active involvement in the construction and application of knowledge.
Instruction Schools and teachers use intentional processes and practices to facilitate high levels of
student learning.
Educators are committed to a common vision for the school that guides instruction.
Assessment
School/district systematically gathers and uses multiple sources of evidence to monitor student learning and achievement.
Assessments are aligned to state standards and curricular content, and are used to guide instructional decisions and monitor student learning.
Alignment of fiscal and human resources
Fiscal and human resource allocation is driven by school priorities and centered on student achievement.
There is transparency in resource allocation, and administrators are accountable for monitoring resource use.

Page 48
Appendix B: Telephone Interview Protocols

Page 49
District SIG Administrator Interview Protocol SIG Implementation in Year One
District: Interviewer:
School: Date/Time:
Interviewee:
Introduction
Thanks again for taking the time to speak with me this morning/afternoon. Before we start, I’d
like to provide a little background on our work, and answer any questions you might have for
me.
As you probably know, I work for an independent, not-for-profit research organization called
WestEd, and we are under contract with the Michigan Department of Education to study the
implementation of the American Recovery and Reinvestment Act (or ARRA) -funded School
Improvement Grants (SIG) that were awarded in 2010. And more specifically, we’re collecting
information about the decisions and strategies that schools and districts undertake, and the
constraints they face as they work to implement intervention models intended to improve
student outcomes.
The study is taking place at all 28 schools within the 18 districts in Michigan that were awarded
SIGs in 2010 with funds from the American Recovery and Reinvestment Act (or ARRA).
Like I said, we are studying only the ARRA-funded SIGs that were awarded in 2010. So, in your
district, this includes only [name of school(s) ]. I understand that other schools in your district
may be implementing transformation or turnaround models. However, in our interview today,
please only respond with information about [name of school(s)].
Also, although WestEd is studying all three years of SIG implementation, for this interview I just
want you to focus on how SIG was implemented in its first year – that is, during the 2010-11
school year.
Do you have any questions before we begin?
YOUR TITLE AND ROLE
First, my understanding is that you were the District SIG Administrator in [name of district]
during 2010-11. Is that correct?
Could you explain what your exact duties were with regards to implementing SIG at [name of
school(s)] during 2010-11?

Page 50
RECRUITING AND SELECTING STAFF
Describe the staff qualifications, criteria, and skills (including locally adopted competencies)
identified by the district as critical to SIG-related school improvement efforts.
How were these applied at the school and district levels in 2010-11?
Describe your system of financial incentives and rewards for staff in 20101-11? How did this system
address the removal of teachers and other staff?
What policies and procedures did the district establish to replace principals in turnaround and
transformation schools? How many principals were replaced in 2010-11?
PROFESSIONAL DEVELOPMENT (PD)/TRAINING
Describe the professional development the district provided district staff, principals, and teachers
related to the implementation of SIG strategies. (Probe for alignment with critical
skills/competencies used in hiring staff.)
COACHING
Describe the coaching the district provided principals and teachers to support the implementation of
SIG strategies. (Probe for alignment with critical skills/competencies used in hiring.)
PERFORMANCE EVALUATION
How was the performance of principals and district SIG staff evaluated? (Probe for alignment of
evaluation criteria with critical skills/competencies used for hiring.)
Describe how the district monitored implementation of SIG intervention models. (Probe for focus
on model fidelity.)
DECISION SUPPORT DATA SYSTEM
What data did the district and principals use to inform decisions on SIG implementation?
Were these data gathered systematically? [If yes, probe for frequency.]
FACILITATIVE ADMINISTRATION
How did the district change its organizational structure in 2010-11 to better support schools and
principals? (Probe for new governance structure.)
How did the district ensure principals have freedom and flexibility to implement all aspects of the
SIG model? [Probe for new flexibility in staffing, calendars, scheduling, budgeting.]

Page 51
LEADERSHIP
Describe how the district modified its culture/environment in 2010-11 to increase how, and the
degree to which, staff and key stakeholders contributed to student learning.
Did the district appoint a SIG team in 2010-11? If so, describe the SIG team membership and their
activities that support implementation of the intervention models.
SYSTEM INTERVENTIONS
Describe how schools worked with external providers to support SIG implementation.
CURRICULUM
What role did the district have in identifying curricula used in SIG schools?
How did the district ensure the curricula used were research-based, aligned to state standards, and
vertically aligned?
ASSESSMENT
What was the district’s role in monitoring student learning and achievement in 2010-11?
ADDITIONAL QUESTIONS
Please describe any other support you provided schools during 2010-11 that was not covered in
previous questions.
What would you say were the biggest successes during SIG implementation in 2010-11?
What would you say were the biggest obstacles to implementing SIG plans in 2010-11?
What additional support from MDE would be most helpful in addressing these obstacles?
Any other comments about SIG implementation?

Page 52
SIG School Principal Interview Protocol SIG Implementation in Year One
District: Interviewer:
School: Date/Time:
Interviewee:
Introduction
Thanks again for taking the time to speak with me this morning/afternoon. Before we start, I’d
like to provide a little background on our work, and answer any questions you might have for
me.
As you probably know, I work for an independent, not-for-profit research organization called
WestEd, and we are under contract with the Michigan Department of Education to study the
implementation of the American Recovery and Reinvestment Act (or ARRA) -funded School
Improvement Grants (SIGs) that were awarded in 2010. And more specifically, we’re collecting
information about the decisions and strategies that schools and districts undertake, and the
constraints they face as they work to implement intervention models intended to improve
student outcomes.
The study is taking place at all 28 schools in Michigan that were awarded SIGs in 2010 with
funds from the American Recovery and Reinvestment Act (or ARRA). [name of school] was one
of these 28 schools.
Although WestEd is studying all three years of SIG implementation, for this interview I just want
you to focus on how SIG was implemented in its first year – that is, during the 2010-11 school
year.
Do you have any questions before we begin?
YOUR TITLE AND ROLE
First, my understanding is that you were the School Principal at [name of school] during 2010-11.
Is that correct?
RECRUITING AND SELECTING STAFF
How long have you been principal at this school? Describe your role in SIG implementation in
2010-11.

Page 53
Describe the staff qualifications, criteria, and skills (including locally adopted competencies)
identified as critical to SIG-related school improvement efforts.
How were these applied at your school in 2010-11?
Describe the system of financial incentives and rewards that were available to you as a principal?
How did this system address the removal of principals?
Describe the system of financial incentives and rewards that were available to teachers? How did this
system address the removal of teachers?
PROFESSIONAL DEVELOPMENT (PD)/TRAINING
Describe the professional development you received as a principal to support SIG implementation
in 2010-11 (Probe for alignment with critical skills/competencies used in hiring staff.)
Describe the professional development your teachers received to support SIG implementation in
2010-11. [Probe for needs assessment, pre/post data from training, satisfaction surveys.] (Probe for
alignment with critical skills/competencies used in hiring staff.)
COACHING
Describe the coaching you received as a SIG principal in 2010-11. (Probe for alignment with critical
skills/competencies used in hiring.)
Describe the coaching your teachers received in 2010-11 (Probe for alignment with critical
skills/competencies used in hiring.)
PERFORMANCE EVALUATION
How were teachers and other SIG support staff performance evaluated? (Probe for alignment of
evaluation criteria with critical skills/competencies used for hiring.)
How did the school monitor teacher and staff implementation of SIG responsibilities?
DECISION SUPPORT DATA SYSTEM
What data did you and your teachers use to inform decisions related to SIG implementation and in
providing differentiated instruction?
Were these data collected systematically? [If yes, probe for frequency.]

Page 54
FACILITATIVE ADMINISTRATION
How did the district change its organizational structure in 2010-11 to better support schools and
principals? (Probe for new governance structure.)
How did you change school organizational structure after your received the SIG, to better support
teachers?
During 2010-11, describe any changes to the freedom and flexibility you had as a principal with
respect to implementing the SIG. [Probe for new flexibility in staffing, calendars, scheduling,
budgeting.]
LEADERSHIP
Describe how you modified the school’s culture/environment in 2010-11 to increase how, and the
degree to which, staff and key stakeholders contributed to student learning.
Did you appoint a SIG team in 2010-11? If so, describe the SIG team membership and their
activities that support implementation of the intervention model.
SYSTEM INTERVENTIONS
Describe how your school worked with external providers to support SIG implementation.
ASSESSMENT
What data did you collect to monitor student learning and achievement in 2010-11? (Probe for use
of benchmark and interim assessments.)
How did you ensure assessments are aligned to state standards and curricular content?
How did you ensure assessments are used to guide instructional decisions and monitor student learning?
ADDITIONAL QUESTIONS
Please describe any other support you provided schools during 2010-11 that was not covered in the
previous questions.
What were the biggest successes during SIG implementation in 2010-11?
What were the biggest obstacles to implementing SIG plans in 2010-11?
What additional support from MDE would be most helpful in addressing these obstacles?
Any other comments about SIG implementation?

Page 55
SIG School Specialist Interview Protocol SIG Implementation in Year One
District: Interviewer:
School: Date/Time:
Interviewee:
Introduction
Thanks again for taking the time to speak with me this morning/afternoon. Before we start, I’d
like to provide a little background on our work, and answer any questions you might have for
me.
As you probably know, I work for an independent, not-for-profit research organization called
WestEd, and we are under contract with the Michigan Department of Education to study the
implementation of the American Recovery and Reinvestment Act (or ARRA) -funded School
Improvement Grants (SIGs) that were awarded in 2010. And more specifically, we’re collecting
information about the decisions and strategies that schools and districts undertake, and the
constraints they face as they work to implement intervention models intended to improve
student outcomes.
The study is taking place at all 28 schools in Michigan that were awarded SIGs in 2010 with
funds from the American Recovery and Reinvestment Act (or ARRA). [name of school] was one
of these 28 schools.
Although WestEd is studying all three years of SIG implementation, for this interview I just want
you to focus on how SIG was implemented in its first year – that is, during the 2010-11 school
year.
Do you have any questions before we begin?
YOUR TITLE AND ROLE
First, my understanding is that you were the SIG Specialist at [name of district] during 2010-11. Is
that correct?
Could you explain what your exact duties were with regards to implementing SIG at [name of
school(s)] during 2010-11?

Page 56
RECRUITING AND SELECTING STAFF
How long have you been a SIG specialist at this school? Describe your role in SIG implementation
during 2010-11. (Probe for previous experience/history with the school, the type of support they
provided, to whom they provided it, and whether they received guidance on what support to
provide.).
Describe the staff qualifications, criteria, and skills (including locally adopted competencies)
identified as critical to SIG-related school improvement efforts.
In your opinion, are these the qualifications, criteria, and skills necessary for successful SIG
implementation? Please explain.
Were all key SIG-related positions at the school filled? If not, describe progress as of the end of
2010-11.
PROFESSIONAL DEVELOPMENT (PD)/TRAINING
Describe the professional development that the principal and teachers received to support SIG
implementation in 2010-11. [Probe for needs assessment, pre/post data from training, satisfaction
surveys.] [Probe for alignment with critical skills/competencies used in hiring staff.]
Describe the professional development you received to support SIG implementation. [Probe for
needs assessment, pre/post data from training, satisfaction surveys.] (Probe for alignment with
critical skills/competencies used in hiring staff.)
Describe any professional development you provided to support SIG implementation?
COACHING
Describe the coaching that the principal and teachers received at this school in 2010-11. (Probe for
alignment with critical skills/competencies used in hiring.)
Describe any coaching you received in 2010-11 (Probe for alignment with critical
skills/competencies used in hiring.)
Describe the coaching you provided teachers and principals in 2010-11? (Probe for alignment with
critical skills/competencies used in hiring.)
DECISION SUPPORT DATA SYSTEM
What data did you use to inform decisions related to SIG implementation and the support you
provided teachers?
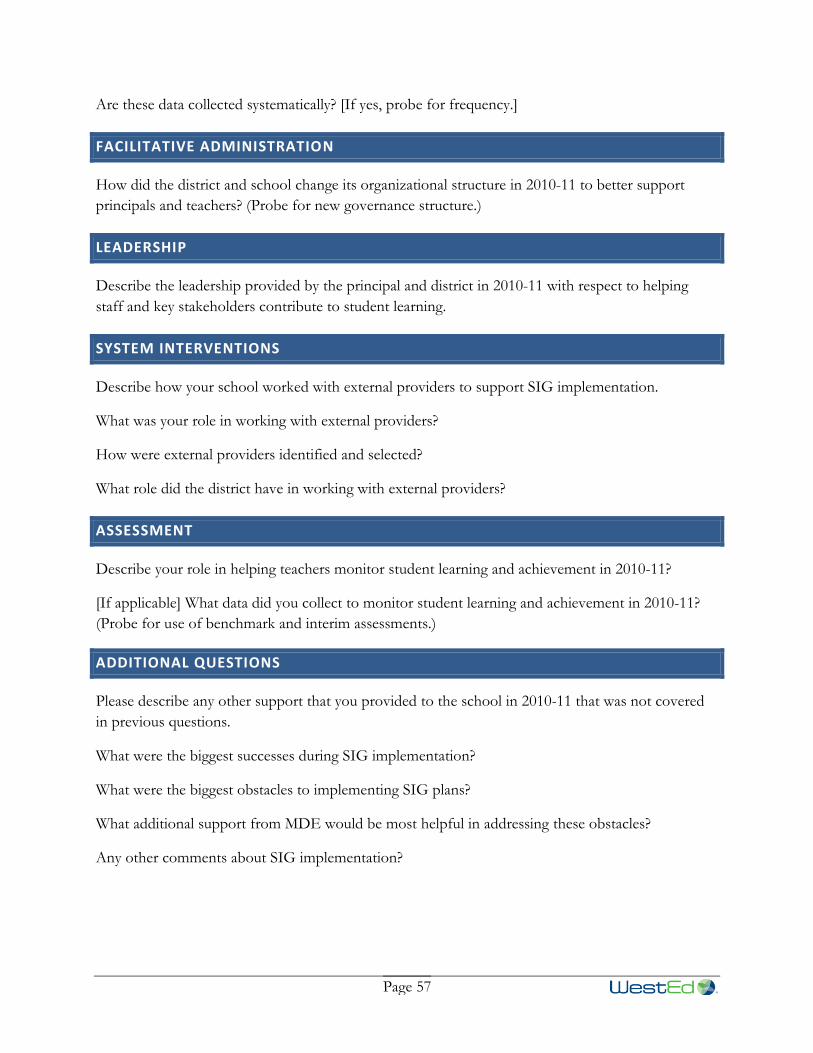
Page 57
Are these data collected systematically? [If yes, probe for frequency.]
FACILITATIVE ADMINISTRATION
How did the district and school change its organizational structure in 2010-11 to better support
principals and teachers? (Probe for new governance structure.)
LEADERSHIP
Describe the leadership provided by the principal and district in 2010-11 with respect to helping
staff and key stakeholders contribute to student learning.
SYSTEM INTERVENTIONS
Describe how your school worked with external providers to support SIG implementation.
What was your role in working with external providers?
How were external providers identified and selected?
What role did the district have in working with external providers?
ASSESSMENT
Describe your role in helping teachers monitor student learning and achievement in 2010-11?
[If applicable] What data did you collect to monitor student learning and achievement in 2010-11?
(Probe for use of benchmark and interim assessments.)
ADDITIONAL QUESTIONS
Please describe any other support that you provided to the school in 2010-11 that was not covered
in previous questions.
What were the biggest successes during SIG implementation?
What were the biggest obstacles to implementing SIG plans?
What additional support from MDE would be most helpful in addressing these obstacles?
Any other comments about SIG implementation?