evaluation of marine water quality – a case study between
TRANSCRIPT

Indian Journal of GeoMarine Sciences Vol. 45(4), April 2016, pp. 517532
Evaluation of marine water quality – a case study between cuddalore and pondicherry coast, India
RM. Narayanan*, K.J. Sharmila & K. Dharanirajan1
Dr. M.G.R Educational and Research Institute, University, Chennai 600 095, India 1Department of Disaster Management, Pondicherry University, Port Blair 744103, India,
*[Email: [email protected], [email protected]]
Received 15 January 2014; revised 13 May 2015
In the present study the physicochemical parameters were determined at 19 stations to assess water quality status. Nitrate concentrations were considerably higher in the hotspots (stations 6, 7, 10 and 16) where the industrial discharges mixes with coastal waters. (5.57.1 µmol/l) compared to near shore coastal waters where values were about 2 µmol/l. The highest concentrations of ammonia are found where bacterial denitrification processes utilise nitrate and thereby generate nitrogen and ammonia along the stations 6,7,10 and 16 due to the decomposition of organic substances from sewage. Total phosphorus concentrations above 0.21 µmol/l and especially or 0.315 µmol/l along the region favor the growth cyanobacteria. From the nutrient data, it was found that during the post monsoon the N/P ratio ranged from a low value of 4.32 (PortoNovo 10 km station) and a high (13.11) nearly reaching the ratio of 16:1 at the Pondicherry hotspot. During the monsoon the N/P ratio at the Cuddalore 10 km station was low (4.23) with a maxima of 11.06 at the Cuddalore hot spot during low tide. The lower N/P ratio observed during the study period indicated that coastal waters from Pondicherry to PortoNovo were nitrogen (N) limited. As per the Central Pollution Control Board standards the observed values were well within the permissible range for the parameters pH 6.58.5 and DO above 4 mg/l. The hotspot locations showed considerable Dissolved Oxygen (DO) under saturation typically about 65% with respect to atmospheric equilibrium.
[Keywords: Marine water quality, Nutrient, Marine Pollution, Oxygen saturation, Redfield ratio]
Introduction Pollution of the marine environment has
become an important issue all over the world due to the ever increasing load of contaminants through various ways such as discharge of industrial effluents, dumping of untreated municipal wastes, old electrical equipments, scrapping of ship wrecks, oil spills, agricultural runoff, residues of persistent organic pollutants, organochlorine pesticides, polyaromatic hydrocarbons and heavy metals1. Rapid industrialization along the river system and the coastal areas has brought considerable decline in the water quality of brackish waters and estuaries (topography, salinity, nutrients, temperature, oxygen) 2. Coastal zones and estuaries are important ecological systems and a resource for a variety of uses. Such areas are subjected to a variety of socio economic drivers, producing increased pressure and impacts which can lead to environmental stress or even affect public health3,4. The increase in nutrient loads produces
ecological impacts over biological communities5, associated mostly with eutrophication process 6, 7.
The prime factor driving coastal pollution is the increase in population and improper management of their wastes which enter the oceans in unacceptable amounts8. Shorelines form the more fertile and productive parts despite of highly complex and variable environmental conditions compared to deep seas. Contrary to the open sea, the changes in quality of coastal waters are much greater. As a result of human activities ~6.5 million tons of litter find their way into the oceans each year. Several million tons of top soil with high fertilizer content is discharged annually into the sea due to soil erosion. Sewage, fertilizer use on land and extensive use of detergents, have almost doubled the rate at which nutrients are added to the coastal zone9. Assessing the concentration of nutrients is important during environmental monitoring, as it is the index of fertility of the sea10. The type of nitrogen found in polluted waters varies. Nitrate is more important
INDIAN J. MAR. SCI., VOL. 45, NO.4 APRIL 2016
518
than ammonia. In poorly oxygenated rivers (resulting from excessive organic matter loading), ammonia may reach 80% of the total dissolved inorganic nitrogen. Urban wastes are higher in ammonia and agricultural runoff is higher in nitrate 11.
Biological productivity and suspended particulates also act as sources and sinks for phosphates. Some of these micronutrients are often utilized faster than they can be replenished where as in regions of high biological activity, low concentrations of nutrients can become a limiting factor. Depletion of DO leads to anoxic environment, which is detrimental to fishes and crustaceans. In aquatic systems, O2 can easily attain 200% of the solubility saturation levels during high primary production, or decrease to zero when bacterial respiration is high 12. The fluctuation in dissolved oxygen concentration is influenced by the time of the day, season, current velocity, temperature and biological characteristics 13. Sewage addition and organic decomposition will deplete dissolved oxygen. The DO levels of less than 2 mg/l is highly detrimental, levels between 2 to 4 mg/l will impart considerable stress.
Nitrite is an intermediate oxidation state of nitrogen, both in the oxidation of ammonia to nitrate and in the reduction of nitrate. Nitrite can enter a water supply system through its use as a corrosion inhibitor in industrial process work. Though nitrate is the ultimate oxidized form of nitrogen, the reactions leading to the oxidation of
nitrogen are very low and hence the presence of significant concentration of lower oxidation states. Ammonia is the only source of nitrogen which may be important to phytoplankton as species composition is partly based on diversity of inorganic species of available nitrogen and which will reflect in an increase in cell numbers and a decrease in species diversity14.The utilization of nutrients such as nitrates and phosphates can be taken as a measure of the productivity of the area.
The accelerated increase in the input of nutrients to the marine system represents the greatest threat to the integrity of marine ecosystem 15, 16, 17. In view of the persistent problem of marine pollution, there is a growing need to monitor the coastal waters towards studying/creating a baseline data on specific oceanographic parameters. Present study aims to evaluate the impact of developmental activities on the coastal water quality with reference to the CPCB standards. The key environmental factors considered in this study include pH, dissolved oxygen, NH4N, NO3N, NO2N and PO4P.
Materials and Methods
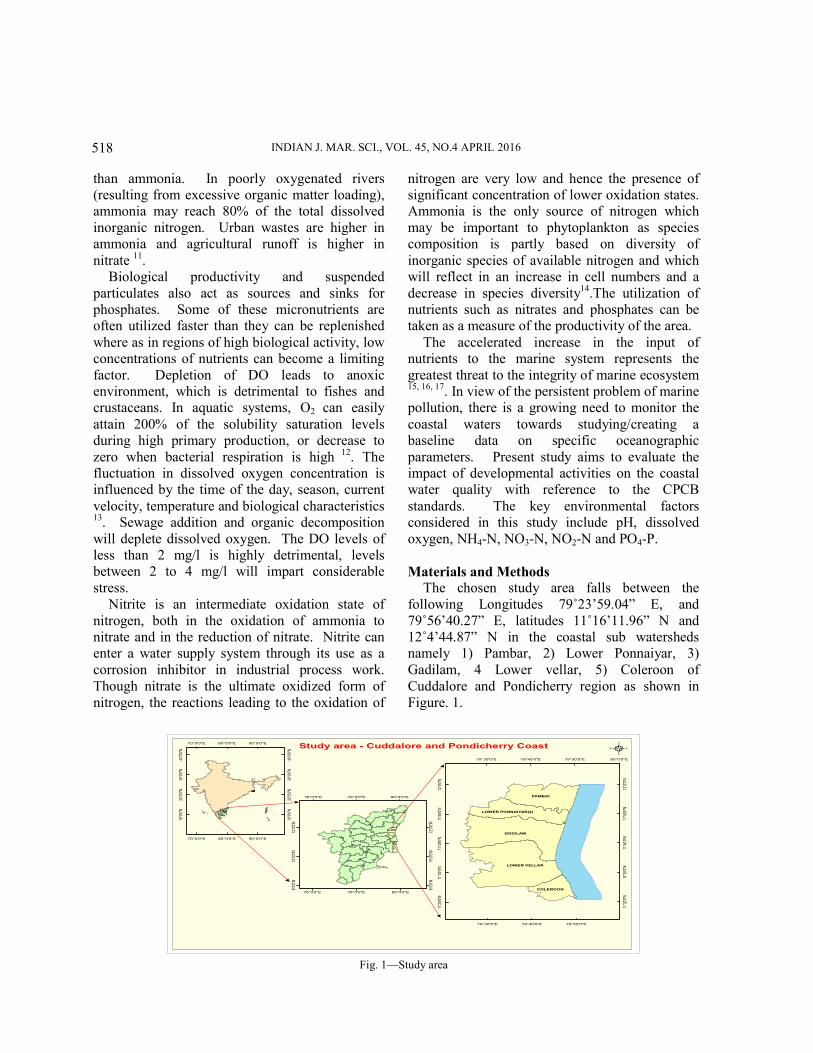
The chosen study area falls between the following Longitudes 79˚23’59.04” E, and 79˚56’40.27” E, latitudes 11˚16’11.96” N and 12˚4’44.87” N in the coastal sub watersheds namely 1) Pambar, 2) Lower Ponnaiyar, 3) Gadilam, 4 Lower vellar, 5) Coleroon of Cuddalore and Pondicherry region as shown in Figure. 1.
70°0'0"E
70°0'0"E
80°0'0"E
80°0'0"E
90°0'0"E
90°0'0"E
10°0
'0"N
10°0
'0"N
20°0
'0"N
20°0
'0"N
30°0
'0"N
30°0
'0"N
40°0
'0"N
40°0
'0"N
76°0'0"E
76°0'0"E
78°0'0"E
78°0'0"E 80°0'0"E
80°0'0"E
8°0'0
"N
8°0'0
"N
10°0
'0"N
10°0
'0"N
12°0
'0"N
12°0
'0"N
GODILAM
LOWER VELLAR
PAMBAI
LOWER PONNAIYAR(2)
COLEROON
79°30'0"E
79°30'0"E
79°40'0"E
79°40'0"E
79°50'0"E
79°50'0"E 80°0'0"E
11°2
0'0"N
11°2
0'0"N
11°3
0'0"N
1 1°3
0'0"
N
11°4
0'0"N
1 1°4
0'0"
N
11°5
0'0"N
1 1°5
0'0"
N
12°0
'0"N
1 2°0
'0"N
Study area - Cuddalore and Pondicherry Coast 5
Fig. 1—Study area

NARAYANAN et al.: EVALUATION OF MARINE WATER QUALITY
519
Insitu data were collected data for monsoon months (Oct, Nov, and Dec) and Post Monsoon (Jan, Feb, March) for the years between 2002 and 2006 as listed in Table 1&2. Water samples at each station (by boat) were taken from the surface layer of the sea (02 m). Each year 24 smaller motorboats were used for the water sampling. The water quality variables were measured using standard methods. All the laboratory analyses were done at the Center for Advanced Studies in
marine biology (Annamalai University) and Institute for ocean management (Anna University). All samples from transects were analyzed at the center for advanced studies in marine biology within 410 hours from sampling18. Sampling network was designed in such a way that all the 19 samples should represent the full range of the conditions expected in the area and is shown in the Figure 2.
Fig. 2—Sampling stations and industries in study area

INDIAN J. MAR. SCI., VOL. 45, NO.4 APRIL 2016
520
Marine water samples were collected at 19 different locations from the coastal and marine waters of Cuddalore and Pondicherry Figure 2 and as given in the table (1). The samples were then analyzed for various water quality parameters. The water samples were collected in oneliter precleaned acid washed polyethylene bottles and were preserved under dry ice, in an icebox, and stored
in the cold room at 4°C in the laboratory until further analysis. In situ measurements were measured using a multiprobe, after calibration with appropriate standards. The water samples were filtered through a 0.45 µm millipore filter and were analyzed for nutrients. Standard procedures and methods were followed 19, 20.
Sampling dates and year
2002 2003 2004 2005 2006
19th Nov
4th &20th Mar 16th Feb
11th Mar 3rd March
10th Nov 9th Oct 11th & 14th Oct.
Sampling Location and Depth of Site
SNo. Sampling Station Station Depth
1 Cuddalore 0.5 km 8.82
2 Cuddalore 1 km 10.42
3 Cuddalore 3 km 13.24
4 Cuddalore 5 km 17.17
5 Cuddalore 10 km 26.26
6 Cuddalore Hot Spot 4.54
7 Cuddalore Hot Spot Left High Tide 3.75
10 Cuddalore Hot Spot Right Low Tide 1.20
11 Pondicherry 0.5 km 7.63
12 Pondicherry 1 km 8.68
13 Pondicherry 3 km 16.59
14 Pondicherry 5 km 20.02
15 Pondicherry 10 km 26.36
16 Pondicherry Hot Spot 8.01
21 Porto nova 0.5 km 9.76
22 Porto nova 1 km 9.88
23 Porto nova 3 km 18.60
24 Porto nova 5 km 26.03
25 Porto nova 10 km 39.25
Results and Discussion In the present study the physicochemical
parameters (pH, salinity, dissolved oxygen, ammonium, nitrite, nitrate and phosphate) were determined at 19 stations to assess water quality
status at Cuddalore along the Pondicherry coast and offshore waters. Surface water quality analysis results are shown in Table 1.

NARAYANAN et al.: EVALUATION OF MARINE WATER QUALITY
521
Table 1—Water quality parameters assessed at 19 stations determined between (2002 and 2006) in monsoon and post monsoon periods between Pondicherry and Cuddalore coast of India
Sl. No.
Name of the Parameter
Monsoon Season Post Monsoon Season
Min Value
(Average)
Max Value
(Average)
Average (4
years)
Standard Deviation
(±)
Min Value
(Average)
Max Value
(Average)
Average (4
years)
Standard Deviation
(±)
1 pH 8.00 8.32 8.19 0.12 8.06 8.48 8.25 0.14 2 Salinity 33.03 33.61 33.23 0.31 33.65 33.04 33.70 0.28 3 DO ml/l 3.60 5.32 4.75 0.60 3.69 5.49 4.95 0.60 4 NH4N (µmol/l) 1.25 4.41 2.05 1.29 0.82 6.34 2.28 2.23 5 NO3N (µmol/l) 1.35 7.10 2.79 2.13 1.25 6.72 2.50 2.05 6 NO2N (µmol/l) 0.20 0.41 0.27 0.07 0.37 0.61 0.45 0.07 7 PO4P (µmol/l) 0.56 1.36 0.77 0.28 0.47 1.27 0.67 0.26
pH
In the present study pH values are in the range of 7.8 to 8.4 for the Monsoon period and 7.97 to 8.50 for the Post Monsoon period. Average pH values during the post monsoon season were 8.25 ± 0.14 and during the monsoon season was 8.19 ±
0.08 for all the sampling stations (hotspots, coastal waters and offshore waters). The average values for each station for both the seasons are shown in the Figure 3.
7.70
7.80
7.90
8.00
8.10
8.20
8.30
8.40
8.50
8.60
16 6 7 10 11 1 21 12 2 22 13 3 23 14 4 24 15 5 25
pH
Hot spots Coastal waters Offshore waters
pH variation in each sample station
Monsoon Post monsoon
Fig. 3— Variations in pH during monsoon and post monsoon for sampling stations
pH for monsoon (data) and post monsoon (data)
are illustrated in Table 2 & Figure 3. Highest pH values were observed in the hotspot locations (near industrial discharges) in the post monsoon period (8.068.48) however the variation was large. Open seawater typically has a pH of (~8.2)21. Thus values near hotspots were generally higher, this might be expected during the post monsoon period. pH values during the monsoon period showed much smaller variation (8.228.32)
and were close to the expected sea water values. Largest interseason differences were surprisingly not observed in the hotspot locations but were observed in nearshore coastal waters. Monsoon values at Stations 11, 1 and 21 were 8.08, 8.03 and 8.00. These values are considerably lower than expected marine pH values and indicate that ocean acidification may be occurring to some degree. Values during the post monsoon period at station 11, 1 and 21 were much higher (8.37, 8.38 and

INDIAN J. MAR. SCI., VOL. 45, NO.4 APRIL 2016
522
8.4) this might indicate greater range of influence from hotspot inputs as a result of increased flushing (reduced estuarine residence time) 22.
Apart from the hotspot sites and three near shore sites highlighted pH variations through the rest of the sampling sites were much smaller
(8.088.28) with the mean in excellent agreement with that published for marine waters (8.2). In these remaining sites no notable differences were observed between the two sampling seasons. Dissolved gases, such as carbon dioxide, and ammonia, appreciably affect pH23.
Table 2— Published literatures for pH values from hotspots and coastal waters (India)
S.No. Name of the Author Location Year pH value
1 Ramachandran 38 Thiruchendur coastal waters 1997 7.3 to 8.2
2 Jonathan et al 43 Hotspots of Cuddalore 2008 8.25 to 8.8
3 Jonathan et al 43 Uppanar River and Coastal waters of Cuddalore
2008 7.7 to 8.3
Salinity
Salinity is a measure of the total concentration of chlorine ions – which uniformly account for 55.0% of total ions. A kilogram, or nearly a litre, of seawater typically contains about 35 g of salts (or 3.5% weight for volume), and therefore has been expressed as 35 ppt. Salinity is tremendously important to fish which must maintain the concentration of dissolved salts in their bodies at a fairly constant level. Through the process of osmoregulation, the fish expends energy in order to maintain this level. Each organism has a range of salinity in which it can grow optimally, and when it is out of this range, excess energy needs to be expended in order to maintain the desired salt concentration.
Salinity data for monsoon and post monsoon periods are illustrated in Figure 4. In the hotspots (impacted by discharges) salinity was higher (33.3533.7) than in the adjacent coastal waters (33.0533.58) and offshore waters (33.0333.09). This was attributed to an excess of evaporation over inputs in the estuarine systems2 which lead to a hyper saline condition compared to adjacent
marine waters. In Tamil, the estuary in the study area is known as Uppanar which translates as ‘salt’. In the hotspots and in near shore coastal waters salinity was consistently higher in the post monsoon period. The results are compared with existing literatures and shown in Table 3.
The mean rainfall for the post monsoon observed at Pondicherry was only 58 mm in contrast to monsoon values (930 mm) (Statistical handbook of Cuddalore and Pondicherry 2005). Obviously this additional freshwater flux leads to a lowering of salinity during the monsoon period. Typically, this was 0.32 salinity units in hotspots and 1.11 salinity units in near shore coastal waters. Again the largest seasonal variation was therefore observed in adjacent coastal waters. Salinity variations in offshore waters were much smaller and at sites 15,5 and 25 there were no obvious differences between the two seasons. The result of the present study reveals that the salinity is in the optimum range for marine fish as cited by Lawson 24.
32.60
32.80
33.00
33.20
33.40
33.60
33.80
16 6 7 10 11 1 21 12 2 22 13 3 23 14 4 24 15 5 25
Salin
ity
PSU
Hot spots Coastal waters Offshore waters
Salinity (PSU) variation in each sample station
Monsoon Post monsoon
Fig. 4 — Variations in salinity during monsoon and post monsoon for sampling stations

NARAYANAN et al.: EVALUATION OF MARINE WATER QUALITY
523
Table 3—Salinity ranges from various published literature for hotspots,
coastal and offshore waters
S.No. Name Location Year Salinity
1 Sasammal et al 44 19°N to 21°N Bay of Bengal (SW monsoon)
1989 23.62 to 32.63
2 World Ocean Atlas 45 Bay of Bengal waters 2002 33 to 34
3 Thadathil et al 46 11° N and 13°N Bay of Bengal open ocean (Nov Dec) 2002 32 to 33
4 Thadathil et al 46 11° N and 13°N Bay of Bengal open ocean (JanFeb) 2002 32 to 34
5 Thadathil et al 46 11° N and 13°N Bay of Bengal coastal waters 2002 33 to 34
6 Prasanna kumar et al 47 Bay of Bengal between 7°N and 20°N along 88°E transect (April May) open ocean
2006 32.5 to 34
7 Prasanna kumar et al 47 Bay of Bengal between 7°N and 20°N along 88°E transect (April May) coastal
2006 ~34
8 Prasanna kumar et al 47 Bay of Bengal between 7°N and 20°N along 88°E transect (Sep Oct) open ocean
2006 34 to 32
9 Prasanna kumar et al 47 Bay of Bengal between 7°N and 20°N along 88°E transect (Sep Oct) coastal
2006 34 to 21
10 Jonathan et al 43 Cuddalore Hotspots 2008 33.06
11 Jonathan et al 43 Uppanar River and Coastal surface waters of Cuddalore coast 2008 31.26 to 35.91
12 Sundaramanickam et al 2 Portonovo and Cuddalore coastal waters 2008 15.3 to 35.5
Dissolved Oxygen
The amount of oxygen dissolved in water is called the dissolved oxygen (DO) concentration and is influenced by water temperature. The dissolved oxygen content of the water is yet another important water quality parameter that indicates the purity of water and also the degree of contamination. Dissolved oxygen analysis measures the amount of gaseous oxygen (O2) dissolved in an aqueous solution. Oxygen gets into water by diffusion from the surrounding air, by aeration (rapid movement), and as a waste product of photosynthesis25. Oxygen saturation is measured as a percentage of the theoretical maximum concentration given the current temperature, pressure and salinity. Dissolved oxygen (DO) is the traditional and ubiquitous indicator of aquatic health. It determines the ability of aerobic organisms to survive and, in most cases, higher dissolved oxygen is better.
DO is typically around 4 to 8 mg/L, or reported as percentage saturation, when 100% is in
equilibrium with the air. Therefore, high percentage saturation occurs during the day due to algal photosynthesis, and low (hypoxic, less than 23 mg/l DO) or anoxic water (around 0 mg/L) occurs late at night due to respiration and decomposition. Well aerated water (in free interchange with air) will be 100% saturated. Regimes of low concentrations in the range between 0 and 30% are often called hypoxic. The state of 0% saturation is called anoxia. Most of the fishes cannot live below 30% saturation. Healthy ocean water is usually 100110% saturated, the slight oversaturation caused by phytoplankton. Oversaturation can sometimes be harmful for organisms and can cause gas bubble disease. When phytoplankton cells die, they sink towards the bottom and are decomposed by bacteria, a process that further reduces DO in the water column. If oxygen depletion progresses to hypoxia, fish kills can occur and invertebrates like worms and clams on the bottom may be killed as well 26.

INDIAN J. MAR. SCI., VOL. 45, NO.4 APRIL 2016
524
In the present study the DO values were determined at 19 stations the values are in the range of 3.96 mg/l to 6.75 mg/l during the monsoon period and 4.5 mg/l to 7.1 mg/l during the post monsoon period obtained results were compared with published data and shown in Table 4. Dissolved oxygen (DO) is shown in Figure 5 (a) mg/l and b) % of saturation. Although DO is typically expressed in mg/l (ppm) the % saturation measurements allows for greater interpretation of environmental control on DO (Barnes per. comm). The hotspot locations showed considerable DO undersaturation (typically about 65% with respect to atmospheric equilibrium. This indicated microbial removal of DO possibly as a consequence of BOD (Biological oxygen demand) associated with industrial discharges. The low DO contents results when industrial effluents pollute the waters and high chemical oxygen demand (COD) of the effluents may result in reduced DO. However, the depletion of Dissolved oxygen is not only related to anthropogenic activity but also due to rivers carrying high organic load (Zingde et al 1986). Introduction of these organic load leads to intense bacterial activity and since the bacteria consume oxygen during their respiration and the DO levels are affected. However, the hotspot locations were located near or in the estuarine environment which have been reported as
heterotrophic27, 28. In heterotrophic environment respiration is
dominant and removes oxygen from the water column. Photosynthesis by algae works in opposition to this process and adds oxygen to the water column. As is evident by the rather low DO saturations in the hotspots these environments appear to be heterotrophic. In near shore and offshore waters DO was much closer to atmospheric equilibrium (100%) indicating that neither respiration nor photosynthesis was dominant. If photosynthesis was a prevalent process in the study site it might be expected the DO values should exceed 100% saturation. Seasonal differences in DO were rather small with slightly higher values observed in the post monsoon period. The higher DO in post monsoon compared to monsoon period in the Bay of Bengal is caused by higher Chla (oxygen release during photosynthesis) at the surface29. Hyperoxia occurs when tissues and organs are exposed to an excess supply of oxygen (O2) or higher than normal partial pressure of oxygen hyperoxia is harmful to tissues30. Hyperoxia can induce oxidative cell damage in the gills within 6 hours of exposure to 200% of atmospheric oxygen levels31 which could affect O2 transport. In this study the hyperoxia is not reported.
Table 4—DO concentrations (mg/l) for hotspots, coastal waters and
offshore waters from published literature
S. No Name Location Year DO (mg/l)
1 Sasammal et al 44 19°N to 21°N Bay of Bengal (SW monsoon) 1989
5.5 to 7.5
2 Gowri 37 Chennai coastal waters 1997 1.1 to 8.1
3 Ingole and Kadam 40 Madh (recreation beaches) 2003 6.3
4 Ingole and Kadam 40 Juhu (recreation beaches) 2003 6.9
5 Ingole and Kadam40 Dadar (recreation beaches) 2003 4.5
6 Ingole and Kadam 40 Gurgaon (recreation beaches) 2003 7.3
7 Ingole and Kadam 40 Mumbai coastal water 2003 4.2
8 Desa et al 48 Interior Gulf of Kuchch 2005 6.05 to 6.86
9 Desa et al 48 Nearshore waters Gulf of Kuchch 2005 3.5 to 7.8
10 Rosamma Stephen et al 49 Bay of Bengal before tsunami 2006 5.25 to 6
11 Rosamma Stephen et al 49 Bay of Bengal after tsunami 2006 2.69 to 10.29
12 Sawant et al 50 Mumbai and Jawaharlal Nehru port 2007 4.3
13 Sawant et al 50 Kasara basin (Mumbai coast) 2007 2.7 ± 0.5

NARAYANAN et al.: EVALUATION OF MARINE WATER QUALITY
525
14 Sawant et al 50 Southern offshore (Mumbai coast) 2007 6.0 ± 1.4
15 Jonathan et al 43 Hotspots Cuddalore 2008 < 2
16 Jonathan et al 43 Uppanar River and Coastal surface waters of Cuddalore coast 2008 5.31
17 Sundaramanickam et al 2 PortoNovo and Cuddalore coastal waters 2008 3.92 to 8.78
0.00
1.00
2.00
3.00
4.00
5.00
6.00
7.00
8.00
16 6 7 10 11 1 21 12 2 22 13 3 23 14 4 24 15 5 25
DO
mg/
l
Hot spots Coastal waters Offshore waters
DO mg/l for each sample station
Monsoon Post monsoon
a
0
10
20
30
40
50
60
70
80
90
100
16 6 7 10 11 1 21 12 2 22 13 3 23 14 4 24 15 5 25
DO
% o
f Sa
tura
tio
n
DO % of Saturation in each sampling station
Post monsoon Monsoon
Hot spots Coastal waters Offshore waters
b
Fig. 5— Dissolved oxygen variations in a) mg/l b) % of saturation
Nitrate and nitrite
The accelerated increase in the input of nutrients to the marine system represents the greatest threat to the integrity of marine ecosystem 15,16, 17. Though nitrogen and phosphorus are the elements of the growth of phytoplankton, micro algae etc. can create problems with an overabundance32. Nitrate is considered as the only thermodynamically stable oxidation state of nitrogen in the presence of oxygen. It is an essential nutrient for primary production and along with phosphorous, considered as the growthlimiting nutrient. Major limiting nutrients for phytoplankton are nitrogen – in the form of ammonium (NH4), nitrite (NO2) and nitrate (NO3)
– and phosphate (PO4). Nitrogen tends to be the limiting nutrient in marine systems, while phosphate is the limiting nutrient in freshwater systems. Nitrogen and phosphorous are needed for cell membranes and for proteins such as enzymes.
In the present study the Nitrate (NO3N) values of Cuddalore and Pondicherry coastal and offshore waters were in the range of 1.1 µmol/l to 7.47 µmol/l in the monsoon period and 1.17 µmol/l to 6.75 µmol/l in the post monsoon period. Nitrate data for monsoon and post monsoon periods are illustrated in Figure 6. Nitrate concentration were considerably higher in the hotspot locations (5.57.1 µmol/l) compared to near shore coastal waters where values were about 2 µmol/l. offshore waters

INDIAN J. MAR. SCI., VOL. 45, NO.4 APRIL 2016
526
were similar to near shore waters with the exception of station 15 where values were notably higher. Higher suspended matter was observed and therefore higher nitrate water column were attributed to sediment resuspension at this site and is indicative of ‘old’ or ‘aged’ nutrients from oceanographic upwelling33,34.
The higher nitrate concentrations observed at the hotspots are not considered high in terms of global estuarine concentrations which can exceed (500 µmol/l) in temperate estuaries27. The nitrate concentrations observed in coastal and offshore waters are well within the limits proposed for near shore marine system as shown in Table 5. In all the cases the nitrate concentrations were slightly higher in the monsoon period than the post monsoon period and this difference was most evident at the hotspot stations. Presumably this reflected greater mobilization of land derived N (possibly through the use of fertilizers) because of
higher rainfall during this season. The Nitrite (NO2
N) values are in the range of 0.16 µmol/l to 0.45 µmol/l for the monsoon period and 0.35 µmol/l to 0.67 µmol/l for the post monsoon period. Nitrite data for the study area are illustrated in Figure 7. Slightly higher nitrite concentrations were observed in the hotspot locations (16, 6, 7 and 10) however in general nitrite concentrations were low at all sites (1 µmol/l). Greater variation was seen seasonally with lower nitrite concentrations observed in the monsoon period, the exact opposite situation was witnessed for nitrate. Nitrite is an intermediate product of both nitrification (NH4+→ NO2
→NO3
) and denitrification (NO3 → NO2
→N2O→N2)35.
Thus assuming these rates were similar in both monsoon and post monsoon periods this might simply be a reflection of greater dilution of nitrite in the monsoon season due to higher rainfall.
Table 5—Nitrate concentrations (µmol/l) for hotspots, coastal waters and offshore waters from published literature
S.No Name Location Year Nitrate (µmol/l)
1 Satpathy and Nair 51 Offshore Visakhapatnam 1996 0.014 to 0.233
2 Gouda and Panigrahy 52 Coastal waters off Gopalpur 1996 0.056 to 0.476
3 De Sousa et al 53 Eastern Arabian Sea 1996 ~4
4 Morrison et al 54 Eastern Arabian Sea 1998 ~4
5 Madhu et al 55 Chennai coastal waters (SW monsoon)
2002 1 to 2
6 Jyotibabu et al 56 Bay of Bengal near Karaikal (Trichosdesmium blooms) 2003 0.05
7 Patra et al 29 Western Arabian Sea 2006 maximal of 16
8 Ramesh and Sanjeev Kumar 57 Bay of Bengal (11°59' 37.3" N and 81° 0' 9.8" E ) 2006 0.21
9 Sardesai and Sundar 58 Mandovi and Zuari estuaries (September) 2007 4.4 to 6
10 Sardesai and Sundar 58 Mandovi and Zuari estuaries (March) 2007 1
Table 6— Nitrite concentrations (µmol/l) for hotspots, coastal waters and offshore waters from published literature
S.No Name Location Year Nitrite (µmol/l)
1 Ramachandran 38 East coast of Tamil Nadu 1997 0.2 to 1.02
2 NOIS 39 Gulf of Mannar 1998 0.3 to 1.3
3 NOIS 39 Tuticorin coastal waters 1998 0.012 to 0.6
4 Gowri 37 Chennai coastal waters 1997 0.02 to 32
5 Sundaramanickam et al 2 PortoNovo and Cuddalore coastal waters
2008 .21 to 2.68

NARAYANAN et al.: EVALUATION OF MARINE WATER QUALITY
527
0.00
1.00
2.00
3.00
4.00
5.00
6.00
7.00
8.00
16 6 7 10 11 1 21 12 2 22 13 3 23 14 4 24 15 5 25
NO
3µ
mo
l/l
Hot spots Coastal waters Offshore waters
NO3 µ mol/l for each sample station
Monsoon Post monsoon
Fig. 6 —Variations in Nitrate during monsoon and post monsoon for sampling stations
0.00
0.10
0.20
0.30
0.40
0.50
0.60
0.70
16 6 7 10 11 1 21 12 2 22 13 3 23 14 4 24 15 5 25
NO
2 µ
mo
l/l
Hot spots Coastal waters Offshore waters
NO2 µ mol/l for each sample station
Monsoon Post monsoon
Fig. 7—Variations in Nitrite during monsoon and post monsoon for sampling stations
Ammonium
Ammonia is produced largely by determination of organic nitrogen containing compounds and by hydrolysis of urea. Ammonia contains nitrogen in the reduced form and like the unstable nitrite ion, it is generally found in oxic regions of the ocean in low concentrations.
Ammonium in the study area ranged from 1.17 to 4.42 µmol/l in monsoon and 0.67 to 6.42 µmol/l in the post monsoon season. Ammonium data for monsoon and post monsoon periods are illustrated in Figure 8. Ammonium concentrations were considerably higher in the hotspot locations (4.366.34 µmol/l) compared to near shore coastal waters where values were about 1 µmol/l. Offshore waters were similar to near shore waters with the exception of station 15 where values were notably higher. The highest concentrations of
ammonia are found where bacterial denitrification processes utilise nitrate and thereby generate nitrogen and ammonia. Higher concentration of ammonia was observed due to discharge of sewages which contains large amounts of organic substances which, when decompose, release large quantities of ammonia. Huguenin and Colt36 reported that < 0.01 (mg l1 of NH3) or ~0.5 µmol/l is the safe concentration of ammonia tolerances for Marine fish. Toxic effects of unionized ammonia are usually felt at concentrations between 0.6 and 2.0 parts per million (mg l1), but some species may be less tolerant. The higher ammonium concentrations observed at the hotspots are not considered high in terms of estuarine concentration in temperate estuaries27.
The marine water quality was compared between parangipettai (PortoNovo to Cuddalore

INDIAN J. MAR. SCI., VOL. 45, NO.4 APRIL 2016
528
Coast) between the year 2000 and 2002, the ammonia NH4
N varied from 0.011 to 0.46 µmol/l and the minimum NH4N was observed in the mouth of velar estuary during post monsoon and the maximum in Cuddalore hotspot (Marine zone of uppanar estuary and Gadilam estuary) during
monsoon season2. The ammonia values recorded during the present study is less than the values recorded (0.04 to 228 µmol/l) in the coastal waters of Chennai37. Ammonia recorded is low compared to the water quality status along west coast waters and correlated well with east coast waters 38, 39.
0.00
1.00
2.00
3.00
4.00
5.00
6.00
7.00
16 6 7 10 11 1 21 12 2 22 13 3 23 14 4 24 15 5 25
NH
4 µ
mo
l/l
Hot spots Coastal waters Offshore waters
NH4 µ mol/l for each sample station
Monsoon Post monsoon
Fig. 8—Variations in ammonium during monsoon and post monsoon for sampling stations
Phosphate
Phosphorus can be measured in two ways – as soluble reactive phosphorus or as total phosphorus. Soluble reactive phosphorus represents the phosphorus that is immediately available for algal growth within the water column. Phosphate data for monsoon and post monsoon periods are illustrated in Figure 9. Phosphate was 0.5 to 1.42 µmol/l in the monsoon and 0.39 to 1.29 µmol/l in the post monsoon season. Phosphate concentrations were slightly higher in the hotspot locations (0.96 1.36 µmol/l) compared to nearshore coastal waters where values were about 0.7 µmol/l. offshore waters were similar to near shore waters with the exception of station 15, where values were notably higher. Higher suspended matter was observed by Narayanan 33,34, and therefore higher phosphate was attributed to sediment resuspension.
The phosphates observed in the study area were correlated with the growth of plankton and aquatic plants which provide food for fish 40. In all the cases the phosphate concentrations were slightly
higher in the monsoon period than the post monsoon period and this difference for most evident at the hotspot stations. Presumably this reflects greater mobilization of land based agricultural runoff because of higher rainfall through this period. Much of the total phosphorus is thus not immediately available for phytoplankton growth, but may become available in the near future. However, total phosphorus concentrations above 0.21 µmol/l and especially or 0.315 µmol/l favor most cyanobacteria.
From the nutrient data, it was found that during the post monsoon the N/P ratio ranged from a low value of 4.32 (PortoNovo 10 km station) and a high (13.11) at the Pondicherry hotspot. During the monsoon the N/P ratio at the Cuddalore 10 km station was low (4.23) with a maxima of 11.06 at the Cuddalore hot spot during low tide. The lower N/P (16:1, the Redfield ratio; Redfield 1958 41) values observed during the observation period signify that coastal waters from Pondicherry to PortoNovo were nitrogen (N) limited.

NARAYANAN et al.: EVALUATION OF MARINE WATER QUALITY
529
Table 7— Phosphate concentrations (µmol/l) for hotspots, coastal waters and offshore waters from published literature
S.No Name Location Year Phosphate (µmol/l)
1 Satpathy and Nair 51 Offshore Visakhapatnam 1996 0 to 0.038
2 Gouda and Panigrahy 52 Coastal waters of Gopalpur 1996 0.04 to 0.88
3 NOIS 39 Gulf of Mannar 1998 0.055 to 4.8
4 NOIS 39 Tuticorin coastal waters 1998 0.01 to 0.43
5 Jyotibabu et al 56 Bay of Bengal near Karaikal (trichosdesmium blooms) 2003 0.9
6 Sundaramanickam et al 2 PortoNovo and Cuddalore coastal waters 2008 0.19 to 2.48
0.00
0.20
0.40
0.60
0.80
1.00
1.20
1.40
1.60
16 6 7 10 11 1 21 12 2 22 13 3 23 14 4 24 15 5 25
PO
4µ
mo
l/l
Hot spots Coastal waters Offshore waters
PO4 µ mol/l for each sample station
Monsoon Post monsoon
Figure 9 Variations in Phosphate during monsoon and post monsoon for sampling stations
Marine water quality with reference to central pollution control board (CPCB) and national standards
Coastal marine water is subjected to several
types of uses. Water quality criteria have been specified to determine its suitability for a particular purpose. Among the various types of uses there is one use that demands highest level of water quality/purity and that is termed a ''designed best use'' in that stretch of the coastal segment. Based on this, primary water quality criteria have been specified for following five designated best uses (CPCB, Environment Protection Act, 1986)42. SWI Salt pans, Shell fishing, Mariculture
and Ecologically Sensitive Zone. SWII Bathing, Contact Water Sports and
Commercial fishing. SWIII Industrial cooling, Recreation (non
contact) and Aesthetics. SWIV Harbor.
SWV Navigation and Controlled Waste Disposal.
As per the CPCB water quality standards for the designated uses of SWI, SWII the parameters of interest in this study should have a pH range between 6.5 and 8.5 and DO above 4 mg/l. The analysis revealed the water quality parameters observed in the present study were well within the range of the prescribed limits for monsoon and post monsoon season. Conclusion
The largest interseason differences in pH were surprisingly not observed in the hotspot locations but were observed in nearshore coastal waters. These values are considerably lower than expected marine pH values and indicate that ocean acidification may be occurring to some degree. Dissolved gases, such as carbon dioxide, and ammonia, appreciably affect pH.
In the hotspots salinity was higher than the adjacent coastal waters and offshore waters. This
INDIAN J. MAR. SCI., VOL. 45, NO.4 APRIL 2016
530
was attributed to an excess of evaporation over inputs in the estuarine systems, additional freshwater flux leads to lowering of salinity during the monsoon period.
The higher DO in post monsoon compared to monsoon period in the Bay of Bengal is caused by higher Chla (oxygen release during photosynthesis) at the surface.
The hotspot locations showed considerable DO under saturation typically about 65% with respect to atmospheric equilibrium. This indicated microbial removal of DO by intense bacterial activity possibly as a consequence of BOD (Biological oxygen demand), COD (Chemical Oxygen Demand) associated with industrial discharges. However, the depletion of Dissolved oxygen is not only related to anthropogenic activity but also due to rivers carrying high organic load. In this study the hyperoxia is not reported.
Nitrate concentrations were considerably higher in the hotspot locations (5.57.1 µmol/l) compared to near shore coastal waters where values were about 2 µmol/l.
Ammonium concentrations were considerably higher in the hotspot locations (4.366.34 µmol/l), The highest concentrations of ammonia are found where bacterial denitrification processes utilise nitrate and thereby generate nitrogen and ammonia. Higher concentration of ammonia was observed due to discharge of sewages which
contains large amounts of organic substances which release large quantities of ammonia.
The phosphates observed in the study area were correlated with the growth of plankton and aquatic plants which provide food for fish. Probably this reflected greater mobilization of land derived N (possibly through the use of fertilizers) because of higher rainfall during this season. However, total phosphorus concentrations above 0.21 µmol/l and especially or 0.315 µmol/l favor the growth cyanobacteria.
The lower N/P (16:1, the Redfield ratio; Redfield 1958) values observed during the observation period signify that coastal waters from Pondicherry to PortoNovo were nitrogen (N) limited.
The analysis revealed the water quality parameters observed in the present study were well within the range of the prescribed limits of CPCB norms for monsoon and post monsoon season. Acknowledgement
Authors are grateful to Prof. T. Swaminathan, Department of Chemical Engineering, Indian Institute of Technology Madras, Chennai, Dr. J.F. Lawrence, Reader in Geology, Presidency College, Chennai for their consistent encouragements towards completing this research work.
References 1. Anupam Sarkar., Guest Editorial. Environment
Internationa.l., 32 (2006):145147. 2. Sundaramanickam, A., Sivakumar, T., Kumaran, R.,
Ammaiappan, V. and Velappan, R., A Comparative Study of PhysicoChemical Investigation along Parangipettai and Cuddalore Coast. Journal of Environmental Science and Technology., 1 (2008): 110.
3. Cave, R.R.., Ledoux, L., Turner, K., Jickells, T., Andrews, J.E. and Davies, H., The humber catchment and its coastal area: From UK to European perspectives. Sci. Total Environ., 314316 (2003):3152.
4. Belzunce, M.J., Solaun, O., Valencia, V. & Perez, V., Contaminents in estuaruine and coastal waters. In: Oceanography and marine environment of the basque country, (Eds.): Borja A. and Collins M., Elsevier oceanography series, Amsterdam., 70 (2004):3351.
5. Karlson, K., Rosenburg, R. & Bonsdorff, E., Temporal and spatial largescale effects of eutrophication and oxygen deficiency on benthic fauna in Scandinavian and
Baltic waters. A review. Oceanogr. Mar. Biol. Ann Rev., 40(2002): 427489.
6. Wang, P.F., Martin, J. and Morrison, G., Water quality and eutrophication unTampa Bay. Florida East. Coast. Shelf Sci., 49(1999):120.
7. Hanninen, J., Vuorinen, I., Helminen, H., Krikkala, T. and Lehtila, K., Trends and gradients in nutrient concentrations and loading in achiepielgo sea. Northern Baltic, East.Coast. Shelf Sci., 50(2000):153171.
8. Goldberg, E.D., Emerging problems in the coastal zone for the Twentyfirst century. Mar. Poll. Bull, 31, 412 (1995): 152158.
9. Naqvi, S.W.A., Research and development for coastal zone. In: Voices for the Oceans, A report to the Independent World Commission on the Oceans, (Ed.): Rajagopalan R. International Ocean Institute, Madras., 1996, pp.8890.
10. Harvey S. In: Pharmacological basis of therapeutics. fifth. Goodman LS, Gilman A, editor. New York: Macmillan; Heavy metals. 1975.

NARAYANAN et al.: EVALUATION OF MARINE WATER QUALITY
531
11. NRC (National Research Council). Accumulation of Nitrate. Committee on Nitrate Accumulation, Agriculture Board, National Academy of Sciences. Washington, DC. 1972.
12. Duursma, E.K., Boisson, M.P.R.M., Global oceanic and atmospheric oxygen stability considered in relation to the carbon cycle and to different time scales. Oceanol. Acta 17(1994): 117–141.
13. Reid, G.K. and Wood, R.D. Ecology of Inland Waters and Estuaries (second edition). D. Van Nostrand and Co. New York. 1976 pp. 485
14. Valsaraj, C.P. and Rao, V.N.R., Nitrogen limitation in the tropical waters of the Bay of Bengal. Hydrobio., 286(1994): 139148.
15. National Research Council [NRC Committee on waste water management for coastal urban areas, water science and technology board], Managing waste water in coastal urban areas, National Academy press, Washington, DC (USA) 1993.
16. National Research Council [NRC Committee on priorities for Ecosystem Research in the coastal Zone, Ocean Studies Board]. Priorities for coastal Ecosystem Science, National Academy press, Washington, DC (USA). 1994.
17. National Research Council [NRC Committee on the causes and management of coastal Eutrophication, ocean studies board and water science and technology board]. Clean coastal waters. Understanding and reducing the effects of nutrient pollution, National Academy press, Washington, DC (USA) 2000.
18. Eloheimo, K., Kutser, T., Härmä, P., Hannonen, T., Pyhälahti, T., Koponen, S. Pulliainen, J., Servomaa, H. 1998. Coastal monitoring in the Baltic Sea using satellite, airborne and in situ data. Proceedings of the Fifth International Conference on Remote Sensing for Marine and Coastal Environments. San Diego, California. October 57, 1998. Volume II, pp. 306313
19. Ramesh, R. and Anbu, M., Chemical Methods for Environmental Analysis. Macmillan India Lit., Madras 2.1996.
20. APHA (American Public Health Association)., Standard Methods for the Examination of Water and Wastewater. 19th edition (Washington, DC: American Public Health Association)., 1995.
21. Doney, S.C., The dangers of ocean acidification. Scientific American., 294(2006):5865.
22. Hatje, V., Payne, T.E., Hill, D.M., McDrist, G., Birch, G.F..and Szymezak, R., Kinetics of trace element uptake and release by particles in estuarine waters: effects of pH, salinity and particle loading. Environ. Int., 29(2003): 619629.
23. Radtke, D. B., J. V. Davis, and F. D. Wilde. Specific electrical conductance. Page 22 in F.D. Wilde and D. B. Radtke, editors. National Field Manual for the Collection of Water Quality Data: Field Measurements. U.S. Geological Survey Reston, VA. 1998.
24. Lawson, T. B. Fundamentals of Aquacultural Engineering. New York: Chapman and Hall. 1995.
25. Kentucky Water Watch. Conductivity and Waterquality.,2009. URL:www.uvm.edu/~empact/ water/conductivity. php.
26. NationMaster.,2005. http://www.nationmaster.com/encyclopedia/ Oxygendepletion
27. Barnes, J. and Owens, N.J.P., Denitrification and Nitrous Oxide concentrations in the Humber Estuary, U.K., and adjacent coastal zones. Marine Pollution Bulletin. 37(3 7)( 1998):247–260.
28. Borges A.V., Delille B., Schiettecatte LS., Gazeau F., Abril G., Frankignoulle M., 'Gas transfer velocities of CO2 in three European estuaries', (Randers Fjord, Scheldt and Thames), Limnol. Oceanogr.,49 (2004) : 16301641.
29. Patra, P. K., Kumar, M. D., Mahowald, N., and Sarma, V. V. S. S., Atmospheric deposition and surface stratification as controls of contrasting chlorophyll abundance in the North Indian Ocean, J. Geophys. Res., 112(2007):C05029, doi:10.1029/2006JC003885.
30. Pelster B. The generation of hyperbaric oxygen tensions in fish. News Physiol. Sci. 16 (2001): 287–291. [PubMed]
31. Liepelt A, Karbe L, Westendo J Induction of DNA strand breaks in rainbow trout, Oncorhynchus mykiss, under hypoxic and hyperoxic conditions. Aquat Toxicol 33(1995): 177–181
32. Rabalais, N. N. Nitrogen in aquatic ecosystems. Ambio 31(2002):102–112.
33. Narayanan RM., Study on coastal environs and evaluation of specific oceanographic parameters by developing biooptic algorithms using satellite data, Anna university, Ph.D. Thesis, Chennai, India., 2009.
34. Narayanan, RM., Sharmila, K.J., Ramalingam, M., & Dharanirajan, K., “Improvements on Regional Total Suspended Matter Algorithms for Modis and Seawifs Satellite Data for Cuddalore and Pondicherry Coast”, International Journal of Earth Sciences & Engineering, 7( 5) ( 2014):17091720.
35. Sijinkumar, A.V., Naik, T., Nath, B.N. & Sharma, R., Changes in nutrient, dissolved oxygen and total suspended matter during simulated placer mining. In: National Seminar on Exploration, Exploitation, Enrichment and Environment of Coastal Placer Minerals (PLACER - 2007), (ed. Loveson V.J., Sen P.K. and Sinha A). 2007, pp. 260269.
36. Huguenin, J.E. and J. Colt.. Design and opertaing guide for aquaculture seawater systems. Amsterdam: Elsevier. 1989
37. Gowri, V.S., Impacts of Adyar and Cooum river discharges on the water and sediment qualities of marina beach, Chennai. Ph.D. Thesis, Anna University., Chennai India.1997.
38. Ramachandran, S., Case studies on coastal fragile areas east coast of India. Institute for Ocean Management, Anna University, India, report submitted to CPCB (Central Pollution Control Board),1997.

INDIAN J. MAR. SCI., VOL. 45, NO.4 APRIL 2016
532
39. NOIS (National Ocean Information Service) 'East Coast of India', Report by Institute for Ocean Management, Anna University, Chennai, India, submitted to DOD 1998.
40. Ingole S.A. and Kadam A.N. Pollution of some recreation beaches of Mumbai, Maharashtra, J. Indian Assoc. Environ. Manage, 30 (2003):172175.
41. Redfield A.C., The biological control of chemical factors in the environment, Am. Sci., 46, (1958): 205.
42. CPCB, Environment Protection Act,1986., http://www.cpcb.nic.in/upload/NewItems/(11)%20 EPAct1986 .doc
43. Jonathan M.P., Srinivasalu S., Thangadurai N., Ayyamperumal T., ArmstrongAltrin J.S., RamMohan V. Contamination of Uppanar River and coastal waters off Cuddalore, Southeast coast of India, Environ Geol., 53(2008):13911404.
44. Sasammal S.K., ‘Hydrography of the northern Bay of Bengal during the south west monsoon’, Mahasagar, 22(1989) (3),105112.
45. World Ocean Atlas, Conkright M.E., Locarnini R.A., Garcia H.E., O'Brien T.D., Boyer T.P., Stephens C. and Antonov J.I., ‘World Ocean Atlas 2001: objective analyses, data statistics and figures CDROM documentation’, National Oceanographic Data Center Internal Report,2002, pp. 17.
46. Thadathil Pankajakshan V.V., Gopalakrishna P.M., Muraleedharan G.V., Reddy, Nilesh Araligidad, Shrikant Shenoy, Surface layer temperature inversion in the Bay of Bengal, Deep-Sea Research I, 49(2002): 18011818.
47. Prasanna Kumar S., Muraleedharan P.M., Nampoothiri G., Almeida A., Nuncio Murukesh, Jayu Narvekar, Deepthi M. and Gaurish Salgaonkar, ‘Response of the upper ocean to atmospheric forcing in the Bay of Bengal on seasonal and interannual scale’, Bay of Bengal Process Studies (BOBPS) Final Report, 2006, http://hdl.handle.net/2264/535
48. Desa E., Zingde M.D., Vethamony P., Babu M.T., D’Sousa S.N. and Verlecar X.N., Dissolved oxygena target indicator in determining use of the Gulf of Kachchh waters, Marine Pollution Bulletin, 50(2005):7379.
49. Rosamma Stephen, K.J. Jayalakshmi, Habeeb Rahman, Karuppuswamy P.K and Nair K.K.C., Tsunami 2004 and the biological oceanography of Bay of Bengal, In Proc. National Commemorative Conference On Tsunami. Madurai. Dec, 2006, pp. 2829.
50. Sawant S.S., Prabhudessai L. and Venkat K., Eutrophication status of marine environment of Mumbai and Jawaharlal Nehru ports, Environmental Monitoring and Assessment., 127, (13) (2007): 283291.
51. Satpathy K.K. and Nair K.V.K., ‘Occurrence of phytoplankton bloom and its effect on coastal water quality’, Ind. J. Mar. Sci., 25 (1996): 145147.
52. Gouda R. and Panigrahy R.C., Ecology of phytoplankton in coastal waters off Gopalpur east coast of India, Indian Journal of Marine Sciences., 25 (1996) 8184.
53. DeSousa S.N., Kumar M.D., Sardessai S., Sarma V.V.S.S. and Shirodkar P.V., Seasonal variability in
oxygen and nutrients in 71, the central and eastern Arabian Sea, Current Science., (1996) 847851.
54. Morrison J.M., Codispoti L.A., Gaurin S., Jones B., Manghnani V. and Zheng Z., Seasonal Variation of hydrographic and nutrient fields during the US JGOFS Arabian Sea Process Study, Deep-Sea Res., II., 45(1998): 20532102.
55. Madhu N.V., Maheswaran P.A., Jyothibabu R., Sunil V., Revichandran C., Balasubramanian T., Gopalakrishnan T.C. and Nair K.K.C., Enhanced biological production off Chennai triggered by super cyclone (Orissa), Current Science., 82(12) (2002) :14721478.
56. Jyothibabu R., Madhu N.V., Nuncio Murukesh P.C., Haridas K.K., Nair C. and Venugopal P., Intense blooms of Trichodesmium erythraeum (Cyanophyta) in the open waters along east coast of India, Indian Journal of Marine Sciences., 32(2)( 2003):165167.
57. Ramesh R. and Sanjeev Kumar, ‘New production studies, Bay of Bengal Process Studies (BOBPS), Final Report, 2006, http://hdl.handle.net/2264/535
58. Sardessai S. and Sundar D., Variability of nitrate and phosphate, In: The Mandovi and Zuari estuaries, (ed. Shetye S.R., Dileep Kumar M. and Shankar D), 2007, pp. 5966.