evaluation of indianapolis comprehensive anti-gang
TRANSCRIPT
PART OF THE INDIANA UNIVERSITY PUBLIC POLICY INSTITUTE
Evaluation of Indianapolis
Comprehensive Anti-Gang Initiative Law Enforcement
Activities, 2009-2010

Evaluation of IndianapolisComprehensive Anti-Gang Initiative Law Enforcement Activities,2009-2010
© 2011 Center for Criminal Justice Research (11-C31)School of Public and Environmental AffairsIndiana University–Purdue University Indianapolis334 North Senate Avenue, Suite 300Indianapolis, Indiana 46204-1708

The Center for Criminal Justice ResearchThe Center for Criminal Justice Research, one of two applied research centers affiliated with the IndianaUniversity Public Policy Institute, works with public safety agencies and social services organizations toprovide impartial applied research on criminal justice and public safety issues. CCJR provides analysis,evaluation, and assistance to criminal justice agencies; and community information and education on pub-lic safety questions. CCJR research topics include traffic safety, crime prevention, criminal justice systems,drugs and alcohol, policing, violence and victimization, and youth.
Indiana University Public Policy InstituteThe Indiana University (IU) Public Policy Institute is a collaborative, multidisciplinary research institutewithin the Indiana University School of Public and Environmental Affairs (SPEA), Indianapolis. TheInstitute serves as an umbrella organization for research centers affiliated with SPEA, including the Centerfor Urban Policy and the Environment and the Center for Criminal Justice Research. The Institute alsosupports the Office of International Community Development and the Indiana Advisory Commission onIntergovernmental Relations (IACIR).
Table of Contents Executive Summary . . . . . . . . . . . . . . . . . 1
Comprehensive Anti-Gang Initiative(CAGI) background . . . . . . . . . . . . . . 4
Indianapolis CAGI Law Enforcement Initiatives . . . . . . . . . . . 6
CAGI Open Air Drug MarketInitiatives (OAI) 2009-2010 . . . . . . . . 8
Evaluation strategy . . . . . . . . . . . . . . . . .11
2009 Open Air Drug Market Initiative (OAI) Results . . . . . . . . . . 12
2010 Open Air Drug MarketInitiative Results . . . . . . . . . . . . . . . . 21
Assessment of CAGI 2009 and 2010Open Air Initiatives . . . . . . . . . . . . . 29
Recommendations . . . . . . . . . . . . . . . . . 31
References . . . . . . . . . . . . . . . . . . . . . . . . 32
AuthorsThomas D. Stucky, Associate Director,
Center for Criminal Justice Research;
Associate Professor, School of Public and
Environmental Affairs

Tables: PAGE
Table 1: CAGI 2009 and 2010 open air drug market initiative subgrants awarded and funds expended . . . . . . . . . . . . . . . . . . . . . . . . . . . . . . . . . . . . . . . . . . . . . . . . . . . . . . . . . . . . . . . . . . . . . . . . . . . . . 8
Table 2: CAGI OAI Tiburon incident reports by month and beat, 2009 . . . . . . . . . . . . . . . . . . . . . . . . . . . . . 12
Table 3: IMPD OAI Tiburon reports by month and type, 2009. . . . . . . . . . . . . . . . . . . . . . . . . . . . . . . . . . . . . 13
Table 4: CAGI OAI individuals arrested, by beat and month, 2009 . . . . . . . . . . . . . . . . . . . . . . . . . . . . . . . . . 15
Table 5: CAGI OAI charges at arrest by type, 2009. . . . . . . . . . . . . . . . . . . . . . . . . . . . . . . . . . . . . . . . . . . . . . . 16
Table 6: CAGI OAI Tiburon incident reports noting seizures of firearms and money, by month, 2009 . . . 18
Table 7: Known or suspected gang members in cases sent to CAGI prosecutor, 2009 . . . . . . . . . . . . . . . . 18
Table 8: CAGI OAI charges sent to CAGI prosecutor by IMPD, 2009. . . . . . . . . . . . . . . . . . . . . . . . . . . . . . . 19
Table 9: CAGI OAI 2009 prosecutions and convictions . . . . . . . . . . . . . . . . . . . . . . . . . . . . . . . . . . . . . . . . . . . 20
Table 10: CAGI OAI Tiburon incident reports, by month and beat, 2010 . . . . . . . . . . . . . . . . . . . . . . . . . . . . 21
Table 11: CAGI OAI Tiburon reports by month and type, 2010 . . . . . . . . . . . . . . . . . . . . . . . . . . . . . . . . . . . . 22
Table 12: CAGI OAI individuals arrested, by beat and month, 2010 . . . . . . . . . . . . . . . . . . . . . . . . . . . . . . . . 23
Table 13: CAGI OAI charges at arrest, by type, 2010 . . . . . . . . . . . . . . . . . . . . . . . . . . . . . . . . . . . . . . . . . . . . . 24
Table 14: CAGI OAI Tiburon reports noting drugs seized, by beat and month, 2010. . . . . . . . . . . . . . . . . . 24
Table 15: CAGI OAI money and firearm seizures by month, 2010 . . . . . . . . . . . . . . . . . . . . . . . . . . . . . . . . . 26
Table 16: Information on 2010 CAGI OAI activities from IMPD CAGI database . . . . . . . . . . . . . . . . . . . . . 27
Table 17: Prosecutions/convictions of 2010 CAGI OAI cases . . . . . . . . . . . . . . . . . . . . . . . . . . . . . . . . . . . . . . 28
Maps:
Map A: CAGI law enforcement target beats, 2009 . . . . . . . . . . . . . . . . . . . . . . . . . . . . . . . . . . . . . . . . . . . . . . . . 9
Map B: CAGI law enforcement target beats, 2010 . . . . . . . . . . . . . . . . . . . . . . . . . . . . . . . . . . . . . . . . . . . . . . . 10
Map C: CAGI OAI Tiburon incident locations involving an arrest, by IMPD beat, 2009 . . . . . . . . . . . . . . . 14
Map D: CAGI OAI Tiburon incident locations involving drug seizures, by IMPD beat, 2009. . . . . . . . . . . 17
Map E: CAGI OAI search warrants, by IMPD beat, 2009 . . . . . . . . . . . . . . . . . . . . . . . . . . . . . . . . . . . . . . . . . 17
Map F: CAGI OAI Tiburon incident locations involving an arrest, by IMPD beat, 2010 . . . . . . . . . . . . . . . 23
Map G: CAGI OAI Tiburon incident locations involving drug seizures, by IMPD beat, 2010. . . . . . . . . . . 25

In 2006, the U.S. Department of Justice(DOJ) initiated the Comprehensive Anti-Gang Initiative (CAGI) to support lawenforcement in combating violent gangcrime and promoting prevention effortsthat discouraged gang involvement. Theinitiative grew out of Project SafeNeighborhoods (PSN), a nationwide pro-gram aimed at reducing gun and gangcrime through support of existing localprograms. DOJ dedicated $30 million ingrant funding to support new andexpanded anti-gang prevention andenforcement efforts through CAGI. DOJinitially provided anti-gang resources tosix cities. In April 2007, CAGI wasexpanded to include four additional sites,including Indianapolis, Indiana. CAGIprovided $2.5 million in targeted grantfunding for a three-year period to eachselected city to implement a three-pronged strategy to reduce gang involve-ment and crime, which included initia-tives in prevention/intervention, lawenforcement, and reentry. Approximately$1 million was dedicated to support com-prehensive gang prevention and interven-tion efforts with youth. An additional $1million was targeted to law enforcementand $500,000 to support reentry initiatives.In July 2008, the Center for CriminalJustice Research (CCJR), part of theIndiana University Public Policy Institute,was engaged to serve as the research part-ner for CAGI. This report focuses on doc-umenting two major law enforcement ini-tiatives for the CAGI grant to the city ofIndianapolis through 2010.
In its proposal to DOJ, the Law Enforce -ment Committee (LEC) proposed a five-phase strategy for CAGI law enforcementactivities which included the following:
1. Identification of the target area
2. Intelligence gathering
3. Identification of gangs and gangmembers within the target area
4. Aggressive law enforcement activities
5. Evaluate and adjust initial lawenforcement efforts for effectiveness
Target areas were selected based ongeneral crime statistics. Beats selected forenforcement efforts were NorthwestDistrict beats 21, 24, and 33; SouthwestDistrict beats 11 and 12; and NortheastDistrict beats 21, 22, 23, 24, and 51. Uponselection of the target area, the LEC pro-posed to gather intelligence on gang activ-ity and prioritize gangs and areas to betargeted with “street level law enforce-ment efforts, such as saturated and direct-ed patrols, officer overtime, and under-cover operations.” In addition, fundingwas to be provided for materials, equip-ment, and investigative tools that wouldsupport law enforcement activities. At theheart of the CAGI law enforcement activi-ties were two open air drug market initia-tives (OAI). The 2009 OAI subgrant pro-posal noted that much of the drug salesactivity occurs in public spaces and is con-ducted by or supports criminal gangs.Law enforcement activities were proposedto reduce drug crime and thereby reducethe potential for drug market related vio-lence and eliminate a major source offunds for gangs.
The goal of the CCJR OAI evaluationwas to document the activities of the 2009and 2010 OAI and to evaluate the impactof CAGI drug market enforcement activi-ties on crime in the area. This report docu-ments the 2009 and 2010 OAI activities.Examination of the impact of the initia-tives on crime in the selected beats will beincluded in a later report. The proposedstrategy for documenting OAI activitiesincluded attempts to collect the followinginformation: gang members identified inOAI targeted areas, OAI target area
EXECUTIVESUMMARY
1

arrests, OAI specific prosecutions general-ly and specific gang charges pursued, andOAI specific weapon and drug seizures,and assets forfeited.
The data used to document 2009 and2010 OAI activities come from four mainsources: IMPD Tiburon reports, theMarion County Gang Database, a relation-al database maintained by IMPD for 2010OAI activities, and data on prosecutions/convictions maintained by the MarionCounty Prosecutor’s Office. Additionalbackground information was obtainedthrough communications with IMPD, theMCPO, and interim reports on the projectto the CAGI Steering Committee. Themajor source of data for this report is theTiburon incident reporting system. Fromhard copy files of all Tiburon incidentreports associated with the 2009 and 2010CAGI OAI activities, a list of all CAGI-related Tiburon report numbers wasdeveloped. Electronic copies of thesereports were obtained.
The data showed the following:
1. In 2009, there were 219 individualsarrested on 305 charges according toCAGI-related Tiburon reports. Morethan one-third of these charges (120)were for drug trafficking orpossession.
2. More than half (54 of 111) of chargesforwarded to the CAGI prosecutor forreview involved drug possession ortrafficking (most often at the felonylevel).
3. For CAGI defendants arrested in 2009,there were 22 listed as prosecuted.Twenty of the 22 cases resulted inconviction. The remaining two caseswere individuals still wanted bypolice. The large majority of thesecases involved felony drug trafficking.
4. In 2010, 29 individuals were arrestedon 63 charges. Nearly-two thirds ofthe charges at arrest were for drug
trafficking or possession. Severaladditional arrests are likely based onarchived drug buys being used tobuild cases.
5. Of the 20 cases forwarded to theCAGI prosecutor with a 2010 arrestdata, 19 were convicted (nearly all ondealing cocaine or heroin charges).One defendant was listed as wantedby police.
6. Only one of 315 CAGI Tiburon reportsin 2009 and 2010 mentioned the wordgang. Of 96 cases forwarded to theCAGI prosecutor in 2009, nearly 20percent (19 individuals) were knownor suspected gang members.Examination of the IMPD relationaldatabase showed that in 2010, 11 of 32arrestees tracked there were suspectedor confirmed gang members.
The report also documents severalimportant lessons learned, which lead tothe following recommendations:
Operational issues for programs such as CAGI OAI 1. Develop a consistent definition of
gang crime, train officers on thisdefinition and ensure systematic gangdata collection.
2. Train officers on when and how to fillout gang contact sheets and ensurethat they do so when appropriate.
3. When initiatives involve drug marketactivity, focus additional efforts ongenerating cases for federalprosecution.
Information collection and research issues4. Rather than the involved officers
specifying the district office,accurately record the location ofactivity to improve the geographicalassessment of programs such asCAGI-OAI. If necessary to preserveconfidentiality of investigatoryinformation, the officer could list the
2

district office in the incident reportand maintain a separate log oflocations of drug purchases thatwould remain confidential but couldbe provided to researchers.
5. Develop an accounting method tosystematically show when officers areengaged in special projects such asCAGI. Tracking these specialassignments across all IMPD districtsand activities would simplify thedetermination of the impact of IMPDinitiatives.
6. Develop electronic tracking of cases toreduce time and increase accuracy, aswas partially done in 2010.Systematically and regularly enterinformation into the database.
7. For data collection efforts that rely on
law enforcement officers whoseprimary mission is not data collection,ensure data collection instruments arein place prior to the project start dateand not onerous to collect. Automatedata collection if possible. IMPDwould benefit from developing auniversal tracking tool for projectssuch as these which requiredocumentation and evaluation of lawenforcement activities, arrests,prosecutions, and crime rates.
8. Engage the research partner as earlyas possible in the research process,preferably as the grant proposal isbeing developed so that datacollection strategies can be workedout in advance of programimplementation.
3

4
In many areas across the United States,gangs and gang-related activity remain aprimary concern for law enforcementagencies and the public in general.According to results from the 2009National Youth Gang Survey (NYGS) oflaw enforcement agencies, the number ofjurisdictions with gang problems and thenumber of gangs rose over 20 percentbetween 2002 and 2009. Gang-relatedcrime, in particular homicides, remainshighly concentrated in most populatedjurisdictions. The 2009 NYGS results showthat 96 percent of all gang-related homi-cides recorded in 2009 occurred in largercities and suburban counties (Egley &Howell, 2011). Over the last several yearsin Indianapolis, law enforcement officialsreport that gang-related incidents are onthe rise (Ryckaert, 2006). In late 2009,Indianapolis Metropolitan PoliceDepartment (IMPD) officials indicatedthat 150 gang-related arrests had beenmade that year, compared with only sevenin 2006. At that time, IMPD reported thatover 300 different gangs were operating inMarion County (Ryckaert & Murray,2009).
In early 2006, the U.S. Department ofJustice (DOJ) initiated the ComprehensiveAnti-Gang Initiative (CAGI). The programwas designed to support law enforcementin combating violent gang crime, as wellas promote prevention efforts that dis-couraged gang involvement. The initiativegrew out of Project Safe Neighborhoods(PSN). Begun in 2001, PSN is a nationwideprogram aimed at reducing gun and gangcrime through support of existing localprograms. PSN resources have beendirected to a variety of uses; for instance,to hire new federal and state prosecutors,deter juvenile gun crime, develop andpromote community outreach efforts, pro-vide training, and support gang violence
reduction strategies. With announcementof the CAGI program, DOJ dedicated $30million in grant funding to support newand expanded anti-gang prevention andenforcement efforts. The new funds wereintended to allow local PSN task forces tocombat gangs by building on the effectivestrategies and partnerships developedunder PSN. In May 2006, DOJ providedanti-gang resources for prevention,enforcement, and offender reentry effortsto six sites across the nation. In April 2007,CAGI was expanded to include four addi-tional sites, one of which wasIndianapolis.1 CAGI provided $2.5 millionin targeted grant funding for a three-yearperiod to each of the ten sites to imple-ment a three-pronged strategy in responseto gangs, as summarized below (U.S.Department of Justice, 2006; 2008):
• Prevention – Approximately $1million in grants was made availableper community to supportcomprehensive prevention effortsfocused on reducing youth-gangcrime and violence by addressing therange of personal, family andcommunity factors that contribute tojuvenile delinquency and gangactivity.
• Law Enforcement – The programmade available approximately $1million in grants per community tohelp support enforcement programsthat focused law enforcement effortson the most significant violent gangoffenders.
• Prisoner Reentry – Approximately$500,000 was made available percommunity to create reentryassistance programs with faith-basedand other community organizationsthat provided transitional housing, jobreadiness and placement assistance,and substance abuse and mentalhealth treatment to prisoners re-entering society.
1The 10 sites include Los Angeles,California; Tampa, Florida;Cleveland, Ohio; Dallas/Ft. Worth,Texas; Milwaukee, Wisconsin;Eastern District of Pennsylvania’s222 Corridor; Rochester, New York;Oklahoma City, Oklahoma;Indianapolis, Indiana; and Raleigh-Durham, North Carolina.
COMPREHENSIVEANTI-GANG INITIATIVE
(CAGI)BACKGROUND

Through collaboration between theU.S. Attorney’s Office for the SouthernDistrict of Indiana, the City ofIndianapolis/Marion County, and theIndiana Criminal Justice Institute, a steer-ing committee was formed to plan andexecute activities for the three-prongedapproached focusing on prevention, lawenforcement, and reentry programs todiminish gang activity in Indianapolis.The CAGI Steering Committee was com-prised of representatives from theIndianapolis Mayor’s Office, theIndianapolis Metropolitan PoliceDepartment (IMPD), the Marion CountyProsecutor’s Office, community leaders,and members of the faith community.Three subcommittees also were created tooversee the three initiatives
(prevention/intervention, law enforce-ment, and reentry).
In July 2008, the Center for CriminalJustice Research (CCJR), part of theIndiana University Public Policy Institute,was engaged to serve as the research part-ner for CAGI. From the outset of the part-nership, CCJR researchers actively partici-pated with the CAGI Steering Committeeand CAGI program staff in programimplementation and, specifically, in pro-viding input on how to handle challengesregarding implementation and data needsacross the three areas of the initiative.CCJR made sustained efforts in all threeareas to assist CAGI staff and providers inidentifying and gathering necessary datafor evaluation of the program.
5
In its proposal to DOJ (pages 10-15), theLaw Enforcement Committee (LEC) pro-posed a five-phase strategy for CAGI lawenforcement activities which included thefollowing:
1. Identification of the target area
2. Intelligence gathering
3. Identification of gangs and gangmembers within the target area
4. Aggressive law enforcement activities
5. Evaluation and adjustment of initiallaw enforcement efforts foreffectiveness
The LEC noted in its proposal to DOJthat “IMPD has not consistently and/oreffectively tracked incidents of gang-relat-ed criminal activity.” Therefore, targetareas were selected based on general crimestatistics. The LEC identified target areasfor law enforcement activities based on:
[A]n analysis of crime statisticsgathered by the IndianapolisMetropolitan Police Department(IMPD), who plotted a three-yearhistory of homicides, aggravatedassaults, and burglaries in MarionCounty. Areas dense in these crimeswere selected, using police beats asboundaries. Beats selected forenforcement efforts are NorthwestDistrict beats 21, 24, and 33;Southwest District beats 11 and 12;and Northeast District beats 21, 22, 23,24, and 51.2
The law enforcement target beatswere a subset of the areas identified by thefive CAGI zip codes used in targeting pre-vention/intervention and reentry activi-ties. Upon selection of the target area, theLEC proposed to gather intelligence ongang activity and prioritize gangs andareas to be targeted with “street level lawenforcement efforts, such as saturatedpatrols, within the target area.” As out-lined in the DOJ proposal (p. 13):
[I]mplementation of the lawenforcement strategies will begin withintense surveillance and undercoverwork within the target area. Eachparticipating agency will aggressivelyand proactively investigate theirassigned targets. Federal, state, andlocal law enforcement partners willcollaborate with state and federalprosecutors throughout thoseinvestigations with an eye towardprosecuting the most serious, readilyprovable offenses in either state orfederal court. Law enforcementagencies will also collaborate withprobation and parole officers toconduct probation/parole sweeps inthe target area and execute search andarrest warrants in appropriate cases.Search and arrest warrants will alsobe executed in appropriate casesbased on evidence gathered duringproactive undercover investigations.Simultaneously with other lawenforcement activities in Phase IV,officers will conduct significantsaturation patrols to establish a visiblepresence in the targeted area anddeter gang activity.
The LEC proposed to spend $489,500to implement the various law enforcementstrategies and operations. The money wasto be used for saturation and directedpatrols, officer overtime, and undercoveroperations. In addition, funding was to beprovided for materials, equipment, andinvestigative tools that would support lawenforcement activities.
The LEC also set aside $100,000 foradditional Gang Prosecutor resourceswithin the Marion County Prosecutor’sOffice (MCPO) to assist with prosecutionof individuals arrested through CAGI lawenforcement activities.
2CAGI proposal to U.S. Departmentof Justice
INDIANA CAGILAW
ENFORCEMENTINITIATIVES
6

As noted in the DOJ proposal (p. 22):
Anticipated outcomes from the lawenforcement efforts include the following:
• Reduce number of suspected gang-related crimes in Indianapolis/MarionCounty
• Develop gang contact sheets toidentify suspected gang membership.
• Locate the “breeding grounds” for thegang member recruitment
• Increase law enforcement in narcoticsto eliminate the suspected source ofgang financing
• Increase suspected gang conflictawareness withinIndianapolis/Marion County schoolsthrough presentations to faculty andstudents by the IMPD Gang Unit andcollaboration with the GREATProgram
Reduction in gang-related criminaloffenses in the target area is the primarymeasure of success for all components.
• Number of combined homicides,aggravated assaults, and robberiesthat are considered gang-related
With regard to CAGI program staff tosupport law enforcement activities, aGrant Coordinator was hired in August2008 and worked with CCJR researchersthroughout the course of the project, facili-tating data collection on the 2009 and 2010open air drug market initiatives (OAI)described in the next section.
7
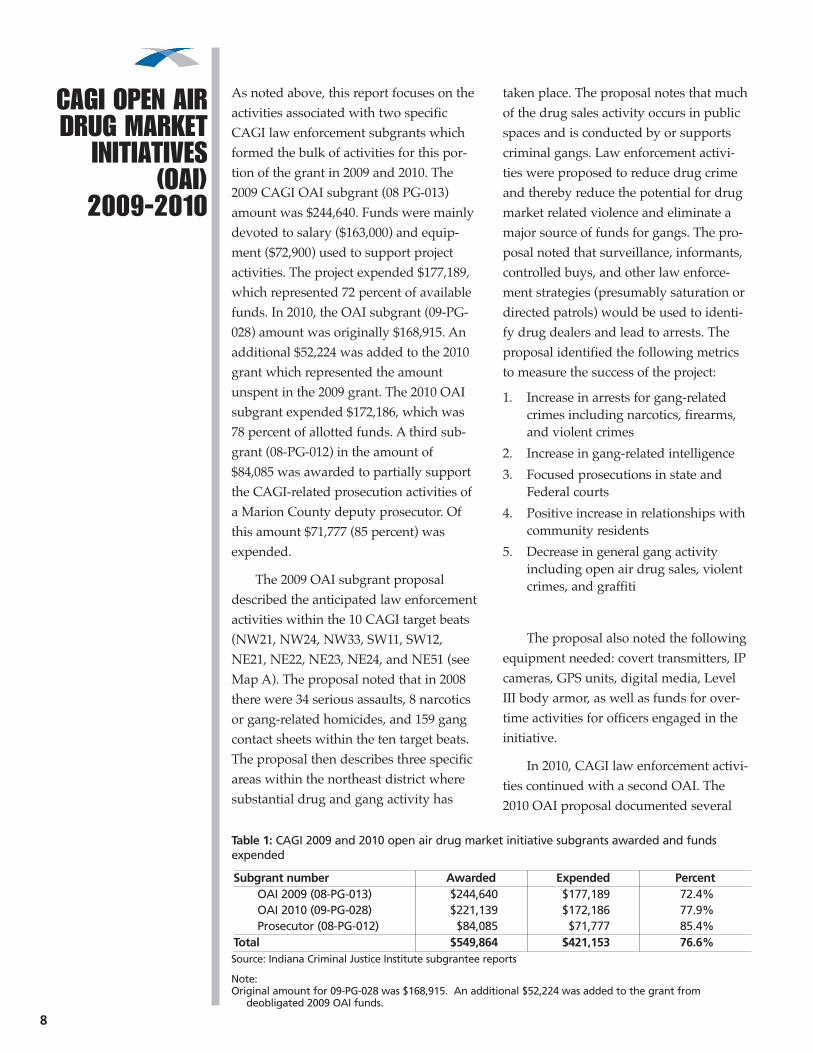
As noted above, this report focuses on theactivities associated with two specificCAGI law enforcement subgrants whichformed the bulk of activities for this por-tion of the grant in 2009 and 2010. The2009 CAGI OAI subgrant (08 PG-013)amount was $244,640. Funds were mainlydevoted to salary ($163,000) and equip-ment ($72,900) used to support projectactivities. The project expended $177,189,which represented 72 percent of availablefunds. In 2010, the OAI subgrant (09-PG-028) amount was originally $168,915. Anadditional $52,224 was added to the 2010grant which represented the amountunspent in the 2009 grant. The 2010 OAIsubgrant expended $172,186, which was78 percent of allotted funds. A third sub-grant (08-PG-012) in the amount of$84,085 was awarded to partially supportthe CAGI-related prosecution activities ofa Marion County deputy prosecutor. Ofthis amount $71,777 (85 percent) wasexpended.
The 2009 OAI subgrant proposaldescribed the anticipated law enforcementactivities within the 10 CAGI target beats(NW21, NW24, NW33, SW11, SW12,NE21, NE22, NE23, NE24, and NE51 (seeMap A). The proposal noted that in 2008there were 34 serious assaults, 8 narcoticsor gang-related homicides, and 159 gangcontact sheets within the ten target beats.The proposal then describes three specificareas within the northeast district wheresubstantial drug and gang activity has
taken place. The proposal notes that muchof the drug sales activity occurs in publicspaces and is conducted by or supportscriminal gangs. Law enforcement activi-ties were proposed to reduce drug crimeand thereby reduce the potential for drugmarket related violence and eliminate amajor source of funds for gangs. The pro-posal noted that surveillance, informants,controlled buys, and other law enforce-ment strategies (presumably saturation ordirected patrols) would be used to identi-fy drug dealers and lead to arrests. Theproposal identified the following metricsto measure the success of the project:
1. Increase in arrests for gang-relatedcrimes including narcotics, firearms,and violent crimes
2. Increase in gang-related intelligence
3. Focused prosecutions in state andFederal courts
4. Positive increase in relationships withcommunity residents
5. Decrease in general gang activityincluding open air drug sales, violentcrimes, and graffiti
The proposal also noted the followingequipment needed: covert transmitters, IPcameras, GPS units, digital media, LevelIII body armor, as well as funds for over-time activities for officers engaged in theinitiative.
In 2010, CAGI law enforcement activi-ties continued with a second OAI. The2010 OAI proposal documented several
CAGI OPEN AIRDRUG MARKET
INITIATIVES(OAI)
2009-2010
8
Table 1: CAGI 2009 and 2010 open air drug market initiative subgrants awarded and fundsexpended
Source: Indiana Criminal Justice Institute subgrantee reports
Note:Original amount for 09-PG-028 was $168,915. An additional $52,224 was added to the grant from
deobligated 2009 OAI funds.
Subgrant number Awarded Expended PercentOAI 2009 (08-PG-013) $244,640 $177,189 72.4%OAI 2010 (09-PG-028) $221,139 $172,186 77.9%Prosecutor (08-PG-012) $84,085 $71,777 85.4%
Total $549,864 $421,153 76.6%

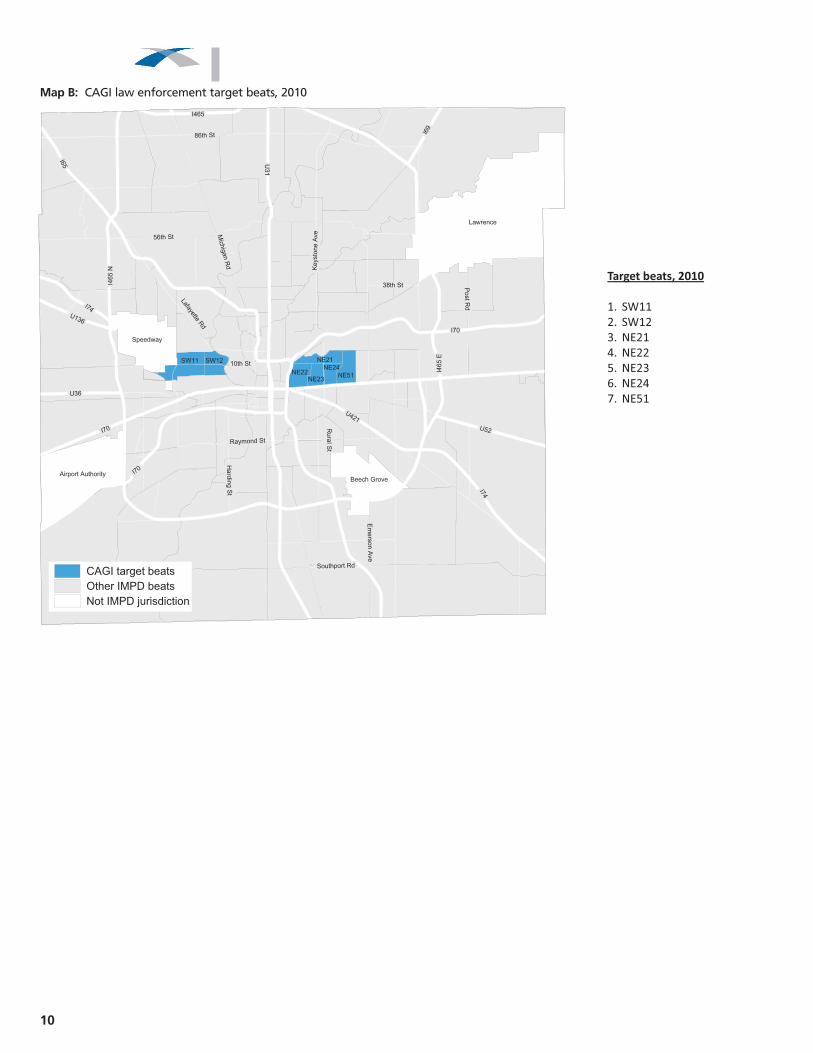
areas of progress in the CAGI targetenforcement areas as a result of the 2009OAI activities such as arrests and gangmembers identified. The 2010 CAGI OAIlisted several target areas, some of whichwere beats and some of which were small-er areas. To simplify the visualization ofthe areas that were targeted, each smallerarea was aggregated up to the entire beat.Map B shows the seven CAGI target beatsfor 2010 which include SW11, SW12, andNE21, NE22, NE23, NE24, and NE51.Perhaps not coincidentally, these were theareas of highest concentrations of activityin 2009. These areas appeared to be muchmore concentrated than the 2009 approachand appeared to take advantage of theknowledge gained from conducting the2009 OAI. For example, rather than target-
ing entire areas, in some cases, the pro-posed enforcement would focus on busi-nesses identified as supporting drug andgang activities or individuals identified inprior investigations. The proposal identi-fied the following metrics to measure thesuccess of the project, which were verysimilar to the 2009 metrics:
1. Increased awareness of gang-relatedcrimes including narcotics, firearms,and violent crimes
2. Increase in gang-related intelligence
3. Focused prosecutions in state andFederal courts
4. Positive increase in relationships withcommunity residents
5. Decrease in general gang activityincluding open air drug sales, violentcrimes, and graffiti
9
Lawrence
Airport Authority
Speedway
Beech Grove
NW33
NW24
NW21
SW11
NE51NE22
SW12 NE21
NE23
NE24
Ha
rdin
g S
t
I70
I465
Ke
ysto
ne
Ave
U31
86th St
I74
I70
Lafayette Rd
I65
10th St
Po
st R
d
56th St
Em
ers
on
Ave
I69
Raymond St
U136
U421
Ru
ral S
t
Southport Rd
38th St
U52
Mic
hig
an R
d
I465 N
I46
5 E
U36
I74
I70
Other IMPD beats
CAGI target beats
Not IMPD jurisdiction
Map A: CAGI law enforcement target beats, 2009
10
Target beats, 2010 1. SW11 2. SW12 3. NE21 4. NE22 5. NE23 6. NE24 7. NE51
Lawrence
Airport Authority
Speedway
Beech Grove
SW11
NE51NE22
SW12 NE21
NE23
NE24
Ha
rdin
g S
t
I70
I465
Ke
ysto
ne
Ave
U31
86th St
I74
I70
Lafayette Rd
I65
10th St
Po
st R
d
56th St
Em
ers
on
Ave
I69
Raymond St
U136
U421
Ru
ral S
t
Southport Rd
38th St
U52
Mic
hig
an R
d
I46
5 N
I46
5 E
U36
I74I70
Other IMPD beats
CAGI target beats
Not IMPD jurisdiction
Map B: CAGI law enforcement target beats, 2010
The goal of the CCJR OAI evaluation wasto document the activities of the 2009 and2010 OAI and to evaluate the impact ofCAGI drug market enforcement activitieson crime in the area. The focus of this reportwill be to document the 2009 and 2010 OAIactivities. Examination of the impact of theinitiatives on crime in the selected beats willbe included in a later report once enoughdata are available in the period followingCAGI activity to examine monthly beat-level trends in crime over time before, dur-ing, and after the 2009 and 2010 initiatives.
The proposed strategy for documentingOAI activities included attempts to collectthe following information:
• Gang members identified in OAItargeted areas
• OAI target area arrests
• OAI specific prosecutions generallyand specific gang charges pursued
• OAI specific weapon and drugseizures, and assets forfeited
Data Sources
The data used to document 2009-10 OAIactivities come from four main sources:IMPD Tiburon reports, the Marion CountyGang Database, a relational database main-tained by the IMPD for 2010 OAI activities,and data on prosecutions/convictionsmaintained by the MCPO. Additional back-ground information was obtained throughcommunications with IMPD, the MCPO,and interim reports on the project to theCAGI Steering Committee.
The major source of data for this reportis the Tiburon incident reporting system.Tiburon reports are generated for all inci-dents involving IMPD officers. Incidents caninclude arrests but also include traffic stops,collection of evidence, interviews of suspectsor victims, and a host of other activitiesinvolving police. These incident reports notethe location of the activity, the date and time
of the activity, the nature of the incidentfrom a lengthy list of Tiburon incidentcodes, individuals involved, propertyseized, and a narrative of the incident.IMPD maintained hard copy files of allTiburon incident reports associated with the2009 and 2010 CAGI OAI activities. Fromthese files, a list of all CAGI OAI Tiburonreport numbers were compiled. Electroniccopies of these reports were obtained fromthe IMPD crime analysis unit. One limita-tion of the Tiburon system that posed a realchallenge to data collection efforts is thatmost relevant information is placed into asingle narrative field. This made cleaningthe data and compilation of relevant infor-mation highly time consuming. Nearly allinformation relating to 2009 and 2010 CAGIOAI activities comes from these Tiburonreports, unless otherwise noted. Because the2009 and 2010 OAI activities appeared tohave two different underlying logics (as willbe discussed further below) and come fromtwo separate subgrants, the activities of eachwill be discussed separately beginning with2009 activities.
Throughout the project, CCJRresearchers worked closely with IMPD andCAGI staff to try to systematically collectcomprehensive data on the 2009 and 2010OAI. These efforts led to a large amount ofdata being available for analysis, whichcame mainly in the form of Tiburon incidentreports. Attempts to move beyond existingIMPD tracking tools were less successful. Forexample, in 2010, a database was developedto track the gang ties of arrestees, what ledofficers to be involved with a particular situ-ation, and what resulted from the incident(e.g., new confidential informant, evidenceleading to a search warrant, among otherthings). However, such activities are some-what labor intensive and possibly as a resultof this, the database was not as comprehen-sive as it might have been and informationwas only available for 2010.
EVALUATIONSTRATEGY
11

There were a total of 225 Tiburon reports
identified in connection with the CAGI 2009
OAI. Each was geocoded by CCJR
researchers in terms of latitude and longi-
tude and assigned an IMPD beat. Table 2
documents the locations of these reports by
beat by month. Seventeen reports listed an
IMPD district office as their location. Table 2
shows that the heaviest months of activity
were from July through October 2009, with
the most activity noted in August 2009 with
71 Tiburon reports listed in that month.
CAGI target beats accounted for over half
the reports listed in Table 2 with NE24 hav-
ing the most reports (28), followed by
SW11. Some Tiburon reports are associated
with CAGI OAI activities, but fall outside
the target beats. The reason for this is that
criminals involved in gangs and drugs
appear to move quite freely within the city
of Indianapolis. Therefore, an investigation
of drug activity in NE24 might lead to a
search or arrest warrant being served else-
where. From this perspective, the number
of associated reports outside the target
beats does not indicate a lack of focus on
the part of the police but rather the com-
plexity and fluidity of the crime and crimi-
nals being targeted.
2009 OPEN AIRDRUG MARKET
INITIATIVE (OAI)RESULTS
12
Table 2: CAGI OAI Tiburon incident reports by month and beat, 2009
Source: IMPD Tiburon incident reports associated with CAGI OAI activities
Notes: There was one incident report listed as being CAGI-related in each month for January, February, and March, 2009, prior to the start of the OAI
initiative. These reports are most likely indirectly related to legitimate CAGI 2009 OAI activities. This could be because a person was arrested who was a suspect in a prior case, for example.
All other includes NE65, DT31, ND21, ND43, NE22, NW24, and SE13 with two CAGI OAI incident reports each in 2009. DT12, ND22, ND23, NE14, NE32, NE33, NE54, NE64, NW13, NW21, NW72, SE11, SE21, SE22, SE42, Speedway, SW61, SW82 each reported one CAGI-related incident report in 2009.
May June July August September October November TotalBeat Count % Count % Count % Count % Count % Count % Count % Count %
SE district office 0 0.0% 2 22.2% 1 3.3% 6 8.5% 1 2.0% 2 4.2% 0 0.0% 12 5.3%
SW district office 0 0.0% 0 0.0% 0 0.0% 2 2.8% 0 0.0% 2 4.2% 0 0.0% 4 1.8%
NE district office 1 8.3% 0 0.0% 0 0.0% 0 0.0% 0 0.0% 0 0.0% 0 0.0% 1 0.4%
CAGI targetNE24 1 8.3% 2 22.2% 7 23.3% 15 21.1% 3 5.9% 0 0.0% 0 0.0% 28 12.4%
SW11 0 0.0% 0 0.0% 0 0.0% 4 5.6% 5 9.8% 10 20.8% 2 50.0% 21 9.3%
NE23 0 0.0% 0 0.0% 5 16.7% 11 15.5% 1 2.0% 0 0.0% 0 0.0% 17 7.6%
NE51 0 0.0% 2 22.2% 2 6.7% 9 12.7% 2 3.9% 0 0.0% 0 0.0% 15 6.7%
NE21 0 0.0% 0 0.0% 5 16.7% 7 9.9% 2 3.9% 0 0.0% 0 0.0% 14 6.2%
SW12 0 0.0% 0 0.0% 0 0.0% 2 2.8% 5 9.8% 2 4.2% 0 0.0% 9 4.0%
Non-targetAll other 5 41.7% 3 33.3% 3 10.0% 8 11.3% 10 19.6% 3 6.3% 0 0.0% 32 14.2%
NE11 0 0.0% 0 0.0% 0 0.0% 0 0.0% 6 11.8% 14 29.2% 0 0.0% 20 8.9%
NE12 0 0.0% 0 0.0% 0 0.0% 0 0.0% 9 17.6% 9 18.8% 0 0.0% 18 8.0%
NE13 0 0.0% 0 0.0% 0 0.0% 0 0.0% 3 5.9% 3 6.3% 0 0.0% 6 2.7%
SW13 0 0.0% 0 0.0% 1 3.3% 0 0.0% 0 0.0% 3 6.3% 2 50.0% 6 2.7%
NE31 0 0.0% 0 0.0% 1 3.3% 2 2.8% 2 3.9% 0 0.0% 0 0.0% 5 2.2%
DT32 1 8.3% 0 0.0% 0 0.0% 3 4.2% 0 0.0% 0 0.0% 0 0.0% 4 1.8%
SE12 0 0.0% 0 0.0% 3 10.0% 0 0.0% 1 2.0% 0 0.0% 0 0.0% 4 1.8%
DT21 2 16.7% 0 0.0% 1 3.3% 0 0.0% 0 0.0% 0 0.0% 0 0.0% 3 1.3%
DT22 2 16.7% 0 0.0% 0 0.0% 1 1.4% 0 0.0% 0 0.0% 0 0.0% 3 1.3%
NE53 0 0.0% 0 0.0% 1 3.3% 1 1.4% 1 2.0% 0 0.0% 0 0.0% 3 1.3%
Total 12 100.0% 9 100.0% 30 100.0% 71 100.0% 51 100.0% 48 100.0% 4 100.0% 225 100.0%
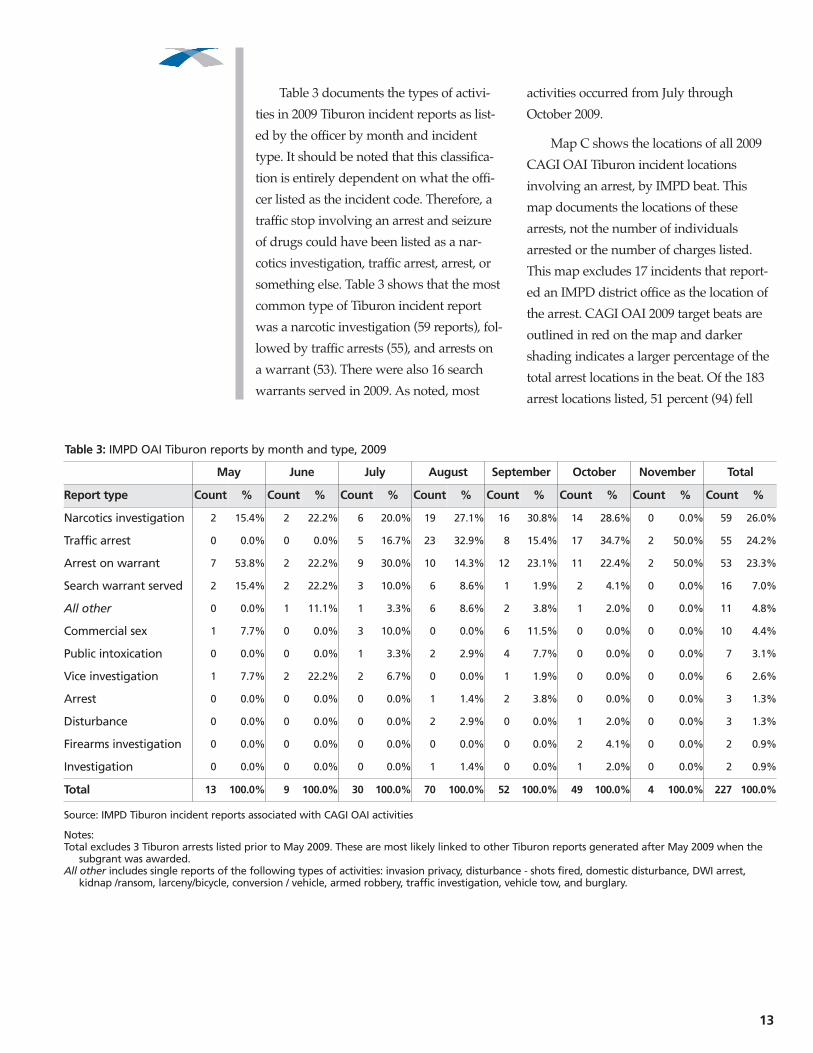
Table 3 documents the types of activi-
ties in 2009 Tiburon incident reports as list-
ed by the officer by month and incident
type. It should be noted that this classifica-
tion is entirely dependent on what the offi-
cer listed as the incident code. Therefore, a
traffic stop involving an arrest and seizure
of drugs could have been listed as a nar-
cotics investigation, traffic arrest, arrest, or
something else. Table 3 shows that the most
common type of Tiburon incident report
was a narcotic investigation (59 reports), fol-
lowed by traffic arrests (55), and arrests on
a warrant (53). There were also 16 search
warrants served in 2009. As noted, most
activities occurred from July through
October 2009.
Map C shows the locations of all 2009
CAGI OAI Tiburon incident locations
involving an arrest, by IMPD beat. This
map documents the locations of these
arrests, not the number of individuals
arrested or the number of charges listed.
This map excludes 17 incidents that report-
ed an IMPD district office as the location of
the arrest. CAGI OAI 2009 target beats are
outlined in red on the map and darker
shading indicates a larger percentage of the
total arrest locations in the beat. Of the 183
arrest locations listed, 51 percent (94) fell
13
Table 3: IMPD OAI Tiburon reports by month and type, 2009
Source: IMPD Tiburon incident reports associated with CAGI OAI activities
Notes:Total excludes 3 Tiburon arrests listed prior to May 2009. These are most likely linked to other Tiburon reports generated after May 2009 when the
subgrant was awarded.All other includes single reports of the following types of activities: invasion privacy, disturbance - shots fired, domestic disturbance, DWI arrest,
kidnap /ransom, larceny/bicycle, conversion / vehicle, armed robbery, traffic investigation, vehicle tow, and burglary.
May June July August September October November Total
Report type Count % Count % Count % Count % Count % Count % Count % Count %
Narcotics investigation 2 15.4% 2 22.2% 6 20.0% 19 27.1% 16 30.8% 14 28.6% 0 0.0% 59 26.0%
Traffic arrest 0 0.0% 0 0.0% 5 16.7% 23 32.9% 8 15.4% 17 34.7% 2 50.0% 55 24.2%
Arrest on warrant 7 53.8% 2 22.2% 9 30.0% 10 14.3% 12 23.1% 11 22.4% 2 50.0% 53 23.3%
Search warrant served 2 15.4% 2 22.2% 3 10.0% 6 8.6% 1 1.9% 2 4.1% 0 0.0% 16 7.0%
All other 0 0.0% 1 11.1% 1 3.3% 6 8.6% 2 3.8% 1 2.0% 0 0.0% 11 4.8%
Commercial sex 1 7.7% 0 0.0% 3 10.0% 0 0.0% 6 11.5% 0 0.0% 0 0.0% 10 4.4%
Public intoxication 0 0.0% 0 0.0% 1 3.3% 2 2.9% 4 7.7% 0 0.0% 0 0.0% 7 3.1%
Vice investigation 1 7.7% 2 22.2% 2 6.7% 0 0.0% 1 1.9% 0 0.0% 0 0.0% 6 2.6%
Arrest 0 0.0% 0 0.0% 0 0.0% 1 1.4% 2 3.8% 0 0.0% 0 0.0% 3 1.3%
Disturbance 0 0.0% 0 0.0% 0 0.0% 2 2.9% 0 0.0% 1 2.0% 0 0.0% 3 1.3%
Firearms investigation 0 0.0% 0 0.0% 0 0.0% 0 0.0% 0 0.0% 2 4.1% 0 0.0% 2 0.9%
Investigation 0 0.0% 0 0.0% 0 0.0% 1 1.4% 0 0.0% 1 2.0% 0 0.0% 2 0.9%
Total 13 100.0% 9 100.0% 30 100.0% 70 100.0% 52 100.0% 49 100.0% 4 100.0% 227 100.0%

within CAGI target beats and 49 percent
(89) fell outside CAGI target areas. The map
clearly indicates that arrest activities listed
as being associated with CAGI were spread
throughout much of the midsection of the
city of Indianapolis. Map C also shows that
arrest locations were concentrated within
the target beats of NE21, 23, 24, and 51, as
well as SW11 and 12. Some additional arrest
activities appeared to be concentrated in
beats adjacent to the target beats such as
NE13, 31.
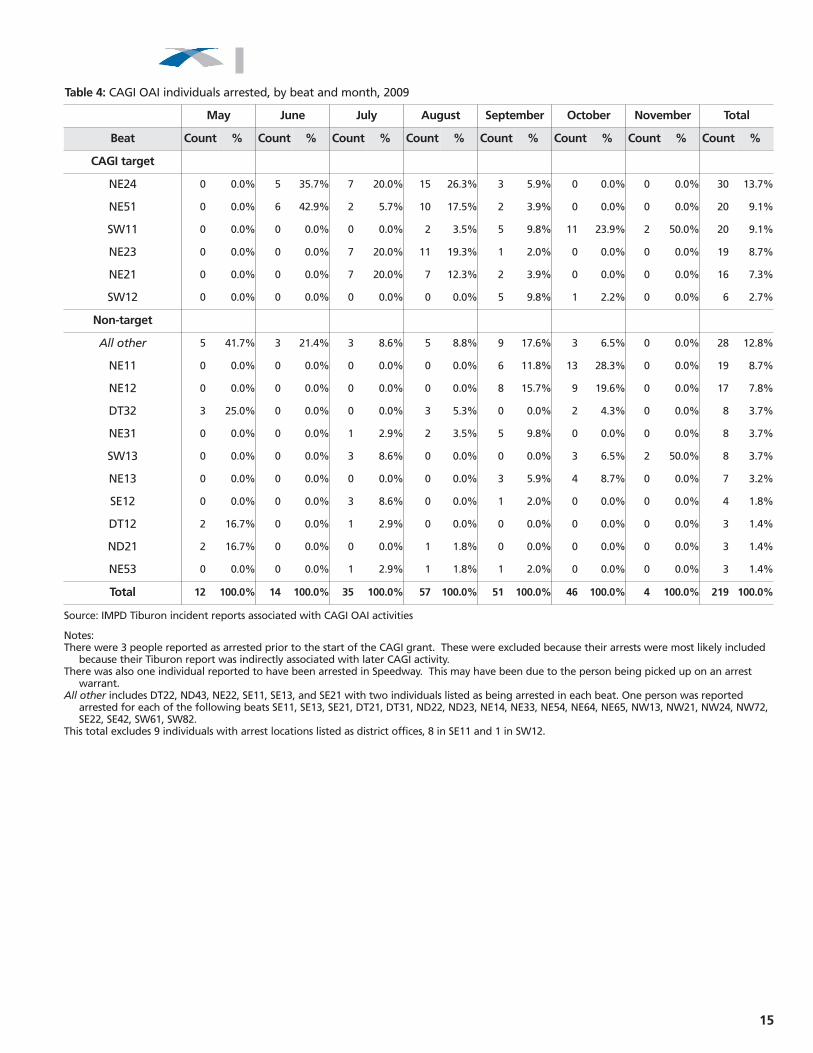
Table 4 shows the number of individu-
als arrested monthly by beat as listed in
CAGI Tiburon reports in 2009. There were a
total of 219 individuals arrested in 2009,
with the majority arrested from July
through October; the largest number of
arrests were in August (57) and September
(51). The largest number of individuals was
arrested in NE24 (30), NE51 (20), and SW11
(20). Each CAGI target beat listed at least
one individual arrested, with the exception
of NW33. More than half of arrestees were
arrested in CAGI target beats, but as with
other CAGI activity, arrests were spread
throughout a large number of IMPD beats.
More than 40 beats listed at least one CAGI
OAI arrest.
14
Number of arrests, 2009 CAGI target beats: 94 (51%) Other beats: 89 (49%) TOTAL: 183
Lawrence
Airport AuthorityBeech Grove
Ha
rdin
g S
t
I70
I465
Ke
ysto
ne
Ave
U31
86th St
I74
US40
Lafayette Rd
I65
10th St
Po
st R
d
56th St
Em
ers
on
Ave
I69
Raymond St
U136
U421
Ru
ral S
t
Southport Rd
38th St
U52
Mic
hig
an R
d
I465 N
I46
5 E
U36
I74
I70
SE420.5%
NE640.5%
SW820.5%
Speedway0.5%
NE651.6%
NE330.5%
NW720.5%
SW132.7%
SW610.5%
ND211.1%
NE531.6%
NE312.2%
NE540.5%
NE140.5%
ND220.5%
SE122.2%
SE131.1%
NW210.5% NE12
9.3%
SW119.3%
SE220.5%
NW130.5%
ND230.5%
NE118.2%
SE210.5%
SE110.5%
NE132.7%
ND431.1%
NE517.1%
NE221.1%
SW123.8%
NE218.2%
NE238.2%
DT323.3%
NE2412.6%
DT120.5% DT21
1.1%
DT221.1%
DT310.5%
NW240.5%
NW330.0%
Beat classification CAGI target beats
% of total arrests
Not IMPD jurisdiction
Not CAGI target beats
0
>0% to 1%
1% to 2%
2% to 3%
>=3%
Map C: CAGI OAI Tiburon incident locations involving an arrest, by IMPD beat, 2009
15
Table 4: CAGI OAI individuals arrested, by beat and month, 2009
Source: IMPD Tiburon incident reports associated with CAGI OAI activities
Notes:There were 3 people reported as arrested prior to the start of the CAGI grant. These were excluded because their arrests were most likely included
because their Tiburon report was indirectly associated with later CAGI activity.There was also one individual reported to have been arrested in Speedway. This may have been due to the person being picked up on an arrest
warrant.All other includes DT22, ND43, NE22, SE11, SE13, and SE21 with two individuals listed as being arrested in each beat. One person was reported
arrested for each of the following beats SE11, SE13, SE21, DT21, DT31, ND22, ND23, NE14, NE33, NE54, NE64, NE65, NW13, NW21, NW24, NW72, SE22, SE42, SW61, SW82.
This total excludes 9 individuals with arrest locations listed as district offices, 8 in SE11 and 1 in SW12.
May June July August September October November Total
Beat Count % Count % Count % Count % Count % Count % Count % Count %
CAGI target
NE24 0 0.0% 5 35.7% 7 20.0% 15 26.3% 3 5.9% 0 0.0% 0 0.0% 30 13.7%
NE51 0 0.0% 6 42.9% 2 5.7% 10 17.5% 2 3.9% 0 0.0% 0 0.0% 20 9.1%
SW11 0 0.0% 0 0.0% 0 0.0% 2 3.5% 5 9.8% 11 23.9% 2 50.0% 20 9.1%
NE23 0 0.0% 0 0.0% 7 20.0% 11 19.3% 1 2.0% 0 0.0% 0 0.0% 19 8.7%
NE21 0 0.0% 0 0.0% 7 20.0% 7 12.3% 2 3.9% 0 0.0% 0 0.0% 16 7.3%
SW12 0 0.0% 0 0.0% 0 0.0% 0 0.0% 5 9.8% 1 2.2% 0 0.0% 6 2.7%
Non-target
All other 5 41.7% 3 21.4% 3 8.6% 5 8.8% 9 17.6% 3 6.5% 0 0.0% 28 12.8%
NE11 0 0.0% 0 0.0% 0 0.0% 0 0.0% 6 11.8% 13 28.3% 0 0.0% 19 8.7%
NE12 0 0.0% 0 0.0% 0 0.0% 0 0.0% 8 15.7% 9 19.6% 0 0.0% 17 7.8%
DT32 3 25.0% 0 0.0% 0 0.0% 3 5.3% 0 0.0% 2 4.3% 0 0.0% 8 3.7%
NE31 0 0.0% 0 0.0% 1 2.9% 2 3.5% 5 9.8% 0 0.0% 0 0.0% 8 3.7%
SW13 0 0.0% 0 0.0% 3 8.6% 0 0.0% 0 0.0% 3 6.5% 2 50.0% 8 3.7%
NE13 0 0.0% 0 0.0% 0 0.0% 0 0.0% 3 5.9% 4 8.7% 0 0.0% 7 3.2%
SE12 0 0.0% 0 0.0% 3 8.6% 0 0.0% 1 2.0% 0 0.0% 0 0.0% 4 1.8%
DT12 2 16.7% 0 0.0% 1 2.9% 0 0.0% 0 0.0% 0 0.0% 0 0.0% 3 1.4%
ND21 2 16.7% 0 0.0% 0 0.0% 1 1.8% 0 0.0% 0 0.0% 0 0.0% 3 1.4%
NE53 0 0.0% 0 0.0% 1 2.9% 1 1.8% 1 2.0% 0 0.0% 0 0.0% 3 1.4%
Total 12 100.0% 14 100.0% 35 100.0% 57 100.0% 51 100.0% 46 100.0% 4 100.0% 219 100.0%

Table 5 shows the charges that were
listed in 2009 CAGI OAI Tiburon reports.
There were a total of 305 charges listed at
the time of arrest. This exceeds the number
of arrestees because some individuals were
charged with more than one offense at the
time of arrest. In terms of the types of
charges, approximately 40 percent were
drug-related (trafficking 16 percent, posses-
sion 24 percent). The largest percentage of
both trafficking (13 percent) and possession
(12 percent) charges were felonies for
cocaine or narcotics. Approximately 21 per-
cent were for license violations, such as
driving on a suspended license. An addi-
tional eight percent were re-arrests on war-
rants from prior charges.
Map D shows the locations for CAGI
OAI Tiburon reports involving drug
seizures. In 2009, a total of 59 separate
Tiburon incident locations involving drug
seizures listed an identifiable address other
than a district office (14 incidents in 2009
listed district offices as the location and are
therefore excluded). Forty-seven percent of
these 59 locations were within CAGI target
beats. The largest percentage were in CAGI
target beats SW11, NE24, and NE51 (each
with 11.9 percent), followed by two non-
CAGI beats NE11 and NE12 (each with 8.5
percent). Drug seizure locations were con-
centrated within or very near CAGI target
beats with the exception of a small percent-
age of seizures in several IMPD beats in the
16
Table 5: CAGI OAI charges at arrest by type, 2009
Source: IMPD Tiburon incident reports associated with CAGI OAI activities
Notes:Individuals can be arrested on multiple charges so the number of charges will exceed the number of
ndividuals arrested.All other includes two charges each of OWI, battery, Burglary, Disorderly conduct, Neglect of dependent,
and robbery. Harassment, invasion of privacy, obstruction of justice, auto theft, conversion, forgery, and criminal recklessness were each listed once as charges.
FA, FB, FC, and FD refer to levels of felony charges. MA, MB, MC refer to levels of misdemeanor charges.
By offenseDrug trafficking Count PercentDealing cocaine or narcotics FA/FB 41 13.4%Dealing marijuana or hashish FC/FD 3 1.0%Dealing marijuana or hashish MA 3 1.0%Dealing sched. 1-3 controlled substance FA/FB 1 0.3%Drug possessionPossession of cocaine or narcotics FA-FD 37 12.1%Possession of marijuana or hashish MA 15 4.9%Possession of paraphernalia 13 4.3%Possession of controlled substance FD 3 1.0%Possession of look-alike substance MA-MC 2 0.7%Possession of marijuana or hashish FD 2 0.7%OtherLicense violations 65 21.3%Rearrest warrant 23 7.5%All other 19 6.2%Prostitution MA 14 4.6%resisting law enforcement 14 4.6%Theft FC/FD 12 3.9%Public intoxication MB 10 3.3%Visiting a common nuisance MB 10 3.3%Traffic violations 8 2.6%Firearms violations 7 2.3%Unknown 3 1.0%
Overall total number of charges 305 100.0%

17
Number of drug seizure incidents, 2009 CAGI target beats: 28 (47%) Other beats:31 (53%)TOTAL: 59
Lawrence
Beech Grove
Ha
rdin
g S
t
I70
I465
Ke
ysto
ne
Ave
U31
86th St
I74
US40
Lafayette Rd
I65
10th St
Po
st R
d
56th St
Em
ers
on
Ave
I69
Raymond St
U136
U421
Ru
ral S
t
Southport Rd
38th St
U52
Mic
hig
an R
d
I46
5 N
I46
5 E
U36
I74
I70
Airport Authority
Speedway
NE641.7%
NE651.7%
NE331.7%
SW135.1%
NE321.7%
NW330.0%
ND211.7%
NE311.7%
ND221.7%
SE123.4%
SE131.7%
NW240.0%
NW210.0%
NE128.5%
SW1111.9%
NE118.5%
SE211.7%
SE111.7%
NE133.4%
NE5111.9%NE22
0.0%
SW125.1%
NE213.4%
NE233.4%
DT321.7%
NE2411.9%
DT221.7%
DT313.4%
Beat classification CAGI target beats
Not IMPD jurisdiction
Not CAGI target beats
% of drug seizure incidents
>0% to 2%
2% to 4%
4% to 6%
>6%
0
Map D: CAGI OAI Tiburon incident locations involving drug seizures, by IMPD beat, 2009
Number of search warrants, 2009 CAGI target beats: 9 (56%)Other beats: 7 (44%) TOTAL: 16
Lawrence
Beech Grove
Ha
rdin
g S
t
I70
I465
Ke
ysto
ne
Ave
U31
86th St
I74
US40
Lafayette Rd
I65
10th St
Po
st R
d
56th St
Em
ers
on
Ave
I69
Raymond St
U136
U421
Ru
ral S
t
Southport Rd
U52
Mic
hig
an R
d
I46
5 N
I46
5 E
I74
I70
U36
38th St
Airport Authority
Speedway
NE64
NE65
NW72
NE32
NW33
ND21
NW24
NW21
SW11
SE11
NE51NE22
SW12NE21
NE23
NE24DT22
Beat classification CAGI target beats
Not IMPD jurisdiction
Other IMPD beats
Search warrants 0
1
2
4
Map E: CAGI OAI search warrants, by IMPD beat, 2009

east central part of Marion County. No
seizures were listed within CAGI target
beats NW21, NW24, NW33, or NE22.
Map E shows the locations of search
warrants executed in 2009 as documented
in CAGI OAI Tiburon reports. Nine (56 per-
cent) of 16 search warrants were executed
within CAGI target beats. Eight of nine
CAGI target beat search warrants were
within NE district and half of those were in
beat NE51. Only one search warrant was
executed in SW district (SW12) and none
were executed within NW district CAGI
target beats. One search warrant was exe-
cuted in seven non-CAGI target beats in
2009: NW72, ND21, NE32, NE64, NE65, SE
11, and DT22.
Table 6 lists the number of incident
reports listing seizures of firearms or
money in 2009 CAGI-related incident
reports. Specific counts or descriptions of
firearms or cash dollar amounts could not
be derived from the information available.
In 2009, 15 CAGI-related incident reports
listed at least one firearm seized and 22
listed cash seized. October saw the most
firearm seizure incidents with 5, followed
by August (3). August (7) and October (5)
had the largest number of cash seizure
incidents.
The Tiburon incident information was
largely devoid of any reference to gangs.
The term gang only appeared once in any
2009 Tiburon report reviewed here.
Therefore, to examine the connection of
2009 CAGI OAI activity with gangs, addi-
tional information was sought from IMPD
liaisons. IMPD officials maintained a record
of cases that were forwarded to the CAGI-
dedicated prosecutor each month. These
cases were considered the most serious
cases of arrests made during CAGI activi-
ties. A manual search of the IMPD gang
database was conducted to determine
whether the names of arrestees in forward-
ed cases were listed as known or suspected
gang members in 2009. Table 7 shows the
number of total arrestees in cases sent to the
CAGI prosecutor and the number of known
or suspected gang members located in the
IMPD gang database. Overall, 19 of 96 (20
percent) arrestees were located within the
gang database. The largest percentage was
in August, when 35 percent (6 of 17)
arrestees were known or suspected gang
members. In July and October just less than
one-quarter of arrestees in each month were
known or suspected gang members, fol-
lowed by September (16 percent).
18
Table 6: CAGI OAI Tiburon incident reports noting seizures of firearms and money, by month, 2009
Source: IMPD Tiburon incident reports associated with CAGI OAI activities
May June July August September October TotalSeized Count % Count % Count % Count % Count % Count % Count %Firearm 2 66.7% 1 33.3% 2 40.0% 3 30.0% 2 33.3% 5 50.0% 15 40.5%Money 1 33.3% 2 66.7% 3 60.0% 7 70.0% 4 66.7% 5 50.0% 22 59.5%Total 3 100.0% 3 100.0% 5 100.0% 10 100.0% 6 100.0% 10 100.0% 37 100.0%
Table 7: Known or suspected gang members in cases sent to CAGI prosecutor, 2009
Source: CAGI OAI monthly summaries of cases forwarded to CAGI prosecutor and IMPD gang database.
June July August September October TotalCount % Count % Count % Count % Count % Count %
Known/suspected gang member
0 0.0% 4 22.2% 6 35.3% 4 16.0% 5 22.7% 19 19.8%
Arrestees 14 100.0% 18 100.0% 17 100.0% 25 100.0% 22 100.0% 96 100.0%

Table 8 shows the charges listed in the
monthly reports sent to the CAGI prosecu-
tor in 2009. Note that the number of charges
is less than the number of individual in
Table 4 and arrest charges in Table 5
because not all cases were forwarded to the
CAGI prosecutor. Only 96 of 219 CAGI
arrestees were handled by the CAGI prose-
cutor, accounting for 111 of 305 charges ini-
tially listed in CAGI Tiburon reports.
Although a reduction of this magnitude
might seem surprising, this does not mean
the remaining individuals were not prose-
cuted and convicted. The exact number of
these cases resulting in prosecution was
beyond the scope of the available data.
Certainly some percentage of these cases
were prosecuted and resulted in convic-
tions. However, because they were not
assigned to the CAGI prosecutor, tracking
them was impossible without access to the
Justis system (which CCJR researchers did
not have). In each month from June
through October 2009, there were 16 to 28
charges sent to the CAGI prosecutor for
review by IMPD. Nearly one-third (30 per-
cent) of these charges were for drug traffick-
ing. An additional 19 percent were for drug
possession. The most common other offens-
es were warrant arrests (17 percent) and
prostitution (14 percent).
19
June July August September October TotalCount % Count % Count % Count % Count % Count %
Drug trafficking
Dealing in cocaine or narcotic/ FB 4 25.0% 2 9.1% 6 33.3% 0 0.0% 5 18.5% 17 15.3%
Dealing in cocaine or narcotic/ FA 2 12.5% 3 13.6% 1 5.6% 2 7.1% 2 7.4% 10 9.0%
Dealing in marijuana MA 0 0.0% 1 4.5% 3 16.7% 0 0.0% 0 0.0% 4 3.6%
Dealing in cont subst or heroin/ FB 0 0.0% 0 0.0% 0 0.0% 1 3.6% 1 3.7% 2 1.8%
Drug possession\Possess cocaine/ FD 0 0.0% 0 0.0% 0 0.0% 4 14.3% 4 14.8% 8 7.2%Possess paraphernalia FD/MA 1 6.3% 2 9.1% 1 5.6% 1 3.6% 3 11.1% 8 7.2%
Possess marijuana or hash FD/MA 0 0.0% 0 0.0% 1 5.6% 3 10.7% 1 3.7% 5 4.5%
OtherWarrant arrests 1 6.3% 3 13.6% 1 5.6% 8 28.6% 6 22.2% 19 17.1%Prostitution FD/MA 8 50.0% 5 22.7% 0 0.0% 2 7.1% 0 0.0% 15 13.5%Weapons charges 0 0.0% 0 0.0% 1 5.6% 3 10.7% 2 7.4% 6 5.4%Resisting law enforcement 0 0.0% 0 0.0% 3 16.7% 2 7.1% 0 0.0% 5 4.5%
Visiting a common nuisance/ MB 0 0.0% 4 18.2% 0 0.0% 0 0.0% 0 0.0% 4 3.6%
All other 0 0.0% 0 0.0% 1 5.6% 2 7.1% 1 3.7% 4 3.6%Operating vehicle illegally 0 0.0% 0 0.0% 0 0.0% 0 0.0% 2 7.4% 2 1.8%Criminal recklessness/ MA 0 0.0% 2 9.1% 0 0.0% 0 0.0% 0 0.0% 2 1.8%Total 16 100.0% 22 100.0% 18 100.0% 28 100.0% 27 100.0% 111 100.0%
Table 8: CAGI OAI charges sent to CAGI prosecutor by IMPD, 2009.
Source: CAGI OAI monthly summaries of cases forwarded to CAGI prosecutor for review.
Notes:All other includes one charge each for: public intoxication, burglary, patronizing a prostitute, theft;receiving stolen property.FA, FB, FC, and FD refer to levels of felony charges. MA, MB, MC refer to levels of misdemeanor charges.Information here is not directly comparable with other tables because the nature of the database is different.
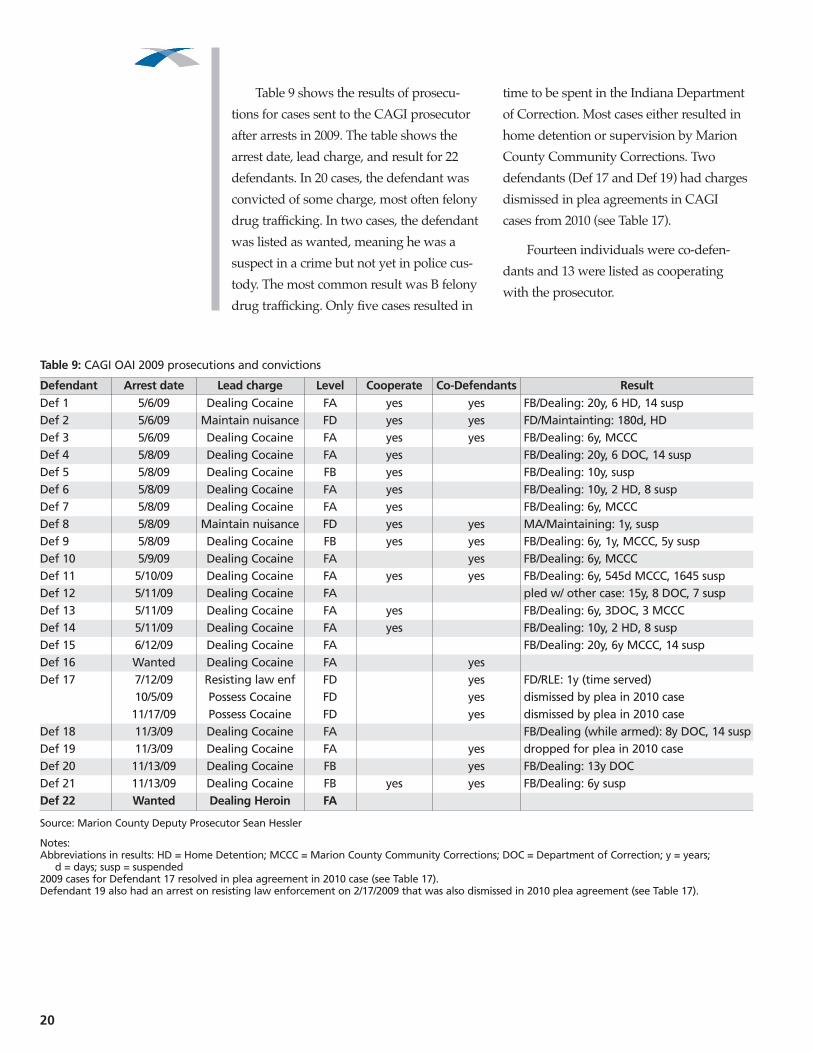
Table 9 shows the results of prosecu-
tions for cases sent to the CAGI prosecutor
after arrests in 2009. The table shows the
arrest date, lead charge, and result for 22
defendants. In 20 cases, the defendant was
convicted of some charge, most often felony
drug trafficking. In two cases, the defendant
was listed as wanted, meaning he was a
suspect in a crime but not yet in police cus-
tody. The most common result was B felony
drug trafficking. Only five cases resulted in
time to be spent in the Indiana Department
of Correction. Most cases either resulted in
home detention or supervision by Marion
County Community Corrections. Two
defendants (Def 17 and Def 19) had charges
dismissed in plea agreements in CAGI
cases from 2010 (see Table 17).
Fourteen individuals were co-defen-
dants and 13 were listed as cooperating
with the prosecutor.
20
Table 9: CAGI OAI 2009 prosecutions and convictions
Source: Marion County Deputy Prosecutor Sean Hessler
Notes:Abbreviations in results: HD = Home Detention; MCCC = Marion County Community Corrections; DOC = Department of Correction; y = years;
d = days; susp = suspended2009 cases for Defendant 17 resolved in plea agreement in 2010 case (see Table 17).Defendant 19 also had an arrest on resisting law enforcement on 2/17/2009 that was also dismissed in 2010 plea agreement (see Table 17).
Defendant Arrest date Lead charge Level Cooperate Co-Defendants ResultDef 1 5/6/09 Dealing Cocaine FA yes yes FB/Dealing: 20y, 6 HD, 14 suspDef 2 5/6/09 Maintain nuisance FD yes yes FD/Maintainting: 180d, HDDef 3 5/6/09 Dealing Cocaine FA yes yes FB/Dealing: 6y, MCCCDef 4 5/8/09 Dealing Cocaine FA yes FB/Dealing: 20y, 6 DOC, 14 suspDef 5 5/8/09 Dealing Cocaine FB yes FB/Dealing: 10y, suspDef 6 5/8/09 Dealing Cocaine FA yes FB/Dealing: 10y, 2 HD, 8 suspDef 7 5/8/09 Dealing Cocaine FA yes FB/Dealing: 6y, MCCCDef 8 5/8/09 Maintain nuisance FD yes yes MA/Maintaining: 1y, suspDef 9 5/8/09 Dealing Cocaine FB yes yes FB/Dealing: 6y, 1y, MCCC, 5y suspDef 10 5/9/09 Dealing Cocaine FA yes FB/Dealing: 6y, MCCCDef 11 5/10/09 Dealing Cocaine FA yes yes FB/Dealing: 6y, 545d MCCC, 1645 suspDef 12 5/11/09 Dealing Cocaine FA pled w/ other case: 15y, 8 DOC, 7 suspDef 13 5/11/09 Dealing Cocaine FA yes FB/Dealing: 6y, 3DOC, 3 MCCCDef 14 5/11/09 Dealing Cocaine FA yes FB/Dealing: 10y, 2 HD, 8 suspDef 15 6/12/09 Dealing Cocaine FA FB/Dealing: 20y, 6y MCCC, 14 suspDef 16 Wanted Dealing Cocaine FA yesDef 17 7/12/09 Resisting law enf FD yes FD/RLE: 1y (time served)
10/5/09 Possess Cocaine FD yes dismissed by plea in 2010 case11/17/09 Possess Cocaine FD yes dismissed by plea in 2010 case
Def 18 11/3/09 Dealing Cocaine FA FB/Dealing (while armed): 8y DOC, 14 suspDef 19 11/3/09 Dealing Cocaine FA yes dropped for plea in 2010 caseDef 20 11/13/09 Dealing Cocaine FB yes FB/Dealing: 13y DOCDef 21 11/13/09 Dealing Cocaine FB yes yes FB/Dealing: 6y suspDef 22 Wanted Dealing Heroin FA
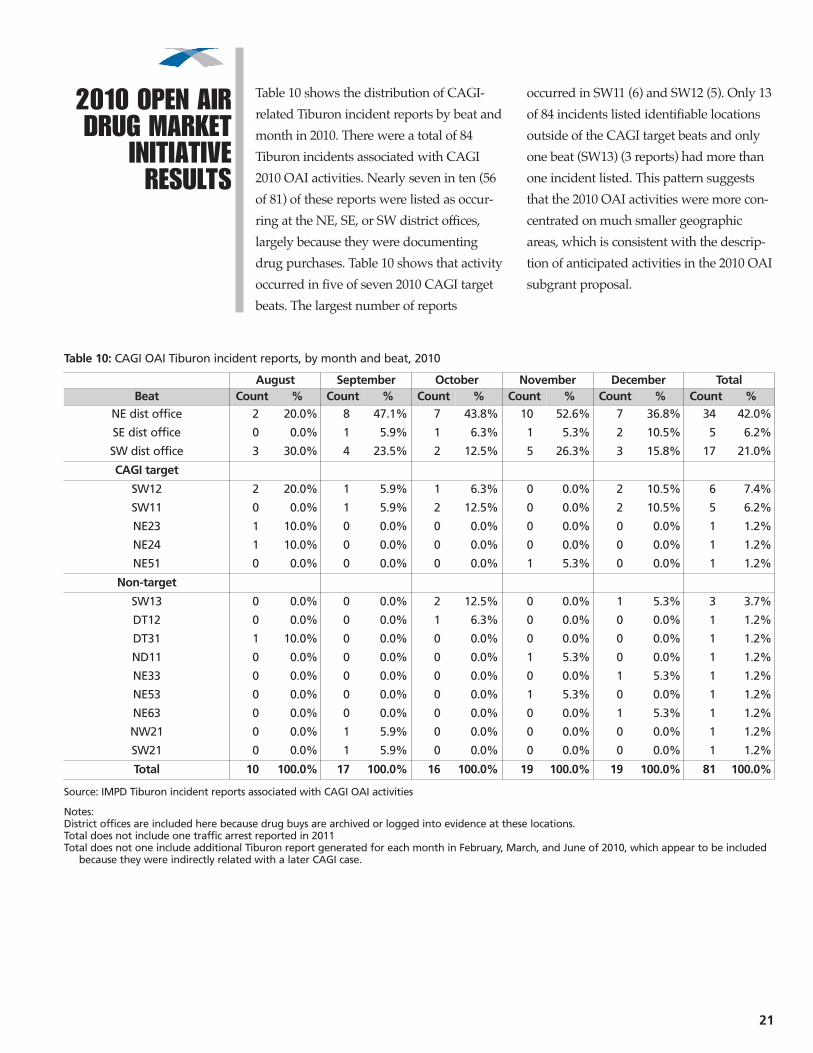
Table 10 shows the distribution of CAGI-
related Tiburon incident reports by beat and
month in 2010. There were a total of 84
Tiburon incidents associated with CAGI
2010 OAI activities. Nearly seven in ten (56
of 81) of these reports were listed as occur-
ring at the NE, SE, or SW district offices,
largely because they were documenting
drug purchases. Table 10 shows that activity
occurred in five of seven 2010 CAGI target
beats. The largest number of reports
occurred in SW11 (6) and SW12 (5). Only 13
of 84 incidents listed identifiable locations
outside of the CAGI target beats and only
one beat (SW13) (3 reports) had more than
one incident listed. This pattern suggests
that the 2010 OAI activities were more con-
centrated on much smaller geographic
areas, which is consistent with the descrip-
tion of anticipated activities in the 2010 OAI
subgrant proposal.
2010 OPEN AIRDRUG MARKET
INITIATIVERESULTS
21
August September October November December TotalBeat Count % Count % Count % Count % Count % Count %
NE dist office 2 20.0% 8 47.1% 7 43.8% 10 52.6% 7 36.8% 34 42.0%
SE dist office 0 0.0% 1 5.9% 1 6.3% 1 5.3% 2 10.5% 5 6.2%
SW dist office 3 30.0% 4 23.5% 2 12.5% 5 26.3% 3 15.8% 17 21.0%
CAGI target
SW12 2 20.0% 1 5.9% 1 6.3% 0 0.0% 2 10.5% 6 7.4%
SW11 0 0.0% 1 5.9% 2 12.5% 0 0.0% 2 10.5% 5 6.2%
NE23 1 10.0% 0 0.0% 0 0.0% 0 0.0% 0 0.0% 1 1.2%
NE24 1 10.0% 0 0.0% 0 0.0% 0 0.0% 0 0.0% 1 1.2%
NE51 0 0.0% 0 0.0% 0 0.0% 1 5.3% 0 0.0% 1 1.2%
Non-target
SW13 0 0.0% 0 0.0% 2 12.5% 0 0.0% 1 5.3% 3 3.7%
DT12 0 0.0% 0 0.0% 1 6.3% 0 0.0% 0 0.0% 1 1.2%
DT31 1 10.0% 0 0.0% 0 0.0% 0 0.0% 0 0.0% 1 1.2%
ND11 0 0.0% 0 0.0% 0 0.0% 1 5.3% 0 0.0% 1 1.2%
NE33 0 0.0% 0 0.0% 0 0.0% 0 0.0% 1 5.3% 1 1.2%
NE53 0 0.0% 0 0.0% 0 0.0% 1 5.3% 0 0.0% 1 1.2%
NE63 0 0.0% 0 0.0% 0 0.0% 0 0.0% 1 5.3% 1 1.2%
NW21 0 0.0% 1 5.9% 0 0.0% 0 0.0% 0 0.0% 1 1.2%
SW21 0 0.0% 1 5.9% 0 0.0% 0 0.0% 0 0.0% 1 1.2%
Total 10 100.0% 17 100.0% 16 100.0% 19 100.0% 19 100.0% 81 100.0%
Table 10: CAGI OAI Tiburon incident reports, by month and beat, 2010
Source: IMPD Tiburon incident reports associated with CAGI OAI activities
Notes:District offices are included here because drug buys are archived or logged into evidence at these locations.Total does not include one traffic arrest reported in 2011Total does not one include additional Tiburon report generated for each month in February, March, and June of 2010, which appear to be included
because they were indirectly related with a later CAGI case.
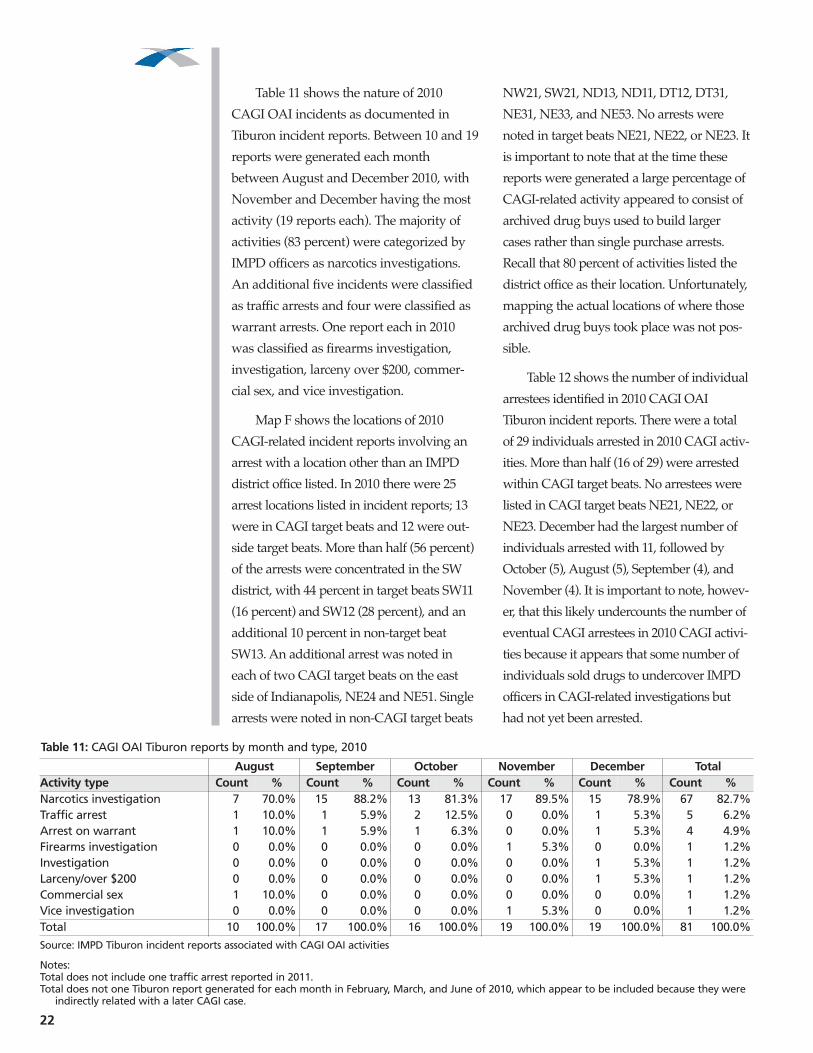
Table 11 shows the nature of 2010
CAGI OAI incidents as documented in
Tiburon incident reports. Between 10 and 19
reports were generated each month
between August and December 2010, with
November and December having the most
activity (19 reports each). The majority of
activities (83 percent) were categorized by
IMPD officers as narcotics investigations.
An additional five incidents were classified
as traffic arrests and four were classified as
warrant arrests. One report each in 2010
was classified as firearms investigation,
investigation, larceny over $200, commer-
cial sex, and vice investigation.
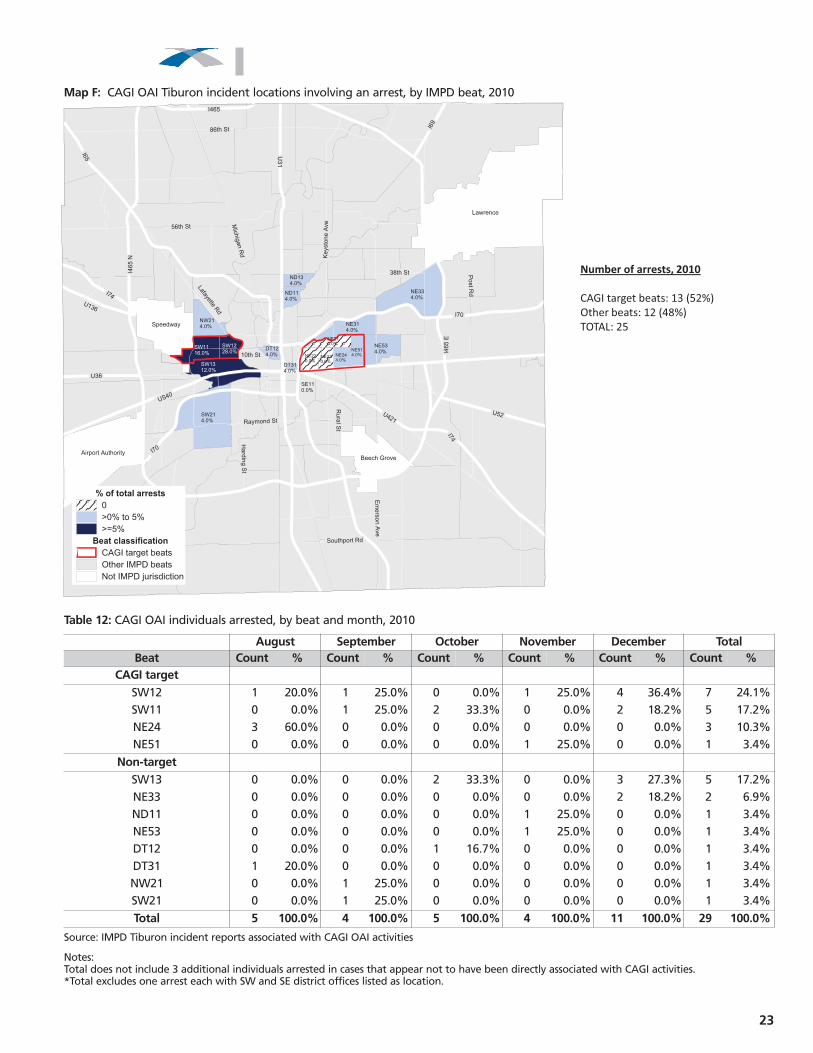
Map F shows the locations of 2010
CAGI-related incident reports involving an
arrest with a location other than an IMPD
district office listed. In 2010 there were 25
arrest locations listed in incident reports; 13
were in CAGI target beats and 12 were out-
side target beats. More than half (56 percent)
of the arrests were concentrated in the SW
district, with 44 percent in target beats SW11
(16 percent) and SW12 (28 percent), and an
additional 10 percent in non-target beat
SW13. An additional arrest was noted in
each of two CAGI target beats on the east
side of Indianapolis, NE24 and NE51. Single
arrests were noted in non-CAGI target beats
NW21, SW21, ND13, ND11, DT12, DT31,
NE31, NE33, and NE53. No arrests were
noted in target beats NE21, NE22, or NE23. It
is important to note that at the time these
reports were generated a large percentage of
CAGI-related activity appeared to consist of
archived drug buys used to build larger
cases rather than single purchase arrests.
Recall that 80 percent of activities listed the
district office as their location. Unfortunately,
mapping the actual locations of where those
archived drug buys took place was not pos-
sible.
Table 12 shows the number of individual
arrestees identified in 2010 CAGI OAI
Tiburon incident reports. There were a total
of 29 individuals arrested in 2010 CAGI activ-
ities. More than half (16 of 29) were arrested
within CAGI target beats. No arrestees were
listed in CAGI target beats NE21, NE22, or
NE23. December had the largest number of
individuals arrested with 11, followed by
October (5), August (5), September (4), and
November (4). It is important to note, howev-
er, that this likely undercounts the number of
eventual CAGI arrestees in 2010 CAGI activi-
ties because it appears that some number of
individuals sold drugs to undercover IMPD
officers in CAGI-related investigations but
had not yet been arrested.
22
Table 11: CAGI OAI Tiburon reports by month and type, 2010
Source: IMPD Tiburon incident reports associated with CAGI OAI activities
Notes:Total does not include one traffic arrest reported in 2011.Total does not one Tiburon report generated for each month in February, March, and June of 2010, which appear to be included because they were
indirectly related with a later CAGI case.
August September October November December TotalActivity type Count % Count % Count % Count % Count % Count %Narcotics investigation 7 70.0% 15 88.2% 13 81.3% 17 89.5% 15 78.9% 67 82.7%Traffic arrest 1 10.0% 1 5.9% 2 12.5% 0 0.0% 1 5.3% 5 6.2%Arrest on warrant 1 10.0% 1 5.9% 1 6.3% 0 0.0% 1 5.3% 4 4.9%Firearms investigation 0 0.0% 0 0.0% 0 0.0% 1 5.3% 0 0.0% 1 1.2%Investigation 0 0.0% 0 0.0% 0 0.0% 0 0.0% 1 5.3% 1 1.2%Larceny/over $200 0 0.0% 0 0.0% 0 0.0% 0 0.0% 1 5.3% 1 1.2%Commercial sex 1 10.0% 0 0.0% 0 0.0% 0 0.0% 0 0.0% 1 1.2%Vice investigation 0 0.0% 0 0.0% 0 0.0% 1 5.3% 0 0.0% 1 1.2%Total 10 100.0% 17 100.0% 16 100.0% 19 100.0% 19 100.0% 81 100.0%
23
Number of arrests, 2010 CAGI target beats: 13 (52%) Other beats: 12 (48%) TOTAL: 25
Lawrence
Beech Grove
Ha
rdin
g S
t
I70
I465
Ke
ysto
ne
Ave
U31
86th St
I74
US40
Lafayette Rd
I65
10th St
Po
st R
d
56th St
Em
ers
on
Ave
I69
Raymond St
U136
U421
Ru
ral S
t
Southport Rd
38th St
U52
Mic
hig
an R
d
I46
5 N
I46
5 E
U36
I74
I70
Airport Authority
Speedway
SW214.0%
NE334.0%
SW1312.0%
NE534.0%
NE314.0%
NW214.0%
SW1116.0%
SE110.0%
NE514.0%NE22
0.0%
SW1228.0%
NE210.0%
ND114.0%
ND134.0%
NE230.0%
NE244.0%
DT124.0%
DT314.0%
Beat classification CAGI target beats
Not IMPD jurisdiction
Other IMPD beats
% of total arrests 0
>0% to 5%
>=5%
Map F: CAGI OAI Tiburon incident locations involving an arrest, by IMPD beat, 2010
August September October November December TotalBeat Count % Count % Count % Count % Count % Count %
CAGI targetSW12 1 20.0% 1 25.0% 0 0.0% 1 25.0% 4 36.4% 7 24.1%SW11 0 0.0% 1 25.0% 2 33.3% 0 0.0% 2 18.2% 5 17.2%NE24 3 60.0% 0 0.0% 0 0.0% 0 0.0% 0 0.0% 3 10.3%NE51 0 0.0% 0 0.0% 0 0.0% 1 25.0% 0 0.0% 1 3.4%
Non-targetSW13 0 0.0% 0 0.0% 2 33.3% 0 0.0% 3 27.3% 5 17.2%NE33 0 0.0% 0 0.0% 0 0.0% 0 0.0% 2 18.2% 2 6.9%ND11 0 0.0% 0 0.0% 0 0.0% 1 25.0% 0 0.0% 1 3.4%NE53 0 0.0% 0 0.0% 0 0.0% 1 25.0% 0 0.0% 1 3.4%DT12 0 0.0% 0 0.0% 1 16.7% 0 0.0% 0 0.0% 1 3.4%DT31 1 20.0% 0 0.0% 0 0.0% 0 0.0% 0 0.0% 1 3.4%NW21 0 0.0% 1 25.0% 0 0.0% 0 0.0% 0 0.0% 1 3.4%SW21 0 0.0% 1 25.0% 0 0.0% 0 0.0% 0 0.0% 1 3.4%Total 5 100.0% 4 100.0% 5 100.0% 4 100.0% 11 100.0% 29 100.0%
Table 12: CAGI OAI individuals arrested, by beat and month, 2010
Source: IMPD Tiburon incident reports associated with CAGI OAI activities
Notes:Total does not include 3 additional individuals arrested in cases that appear not to have been directly associated with CAGI activities.*Total excludes one arrest each with SW and SE district offices listed as location.

24
Table 13: CAGI OAI charges at arrest, by type, 2010
Source: IMPD Tiburon incident reports associated with CAGI OAI activities
Notes:Excludes one case of driving with license suspended in 2011.Individuals can be arrested on multiple charges so the number of charges will exceed the number of
individuals arrested.FA, FB, FC, and FD refer to levels of felony charges. MA, MB, MC refer to levels of misdemeanor charges.
By offenseDrug trafficking Count PercentDealing cocaine or narcotic FA/FB 9 14.3%Dealing marijuana or hashish FC/FD 8 12.7%Dealing counterfeit substance/FD 1 1.6%Drug possessionPossession of cocaine or narcotic FA-FD 7 11.1%Possession of marijuana or hashish FD 5 7.9%Possession of marijuana or hashish MA 5 7.9%Possession of controlled substance FD 3 4.8%Possession of paraphernalia FD 1 1.6%Possession of paraphernalia MA 1 1.6%OtherLicense violations 9 14.3%Rearrest warrant 3 4.8%Prostitution MA 2 3.2%Resisting law enforcement 2 3.2%Unknown 2 3.2%Firearms violations 1 1.6%Theft FC/FD 1 1.6%Traffic 1 1.6%Identity deception FD 1 1.6%Public indecency MA/MC 1 1.6%
Total 63 100.0%
August September October November December TotalBeat Count % Count % Count % Count % Count % Count %
NE dist office 2 28.6% 8 50.0% 7 58.3% 10 62.5% 7 46.7% 34 51.5%SW dist office 3 42.9% 4 25.0% 1 8.3% 4 25.0% 3 20.0% 15 22.7%SE dist office 0 0.0% 1 6.3% 1 8.3% 1 6.3% 2 13.3% 5 7.6%CAGI target
SW12 0 0.0% 1 6.3% 0 0.0% 0 0.0% 1 6.7% 2 3.0%NE23 1 14.3% 0 0.0% 0 0.0% 0 0.0% 0 0.0% 1 1.5%NE24 1 14.3% 0 0.0% 0 0.0% 0 0.0% 0 0.0% 1 1.5%NE51 0 0.0% 0 0.0% 0 0.0% 1 6.3% 0 0.0% 1 1.5%SW11 0 0.0% 0 0.0% 1 8.3% 0 0.0% 0 0.0% 1 1.5%
Non-targetSW13 0 0.0% 0 0.0% 1 8.3% 0 0.0% 1 6.7% 2 3.0%DT12 0 0.0% 0 0.0% 1 8.3% 0 0.0% 0 0.0% 1 1.5%NE33 0 0.0% 0 0.0% 0 0.0% 0 0.0% 1 6.7% 1 1.5%NW21 0 0.0% 1 6.3% 0 0.0% 0 0.0% 0 0.0% 1 1.5%SW21 0 0.0% 1 6.3% 0 0.0% 0 0.0% 0 0.0% 1 1.5%Total 7 100.0% 16 100.0% 12 100.0% 16 100.0% 15 100.0% 66 100.0%
Table 14: CAGI OAI Tiburon reports noting drugs seized, by beat and month, 2010
Source: IMPD Tiburon incident reports associated with CAGI OAI activities
Notes:Excludes one drug seizure in February 2010 in NE 31 which was likely a separate incident that was associated with a later Tiburon report.District offices are included here because drug buys are archived or logged into evidence at these locations.
Lawrence
Beech Grove
Hard
ing
St
I70
I465
Ke
ysto
ne A
ve
U3
1
86th St
I74
US40
Lafayette Rd
I65
Post R
d
56th St
Em
ers
on A
ve
I69
Raymond St
U136
U421
Ru
ral S
t
Southport Rd
38th St
U52
Mic
hig
an R
d
I46
5 N
I46
5 E
U36
I74
I70
Airport Authority
Speedway
SW218.3%
NE338.3%
SW1316.7%
NE310.0%
NW218.3%
SW118.3%
NE518.3%NE22
0.0%
SW1216.7%
NE210.0%
NE238.3%
NE248.3%
DT128.3%
Beat classification CAGI target beats
Not IMPD jurisdiction
Not CAGI target beats
% of drug seizure incidents 0
>0% to 10%
>=10%
Map G: CAGI OAI Tiburon incident locations involving drug seizures, by IMPD beat, 2010
Table 13 shows the charges listed at
arrest. There were a total of 63 charges list-
ed. More than one-quarter (29 percent) of
arrests were for drug trafficking offenses,
most often for dealing cocaine. An addition-
al 35 percent of charges at arrest were for
drug possession. Thus, nearly two-thirds of
charges at arrest were drug-related, which
might be expected given that the activity is
designed to be an open air drug market
investigation. Another 14 percent of charges
were for driver’s license violations. The
remaining 22 percent of charges represent-
ed crimes such as prostitution, resisting law
enforcement, firearms violations, theft,
identity deception, and public indecency.
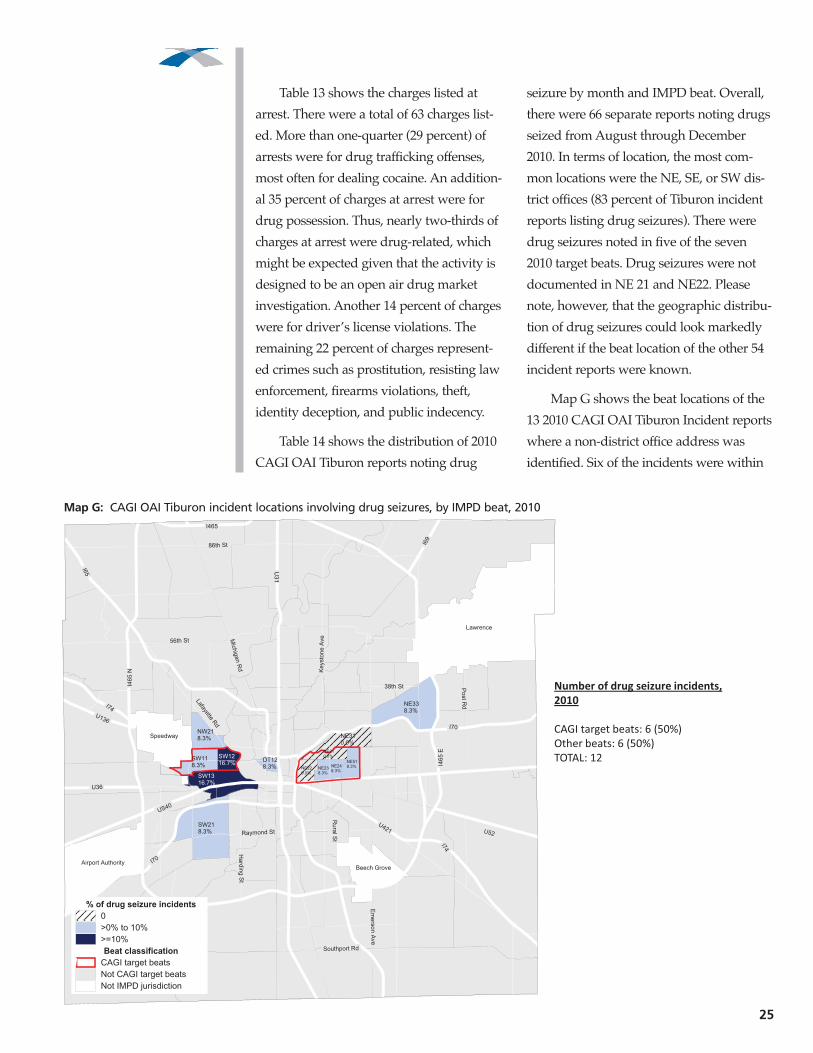
Table 14 shows the distribution of 2010
CAGI OAI Tiburon reports noting drug
seizure by month and IMPD beat. Overall,
there were 66 separate reports noting drugs
seized from August through December
2010. In terms of location, the most com-
mon locations were the NE, SE, or SW dis-
trict offices (83 percent of Tiburon incident
reports listing drug seizures). There were
drug seizures noted in five of the seven
2010 target beats. Drug seizures were not
documented in NE 21 and NE22. Please
note, however, that the geographic distribu-
tion of drug seizures could look markedly
different if the beat location of the other 54
incident reports were known.
Map G shows the beat locations of the
13 2010 CAGI OAI Tiburon Incident reports
where a non-district office address was
identified. Six of the incidents were within
25
Number of drug seizure incidents, 2010 CAGI target beats: 6 (50%)Other beats: 6 (50%) TOTAL: 12
CAGI target beats and seven were not. All
except one location was in or contiguous to
a 2010 CAGI target beat. Drug seizures
were not documented in CAGI target beats
NE21 or NE22. It is important to remember
that this picture might look quite different if
the actual locations of drug seizures that
listed IMPD district offices as locations were
known.
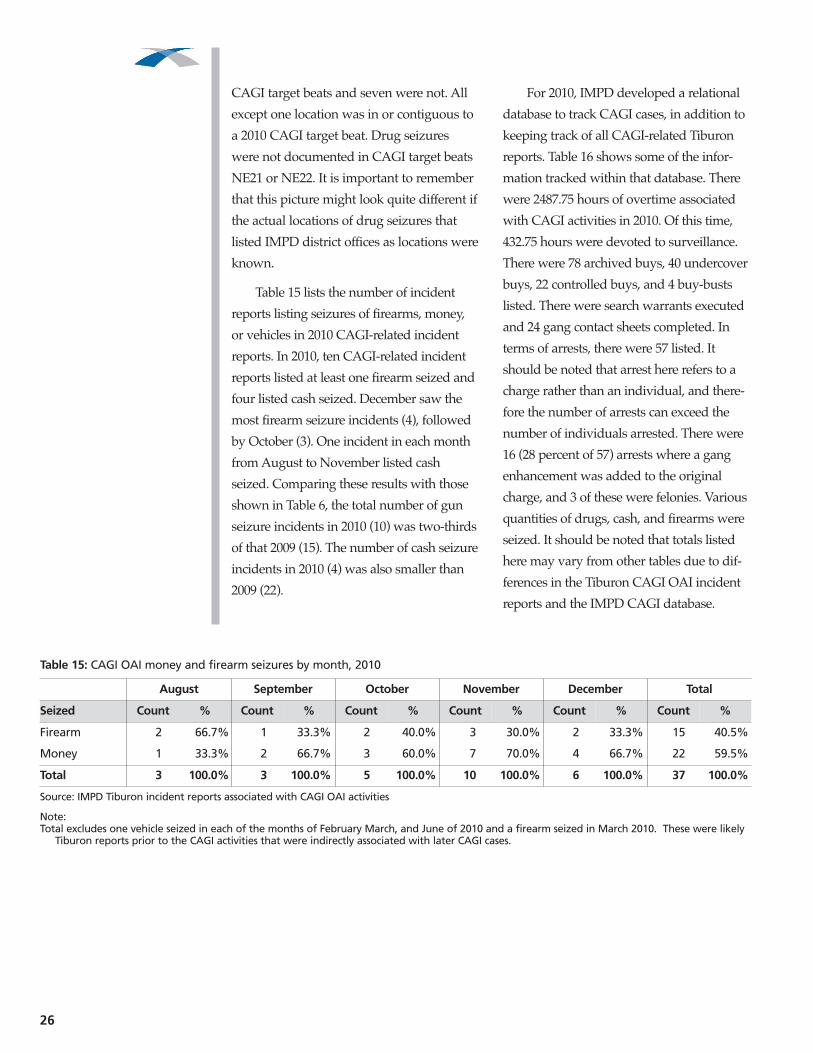
Table 15 lists the number of incident
reports listing seizures of firearms, money,
or vehicles in 2010 CAGI-related incident
reports. In 2010, ten CAGI-related incident
reports listed at least one firearm seized and
four listed cash seized. December saw the
most firearm seizure incidents (4), followed
by October (3). One incident in each month
from August to November listed cash
seized. Comparing these results with those
shown in Table 6, the total number of gun
seizure incidents in 2010 (10) was two-thirds
of that 2009 (15). The number of cash seizure
incidents in 2010 (4) was also smaller than
2009 (22).
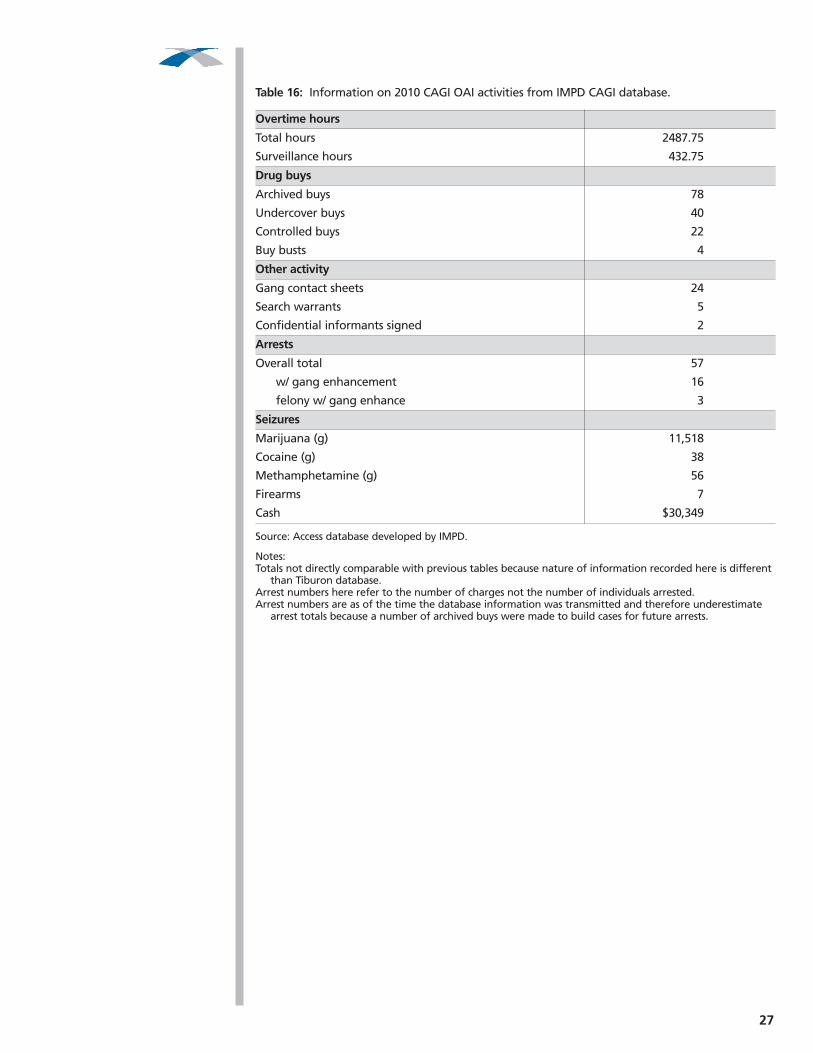
For 2010, IMPD developed a relational
database to track CAGI cases, in addition to
keeping track of all CAGI-related Tiburon
reports. Table 16 shows some of the infor-
mation tracked within that database. There
were 2487.75 hours of overtime associated
with CAGI activities in 2010. Of this time,
432.75 hours were devoted to surveillance.
There were 78 archived buys, 40 undercover
buys, 22 controlled buys, and 4 buy-busts
listed. There were search warrants executed
and 24 gang contact sheets completed. In
terms of arrests, there were 57 listed. It
should be noted that arrest here refers to a
charge rather than an individual, and there-
fore the number of arrests can exceed the
number of individuals arrested. There were
16 (28 percent of 57) arrests where a gang
enhancement was added to the original
charge, and 3 of these were felonies. Various
quantities of drugs, cash, and firearms were
seized. It should be noted that totals listed
here may vary from other tables due to dif-
ferences in the Tiburon CAGI OAI incident
reports and the IMPD CAGI database.
26
Table 15: CAGI OAI money and firearm seizures by month, 2010
Source: IMPD Tiburon incident reports associated with CAGI OAI activities
Note:Total excludes one vehicle seized in each of the months of February March, and June of 2010 and a firearm seized in March 2010. These were likely
Tiburon reports prior to the CAGI activities that were indirectly associated with later CAGI cases.
August September October November December Total
Seized Count % Count % Count % Count % Count % Count %
Firearm 2 66.7% 1 33.3% 2 40.0% 3 30.0% 2 33.3% 15 40.5%
Money 1 33.3% 2 66.7% 3 60.0% 7 70.0% 4 66.7% 22 59.5%
Total 3 100.0% 3 100.0% 5 100.0% 10 100.0% 6 100.0% 37 100.0%
27
Table 16: Information on 2010 CAGI OAI activities from IMPD CAGI database.
Source: Access database developed by IMPD.
Notes:Totals not directly comparable with previous tables because nature of information recorded here is different
than Tiburon database.Arrest numbers here refer to the number of charges not the number of individuals arrested.Arrest numbers are as of the time the database information was transmitted and therefore underestimate
arrest totals because a number of archived buys were made to build cases for future arrests.
Overtime hours
Total hours 2487.75
Surveillance hours 432.75
Drug buys
Archived buys 78
Undercover buys 40
Controlled buys 22
Buy busts 4
Other activity
Gang contact sheets 24
Search warrants 5
Confidential informants signed 2
Arrests
Overall total 57
w/ gang enhancement 16
felony w/ gang enhance 3
Seizures
Marijuana (g) 11,518
Cocaine (g) 38
Methamphetamine (g) 56
Firearms 7
Cash $30,349

Table 17 describes the results of prosecu-
tions for 18 defendants with arrests in 2010
related to CAGI OAI. Recall that two defen-
dants (17 and 19) had cases in 2009 that were
resolved in plea agreements in 2010 cases. As
with 2009, nearly all lead charges were for
felony drug trafficking. Given the dates of the
arrests listed here, it is likely that a large per-
centage of these cases were developed based
on 2009 CAGI OAI activities, particularly
those with arrest dates prior to August 2010.
However, it is impossible with available data
to distinguish which cases came from activi-
ties in 2009 or 2010. In 2010, 11 of 20 defen-
dant received time in the Indiana
Department of Correction. At the time of this
report, one individual was still listed as want -
ed for dealing heroin. Seven of 20 individuals
were co-defendants, and 12 of 20 were listed
as cooperating with the prosecutor.
Another portion of the relational data-
base maintained by IMPD for 2010 CAGI
OAI activities listed arrestees. Eleven of the
32 arrestees tracked in that database con-
tained some reference to gang affiliation
(suspected or confirmed as gang member or
specific gang affiliation). Most of these 32
individuals were successfully prosecuted, as
shown in Table 17.
28
Table 17: Prosecutions/convictions of 2010 CAGI OAI cases
Source: Excell Spread Sheet maintained by Marion County Gang Prosecutor
Notes:Although the arrest dates in these cases occurred in 2010, it is likely that a substantial number of them were related to 2009 CAGI OAI activities.
Unfortunately, determining which cases for which this is true was not possible with available data.Abbreviations in results: HD = Home Detention; MCCC = Marion County Community Corrections; DOC = Department of Correction; y = years; d =
days; susp = suspendedDefendant 19 also had arrests in 2009 that were resolved in 2010 plea agreement.Defendant 17 had arrests in 2009 that were dismissed in 2010 plea agreement.
Defendant Arrest date Lead charge Level Cooperate Co-Defendants ResultDef 17 4/20/10 Dealing Cocaine FA yes FB/Dealing: 20y DOCDef 19 4/24/10 Dealing Cocaine FA yes FA/Dealing: 20y DOC
3/20/10 Drive susp lic MA dismissed by pleaDef 23 1/15/10 Dealing Cocaine FA yes FA/Dealing: 20y DOC
1/15/10 Robbery FB FB/Robbery: 10y DOC1/15/10 Dealing Cocaine FB dismissed by plea
Def 24 1/15/10 Dealing Cocaine FA yes dismissed by plea4/24/10 Dealing Cocaine FA yes FA/Dealing: 25y DOC
Def 25 4/11/10 Dealing Cocaine FA yes to be refiled pending DNA analysis5/6/10 Dealing Cocaine FB to be refiled pending DNA analysis
Def 26 5/6/10 Dealing Cocaine FA yes yes FB/Dealing: 2y MCCC, 6y susp4/15/10 Possess Cocaine FD dismissed by plea
Def 27 4/24/10 Dealing Cocaine FA yes yes FD/Maintain Nusance: 1y suspDef 28 5/6/10 Dealing Cocaine FB FB/Dealing: 9y DOC, 11y suspDef 29 5/6/10 Dealing Cocaine FA yes FB/Dealing: 18y DOC Def 30 5/6/10 Dealing Cocaine FA yes FB/Dealing 2y MCCC, 4y suspDef 31 5/6/10 Dealing Cocaine FA yes FB/Dealing, 4y MCCC, 6y suspDef 32 5/7/10 Dealing Cocaine FA yes FB/Dealing: 3y MCCC, 9y suspDef 33 5/11/10 Dealing Cocaine FA yes FB/Dealing 1y (time served); 19y suspDef 34 5/12/10 Dealing Cocaine FB yes FB/Dealing: 6y DOC, 4y suspDef 35 5/20/10 Dealing Cocaine FA yes FB/Dealing: 20y suspDef 36 7/19/10 Dealing Heroin FA yes FB/Dealing: 6y DOCDef 37 7/21/10 Dealing Cocaine FA yes FB/Dealing: 6y DOCDef 38 8/19/10 Dealing Cocaine FA FB/Dealing: 12 y DOCDef 39 11/11/10 Dealing Cocaine FB FB/Dealing: 10y DOCDef 40 Wanted Dealing Heroin FA

The information presented here docu-ments the activities of the 2009 and 2010CAGI OAI by IMPD. The goal of the ini-tiatives was to reduce drug market activi-ty in open drug markets on the premisethat gangs were often involved in drugtrafficking. As such, the high number ofdrug arrests and prosecutions should notbe surprising.
In 2009, there were 219 individualsarrested on 305 charges according toCAGI-related Tiburon reports. More thanone-third of these charges (120) were fordrug trafficking or possession. More thanhalf (54 of 111) of charges forwarded to theCAGI prosecutor for review involveddrug possession or trafficking (most oftenat the felony level). For CAGI defendantsarrested in 2009, there were 22 listed asprosecuted according to the CAGI prose-cutor. In 20 of the 22 cases, the result wasa conviction. The remaining two caseswere individuals still wanted by police.The large majority of these cases involvedfelony drug trafficking.
In 2010, 29 individuals were arrestedon 63 charges. However, available infor-mation suggests that this likely underesti-mates the total number of arrests associat-ed with 2010 CAGI activities because alarge number of archived buys were madeto build cases for later prosecution.Similar to 2009, nearly two-thirds of thecharges at arrest were for drug traffickingor possession (mostly felony level). Of the20 cases forwarded to the CAGI prosecu-tor with a 2010 arrest data, 19 were con-victed (nearly all on dealing cocaine orheroin charges). One defendant was listedas wanted by police and two casesinvolved plea agreements to resolve 2009and 2010 cases.
Examination of the gang connection in2009 and 2010 CAGI activities was com-plicated by the fact that only one CAGI
OAI Tiburon report mentioned the wordgang. An examination of the gang data-base created by the IMPD show that of 96cases forwarded to the CAGI prosecutorin 2009, nearly 20 percent (19 individuals)were listed in the IMPD gang database asknown or suspected gang members. In2010, fewer individuals had been arrested.Examination of the relational databasemaintained by the IMPD showed that 11of 32 arrestees tracked there were listed assuspected or confirmed gang members.
One challenge to the documentationof the CAGI activities as it relates to show-ing a gang connection is that thereappears to be no systematic data collectionon which individuals confronted by policeare gang members/gang involved or sus-pected to have gang ties. There is a mech-anism for documenting this informationthrough gang contact sheets and onTiburon reports. However, IMPD officersdo not appear to systematically documentthis information. This may be because his-torically documentation of gang memberactivities was discouraged by IMPD andcity officials (noted by several officers inpersonal communications with theauthor). One consequence of this historicalaversion to documenting gang activities isthat only one Tiburon report of 315 associ-ated with 2009-2010 CAGI OAI activitiesmentioned the word gang.
It is important to note that the datareported here are only as accurate as theinformation provided in the data provid-ed, primarily Tiburon incident reports.Extensive examination of these reportssuggests that there are some limitationswhen using them as a primary source ofdata for this type of evaluation. For exam-ple, in 70 percent of 2010 CAGI OAI inci-dent reports the location of activity was adistrict office address. There may be goodreasons for this within the logic of the
ASSESSMENT OFCAGI 2009 AND2010 OPEN AIR
INITIATIVES
29

Tiburon system when it is used for policepurposes. However, this severely limits itsutility in documenting the geographic dis-tribution of CAGI activity relative toCAGI target beats.
Similarly, a relational database wasdeveloped by IMPD in consultation withCCJR researchers and maintained for2010. Unfortunately, there appeared to besome discrepancies between numbersderived from examination of CAGI-relat-ed Tiburon reports and the relational data-base. There may be good reasons for thedifferences but this would require exten-sive follow up to ascertain them.Originally it was envisioned that informa-tion would be kept for all CAGI-relatedactivities, specifically the lead informationsource (how the officer came to be investi-gating this person or situation) and theresult (e.g., probable cause for arrest,search warrant). This information wasonly entered for some Tiburon incidents,however.
It is also likely that the informationpresented here somewhat understates thegang connection to enforcement activitiesassociated with the 2009 and 2010 OAI.Reports from IMPD officers involved withthe project and follow up conversationswith them give the impression that gangsare heavily involved with drug traffickingin Indianapolis. It is possible that limita-
tions in the available tracking mechanismsmake this connection appear weaker thanit is. The degree to which this drug-gangconnection is underestimated in the cur-rent data is not knowable. Following sev-eral years of listening to law enforcementofficers while involved with this projectthere is a clear disconnect between whatthe available data show and the reality ofgang and gang-involved drug crime inIndianapolis. Efforts to track gang crimemore systematically in Indianapolis haveso far proved difficult to implement.
It does not appear that federal prose-cutions by the U.S. Attorney’s office weresignificant in the CAGI OAI cases. No fed-eral prosecutions were reported for in2009-2010 CAGI OAI cases. In future openair drug market investigations, additionalefforts should be made to enhance thenumber of federal prosecutions.
Attendance of several meetingsamong law enforcement and prosecutionby CCJR researchers suggests that theCAGI Prosecutor may have been engagedtoo early and as a result waited severalmonths while cases were being estab-lished for prosecution. Eventually the flowof cases was significant. To avoid this inthe future, it might make sense to have alag between when enforcement activitiesbegin and the dedicated prosecutor isengaged.
30
Based on the lessons learned from theseinitiatives, we make the following recom-mendations:
Operational issues for programs such as CAGI OAI 1. Develop a consistent definition of
gang crime, train officers on thisdefinition and ensure systematic gangdata collection.
2. Train officers on when and how to fillout gang contact sheets and ensurethat they do so when appropriate.
3. When initiatives involve drug marketactivity, focus additional efforts ongenerating cases for federalprosecution.
Information collection and research issues4. Rather than the involved officers
specifying the district office,accurately record the location ofactivity to improve the geographicalassessment of programs such asCAGI-OAI. If necessary to preserveconfidentiality of investigatoryinformation, the officer could list thedistrict office in the incident reportand maintain a separate log oflocations of drug purchases thatwould remain confidential but couldbe provided to researchers.
5. Develop an accounting method tosystematically show when officers areengaged in special projects such asCAGI. Tracking these specialassignments across all IMPD districtsand activities would simplify thedetermination of the impact of IMPDinitiatives.
6. Develop electronic tracking of cases toreduce time and increase accuracy, aswas partially done in 2010.Systematically and regularly enterinformation into the database.
7. For data collection efforts that rely onlaw enforcement officers whoseprimary mission is not data collection,ensure data collection instruments arein place prior to the project start dateand not onerous to collect. Automatedata collection if possible. IMPDwould benefit from developing auniversal tracking tool for projectssuch as these which requiredocumentation and evaluation of lawenforcement activities, arrests,prosecutions, and crime rates.
8. Engage the research partner as earlyas possible in the research process,preferably as the grant proposal isbeing developed so that datacollection strategies can be workedout in advance of programimplementation.
RECOMMENDATIONS
31
Egley, Jr., A., & Howell, J. C. (2011, June). Highlights of the 2009 National Youth Gang Survey.
Washington, D.C.: U.S. Department of Justice: Office of Juvenile Justice and
Delinquency Prevention. http://www.ncjrs.gov/pdffiles1/ojjdp/233581.pdf
Ryckaert, V. (2006, September 13). Police: Gang violence rising in Indiana. The Indianapolis
Star, p. B1.
Ryckaert, V., & Murray, J. (2009, October 28) Gang problem growing, IMPD official says.
The Indianapolis Star, p. A17.
U.S. Department of Justice. (2008). Fact Sheet: Department of Justice comprehensive
efforts to fight gang violence [Press release]. Retrieved from
http://www.justice.gov/opa/pr/2008/June/08-ag-562.html
U.S. Department of Justice. (2006). Fact Sheet: Department of Justice initiative to combat
gangs. [Press release]. Retrieved from
http://www.justice.gov/opa/pr/2006/February/06_opa_082.html
REFERENCES
32

334 North Senate Avenue, Suite 300 Indianapolis, IN 46204 Phone 317.261.3000 Fax 317.261.3050 www.criminaljustice.iupui.edu