evaluation of geotechnical parameters using geophysical...
TRANSCRIPT

J. Eng. Technol. Sci., Vol. 49, No. 1, 2017, 95-113 95
Received September 16th, 2016, Revised March 7
th, 2017, Accepted for publication March 14
th, 2017.
Copyright ©2017 Published by ITB Journal Publisher, ISSN: 2337-5779, DOI: 10.5614/j.eng.technol.sci.2017.49.1.6
Evaluation of Geotechnical Parameters using
Geophysical Data
Olusegun Oladotun Adewoyin,1,*
, Emmanuel Oluwagbemi Joshua1, Isaac Ibukun
Akinwumi2, Maxwell Omeje
1 & Emmanuel Sunday Joel
1
1Department of Physics, College of Science and Technology,
Covenant University, P.M.B. 1023, Ota, Ogun State, Nigeria 2Department of Civil Engineering, College of Engineering
Covenant University, P.M.B. 1023, Ota, Ogun State, Nigeria *E-mail: [email protected]
Abstract. The financial implications and the time required for carrying out a
comprehensive geotechnical investigation to characterize a site can discourage
prospective private residential building developers, especially where a large area
of land is to be investigated for construction purposes. Also, most of the
geotechnical test procedures utilized during site investigation only provide information on points tested in the subsurface. This research method suggests an
approach of investigating the subsurface condition of a site in order to obtain key
subsoil geotechnical properties necessary for foundation design for proposed
engineering facilities. Seismic wave velocities generated from near surface
refraction were combined with percussion drilling and cone penetration tests to
obtain a comprehensive geotechnical investigation. From the results of the
seismic refraction method, the bulk density of the soil, Young’s modulus, bulk
modulus, shear modulus and allowable bearing capacity of a competent layer
that can bear structural load at the particular study site were determined. The
most competent layer was found within the depth observed by geotechnical
methods. In addition, regression equations were developed in order to directly obtain the bulk density of the soil, Young’s modulus, bulk modulus, shear
modulus and allowable bearing capacity from the primary wave velocities.
Keywords: characterization; environment; geophysical; geotechnical; seismic.
1 Introduction
The expenses and time required to carry out the geotechnical investigation of a proposed construction site can discourage the building developer, especially if
the construction site is a large expanse of land. These challenges have made
many private developers carry out various construction projects without
undertaking a proper site investigation. One of the implications of this is its significant contribution to the incessant building collapse experienced in many
developing countries. An effort to reduce the cost and reliably estimate the
geotechnical parameters needed for proper foundation design will bring a sigh of relief to geotechnical engineers and building developers. A combination of

96 O.O. Adewoyin, et al.
geophysical and geotechnical techniques to study the required geotechnical
parameters needed for construction purposes has the potential to make this
contribution. Typically, the results of geotechnical tests are for point
measurements because of the inability of this technique to provide lateral information on the subsurface. Geophysical methods, on the other hand, can
give volumetric measurement and produce images of the subsurface without
physically disturbing the subsoil. Therefore, in order to cover a large expanse of land in the shortest possible time and at a highly reduced cost, geotechnical
investigation could be conducted at certain central locations on the proposed
site, while geophysical investigations would be conducted to cover up for the
portion of the site not investigated by geotechnical methods. The results obtained from the geophysical investigation would be checked against the
results of the geotechnical method, which would serve as the control for the
entire subsurface characterization. According to Soupios, et al. [1], there is an increasing requirement for geophysical surveys conducted during geotechnical
investigations so as to provide direct information about rock/soil quality and
other geotechnical parameters that will be useful in correlating geophysical results with actual rock/soil properties.
Bery and Saad [2] together with Karaman and Kesimal [3] proved that it is
possible to study the P-wave velocities of materials both in the laboratory and
the field. The P-wave values obtained by Bery and Saad [2] were later compared with the engineering parameters of a site such as the SPT-N (blow
count) values, rock quality, friction angle, velocity index, density and
penetration strength. Empirical correlations were also found for selected parameters and the regression coefficients obtained showed a high degree of
correlation. They concluded that their method could be used to estimate and
predict the properties of the subsurface material in order to reduce the cost of
subsurface investigation. Altindag [4], Kahraman [5] and Yagiz [6], on the other hand, studied the relationship between P-wave velocity and mechanical
properties of sedimentary rocks. The latter used already acquired data and a
simple regression analysis. All the data were later subjected to a multi-regression analysis and he went further to derive some empirical equations with
high correlation coefficients that would be useful for rock engineers. Atat, et al.
[7] carried out a study using seismic refraction techniques to determine the allowable bearing pressure of a site for construction purposes in the Eket area of
Akwa Ibom State in Nigeria. They obtained both compressional and shear wave
velocities, which were substituted into some equations from the literature to
determine the elastic constants, allowable bearing capacity and the ultimate bearing capacity of the site. Their result revealed that the allowable bearing
pressure increased with increase in shear modulus and shear wave velocity. The
empirical relation between allowable bearing capacity and shear modulus also showed that the allowable bearing capacity increased with depth. Tezcan, et al.

Evaluation of Geotechnical Parameters - Geophysical Data 97
[8] proposed an empirical formulation for the rapid determination of allowable
bearing capacity of shallow foundations. The proposed expression consistently
corroborated the results of the classical theory and it was proven to be rapid and
reliable. It was indicated that once the shear and P-wave velocities were measured in situ by an appropriate geophysical survey, the allowable bearing
capacity as well as the coefficient of subgrade reaction and many other elasticity
parameters could be determined rapidly and reliably through a single-step operation for both soils and rock formations.
Seismic refraction is one of the geophysical techniques that offer a non-
intrusive and non-destructive way of performing geotechnical properties
measurement. Seismic refraction can be an attractive alternative to boring when access is difficult with geotechnical equipment (see Anderson and Croxton, [9],
Fitzallen [10], Uyanik, [11], Nastaran, [12], Mohd, et al. [13]). Also, this
method can easily detect changes in the subsurface characteristics as there are changes in the behaviors of a passing seismic wave as it passes through media
of different characteristics, in order to determine zones of structural weakness in
the basement and analyze the stability of the subsurface. Therefore, in this study, a combination of seismic refraction, cone penetration and percussion
drilling tests was used to reduce the difficulties usually faced by geotechnical
engineers and building developers in determining the geotechnical parameters
of a site for construction purposes. Also, empirical correlation equations were developed by correlating P-wave velocity with other geotechnical parameters.
2 Geology and Location of the Study Area
The area under investigation is part of the geologically termed alluvium
deposits of the southwestern Nigeria basin, which is an integral part of the
Dahomey embayment (Figure 1). The superficial materials of the general area
under investigation are silts, sands and clays with fibrous peat on the surface in some places. The Dahomey sedimentary basin extends from the eastern part of
Ghana through Togo and Benin Republic to the western margin of the Niger
Delta. The eastern half of the basin lies within Nigerian territory. The base of the basin consists of unfossilerous sandstones and gravels weathered from the
underlying Precambrian basement. The vegetation of the study area has given
way to fens and other water loving shrubs and herbs (Adegbola and Badmus
[14]).
The study area lies between latitude 06° 26’ N and 06° 32’
N and longitude 03°
35’ E and 03° 45’
E in the Lagos Island area of Lagos State[15]. The Nigeria
coastal zone has a tropical climate with two seasons: a rainy season and a dry
season. The rainy season is between April and November while the dry season
is between December and March (Akintorinwa and Adesoji, [16]). The amount

98 O.O. Adewoyin, et al.
of annual rainfall varies between 2030 mm and 2540 mm (Obasi and
Ikubuwaje, [17]).
Figure 1 Geological map of Nigeria, showing the Nigerian part of the Dahomey
basin (modified after Aizebeokhai and Oyeyemi [15]).
Figure 2 Base map of the study area.

Evaluation of Geotechnical Parameters - Geophysical Data 99
3 Theory
Field surveys can readily provide both primary and shear wave velocities, PV
and SV , measured in meters/seconds (m/s). These velocities can be used to
determine the following engineering parameters: the Young modulus, the bulk
modulus, the shear modulus and the Poisson ratio. These are used to measure the degree of stiffness of the subsurface material (Clayton, [18]). The three
stiffness parameters are the Young modulus, the bulk modulus and the shear
modulus. These elastic moduli are represented mathematically as expressed in Eqs. (1) to (6) below:
2
2
2
2 1
P
S
P
S
V
V
V
V
ν
− = −
(1)
( )( )( )
2 1 2 1
1
b PV
Eρ ν ν
ν
− +=
− (2)
(1 )
(1 )(1 2 )c
EE
νν ν−
=+ −
(3)
( )2 1
EG
ν= +
(4)
2
3(1 2 )b p
EB V
ν= =
−ℓ (5)
b g
γρ = (6)
where γ is the unit weight of the soil and g is the acceleration due to gravity,
which is given by 9.8 2/m s . The unit weight of the soil relates with P-wave
velocity pV is as shown in Eq. (7) below:
0.002o p
Vγ γ= + (7)

100 O.O. Adewoyin, et al.
0γ is the reference unit weight value in 3/kN m for soil and rock types. The
value of 0γ is 16 for loose, sandy and clayey soil (Atat, et al. [7], Tezcan, et al.
[8]). The relationship between shear wave and primary wave velocities is
expressed in Eq.(8):
1.7p s
V V≈ (8)
where E is the Young modulus 2( / )N m , G is the shear modulus 2
( / )N m ,
B is the bulk modulus 2( / )N m , bρ is the bulk density ( 3
/ )kg m and ν is
the Poisson ratio. The subgrade coefficient ( )s
K , ultimate bearing capacity
( )fq and the allowable bearing capacity ( )
aq can be determined using the
following equations respectively:
4s s
K Vγ= (9)
40
sf
Kq = (10)
fa
n= (11)
where n is the safety factor and n = 4 for soils. The results of Eqs. (9) to (11)
further confirm the strength of the soil being considered for construction purposes.
4 Materials and Methods Applied
4.1 Seismic Refraction Method
Seismic refraction was carried out in the study area, using a 24-channel ABEM
Terraloc Mark 6 seismograph. This method requires the use of a seismograph, a 12-volt DC battery, a roll of trigger cable, 2 seismic cable reels, a 15 kg sledge
hammer, a metal base plate, 24 geophones of 14 Hertz frequency, a log book
and measuring tapes. The geophones were connected to the 2 seismic cable reels, which are signal cables that were in turn connected to the seismograph.
The seismograph was placed in the middle of the survey line on each traverse.
The geophones were planted at an interval of 2 m from each other along the
traverse so as to obtain quality data and a good depth of investigation. The trigger cable reel connects the sledgehammer to the equipment and each time it
is triggered, by hitting the hammer on a base plate, the seismogram records a
seismic event. The base plate is a thick, heavy iron metal plate hit with the

Evaluation of Geotechnical Parameters - Geophysical Data 101
sledgehammer for the measurements to be taken. The base plate was placed at a
distance of 2m from the first geophone.
(a)
(b)
(c)
(d)
Figure 3 (a)-(d) 2D seismic refraction image of the study area, indicating the
number of layers, P-wave velocity of each layer and depth of investigation.

102 O.O. Adewoyin, et al.
Four (4) traverses were surveyed in the areas studied, as shown in Figure 2.
Shots were taken at the following points on each traverse: offset distance, which
was 2 m from the first geophone, between the 6th and 7th geophones, between
the 12th and 13th geophones, between the 18th and 19th geophones and 2 m after the 24th geophones. These shot points are termed the offset, quarter
spread, mid-spread, three-quarter spread and off-end respectively (Keary, et al.
[19], Mohd, et al. [13]). The SeisImager software application was used to produce a 2D seismic image of the collected data (Figure 3).
Each traverse showed two geological layers with the topmost layer being
characterized by low P-wave velocities, which may be as a result of the loose
and soft nature of the soil material. The second layer, on the other hand, is composed of a formation that is relatively stiffer because of a higher velocity
observed, which may be due to saturation and compression of the geomaterial in
the subsurface. The significant change noticed in the elastic properties of the two layers may be due to a change in the composition of the subsurface, uneven
saturation and changes in the unit weight of the soil.
4.2 Geotechnical Methods
In this study, geotechnical investigations, including cone penetration and
borehole tests, were carried out in the area of study. A borehole was dug and
two (2) cone penetration tests were carried out. These were carried out to determine the in situ bulk properties of the subsurface material and to provide a
control for this research. They were carried out to provide a good level of
confidence for our results. The borehole was dug to a depth of 30 m with the use of shell and auger boring equipment. Ordinary disturbed samples were
collected at changes of strata and as deemed fit for strata identification purposes
through visual inspection and classification tests. The result of the borehole test
was used to produce a log that contains information on the lithology and strength of the area of study (Figure 4).
Also, cone penetration tests were carried out using a Dutch cone penetrometer
with a capacity of 2.5 tons. The apparatus consisted of a cylindrical probe of 1000 mm
2 cross sectional area and a conic head with an of apex angle 60°. The
probe was forced down through the soil at a steady rate of about 20 mm/s by
exerting pressure on the outer sounding tube (Hunt [20], Look [21]). The tests
were terminated at depths where the machine anchors began to lift out of the ground. This method allows for the soil strength to be determined from the
measured values of cone resistance and sleeve friction. The results of the cone
penetration test are presented in the graph below (Figure 5).

Evaluation of Geotechnical Parameters - Geophysical Data 103
5 Results and Discussion
In this study, geotechnical parameters, i.e. density, Young’s modulus, bulk
modulus, shear modulus, oedometric modulus, were obtained from the result of the primary and secondary wave velocities for each layer using Eqs.(1) to(8).
These relationships also led to the determination of the ultimate bearing
capacity and the allowable bearing capacity of the area of study. The results
obtained are presented in Table 1. As mentioned before, two geologic layers were delineated with the SeisImager software application. The first geologic
layer had a lower seismic wave velocity while the second layer had a higher
seismic wave velocity. The bulk density of the first layer ranged between
1.7088 3/kg m and 1.7457 3/kg m with an average bulk density of 1.7286
3/kg m . The bulk density of the second layer ranged between 1.7527 3/kg m
and 2.04333/ mkg with an average density of 1.9420 3/kg m .
This result shows that the second layer is more compressed than the first layer. This may be as a result of the geologic formation of this layer, its level of
saturation and the level of cementation of the geomaterial. It was also observed
that the density of the subsurface increased in direct proportion with the seismic
wave velocity and the two parameters increased with depth. The Young
modulus of the first layer ranged between 0.2032GPa and 4.5808GPa , while in
the second layer, the modulus ranges between 0.5181 GPa and 7.0719 GPa .
The average Young moduli for the first and the second layers were 0.3354 GPa
and 4.5048GPa respectively. This also shows that the second layer has more
strength than the first layer.
The oedometric modulus, which is a measure of the ease of deformation of
subsurface geomaterial, ranged between 0.2377GPa and 0.5358GPa with an
average layer modulus of 0.3922GPa for the first layer. In the second layer, the
modulus ranged between 0.6060GPa and 8.2714GPa with an average layer
modulus of 5.2690GPa . This result also shows that the first layer would deform
more easily under shear stress than the second layer. The bulk modulus for the
first layer ranged between 0.12806 GPa and 0.2886 GPa , while it ranged
between 0.3264GPa and 4.4553GPa in the second layer. The average bulk
moduli for the first and second layers were 0.2113GPa and 2.8381GPa
respectively. This further confirmed the second geologic layer to be more competent than the first layer.
The shear modulus ranged between 0.0823GPa and 0.1854GPa with an
average modulus of 0.1357GPa in the first layer. On the other hand, the second
layer had a shear modulus that ranged between 0.2097GPa and 2.8621GPa

104 O.O. Adewoyin, et al.
with an average layer modulus of 1.8232GPa . This result reveals that the
second geologic layer is more competent than the first layer.
The ultimate bearing capacity and the allowable bearing pressure were also
estimated, to buttress the results provided by the earlier discussed elastic
moduli. The ultimate bearing capacity for the study area ranged between 0.3674
MPa and 0.5575 MPa , while it ranged between 0.5941 MPa and 2.3699
MPa in the second layer. The average ultimate bearing capacity was 0.4702
MPa and 1.7356 MPa in the first and second layers respectively. This further
confirms the second layer to have more bearing capacity than the first layer.
Also, the allowable bearing pressure for the study site ranged between 0.0919
MPa and 0.1394 MPa with an average of 0.1175 MPa in the first layer while
it ranged between 0.1485 MPa and 0.5925 MPa with an average of 0.4339
MPa in the second layer. This result also shows that the second layer is more
competent than the first layer. Furthermore, it shows that the depth to the most competent layer ranges between 7 m and 15.7 m. This result is in agreement
with the results obtained from the borehole log and the cone penetration tests
carried out in the area of study.
Table 1 Seismic wave velocities for each traverse and their geotechnical parameters.
Si-
de ( / )
pV
m s
( / )
sV
m s
3( / )Kg m
ρ
( )
Depth
m
ν ( )
E
GPa
( )cE
GPa
( )
B
GPa
( )
G
GPa
( )s
K
MPas
( )fq
MPa
( )aq
MPa
S1 498
1961
292.94
1153.53
1.7343
2.0329
7.6
15.7
0.2355
0.2355
0.3677
6.6837
0.4301
7.8174
0.2317
4.2108
0.1488
2.7050
0.0199
0.0919
0.4979
2.2981
0.1245
0.5745
S2 554
1503
325.88
884.12
1.7457
1.9394
8.7
10.9
0.2355
0.2354
0.4581
3.7458
0.5358
4.3811
0.2886
2.3598
0.1854
1.5160
0.0223
0.0672
0.5575
1.6804
0.1394
0.4201 S3 460
2012
270.59
1183.53
1.7265
2.0433
7.9
11.4
0.2354
0.2354
0.3124
7.0719
0.3653
8.2714
0.1968
4.4553
0.1264
2.8621
0.0185
0.0948
0.4578
2.3699
0.1145
0.5925
S4 373
588
219.41
345.88
1.7088
1.7527
7.0
10.3
0.2355
0.2355
0.2033
0.5181
0.2377
0.6060
0.1281
0.3264
0.0823
0.2097
0.0147
0.0238
0.3674
0.5941
0.0919
0.1485
The result from the borehole log (Figure 4) revealed the geomaterial in the
second layer to be sandy clay of firm to stiff consistency underlain by a medium
dense sand material. The sand material is more geotechnically stable because it
has high shear strength and low compressibility potential (Atat, et al. [7], Sarsby, [22]). The formation at this depth can be considered for engineering
construction purposes. The result of the cone penetration tests confirmed that
the geomaterial at that depth has stable geotechnical properties. Also, the cone penetration log showed a rise in the cone resistance values from a depth of 6.50
m in the log presented below (Figure 5).

Evaluation of Geotechnical Parameters - Geophysical Data 105
Figure 4 Result of the borehole log obtained from the area of study.
BOREHOLE LOG
Ground Water Level : Surface level
Depth
(m) Samples Soil Description Symbol
Nspt
0 10 20 30 40 50
0
Soft dark brown organic PEAT.
0.6
0.75
1.5
2.25
Soft dark brown organic peaty CLAY
3
4.5
5.25
Firm to stiff greyish/pinkish sandy CLAY
6
7.5
7.75
Medium dense dark grey very silty SAND
9 23
9.75
10.5 23
12 26
13.5 27
15 26
16.5
18
Medium dense to dense grey silty SAND
25
19.5 35
20
Soft dark greyish organic CLAY
24
Light greyish coarse SAND
25.5
Very stiff dark organic CLAY
27
30
End of Borehole
KEYS:

106 O.O. Adewoyin, et al.
Figure 5 Cone penetration test result in Lagos Island area.
6 Evaluation of Geotechnical Parameters from Seismic Data
This study was also aimed at obtaining model equations from the correlations of
the primary wave velocities and the different geotechnical parameters studied. This was to obtain direct relationships between the P-wave velocity and the
geotechnical parameters. These equations can be used for a speedy evaluation
and inexpensive estimation of the various geotechnical parameters. The graphs of the geotechnical parameters were plotted against the primary wave velocities.
The regression equations and their coefficient of determination were obtained.
The graph of density against the P-wave velocity (Figure 6) gave the empirical
equation below. The empirical correlation equation is defined in Eq. (12).
-10
-9
-8
-7
-6
-5
-4
-3
-2
-1
0
0 50 100 150 200 250
Dep
th (
m)
Cone Reading (kg/cm2 )
Lagos Island area, Lagos.
(2.5 ton penetrometer test log)
Test No.2
Ground Water Level: Surface level

Evaluation of Geotechnical Parameters - Geophysical Data 107
11 26 10 0.0002 1.6328
p pV Vρ −= × + + (12)
The coefficient of determination is 1. This also shows the polynomial
relationship between the density of the subsurface and the primary wave
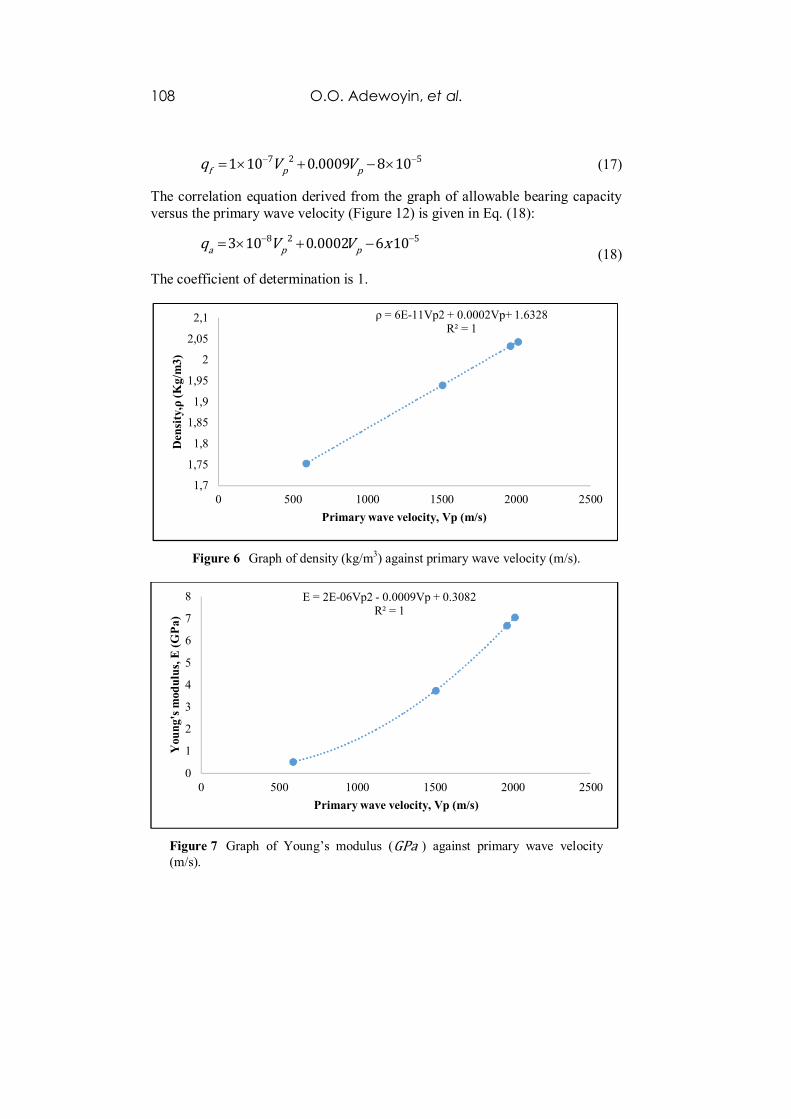
velocity. Also, the graph of the Young modulus against the primary wave velocity was plotted (Figure 7). The empirical correlation equation was obtained
in Eq. (13):
-6 22 10 -0.0009 0.3082
p pE V V= × + (13)
The coefficient of determination was obtained to be 1. This implies that the higher the primary wave velocity of the geomaterial, the higher the level of its
competence. The graph of the bulk modulus against the primary wave velocity
was also plotted (Figure 8). The empirical correlation equation and the coefficient of determination were obtained. The empirical correlation equation
was obtained in Eq. (14):
6 21 10 0.0006 0.1942
p pB V V−= × − + (14)
while the coefficient of determination is 1. This shows the polynomial relationship between the bulk modulus and the primary wave velocity in the
area of study. This simply implies that the higher the primary wave velocity, the
higher the strength of the geomaterial that is being tested. The shear modulus was also plotted against the primary wave velocity, as shown in Figure 9. Both
the empirical correlation equation and the coefficient of determination were
obtained. The empirical correlation equation is defined in Eq. (15):
7 29 10 0.0004 0.1247
p pG V V−= × − + (15)
The coefficient of determination obtained is 1. This confirmed the polynomial
relationship between the shear modulus and the primary wave velocity. This
implies that the higher the value of the primary wave velocity, the more confidence we can have in the fitness for construction purposes of the
subsurface being studied. The oedometric modulus was also plotted against the
primary wave velocity (Figure 10); the empirical correlation equation is given as in Eq. (16):
6 22 10 0.001 0.3606c p pE V V−= × − +
(16)
The coefficient of determination is 1. The graph of unlimited bearing capacity
was plotted against the primary wave velocity (Figure 11); the correlation equation is given as in Eq. (17):
108 O.O. Adewoyin, et al.
7 2 51 10 0.0009 8 10
f p pq V V− −= × + − × (17)
The correlation equation derived from the graph of allowable bearing capacity
versus the primary wave velocity (Figure 12) is given in Eq. (18):
8 2 53 10 0.0002 6 10a p pq V V x− −= × + −
(18)
The coefficient of determination is 1.
Figure 6 Graph of density (kg/m3) against primary wave velocity (m/s).
Figure 7 Graph of Young’s modulus (GPa ) against primary wave velocity
(m/s).
ρ = 6E-11Vp2 + 0.0002Vp+ 1.6328R² = 1
1,7
1,75
1,8
1,85
1,9
1,95
2
2,05
2,1
0 500 1000 1500 2000 2500
Den
sity
,ρ(K
g/m
3)
Primary wave velocity, Vp (m/s)
E = 2E-06Vp2 - 0.0009Vp + 0.3082R² = 1
0
1
2
3
4
5
6
7
8
0 500 1000 1500 2000 2500
You
ng's
mod
ulu
s, E
(G
Pa)
Primary wave velocity, Vp (m/s)

Evaluation of Geotechnical Parameters - Geophysical Data 109
Figure 8 Graph of bulk modulus (GPa ) against primary wave velocity (m/s).
Figure 9 Graph of shear modulus (GPa ) against primary wave velocity (m/s).
Figure 10 Graph of Oedometric modulus (GPa ) against primary wave
velocity (m/s).
B = 1E-06Vp2 - 0.0006Vp + 0.1942R² = 1
0
1
2
3
4
5
0 500 1000 1500 2000 2500
Bu
lk m
od
ulu
s, B
(G
Pa)
Primary wave velocity, Vp (m/s)
G = 9E-07Vp2 - 0.0004Vp + 0.1247R² = 1
0
0,5
1
1,5
2
2,5
3
3,5
0 500 1000 1500 2000 2500
shear m
od
ulu
s, G
(G
Pa)
Primary wave velocity, Vp (m/s)
Ec = 2E-06Vp2 - 0.001Vp + 0.3606R² = 1
0
2
4
6
8
10
0 500 1000 1500 2000 2500
Oed
om
etr
ic m
od
ulu
s, E
c
(GP
a)
Primary wave velocity, Vp (m/s)

110 O.O. Adewoyin, et al.
Figure 11 Graph of ultimate bearing capacity (MPa ) against primary wave
velocity (m/s).
Figure 12 Graph of allowable bearing pressure (MPa ) against primary wave
velocity (m/s).
Figures 6 to12 are the graphs of density against primary wave velocity, Young’s modulus against primary wave velocity, bulk modulus against primary wave
velocity, shear modulus against primary wave velocity, oedometric modulus
against primary wave velocity, ultimate bearing capacity and allowable bearing
pressure against primary wave velocity. The results of the regression analysis showed good correlations between the properties tested in all cases. This shows
that we can estimate the engineering parameters of the subsurface from the
primary wave velocity data acquired (Bery and Saad [2]). The results obtained in the present study correlated well with the results of Altindag [4], Bery and
Saad [2] and Atat, et al. [7].
qf = 1E-07Vp2 + 0.0009Vp - 8E-05R² = 1
0
0,5
1
1,5
2
2,5
0 500 1000 1500 2000 2500
ult
imate
bearin
g c
ap
acit
y, q
f
(MP
a)
Primary wave velocity, Vp (m/s)
qa = 3E-08Vp2 + 0.0002Vp - 6E-05R² = 1
0
0,1
0,2
0,3
0,4
0,5
0,6
0,7
0 500 1000 1500 2000 2500
all
ow
ab
le b
earin
g p
ress
ure, q
a
(MP
a)
Primary wave velocity, Vp (m/s)

Evaluation of Geotechnical Parameters - Geophysical Data 111
The small variations observed in the correlation coefficient could be a result of
the difference in geological formation, the types of curve fitting approximation
engaged and the geotechnical parameters of interest could also be a factor. This
is because curve-fitting approximations with the highest correlation coefficient were selected in each study. Also, the geotechnical parameters of interest varied
in the various studies. For instance, in Altindag [4] the study was conducted on
sedimentary rock samples and power curve fitting was observed to give the highest correlation coefficient. The correlation coefficient differs from the
present study by a factor of 0.23, which could be as a result of the type of
geomaterial and the geotechnical parameters studied. The correlation coefficient
obtained in Bery and Saad [2] differs from the present study by 0.0685. This variation could be as a result of the geotechnical parameters studied and the
linear curve fitting approximations used. In the present study, the geological
formation is alluvium and the geotechnical parameters of interest also differ from the previous study. Polynomial curve fitting of order two was used
because it was found to give the highest correlation coefficient.
7 Conclusion
A geophysical survey was carried out using a seismic refraction method and
some geotechnical information was obtained from the study site. The seismic
refraction results revealed two geologic layers with the second layer being more competent. The geotechnical results also confirmed the result obtained by the
seismic refraction method. There is a correlation between the depths of
competence delineated by the two methods.
This study also revealed that the P-wave velocities can be used to determine the
geotechnical parameters of a site that can be used to easily characterize its
subsurface condition. Also, the empirical equations obtained can be used to
evaluate and predict the geotechnical parameters of the site studied. There was a good correlation between the results of the present and previous studies.
The results obtained are applicable to any area with a similar geological
formation as the current study area, but a similar procedure may be applicable in other areas as well. This method has the potential to reduce the cost of
geotechnical investigations. This approach will help to reduce the cost of
geotechnical investigations and also protect the environment from destruction
caused by the invasive nature of geotechnical equipment.
References
[1] Soupios, P.M., Papazachos, C.B., Vargemezis, G. & Fikos, I., Application of Seismic Methods for Geotechnical Site Characterization,

112 O.O. Adewoyin, et al.
International Workshop in Geoenvironment and Geotechnics, pp. 1-7,
2005.
[2] Bery, A.A. & Saad, R., Correlation of Seismic P-wave Velocities with
Engineering Parameters (N Value and Rock Quality) for Tropical Environmental Study, International Journal of Geosciences, 3, pp. 749-
757, 2012.
[3] Karaman, K. & Kesimal, A., Correlation of Schmidt Rebound Hardness with Uniaxial Compressive Strength and P-wave Velocity of Rock
Materials, Arabian Journal for Science and Engineering, 40 (7), pp.
1897-1906, 2015.
[4] Altindag, R., Correlation Between P-wave Velocity and Some Mechanical Properties for Sedimentary Rocks, The Journal of the
Southern African Institute of Mining and Metallurgy, 112, pp. 229-237,
2012. [5] Kahraman, S., The Correlations between the Saturated and Dry P-wave
Velocity of Rocks, Ultrasonics, 46, pp. 341-348, 2007.
[6] Yagiz, S., P-wave Velocity Test for the Assessment of Some Geotechnical Properties of Rock Materials, Bull. Mater. Sci. 34, pp. 943-957, 2011.
[7] Atat, J.G., Akpabio, I.O. & George, N.J., Allowable Bearing Capacity for
Shallow Foundation in Eket Local Government area, Akwa Ibom State,
Southern Nigeria, International Journal of Geosciences, 4(2013), pp. 1491-1500, 2013.
[8] Tezcan, S.S., Ozdemir, Z. & Keceli, A., Seismic Technique to Determine
the Allowable Bearing Pressure for Shallow Foundations in Soils and Rocks, Acta Geophysica, 57(2), pp. 1-14, 2009.
[9] Anderson, N. & Croxton, N., Geophysical Methods Commonly Employed
for Geotechnical Site Characterization, Transportation Research
Circular, E-C130, pp.1-13, 2008. [10] Fitzallen, A., An Improved Approach to Site Characterization Combining
Geophysical and Geotechnical Data, Australian Geomechanics, 45(1),
pp. 77-88, 2010. [11] Uyanik, O., Compressional and Shear Wave Velocity Measurements in
Unconsolidated Top-soil and Comparison of the Results, International
Journal of the Physical Sciences, 5(7), pp. 1034-1039, 2010. [12] Nastaran, S., Correlation between Geotechnical and Geophysical
Properties of Soil, Master on Philosophy Thesis, Stoke-on-Trent:
University of Birmingham, Birmingham, United Kingdom, 2012.
[13] Mohd, H.Z.A., Rosli, S., Fauziah, A., Devapriya, C.W. & Mohamed, F.T.B., Seismic Refraction Investigation in Near Surface Landslides at
the Kindasang Area in Sabah, Malaysia, Sciverse Science Direct,
Procedia Engineering, 50(2012), pp. 516-531, 2012. [14] Adegbola, R.B. & Badmus, O.G., Estimation of Shear Wave Velocity for
Near-surface Characterization: Case Study Ifako/Gbagada area of Lagos

Evaluation of Geotechnical Parameters - Geophysical Data 113
State, S.W. Nigeria, British Journal of Applied Science and Technology,
4(5), pp. 831-840, 2014.
[15] Aizebeokhai, A.P. & Oyeyemi, K.D., Application of Geoelectrical
Resistivity Imaging and VLF-EM for Subsurface Characterization in a Sedimentary Terrain, Southwestern Nigeria, Arabian Journal of
Geosciences, DOI 10.1007/s12517-014-14282-z, 2014.
[16] Akintorinwa, O.J. & Adesoji, I.J., Application of Geophysical and Geotechnical Investigations in Engineering Site Evaluation, International
Journal of Physical Sciences, 4(8), pp. 443-454, 2009.
[17] Obasi, R.A. & Ikubuwaje, C.O., Analytical study of rainfall and
temperature trend in catchment States and stations of the Benin-Owena River basin, Nigeria, Journal of Environment and Earth Science, 2(3), pp.
9-21, 2012.
[18] Clayton, C.R.I., Stiffness at Small Strain: Research and Practice, Geotechnique, 61(1), pp. 5-37, 2011.
[19] Keary, P., Brooks, M. & Hill, I., An Introduction to Geophysical
Exploration, Blackwell Publishing Company, third edition, pp. 21-40, 2002.
[20] Hunt, R.E., Geotechnical Engineering Investigation Handbook, 2nd
edition, pp. 1-3, 2005.
[21] Look, B.G., Handbook of Geotechnical Investigation and Design Table, Taylor and Francis, pp. 12-78, 2007.
[22] Sarsby, R.W., Environmental Geotechnics, Thomas Telford Publishing,
pp. 35-48, 2000.