evaluation of genetic bases and diversity of egyptian ... · molecular markers (kisha et al., 1998;...
TRANSCRIPT

http://agrobiol.sggw.waw.pl/cbcs
Communications in Biometry and Crop Science Vol. 6, No. 1, 2011, pp. 31–47
International Journal of the Faculty of Agriculture and Biology, Warsaw University of Life Sciences, Poland
REGULAR ARTICLE
Evaluation of genetic bases and diversity of Egyptian wheat cultivars released during the last 50 years using coefficient of parentage
Bhoja R. Basnet1, Mohamed B. Ali4, Amir M.H. Ibrahim1*, Thomas Payne2, Moussa G. Mosaad3 1 Department of Soil & Crop Sciences, Texas A & M University, College Station, TX 77843-2474. 2 CIMMYT Apdo, Postal 6-641, 06600 Mexico, D.F., Mexico. 3 Field Crop Research Institute, Agricultural Research Center, Giza 12619, Egypt. 4 Agronomy Department, College of Agriculture, Assiut University, Assiut 71526, Egypt. * Corresponding author: Amir M.H. Ibrahim E-mail: [email protected]
CITATION: Basnet, B.R., Ali, M.B., Ibrahim, A.M.H., Payne, T., Mosaad, M.G. (2011). Evaluation of genetic bases and diversity of Egyptian wheat cultivars released during the last 50 years using coefficient of parentage. Communications in Biometry and Crop Science 6 (1), 31–47.
Received: 15 March 2011, Accepted: 5 April 2011, Published online: 30 April 2011 © CBCS 2011
ABSTRACT Discerning the genetic diversity of any crop species provides insight into the strength of an applied breeding program and directs future breeding strategies aimed at long-term genetic gain and minimized genetic vulnerability. The number and abundance of ancestral parents present in the pedigree of crop cultivars can provide an average estimation of the depth of the genetic base of the overall crop improvement program. The objectives of this study were to estimate (1) the genetic similarity among 33 Egyptian wheat (Triticum aestivum L.) cultivars and different eras of release (1947-2004) and productivity groups based on COP values, and (2) the relative genetic contribution and abundance of ancestral parents from different geographical origins to the total gene pool of Egyptian wheat cultivars. Broad genetic diversity was observed among 33 Egyptian cultivars with average COP value of 0.11 and large numbers of ancestral parents (155 landraces) traced to 31 countries. The genetic base ranged from very low in pre 1960’s cultivars such as ‘Giza 139’ (with only 3 landraces in the background) to very high in modern cultivars such as ‘Gemmeiza-7’ (with 73 landraces in the background). ‘Hindi-62’, ‘Red Fife’, ‘Hard Red Calcutta’ and ‘Akagomughi’ were the major ancestors with 6, 5, 4, and 4% of total genetic contribution to the Egyptian wheat gene pool, respectively. Egypt, United States of America, Kenya and Ukraine were the major source countries with 16, 11, 9 and 7% of total genetic contribution to this gene pool, respectively. Though Marquis-Thatcher germplasm from North America has the greatest influence on overall Egyptian cultivars, Mexican-based sources of dwarfing and high yield, derived from ancestors such as ‘Akagomughi’ and ‘Daruma’ and exploited by the International Maize and Wheat Improvement Center (CIMMYT), were very prominent in Egyptian cultivars post 1970’s. Key Words: coefficient of parentage; landraces; genetic contribution.

Communicat ions in B iometry and Crop Sc ience, 6(1) 32
INTRODUCTION Wheat (Triticum aestivum L.) has been the main cereal grain grown in Egypt for
thousands of years, serving as the principal source of calories in Egyptian diet. The productivity of Egyptian wheat cultivars has increased dramatically from 2.4 Mg ha-1 in 1958 to 6.8 Mg ha-1 in 2004. Enrichment of genetic diversity plays a crucial role in wheat cultivar improvement (Chao et al., 2007). Estimates of genetic similarities can be based on biochemical or morphological genetic markers (Elkassaby, 1982; Keeler, 1978), quantitative traits (Martinez et al., 1983; Price et al., 1984), or pedigree analysis (Cox et al., 1985a). Estimates based on phenotypic data are used to present the degree of relationship between two lines or populations assuming that similarity in phenotype accurately reflects similarity in genotype (Cox et al., 1985b). On the other hand, when pedigree data are used, it is assumed that selection and genetic drift have not caused significant deviations from the expected relationship (Cox et al., 1985b). The consistency between estimates depends on the population or species studied (Price et al., 1984). A close agreement has been found between estimates of genetic similarity for modern soybean cultivars based on either pedigree data or molecular markers (Kisha et al., 1998; Priolli et al., 2010). Similarly, Almanza-Pinzon et al., (2003) have reported a significant correlation (0.34 ≤ r ≤ 0.46, P < 0.05) between the genealogical similarity (COP) matrix and the matrices of genetic similarity obtained by using molecular markers in bread wheat accessions. These findings indicate that, despite some shortcomings, when complete pedigree records have been maintained, COP matrices can be relevant to analyze the genetic diversity pattern in crops like wheat and soybean as an alternative to other costly and time consuming methods.
Genetic variation provides the basis for genetic gain in any breeding program (Souza et al., 1998), and pedigree based diversity analysis provides useful genetic information for the preservation of diversity, tracing genetically related phenomena from ancestor to ancestor, and the selection of parents in crop improvement programs through crossing (Souza et al., 1994; Dilday, 1990; Souza and Sorrels, 1989). Coefficient of parentage (COP) is the probability that a random allele at a given locus in one individual is identical by descent to a random allele at the same locus in another individual (Mercado et al., 1996). Analysis of COP is one of the most common techniques of pedigree-based diversity analysis (Miranda et al., 2007), where a complete pedigree of genotypes is traced back to the original parents (i.e. landrace), and genetic similarity is calculated between them based on the common share of genetic material through ancestors. It ranges from 0, which indicates no common ancestor, to 1, which indicates the same individual or identical twins. In addition to detailed pedigree information on all genotypes, the following assumptions should be valid for all pairwise COP computations and further diversity analyses for inbred species (St. Martin, 1982; Murphy et al., 1986): (1) a cultivar derived from a cross traces half of its genes from each parent, (2) all ancestral parents, cultivars, and parental lines are homozygous and homogeneous, (3) the ancestral parents are unrelated (COP = 0), and (4) the COP value between the cultivar and itself is 1.0. It is important in breeding programs to use parents with low COP because a low COP between parents ensures adequate variability in segregating population so that we can increase the gain from selection. The estimates of genetic diversity based on COP allow the characterization and grouping of germplasm (Cox et al., 1985b; Murphy et al., 1986). In addition to estimating genetic diversity, COP has other uses that include predicting breeding behavior of progeny of crosses (Cowen and Frey, 1987), regional crop diversity (Souza et al., 1994), and identifying parental combining ability for different traits, including high yield (Beer et al., 1995).
In this study, the levels and patterns of genetic diversity among Egyptian cultivars were investigated using a sample of 33 spring cultivars released from 1947 to 2004. Our objectives were to: (1) calculate the COP between cultivars based on pedigree information, (2) identify the original parents/landraces and their contribution to Egyptian wheat cultivars, and (3)

Basnet et a l . – Evaluation of genetic bases and diversity of Egyptian wheat cultivars 33
assess the genetic bases and diversity based on COP values and the geographical distribution of the original parents.
MATERIALS AND METHODS CULTIVAR CHARACTERISTICS AND COP CALCULATION
Thirty three Egyptian wheat cultivars released from 1947 to 2004 were evaluated for their relatedness by pedigree. All the cultivars were defined and categorized by their release era (RE: I = before 1960, II = 1960-1969, III = 1970-1979, IV = 1980-1989, V = 1990-1999, and VI = 2000-2004), maturity group (MG: VLY, ELY, MED, and LTE), productivity group (PG: LOW, AVE, MED, HGH, and VHG), plant height (PH: MED, TLL, and VTL) and growing region (GR: AEGY, DEL, EDEL, NDEL, SDEL, MEGY, N/MEGY, and UEGY) to assess among and within group relatedness based on COP matrix (group designation for each cultivars and abbreviations for group name are presented in Table 1). The COP matrices among cultivars, using the pedigree information in the International Maize and Wheat Improvement Center (CIMMYT) wheat database, were calculated by using the International Wheat Information System (IWISTM version 2.0) program (Payne et al., 2002). In addition to a pedigree-based COP matrix (r), IWISTM v 2.0 also displays the family tree to a level of ancestors whose pedigree is unknown, i.e. basically to the landrace level, and calculates the theoretical percentage contribution of the ancestors to a given pedigree. The MEANS procedure of SAS (SAS Institute, 1992) was used to calculate average COP among all the cultivars and within and among the various categories of cultivars from the whole COP matrix. Average COP values among the six release eras and the five productivity groups were considered an indication of the relative diversity of the genetic base of Egyptian breeding program. In addition, correlation analysis among RE, MG, PH and PG was carried out using PROC CORR procedure of SAS.
MULTIDIMENSIONAL SCALING (MDS) AND CLUSTER ANALYSIS Multidimensional scaling (MDS) analysis estimates coordinates for a set of objects in a
space of specified dimensionality by using the measurement of distances between pairs of objectives (SAS/STAT 9.2, 2009). Thus, MDS provides a graphical representation of objects in multidimensional space where the relationship between objects on the plot represents their underlying dissimilarity. In this study, MDS analysis was performed by using the PROC MDS procedure (SAS/STAT 9.2, 2009) to the 33 x 33 dissimilarity matrix (1- r) of Egyptian cultivars to obtain the Euclidean coordinates in the form of two metric dimensions. Similar options (COFF=IDENTITY, and LEVEL=ABSOLUTE) were employed as used by Gizlice et al., (1996) and Zhou et al., (2002), except SIMILAR=1, which is for proximity matrix. For convenient graphical representation purposes among cultivars, 2-dimensional MDS procedure was used to produce MDS coordinates obtained with badness-of-fit and convergence criteria (Gradient) of 0.34 and of 0.01, respectively (values of two MDS coordinates for all genotypes are presented in Table 1). These coordinates were then used to obtain different MDS plots among cultivars and various cultivar categories by using the PROC PLOT statement.
Cluster analysis was performed using the NEIGHBOR program of PHYLIP (Phylogeny inference package) version 3.6 (Felsenstein 2005). The Un-weighted Pair-Group Method using Arithmetic means (UPGMA), also called average linkage clustering, approach of PHYLIP’s NEIGHBOR program uses a distance matrix to produce a hierarchical clusters and construct a rooted tree (dendrogram). In this study, the original r matrix was converted into a distance matrix (1-r) and used as an input data file in PHYLIP’s NEIGHBOR program for clustering with UPGMA method. The ‘outtree’ file from PHYLIP was then transferred to the TREEVIEW V1.6.6. (Page, 1996) program to construct the printable form of the dendrogram. To identify the number of clusters we considered the average COP within and among

Communicat ions in B iometry and Crop Sc ience, 6(1) 34
clusters, minimum number of cultivars within clusters, and minimum level of similarity among the clusters.
Table 1. Egyptian cultivars released between 1947 and 2004 and their growing regions, year of release, maturity group, productivity group, plant height, growing region, number of ancestors, and the two-dimensional coordinates that were obtained from multidimensional scaling (MDS) for Figure 1.
Released No. of MDS Coordinates
S.N. Codea Variety Year MGb PGc PHd GRe Ancestors Cluster DIM-1 DIM-2 1 GZ139 Giza139 1947 LTE LOW VTL DEL 3 I 0.66 0.41 2 GZ144 Giza144 1958 LTE LOW VTL NDEL 8 I 0.67 0.33 3 GZ145 Giza145 1958 LTE LOW VTL SDEL 50 F -0.20 -0.65 4 GZ147 Giza147 1958 LTE LOW VTL UEGY 6 A 0.57 0.01 5 GZ148 Giza148 1959 LTE LOW VTL UEGY 6 N/A 0.79 0.02 6 GZ150 Giza150 1960 MED LOW VTL N/A 12 A 0.66 -0.21 7 GZ155 Giza155 1968 ELY AVE TLL AEGY 19 F 0.39 -0.66 8 GZ156 Giza156 1972 MED AVE TLL MEGY 13 H 0.16 0.78 9 SUPX Super X 1972 MED VHG MED DEL 37 C -0.41 0.33 10 INDS65 Indus-65 1973 N/A N/A MED N/A 38 C -0.57 0.36 11 CHB70 Chenab70 1977 MED AVE NA UEGY 37 F 0.03 -0.62 12 GZ157 Giza157 1977 MED MED TLL DEL/MEGY 44 G 0.51 -0.45 13 GZ158 Giza158 1980 ELY MED MED M/UEGY 41 H -0.19 0.65 14 SKH8 Sakha8 1978 MED MED MED NDEL/UEGY 42 C -0.36 0.05 15 SKH61 Sakha61 1980 ELY MED MED DEL 45 C -0.55 0.16 16 GZ160 Giza160 1982 ELY MED MED UEGY 45 F 0.20 -0.66 17 SKH92 Sakha92 1987 MED HGH MED NDEL 45 E 0.27 0.35 18 CHLEF Chlef 1987 N/A N/A MED N/A 48 C -0.17 0.04 19 GZ163 Giza163 1987 MED HGH MED DEL 41 C 0.04 0.22 20 GZ164 Giza164 1987 ELY HGH MED M/UEGY 49 B -0.44 -0.17 21 GZ165 Giza165 1991 MED HGH MED UEGY 60 C 0.17 0.01 22 GMZ1 Gemmeiza1 1991 MED HGH MED EDEL 68 D 0.09 -0.29 23 SAHL1 Sahel1 1994 MED MED TLL N/A 56 B -0.55 -0.36 24 GZ167 Giza167 1995 MED VHG MED N/A 57 D -0.20 -0.40 25 GMZ3 Gemmeiza3 1996 MED VHG MED EDEL 59 C -0.17 0.35 26 GMZ5 Gemmeiza5 1997 MED VHG MED EDEL 54 B -0.45 -0.49 27 GMZ7 Gemmeiza7 1998 ELY VHG TLL MEGY 73 N/A -0.02 0.62 28 GMZ9 Gemmeiza9 1999 LTE VHG MED MEGY 70 C -0.39 0.52 29 GZ168 Giza168 1999 MED VHG MED AEGY 68 B -0.65 -0.19 30 SKH93 Sakha93 1999 MED VHG MED AEGY 46 E 0.35 0.53 31 SKH94 Sakha94 2004 MED VHG TLL AEGY 56 B -0.60 -0.01 32 GMZ10 Gemmeiza10 2004 MED VHG MED DEL 66 D -0.09 -0.23 33 SIDS4 Sids4 1995 VLY LOW MED MEGY 73 G 0.42 -0.35
a Code of Cultivars used in analysis in this study b Maturity group (MG): VLY= very early, ELY=early, MED=Medium, LTE= late cProductivity group (PG): LOW=2.0=3.0 Mg ha-1, AVE=3.0-4.0 Mg ha-1, MED=4.0-5.0 Mg ha-1, HGH = 5.0-6.0 Mg ha-1, VGH= more than 6 Mg ha-1 d Plant height (PH): MED = Medium height (semi dwarf), TLL = relatively tall, VTL = Very tall e Growing region (GR): DEL= Delta, NDEL=north delta, SDEL= south delta, EDEL=east delta, MEGY=middle Egypt, UEGY=Upper Egypt, AEGY= All over Egypt
RESULTS GENETIC BASE AND DIVERSITY PATTERN ANALYSIS OF 33 EGYPTIAN CULTIVARS
We obtained 528 pairwise COP values for all thirty three Egyptian cultivars. Analysis of these COP values revealed that the mean COP for 33 cultivars was 0.103 (excluding the COP

Basnet et a l . – Evaluation of genetic bases and diversity of Egyptian wheat cultivars 35
between the same cultivar). Frequency distribution of the COP values showed that 6.06 % of the total pairwise combinations of cultivars had COP values of 0.0, whereas 81.44 % of the pairwise combinations had COP values ranging from > 0.0 to 0.2 (Table 2). Cluster analysis by the UPGMA method resulted in a total of 9 groups (Cluster A to I) of related cultivars (Fig. 1). The cultivars were assigned to the cluster at the level of COP (within) ≤ 0.20 which is sufficiently smaller than for half sibs COP (i.e. 0.25). Similarly, other criteria used to assign clusters were high resolution of clusters for visual depiction (at least 2 cultivars per cluster) and homogeneity of clusters (i.e. high within cluster COP). Thus, these 9 clusters consist of 2 to 9 cultivars within clusters with an average 0.73 to 0.91 within cluster COP, where 2 cultivars (‘Giza 148’ and ‘Gemmeiza 7’) did not belong to any clusters. Giza 148 was released in 1959 as a stem rust resistant variety suitable for Upper Egypt.
Figure 1. Dendrogram of 33 Egyptian wheat cultivars obtained using the UPGMA method of hierarchical cluster analysis. The letters A-I represent cluster groups for the cultivars indicated by the right brackets.

Communicat ions in B iometry and Crop Sc ience, 6(1) 36
Table 2. Frequency distribution of coefficient of parentage (COP) values determined for all pairwise combinations of 33 Egyptian wheat cultivars.
Pairwise cultivar combination in a COP category COP Category COP rangea Frequency Percentage Cumulative %
1 [0.00-0.00] 32 6.06 6.06 2 (0.00-0.10] 278 52.65 58.71 3 (0.10-0.20] 152 28.79 87.50 4 (0.20-0.30] 49 9.28 96.78 5 (0.30-0.40] 12 2.27 99.05 6 (0.40-0.50] 1 0.19 99.24 7 (0.50-0.60] 3 0.57 99.81 8 (0.60-0.70] 0 0.00 99.81 9 (0.70-0.80] 1 0.19 100.00
10 (0.80-1.00] 0 0.00 100.00 Totalb 528 100.00 100.00
a For each COP interval parentheses indicate boundary exclusive while square brackets indicate boundary inclusive b Number of cluster pairs was calculated as (n2-n)/2, where n is the number of cultivars
This cultivar is relatively less similar to rest of the others because of a unique Egyptian
landrace ‘Mokhtar’ which contributes 75% of its total the genetic makeup. Whereas, Gemmeiza 7, which was released in 1998, contains two unique landraces ‘Ranjit’ and ‘Russian Velvet’ (contributing about 40% of total genetic makeup) making it genealogically different than others. Similarly, MDS analysis revealed a very good pattern of genetic diversity which can be visualized in a 2-D MDS plot (Fig. 2). When the cluster groups were overlaid on the MDS plot, the major groups of clusters were clearly separated with optimal representation of relative distances among clusters, thus confirming the similar conclusion from 2D MDS plots and cluster analysis (Fig. 2).
A total of 155 ancestors of the 33 cultivars under this study were traced to 31 countries of origin. Number of ancestors per cultivars ranged from 3 for Giza-139 (with 2 levels of expansion i.e., Giza-139 represents a second generation progeny from its founder parents) to 73 for Gemmeiza-7 (with 38 levels of expansion i.e., Gemmeiza-7 represents a thirty eighth generation progeny from its founder parents). Based on the origin of ancestors, Egypt itself was the country with highest genetic contribution to the overall genetic pool of Egyptian wheat cultivars. It contributed 16% of the total gene pool with 6 ancestors (landraces) distributed among 94% of total Egyptian wheat cultivars under study (Table 3). In spite of being few in number, the Egyptian materials formed the strong base of crossing program which was started in 1940 with the introduction of new sources of rust resistance genes from India and Kenya (Personal communication). Thus, the Egyptian ancestors worked as immediate parents for most of the 1940s and 50s cultivars which successively became potential parents in crossing blocks, thus, inheriting genetic materials to the modern cultivars. Similarly, 32 ancestors from the US, Kenya, and Ukraine accounted for 11, 9, and 7% of the total genetic contribution to the pedigrees, respectively. About 4% of the total genetic contribution was made by 29 ancestors of unknown origin. Out of the 155 ancestors, the Egyptian cultivar Hindi-62 had the largest (6%) genetic contribution to Egyptian cultivars (Table 4). However, the abundance of Hindi-62 among the cultivars is low (i.e. it is present only in 5 out of 33 cultivars). Similarly, Red Fife and Hard Red Calcutta of Polish and Indian origin, respectively, contributed about 5 and 4% of the total genetic pool of Egyptian cultivars. These two ancestors are also considered to constitute the foundation germplasm

Basnet et a l . – Evaluation of genetic bases and diversity of Egyptian wheat cultivars 37
for the US hard red spring (HRS) class of wheat (Cox 1991). Derived from the cross of Hard Red Calcutta/Ref Fife, ‘Marquis’ was the first cultivar that was grown on almost the entire spring wheat area of both the US and Canada during the 1920s (Van Beuningen and Busch 1997b).
Table 3. List of countries with corresponding genetic contributions and ancestral abundances in overall genetic bases of 33 Egyptian wheat cultivars. Ranking is based on the percentage of total genetic contribution.
cAbundance (%) based on
Rank Country %Genetic contribution
No of Landraces
No of cultivarsa
No of obsb
total cultivars
Total obs
1 EGY 15.581 6 31 38 93.94 2.65 2 US 11.488 20 30 244 90.91 17.00 3 KEN 9.103 7 30 65 90.91 4.53 4 UKR 7.088 5 29 92 87.88 6.41 5 ARG 6.243 7 26 124 78.79 8.64 6 POL 5.379 2 31 59 93.94 4.11 7 JPN 5.186 3 27 54 81.82 3.76 8 IND 5.140 7 31 99 93.94 6.90 9 MEX 4.503 6 22 36 66.67 2.51
10 BRA 4.471 6 27 84 81.82 5.85 11 Unknown 4.143 29 27 107 81.82 7.46 12 ZAF 3.600 1 25 25 75.76 1.74 13 ESP 2.500 3 29 32 87.88 2.23 14 CAN 2.261 7 30 54 90.91 3.76 15 ITA 2.154 7 27 45 81.82 3.14 16 PSE 2.141 2 25 26 75.76 1.81 17 URY 1.858 3 24 53 72.73 3.69 18 RUS 1.630 3 27 34 81.82 2.37 19 AUS 1.348 4 28 58 84.85 4.04 20 DEU 1.029 3 11 21 33.33 1.46 21 PRT 0.758 1 1 1 3.03 0.07 22 FRA 0.744 12 25 37 75.76 2.58 23 MAR 0.663 1 3 3 9.09 0.21 24 NLD 0.478 1 27 27 81.82 1.88 25 SRB 0.379 2 1 2 3.03 0.14 26 COL 0.095 1 1 1 3.03 0.07 27 ZWE 0.033 1 4 4 12.12 0.28 28 GBR 0.002 1 4 4 12.12 0.28 29 SWE 0.001 1 1 1 3.03 0.07 30 ECU 0.001 1 2 2 6.06 0.14 31 CHL 0.001 1 2 2 6.06 0.14 32 DZA 0.000 1 1 1 3.03 0.07
a Number of Egyptian wheat cultivars which content at least one US based ancestor in the pedigree b Frequency of US ancestors present in overall genetic pool of 33 Egyptian wheat cultivars after expanding the pedigree to the landrace level c Abundance based on total cultivar = (No. cultivar representation for a country/total cultivars)*100, Abundance based on total observation= (No of times a country appear in the pedigree/total no. observations)*100

Communicat ions in B iometry and Crop Sc ience, 6(1) 38
Figure 2. Plot of 33 Egyptian wheat cultivars in two dimensions obtained through multidimensional scaling (MDS) analysis. The complement of the linear distance (1-Distance) between any two cultivars estimates the coefficient of parentage between them. The closed ovals represent clusters of cultivars obtained by using the UPGMA hierarchical clustering approach. Cultivar abbreviation has been presented in Table 1.
DIVERSITY PATTERNS REVEALED BY CLUSTER ANALYSIS Cluster C was the largest among the 9 clusters produced based on a COP matrix of 33
cultivars using the UPGMA method (Table 1, Fig. 1). Average COP within cluster C was 0.39 indicating more diverse genetic material within this cluster. However, we cannot completely deny the possibility that the large sample size might have caused the lower average COP estimate within cluster C as compared to other clusters. This cluster was comprised of 9 Egyptian wheat cultivars released from 1970s to 1999, most of them with high yield potential. Cultivar maturity within this cluster ranged from early to late with medium plant height. The major ancestors representing cultivars of this clusters were, ‘Steinwedel’, Red Fife, ‘Red Egyptian’, and ‘KenyaBF4-3B’ with 6.3, 5.3, 5.2, and 5.0% of genetic contribution for this cluster, respectively. Cluster ‘B’ was the second largest, comprising of 5 cultivars released from 1980s to 2004. This cluster had less diverse genetic material (within cluster COP = 0.51) compared to cluster C. Cluster B on average was comprised of cultivars with medium plant height, early to medium maturity, and relatively high yield potential. Major ancestors representing this cluster were Akagomughi, Steinwedel, Red Fife and ‘Kenya 324’ with 6, 4.1, 4, and 3.8% of genetic contribution to this cluster, respectively. Cluster ‘F’ was composed of 4 cultivars released from the late 1950s to the early 1980s. Characteristically, this cluster consisted of cultivars with medium to very tall plant height, early to late maturity, and average yield potential. Within cluster COP for this cluster was 0.57.

Basnet et a l . – Evaluation of genetic bases and diversity of Egyptian wheat cultivars 39
Table 4. List of top 30 landraces based on their corresponding genetic contributions to overall genetic bases of 33 Egyptian wheat cultivars along-with their abundances in the genetic pool.
bAbundance (%) based on Rank Ancestors
% Genetic Contribution
Country of origin
No. of cultivarsa Total cultivars Total obs.
1 Hindi-62 5.776 EGY 5 15.15 1.06 2 Red fife 5.106 POL 31 93.94 6.55 3 Hard Red Calcutta 3.883 IND 31 93.94 6.55 4 Akagomughi 3.820 JPN 27 81.82 5.70 5 Steinwedel 3.600 ZAF 25 75.76 5.28 6 Hindi-90 2.918 EGY 6 18.18 1.27 7 Kanred 2.883 UKR 29 87.88 6.12 8 Kenya BF4-3b.10.v.1 2.531 KEN 23 69.70 4.86 9 Red Egyptian 2.531 EGY 23 69.70 4.86
10 Kenya-324 2.509 KEN 26 78.79 5.49 11 ‘Iumillo’ emmer 2.499 ESP 29 87.88 6.12 12 Turkey Red 2.355 UKR 26 78.79 5.49 13 Mokhtar 2.273 EGY 1 3.03 0.21 14 Gaza 2.140 PSE 25 75.76 5.28 15 Egyptna-101 2.106 ARG 22 66.67 4.65 16 Rieti 1.944 ITA 27 81.82 5.7 17 Oro 1.766 US 26 78.79 5.49 18 Polyssu 1.735 BRA 27 81.82 5.70 19 Lerma-950 1.704 MEX 2 6.06 0.42 20 Fultz 1.600 US 26 78.79 5.49 21 Hindi-D 1.515 EGY 1 3.03 0.21 22 Tr-810328 1.515 MEX 1 3.03 0.21 23 Improved Fife 1.487 US 28 84.85 5.91 24 Kenya9M.I.A.3 1.459 KEN 6 18.18 1.27 25 Kenya U 1.459 KEN 6 18.18 1.27 26 Daruma 1.177 JPN 26 78.79 5.49 27 Kenya 1.136 CAN 2 6.06 0.42 28 Knott#2 1.136 KEN 2 6.06 0.42 29 Barleta 1.134 ARG 24 72.73 5.07 30 Chino 1.134 ARG 24 72.73 5.07
a Number of cultivars which has some genetic contribution from the given ancestor b Abundance based on cultivars = (No. of cultivars from the ancestor/total number of cultivars)*100, Abundance based on observation= (No. of times the ancestor appear in the pedigree/ total number of observations)*100
Cluster F was unique in having a single predominant ancestor, Hindi-62, with a big
genetic contribution (41%). Other major ancestors were Red Fife, Steinwedel, and Hard Red Calcutta having genetic contributions of 4, 3.2, and 2.7%. Similarly, cluster D was comprised of 3 cultivars released from the 1990s to 2004. Cultivars such as ‘Gemmeiza 10’ and ‘Giza 167’ with very high yield potential, medium plant height, and medium maturity belong to this cluster. Historical ancestors Akagomughi, Red Fife, Steinwedel, and ‘Kanred’ were the major ancestors with genetic contributions of 6.0, 5.5, 5.0, and 4.0%.
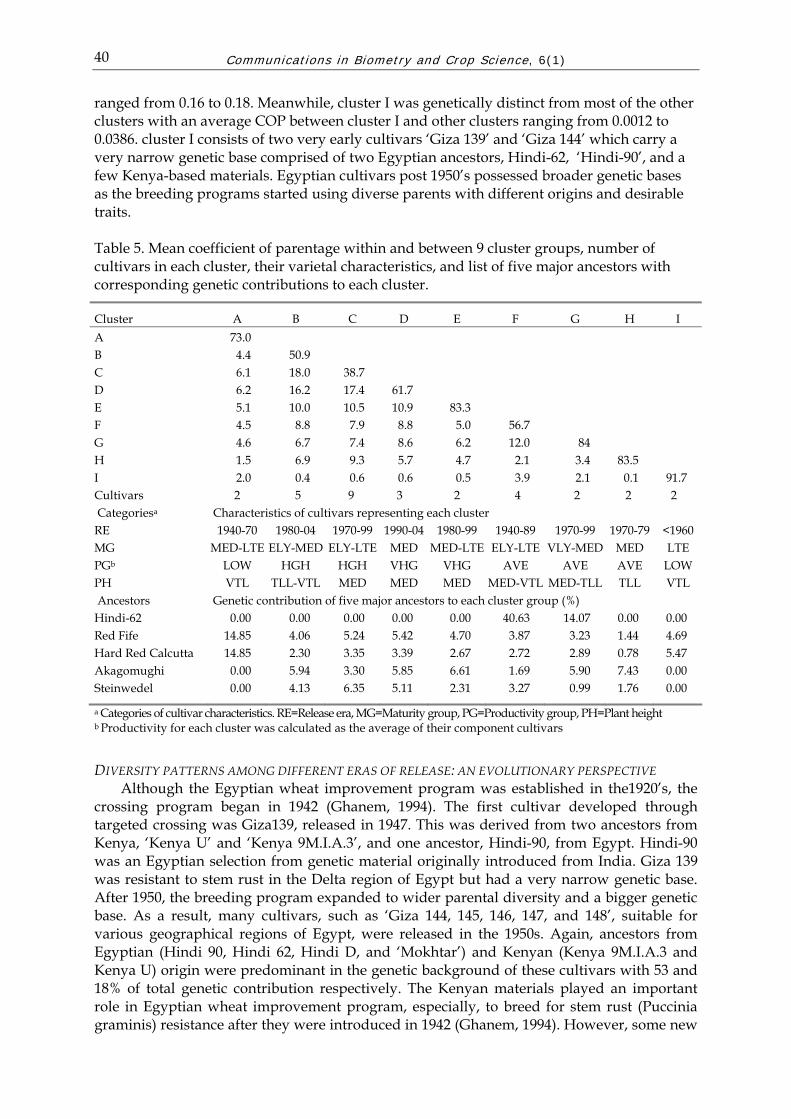
Clusters A, E, G, H, and I are relatively small with 2 cultivars within each cluster and have different cultivar characteristics and levels of genetic similarity (Table 5). The clusters B, C, and D had more common ancestral contributions based on among cluster COP which
Communicat ions in B iometry and Crop Sc ience, 6(1) 40
ranged from 0.16 to 0.18. Meanwhile, cluster I was genetically distinct from most of the other clusters with an average COP between cluster I and other clusters ranging from 0.0012 to 0.0386. cluster I consists of two very early cultivars ‘Giza 139’ and ‘Giza 144’ which carry a very narrow genetic base comprised of two Egyptian ancestors, Hindi-62, ‘Hindi-90’, and a few Kenya-based materials. Egyptian cultivars post 1950’s possessed broader genetic bases as the breeding programs started using diverse parents with different origins and desirable traits.
Table 5. Mean coefficient of parentage within and between 9 cluster groups, number of cultivars in each cluster, their varietal characteristics, and list of five major ancestors with corresponding genetic contributions to each cluster.
Cluster A B C D E F G H I A 73.0 B 4.4 50.9 C 6.1 18.0 38.7 D 6.2 16.2 17.4 61.7 E 5.1 10.0 10.5 10.9 83.3 F 4.5 8.8 7.9 8.8 5.0 56.7 G 4.6 6.7 7.4 8.6 6.2 12.0 84 H 1.5 6.9 9.3 5.7 4.7 2.1 3.4 83.5 I 2.0 0.4 0.6 0.6 0.5 3.9 2.1 0.1 91.7 Cultivars 2 5 9 3 2 4 2 2 2 Categoriesa Characteristics of cultivars representing each cluster RE 1940-70 1980-04 1970-99 1990-04 1980-99 1940-89 1970-99 1970-79 <1960 MG MED-LTE ELY-MED ELY-LTE MED MED-LTE ELY-LTE VLY-MED MED LTE PGb LOW HGH HGH VHG VHG AVE AVE AVE LOW PH VTL TLL-VTL MED MED MED MED-VTL MED-TLL TLL VTL Ancestors Genetic contribution of five major ancestors to each cluster group (%) Hindi-62 0.00 0.00 0.00 0.00 0.00 40.63 14.07 0.00 0.00 Red Fife 14.85 4.06 5.24 5.42 4.70 3.87 3.23 1.44 4.69 Hard Red Calcutta 14.85 2.30 3.35 3.39 2.67 2.72 2.89 0.78 5.47 Akagomughi 0.00 5.94 3.30 5.85 6.61 1.69 5.90 7.43 0.00 Steinwedel 0.00 4.13 6.35 5.11 2.31 3.27 0.99 1.76 0.00
a Categories of cultivar characteristics. RE=Release era, MG=Maturity group, PG=Productivity group, PH=Plant height b Productivity for each cluster was calculated as the average of their component cultivars
DIVERSITY PATTERNS AMONG DIFFERENT ERAS OF RELEASE: AN EVOLUTIONARY PERSPECTIVE Although the Egyptian wheat improvement program was established in the1920’s, the
crossing program began in 1942 (Ghanem, 1994). The first cultivar developed through targeted crossing was Giza139, released in 1947. This was derived from two ancestors from Kenya, ‘Kenya U’ and ‘Kenya 9M.I.A.3’, and one ancestor, Hindi-90, from Egypt. Hindi-90 was an Egyptian selection from genetic material originally introduced from India. Giza 139 was resistant to stem rust in the Delta region of Egypt but had a very narrow genetic base. After 1950, the breeding program expanded to wider parental diversity and a bigger genetic base. As a result, many cultivars, such as ‘Giza 144, 145, 146, 147, and 148’, suitable for various geographical regions of Egypt, were released in the 1950s. Again, ancestors from Egyptian (Hindi 90, Hindi 62, Hindi D, and ‘Mokhtar’) and Kenyan (Kenya 9M.I.A.3 and Kenya U) origin were predominant in the genetic background of these cultivars with 53 and 18% of total genetic contribution respectively. The Kenyan materials played an important role in Egyptian wheat improvement program, especially, to breed for stem rust (Puccinia graminis) resistance after they were introduced in 1942 (Ghanem, 1994). However, some new

Basnet et a l . – Evaluation of genetic bases and diversity of Egyptian wheat cultivars 41
sources of genetic material, Hard Red Calcutta from India, Red Fife from Poland, and Kanred from Ukraine, constituting about 22% of the total genetic background, were also introduced into these cultivars (Table 6). Out of these varieties, Giza 144 was resistant to both stem and leaf rusts and was very popular in the Delta region before it succumbed to stripe rust (Puccinia striiformis) in 1967 (Ghanem, 1994). The decades of the 1950s and early 1960s remained important to further broadening of the genetic base and diversity of Egyptian wheat cultivars. This can be witnessed in cultivar Giza 145, released in 1958, having 50 ancestors in its genetic background.
The decade of the 1960s also marked the successful historical release of cultivars such as ‘Giza 155’. This cultivar was resistant to stem and stripe rusts along with possessing a high degree of tolerance to leaf rust (Ghanem, 1994). Also being heat tolerant, early maturing and moderately resistant to lodging, it was popularly grown all over Egypt in the late 1960s and mid 1970s. As for the genetic background, 1960s cultivars had Hindi 62 providing the highest contribution of 37% followed by ‘Merit’ of US origin, Red Fife, and Hard Red Calcutta with 14, 10, and 10.2% contribution, respectively. Similarly, ‘Kota’ from Russia and ‘Iumillo’ from Spain appeared to have significant contributions of 7 and 5%, respectively, to this group of cultivars. Furthermore, the introduction of dwarfing genes from CIMMYT to Egypt was begun in 1962 (Ghanem, 1994).
In the 1970s, many cultivars with more diverse genetic backgrounds including dwarf plant stature, lodging resistance, and high nitrogen responsiveness were released in Egypt. The list includes ‘Giza 156 and 157’, ‘Super-X’, ‘Indus 65’, ‘Chenab 70’, ‘Mexipak’, and ‘Sakha 8’. A new ancestor from Mexico ‘Lerma 950’ with a genetic contribution of 8% became the largest contributing ancestor for the gene pool of 1970s cultivars. Similarly, Akakomughi, of Japanese origin, appeared in the pedigrees of these cultivars with significant contributions (4.5%) to this gene pool. Akakomughi is an ancestral parent of many spring wheat varieties through widespread use as a dwarfing source and as a grandparent of ‘Frontana’, a South American spring wheat used widely as a source of leaf rust (Puccinia recondita Rob. ex Desm. f. sp. tritici) resistance (Roelfs et al., 1992). A large ancestral contribution was also observed from Steinwedel of S. African origin, Red Egyptian of Egyptian origin, ‘Knott#2’ of Canadian origin, ‘Turkey Red’ of Ukrainian origin, and some ancestors from Kenya and Poland to the 1970s’ Egyptian cultivars.
In the 1980s, some more promising cultivars with short plant height and high yield potential were released. ‘Sakha 61’ and ‘Giza 160’ were released in the early 1980s, whereas ‘Sakha 92’, ‘Giza 163 and 164’ were released in the late 1980s. In this era Hindi-62 again became the dominant ancestor in the pedigrees followed by Steinwedel, Ref Fife, and Akakomughi. A new ancestor ‘Egyptna 101’ from Egypt appeared to have had a significantly big contribution (3.5%) to the total gene pool of 1980s cultivars. With 45 ancestors per cultivar on average, the genetic base of each cultivar appeared to be bigger than the ones released earlier.
The 1990s was probably the most fruitful decade in the history of the Egyptian wheat improvement program. More than 10 bread wheat cultivars were released in the 1990s. These high yielding cultivars had a very broad genetic base. Most of the cultivars could be traced back to 60 ancestors with 25 to 35 levels of expansion on average. Within COP for the 1990s cultivar group was 0.25 which is significantly lower than any other release era group indicating a broad genetic base within the cultivar background and higher diversity among the cultivars. Some of the high yielding cultivars released in the 1990s were ‘Gemmeiza 5, 7 and 9’, ‘Giza 168’, ‘Sakha 93’ etc., which yielded about 6.5 ton per hectare. Out of 146 ancestors present in the background of 1990s cultivars two ancestors, Akakomughi of Japanese and ‘TR-810328’ of Mexican origin, had the highest genetic contributions (5% each). Similarly, in 2004, some important high yielding varieties (‘Sakha 94’ and ‘Gemmieza 10’) were released. Again, Akakomughi was the predominant ancestor in the background of these cultivars.

Communicat ions in B iometry and Crop Sc ience, 6(1) 42
Overall COP analysis revealed that cultivars released in the 1990s had the highest genetic diversity which could be measured by a within group COP value of 0.25 and a broader genetic base with 11 cultivars containing 145 ancestors in their background. The genetic similarity between the cultivar groups released before and after 1970 was relatively lower as indicated by COP values ranging from 0.034 to 0.092 (Table 6). Similarity in genetic materials among cultivar groups of the 1970s, 80s, 90s, and later were more pronounced as provided by COP values between groups that ranged from 0.12 to 0.18. This may be possibly due to global use of CIMMYT derived dwarf and high yielding materials and introduction of some common parents like Thatcher, which were extensively used as parents in the US and Canada at that time. Graphical representation of each release era in two dimensional MDS plots is given in Fig. 3.
Figure 3. Plot of the six release eras representing 33 Egyptian wheat cultivars. The dimension scores for each group were obtained by averaging the multidimensional scaling scores in Table 1. The complement of the linear distance (1-Distance) between any two cultivars estimates the coefficient of parentage between them. Designations of release eras; I, II, III, IV, V and VI represent the years before 1960, 1960 to 1969, 1970 to 1979, 1980 to 1989, 1990 to 1999 and after 2000 respectively.
DIVERSITY PATTERNS AMONG DIFFERENT PRODUCTIVITY GROUPS AND GROWING REGIONS Increases in the genetic yield potential in Egyptian wheat cultivars follow the
evolutionary pattern of cultivar development by exploiting new genetic resources and technologies from around the world. In this study, 33 Egyptian cultivars were classified into five productivity groups based on their yield potential under Egyptian conditions. Most of the cultivars released before 1960 had low yield potential (less than 3 Mg ha-1) whereas the cultivars released in the 1970s have an average to medium level of productivity. This yield increase was attributed to the introduction of short statured plants and effective breeding efforts to accumulate many desirable traits (like rust resistance and heat stress tolerance) into the cultivars through massive germplasm mobilization around the world. As expected, the COP within each productivity group ranged from 0.30 to 0.44 which was relatively higher than among group COP values. Genetic similarity measures based on COP among the groups ranged from 0.39 (between low and very high PG group) to 0.17 (between high to very high PG group). Many cultivars released after 1990 possess a very high yield potential (> 6.0 Mg ha-1). Based on average COP among the groups, the low productivity group shares

Basnet et a l . – Evaluation of genetic bases and diversity of Egyptian wheat cultivars 43
a very small fraction of genetic material with all the other PG groups, whereas, medium, high, and very low levels of productivity group share bigger fraction of their genetic material. As expected, we observed a strong positive linear relationship between productivity group and release era (Pearson’s correlation coefficient, r = 0.85, P < 0.001) indicating the evolutionary pattern of yield increases in Egyptian wheat cultivars. Similarly, plant height showed a significant negative linear relationship with productivity group (r = -0.73, P < 0.001), indicating that the introduction of dwarfing genes into the breeding program played an important role in increasing the yield potential of Egyptian wheat cultivars. However, maturity group does not seem to have a significant impact on yield increase (r = -0.22, P > 0.05).
Egyptian wheat cultivars showed a significant diversity pattern based on their targeted growing regions. Major geographical locations for targeted breeding programs include the North Delta (for rust resistance, salinity tolerance and earliness), Middle Delta (for rust resistance, low input and long spike), West Delta (for rust resistance, drought and salinity tolerance), South Delta (for earliness and yield potential), Middle Egypt, and Upper Egypt (for heat stress tolerance) (Ghanem, 1994; Mosaad, 2010, personal communication). As most of the cultivars overlap more than one growing region, we could not assign groups and analyze using within and among group average COP values. However, such a tremendous heterogeneity in growing regions has provided a big opportunity to host greater genetic diversity among wheat cultivars grown all over Egypt. Targeted growing regions (GR) for 33 wheat cultivars have been presented in Table 1.
Table 6. Mean coefficient of parentage (rx100) of 33 Egyptian wheat cultivars within and between six release eras (RE) and major contributing ancestors to each group.
RE BEF 1960 1960-1969 1970-1979 1980-1989 1990-1999 2000-2004
BEF 1960 39.41
1960-1969 9.18 68.83
1970-1979 3.27 4.20 34.71
1980-1989 5.09 7.32 15.03 40.55
1990-1999 3.60 3.11 11.55 15.21 26.30
2000-2004 4.52 3.10 13.76 18.84 15.84 72.67 No. of cultivars 5 2 7 6 11 2
Major Ancestors of each release era (RE) group with percentage genetic contribution to each
group in parenthesis 1 Hindi90 (17) Hindi62(37) Lerma950 (8) Hindi62 (6) Akagomughi (5) Akagomughi (6) 2 Mokhtar (15) Merit (14) Kenya (5) Steinwedel (5) TR-810328 (5) Red Fife (5) 3 Hindi62(10) Red Fife (10) Steinwedel (5) Red Fife(5) Red Fife (4) Steinwedel (5) 4 HindiD (10) bHRC (9) Akagomughi (5) Akagomughi (5) Steinwedel (4) Kanred (4) 5 aKenya9(9) Kota (7) Red Egyptian (4) T. aestivum (4) Kenya324(3) Kenya324 (4)
a Kenya9.M.I.A.3 b Hard Red Calcutta
DISCUSSION The genetic base and diversity of Egyptian wheat germplasm has increased
tremendously in the last 50 years. Beginning with a very narrow genetic base (three parents in Giza 139) and low yield potential, modern Egyptian wheat cultivars possess a broad genetic base in their background (with more than 60 ancestors in Gemmeiza 10, Sakha 94,
Communicat ions in B iometry and Crop Sc ience, 6(1) 44
etc.) with very high yielding ability in the different agro-climatic regions of Egypt. Global mobilization of genetic materials of spring wheat dates back to 1842 when ‘Fife’, a landrace from Poland, was introduced into Canada (Ausems and Rietz, 1962) and used for selection and crossing. Derived from the cross between Hard Red Calcutta and Red Fife, Marquis was released in 1911 and later became the backbone of North American wheat production (Kephart, 1994). Similarly, another landmark variety Thatcher (Marquis/‘Iumillo’ emmer//Marquis/Kanred) replaced Marquis in both production area (with approximately 2.5 million ha in the US) and quality standard in 1939 (Mercado et al., 1996). Thus Marquis-Thatcher germplasm became dominant as the hallmark parents in crossing programs around the world in the 1950s and 1960s. The worldwide popularity of these germplasm has definitely affected the Egyptian breeding program as well. This can be clearly witnessed by predominant ancestors (Red Fife, Hard Red Calcutta, Iumillo emmer, and Kanred), which have significantly large amounts of genetic contribution to the Egyptian spring wheat cultivars background. Before 1970, we can speculate direct introduction of Marquis-Thatcher germplasm from North America (US/Canada). However, after 1970, these materials were inherited in CIMMYT derived introductions in conjunction with bringing dwarfing and rust resistance genes to Egypt.
Pedigree based diversity analysis of Egyptian wheat cultivars (for all the cultivars, average COP = 0.103) has comparable results with similar previous studies for different countries and regions of the world. This analysis essentially indicated broader genetic base and diversity within Egyptian wheat cultivars as compared to US and Canadian red spring wheat (average COP = 0.16), US and Canadian white wheat (average COP = 0.25), CIMMYT based US and Canadian wheat (average COP = 0.19) cultivars (van Beuningen and Busch, 1997), and wheat lines included in CIMMYT coordinated international wheat nurseries 17 to 27 with an average COP of 0.14 (Souza et al., 1998). A similar study by Mercado et al., (1996) showed that average COP for North American hard red spring wheat cultivars from 1920 to 1990 ranged from 0.10 to 0.34. Similarly, Murphy et al. (1986) found relatively higher COP values among soft red winter (COP = 0.16) and hard red winter (COP= 0.23) wheat cultivars from the US released before 1986. These values indicate less diverse genetic materials in American red wheat released before 1986 than the Egyptian cultivars released over the last 50 years. Similar diversity levels were observed by Martin et al. (1991) in North American spring barley cultivars (average COP among two and six row cultivars 0.11 and 0.10 respectively). However, in most studies genetic diversity of wheat has been observed to be relatively lower than that of other self pollinated crops like soybean and rice. This seems to be relevant observation as the common wheat (T. aestivum) which went through massive breeding pressure, was evolved from two progenitors, tetraploid T. turgidum and diploid T. tauschii, in limited number of accidental crosses (Reif et al., 2005; Dvorak et al., 1998; Talbert et al., 1998). Wang and Lu (2006) have found very high genetic diversity (average COP = 0.056) among 100 parental lines of Indica hybrid rice in China. Similarly, huge genetic diversity (average COP = 0.02) among 651 Chinese soybean cultivars released from 1923 to 1995 has been observed by Cui et al. (2000). Similar results were found in 86 Japanese soybean cultivars (average COP = 0.04), indicating a potentially high degree of diversity in Japanese soybean breeding (Zhou et al., 2000).
The accuracy of the COP analysis depends upon a number of assumptions. Deviations from equal genetic contribution from both parents and deviation from the assumption that ancestors are unrelated by descent may cause problems in making inferences (St. Martin, 1982; van Beuningen and Busch, 1997a). Furthermore, the COP values among the cultivars are relative measures of diversity that allow the comparison of different gene pools in time and space. Better estimates of absolute diversity may be obtained from polymorphism among cultivars at the DNA level (van Beuningen and Busch, 1997b). The distribution of cultivars in each release era from 1947 to 2004 was not equal, so average COP based inference may not give the best diversity estimate of cultivars across release era. Pedigree

Basnet et a l . – Evaluation of genetic bases and diversity of Egyptian wheat cultivars 45
record is another important aspect to reveal the accuracy of this study. Our study is based on all the pedigree records available in the international wheat information system of CIMMYT. Similarly, in our study we selected only 33 Egyptian cultivars of hexaploid wheat to obtain COP matrices and ancestral contributions for diversity analysis. We could not include all cultivars in this study because of incomplete information regarding their pedigrees and/or cultivar characteristics. So this study may not necessarily give the complete picture of diversity for all the Egyptian cultivars released so far. However, we believe this study significantly represents the major cultivars with landmark historical backgrounds and provide a representative picture of genetic base and diversity patterns among them. In conclusion, this information can direct future breeding strategies by enabling effective crossing and/or introduction of new germplasm for better combinations of useful traits, broadening of the genetic base, and reducing of the genetic vulnerability to the gene pool.
REFERENCES Almanza-Pinzon, M.I., Khairallah, M., Fox, P.N., Warburton M.L. (2003). Comparison of
molecular markers and coefficients of parentage for the analysis of genetic diversity among spring bread wheat accessions. Euphytica 130, 77–86.
Ausemus, E.R., Reitz, L.P. (1962). Hard red spring and durum wheats: Culture and varieties. USDA Agric Info Bul No 249. US Government Printing Office, Washington, D.C.
Beer, S.C., Souza, E., Sorrells, M.E. (1995). Prediction of genotype performance from ancestral relationship in oat. Crop Science 35, 69–73.
Chao, S.M., Zhang, W.J., Dubcovsky, J., Sorrells, M. (2007). Evaluation of genetic diversity and genome-wide linkage disequilibrium among US wheat (Triticum aestivum L.) germplasm representing different market classes. Crop Science 47, 1018–1030.
Cowen, N.M., Frey, K.J. (1987). Relationship between genealogical distance and breeding-behavior in oats (Avena sativa L). Euphytica 36, 413–424.
Cox, T.S. (1991). The contribution of introduced germplasm to the development of US wheat cultivars In: Shands, H.L., Wiesner, L.E. (Eds.) Use of plant introductions in cultivar development. CSSA Special Pub No 17, Madison, Wisconsin.
Cox, T.S., Kiang, Y.T., Gorman, M.B., Rodgers, D.M. (1985a). Relationship between coefficient of parentage and genetic similarity indexes in the soybean. Crop Science 25, 529–532.
Cox, T.S., Lookhart, G.L., Walker, D.E., Harrell, L.G., Albers, L.D., Rodgers, D.M. (1985b). Genetic-relationships among hard red winter-wheat cultivars as evaluated by pedigree analysis and gliadin polyacrylamide-gel electrophoretic patterns. Crop Science 25, 1058–1063.
Cui, Z.L., Carter, T. E. Jr, Burton, J.W. (2000). Genetic base of 651 Chinese soybean cultivars released during 1923 to 1995. Crop Science 40, 1470–1481.
Dilday, R.H. (1990). Contribution of ancestral lines in the development of new cultivars of rice. Crop Science 30, 905–911.
Dvorak, J., Luo, M.C., Yang, Z.L., Zhang, H.B. (1998). The structure of the Aegilops tauschii genepool and the evolution of hexaploid wheat. Theoretical and Applied Genetics 97, 657–670.
Elkassaby, Y.A. (1982). Associations between allozyme genotypes and quantitative traits in douglas-fir [Pseudotsuga menziesii (Mirb) Franco]. Genetics 101, 103–115.
Felsenstein, J. (2005). Phylip (Phylogeny Inference Package) Version 3.6. Distributed by the author. Department of Genome Sciences, University of Washington, Seattle.
Ghanem, E.H. (1994). Wheat improvement in Egypt with emphasis with heat tolerance. In: Saunders, D.A., Hettel, G.P. (Eds.) Wheat in heat-stressed environments: irrigated, dry areas and rice-wheat farming systems. Mexico, D.F., CIMMYT.

Communicat ions in B iometry and Crop Sc ience, 6(1) 46
Gizlice, Z., Carter, T.E. Jr, Gerig, T.M., Burton, J.W. (1996). Genetic diversity patterns in North American public soybean cultivars based on coefficient of parentage. Crop Science 36, 753–765.
Keeler, K.H. (1978). Intra-population differentiation in annual plants. II. Electrophoretic variation in Veronica peregrina. Evolution 32, 638–645.
Kephart, K.D. (1994). Commercial wheat varieties of the United States. Version 1.1. In: Graingenes the Triticeae genome database. Internet Gopher server at host greengenes.cit.cornell.edu, port 70
Kisha, T.J., Diers, B.W., Hoyt, J.M., Sneller, C.H. (1998). Genetic diversity among soybean plant introductions and North American germplasm. Crop Science 38, 1669–1680.
Martin, J.M., Blake, T.K., Hockett, E.A. (1991). Diversity among North American spring barley cultivars based on coefficients of parentage. Crop Science 3l, 1131–1137.
Martinez, O.J., Goodman, M.M., Timothy, D.H. (1983). Measuring racial differentiation in maize using multivariate distance measures standardized by variation in F2 populations. Crop Science 23, 775–781.
Mercado, L.A., Souza, E., Kephart, K.D. (1996). Origin and diversity of North American hard spring wheats. Theoretical and Applied Genetics 93, 593-599.
Miranda, Z.D.S., Arias, C.A.A., Prete, C.E.C., Kiihl, R.A.D., de Almeida, L.A., de Toledo, J.F.F., Destro, D. (2007). Genetic characterization of ninety elite soybean cultivars using coefficient of parentage. Pesquisa Agropecuaria Brasileira 42, 363–369.
Murphy, J.P., Cox, T.S., Rodgers, D.M. (1986). Cluster-analysis of red winter-wheat cultivars based upon coefficients of parentage. Crop Science 26, 672–676.
Page, R.D. M. (1996), Treeview: An application to display phylogenetic trees on personal computers. Computer Applications in the Biosciences 12, 357–358.
Payne, T.S., Skovmand, B., Lopez, C.G., Brandon, E., Mcnab, A. (Ed.) (2002). The international wheat information system (IWIS), Version 4. 2001. On Compact Disk. CIMMYT, Mexico, D.F.
Price, S.C., Shumaker, K.M., Kahler, A.L., Allard, R.W., Hill, J.E. (1984). Estimates of population differentiation obtained from enzyme polymorphisms and quantitative characters. Journal of Heredity 75, 141–142.
Priolli, R.H.G., Pinheiro, J.H., Zucchi, M.I., Bajay, M.M., Vello, N.A. (2010). Genetic diversity among Brazilian soybean cultivars based on SSR loci and pedigree data. Brazilian Archives of Biology and Technology 53, 519–531.
Reif, J.C., Zhang, P., Dreisigacker, S., Warburton, M. L., Van Ginkel, M., Hoisington, D., Bohn M., Melchinger, A.E. (2005). Wheat genetic diversity trends during domestication and breeding. Theoretical and Applied Genetics 110, 859–864.
Roelfs, A.P., Singh, R.P., Saari, E.E. (1992). Rust diseases of wheat: Concepts and methods of disease management. CIMMYT, Mexico, DF.
Souza, E., Fox, P.N., Byerlee, D., Skovmand, B. (1994). Spring wheat diversity in irrigated areas of 2 developing-countries. Crop Science 34, 774–783.
Souza, E., Fox, P.N., Skovmand, B. (1998). Parentage analysis of international spring wheat yield nurseries 17 to 27. Crop Science 38, 337–341.
Souza, E., Sorrells, M.E. (1989). Pedigree analysis of North American oat cultivars released from 1951 to 1985. Crop Science 29, 595–601.
St Martin, S.K. (1982). Effective population size for the soybean improvement program in maturity groups 00 To IV. Crop Science 22, 151–152.
Talbert, L.E., Smith, L.Y., Blake, M.K. (1998). More than one origin of hexaploid wheat is indicated by sequence comparison of low copy DNA. Genome 41, 402–407.
Van Beuningen, L.T., Busch, R.H. (1997a). Diversity among North American spring wheat cultivars: I. Analysis of the coefficient of parentage matrix. Crop Science 37, 570–579.

Basnet et a l . – Evaluation of genetic bases and diversity of Egyptian wheat cultivars 47
Van Beuningen, L.T., Busch, R.H. (1997b). Genetic diversity among North American spring wheat cultivars: II. Ancestor contributions to gene pools of different eras and regions. Crop Science 37, 580–585.
Wang, S., Lu, Z. (2006). Genetic diversity among parental lines of indica hybrid rice (Oryza sativa L.) in China based on coefficient of parentage. Plant Breeding 125, 606–612.
Zhou, X., Carter, T.E. Jr, Cui, Z., Miyazaki. S., Burton, J.W. (2002). Genetic diversity patterns in Japanese soybean cultivars based on coefficient of parentage. Crop Science 42, 1331–1342.
Zhou, X., Carter, T.E. Jr, Cui, Z., Miyazaki, S., Burton, J.W. (2000). Genetic base of Japanese soybean cultivars released during 1950 to 1988. Crop Science 40, 1794–1802.