evaluation of fodder systems for organic dairy cattle to ... · evaluation of fodder systems for...
TRANSCRIPT

This is a Final project report submitted to The Ceres Trust. Project Title: Evaluation of Fodder Systems for Organic Dairy Cattle to Improve Livestock Efficiency Investigator: Bradley Heins, Ph.D. University of Minnesota West Central Research and Outreach Center 46352 State Hwy 329 Morris, MN 56267 32-589-1711 [email protected] Collaborators: James Paulson, M.S., University of Minnesota Extension, Rochester, MN Project Period: 2013-2016 Report Submitted: January 2017

Problem addressed The number of organic dairies has been steadily growing during the past decade in the United States and the Midwest. However, current research and extension programs do not adequately support the needs of the increasing number of organic dairies, and scientific research on feeding fodder to organic dairy cattle is lacking. There is renewed interest in fodder systems for dairy production systems. As organic grain prices have remained high and organic alfalfa hay in short supply because of drought conditions across the United States, producers are looking for information about fodder sprouting systems to supply essential nutrients to dairy cattle. Project Objective
The overall objective of the project is to evaluate the milk production potential and economics of feeding fodder to organic lactating dairy cattle. We will deliver organic best management practices for fodder production systems to organic dairy cows through learning opportunities via workshops, field days, conferences, and scholarly articles. Cow Methodology
A fodder system was acquired from FarmTek (Dyersville, IA) during July 2014 and assembled during late July and August 2014 at the West Central Research and Outreach Center
During September 2014, we evaluated five grains for use in fodder productions systems. We evaluated the performance of varieties of barley, oats, wheat, rye, and triticale harvested at 7 days after the start of growing. Every Monday for six weeks, 30 fodder trays (2ft x 6ft) were filled with 9 lbs of wet grain. Each tray was automatically watered twice days for 4 minutes each time. On the seventh day, each tray was harvested, weighed, and scored on a 1 to 5 scale for mold. Ten random samples from each grain each week were saved for dry matter and forage quality analysis.
Fodder samples were analyzed for dry matter, ash, crude protein, neutral detergent fiber, acid detergent fiber, starch, and minerals using wet chemistry by Rock River Laboratories, Inc. (Watertown, WI).
During the summer of 2015, organic dairy cows at the WCROC organic dairy that calved during fall and spring calving seasons (36 cows) were used to evaluate production, profitability, rumination, and fatty acid profile of organic dairy cattle supplemented with sprouted barley fodder. Lactating Holstein and crossbred organic dairy cows were assigned to one of two treatments and were blocked by lactation number, breed, and previous lactation milk production. Breed groups of cows included pure Holsteins and various crossbreds of Jersey, Normande, Holstein, Montbéliarde, and Scandinavian Red.
Cows were fed the following dietary supplementation levels, 1) no fodder supplementation, or 2) fodder supplementation at 20 lb/cow/day. Supplement was fed with a total mixed ration of an organic grain mix (corn and minerals). The fodder replaced 6 lbs of organic corn. The no Fodder cows were fed 8 lbs of organic grain in the supplement.
Heifer Methodology
During the summer of 2016, organic dairy heifers at the WCROC organic dairy that were born during the fall of 2015 (40 heifers) were used to evaluate growth and profitability of organic dairy heifers supplemented with sprouted barley fodder on pasture. Holstein and crossbred organic dairy heifers were assigned to one of two treatments and were blocked by breed and initial body weight at the beginning of the study. Breed groups of cows included pure Holsteins and various crossbreds of Jersey, Normande, Holstein, Montbéliarde, and Scandinavian Red. There were 4 replicated groups of heifers on pasture (2 fodder groups and 2 corn grain groups).
Heifers were fed the following dietary supplementation levels, 1) no fodder supplementation, or 2) fodder supplementation at 20 lb/heifer/day. Fodder was fed on pasture in feed bunk, and the corn-grain was fed on pasture. The fodder replaced 6 lbs of organic corn. All

heifers had access to free-choice minerals and water. Body weights and body condition score were measured every two weeks from June to
August as out on the pasture with a portable scale system. Production, Body, and Fatty Acid Measurements
Body weights and body condition score were measured every two weeks from June to August as cows exited the milking parlor during the morning milking. Milk production was collected daily from the Boumatic SmartDairy system at the WCROC dairy, and milk samples were collected every two weeks and analyzed for milk components with mid-infrared spectrophotometry.
Milk for fatty acid profiles was collected every 2 weeks, and samples were analyzed at Minnesota Valley Testing Laboratories in New Ulm, Minnesota. Fatty acids from the supplementation groups were determined according to the AOAC International method (AOAC International, 2002; method 996.06). Briefly, lipids were extracted from a 3-g sample, saponified, derivatized, and then run on a gas chromatograph to determine which FA were contained in the sample. Results were reported as a percentage of a specific FA in the total fat and the value of all FA added up to 100%. Profitability
Profit was estimated as a function of the revenue and expense for TMR cost for a pen of cows during the study. Profit per cow per day was the profit for a cow for the 80 days of the study. Milk price $32.16/cwt, which was the mean milk price during the summer of 2015 for the WCROC organic dairy from the CROPP Cooperative. The average organic TMR price for the no fodder mix was $5.71/cow/day and $5.84/cow/day for the Fodder mix. Fodder was valued at $0.06/lb. The average organic corn price included in the TMR price was $11.77/bushel, which was the average organic corn price from USDA during the study.
Sensitivity analyses were performed to evaluate the effects of changes in organic corn price on total feed cost and profit per cow per day for organic dairy cows. Alternative corn prices were used for sensitivity analysis. The organic corn cost was increased to 25% and 50% higher, which reflect potential market conditions for organic corn. Animal Behavior
We installed Heatime® HR Tags from SCR Dairy (SCR Engineers, Ltd., Netanya, Israel) around the neck of each cow in the study. This system allows us to track rumination (chewing) in addition to monitoring activity levels of cows. Due to manufacturer’s settings, the monitors collect data for 7 days before registering activity and rumination index data. The monitors hold 24-hours of data and correspond with a long distance (LD) antenna placed atop the milking center. The antenna had a range of several hundred meters depending on the weather and other environmental factors. Each time the cattle returned to the milking center, and if they were in paddocks nearby the milking center, the antenna would download data as often as every 20 minutes. Unique to the HR Tag, we are also able to monitor rumination through a microphone installed around the neck. This microphone is actually picking up jaw movements as bones rub together during rumination. Rumination is measured in minutes per day. Statistical analysis
For statistical analysis of forage quality and minerals of the five fodder grains, independent variables were fixed effects of grain and harvest date and replication were random effects. The MIXED procedure of SAS (SAS Institute, 2015) was used to obtain solutions and conduct the ANOVA. All treatment results are reported as least squares means and significance was declared at P < 0.05.
For statistical analysis of production, body weight, and body condition score, independent variables were fixed effects of week of study and fodder supplementation group. Replicate of study was a random effect with repeated measures.
For fatty acid analysis, the fixed effects were fodder group, with collection date as a random effect with repeated measures.
For economics, fixed effects were week of study, fodder supplementation group, with replicate as a random effect. The MIXED procedure of SAS (SAS Institute, 2015) was used to obtain solutions and conduct the ANOVA. All treatment results are reported as least squares means and significance was declared at P < 0.05.
Independent variables for statistical analysis of daily activity, daily rumination, activity at 2-hr intervals, and rumination at 2-hr intervals were effects of week of study, fodder supplementation group, and replicate were random effects with measurement date as repeated measures. For activity and rumination at 2-hr intervals, 2-hr time block and the interactions of 2-hr time block and fodder group were added to the model. The HPMIXED procedure of SAS (SAS Institute, 2015) was used to obtain solutions and conduct the ANOVA.
For the heifer analysis, the fixed effects were fodder group, with replicated group nested within fodder group as a random effect with repeated measures.
Results from evaluating alternative grains
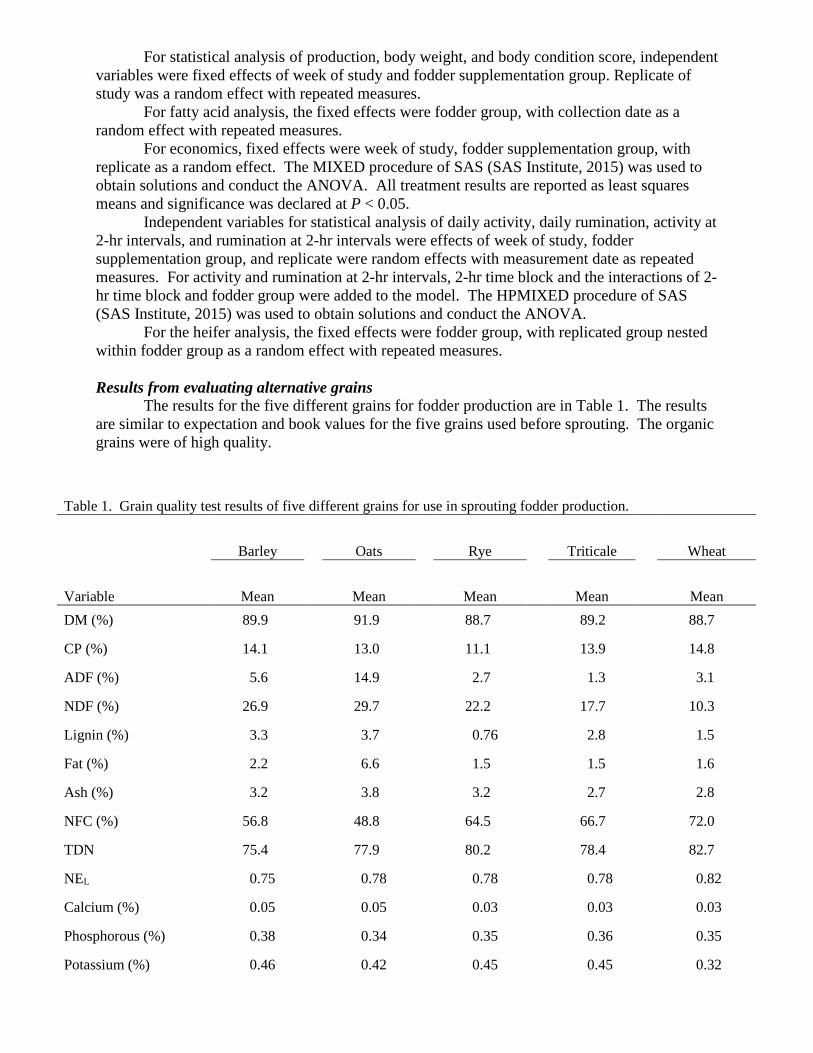
The results for the five different grains for fodder production are in Table 1. The results are similar to expectation and book values for the five grains used before sprouting. The organic grains were of high quality.
Table 1. Grain quality test results of five different grains for use in sprouting fodder production.
Barley Oats Rye Triticale Wheat
Variable
Mean Mean Mean Mean Mean DM (%) 89.9 91.9 88.7 89.2 88.7
CP (%) 14.1 13.0 11.1 13.9 14.8
ADF (%) 5.6 14.9 2.7 1.3 3.1
NDF (%) 26.9 29.7 22.2 17.7 10.3
Lignin (%) 3.3 3.7 0.76 2.8 1.5
Fat (%) 2.2 6.6 1.5 1.5 1.6
Ash (%) 3.2 3.8 3.2 2.7 2.8
NFC (%) 56.8 48.8 64.5 66.7 72.0
TDN 75.4 77.9 80.2 78.4 82.7
NEL 0.75 0.78 0.78 0.78 0.82
Calcium (%) 0.05 0.05 0.03 0.03 0.03
Phosphorous (%) 0.38 0.34 0.35 0.36 0.35
Potassium (%) 0.46 0.42 0.45 0.45 0.32


Table 2 has the weight, dry matter and mold score results for the five alternative grains. Barley and oats had the greatest weight of fodder per week, while triticale was the lowest. For mold score, almost all trays of Triticale had a high mold count. Barley and Oats had very little mold growth across the study. Barley had the lowest amount of dry matter.
Table 2. Sprouting fodder biomass produced and mold score for five alternative grains1.
Barley Oats Rye Triticale Wheat
Variable Mean S.E. Mean S.E. Mean S.E. Mean S.E. Mean S.E. Weight (kg) 9.3a 0.15 9.0a,b 0.15 7.8c 0.15 6.3d 0.15 8.8b 0.15
Mold Score2 0.04a 0.06 0.03a 0.06 2.8b 0.06 4.8c 0.06 1.1d 0.06
DM (%) 15.4a 0.47 19.1b 0.48 19.8b 0.49 24.2b 0.51 18.9c 0.47 Water (%) 84.6a 0.47 80.9b 0.48 80.2b 0.49 75.8b 0.51 81.1c 0.47 1 = One-hundred fifty-four fodder observations for each alternative grain. 2= Mold score 1= no mold, 5 = severe mold a-e Means within a row without common superscripts are different at P < 0.05.
The results for forage quality for the five different grains for fodder production are in
Table 3. Triticale and wheat had the greatest crude protein content of the alternative grains. Neutral detergent fiber was the greater for barley and oats, indicated that they have the highest digestible fiber. When the digestible fiber is greater in feeds, there are more benefits to cattle including higher milk production. The barley and oats had lower values of NFC (Non-fiber carbohydrates). The lower values of NFC indicate that there is less starch in the barley and oat fodder. Higher starch content was found in the rye and triticale.
Table 4 has the mineral sample test results for the five alternative grains. Barley fodder
had the highest calcium percentage of any of the fodder samples. The minerals results of the different grains are quite variable. The results show that barley has the highest forage quality for fodder production systems. However, oats may be another option for fodder production systems in the Upper Midwest.

Table 3. Forage quality results of five different grains for sprouting fodder production1. Barley Oats Rye Triticale Wheat Variable Mean S.E. Mean S.E. Mean S.E. Mean S.E. Mean S.E. CP (%) 15.6a 0.4 13.1b 0.4 12.8b 0.4 17.0c 0.4 17.9c 0.4 ADF(%) 17.4a 0.9 25.4b 0.9 8.4c 0.9 7.7c 0.9 12.5d 0.9 NDF (%) 34.4a 1.6 44.8b 1.6 23.6c 1.6 20.4d 1.6 26.7e 1.6
Lignin (%) 3.7a 0.3 5.2b 0.3 2.0c 0.3 2.1c 0.3 2.8a,c 0.3
Fat (%) 3.3a 0.2 6.5b 0.2 2.8a,c 0.2 2.6c 0.2 3.0a,c 0.2 Ash (%) 3.6a 0.1 3.7a 0.1 2.8b 0.2 3.1c 0.2 3.3c 0.2 NFC (%) 45.7a 1.9 33.4b 1.9 59.9c 1.4 58.9c 1.4 51.8d 1.4
Starch (%) 25.8a 1.9 20.2b 1.9 36.3c 1.9 39.3c 1.9 31.4d 1.9
TDN 73.4a 0.71 71.8a 0.71 79.1b 0.71 79.7b 0.71 77.0c 0.71 NEL 0.74a 0.01 0.73a 0.01 0.78b 0.01 0.70c 0.01 0.78b 0.01 NEG 0.56a 0.01 0.54a 0.01 0.65b 0.01 0.65b 0.01 0.62c 0.01 NEM 0.85a 0.01 0.82a 0.01 0.95b 0.01 0.96b 0.01 0.92c 0.01 Relative feed value
211.0a 17.7 146.2b 17.7 334.0c 17.7 386.4d 17.7 284.6e 17.7
Milk per Ton 73.4a 0.7 71.8a 0.7 79.1b 0.7 79.7b 0.7 77.0c 0.7 1 = Twenty-five fodder observations for each alternative grain. a-eMeans within a row without common superscripts are different at P < 0.05.
Table 4. Mineral results of five different grains for sprouting fodder production1. Barley Oats Rye Triticale Wheat Variable Mean S.E. Mean S.E. Mean S.E. Mean S.E. Mean S.E. Calcium (%) 0.16a 0.01 0.13b 0.01 0.12b 0.01 0.12b 0.01 0.12b 0.01 Phosphorous (%)
0.37a 0.01 0.28b 0.01 0.37a 0.01 0.40a,c 0.01 0.43c 0.01
Potassium (%)
0.30a 0.02 0.20b 0.02 0.35c 0.02 0.35c 0.02 0.30a 0.02
Magnesium (%)
0.15a 0.01 0.13b 0.01 0.15a 0.01 0.16a 0.01 0.18c 0.01
Manganese (ppm)
17.7a 2.9 38.5b 2.9 38.2b 2.9 37.1b 2.9 35.9b 2.1
Molybdenum (ppm)
1.1a 0.5 2.6a 0.5 1.2a 0.5 1.2a 0.5 0.8a .5
Aluminum (ppm)
62.4a 13.0 297.6b 13.0 5.1a 13.0 16.5a 13.0 31.6a 13.0
Zinc (ppm) 41.6a 3.6 36.0a 3.6 40.6a 3.6 37.4a 3.6 41.0a 3.6 Sodium (%) 0.03a 0.002 0.02b 0.002 0.02b 0.002 0.02b 0.002 0.02b 0.002 Copper (ppm) 4.6a 0.7 4.5a 0.7 2.8a 0.7 3.7a 0.7 3.3a 0.7 Iron (ppm) 112.74a 15.8 166.8b 15.8 75.6c 15.8 83.0c 15.8 82.5c 15.8 Sulfur (%) 0.20a 0.01 0.18a,b 0.01 0.17b 0.01 0.18a,b 0.01 0.20a 0.01 1 = Twenty-five fodder observations for each alternative grain. a-eMeans within a row without common superscripts are different at P < 0.05.

Results from feeding fodder to dairy cows
The distribution of cows by breed group and supplementation group is in Table 1. Breed groups of cows were Holsteins (n = 9) maintained at 1964 breed average level, Holstein-sired crossbreds (n = 6), Jersey-sired crossbreds (n = 10), and Viking Red-sired crossbreds (n = 11).
The no fodder cows and fodder cows were not different for milk or fat production (Table
6). However, the no fodder cows had significantly higher protein production than the fodder cows. Surprisingly, there were no differences in milk production between the two fodder groups of organic cows. No differences between cow groups were observed for body weight or body condition score, either.
As expected, the fodder cows had higher milk urea nitrogen (MUN) than the no fodder groups of cows. The concentration of MUN in milk provides an idea of how cows utilize crude protein from the feedstuffs they consume. Typical dairy cow MUN ranges from 10 to 12 mg/dl, but values are higher when excess rumen degradable and undegradable protein is fed. The interpretation of MUN values may be influenced by many different variables, i.e. season, breed, level of production, and feedstuffs.
Income per day (Table 7; income over feed cost, $/cow/day) was similar for no fodder and fodder cows ($3.18 versus $2.96, respectively). However, at the highest corn price, the fodder cows had an advantage in income per cow compared to the no fodder cows, and the differences were $0.44/cow/day.
The results for fatty acid profile analysis across the grazing season are in Table 8 and 9. The fodder cows had milk that tended to be lower for polyunsaturated fat and higher for Omega-3 fatty acid (Table 9) than milk from no fodder cows. No difference was found for fodder groups for Omega-6 fatty acid. Furthermore, omega-6/omega-3 ratio was lower for fodder cows compared to no fodder cows. These fatty acid profile results may indicate that milk from cows that consume fodder may provide human health benefits.
Table 5. Distribution of organic dairy cows by breed group and fodder group.
No Fodder Fodder Breed group (N) (N) 1964 Holstein 4 5
Holstein-sired crossbreds 3 3
Jersey-sired crossbreds 5 5
Viking Red-sired crossbreds 6 5
Total cows 18 18
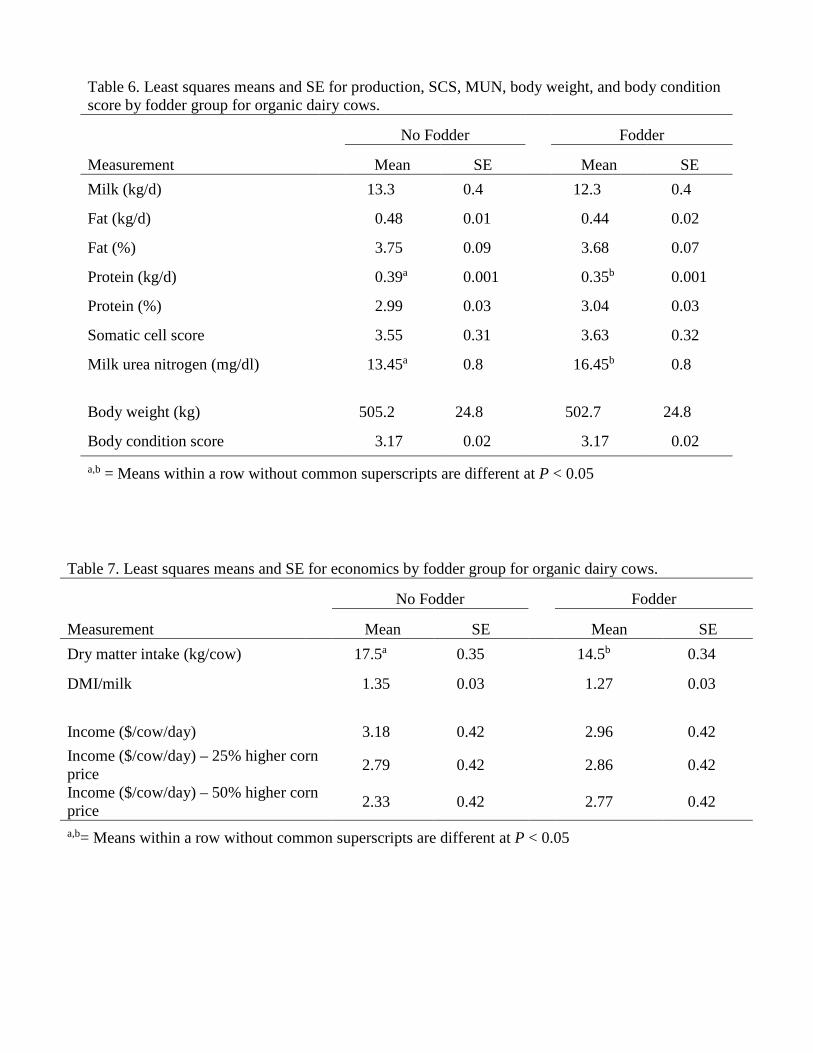
Table 6. Least squares means and SE for production, SCS, MUN, body weight, and body condition score by fodder group for organic dairy cows.
No Fodder Fodder
Measurement
Mean SE Mean SE Milk (kg/d) 13.3 0.4 12.3 0.4
Fat (kg/d) 0.48 0.01 0.44 0.02
Fat (%) 3.75 0.09 3.68 0.07
Protein (kg/d) 0.39a 0.001 0.35b 0.001
Protein (%) 2.99 0.03 3.04 0.03
Somatic cell score 3.55 0.31 3.63 0.32
Milk urea nitrogen (mg/dl) 13.45a 0.8 16.45b 0.8 Body weight (kg) 505.2 24.8 502.7 24.8
Body condition score 3.17 0.02 3.17 0.02 a,b = Means within a row without common superscripts are different at P < 0.05
Table 7. Least squares means and SE for economics by fodder group for organic dairy cows.
No Fodder Fodder
Measurement
Mean SE Mean SE Dry matter intake (kg/cow) 17.5a 0.35 14.5b 0.34
DMI/milk 1.35 0.03 1.27 0.03 Income ($/cow/day) 3.18 0.42 2.96 0.42 Income ($/cow/day) – 25% higher corn price 2.79 0.42 2.86 0.42
Income ($/cow/day) – 50% higher corn price 2.33 0.42 2.77 0.42
a,b= Means within a row without common superscripts are different at P < 0.05

Table 8. Least squares means and standard errors for specific fatty acids for fodder groups for organic dairy cows. No Fodder Fodder Fatty acid Mean SE Mean SE ---------------- (%) weight of total fat ------------------ 4:0, butryic 4.06 0.05 4.15 0.05 6:0, caproic 2.22 0.05 2.24 0.05 8:0, caprylic 1.25 0.05 1.24 0.05 10:0, capric 2.84 0.14 2.74 0.13 12:0, lauric 3.39 0.22 3.04† 0.21 13:0, tridecanoic 0.14 0.01 0.14 0.01 14:0, myristic 11.02 0.38 10.9 0.34 14:1, myristoleic 0.95 0.05 0.97 0.05 15:0, pentadecanoic 1.77 0.06 1.84 0.06 16:0, palmitic 31.96 1.04 31.99 0.95 16:1, palmitoleic 2.03 0.09 2.17† 0.09 16:1T, palmitelaidic 0.46 0.04 0.51 0.04 17:0, margaric 1.04 0.03 1.04 0.03 18:0, stearic 10.4 0.27 10.3 0.25 18:1, oleic 21.1 1.0 20.7 0.93 18:1T, elaidic 1.5 0.09 1.5 0.09 18:2, linoleic 1.93 0.12 1.88 0.11 18:2T, linoelaidic 0.72 0.07 0.67 0.07 18:3, linolenic 0.50 0.04 0.50 0.04 18:3, gamma linolenic 0.05 0.01 0.06 0.01 cis-9, trans-11 CLA 0.004 0.003 0.001 0.003 20:0, arachidic 0.23 0.01 0.23 0.01 21:0, heneicosanoic 0.01 0.01 0.01 0.01 † = Means within a row are different at P < 0.10

Table 9. Least squares means and standard errors for fatty acids and their ratios for fodder groups for organic dairy cows. No Fodder Fodder Fatty acid Mean SE Mean SE ------------ (%) in sample of fat ------------ cis-Monounsaturated Fat 0.81 0.05 0.72 0.04 cis-Polyunsaturated Fat 0.96 0.01 0.83† 0.01 Omega-3 fat 0.59 0.01 0.63 0.01 Omega-6 fat 0.08 0.003 0.07 0.003 Saturated fat 2.28 0.11 2.14 0.10 Total fat triglycerides 3.75 0.16 3.53 0.15 trans fat 0.09 0.01 0.08† 0.01 Saturated fat (%) 69.9 1.3 70.6 1.2 Mono-unsaturated fat (%) 24.37 1.1 24.1 1.0 Poly-unsaturated fat (%) 2.95 0.16 2.75 0.15 Trans-fat (%) 2.71 0.17 2.64 0.16 Omega-6/Omega-3 ratio 1.39 0.10 1.16† 0.10 Omega-3/Omega-6 ratio 0.37 0.01 0.36 0.01 ALA 0.50 0.04 0.49 0.04 Sum ALA + CLA 0.61 0.06 0.49 0.06 LA/ALA ratio 3.85 0.21 3.83 0.21 † = Means within a row are different at P < 0.10
Animal Behavior and Activity
Table 10 has means for daily activity and rumination for fodder groups of cows. The fodder cows had greater activity (599 vs. 499) and lower rumination (519 min/day vs. 550 min/day) compared to the no fodder cows. The fodder cows would possibly been expected to have greater rumination because of the higher fodder amount in the diet; however, quite possible mold in the fodder lead to decreased rumination.
All of the fodder groups ruminate during the night and remain active during the day (Figures 1 and 2). The reason for the varying daily activity and rumination levels among months could be due to feed availability, ambient temperature, weather events, insect pressure, or other factors.

Table 10. Least squares means and SE for daily activity and rumination by fodder group for organic dairy cows.
No Fodder Fodder
Measurement
Mean SE Mean SE Daily activity 499 38.7 599† 38.7
Daily rumination (min/d) 550 16.4 519† 16.4 † = Means within a row are different at P < 0.10

Results from feeding fodder to dairy cows The distribution of the 40 organic heifers by breed group and supplementation group is in Table 11. Breed groups of cows were Holsteins (n = 8) maintained at 1964 breed average level, pure Holsteins (n = 6), Montbéliarde-sired crossbreds (n = 2), Normande-sired crossbreds (n = 7), Jersey-sired crossbreds (n = 5), and Viking Red-sired crossbreds (n = 12).
Table 11. Distribution of organic dairy heifers by breed group and fodder group.
Grain Fodder Breed group (N) (N) 1964 Holstein 4 4
Pure Holstein 3 3
Montbéliarde-sired crossbreds 1 1
Normande-sired crossbreds 3 4
Jersey-sired crossbreds 2 3
Viking Red-sired crossbreds 7 5
Total cows 20 20
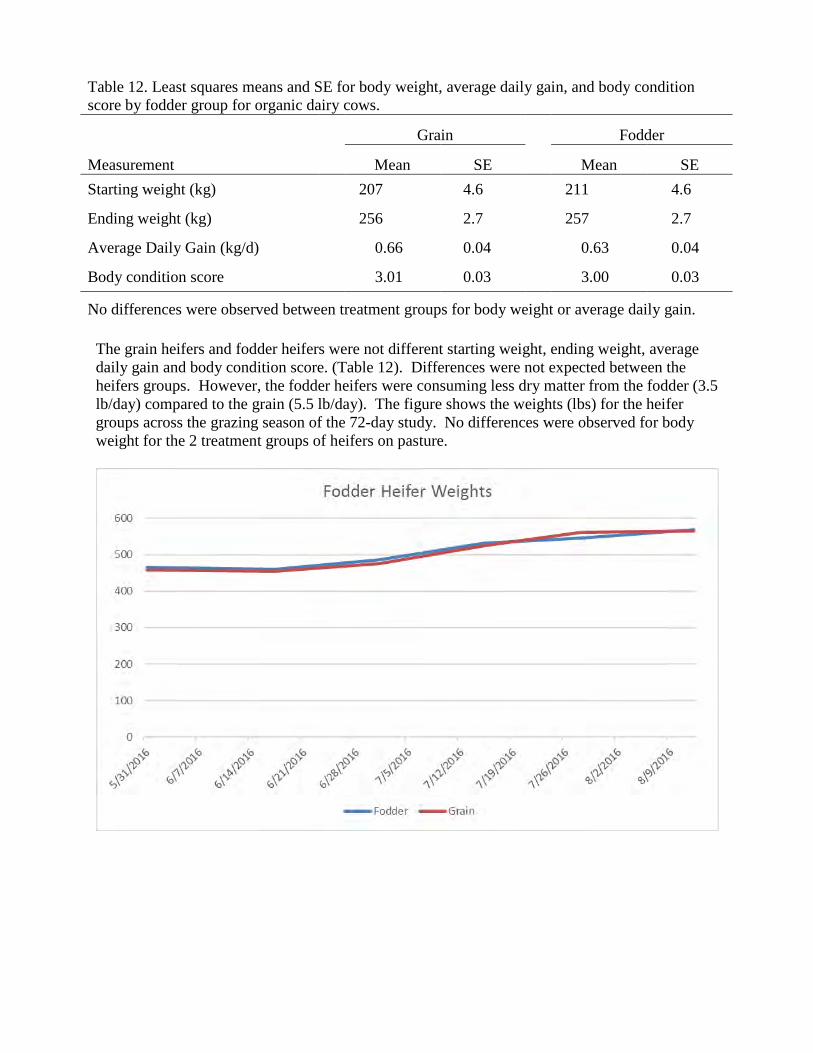
The grain heifers and fodder heifers were not different starting weight, ending weight, average daily gain and body condition score. (Table 12). Differences were not expected between the heifers groups. However, the fodder heifers were consuming less dry matter from the fodder (3.5 lb/day) compared to the grain (5.5 lb/day). The figure shows the weights (lbs) for the heifer groups across the grazing season of the 72-day study. No differences were observed for body weight for the 2 treatment groups of heifers on pasture.
Table 12. Least squares means and SE for body weight, average daily gain, and body condition score by fodder group for organic dairy cows.
Grain Fodder
Measurement
Mean SE Mean SE Starting weight (kg) 207 4.6 211 4.6
Ending weight (kg) 256 2.7 257 2.7
Average Daily Gain (kg/d) 0.66 0.04 0.63 0.04
Body condition score 3.01 0.03 3.00 0.03
No differences were observed between treatment groups for body weight or average daily gain.

The cost per heifer per day (Table 13; $/heifer/day) was greater for the fodder heifers compared to the heifers that were fed grain on pasture ($1.59 versus $1.50, respectively). However, at higher corn prices, the fodder heifers would be expected to have similar cost per day compared to the heifers fed grain. Conclusion The preliminary results show that barley has the highest forage quality for fodder production systems. However, oats may be another option for fodder production systems in the Upper Midwest. No differences were found for production of cows fed fodder versus no fodder. However, from an economic viewpoint, fodder may pay for itself at high organic grain prices. Outreach and Extension The West Central Research and Outreach Center hosted its annual Organic Dairy Day in Morris in 2014, 2015, and 2016. More than 80 people, mostly dairy producers, from three states attended the event. The field tour provided opportunities for producers to view several research projects at WCROC. One field tour stop included the visit to the fodder production system. This current project was also an important part of the organic dairy day at WCROC and received much interest from the participants. Publications Heins, B. 2014. Fodder Production Systems. Morris Sun Tribune. September 27, 2014 Heins, B. J., J. C. Paulson, and H. Chester-Jones. 2015. Evaluation of forage quality of five grains for use in sprouted fodder production systems for organic dairy cattle. J. Dairy Sci. 98 (Suppl. 2). Abstract. 64 Heins, Brad. 2015. Fodder production systems and their use in dairy production. 2015 Morris SunTribune Farm Progress Supplement, March 14, 2015, pp 2C Heins, B., and J. Paulson. 2015. Evaluation of Five Grains for Use in Fodder Systems for Organic Dairy Cattle. MOSES Organic Conference Poster, LaCrosse, WI, February, 26 – February 28, 2015.
Table 13. Least squares means and SE for economics by fodder group for organic dairy heifers on pasture.
Grain Fodder
Measurement
Mean SE Mean SE Total cost (for 10 head) $ 1,082.62a 2.1 1,142.33b 2.1
Cost per heifer ($) 108.26a 0.21 114.23b 0.21
Cost per heifer per day ($/d) 1.50a 0.002 1.59b 0.002
Cost per lb of Dry Matter ($) 0.028a 0.001 0.44b 0.001 a,b = Means within a row without common superscripts are different at P < 0.05

Heins, B. J., J. C. Paulson, and H. Chester-Jones. 2016. Evaluation of production, rumination, milk fatty acid profile, and profitability for organic dairy cattle fed sprouted barley fodder. J. Dairy Sci. 99 (Suppl. 1). Abstract. 662 Heins, B. 2016. Fodder Production Systems for Dairy Cattle. Dairy Star. November, 2016. Soder, K. and B. Heins. Evaluation of Sprouted Barley Fodder for Grazing Dairy Farms. Graze magazine. September, 2016. Soder, K., B. J. Heins, A. Hafla, M.D. Rubano. 2017. Evaluation of Fodder Production Systems for Grazing Dairy Farms. Journal of Dairy Science. In preparation.

Photos
Fodder production system at WCROC, Morris
Discussion of the fodder study with dairy producers at the Organic Dairy Day on August 12,
2014
Barley Fodder growing during the research trial. Fodder within the first day after seeding
Fodder production system at WCROC, Morris

Photos of cows and heifers on the fodder project