evaluation of filter criteria and thickness...
TRANSCRIPT

-FINAL REPORT-
EVALUATION OF FILTER CRITERIA ANDTHICKNESS FOR MITIGATING PIPING INSANDS
F. C. TOWNS ENDDAVID BLOOMQUISTJIH-MIN SHIAURAMON MARTINEZHEIDI RUBIN
FOR:
U.S. BUREAU OF RECLAMATIONENGINEERING & RESEARCH CENTER
U.F.# 491 0450421 51 2CONTRACT #7- PG-81-221 60
Department of Civil EngineeringCollege of EngineeringUNIVERSITY OF FLORIDAGainesville

ANALYTICAL AND EXPERIMENTAL EVALUATION OF PIPING AND FILTERDESIGN FOR SANDS
by
F. C. TownsendDavid BloomquistJih-Min ShiauRamon MartinezHeidi Rubin
Department of Civil EngineeringUniversity of FloridaGainesville, Florida 32611
for
U. S. Bureau of Reclamation
January 1988
Preface
This report was prepared by the Department of Civil
Engineering, University of Florida, Gainesville, Florida
32611 under U. S. Bureau of Reclamation (USER) contract 4-
CR-81-04100, "Experimental Evaluation of Piping Theory and
Filter Design for Sand and Dispersive Clays," Phase I and
USER contract 7-PG-81-22160, Phase II. The investigation was
supervised by Dr. DeWayne Campbell of the USER Engineering
and Research Center. This report describes work completed
during October 1984 to December 1985 (Phase I) and May 1987
to October 1987 (Phase II). The report was submitted in
January 1988.
This report is the Master of Engineering thesis of
Mr. Shiau (Phase I) and High Honors project of Miss Heidi
Rubin (Phase II). The work was performed under the
supervision and guidance of Professors F. C. Townsend and D.
Bloomquist. Messers J. Shiau, B. Doan, R. Martinez, M.
Oliver and Miss H. Rubin performed the experimental portion
of the research.
Dr. J. H. Schmertmann, Schmertmann & Crapps,
Gainesville, Florida, was instrumental in the design of the
flume and initial portions of the research on Reid Bedford
sand. Florida Power and Light contributed to design and
fabrication of the flume.

TABLE OF CONTENTS
PAGE
PREFACE i i
LIST OF TABLES v
LIST OF FIGURES vi
ABSTRACT viii
CHAPTER
I I INTRODUCTION 1
. 1.1 Definition of Piping 1I 1.2 Description of Problem 1
1.3 Scope of the Project 3
i II HISTORICAL REVIEW OF PIPING PROCESS AND FILTER DESIGN 5
L.2.1 Causes of Piping 52.2 An.Empirical Design for Prevention of Piping-
i Lane's Creep Ratio 52.3 Development of a Quantitative Piping Theory 72.4 Kenney and Lau's Research 13
j 2.5 Liu's Research 18L . 2.6 Filter Design Criteria 22
III LABORATORY EQUIPMENT, MATERIALS , AND PROCEDURES 27
3.1 General 273.2 Details of the Hydraulic Flume 273.3 Bladder Pressure Tank 333.4 Water Supply Reservoir 353.5 Sand Rainer 353.6 Materials and Density Determination 373.7 Sample Preparation 403.8 Test Procedures 44
Ii IV TEST RESULTS 47
4.1 General 47: 4.2 Piping Tests 47! 4.3 Filter Tests 62

CHAPTER PAGE
V DISCUSSION OF RESULTS 76
5.1 The Piping Process 765.2 Discussion of the Piping Tests 785.3 Comparison with Earlier Research 855.4 Discussion of the Filter Tests 89
VI FILTER DESIGN INVESTIGATION 92
6.1 Scope of Phase II 926.2 Materials 936.3 Equipment 936.4 Sample Preparation 966.5 Filter Design Calculations 966.6 Discussion of Test Results 966.7 Summary of Phase II Tests 104
VII CONCLUSIONS AND RECOMMENDATIONS 117
REFERENCES 119
APPENDIX 121

LIST OF TABLES
TABLE PAGE
2-1 CAUSES OF PIPING FAILURES ................................. 6
2-2 RECOMMENDED WEIGHTED CREEP RATIOS ......................... 9
2-3 NHSRI CLASSIFICATION OF COHESIONLESS SOILSFOR INTERNAL STABILITY .................................... 20
2-4 CRITICAL AND ALLOWANCE GRADIENTS IN COHESIONLESS SOILS ---- 21
2-5 FILTER DESIGN CRITERIA OF THE U.S. ARMY CORPS ENGINEERS. .. 21
2-6-A SHERARD AND DUNNIGAN FILTER DESIGN CRITERIA ............... 24
2-6-B SCS/USBR CRITERIA FOR PREVENTING SEGREGATION .............. 24
2-7 FILTER DESIGN CRITERIA FOR COHESIONLESS SOILSPROPOSED BY LIU ........................................... 25
2-8 CONTROL GRAIN DIAMETER, dk ................................ 25
4-1 COMPARISON BETWEEN FILTER MATERIALS ANDFILTER DESIGN CRITERIA .................................... 62
5-1 SUMMARY OF PIPING TEST RESULTS ........... ; ................ 79
5-2 CHARACTERISTIC GRAIN DIAMETERS OF EACH SOIL USEDIN PIPING TESTS ........................................... 80
5-3 CHARACTERISTIC GRAIN DIAMETERS OF FILTERS AND BASE SOIL. .. 91
5-4 SUMMARY OF THE FILTER TESTS ............................... 91
6-1 MATERIALS ................................................. 94
6-2 SUMMARY OF FILTER TEST RESULTS ........................... 101
6-3 SUMMARY OF TEST RESULTS .................................. 105

LIST OF FIGURES
FIGURE PAGE
2-1 Critical velocities required for initiationof erosion of sand particles 10
2-2 Percent penetration vs. average horizontalgradient 12
2-3 Method of describing the shape of a grading curve 14
2-4 Boundary Shape Curve 16
2-5 Method to evaluate the potential for gradinginstability 17
2-6 K value in Control Grain Diameter, d^, forcontinuous gradation 26
3-1 Hydraulic Flume 30
3-2 Hydraulic Flume Lid 31
3-3 Location of manometers and reinforcing bars 32
3-4 Bladder Pressure Tank 34
3-5 Water Supply Reservoir 36
3-6 Sand Rainer 38
3-7 Grain Size Distribution of the sands tested 39
3-8 Procedures for preparation of test sample 41
3-9 Test Data Sheet 46
4-1 Head distribution for test #5 52
4-2 Head distribution for test #6 54
4-3 Head distribution for test #7 58
4-4 Grain Size Distribution of the Filter materials 63
4-5 Arrangement of filters for test #16 65
4-6 Arrangement of filters for test #17 69
4-7 Arrangement of filters for test #18 72.
5-1 Development of piping action 77
5-2 Close Up View of Pipe at Downstream (Top) andUpstream (Bottom) Ends 82
5-3 Effects of Pipe Penetration and Diameter 84
5-4 Effects of Gradation on Piping Susceptibility 84
5-5 Potential of grading instability for the uniformsands tested 86
5-6 Potential of grading instability for the well-graded and gap-gracfed sands 88

FIGURE PAGE
6-1 Grain size distribution of the materials used 95
6-2 Sample Preparation 97
6-3 Example filter design calculations for USER criteria 98
6-4 Example filter design calculations for COE criteria 99
6-5 Photo of Test 1 illustrating filter failure by piping 107
6-6 Illustration of slight damage to a successfulfilter in Test 2 107
6-7 Test 3 photo illustrating a breach begun by pipingand resulting in a mass flow of upstream materialcarrying away the filter material 110
6-8 Test 4 photo illustrating a filter failing to functionas a filter allowing migration of the upstream materialinto the filter 110
6-9 Photo from Test 6 of a successful graded filter 115

ANALYTICAL AND EXPERIMENTAL EVALUATION OF A PIPING ANDFILTER DESIGN FOR SANDS
By
F. C. TownsendDavid BloomquistRamon MartinezJih-Min ShiauHeidi Rubin
Abstract
A laboratory testing program was undertaken in order to
understand better the phenomena of hydraulic piping in sand
and to evaluate current filter design criteria. To simulate
field conditions a hydraulic flume was used in which a
saturated sand layer could be placed and subjected to
variable pressure heads of water. With small initial pipes
formed in the sand, the critical heads required to initiate
piping were determined. Six sand gradations were tested,
three of the gradations are uniform but with different
effective grain diameters, one gradation was well graded and
lastly, two gradations were gap gradings which also have
different effective grain diameters. The most piping
susceptible uniform sand among those tested was subsequently
used as a base soil in filter design evaluation experiments.
Based upon the ratio of soil to filter grain diameters, several
different filter gradations and thicknesses were testeS to
evaluate filter design criteria.
Based on the results obtained, it was concluded that:
1. It is harder to initiate piping in a cohesionless
soil with a higher C value than in one with a
lower C value; i.e., uniform sands pipe more easily.
2. It is harder to initiate piping in a uniform
cohesionless soil with a larger grain size than
in one with a smaller grain size; i.e., fine sands pipe
more easily.
3. A filter design criterion for cohesionless soil is
established, Dicf/^gcvj 4* with a safety factor
of two. This criterion substantiates that proposed by
Sherard and Dunnigan, and the filter design criteria
of the U. S. Army Corps of Engineers (COE) , Di5f/dggb
< 5 (consider piping only). However, this criteria
only addresses filtering.
4. The criteria used by the USER, the SCS and the COE do
not address the problem of erosion of the filter by
piping. Filters which met the specified criteria
were breached by this type of erosion. Filters of
uniform gradation with a factor of safety of
approximately one, violating the filter design
criteria by a factor of two, performed successfully.
These filters have larger particles than those
filters with a factor of safety of two and require a
higher velocity to erode and move the filter
material.
5. Graded filters perform satisfactorily in resisting

erosion yet filtering the base soil.
6. The thickness of a filter is not a main factor for
success of the filter.
I

CHAPTER IINTRODUCTION
1.1 Definition of Piping
"Piping" is the phenomenon of internal soil erosion
within an embankment dam or its foundation. The pipe or
erosion channel appears to originate with cracks, joints,
animal tunnels, or other features which serve to concentrate
flow to that region. If the hydraulic gradients become
sufficiently large at the pipe tip, then piping or internal
erosion begins. The pipe will continue to migrate upstream
provided there exists sufficient flow to transport and deposit
the eroded material at the downstream point. The pipe may
become larger in diameter as it progresses upstream. The
average hydraulic gradient to the pipe usually increases due
to the upstream migration shortening the length of action.
Hence the action should accelerate due to this increased
gradient and the piping process will continues until it emerges
at the upstream face breaching the structure which may result in a
catastrophic condition to the surrounding environment.
1.2 Description of Problem
Based on a survey (United States Committee on Large Dams,
1975) of existing U.S. dams, over 42 percent of dam incidents
reported were related to leakage and piping. The problems at
Balderhead Dam (Vaughan, 1970), Baldwin Hills (Jansen,1967),

Florida Power&Light Martin Co. Dike (Schmertmann, 1980), and
Teton Dam (Seed, 1981), were all related to piping. Despite
the general advance of soil mechanics and embankment dam
engineering, the problem of piping (erosion) of fine sands
continues to plague the geotechnical engineering profession.
Current methods for analyzing piping are based upon
creep ratios and lines of creep (Lane, 1935). That is,
increasing the line of creep will result in an increased
factor of safety against piping. This method was developed
from case history reviews of small weir-dam failures in India
and is strictly an empirical tool. The use of empirical
methods often leads to designs with unknown factors of
safety. In part,as a result of this limitation, modern dam
designs rely heavily on the use of filters. But, current
filter design methods that are based upon the ratios of soil
to filter grain diameters are also semi-empirical methods.
Until the initial theoretical research performed by
Schmertmann (1980) , no quantitative design theory existed for
the prevention of piping. Furthermore, piping had not been
observed in the laboratory until the University of Florida
experiments in 1981 (Townsend et al., 1981).
Empirical methods and engineering judgement are currently
the only available techniques to evaluate factors of safety
against piping and to design filters. Only Schmertmann"s
method is available for quantifying piping safety and it
requires additional laboratory verification. In addition,
more investigation is needed for the effectiveness of soil
filters to prevent piping.
1.3 Scope of the Project
A specially designed hydraulic flume with a
transparent plastic top to permit visual observation of the
pipe was used to simulate field conditions for the
experimental part of the project. Chronologically, the
project consisted of two phases: Phase I evaluated sand
gradation characteristics conducive to piping and filter
design criteria; and Phase II evaluated filter thickness and
erodability.
In Phase I six sand gradations were tested to determine
the threshold piping gradients. Three of the gradations
were uniform, Reid Bedford sand, 20/30 sand,and 8/30 sand,
but with different effective grain diameters. One gradation
was well graded and two gradations were gap graded, both
having different effective grain diameters. A single
overburden pressure of 5 psi supplied by the bladder in the
base of the flume, and three initial pipe penetration
lengths, 15%, 30%, and 45%,were tested. Subsequently, the
most piping susceptible uniform sand, the Reid Bedford sand,
was subsequently used as a base soil in filter design
experiments. Based upon the ratios of soil to filter grain
diameters, three different filter gradations and thicknesses
were tested to evaluate filter design criteria.

In Phase II two base soils (Reid Bedford sand and 30/65
sand) with different effective grain diameters were used in
the filter design experiments. Filter thicknesses of 3-, 6-
or 12-inches were tested using various filter materials
including one graded filter.
CHAPTER 2
HISTORICAL REVIEW
OF PIPING PROCESS AND FILTER DESIGN
2.1 Causes of Piping
"Piping" is the phenomenon of internal soil erosion
within a water retaining structure or its foundation.
Decaying vegetation, burrowing animals, site stratigraphy,
previously mined areas, cracks and excavations may all form
initial pipe channels. The piping process originates largely
due to the presence of a high exit gradient. Once the pipe is
initiated, the pipe progresses upstream if there exists
enough flow to carry the eroded soil to an exit point. As a
result, the piping process continues in an upstream direction
and the average hydraulic gradient to the pipe may be
increased as the pipe grows. Some of the common causes of
piping failures are shown in Table 2-1.
2.2 An Empirical Design for Prevention of Piping-Lane's Creep Ratio
The line of creep theory was developed based on the
assumption that piping resistance is reduced along horizontal
contacts between a rigid structure and its foundation,
compared with vertical or inclined contacts. Lane(1935), in
his study of 280 dams, including 150 failures, established an
empirical weighted creep ratio as a design concept to avoid

piping.
In this method, the length of the creep is computed as
the sum of the vertical component V plus one third the
horizontal component H of the shortest seepage path beneath a
structure i.e.
TABLE 2-1
CAUSES OF PIPING FAILURES
a. Lack of filter protection
b. Poor compaction along conduits in foundation trenches,
etc.
c. Gopher holes, rotted roots, rotted wood, etc.
d. Filters or drains with pores so large soil can wash
through
e. Open seams or joints in rocks in dam foundations or
abutments
f. Open-work gravel and other coarse strata in
foundations or abutments
g. Cracks in rigid drains, reservoir linings, dam cores,
etc. caused by earth movements or other causes
h. Miscellaneous man-made or natural imperfections
Source: Cedergren, 1977

1/3 H + V
Rc= (Eq.
where H = horizontal contacts ( < 45 )
V = vertical contacts (> 45 )
h = head loss throughout the system
Lane recommended that Re should not be less than those
values shown in Table 2-2 to avoid piping. Incidentally,
Eq.l is merely a modification of the inverse of the average
hydraulic gradient. From Table 2-2, recommended minimum
values for Re range from 1.6 for very hard clay or hardpan,
to 8.5 for a very fine sand.
It should be mentioned that Harr (1962) has pointed out
theoretical errors and cautioned against blind application of
this piping criteria without cognizance of subsurface soil
conditions. Therefore, the importance of a theroetically
sound and quantitative piping theory is self evident.
2.3 Development of a Quantitative Piping Theory
Piping is the erosive action of seepage velocities.
Figure 2-1 shows the seepage velocities required for erosion
for various particle diameters as a function of pipe
diameter. These relationships are for horizontal stream beds

in the absence of seepage forces, and were derived by
equating the average wall shear stress, t0,to the Shields
equation for critical shear stress to cause erosion, T ,as
shown below.(Graf, 1971)
TC = 0.06( YS - YW )De and
2Yw R (Vm)
To
M2 (R)4/3
where YS/ YW = unit weight of solids and water, respectively
De = effective grain size d_5
R — hydraulic radius ( R = d/4 for circular pipe )
Vm = seepage velocity
= discharge velocity / porosity
M - ( 8.25 \fg~ )/ (De)1/S
d = diameter of pipe
From Figure 2-1, the velocity required to initiate
erosion far exceeds that which would occur in a pipe in a
soil, by a factor of 10 to 100. Schmertmann thus concluded
that upward seepage forces must be a significant variable in
reducing the erosion velocity required to initiate and
maintain the piping process. Using flow nets, he found the
vertical gradient at the pipe entrance by dividing the
change in total head between the last 2 equipotential drops
by the vertical distance over which the drops occurs.
Likewise, a similar procedure was used to determine the

TABLE 2-2
RECOMMENDED WEIGHTED CREEP RATIOS (Lane,1935)
Material Safe weighted creep-
head ratios, Re
Very fine sand 8.5
Fine sand 7.0
Medium sand 6.0
Course sand 5.0
Fine gravel 4.0
Medium gravel 3.5
Coarse gravel, including cobbles 3.0
Boulders with some cobbles and gravels- 2.5
Soft clay 3.0
Medium clay 2.0
Hard clay 1.8
Very hard caly or hardpan 1.6
Source: Lane, 1935

(—
H-00
toI .
(D O>1 1O H-W rtH- H-O O
OH, <
(1)CO M0) O3 OO. H-
rt
rtH-O
(DW
n>
i-hO1
H-rtH-(UrtH-O3
Ol-h
ACTUAL VELOCITY,Vm,REQUIRED TO CAUSE EROSION,cm/sec«-• •-• K) M
ui o cn o ui
ui
ot
Jw^w0
M<:wo
oM O
W
fD O
a
oo
T
COo

11
horizontal gradient at the head of the original pipe. The
concentration of these gradients was then expressed as a
product of the average hydraulic gradient that exists
parallel to the pipe.
To avoid the laborious process of constructing flow nets,
seepage computer programs, Logan (1980) and Wong (1981), were
developed to provide more accurate solutions than the
hand-sketching methods used by Schmertmann.
In order to better understand the phenomena of hydraulic
piping in sand, a unique experimentation flume testing
program was performed at UF in 1981 (Townsend et al.). Figure
2-2 presents the results of flume tests using two
semi-circular pipes of different relative.radii (B/r =10 and
B/r = 50, where B= 6"=l/2 width of flume i.e., actual radii
of 0.6" and 1/8") for various percent pipe penetrations. From
Figure 2-2, it can be seen that the smaller the pipes and the
greater pipe the penetration, the lower the average gradients
required to initiate piping. Both observations are in accord
with Schmertmann's concepts.
From this UF investigation, Schmertmann's theory was
basically subtantiated; and a laboratory flume and test
methodology developed. Further studies with a variety of
materials are needed to verify the theory since only one
sand, Reid Bedford sand, was used in this UF
investigation.

12
0.3
00.2
C0)•1-1rsIB
(04JCo
(UGlraS-l
O
0.0
B=distance from center of pipe to side of flume
r=pipe radius
= 10
B/r = 50
5.0 % is the present tiiinking among
practitioners for empirical limit for piping to occur
I I I I10.0 20.0 30.0 40.0
Percent Penetration, L/60
50.0
Figure 2-2. Percent penetration vs. average horizontal gradient
(parallel flow case)

13
2.4 Kenney and Lau's Research
In more recent research (Kenney and Lau, 1985), a method
was proposed for evaluating the potential for grading
instability based on the shape of a material's grain size
curve. The method is illustrated in Figure 2-3. In the
left-hand diagram, at any point on the gradation curve
corresponding to a value of "mass fraction smaller than",
denoted by F, and a particle diameter D, the mass fraction H
is measured between particle size D and 4D and plotted in the
right-hand diagram against F. This procedure is repeated for
different points on the grading curve until sufficient points
are obtained to establish an H:F shape curve. The point
representing the coarse end of the grading curve falls on the
line F + H = 1. Large values of H correspond to steep
grading curves, and vice versa. Constant values of H
correspond to straight line portions of grading curves and
increasing values of H indicate a steepening of the grading
curve.
The reason for choosing the size interval equal to 4
times is that the size of the predominant constrictions in a
void network of a granular soil is approximately equal to
one-quarter the size of the small particles making up the
soil (Kenney et al. 1985). This means that particles of size
D can pass through constrictions in a granular soil formed by
particles of size 4D and larger. The range of F= 0 to 0.3 for
materials having narrowly-graded "primary fabrics" and F= 0

G(0
0)rHHrdeinco•rH
+Ju
U)enme 0. 2
Grain size, D
(locj scale )
H, mass fraction
between D and 4D
0.6 0.4 o.2 01 .0
U4D D
Figure 2-3. Method of describing the shape of a grading curve

15
to 0.2 for materials with widely-graded "primary fabrics" are
the estimated maximum contents of loose particles which can
be removed within the pores of granular materials.
A boundary shape curve which separates stable and
unstable grading curves was proposed as shown in Figure 2-4.
Stable gradings are not deficient in any particle size, their
H values being larger than those of the boundary curve, and
therefore their shape curves are located above the boundary.
On the contrary, unstable gradings are deficient in certain
particle sizes and the corresponding parts of their shape
curves lie below the boundary.
An approximate method is shown in Figure 2-5
illustrating how the boundary relationship in Figure 2-4 can
be used to assess whether or not materials are potentially
unstable. The two grain size curves are the envelope of
gradings of filter materials used in a rockfill dam. The
method consists of drawing, at several values of'F along the
grading curve, the minimum required values of H for stable
gradings given by the boundary line in Figure 2-4. Both
materials in Figure 2-5 are widely-graded in the particle
range of the primary fabric and therefore H-values were
obtained within the range F=0 to 0.2. It can be seen that the
upper grading curve lies below these points and it can be
concluded that this material is potentially unstable. By
applying this method to the lower curve the same conclusion
would be reached.

16
T3
IB
Q
I4J
J8o
WW
= 0.2 Suggested boundary betweenstable and unstable gradings,applicable in the indicatedranges of F.
0.2 0.4 0.6
F, mass fraction smaller than
LEGEND
WG: soils widely graded in range F=0.2 to 1.0
NG: soils narrowly graded in range F=0.3 to 1.0
Figure 2-4. Boundary Shape Curve

1.0 I I I I I I I I I
Envelope of filter gradings
Values of H obtainedfrom boundary curve
0
200 100 60 20 10 6 2 i 0.6 0.2 0.1 0.06 0.02
Grain size D/ nun
Figure 2-5. Method to evaluate the potential for grading instability

18
2.5 Liu's Research
In a research project at the Hydrotechnical Science
Research Institute, China ( Liu, 1984 ), cohesionless soils
were classified into piping soil, transitive soil and
non-piping soil. Considering a soil under the influence of a
certain hydraulic gradient, if particles of the soil are
eroded and carried out through pores of the soil, then this
soil is a piping soil; if the soil is not carried out
particle by particle but is removed all together, i.e. sheet
flow, then this soil is a non-piping soil. A soil which has
both characteristics of piping and non-piping soils is
classified as a transitive soil.
To classify a soil's property of piping, several factors
are considered, such as the coefficient of uniformity, the
gradation curve, portions of fine material, and the average
diameter of pores in soil. Firstly, cohesionless soils are
distinguished by the coefficient of uniformity, Cu. A soil
with a Cu equal to or less than 5, classifies as a uniform
soil and is a non-piping soil. For soil with a Cu greater
than 5, i.e. a non-uniform soil, the gradation curve is used
to classify the soil into a discontinuous or continuous
gradation. For discontinuous gradation soils, a soil is
classified as a non-piping soil if the portion of fine
material, P, is greater than 35 percent. A soil is
classified as a piping soil if P is less than 25 percent and

19
as a transitive soil if P lies between 25 and 35 percent.
For continuous gradation soils, a soil is classified as a
non-piping soil if its average diameter of pores, Do, is less
than D-, where D. is the soil diameter at which 3 percent of
the soil weight is finer. A soil is classified as a piping
soil if Do is greater than Dg and as a transitive soil if Do
lies between D3 and DS. The classification of cohesionless
soils can be seen in Table 2-3.
In Liu's research, critical gradients for cohesionless
soils were also established, as shown in Table 2-4. For
non-piping soils, the allowance gradients are calculated
using a safety factor of 2. For piping soils, a safety
factor of 1.5 is used since the soil still has some potential
to sustain piping under the gradient of initiation piping.
However considering the factor of practical experience, 0.1
is thought as the minimum allowance gradient.
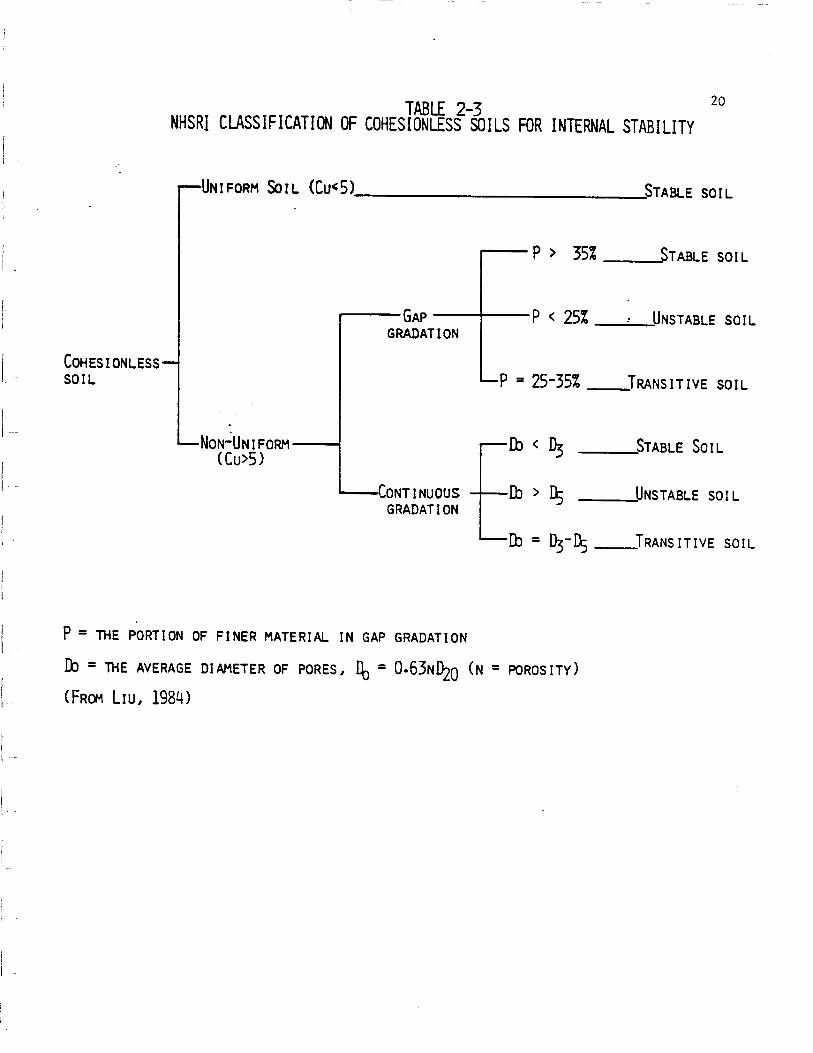
TABLE 2-3NHSRI CLASSIFICATION OF COHESIONLESS SOILS FOR INTERNAL STABILITY
20
i—UNIFORM SOIL (Cu<5)_
COHESIONLESS-SOIL
.STABLE SOIL
—NON-UNIFORM-(Cu>5)
•GAPGRADATION
P > 35% STABLE SOIL
•P < 25% -• UNSTABLE SOIL
L-P « 25-35% TRANSITIVE SOIL
DNTINUOUSGRADATION
- DO <
Db >
STABLE SOIL
UNSTABLE SOIL
'—Db = 03-1)5 TRANSITIVE SOIL
P - THE PORTION OF FINER MATERIAL IN GAP GRADATION
DD = THE AVERAGE DIAMETER OF PORES, Ejj = 0.63ND2Q (N • POROSITY)
(FROM Liu, 1984)

21
TABLE 2-4
CRITICAL AND ALLOWANCE GRADIENTS IN COHESIONLESS SOILS
Non-piping soil Transitive Piping soil
Gradient soil Continuous Discontinuous
Cu<5 Cu>5 gradation gradation
i 0.8-1.0 1.0-1.5 0.4-0.8 0.2-0.4 0.1-0.3cr
•Callow °-4~°-5 0.5-0.8 0.25-0.4 0.15-0.25 0.1-0.2
TABLE 2-5
FILTER DESIGN CRITERIA OF THE U.S. ARMY CORPS ENGINEER
D15f/d85b < 5 piping ratio
5 < D-icf/^-iEVj < 20 permeability ratio
D50f/d50b < 25 parallel gradation
22
2.6 Filter Design Criteria
From the recent research of Sherard and Dunnigan (1985),
some changes in the practice of earth dam engineering have been
proposed. The changes consist of less emphasis on the necessity
for keeping the dam core watertight by avoiding cracks and more
emphasis on the importance and details of downstream filter.
Sherard and Dunnigan state,
"In the past pactice the designer held as an axiom that:The impervious core is the most important element in the
dam. As long as the impervious core remains intact, with nocracks or other concentrated leaks, the dam will be safe.Therefore, the primary and most important objective of thedesign is to provide measures which will minimize thelikelihood of a concentrated leak to the greatest extentpossible.
Based on the current available experience the designer isnow inclined to see the situation differently:
We have been deluded in the past thinking that theimpervious sections of our dams remain intact. Evidence nowshows that concentrated leaks commonly develop in welldesigned and constructed dams. It is now clear that the mostimportant element in the dam is the filter (or transitionzone) downstream of the core. By providing a conservativedownstream filter, we can quit worrying about possibleconcentrated leaks through the core."
A number of the filter design criteria have been
proposed during the past century. The current criteria used
commonly in the United States is the U.S. Army Corps of
Engineers's, as shown in Table 2-5. After a 4-year research
program in the Soil Conservation Service, Sherard and
Dunnigan (1985) recommended the design criteria shown in
Table 2-6-A. This criteria was augmented by additional
criteria shown as footnotes and Table 2-6-B, and subsequently

23
adopted by the Soil Conversation Service (SCS) and U. S.
Bureau of Reclamation (USER).
Based on research at the Hydrotechnical Science
Research Institute, China, Liu (1984) also proposed filter
design criteria for cohesionless soils. His criteria are
based on the uniformity of protected soil, the piping
property of protected soil, and the ratio of D2Qf/dk' wnere
D20f s *"ne filter grain diameter at which 20 percent of
the filter weight is finer, and d. is the control grain
diameter of the protected soil. These criteria are shown
in Table 2-7, and the control grain diameter of the
protected soil, dk, can be found according to Table 2-8 and
Figure 2-6.

24
TABLE 2-6-AFILTER DESIGN CRITERIA PROPOSED BY SHERARD AND DUNNIGAN
ADOPTED BY SOIL CONSERVATION SERVICE (SCS) ANDU. S. BUREAU OF RECLAMATION (USER)
soil group % Fines description Filter criteria(<No.200 sieve) (safety factor
included)
85 to 100 % fine silts D1K../dQCu < 9and clays 15f 85b ~
40 to 85 % sands, silts, Disf — °-7mi11clays and silty& clayey sands
15 to 40 % silty and clayey D15f < [(40-A)/sands andgravels (40-15) ]* (4d85fc)-
0.7)+0.7mm
4 0 to 15 % sands and D, --/d-.. < 4gravels 13r asD
a) Determine the minimum Dlgf size for the filter,
D15_>4d15. , but no smaller than 0.1 mm.
b) Set maximum particle size at 3.0 inches and the maximumpassing the No. 200 sieve at 5%.
c) For coarse, gap-graded filters the limitations ofTable 2-6-B should be applied to minimize segregation.
* A = percent passing the No. 200 sieve
TABLE 2-6-BSCS/USBR CRITERIA FOR PREVENTING SEGREGATION
minimum DIQ(mm)
< 0.50.5 - 1.01.0 - 2.02.0 - 5.05.0 - 1010 - 50
maximum D.. n(mm)xu
202530405060

25
TABLE 2-7FILTER DESIGN CRITERIA
FOR COHESIONLESS SOILS PROPOSED BY LIU
Design criteria
< 5 D20/d70 * 7
non-piping soil D-./d, < 7Cu > 5 _ 20 K _
piping soil D2Q/d15 <. 5
d. = the control grain diameter of protected soil
TABLE 2-8CONTROL GRAIN DIAMETER ,
Control grain diameter, d.
non-piping soil piping soil
Cu<5 Cu>5
Continous gradation d_Q d. (Figure 2-5) d.,_Discontinous gradation d_Q p d^g
P = the portion of fines in discontinuous gradation

26
100
90
80
70
60
* 50
3 30
20
10
0
^ I I I I I I I I 1
I I I I I
5 10 20 50
Coefficient of uniformity, Cu
100
Figure 2-6. K value in Control Grain Diameter, dk, forcontinuous gradation

CHAPTER 3
LABORATORY EQUIPMENT, MATERIAL, AND PROCEDURES
3.1 General
The analytical and experimental evaluation of a piping
theory and filter design for sands is a unique study which
required special equipment and supplies. Most of the
laboratory equipment for this study was modified from the
equipment that was used in a piping study performed at
University of Florida in 1981.
A number of modifications were still made as the testing
progressed in order to improve the testing conditions and
data. For example, a vertical pulley system and a regulator
were used to adjust the upstream head, cookie sheets were
used to place the filter material, sugar was used to create
the original pipe at upstream side of filter. A brief
description of the equipment is as follows.
3.2 Details of the Hydraulic Flume
A drawing of the hydraulic flume which was used for all
the laboratory tests is shown in Figure 3-1. The flume is
constructed of aluminum with dimensions of 1 foot by 1 foot
by 7.5 feet. It consists of 3/8 inch thick aluminum bottom
27

28
and sides which were welded at the joints. Internal weirs
provide for a sample length of 5 feet with upstream and
downstream reservoirs. A plexiglass top acts as an
impermeable roof along which piping can be visually observed.
A rubber bladder at the bottom of the flume can provide an
upward pressure that keeps the sample in contact with the
plexiglass top. A constant head is applied at upstream
through an adjustable water reservoir. A series of
manometers located at 1/4 points were inserted in order to
measure the heads acting along the sample.
The flume contains three internal weirs, as shown in
Figure 3-1, which are porous and covered with filter fabric
material, that extended across the entire one foot width. The
test specimen, with a total length of five feet, lies between
the upstream and downstream weirs. The upstream weir extends
the full one foot depth of the flume in order to prevent any
sloughing of sand 'into the upstream reservoir. The downstream
weir was thought originally unnecessary since the test
specimen sloped downstream from this point. However, the
sample was pushed onto the downstream slope when the rubber
pressure bladder located at the bottom of the flume was
expanded. Therefore, the downstream weir was inserted in
order to prevent any sample disturbance due to the expansion
of the rubber bladder. The height of this weir is ten inches
which allows two inches of clearance for the creation of the
original horizontal pipe into the sample.
The slope weir was provided for the construction of a

29downstream slope with an angle of fifteen degree.
The rubber bladder, 1/4 inch thick, extends along the
bottom of the entire length of the sample. It is fixed by a
1/4 inch wide aluminum frame bolted to the bottom of the
flume. In order to provide a seal against leaks during vacuum
and saturation, rubber O-rings were attached to the bolts. A
1/4 inch quick connect was inserted at the bottom of the
flume to provide for expansion of the bladder by means of
water pressure. This upward exerted pressure maintains the
sample in contact with the plexiglass top of the flume and
prevents sheet flow of water between the plexiglass top and
sand. The plexiglass top acts as an impervious roof beneath
which the piping action takes place.
The Hydraulic Flume Lid was made of one inch thick
plexiglass. Figure 3-2 shows the lid.
In order to provide a seal between the flume and the lid,
a continuous rubber 0-ring was inserted in a 1/16 inch deep
groove which was cut into the top of the aluminum walls. One
inch square reinforcing bars are bolted to the flume to
provide a downward force sealing the plexiglass lid against
the 0-ring.
A series of manometers were inserted in order to measure
the heads acting along the sample. One of the manometers was
inserted at the upstream reservoir to determine the applied
head. The others were placed at 15, 30 and 45 inches from the
downstream end of the sample and 1.5 inches from the side of
the flume. The layout of the manometers is shown in Figure 3.3.

INDEX: A -
B -
C -
D -
E -
C=
1!
711 L
SLOPE WEIR
DOWNSTREAM WEIR
UPSTREAM WEIR
RUBBER PRESSURE BLADDER
1/4 INCH QUICK CONNECT
!
B Direction^Of Water ]|
D
14" „ 60" m
ELEVATION
!ciilow
1u
. 9" r
1 112"
=E 1
1/4 IN. BOLTS
c
l
•
r
D
• «
PLAN
Figure 3-1. Hydraulic Flume

1 INCH SQUAREREINFORCING BARS
1* . IP
ii I iI I
I1 ll ll I II"Fffl
V M-f
ELEVATION
, 1/4 INCH BOLTS
4
(N
r-H
IT)
1
f
*•
•
• •
•
• •
*
• •
•
•
»
•
•
•
•
• •
_L• •
• •
9 •
1-
1
Lrii— 1_
FLAN
Figure 3-2. Hydraulic Flume Lid

DOWNSTREAMWEIR _
BAR 1
BAR 2
BAR 3
BAR 4
BAR 5UPSTREAMWEIR
J-— 1 1/2-G-M1
12'
FLUME
-0— M2 30'
-Q-M3 — 45'
32
10'
22'
34'
46"
GLASSTOP
58'
60'
M - MANOMETERS
Figure 3-3. Location of manoneters and reinforcing bars

33Water enters the flume through a 1/4 inch tube with a
quick connect inserted at the upstream end of the flume. A 1
inch water hose has been used later instead of the 1/4 inch
tube since more quantity of flow is needed to maintain the
applied head for sands with higher permeability.
Drainage from the flume takes place through a 1/4 inch
opening at the downstream reservoir. But for sands with
higher permeability, additional drainage tubes are needed.
Note that the water level in the downstream reservoir is
higher than the sample so that the sample remains fully
saturated throughout the test.
3.3 Bladder Pressure Tank
The pressure to inflate the rubber pressure bladder
described in Section 2 is provided by a supply tank which is
shown in Figure 3-4.
The tank was filled with water. Air pressure was applied
through the top inlet onto the water, which forced the water
through the bottom outlet into a 1/4 inch tube which
connected to the rubber bladder at the bottom of the flume.
The bladder was expanded until the pressure was neutralized.
A air pressure of 5 psi was used for all the tests
performed.

34
4'
AIR PRESSURE GAUGE
12 INCHDIAMETER
AIR IN
1/2 INCH BALL VALVE
GLASS STANDPIPE
WATER OUT
i/2 INCH BALL VALVE
Figure 3-4. Bladder Pressure Tank

35
3.4 Water Supply Reservoir
The water supply reservoir shown in Figure 3-5 provides
the constant upstream head which initiates piping. Two
systems were used to adjust this upstream head. One, a
vertical pulley system which increases the elevation head, or
secondly, a water regulator which adjusts the pressure head.
Water enters the reservoir at the top through a 1 inch
water hose connected to a faucet. Water exits through the
bottom outlet and is controlled by a regulator in the hose to
the upstream water reservoir of the hydraulic flume. The
overflow outlet serves as a means of monitoring a constant
head of water.
A vertical pulley system was used to raise the reservoir,
and a regulator connected to upstream reservoir of the flume
was used to adjust the elevation head. The applied head was
determined from the upstream reservoir manometer readings.
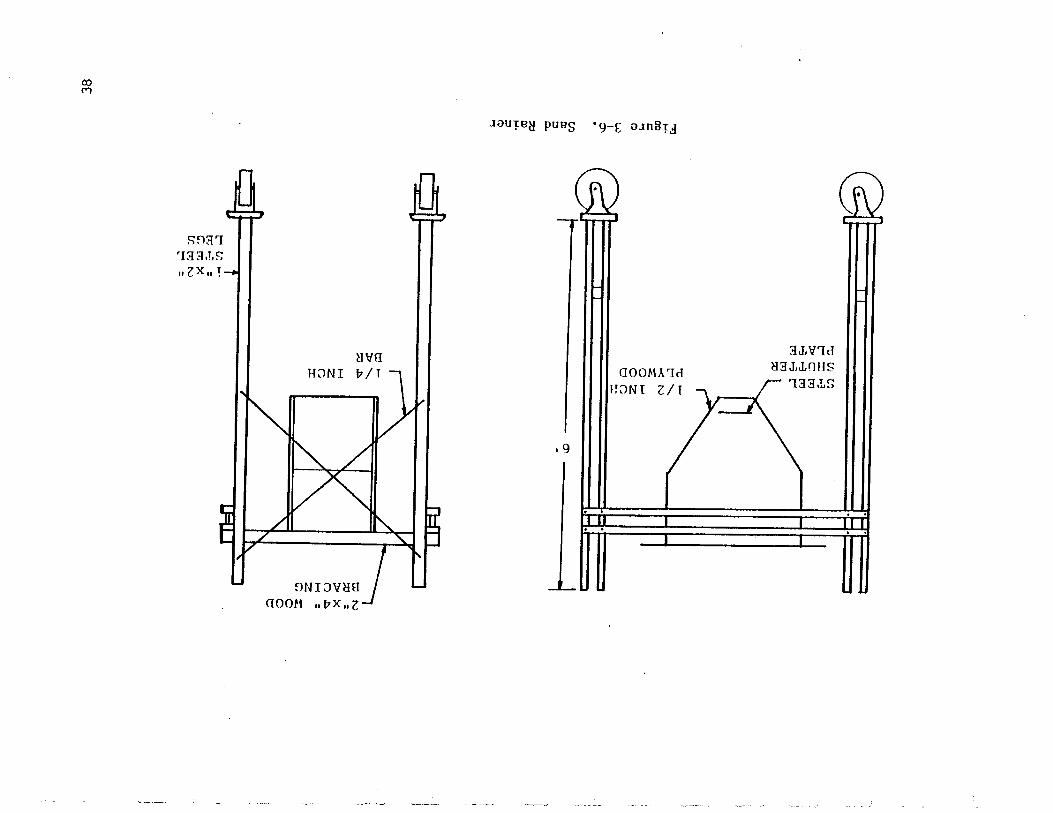
3.5 Sand Rainer\ sample of uniform density is prepared using a sand
raining device to deposit the sand into the hydraulic flume
from a fixed height.
The sand raining device, is shown in Figure 3-6. Tracks
were mounted on the floor to guide the rainer over the
hydraulic flume. The rainer was filled with sand while the

36
3/4 INCH—-^PIPE
OVERFLOW6 i/4'1
5/4 INCHPIPE
2i /4 INCHQUICK
CONNECT
Figure 3-5. Water Supply Reservoir

37shutter plate remained in a closed position. The sand was
allowed to fall freely into the flume by pulling out the
shutter plate. Subsequently the rainer was continuously moved
back and forth at a constant rate to assure a uniform
density.
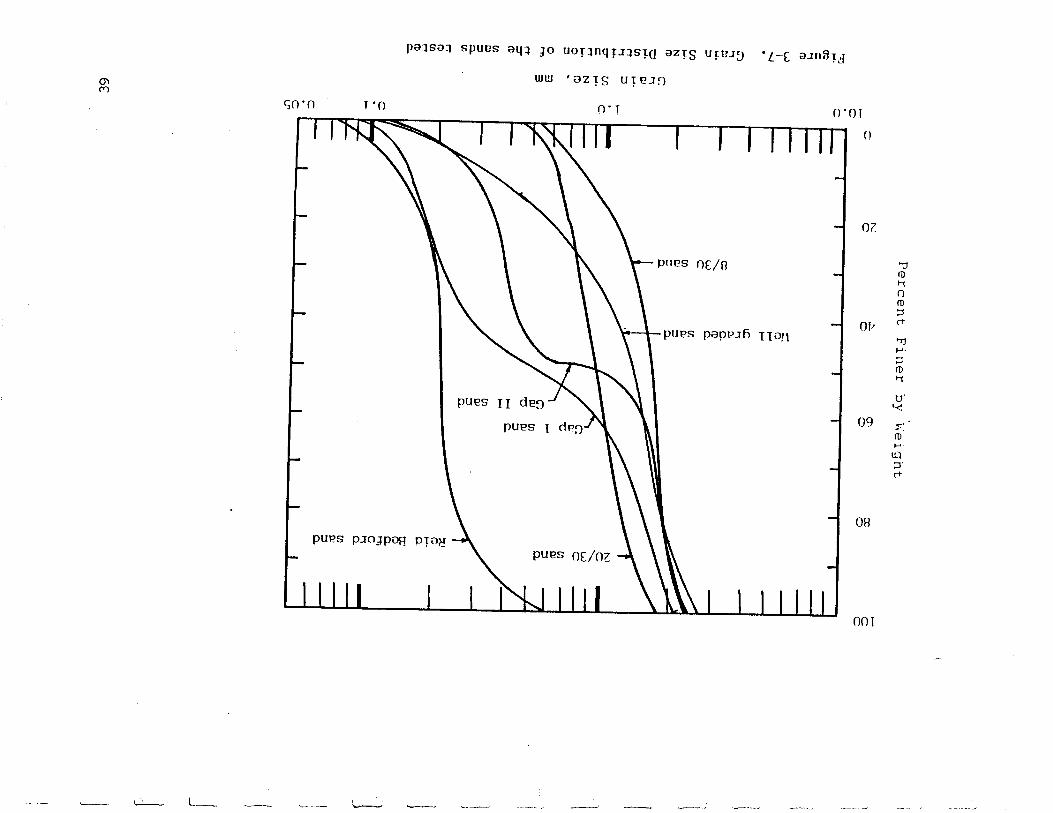
3.6 Materials and Density Determination
Six sand gradations were used in this project to evaluate
the piping theory and filter design as shown in Figure 3-7.
Three of the gradations are uniform; Reid Bedford sand, 20/30
sand, and 8/30 sand, but with different effective grain
diameters, DIO= 0.14mm, 0.63mm, and 0.8mm, respectively. One
gradation is well graded and lastly, two gradations are gap
gradings which also have different effective grain diameters.
The effective grain diameters, DIO, the mean grain diameter,
D5Q, and uniformity and curvature coefficients are summarized
below:
SAND D10(mm) D5Q(mm) Cu Cc
Reid Bedford
20/30
8/30
W.G
gap I
gap II
0.14
0.63
0.8
0.24
0.16
0.28
0 .20
0.93
1.6
1.42
0.50
0.60
1.5
1.6
2.1
6.7
5.6
6.1
1.23
0.97
1.48
2 .20
0.31
0 .26
LLL
STEELSHUTTERPLATE
1/2 INCHFLYWOOD
•2"x4" WOODBRACING
\4 INCHBAR
LEGS
Figure 3-6. Sand Rainer
oo
100
80
-p,c01
60
-PcQJUMOJ(X,
0
TT
Ifell graded sand
8/30 sand
mirxi i i mrrReid Bedford sand
Gap 1 sand
Gap II sand
JO.O i.O
Grain Size, mm
Figure 3-7. Grain Size Distribution of the sands tested
O.i O.ObCOID

40
The gradation used for filter design experiment was Reid
Bedford sand since this sand is the most piping susceptible
gradation among those tested.
The method used to determine the in-place density is
decribed as following. Three tare cans were placed into the
flume during the sand raining process. When the cans were
full, the surfaces of the cans were screeded and then
weighed. Since the weight and volume of the cans were known,
the density of the material could be calculated.
The same procedures were performed in the bottom and
upper layers of the sample. The density of the sample was
the average of the density of bottom and upper layers.
3.7 Sample Preparation
In order to prepare a specimen with uniform density and
to insure consistency between specimens, several steps must
be followed. Figure 3-8 shows schematically the procedures
for preparation of test sample.
With the pressure bladder deflated and the flume top
removed, the rainer is placed within its tracks to start the
filling procedure. Since the rainer's volume is smaller than
that of specimen, the rainer must be filled 2 to 3 times to
achieve a full flume. During this fil.ling procedure, the
density is determined by the method described in Section 6.
The sand is deposited only between the upstream weir and

41
RAIN SAND
SCREED SURFACE
CREATE INITIALPIPE
ATTACH FLUME LIDAND SEAL OPENINGS .
APPLY BLADDER PRESSURE
VACUUM FLUME
SATURATE
Figure 3-8. Procedures for preparation of test sample

42
slope weir, so that the upstream and downstream reservoir are
formed.
After the flume is filled, the surface is screeded with a
straightedge to obtain a smooth and uniform surface,
sometimes it is necessary to drop sand by hand from the same
height of the rainer to fill in irregularities left by
screeding.
The original pipe is constructed by placing a
semi-circular wooden dowel on the middle of the sand surface
at the downstream end. The circular portion of the dowel
rests in the sand and the flat surface will be in contact
with the flume top. The dowel is placed at a depth to insure
the flat portion is level with the sand surface. The dowel
was not withdrawn until saturation was complete.
For filter tests, the filling procedure is different.
With the pressure bladder deflated and the flume top removed,
the filter material is first placed in desired positions
between two vertical cookie sheets separated at the
prescribed filter thickness. The cookie sheets are suported
by numerous dowels. . To prevent mixing with sand, the filters
are covered by plastic during the raining procedure. Once
the flume is filled, the surface is screeded and the cookie
sheets are slowly pulled out to obtain a level surface.
The original pipe at the downstream end is formed by the
semi-circular wooden dowel. A dissolvable material, sugar,
was used to create the original pipe at the upstream side of
filter. The original pipe was formed when the sugar was

43
dissolved during the saturation processing.
After the original pipe is formed, the plexiglass lid is
then placed and bolted on the flume in order to have a fully
sealed condition. The bladder pressure is applied
temporarily by connecting with water supply reservoir which
is raised to 9 feet height. The applied pressure results in
expansion of the rubber bladder, which pushes upward on the
sample to contact it against the plexiglass lid.
In order to obtain a saturated sample, a vacuum procedure
was used before the saturation procedure. However, leak
problems happened in almost every test, hence it was decided
to perform the tests by using samples with identical
conditions except the vacuum procedure was ommitted. It was
found that the difference between results was insignificant;
therefore, the vacuum procedure was abandoned for the later
tests in this project.
With the glass lid bolted on the flume and the bladder
pressure applied by the Water Supply Reservoir, the
saturation procedure was started. A water tank supplied
water at room temperature into the downstream reservoir of
the flume. Initially, saturation was tried by supplying
water into the flume from the upstream reservoir, but the
downstream slope failed due to seepage forces. Obviously,
the time needed to saturate the sample depends upon the
permeability of the sand used, with 24 hours usually required
for this procedure.
It is not easy to obtain a fully saturated sample. Some
44
air bubbles are still visible in the sample after the
saturation procedure. However, the sample is ready for
testing.
3.8 Test Procedures
When the sample is ready for testing, the glass covering
over the downstream reservoir can be removed. The bladder
pressure is now applied by connecting with bladder pressure
tank in which air pressure, 5 psi, is applied. The bladder
pressure is applied throughout the whole test to insure the
contact between the sample and the glass lid.
The water supply reservoir is set initially at low
elevation and tap water is applied to the reservoir through a
hose. The overflow outlet on the reservoir provides for a
constant head. The dowel is then slowly withdrawn from the
sample. Some disturbance is unavoidable, but the diameter of
the created pipe is considered to be the diameter of the
dowel used to form it.
A head of water is applied to the sample by connecting a
3/4 inch hose between the water reservoir and the upstream
reservoir of the flume. A regulator, which is connected
between the hose and upstream reservoir, is used as a fine
adjustment of the head. The heads are read from the
manometers which are inserted along the sample. Time
increments of 5 to 10 minutes were used before the head was
increased when piping could not be initiated. The head was

45
gradually increased stepwise until piping began.
Subsequently the upstream and downstream heads and the
manometer's heads were recorded and monitored.
A study of the rate of piping was attempted but the
piping would stop in most tests. In these cases, the head
would be increased until piping was re-initiated, therefore,
the timing procedures were useless. Figure 3-9 presents a
typical data sheet used for recording the test data. The
test data sheets are presented in the Appendix. Details for
each of the tests are presented in the test results described
in Chapter 4.

46
HYDRAULIC PIPING TEST DATA SHEET
Test * :
Date:
Bladder Pressure:
Length of Pipe Penetration:
Percent Pipe Penetration:
Initial Pipe Diameter:
Tine at Start of Test:
Head at Upstream End:
Head at Downstream End:
Total Head:
Location of Pioe Tin:s Time Increment
Bar #1
Ear #2
Bar £3
Ear #4
Bar #5
Upstream Weir
Comments:
Figure 3-9. Test Data Sheet

CHAPTER 4
TEST RESULTS
4.1 General
A brief summary of each test is given below. Reasons and
details for modifications are explained and described.
Six sand gradations were tested to determine the
threshold piping gradients. Three of the gradations are
uniform; the Reid Bedford sand, the 20/30 sand, and the 8/30
sand. One gradation is well graded and the other two
gradations are gap gradings. A single overburden pressure of
5 psi, and three penetration lengths, 15%, 30%, and 45% were
tested. A single pipe diameter, 1/4 inch, was used. The grain
size distribution of the six gradations are shown in Chapter
3.
For the filter design test, the Reid Bedford sand was
used as the base soil. Three filter gradations and'three
filter widths were tested.
4.2 Piping Tests
Test #1.
Since this is the first test of this project, the Reid
Bedford sand was chosen in order to compare with the UF's
47

48piping investigation of 1981. The sample was prepared
according to the procedures outlined in Chapter 3. The sand
was rained in, and the density of the sand was determined
using the method described in section 3.6. 'After the surface
of the sand was screeded, a 12 inch long or 20 percent
penetration 1/2 inch diameter semicircular dowel was placed
into the sample. The plexiglass lid was placed and bolted on
the flume in order to have a fully sealed condition. The
vacuum procedure was performed in this test. Some leak
problems were encountered during this test. In addition, we
initially tried to supply water into the flume from the
upstream reservoir during the saturation procedure, but the
downstream slope slid due to seepage force. Therefore, water
was supplied into the flume from the downstream reservoir.
After saturation was completed, the dowel was slowly
removed and the upstream head was gradually raised. Piping
was intiated when the head reached a value of 8.0 inches. The
sand being piped was deposited into the initial 12 inch pipe,
with only a little bit of sand being carried to the
downstream slope. After few minutes, the piping stopped. It
was decided to raise the upstream head in order to maintain
progression of the piping and piping was re-initiated. When
the piping reached bar#3, it stopped again. The head was
raised, and the piping moved again. Whenever the piping
stopped, the upstream head was raised to maintain the piping.
The upstream heads and the downstream heads were recorded
during the entire test. Meandering of the piping occurred

49along the entire sample since the piping extended itself
along the path of least resistance.
The results of this test were consistent with those of
the UF's piping investigation in 1981.
Test #2.
Since the result from test #1 was consistent with the
results of UF's piping investigation in 1981, confidence in
our procedures was obtained. Therefore, the 20/30 sand
gradation was used for this test. The sample was prepared
according to the procedures outlined in Chapter 3.
A 1/4 inch diameter semicircular dowel was used to form a
9 inch long or 15 percent penetration trough. After
saturation was completed, the dowel was slowly removed and
the upstream head was applied. It was found that the head
loss between the water supply reservoir and the upstream
reservoir was very large, and therefore the upstream head was
not sufficient to initiate piping even though water supply
reservoir was raised to its maximum height (about 9 feet).
The problem was that the 1/4 inch tubing, which connects the
water supply reservoir with the upstream reservoir of the
flume, was too small to provide a large quantity of water.
This water supply problem did not manifest itself in test #1
because the permeability of the Reid Bedford sand is smaller
than that of the 20/30 sand. Accordingly a one inch diameter .
water hose was used to replace the 1/4 inch tube, which
worked satisfactorily.

50
The piping began at a head of 11.38 inches. Whenever the
piping stopped, the upstream head was raised to maintain
progression of the pipe. Meandering of the piping also
happened in this test. The hydraulic head to maintain the
piping process fluctuated in a small range during the entire
test; the average head being about 11.4 inches. The leak
problem also was encountered during the vacuum procedure in
this test, and some air bubbles could be seen in the surface
of the sample.
Test #3.
The soil used in this test was also the 20/30 sand.
Once again a 1/4 inch diameter pipe was originally
constructed for a length of 9 inches or 15 percent
penetration. The piping initiated at a head of 14.5 inches.
When the piping reached bar #3, #4, and #5, the heads were
12.75, 14.88, and 17.88 inches respectively.
Test #4.
The 20/30 sand was used in this test. A 1/4 inch diameter
semicircular dowel was used to form a 18 inch long or 30
percent penetration trough. After the sample was ready for
testing, the upstream head was gradually raised. The piping
was initiated at a head of 8.25 inches. Whenever the piping
procession stopped, the upstream head was raised a little to
maintain piping. When the piping reached bar #2, #3, #4, and
#5, the heads were 12.75, 11.75, 16.50, and 23.0 inches

51
respectively. It can be seen that the head required to
maintain the piping procession was higher at the latter part
of the sample. This head increase to maintain piping is
contrary to expectations as the gradient ( h/1) is increasing
due to .progression of the pipe (1 decreasing) and a head
increase is not anticipated.
Test #5.
The 20/30 sand was used in this test. A 1/4 inch diameter
semicircular dowel was used to form a 27 inch long or 45
percent penetration trough. After the sample was ready for
testing, the upstream head was gradually raised. The piping
initiated at the head of 9.25 inches. The heads along the
sample at the distance of 15 inches, 30 inches, and 45 inches
from the upstream end were also recorded as 5.63, 2.81, and
0.75 inches respectively. Figure 4-1 shows a plot of the
heads obtained. When the piping reached bar #3, #4, and #5,
the heads were 9.5, 10.13, and 9.94 inches respectively.
Test #6.
Since the leak problem was encountered in every test, the
effect of the vacuum process was in doubt. It was decided to
repeat this test at same condition with test #4 except that
the vacuum procedure was not performed in this test. That is,
the 20/30 sand was used and 1/4 inch diameter semicircular
dowel was used to form a 18 inch long or 30 percent
penetration trough. After this test started, the piping was

60.0 50.0 40.0 30.0 20.0 10.0
Distance From Downstream End, inches
0.0
Figure 4-1. Head distribution for test UlNJ

53initiated at a head of 9.25 inches. When the piping reached
bar #2, #3, #4, and #5, the heads were 10.38, 10.0, 12.13,
and 12.75 inches respectively. When the piping reached bar
#2, #3, #4, and #5, the heads along the sample at the
distance of 15, 30, and 45 inches from the upstream end were
also recorded. Figure 4-2 shows a plot of the heads obtained
when the piping reached bar #2.
Test #7.
After the 20/30 sand was tested at three penetration
lengths, 15%, 30%, and 45%, a well graded sand was used in
this test. The grain size distribution curve of the well
graded sand is shown in Chapter 3. The length of pipe
penetration was 18 inches or 30 percent penetration, and the
diameter of the pipe was 1/4 inch. It seemed that the effect
of the vacuum procedure was doubt since the results obtained
from test #4 and #6 were similar. Therefore, it was decided
that the vacuum process would not be used for this test.
After the sample was ready for test, the dowel was removed
slowly and the upstream head was gradually applied. It was
found that the piping was not easy to intiate. At a head of
32.5 inches, only a little fine sand was removed in the
original pipe, and then stopped a few minutes later. The
head was raised several times but the piping did not occur
except a little fine sand was removed occasionally in the
original pipe. After raising the head to 58 inches with no

0)0)I
•H
Q)
O1
-Ha,
a(Tl
o
c-r-i
+J
•ufOQ
10.0
8.0
6.0 -
4.0 -
2.0 -
0
60.0 50.0 40.0 30.0 20.0
Distance From Downstream End, inches
iO.O 0.0
uiFigure 4-2. Head distribution for test #6

55
effect, the test was terminated. Please remember that the
specimen length in the flume is 60 inches, hence a head of
58 inches is approaching the critical gradient.
Test #8.
Because no piping was initiated in test #7, the length
of original pipe was increased to 30 inches or 50 percent
penetration and the vacuum process was performed during
preparing the sample of the well graded sand. The results
obtained from this test were similar to those of test #7.
The head was raised several times but the piping was not
achieved. After raising the head to 52.5 inches with no
effect, the test was terminated as the critical gradient was
being approached.
Test #9.
Since the piping could not be initiated at 50 percent
penetration in Test #8, the test at 15 percent penetration in
the well graded sand was abandoned. A uniform sand, the 8/30
sand, was used for this test. The grain size distribution
curve of the 8/30 sand is shown in Chapter 3. A 1/4 inch
diameter semicircular dowel was used to form a 27 inch long
or 45 percent penetration condition. The vacuum process was
performed in this test.
After the test started, the piping was initiated at a
head of 11 inches. It was necessary to raise the head often
in order to maintain progression of the pipe. It was found

56
that a maximum head of only 16 inches could be achieved when
the water supply reservoir was raised to the top of the
pulley system (about 9 feet height). The reason being that
the permeability of the 8/30 sand is very large and
insufficient water was supplied to increase the head.
Therefore, it was decided to supply the upstream head
directly from a faucet. The upstream head was not easy to
maintain constant since the water was supplied directly from
the faucet. However, the head was raised by increasing the
flow from the faucet when the piping progressing stopped.
The heads were recorded when the piping reached bar #3, #4,
and #5 (19.0, 33.25 and 38.5 inches respectively).
Test #10.
The sand used for this test was the same as in test #9
-the 8/30 sand. The diameter and length of the initial pipe
were 1/4 inch and 18 inches (or 30 percent penetration)
respectively. The vacuum process had been performed before
the saturation procedure started. After the sample was
prepared for testing, the dowel was removed slowly, and the
head was then gradually applied. The water supply reservoir
was raised to a height of about 8 feet when the piping
started, and the head was recorded, 12.25 inches. In order
to maintain the piping progressing, the head was raised
several times. However, as in test #9, the water supply
system was changed from the water supply reservoir to a
faucet because the head supplied from the water supply

57reservoir, even when the reservoir was raised to the top of
the pulley system, was insufficient to maintain pipe
progression. After the head was supplied directly from the
faucet, the head was raised by increasing the flow from the
faucet to continue pipe progressing whenever the piping
stopped. When the piping reached bar #2, #3, #4, and #5, the
heads were recorded; 14.88, 15.0, 20.5, and 22.75 inches,
respectively. The heads along the sample at the distances of
15, 30, and 45 inches from the upstream end were also
recorded when the piping reached the bar #2, #4, and #5.
Figure 4-3 shows a plot of the heads obtained along the
sample when the piping reached bar #2.
Test #11.
The gapl sand was used for this test. This gap gradation
was formed by mixing 50 percent of the 8/30 sand and 50
percent of the EGS sand. The grain size distribution curve
of the gapl sand is shown in Chapter 3. The diameter of
intial pipe for this test was also 1/4 inch, and the length
of the initial pipe was 9 inches or 15 percent penetration.
The vacuum process was performed in this test. After the
sample was ready for testing, the dowel which formed the
initial pipe was removed slowly and the head gradually
increased. For this gap graded sand, only the fine sand moved
in the initial pipe after the head was gradually applied, but
no piping occurred. The head was raised several times, but
piping did not occur except that the fine sand in the initial

!(N=11=
in
rd0)
B1
ca
QJ
§
S1
•am0)
lb.0 —
12.0 —
8.0
4.0 —
60.0 50.0 40.0 30.0 20.0
Distance From Downstream End, inches
10.0 0.0
Figure 4-3. Head distribution for test #10 uioo

59
pipe moved occasionally. Although the head was continually
raised in an attempt to initiate piping, when the head was
raised to more than 6 feet, sheet flow happened; accordingly
the test was terminated.
Test #12.
The same sand as Test #11, the gapl sand, was used in
this test. The diameter of the initial pipe was 1/4 inch and
the length of it was 18 inches or 30 percent penetration.
After the sample was ready for testing, the dowel was removed
slowly, and the head was then applied gradually. Only the
very fine sand moved in the initial pipe. The head was
continually increased in order to initiate piping. However,
the piping did not occur except the fine sand in the initial
pipe moved occasionally, just like test #11. Again as
previously obtained in Test #11, the sheet flow happened when
the head was raised to more than 6 feet and the test was
terminated at this point.
Test #13.
Since the piping could not be initiated in the gapl sand
at 15 percent and 30 percent penetration, the 45 percent
penetration test was abandoned. The gapll sand was used for
this test. The grain'size distribution curve of the gapll
sand is shown in Chapter 3. The initial pipe for this test
was 1/4 inch diameter and 9 inches long or 15 percent
penetration. The vacuum process was not performed during

60
preparing the sample. After the test began, piping occurred
when the head was raised to 21.5 inches. Only the very fine
sand moved, and a self-healing phenomenon happened a few
minutes later. Eventually, the piping stopped. The head was
continually raised to maintain the pipe progressing. At a
head of 29.75 inches, very little piping occurred. But when
the head was raised to 32.75 inches, the piping moved
rapidly. The piping progressing stopped when it reached the
bar #2. The head was raised again to keep the pipe moving,
but it was difficult to maintain the pipe progressing. By
tapping the plexiglass top, the piping moved very slowly.
After the piping reached the bar #3, it was found that the
piping stopped even when tapping the plexiglass top and
raising the head. When the head was raised to about 62
inches, the test terminated.
Test #14.
The gapll sand was used in this test. A 1/4 inch diameter
dowel was used to form the initial pipe with a length of 18
inches or 30 percent penetration. The vacuum process was not
performed in this test. After the sample was ready for
testing, the dowel was removed slowly. When the head was
gradually applied, some air bubbles moved but no piping
happened. The head was raised to 15.5 inches, still nothing
happened. By increasing the size of the initial pipe,
piping occurred. But the sand appeared to be self-healing,
and the piping eventually stopped. The head was continually
61
raised in order to initiate piping. At a head of 57.5
inches, piping would occur by tapping the plexiglass top, but
self-healing would result downstream causing the pipe to
stop. The test was terminated at this time.
Test #15.
Since it was difficult to intiate piping in tests #13 and
#14, a larger diameter of semicircular dowel, 7/16 inch, was
used to form a 27 inches or 45 percent penetration pipe for
this test. The vacuum process was not performed during
preparing the sample. After the sample was ready for
testing, it was discovered that the dowel could not be
removed, hence, the bladder pressure was decreased in order
to remove the dowel. The bladder pressure was then increased
to 5 psi. After the head was gradually applied, only the
fine sand moved in the initial pipe when vibrations were
induced by tapping on the plexiglass top. But movement soon
stopped because of self-healing of the sand. The head was
continually raised, but because the initial pipe was soon
plugged, piping would then develop its own path branching
from the original pipe. But this piping also soon stopped
because of the self-healing of the sand. After the-piping
reached bar #3, it could not move upstream even though the
head was raised to 57.5 inches. This test terminated at this
time as the critical gradient was being approached.

62
4.3 Filter Tests
Test #16.
The filter evaluation tests were started with this
test. The base gradation used for these filter design
experiments was Reid Bedford Sand since this sand was the
most piping susceptible gradation used. The filter I
material used in this test was designed to meet both the
criteria of the U.S. Army Corps of Engineers and the ones
proposed by Sherard and Dunnigan. The grain size distribution
curve of the filter I is shown in Figure 4-4, and Table 4-1
shows the filter I meets both of these filter design
criteria.
TABLE 4-1
COMPARISON BETWEEN FILTER MATERIALS AND FILTER DESIGN CRITERIA
D15f/d85
D15f/d15
D50f/d50
FILTER
I
2.8
5.2
7.6
FILTER
II
8.0
14.7
16.8
FILTER
III
12.0
22.1
21.2
CRITERIA
OF C.O.E.
< 5
> 5, < 20
< 25
CRITERIA
OF SCS
< 4
-
-
For efficiency, two filter thickness were tested in each
filter test. The initial pipes at the upstream side of

64
filter were formed with sugar. The initial pipe at the
downstream end was constructed with a dowel to assure piping
would happen and to observe the effect of piping when it
reached the filter. The sand placement procedure was
different for the filter evaluation tests. The filter
material was first placed in their desired positions formed
vertically by cookie sheets which were suported by numerous
dowels. The positions and thickness of the filter in this
test can be seen in Figure 4-5. The sample was prepared
according to the procedures described in section 3.7. It was
difficult to construct the filters with uniform thicknesses
since it was inevitable to disturb the filters when the
cookie sheets were removed. The thickness of the filters
also can be seen in Figure 4-5. Because the existence of the
dowels which supported the cookie sheets, the density of the
base sand was determined only at the upper part of the sample
using the method described in section 3.6. The diameter of
the initial pipe was 1/4 inch, and the pipe penetration was
15 percent (4.5 inches long for the pipe at the downstream
end and 2.25 inches long for both of the pipes at the
upstream side of the filters). The vacuum process was not
performed in this test.
After the sample was prepared for testing, the initial
pipes at the upstream side of filters were created since the
sugar which used to form the pipe was dissolved during the
saturation procedure, and the dowel which was used to create
the downstream end initial pipe was removed slowly. With no
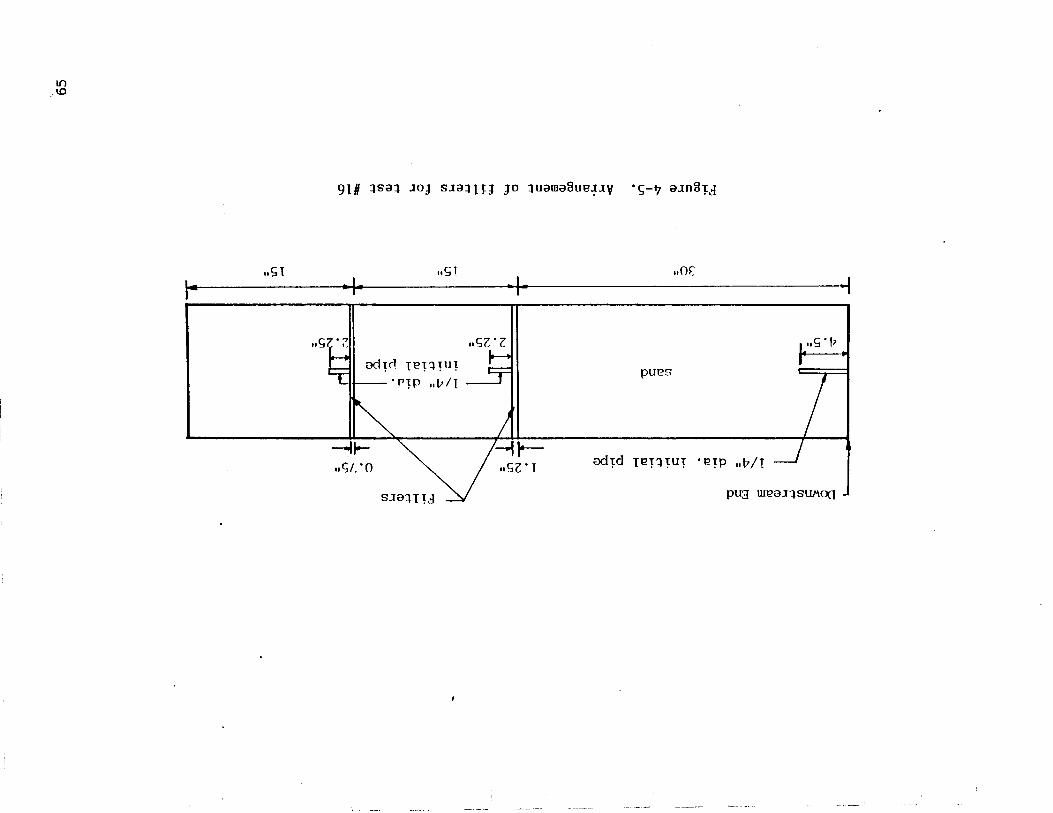
- Downstream End
1 — i/4" dia. initial pipe 1>2
/ — 4=zJ
4.5"n
A. filters
5" / X, 0.75"
* \- 1/4" did.
~ initial pipe• 12.25"
H2.25"
30" 15' 15'
Figure 4-5. Arrangement of filters for test #16
en

66
experience in creating the initial pipe at the upstream side
of filter, the initial pipe was formed with variable
diameter,and some air bubbles could be seen at the surface of
the sand. Nevertheless, the test was initiated, and piping
at the downstream end happened when the head was gradually
raised to 7.63 inches. The heads along the sample at the
distance of 15, 30, and 45 inches from the upstream end were
recorded as; 5.75, 4.0, and 2.0 inches respectively. Nothing
happened at the upstream side of the filters. When the
downstream end piping reached the first filter (at the
position of 30 inches from the upstream end), it stopped.
Subsequently, another pipe initiated from the downstream end,
and it also stopped when it reached the first filter. The
piping behind the first filter started at a head of 22.0
inches, the heads along the sample at the distance of 15, 30,
and 45 inches from the upstream end were 17.38, 11.75, and
6.5 inches, respectively. The piping behind the first filter
did not last long because the sand carried out by the piping
was held by the filter.
When the head was raised to 30 inches, sheet flow
happened from the downstream side of the first filter, and
the initial pipes at the upstream side of both filters were
filled with sand. After a while, entire sheet flow happened.
The sand at the downstream end moved very fast, but the sand
upstream of the filter moved slightly and was then held in
place by the filter. The sand at the downstream side of the
first filter was removed because of the sheet flow. After a

67
long time, the first filter lost the support at the
downstream side since the sand was moved out by the sheet
flow. By tapping the plexiglass top, the first filter was
breached after losing the downstream side support completely.
The piping moved through the first filter and reached the
second filter (at the position of 15 inches from the upstream
end). The piping stopped when it reached the second filter,
and then the sheet flow happened at the downstream side of
the second filter. The sand which supported the second
filter was then gradually removed by the sheet flow. After
the support lost completely, the second filter was then
broken and the piping moved through the sand untill it
reached the upstream end. It seemed that both the filters
worked very well. The failure was because the sand which
supported the filter was removed by the sheet flow-.
Test #17.
It was decided to repeat test #16 using the filter I
material, since the sample used in test #16 was not well
prepared. Two filter layers with different thickness were
placed in this test. The two filters, 1.25 inches thick,
and 1 inch thick were placed at the position of 15 inches and
30 inches from the upstream end respectively. The length of
the initial pipes were 15 inches (50 percent penetration) at
downstream end and 7.5 inches (50 percent penetration also)
at the upstream side of both the filters. The diameter of
all the initial pipes was 1/4 inch. The arrangement of the

68
filters and the initial pipe are shown in Figure 4-6. The 15
inch long initial pipe at downstream end was formed by using
a 1/4 inch diameter semicircular dowel, and both the 7.5 inch
long initial pipes at the upstream side of the filters were
created with sugar.
The sample was prepared according to the procedures
decribed in section 3.7. The vacuum process was not performed
during the sample preparation. The filter layers were more
uniform in thickness than that in test #16, and the pipes
created by sugar were also better (more symmetrical) than
those for test #16. After the sample was ready for testing,
the dowel at the downstream end was removed slowly, and the
head was gradually applied. When the head was gradually
raised to 8.38 inches, piping was initiated at the downstream
end. The heads along the sample at the distances of 15, 30,
and 45 inches from the upstream end were also recorded; 6.5,
4.38, and 2.25 inches, respectively. There was no piping at
the upstream side of the filters. The head was raised
occasionally to maintain the downstream end pipe progressing.
When the piping reached bar #2, the head was 12.63 inches.
The heads along the sample were also recorded, 9.63, 6.25,
and 3.25 inches at the distances of 15, 30, and 45 inches
from the upstream end, respectively. Nothing happened at the
upstream side of the filters.
When the piping reached the thin filter (at the position
of 30 inches from the upstream end), it stopped. The head was
continually raised. A second pipe developed at the

-FiltersDown stream End / N.
— 1/4" dia. initial pipe i •°" / X. ±^— <v*~/ \*
J tidllQ
15" '
' \ .7.5"
1 S"
5"
i/4" dia.| initial pipe
7.5"
i K"
Figure 4-6. Arrangement of filters for test #17
CTtID

70
downstream end, and it also stopped when it reached the thin
filter. Still no piping occurred at the upstream side of the
filters. The head at this time was 22.88 inches, and the
heads along the sample at the distance of 15, 30, and 45
inches from the upstream end were 17.88, 12.25, and 7.75
inches respectively. After a while, the pipe upstream of the
thin filter started to move, and a new pipe was forming and
moving toward the thin filter at the downstream end. The
piping behind the thin filter soon stopped, and the thin
filter held the sand carried to it by the piping. The sand at
the opposite dowmstream end of the filter moved very fast,
but the sand upstream of the thin filter was held by the
filter. The thin filter was losing support at the downstream
side since the sand was eroded very quickly.
The head was continually raised. The sand at the surface
of the downstream end continued to erode very fast, and the
thin filter was deteriorating and deforming but the sand
behind the thin filter still was held in place. The head was
32.5 inches, and the heads along the sample at the distances
of 15, 30, and 45 inches from-the upstream end were 21.0,
5.25, and 4.25 inches, respectively. Vibrations induced by
tapping on the plexiglass top, caused the thin filter to
fail. The piping moved rapidly upstream to the thick filter
(at the position of 15 inches from the upstream end), and
then stopped. The situation was repeating as before. The
sand which supported the thick filter at the downstream side
was eroded. But the sand at the upstream side was held by the
: 70
downstream end, and it also stopped when it reached the thin
filter. Still no piping occurred at the upstream side of the
filters. The head at this time was 22.88 inches, and the
heads along the sample at the distance of 15, 30, and 45
inches from the upstream end were 17.88, 12.25, and 7.75
inches respectively. After a while, the pipe upstream of the
thin filter started to move, and a new pipe was forming and
moving toward the thin filter at the downstream end. The
piping behind the thin filter soon stopped, and the thin
filter held the sand carried to it by the piping. The sand at
the opposite dowmstream end of the filter moved very fast,
but the sand upstream of the thin filter was held by the
filter. The thin filter was loosing support at the
downstream side since the sand was eroded very quickly.
The head was continually raised. The sand at the surface
of the downstream end continued to erode very fast, and the
thin filter was deteriorating and deforming but the sand
behind the thin filter still was held in place. The head was
32.5 inches,'and the heads along the sample at the distances
of 15, 30, and 45 inches from the upstream end were 21.0,
5.25, and 4.25 inches, respectively. Vibrations induced by
tapping on the plexiglass top, caused the thin filter to
fail. The piping moved rapidly upstream to the thick filter
(at the position of 15 inches from the upstream end), and
then stopped. The situation was repeating as before. The
sand which supported the thick filter at the downstream side
was eroded. But the sand at the upstream side was held by the

71
thick filter. The test stopped before the thick filter
completely lost its support and failed because the bladder,
which pushed the sample up to contact with the plexiglass
top, burst. The bursting might have been caused by the
bladder rubber expanding too much at the downstream side of
the sample since the sand at that position.
Test #18.
Based upon tests #16 and #17, it was concluded that
filter I worked very well. It was decided to conduct a test
using a filter which did not meet the current filter design
criteria. Filter II was used in this test. The grain size
distribution curve of the filter II is shown in Figure 4-4,
and Table 4-1 shows the comparison between the filter II and
the filter design criteria.
The sample was prepared according to the procedures
described in section 3.7. Two filter layers with different
thicknesses, 1 inch and 3/4 inch, were placed at the position
of 15 inches and 30 inches from the upstream end
respectively. The length of the initial pipe was 15 inches
(50 percent penetration) at downstream end and 7.5 inches (50
percent penetration also) at the upstream side of the both
filters. The diameter of all the initial pipes was 1/4 inch.
The arrangement of the filters and the initial pipes are
shown in Figure 4-7. The method used to create the initial
pipes was the same as that used in test #17. With the
experience of constructing the filter layers and the initial

Filters— Itowristream End • / N.
1 1/4" dia. initial pipe 0.75"/ \ 1.
— .•-.- . GAnrl
J15" ''
V ^1 I
4. . .. M
7.5" '
0"1-
1/4" diainitial pipe
4 H7.5" '
30 15' 15'
Figure 4-7. Arrangement of filters for test
K)

74
The head was continually raised trying to make the filter
fail, however even with excessive tapping on the plexiglass
top, the filter did not fail. When the head was raised to
45.38 inches with no effect, the test was terminated. At
this time, the heads along the sample at the distances of 15,
30, and 45 inches from the upstream end were 24.38, 1.38, and
0.88 inches, respectively.i
Test #19.
The filter II worked very well in test #18 even though it
did not meet the filter design criteria. Therefore, a
coarser material, filter III, was used as filter in this
test. The grain size distribution curve of the filter III is
shown in Figure 4-4, and Table 4-1 shows the comparison
between the filter III and the filter design criteria.
The sample was prepared according to the procedures
decribed in section 3.7. The arrangement of the filters and
initial pipes was the same as that in test #18 (see Figure
4-7). The vacuum process was also not performed in this
test. After the sample was ready for testing, the dowel
which formed the initial pipe at the downstream end was
removed slowly, and the head was gradually applied. Piping
was initiated at the downstream end when the head was raised
to 11.0 inches. The heads along the sample at the distances
of 15, 30, and 45 inches from the upstream end were 8.5,
6.13, and 3.0 inches respectively. No piping occurred behind
the filters. When the piping reached bar -#2, the head was

75
11.63 inches, and the heads along the sample from the
upstream end were 9.0, 6.25, and 3.0 inches. Still no piping
happened upstream of the filters.
When the piping reached the first filter (at the position
of 30 inches from the upstream end), the head was 13.25
inches. Piping behind the first filter began, the sand was
carried through the first filter. It was obvious that the
first filter failed to hold the sand. The head was 13.25
inches, and the heads along the sample from the upstream end
were 10.75, 6.63, and 3.63 inches.
The piping moved througth the first filter and continued
to move to the second filter. The head was 12.63 inches when
the piping reached the second filter (at the position of 15
inches from the upstream end). Piping happened upstream of
the filter after the piping reached the second filter. The
second filter also failed to hold the sand which was carried
out by the piping. This test was stopped when sheet flow
happened at the downstream end.

CHAPTER 5
DISCUSSION OF RESULTS
5.1 The Piping Process
From the laboratory testing results, a better
understanding of piping action was established. Piping
begins to form with the displacement of several sand
particles at the tip of the initial pipe. The particles slide
into the newly created channel, and when finally washed away,
several more new particles become displaced as a
retrogressive slide. A continuous landslide and erosion
process exists which propagates the pipe. Figure 5-1 shows a
diagram of the piping action. However for sand with large
grain sizes or large coefficients of uniformity, Cu,
insufficient water velocities exist to erode the soil
particles after they slide into the initial pipe and
deposition may occur downstream in the pipe. Because of this
deposition, the piping may be retarded or even ceased by
self-healing. These situations occurred in many tests of
this project.
As a pipe develops, it extends itself along the path of
least resistance. Meandering of the pipe takes place, which
leads to scouring of material at some points and deposition
at others (see Figure 5.2). As the piping progresses upstream,
most of the head loss occurs at the upstream portion from the
76

•Roof
SandPioe
Section of material as pipe developes
• Roof
Sand Pipe
Note material after sliding intothe pipe and carried downstream.
77
Figure 5-1. Development of piping action

78
pipe tip because the head needed to initiate the piping is more
than the head needed to carry away the sand particles which slide
into the pipe. But when self-healing occurs, the head loss
is almost constant along the sample.
The rubber bladder, which pushes the soil sample into
contact with the plexiglass top, is fixed by a frame bolted
to the bottom of the flume. When the bladder pressure is
applied, the rubber bladder expands non-uniformly. The
amount of expansion at the center of the flume is larger than
that at the edge of the flume. Therefore, the upward pressure
against the soil is not uniform. For this reason a second
piping often develops at side of the flume or the head must
be increased as the pipe approaches the middle of the flume
where the upward pressure is greatest.
5.2 Discussion of the Piping Tests
Once the critical heads necessary to initiate piping are
obtained, the average horizontal hydraulic gradient is easily
found by dividing the critical head by the length of the
sample. Table 5-1 presents the piping test results with the
critical heads (if any) obtained and the gradients
calculated. Some characteristic grain diameters and
coefficients of uniformity and curvature of each soil used in
the piping tests are shown in Table 5-2.
Three uniform sands were tested; (1) Reid Bedford sand,
(2) 20/30 sand, and (3) 8/30 sand. The Reid Bedford sand was

TABLE 5-1
SUMMARY OF PIPING TEST RESULTS
Test No.(1)
123456789101112131415161718192021222324
(a) R.B.(b) N/P
Sand (a)(2)
R.B.20/3020/3020/3020/3020/30WGWG8/308/30Gap IGap IGap IIGap IIGap IIR.B.R.B.R.B.R.B.R.B.R.B.R.B.R.B.R.B.
= Reid Bedford= No Piping, o
Pipe Diam Penetration(cm) %(3) (4)
1.270.6350.6350.6350.6350.6350.6350.6350.6350.6350.6350.6350.6350.6350.6350.6350.6350.6350.6353.053.053.053.050.635
, WG = wel 1 gradedS/H = Self Healing
201515304530305045301530153045101014202050202050
Ave. Graident '**>
(5)
0.1330.190.2420.1380.1540.154N/PN/P
.183
.204S/HS/H.358 (S/H).958 (S/H).958 (S/H)
0.1300.1310.1330.1110.1500.0980.1460.1420.081
Final Gradient
(6)
0.135_
0.2980.3830.1660.212_
-.642.379__
1.030.9570.9580.2000.1560.1380.1770.1120.1000.1580.1420.127
Density (a)(pcf)
92.6^
100.5101.8102.6_
110.9112.3106.1106.1110.-1110.4112.0113.0114.0106.0104.8_
106.2_
107.4108.1_
107.5
-jj(c) 1 pcf = .16kN/nT
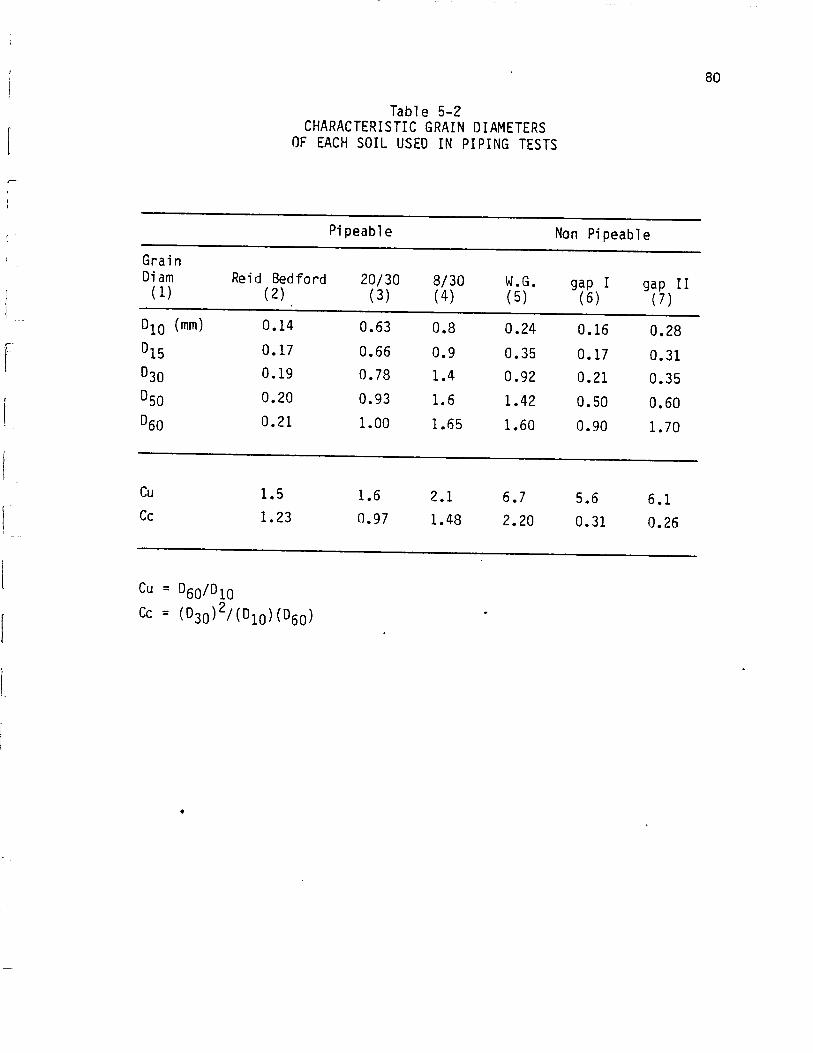
80
Table 5-2CHARACTERISTIC GRAIN DIAMETERS
OF EACH SOIL USED IN PIPING TESTS
GrainDiam(1)
DIQ (mm)
D15D30
D50
D60
Cu
Cc
Pi
Reid Bedford(2)
0.14
0.17
0.19
0.20
0.21
1.5
1.23
peable
20/30(3)
0.63
0.66
0.78
0.93
1.00
1.6
0.97
8/30(4)
0.8
0.9
1.4
1.6
1.65
2.1
1.48
W.G.(5)
0.24
0.35
0.92
1.42
1.60
6.7
2.20
Non Pipeabl
gap I(6)
0.16
0.17
0.21
0.50
0.90
5.6
0.31
e
gap II(7)
0.28
0.31
0.35
0.60
1.70
6.1
0.26
Cu = D6Q/D10
Cc = (D30)2/(D10)(D60)

81
tested only at 20 percent penetration since this sand was
tested in UF's earlier research. A 1/2 inch diameter
semicircular dowel was used only in this test to form the
initial pipe, a 1/4 inch diameter semicircular dowel was used
in all the other tests. The gradient obtained to initiate
piping at 20 percent penetration was 13.33 percent (see Table
1.). which agreed well with the results of UF's earlier
research. For completeness, the 1981 UF test results for
Reid Bedford sand are included in Table 5-1 as tests #16
to 24.
The effects of initial pipe penetration and diameter
for the Reid Bedford sand tests are presented in Figure
5.3. There results show that, as anticipated, smaller
diameter pipes require lower gradients to initiate
piping. This observation is consistent in that small
diameter pipes concentrate flows more than large diameter
pipes, thereby creating higher gradients and velocities
to initiate erosion. The results also show that as the
percent penetration increases, the average gradient,
!=.„•«/ to initiate piping decreases. This observation iscl v S
consistent that for greater penetration the actual
gradient is greater due to the reduced distance from the
head waters.
For the 20/30 sand, five tests were performed at 15, 30,
and 45 percent penetration. The 8/30 sand was tested at 30
and 45 percent penetration. The gradients required to
initiate piping are presented in Table 5-1. From the tests

82
tDIRECTIONOF FLOW
Figure 5-2: Close up View of Pipe at Downstream (Top)And 'Jpstrean (Cotton) Znds
83
on the 20/30 sand and the 8/30 sand, it was found that the
hydraulic head required to maintain the piping progression
was higher at the latter part of the sample. This head
increase to maintain piping is contrary to expectation as the
gradient is increasing due to progression of the pipe (1
decreasing) and a head increase is not anticipated.
Figure 5-4 presents the hydraulic gradients
required to initiate piping versus the corresponding percent
penetration of the initial pipe for the three uniform sands
tested in this project. For uniform sands, the test results
indicate that, as anticipated, the smaller grain
diameters are more susceptible to piping. Obviously,
lower velocities are required to erode smaller particles.
The well graded sand was tested at 30 and 50 percent
penetration of initial pipe. No piping occurred in these
tests. The gap I sand was tested at 15 and 30 percent
penetration, and self-healing occurred in both tests. The
gap II sand was tested at 15, 30, and 45 percent penetration.
The gradient required to initiate piping in the gap II sand
at 15 percent penetration was 35.83 percent; the gradient was
raised several times to maintain the piping, but even at a
gradient of 103 percent the piping stopped before bar #4. The
test using the gap II sand at 30 percent penetration (test
#14), no piping occurred even at a gradient of 95.83 percent.
In test #15, the piping initiated and moved, but stopped
after reaching bar #3; even a gradient of 95.83 percent could
not maintain piping.

84
PIPING TEST RESULTS-REID BEDFORD SAND
01a
.2-
.18-
.16-
£ .12-LU
| .1-
L3
uJ .08-
.06-
.04-
.02-
0
PIPE OIAH (00* a 635^ 1.27o IDS
i 1 I I I 110 15 20 25 30 35
PENETRATION. Z
I I I 1
40 45 50 55 60
Figure 5-3: Effects of Pipe Penetration and Diameter
EFFECTS OF GRADATION
~ REIO BEDFORD SANDA 20/30 SANDa 8/30 SAND •
10 20 30 40PERCENT PENETRATION. L/60
Figure 5-4:Effects of Gradation on Piping Susceptibility
85
The effects of gradation are summarized in Table 5.2
and show that the well-graded and gap-graded soils did
not sustain piping, while the uniform sands all piped.
Other than Cu and/or Cc, no single granulation
characteristic distinguishes piping susceptibility.
Although some instability of the finer sizes was
observed as movement in the gap-graded sands, self-
healing occurred causing erosion.
5.3 Comparison with Earlier Research
Based upon the research of Kenney and Lau in 1985, a
method was proposed for evaluating the potential of grading
instability based on the shape of a material's grain size
curve. This method was described in section 2.4 and was used
to evaluate the various sands used in this research project.
The Reid Bedford sand, the 20/30 sand, and the 8/30 sand are
narrowly-graded in the particle range of the primary fabric
and therefore H-values were obtained within the range F= 0 to
0.3 (see Figure 5-5). From Figure 5.5, it can be seen that
all of the grading curves lie above those points obtained
from the boundary shape curve, and thus it can be concluded
that the Reid Bedford sand, the 20/30 sand, and the 8/30 sand
are all stable. The well graded sand, the gap I sand, and the
gap II sand are widely-graded in the particle range of the
primary fabric and therefore H-values were obtained within
the range of F= 0 to 0.2 (see Figure 5-6). From-Figure

100
,crn
•rH
01
0)C
•H
-P
CQJU>H
0)0-
80
60
U
III I I I I
H-30
INI I I I I
n i rmrHoid Bedford sand
X-8/30 sand•^•-20/30 sand-S--R.B. sand
I I L rtSsiJO.O 1.0 0.1 0.05
G r a i n Size, mm oo
Figure 5-5- Potential of grading instability for the uniform sands tested
—87
5.6, it also can be concluded that all of the well graded
sands, the gap I sand, and the gap II sand are stable.
According to Liu's classification of cohesionless soils
described in section 2.5, the Reid Bedford sand, .the 20/30
sand, and the 8/30 sand are non-piping soils since their Cu
values are less than 5. The well graded sand also is a
non-piping soil since it exhibits a non-uniform and
continueous gradation with the average diameter of pores, Do,
less than D3; where Do = 0.63nD2Q[Do = 0.63(0.33)(0.55)] and
D_ = 0.15. The gap I sand and the gap II sand are also
non-piping soils since they are non-uniform and
discontinueous gradations with the portion of fine material,
P, greater than 35 percent, i.e, Gap I, P = 47%. It is obvious
that all kinds of soils used in this project are stable or
non-piping soils according to Kenney and Lau's or Liu's research.
However, piping occurred in the uniform sands in this project.
The reason being that they observed piping action by applying a
hydraulic head through soil specimens which were placed in a
cylinder, with no initial pipes being formed. Initial pipes
were formed in this project, and piping occurred as decribed
in section 5.1. However, when the self-healing occurs, the
situation is more like the test without an initial pipe,
which is similar to the tests on the well graded sand, the
gap I sand, and the gap II sand. Accordingly, Kenney and
Lau's criteria is to evaluate the internal stability of a
filter; that is to say, whether small particles will move,
and not to evaluate piping susceptibility. Although some

100
0)•z
0)C
-r-l
+JCQJUMQJO,
80 -
20 -
0
Ill I I I I I l l l I I I I IO - Well graded sanda - Gap I sandX - t5a II sand
Gap I sand
Cap II sand
Well qrade(
10.0 1.0
Grain Size, mm
O.i 0.05
a>00
Figure 5-6. Potential of grading instability for the well graded and gap graded sands

89
movement of the fines was observed for tests on the gap I and
II soils, these sand essentially were stable as predicted by
Kenney and Lau's criteria. Thus our results coincide and
validate with Kenney's and Liu's research for the
internal stability of filters.
5.4 The Filter Tests
The Reid Bedford sand was used as base soil for the
Phase I filter tests. Three filter gradations were tested.
The grain size distribution curves of these three filter
materials and the Reid Bedford sand are shown in Figure 4-4.
Some characteristic grain diameters of these filters are
shown in Table 5-3. A summary of the filter tests is given
in Table 5-4.
From the test results, it was found that a filter with
D15/d85 < 8 would protect the cohesionless base soil
properly, where DIS is the 15% size of the filter and d 5 is
the 85% size of the base soil. Therefore, a filter design
criterion for cohesionless soil can be established, Dig/d
< 4, with a safety factor of two. This conclusion coincides
with the criteria proposed by Sherard and Dunnigan and
adopted by the SCS and USER (see Tables 2-6-A and 2-6-B,
soil group 4). Also, the filter design criteria of the U.S.
Army Corps of Engineers shown in Table 2-5, D15/d < 5
90
(consider piping only), is deemed reasonable and practical.
A comparison also was made between the filter test
results and the filter design criteria proposed by Liu (see
Table 2-7). If a filter with D2Q/d70 < 10.9, the filter
would protect the base soil properly (see Table 5-4).
Therefore, the criterion for uniform cohesionless soil,
D_Q/d_o < 7, has a safety factor about 1.5 to 2.0.
Recalling the D15/d_5 criterion for the COE is
5<D15/d15<20/ while that for the SCS/USBR is
D15/d15>4 and observing the results in Table 5-4, suggests
that the COE criterion is appropriate. All agencies, COE,
SCS and USER agree on the lower bound (5 or 4), but it
appears an upper limit similar to the COE (20) is needed.
Filter thickness ranging from 1-1/4 to 3/4 inches (31.8
to 19.0 mm) performed satisfactorily, which are far thinner
than any conceivable field filter. However, in the case of
•filters I and III, as the pipe approached from the
downstream side and the filter should have functioned as a
"crackstopper"; the filters were breached. We did not
observe the filter ravelling into the pipe. Instead as the
pipe arrived at the downstream side of the filter, its
progress was halted and a scouring hole would develop. This
hole, provided the head was high, would continue to enlarge
until support of the filter was removed and via a miniature
landslide the filter collapsed into the scour hole causing
breaching of the filter. This failure of the filter is
investigated further in Phase II (Chapter 6).

91
TABLE 5-3
CHARACTERISTIC GRAIN DIAMETERS OF FILTERS AND BASE SOIL
Filter I
D-i= 0.8515
D20 1'°D 1.5550
D70
D -85
Filter II Filter III
2.4 3.6
2.5 3.8
3.4 4.3
— _
^ —
Reid Bedford sand
0.17
-
0.20
0.23
0.30
unit: mm
TABLE 5-4
SUMMARY OF THE FILTER TESTS
No.
16
17
18
19
Filter material
Filter
Filter
Filter
Filter
I
I
II
III
D15
2.
2.
8.
12.
/d85
83
83
0
0
D20/d70 D15
4
4
10
16
.3
.3
.9
.5
5.
5.
14.
21.
/d!5
0
0
1
2
Result
Work
Work
Work
Fail
D15' D20: the and the 20% size of the
d. , d__, dQ(-: the 15%, the 70% and the 85% size of the baseib 70 85 soil
Base soil: Reid Bedford sand

CHAPTER 6
FILTER DESIGN INVESTIGATION
INTRODUCTION
Following the initial piping and filter studies, it was
decided that the effects of filter width and the possibility
of filter material erosion should be investigated. The
present criteria of the United States Bureau of Reclamation
(USER) and the Corps of Engineers (COE) were used to design
the filters to determine if these sets of criteria were
sufficient to encompass the problem of the piping of a filter
material.
6.1 Scope of Phase II
Reid Bedford sand and 30/65 sand were the base soils
used in phase II of .this investigation. Of the three filter
materials one fit the criteria, the 8/30 sand, one violated
the criteria by a factor of two, the 8/20 sand, and one
violated the criteria by a factor of three, gravel. Filter
widths of 3, 6 and 12 inches depending on the filter material
and the situation were tested with Reid Bedford sand as the
base soil. Additionally, one graded filter was tested with
this base sand. Two supplemental tests were performed with
92

93
the 30/65 base sand to augment and verify the results from
the tests using the Reid Bedford sand.
6.2 Materials
The materials used are listed in Table 6-1 and the
corresponding sieve analysis in Figure 6-1. The base soils
were Reid Bedford sand and the 30/65 sand. The 8/30 sand
filter meets the COE and the USER filter criteria which has a
factor of safety of two as determined in Phase I. The
limiting values computed for the filter criteria were
multiplied by two and three to reduce the factor of safety by
one-half and one-third, respectively, resulting in factors of
safety of one and, approximately, two-thirds, respectively.
The 8/20 sand and gravel met the criteria for the factors of
safety of one and two-thirds, respectively. The 8/20 sand
was scalped below the No. 16 sieve for use in this
experiment.
6.3 Equipment
The equipment used in phase II of this experiment is
identical to that used in phase I.

94
rTABLE 6-1
MATERIALS
Material
8/30
8/20
Gravel
Reid Bedford
30/65
D85
(mm)
1.96
1.77
8.22
0.30
0.98
D50
(mm)
1.18
1.51
4.99
0.20
0.56
D.,- Factor of Safety
(mm)
0.74 2
1.29 1+
3.36 < 1
0.17
0.39

,LD
LT)LO-CD_
LulC_J01UJD_
Reid BedfordA Glass Sanda 8/30• 8/20o 30/65• 20/30• Gravel
1E-1DIAMETER, mm
IE 1
FIGURE 6-1: Grain-size distribution of the materials used
10ui

96
6.4 Sample Preparation
The sample preparation procedure is shown in Figure
6-2. The only changes from phase I made in this preparation
were the following:
1) The base soil was packed to within two inches of
the top of the flume instead of raining the
entire depth; this was to attempt to avoid
settling of the sample during saturation.
2) Only the last two inches of the soil were rained.
3) A dissolvable sugar pipe was inserted upstream of the
filter to initiate upstream piping.
6.5 Filter Design Calculations
The calculations for the USER filter design are shown
in Figure 6-3 and the COE filter design in Figure 6-4. The
factors of safety were incorporated by multiplying the
desired reduction factor by the limiting values computed.
For example, to reduce the factor of safety by one-half the
limiting values are multiplied by two.
6.6 Discussion of Test Results
The results of this investigation are shown in Table

SAMPLE PREPARATION 97
PUT COOKIE SHEETS IN FLUME, PARTIALLY FILL WITH THE FILTER MATERIAL
PACK BASE SOIL ON BOTH SIDES OF THE COOKIE SHEETS TO ENSURESTABILITY
FILL THE COOKIE SHEETS WITH THE FILTER MATERIAL
FILL THE FLUME WITH THE BASE SOIL TO 2 INCHES BELOW THE TOP
COYER THE TOP OF THE COOKIE SHEETS
RAJN THE LAST 2 INCHES OF THE BASE SOIL
SCREED THE EXCESS SOIL UNTIL THE SAMPLE IS COMPLETELY SMOOTHACROSS THE FILTER AND PERFECTLY EVEN WITH THE TOP OF THE FLUME
INSERT THE SUGAR PIPE UPSTREAM OF THE FILTER
CREATE THE INITIAL DOWNSTREAM PIPE
DUST "0" RING WITH BRUSHES TO PREVENT LEAKAGE
PUT LID ON FLUME
CLAMP WITH C-CLAMPS
APPLY BLADDER PRESSURE
SATURATE
FIGURE 6-2

98
FILTER DESIGN CALCULATIONS
USSR CRITERIA
STEP 1: 100% of the Reid Bedford sand passes the No. 4 sieveand the fines compose less than 15% of the sand.Therefore, according to Table 2-6-A (pg. 24), the soilis category 4.
STEP 2: Refer to Table 2-6-A to calculate the maximum D.,. ofthe filter.
max. D15 < 4 x d85b
max. Dig < 4 x 0.30 mm= 0.12 mm
STEP 3: Compute the minimum D,g of the filter,
min. D15 > 4 x d15b
min. D15 > 4 x 0.17 mm = 0.68 mm
The minimum D.,. cannot be less than 0.1 mm15
STEP 4: Set the maximum particle size at 3 inches and the maximumpassing the No. 200 sieve at 5%.
STEP 5: The filters in this experiment are uniformly gradedand do not contain particles that are coarse enoughto require limitations on filter broadness toprevent segregation. Those filters that arecomposed of coarse material and a range of finermaterials or are gap-graded should have limitationson DIQ and DgQ in accordance with Table 2-6-B (pg. 24)
FIGURE 6-3: Example filter design calculationsfor USSR criteria
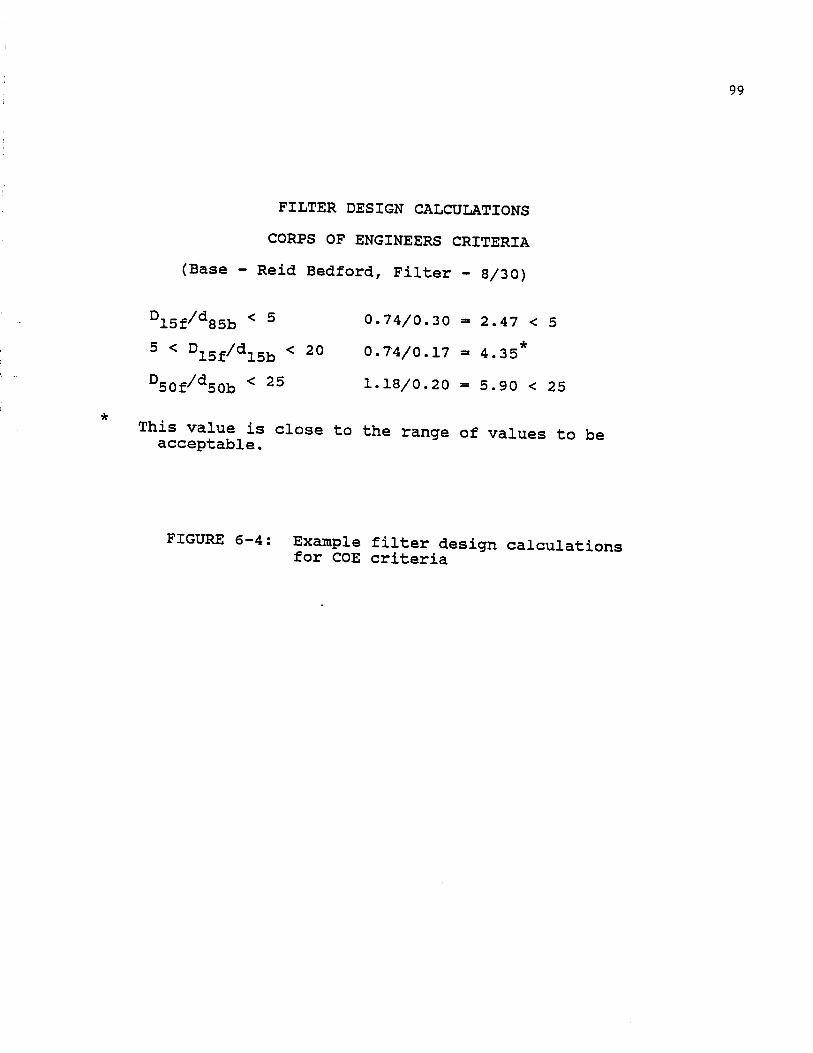
99
FILTER DESIGN CALCULATIONS
CORPS OF ENGINEERS CRITERIA
(Base - Reid Bedford, Filter - 8/30)
D15f/dg5b < 5 0.74/0.30 = 2.47 < 5
5 < D15f/d15b < 2° 0.74/0.17 = 4.35*
D50f/d5Qb < 25 1.18/0.20 = 5.90 < 25
This value is close to the range of values to beacceptable.
FIGURE 6-4: Example filter design calculationsfor COE criteria

100
6-2. The failure mode designated as "piped" indicates a
failure by pipe erosion progressing through and breaching the
filter to allow the upstream material to flow to the
downstream slope. This mode was observed in Tests 1 and 3.
The failure mode "did not filter" indicates a filter
that allows the upstream material to flow into the filter
throughout the depth of the flume and to migrate to the
downstream side of the filter as observed in Tests 4 and 5.
The filter constructed of 8/20 material was successful
in providing a filter of the upstream material, Test 2, and
was also sufficiently coarse to resist pipe erosion and the
progression of the downstream pipes across the filter. The
success of this material contradicts expectations dictated by
the filter design criteria. This material was expected to
perform poorly since the factor of safety against filtering
is approximately one. Conversely, the filter constructed of
the 8/30 material (Tests 1 and 3) had a factor of safety of 2
and was expected to be successful; yet it was breached. The
graded filter (Test 6)provides the best alternative for
preventing pipe erosion from damaging a structure as seen in
Test 6.
The 30/65 base material was used to verify the
controversial results observed using the Reid Bedford as a
base soil with the 8/20 filter material. The 8/20 filter
material was successful even though the factor of safety only
approached unity. Unfortunately, the 30/65 sand used in

101
TABLE 6-2
SUMMARY OF FILTER TEST RESULTS
Test No.
1
2
3
4
5
6
7
abbreviation
FilterMaterial
8/30
8/20
8/30
gravel
gravel
8/302gravel
8/20
BaseMaterial
RB1
RB
RB
RB
RB
RB
30/65
FilterWidth(in)
3
3
12
6
3
33
3
Result
piped
successful
piped
did not filter
did not filter
successful
filter did notfail due topiping; supportwas lost due toerosion of thebase soil
for Reid Bedford
• .«. iC rt / rt • <««M. «•<

102
Tests 7A and 7B failed to verify these results. The piping
of the downstream material proceeded quickly and widened to
the extent of sheet flow over the entire width of the flume
before the initial pipe even reached the filter. Due to this
excessive erosion, the support for the filter was lost. The
filter was not legitimately tested due to the inadequate base
soil.
From these results it is apparent that existing USER
or COE filter criteria merely address migration of the base
soil particles, but neglect the erosion of the filter itself.
When the fluid velocities are sufficiently high, these
results demonstrate that the coarser filter particles
themselves are subject to erosion. Accordingly, the coarser
the filter particles, the more resistant the filter to
erosion as demonstrated by the 8/20 filter outperforming the
finer 8/30 filter. Obviously, a trade-off exists; coarse
filters' resist erosion yet may unsuccessfully filter the base
soil. To overcome this dilemma, graded filters are viable.
A quandary exists concerning the performance of
existing filters, in that to date numerous filters have
performed satisfactorily in the field; yet, these test
results show filter erosion can occur. Apparently, the field
boundary conditions are different than those imposed by the
laboratory flume. For filter erosion to occur an open
channel with high velocities is required as provided by the
plastic flume top and downstream pipe. Obviously, similar

103
filter erosion would be anticipated for similar field
conditions. It is conceivable that a crack in the impervious
core of a dam or arching within the filter could produce
these unfavorable conditions.

104
6.7 Summary of Phase II Tests
Table 6-3 summarizes the test conditions of the test
performed in Phase II of the investigation.
NOTES: 1) d = density
2) k = permeability
3) The location of the filter is measured to the
center of the filter.
Test 1
The base soil used in this test was Reid Bedford sand
with d = 1.66 g/cm3 (103.58 lb/ft3); k = 0.05317 cm/s
(0.00174 ft/s); initial downstream pipe penetration = 12
•inches (33%), diameter = 1/2 inch; 3 inch filter of 8/30 sand
located 36 inches upstream from the downstream slope;
upstream pipe length =14.5 inches, diameter = 3/8 inch;
bladder pressure = 5 psi. The head was increased at a
constant rate from the beginning of the test. The downstream
piping began at the length of the initial pipe (12 inches)
with a head of 12.8 inches. Upstream piping began at the
same time. The upstream pipe clogged at the filter and
stopped. When the downstream pipe reached 19.68 inches in
length, the head was held constant until the pipes reached
the filter at a head of 20.55 inches and a gradient of 0.54

105
TABLE 6-3
SUMMARY OF TEST RESULTS
TESTNo.
1
2
3
4
5
6
7A
7B
BASE FILTERsand density type width
(g/cm3) (in)
RB
RB
RB
RB
RB
RB
30/65
30/65
1.66
1.61
1.58
1.58
1.57
-
1.55
1.56
8/30
8/20
8/30
gravel
gravel
8/30-gravel
8/20
8/20
3
3
12
6
3
3-3
3
3
PERMEABILITY
(cm/s)
0.
0.
0.
0.
0.
0.
0.
0.
05317
02920
06680
04340
05010
04850
11530
12490
PENETRATION
in(%)
12.
12.
12.
12.
13.
12.
12.
8.
0
5
0
0
0
0
0
0
(33)
(35)
(33)
(33)
(26)
(33)
(33)
(38)
UPSTREAM HEADAT START OFPIPING
(in)
12
9
14
8
14
10
13
14
.80
.37
.96
.54
.25
.08
.62
.17

106
across the filter. The downstream material piped and eroded
by sheet flow. The filter was damaged by pipes pulling
material from the filter. The filter was breached by pipes
progressing in a meandering path across the filter. See Fig.
6-5. The gradient across the filter at failure was 0.944.
The 8/30 sand functioned as a filter but not as a
crackstopper at high gradients. At gradients < 0.5 the
filter will stop cracks, but as the fine particles in this
sand wash away by constant erosion, the skeleton of larger
particles is weakened and collapses even at low gradients.
Test 2
The base soil used in this test was Reid Bedford sand
with d = 1.61 g/cm3 (100.3 lb/ft3); k = 0.0292 cm/s (0.000958
ft/s); initial downstream pipe penetration =12.5 inches
(35%), diameter =1/2 inch; 3 inch filter of 8/20 sand
located 36 inches upstream from the downstream slope;
upstream pipe length = 14 inches, diameter = 3/8 inch;
bladder pressure = 7 psi. A higher bladder pressure than
Test 1 was used to ensure full contact between the flume lid
and the sand. Failure due to settling and bladder relaxation
was encountered in a preliminary test. The head was
increased at a constant rate, and piping began at the length
of the initial pipe, 12.5 in, at a head of 9.37 inches.
Upstream piping began at a head of 12.83 in, but the
transported material- clogged the pipe at the filter. Air

107
Fig. 6-5: Photo of Test 1 illustrating filterfailure by piping
Fig. 6-6: An illustration of slight damage to asuccessful filter in Test 2

108
bubbles slowed and almost stopped the progression of the
downstream pipes. As the air flowed out of the pipes, the
pipes progressed to the filter and stopped. At this point
the gradient was 0.40. The eroded sand was deposited at the
downstream slope. The higher gradient caused by the
increasing head cut deep channels in the deposited material.
The high velocities in these channels caused the heads to
drop. The 8/20 material functioned as a filter and did not
fail at gradients as high as 1.45; the head was raised to its
highest value. The coarse material of this filter was
damaged, but the filter did not pipe and did not fail even
when the bladder pressure was reduced to 2 psi. See Fig.
6-6. The pipes and channels became too wide to allow the
filter to function as a crackstopper. However, the material
was sufficiently coarse and permeable to prevent heads from
producing the pressure needed to breach the filter. The
filter was successful. Thus, tests on the 6 inch and 12 inch
filters of this material were not necessary.
Test 3
The Reid Bedford sand was the base soil in this test
with d = 1.58 g/cm3 (98.48 lb/ft3); k = 0.0668 cm/s (0.00219
ft/s); initial downstream pipe penetration = 12 inches (33%),
diameter = 1/2 inch; 12 inch filter of 8/30 sand located 36
inches from downstream slope; upstream pipe length = 6 1/2
inches, diameter = 1/2 inch; bladder pressure = 5 psi. With

109
the head increasing at a constant rate, the loose material
from the removal of the dowel used to form the initial
downstream pipe was carried away at a head of 9.06 inches.
The actual piping began at a head of 14.96 inches at the
length of the initial pipe. The pipes progressed and widened
quickly. Upstream piping was observed at a head of 17.44
inches. The upstream pipe clogged at the filter. When the
downstream pipes reached 28 inches in length, the head was
held constant at a head of 21.06 inches. As the pipes
reached the filter, the fines of the filter material were
eroded and carried downstream. The high velocities began
cutting large, meandering channels in the deposited material
6 inches from the downstream slope. The gradient across the
filter reached 0.265 as the filter material piped to cause a
breach of the filter. The upstream material flowed through
the filter pipes. See Fig. 6-7. Before the filter was
breached, the 8/30 material functioned as a filter for the
upstream material, but the filter material completely failed
by piping as did the 3 inch filter of the same material.
Test 4
The base soil was Reid Bedford sand with d = 1.58 g/cm3
(98.94 lb/ft3); k = 0.0434 cm/s (0.00142 ft/s); initial
downstream pipe penetration = 12 inches (33%), diameter =1/2
inch; 6 inch filter of gravel located 36 inches upstream from
downstream slope; upstream pipe length = 11 inches, diameter

110
Fig. 6-7: A photo from Test 3 illustrating abreach begun by piping and resultingin a mass flow of upstream materialcarrying away the filter material
"W***** "rr,Ji*.% 1
Fig. 6-8: Test 4 photo illustrating a filterfailing to function as a filterallowing migration of the upstreammaterial into the filter

Ill
= 3/8 inch; -bladder pressure = 7 psi. The piping began at the
tip of the initial pipe at a head of 8.54 inches. The
upstream piping began at a head of 11.02 inches. The piping
was stopped by air bubbles in the filter. With the head
increasing steadily the pipes progressed to 19.5 inches in
length, widening at the downstream slope to the width of a
channel, where the head was stopped at 21.3 inches. After a
12 minute lapse, the bladder was relaxed to 6 psi due to slow
pipe progression. The initial pipe was clogging with
transported material because of the excessive bladder
pressure. Side pipes formed as these middle pipes were
clogged, since the outside pipes feel less pressure than the
inside pipes feel. The shape of the bladder causes an uneven
pressure distribution. The pipes were forced to progress by
resuming the constant head increase. As the downstream pipes
reached the filter at a gradient of 0.80 across the filter,
air was released from the large interstitial spaces of the
filter. This release caused a migration of 2 1/2 inches of
the upstream material into the filter. Thus, this material .
failed to function as a filter. The filter did not fail by
piping and was not completely breached, even when the bucket
applying the head was at its highest point. However, the
filter was sufficiently clogged by the upstream material to
render the filter material unsuitable for this base material.
See Fig. 6-8. The velocity of the water through the base
soil was not high enough to carry the sand through the voids

112
of the filter, causing deposition of the sand within the
gravel. As the sample was excavated, infiltration of the
base soil throughout the filter depth was discovered.
Test 5
The base soil was Reid Bedford sand with d = 1.57 g/cm
(97.88 lb/ft3); k = 0.0501 cm/s (0.00164 ft/s); initial
downstream pipe penetration = 13 inches (26%), diameter = 1/2
inch; filter of 3 inch gravel located 49 inches upstream from
the downstream slope; no upstream pipe; bladder pressure = 5
psi. The filter was placed farther upstream to subject the
filter to a higher velocity than in Test 4. The filter was
too close to the upstream reservoir to install an upstream
pipe. The head was increased at a constant rate, and piping
began at the length of the initial pipe at a head of 14.25
inches. The pipe progressed to 19.69 inches under a head of
18.90 inches, when the head was temporarily held constant.
After a lapse of 16 minutes and the pipes had progressed to a
length of 31.5 inches, the increase of the head was resumed.
At a head of 25.6 inches the upstream material began
migrating through the filter material. At a gradient of 0.19
the migration of the upstream soil was completely through the
filter. The head fell to 3.1 inches and remained there as
the water flowed freely through the filter and the sample.
This filter also failed by migration of the upstream material
completely through the gravel filter. The 12 inch filter of

113
this material was not tested. The same migration will occur
regardless of the size of the filter. The extent of the
migration is the only variable.
Test 6
The base soil was Reid Bedford sand with k = 0.0485
cm/s (0.00159 ft/s); initial downstream pipe penetration = 12
inches (33%), diameter = 1/2 inch; graded filter of 3 inches
of 8/30 sand (upstream) and 3 inches of gravel (downstream)
located 36 inches from the downstream slope; upstream pipe .
length = 14 inches, diameter = 3/8 inch; bladder pressure = 5
psi. The piping began at the tip of the initial pipe at a
head of 10.08 inches. The upstream piping initiated at a
head of 13.82 inches. This upstream pipe clogged itself at
the 8/30 filter, indicating the 8/30 sand acted to filter the
upstream material. The constantly increasing head caused
excessive flows of the base sand and widening of the
downstream pipes. Thus, the bladder pressure was increased
to 7 psi. When the initial pipes reached 19.68 inches in
length, the head was temporarily stopped at 20.94 inches.
The pipes progressed, widened and began clogging downstream
with deposited material. When the head was increased again
as the pipes reached the filter, the increase in flow caused
channels to cut through the deposited sand. Some minor
migration of the 8/30 sand into the gravel was observed. The
fines of the 8/30 sand flowed through the gravel at a

114
gradient of 0.81 across the filter. The upstream reservoir
manometer overflowed without any failure observed. At a
gradient of 0.99 across the filter the channels downstream of
the gravel at the interface.between the base and the filter
widened to the entire width of the flume. The head was
raised to its highest point to reach a gradient of 1.42
across the filter, and the bladder pressure was reduced to 2
psi. The filter remained intact and was marginally damaged.
See Fig. 6-9.
NOTE: Tests 7a and 7b were performed to test the 8/20 filter
material with a different base soil with approximately
the same grain-size distribution curve as the Reid
Bedford sand. This was to verify the controversial
results that the material with a marginal factor of
safety and uniform gradation is successful, while a
well-graded material with a factor of safety of 2 fails.
Test 7A
The base soil was 30/65 sand with d = 1.55 g/cm3 (96.68
lb/ft3); k = 0.1153 cm/s (0.00378 ft/s); initial downstream
pipe penetration = 12 inches (33%), diameter =3/8 inch; 3
inch filter of 8/20 sand located 36 inches from the
downstream slope; upstream pipe length =14.5 inches,
diameter = 3/8 inch; bladder pressure = 7 psi. The head was
being increased at a constant rate as the piping began at the

115
Fig. 6-9: Photo from Test 6 of a successfulgraded filter

116
initial pipe tip at a head of 13.62 inches. The pipe was
uniform and widened quickly. This 30/65 sand did not allow
meandering pipes to form; the pipes were very straight. The
sand transportation in the pipes was considerably faster than
with the Reid Bedford sand due to the higher permeability of
the 30/65 sand. The pipe or channel progressed to 19.68
inches in length where the head was held constant at 24.84
inches. The pipe progressed to within 2 inches of the filter
and stopped. The head was increased again and, the bladder
pressure was lowered to 6 psi to induce pipe progression.
The pipes began flowing and widening to cause sheet flow
across the width of the flume. The base material completely
eroded downstream of the filter without damaging the filter
until the filter collapsed solely due to the loss of support
of the base soil.
Test 7B
The identical test was repeated except the filter was
placed 21 inches from the downstream slope with an 8 inch
(38%) initial downstream pipe penetration of 3/8 inch
diameter and a 17 inch upstream pipe of 3/8 inch diameter.
The purpose of the test was to attempt to force the pipes to
the filter before sheet flow started. This test yielded the
identical results to Test 7a. This suggests an inappropriate
base soil for this kind of test. The piping did not progress
to the extent that the filter design was tested.

CHAPTER 7
CONCLUSIONS AND RECOMMENDATIONS
Based upon the results obtained from the laboratory
testing program, the cohesionless soils which were used, and
the specific testing equipment designed for this project, the
conclusions are summarized as follows:
1. It is harder to initiate piping in a well graded
(high coefficient of uniformity, Cu) cohesionless soil than a
uniformly graded (lower Cu) soil. For the uniformly graded
soils which are susceptible to piping, those with a larger
grain size are more difficult to initiate piping than those
with a smaller grain size. In other words, fine uniform
sands are more susceptible to piping than coarse well graded
sands.
2. The internal stability criteria of Kenney and Lau,
and Liu, were verified for well-graded sands. However, a
difference was observed for uniform sands. It is believed
that this divergence was due to this research using an
initial pipe to concentrate flow and using a horizontal
valve.
3. A filter design criterion for cohesionless soil is
established, D15f/d85t) < 4. This criteria has a safety factor
of two, and coincides with that proposed by Sherard and
117

118
Dunnigan and used by the USSR and SCS. Also the filter
design criterion of the U.S. Army Corps of Engineers, D15f/d
< 5 (considering piping only), is deemed reasonable and
practical for filters only.
5. The criteria used by the USER, the SCS and the COE do
not address the problem of erosion of the filter itself by
piping. Filters which met the specified filtering criteria
were breached by this type of erosion. Filters of uniform
gradation with a factor of safety of approximately one,
violating the filter design criteria by a factor of two,
performed successfully. These filters have larger particles
than those filters with a factor of safety of two, and thus
require a higher velocity to erode and move the filter
material.
6. Graded filters perform satisfactorily in resisting
erosion yet filter the base soil, and are recommended to
mitigate breaching.
7. The thickness of a filter has little effect on the
performance of the filter.

119
REFERENCES
1. Cedergren, H. R.. Seepage, Drainage, and Flow Nets, John Wiley andSons, New York, 1977.
2. Graf, W. H., Hydraulics of Sediment Transport, McGraw-Hill, New York,1971.
3. Jansen, R. B., Dukleth, G. W. , Gordon, B. B., James, L. B., andShields, C. E., (1967), "Earth Movement at Baldwin Hills Resevoir,"Jrn. SM & FE Div., ASCE, Vol. 93, No. SM4, July.
4. Kenney, T. C., and Lau, 0., "Internal Stability of Granular Filter,"Canada Geot. Journal , Vol. 22, No. 2, May, 1985, pp. 215-226.
5. Lane, E. W. , "Security from Under-Seepage: Masonry Dams on EarthFoundations," Transactions, ASCE, Vol. 100, 1935.
6. Lambe, T. W. , and Whitman, R. V., Soil Mechanics, John Wiley and Sons,New York, 1969.
7. Liu, Hongmei, and Zhang, Jingmin, "Piping of Sand-Gravel Soils,"Hydrotechnical Science Research Institute, China, 1982.
8. Liu, J., "Piping Properties of Soils and Filter Design,"Hydrotechnical Science Research Institute, China, 1984.
9. Logan, T. J., "The Determination of Gradient Concentration Factors fora Quantitative Piping Theory," University of Florida Master ofEngineering Report, 1980.
10. Pietrus, T. J., "An Experimental Investigation of Hydraulic Piping inSand," University of Florida Master of Engineering Thesis, 1981.
11. Schmertmann, J. H., "A Quantitative Piping Theory and Its Relation toConditions at the FP&L Dike Breach," Special Board of ConsultantsReport, Appendix B, 1980.
12. Seed, H. B. and Duncan, M. J., "The Teton Dam Failure ~ ARetrospective Review," 10th ICSMFE, Stockholm, Vol. 4, pp. 214-238,1981.
13. Sherard, J. L., and Dunnigan, L. P., "Filters and Leakage Control inEmbankment Dams," Proc. ASCE Symp. on Seepage & Leakage from Dams andImpoundments, Denver, CO., May, 1985.
14. Sherard, J. L., Dunnigan, L. P., and Talbot, J. R., "Basic Propertiesof Sand and Gravel Filters," Journal of the Geotechnical EngineeringDivision, ASCE, June, 1984, pp. 684-700.

120
15. Sherard, J. L., Dunnigan, L. P., and Talbot, J. R., "Filter for Siltsand Clays," Journal of the Geotechnical Engineering, ASCE, June, 1984,pp. 701-718.
16. Townsend, F. C., "An Analytical and Experimental Investigtion of aQuantitative Theory for Piping in Sand," Final Report for FloridaPower & Light Company, University of Florida, 1981.
17. United States Committee on Large Dams, Lessons from Dam Incidents,U.S.A., ASCE, 1975.
18. Vaughan, P. R., Kluth, D. J., Leonard, M. W. and Pradoura, H. H. M.,(1970), "Cracking and Erosion of Balderhead Dam and the Remedial WorksAdopted for Repair," 10th Cong., Large Dams, Montreal, Vol. 1.
19. Wong, Y. W., "Three Dimensional Finite Element Analysis of aQuantitative Piping Theory," University of Florida Master ofEngineering Report, 1981.

APPENDIXTEST DATA SHEETS

121
HYDRAULIC PIPING TEST DATA SHEET
Test # :
Date:
Bladder Pressure:
Length of Pipe Penetration:
Percent Pipe Penetration:
Initial Pipe Diameter:
Tine at Start of Test:
Head at Upstream End:
Head at Downstream End:
Total Head:
1 (Reid Bedford sand)
3-11-85
5 psi
12'
20.0
1/2"
11:09 AM
12.5'
4.5'
8.0'
Location of Pise Time Time Increr.ent
Bar #1
Ear #2
Bar £3
Ear #4.
Ear #5
Upstream Weir
Comments;
1. Piping started at 11:09, stopped a minute later. The head had tobe raised.
2. Heads at upstream end and heads at downstream end were recordedat different time:
1:42 i:57 2:U412.88
12:07
1:35
3:57
5:08
5:18
58
88
142
71
10
Time 12:40Head at US end 13.38Head at DS end 5.25
11.63 11.95.13 4.25 4.25
2:25 3:1112.25 12.0 inches4.2.5 4.25inches
3. Dens.ity of sand: 92.64 pcf

122
HYDRAULIC PIPING TEST DATA SHEET
2 (20/30 sand)Test # :
Date:
Bladder Pressure:
Length of Pipe Penetration:
Percent Pipe Penetration:
Initial Pipe Diameter:
Time at Start of Test:
Head at Upstream End:
Head at Downstream End:
Total Head:
Location of Pioe
Bar #1
Ear #2
Bar #3
Ear #4
Bar £5
Upstream Weir
CoinTients:
1. Air voids could be seen in sand.
4-10-85
5 psi
9"
15
I/A"
10:55 AM
16.5"
5 J.2"
11.38"
Tins
10:56
Time Increnent
10
11
1111
11
:59
:09
:14
:25
:26
3
10
5
11
1

123
HYDRAULIC PIPING TEST DATA SHEET
3 (20/30 sand)
4-18-85
5 psi
9"
15
1/4"
9:57 AM
20.0'
5.5"
14.5'
Test # :
Date:
Bladder Pressure:
Length of Pipe Penetration:
Percent Pipe Penetration:
Initial Pipe Diameter:
Tine at Start of Test:
Head at Upstream End:
Head at Downstream End:
Total Head:
Location of Pioe
Bar #1
Ear #2
Bar £3
Ear #4
Ear #5
Upstream Weir
Cotnnents;
1. Heads at upatream end and heads at downstream end were recordedwhen piping reached Bar #3, #4, and #5:
Time Incrcnent
2*
10:21
10:24
10:51
11:15
11:15.5
22
3
27
24
0.5
Bar # 3 4Head at US end 17.25 20.38Head at DS end 4.5 4.5
2. Density of sand: 100.5pcf
22.38 inches4.5 inches

124
HYDRAULIC PIPING TEST DATA SHEET
Test # :
Date:
Bladder Pressure:
Length of Pipe Penetration:
Percent Pipe Penetration:
Initial Pipe Diameter:
Tine at Start of Test:
Head at Upstream End:
Head at Downstream End:
Total Head:
Location of ?ioe
4 (20/30 sand)
4-25-85
5 psi
18"
30
1/4 "
9:08 AM
12.75"
4.5"
8.25'
Time Increrent
Bar #1
Ear #2
Bar £3
Ear #4
Bar #5
Upstream Weir
9:39
10:00 .
10:17
10:28
31
21
17
11
Coirments ;1. Heads at upstream end and heads at downstream end were recorded
when piping reached Bar #2, #3, #4, and -J5 :
B a r # 2 3 4 5Head at US end 12.75 11.75 16.5 23.0 inchesHead at DS end 4.5 4.5 4.5 4.5 inches
2. Density of sand: 101.8 pcf
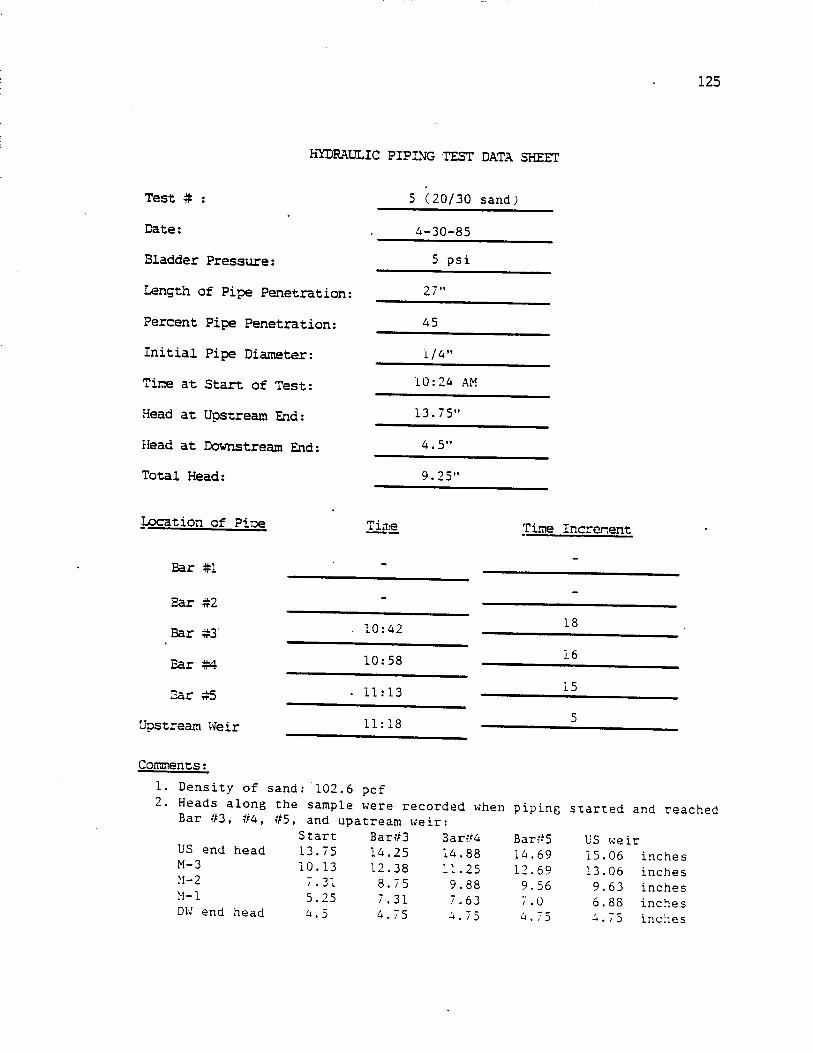
125
HYDRAULIC PIPING TEST DATA SHEET
Test # :
Date:
Bladder Pressure:
Length of Pipe Penetration:
Percent Pipe Penetration:
Initial Pipe Diameter:
Tine at Start of Test:
Head at Upstream End:
Head at Downstream End:
Total Head:
Location of
5 (20/30 sand.)
4-30-85
5 psi
27"
45
i/4"
10:24 AM
13.75"
4.5'
9.25"
Time Tine Increnent
Bar #1
Bar #2
Bar £3'
Ear #4
Ear #5
Upstream Weir
Comnents:
10:42
10:58
. 11:13
11:18
18
16
15
1. Density of sand: 102.6 pcf2. Heads along the sample were recorded when piping started and reached
Bar #3, #4, #5, and upatream weir:Start Bar#3 Bar-?4 Bar-5 US weir
15.06 inches13.06 inches9.63 inches6.88 inches4.75 inches
US end headM-3M-2M-lDW end head
13.7510.137.315.254.5
14.2512.388.757.314.75
14.8811.259.887.634.75
14.6912.699.567.04.75

126
HYDRAULIC PIPING TEST DATA SHEET
Test # :
Date:
Bladder Pressure:
Length of Pipe Penetration:
Percent Pipe Penetration:
Initial Pipe Diameter:
Tine at Start of Test:
Head at Upstream End:
Head at Downstream End:
Total Head:
6 (20/30 sanci)
5-16-85
5 psi
18"
30
1/4"
8:50 AM
13.38'
4.13'
9.25"
Location of Pioe Time Time Increnent
Bar #1
Ear £2
Bar S3
Ear #4
Sar #5
Upstream Weir
9:17
9:21
9:27
i n . A 7
-
4
6
40
10:09
Cotrments;1. The sample was prepared without vacuum procedure.2. Heads along the sample were recorded when piping reached Bar-v-2, £3,
#4, #5, and upatream weir:Bar#214.8811.388.385.75
US end headM-3M-2M-lDW end head .5
Bar#314.6311.138.57.384.63
16.6312.1310.257.54.5
Bar#517.517.C12.388.13
US weir17.5 inches17.012.388.134.75

127
HYDRAULIC PIPING TEST DATA SHEET
Test * :
Date:
Bladder Pressure:
Length of Pipe Penetration:
Percent Pipe Penetration:
Initial Pipe Diameter:
Tine at Start of Test:
Head at Upstream End:
Head at Downstream End:
Total Head:
Location of Pioe
7 (well graded)
5-29-85
5 ps i
30
1/4"
11:18 AM
37'
4.5"
32.5"
Time Increment
Bar #1
Ear £2
Bar £3
Ear #4
Bar #5
Upstream Weir
Comments ;1. Sample was prepared without vacuum process.2. Density of sample: 110.9 pcf3. Only a little fine sand was removed in the original pipe at a nead
of 32.5".4. The head was raised several times but the piping did not occur.
After raising the head to 58" with no eddect, the test was terminated.

128
HYDRAULIC PIPING TEST DATA SHEET
Test # : 8 iwell gradedj
Date: 6-5-85
Bladder Pressure: 5 psi
Length of Pipe Penetration:
Percent Pipe Penetration: ___^_____
Initial Pipe Diameter:
Tine at Start of Test:
Head at Upstream End:
Head at Downstream End:
Total Head:
Location of Pipe Tins Time Increnent
Bar #1 ~
Ear #2 ~
Bar S3 " '
Ear #4 ~
Ear #5 ~
Upstream Weir - "
Comments;1. Sample was prepared without vacuum process.2. Density of sample: 112.3 pcf3. The head was raised several times but piping was not intiated.
After raising the head to 52.5" with no effect, the test was terrr.in.atec

129
HYDRAULIC PIPING TEST DATA SHEET
Test # : 9 (8/30 sand)
Date: ' ' 6-21-85
Bladder Pressure: _ ^ Psi
27"Length of Pipe Penetration:45
Percent Pipe Penetration:
Initial Pipe Diameter:
Tine at Start of Test: 9; 33 AM
Head at Uostream End: 16"
Head at Downstream End: 5"
Total Head: u'
Location of Pioe Tiiae Time Increnent
Bar #1
Ear #2
Bar *3 10:05
Ear*4 i0:12
Ear*5 iU :22
Upstream Weir *-0:
10
Comnents ;1. The vacuum process was performed.2. Density of sample: 106.1 pcf3. The water supply system was changed to a faucet since only a niaxir.iur
head of only 16" could be achieved when the water supply reservoirwas raised to the top of the pulley system.
6. The heads were recorded when the piping reached bar #3, -"4, and -r-5;19.0V 33.25", and 38.5", respectively.

130
HYDRAULIC PIPING TEST DATA SHEET
Test * :
Date:
Bladder Pressure:
Length of Pipe Penetration:
Percent Pipe Penetration:
Initial Pipe Diameter:
Tine at Start of Test:
Head at Upstream End:
rlead at Downstream End:
Total Head:
Location of Pioe
10 (8/30 sand)
6-27-85
5 psi
18"
30
1/4"
9:05 AM
17.0'
4.75"
12.25"
Time Time Increnent
Bar #1
Ear #2
Bar £3
Ear #4
Ear *5
Upstream Weir
Comments:
~"
9:23
9:28
9:50
9:57
9:57
-
5
22
7
0
1. The vacuum process was performed.2. Density of sample: 106.1 pcf3. The water supply system was changed to a faucet after the water supply
reservoir was raised to the top of the pulley system.4. When the piping reached bar #2, #3, #4, and -'5, the head were recorded;
14.88", 15.0", 20.5", and 22.75", respectively.

131
HYDRAULIC PIPING TEST DATA SHEET
Test * :
Date:
Bladder Pressure:
Length of Pipe Penetration:
Percent Pipe Penetration:
Initial Pipe Diameter:
Tine at Start of Test:
Head at Upstream End:
Head at Downstream End:
Total Head:
Location of Pioe '
11 (gap I sand)
7-23-85
5 psi
15
1/4"
9:15 AM
Time Increrent
Bar #1 ~
Ear #2 ~
Bar £3 ~
Ear #4 ~
Bar #5 ~
Upstream Weir ~
Consents:1. The vacuum process was performed.2. Density of sample: 110.1 pcf3. The head was raised several times, but piping did not occur except
that the fine sand in the initial pipe moved occasionally.4. When the head was raised to more than 6 feet sheet flow happened.

132
Test # :
HYDRAULIC PIPING TEST DATA SHEET
12 (gap I sand)
8-5-85Date:
Bladder Pressure: 5 psi
Length of Pipe Penetration: '
Percent Pipe Penetration: 3Q
Initial Pipe Diameter: 1/4"
Time at Start of Test: I0:3° AM
Head at Upstream End: ~
Head at Downstream End: -
Total Head:
Location of Pipe Tirrs Time Increment
Bar #1
Ear #2 ~
Bar #3 ~ 1
Ear #4 ~
Bar *5 ~
Upstream Weir - •
Comments:
1. The vacuum process was performed.2. Density of sample: 110.4 pcf3. The head was continually increased in order to initiate piping.
But piping did not occur except the fine sand in the initial pipemoved occasionally.
4. Sheet flow happened when the head was raised to more than 6 feet.

133
HYDRAULIC PIPING TEST DATA SHEET
Test * :
Date:
Bladder Pressure:
Length of Pipe Penetration:
Percent Pipe Penetration:
Initial Pipe Diameter:
Tine at Start of Test:
Head at Upstream End:
Head at Downstream End:
Total Head:
Location of Pioe
13 (gap II sand)
9-9-85
5 psi
15
1/4"
10:00 AM
26"
4.5'
21.5"
Time Time Increnent
Bar #1
Ear #2
• Bar £3
Ear #4
Ear £5
Upstream Weir
Cerements;
1. The vacuum process was not performed.2. Density of sample: 112.0 pcf3. Piping occurred when the head was raised to 21.5", and a self-healing
phenomenon happened a few minutes later.4. After the piping reached bar #3, the piping stopped even when tapping
the plexiglass top and raising the head.5. The test terminated when the head was raised to about 62".
10:57
11:35
-
-
-
31
38
_
_
-

134
HYDRAULIC PIPING TEST DATA SHEET
Test # : 14 (gap II sand)
Date: 9-16-85
Bladder Pressure: 5 psi
Length of Pipe Penetration: l8
Percent Pipe Penetration: 30
Initial Pipe Diameter: 1/4"
Time at Start of Test: 9i3Q AM
Head at Upstream End: -
Head at Downstream End: ~
Total Head:
Location of Pine Ti-ne Time Increnent
Bar #1
Ear #2
Bar £3
Ear #4
Bar #5
upstream Weir
Comments:
1. The vacuum process was not performed.2. Density of sample: 113.0 pcf3. When the head was gradually applied, some air bubbles moved but no
piping happened.4. When the head was raised to 15.5", still nothing happened. By in-
creasing the size of the initial pipe, piping occurred. But the sandappeared to be self-healing, and the piping eventually stopped.
5. At a head of 57.5", piping woild occur by tapping the plexiglass top,but self-healing woild result downstream causing the pipe to stop.The test was terminated at this tine.
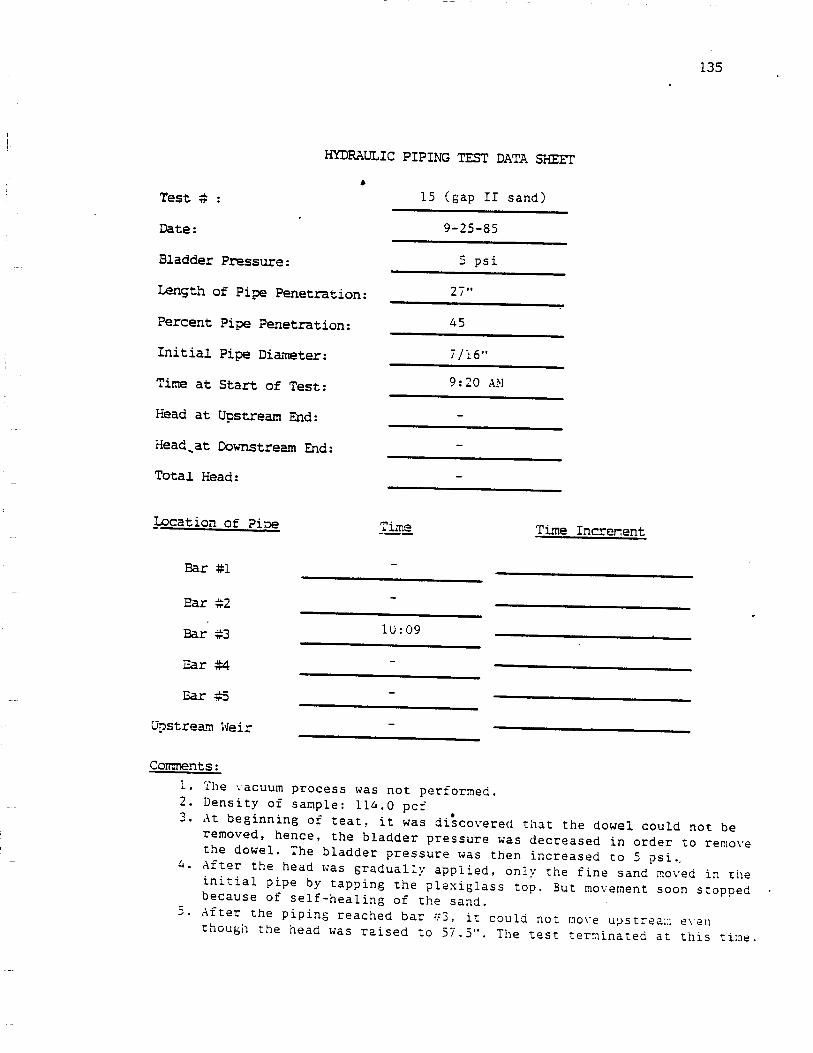
135
HYDRAULIC PIPING TEST DATA SHEET
•
Test # : 15 (eap IZ sand)
Date: ' 9-25-85
Bladder Pressure: 2 Psi
Length of Pipe Penetration: 2/"
Percent Pipe Penetration: 45
Initial Pipe Diameter: 7/i6"
9•?0 AMTime at Start of Test:
Head at Upstream End: ~
Head,at Downstream End: ~
Total Head:
Location of Pine Time Time Increnent
Bar #1
Ear #2
Bar S3 1U:°9
Ear #4
Ear *5
Upstream Weir
Comments:1. The vacuum process was not performed.2. Density of sample: 114.0 pcf3. At beginning of teat, it was discovered that the dowel could not be
removed, hence, the bladder pressure was decreased in order to removethe dowel. The bladder pressure was then increased to 5 psi..
4. After the head was gradually applied, only the fine sand moved in theinitial pipe by tapping the plexiglass top. But movement soon stoppedbecause of self-healing of the sand.
5. After the piping reached bar ->'3, it could not move upstrea;:; eventhough the head was raised to 57.5". The test terminated at this time,

136
HYDRAULIC PIPING TEST DATA SHEET
Test # : 16 (Filter I)
10-7-85Date:
Bladder Pressure: 5 psi/, CM •} ") <
Length of Pipe Penetration: a.a , z.
Percent Pipe Penetration:
Initial Pipe Diameter:
Tine at Start of Test: 9:4° AM
Head at Upstream End: ~
Head at Downstream End: ~
Total Head:
Location of Pise Tins Time Increnent
Bar #1
Bar #2
Bar S3
Ear £4
Ear #5
Upstream Weir
Comments:
1. The base soil was Reid Bedford sand.2. Density of base soil: 96.85 pcf3. Two thickness, o.75" and 1.25",were tested in this test,4. Piping occurred at downstream end.5. Nothing happened at the upstream side of the filters.

137
HYDRAULIC PIPING TEST DATA SHEET
Test * :
Date:
Bladder Pressure:
Length of Pipe Penetration:
Percent Pipe Penetration:
Initial Pipe Diameter:
Time at Start of Test:
Head at Upstream End:
Head at Downstream End:
Total Head:
Location of Pioe
17 (Filter I)
10-16-85
5 psi
CM - cti 7 en. J i / . J , / . J
50
1/4"
9:15 AM
Time Increr.ent
Bar #1
Ear #2
Bar £3
Ear #4
Bar #5
Upstream Weir
Comnents:
1. Base soil: Reid Bedford sand2. Density of base soil: 91.73 pcf3. Two thickness, 1.25" and 1.0", were tested.4. Piping occurred at downstream end,5. The filters worked well until the sand which supported the filters
at the downstream side was eroded.

138
HYDRAULIC PIPING TEST DATA SHEET
Test * :
Date:
Bladder Pressure:
Length of Pipe Penetration:
Percent Pipe Penetration:
Initial Pipe Diameter:
Tine at Start of Test:
Head at Upstream End:
Head at Downstream End:
Total Head:
Location of Pioe •
Bar #1
Ear #2
Bar S3
Ear #4
Bar #5
Upstream Weir
18 (Filter II)
10-28-85
5 psi
15", 7.5", 7.5"
50
1/4"
9:00 AM
Time Time Increnent
Coinnents:
1. Base soil: Reid Bedford sand2. Density of base soil: 94.8 pcf3. Two thickness, 0.75" and 1.0", were tested.4. Piping occurred at downstream end.5. The filters worked well.

139
Test
HYDRAULIC PIPING TEST DATA SHEET
19 (Filter III)
Date: U-6-85
Bladder Pressure: 5 psi
Length of Pipe Penetration: 15", 7.5", 7.5"
Percent Pipe Penetration: ^
Initial Pipe Diameter: 1/4"
Tine at Start of Test: 9:3° AM
Head at Upstream End: ~
Head at Downstream End: -
Total Head:
Location of Pioe Time Time Incrcnent
Bar #1
Ear #2
Bar #3
Ear #4
Bar #5
Upstream Weir
Cotnments:1. Base soil: Reid Bedford sand2. Density of base soil: 95.7 pcf3. Two thickness, 0.75" and 1.0", were tested.4. Piping occurred at downstream end.5. When the piping reached the first filter, piping behind the first
filter began. The sand was carried through the first filter.6. Piping happened upstream of the filter after the piping reached
the second filter. The second filter also failed to hold the sandbehind the filter.

140TEST 1
DATE: 7 - 1 3 - 8 7
FILTER MATERIAL: 8/30
FILTER THICKNESS:_
BLADDER PRESSURE:
3 inches
5 psi
FILTER LOCATION: 36 inches from downstream reservoir
LENGTH OF PIPE PENETRATION: 12 inches
PERCENT PIPE PENETRATION:
INITIAL PIPE DIAMETER:
33%
inch
LENGTH OF UPSTREAM PIPE:_
INITIAL PIPE DIAMETER:
PERMEABILITY: Hi
14.5 inches
3/8 inch
18.5 onH-7 13.4 cmL.
VAk
8:01.43 minutes1061.2 cm~3929.03 cm" 20.05317 on/s
] 114.3 on apart
DENSITY: mass or care:mass of tare - soil:mass of soil:volume:
23.68 g242.55 g
213.87 g131.87 cnT3
density:
TIME AT START OF TEST: 10:03 am
LOCATION 0? PIPE K
1.660 g/otTS
n n r;—— n« — 15'
initial - 30 cm50 cm
head increase stopped70 era
pipe reached filterhead increase resumedchannel erosion
NOTES:
32.5 cm43.2 cm
48.2 cm52.2 on
25.9 cm33.5 cm
37.3 on39.7 cm
21.3 cm27.1 cm
29.3 cm31.2 on
15.9 cm18.4 cm
19.7 cm20.8 on
81.1 on 59.4 cm 46.3 cm 27.5 on
1) Upstream piping began at the same time as the downstream piping.The pipe clogged itsalf as the transported material was stopped by the filter.
2) At a gradient of 0.70 across the filter channels cut through the depositedmaterial downstream.
3) The downstream pipes breach the filter at a gradient of 0.940.4) This filter material functioned as a filter but was erodable and, therefore,
unsuccessful in stopping pipe progression.
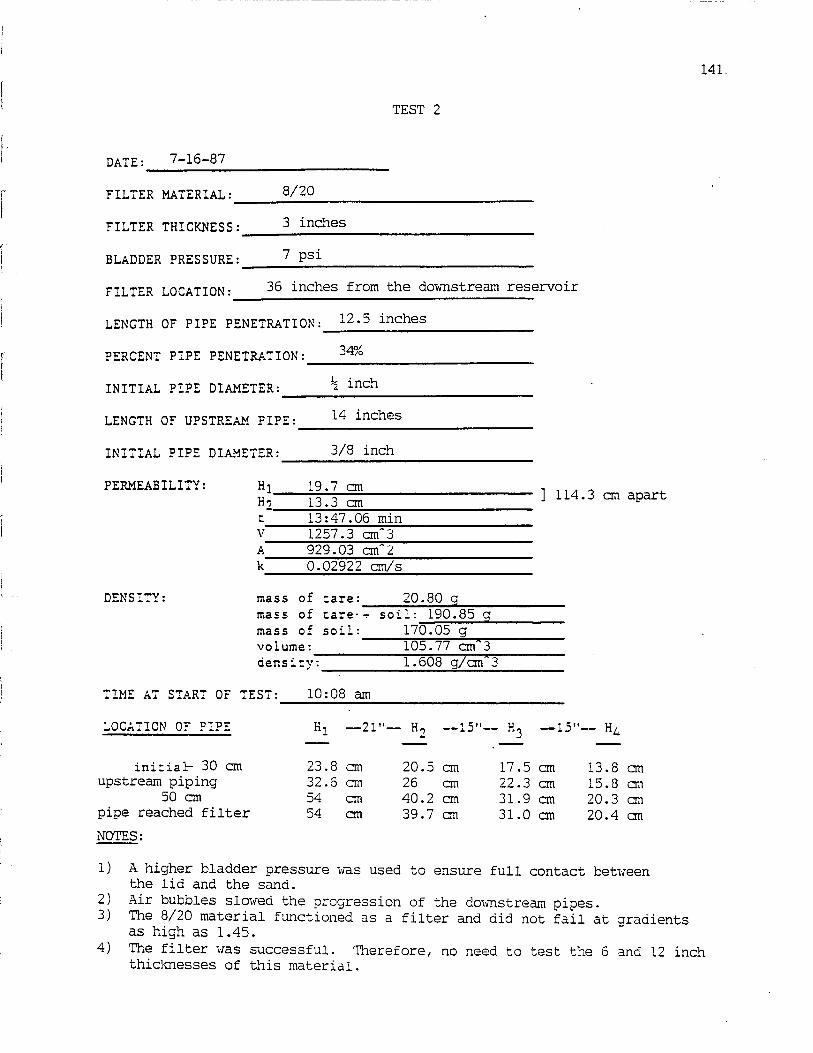
141 _
TEST 2
DATE: 7-16-87
FILTER MATERIAL: 8/20
FILTER THICKNESS:
BLADDER PRESSURED
FILTER LOCATION:
3 inches
7 psi
36 inches from the downstream reservoir
LENGTH OF PIPE PENETRATION: 12'5 inches
PERCENT PIPE PENETRATION :_ 34°°
INITIAL PIPE DIAMETER: inch
LENGTH OF UPSTREAM PIPE:
INITIAL PIPE DIAMETER:
PERMEABILITY:
14 inches
3/8 inch
HIHo^
VAk
19.7 cm13.3 cm13:47.06 mm1257.3 cm~3929.03 cm" 20.02922 cm/s
] 114.3 cm apart
DENSITY: 20.80 gmass of care:mass of tare-f soil: 190.85 gmass of soil: 170.05 gvolume: 105.77 cm"3density:
TIME AT START OF TEST: 10:08 am
LOCATION OF PIPE Hi
1.608 g/on 3
21"— H0 --15"— H. •15'
23.8 cm32.6 cm54 cm54 cm
20.5 cm26 cm40.2 cm39.7 cm
17.5 cm22.3 cm31.9 cm31.0 cm
13.8 cm15.8 cm20.3 cm20.4 on
initial- 30 cmupstream piping
50 cmpipe reached filter
NOTES:
1) A higher bladder pressure was used to ensure full contact betweenthe lid and the sand.
2) Air bubbles slowed the progression of the downstream pipes.3) The 8/20 material functioned as a filter and did not fail at gradients
as high as 1.45.4) The filter was successful. Therefore, no need to test the 6 and 12 inch
thicknesses of this material.

142
TEST 3
DATE: 7-21-87
FILTER MATERIAL: 8/30
FILTER THICKNESS: 12 inches
BLADDER PRESSURE: 5 psi
FILTER LOCATION: 36 inches from the downstream slope
LENGTH OF PIPE PENETRATION: 12 inches
PERCENT PIPE PENETRATION: 33%
INITIAL PIPE DIAMETER: \h
LENGTH OF UPSTREAM PIPE: 6.5 inches
INITIAL PIPE DIAMETER: \h
PERMEABILITY: Hi 22.9cm . ,, n nJ i!4.3 cm apartH? 15.3 cm
CVAk
5:01.651244.7929.030.0668
mmcm" 3cm" 2cm/s
DENSITY: mass of tare: 20.79 qmass of care * soil: 187.71 q
166.92 gvolume: 105.77 arT3dens i cy: 1.578 g/atT3
TIME AT START OF TEST: 10:01 am
LOCATION OF PIPE H, —21"— H? —15"— H3 —15"— H4
initial- 34 cm 38 cm 27.6 cm 26.5 cm 18.9 cmupstream piping 44.3 cm 31.5 on 29.9 on 20.0 cm
70 cm 53.5 cm 37.0 cm 33.6 cm 22.4 onhead increase stoppedpipe reached filter 53.6 cm 37 cm 33.5 on 23.4 onhead increase resumedsheet flow 63.4 on 41.2 cm 19.4 cm 15.4 cm
NOTES:
1) Bladder pressure was increased to 7 psi as sheet flow began to slowfilter erosion.
2) The fines of the filter were easily washed away by the downstreampipes. The filter piped similarly to the 3 inch filter of this material.
3) The gradient across the filter at failure of the filter was 0.265.4) The filter functioned as a filter of the upstream material, but was erodable.
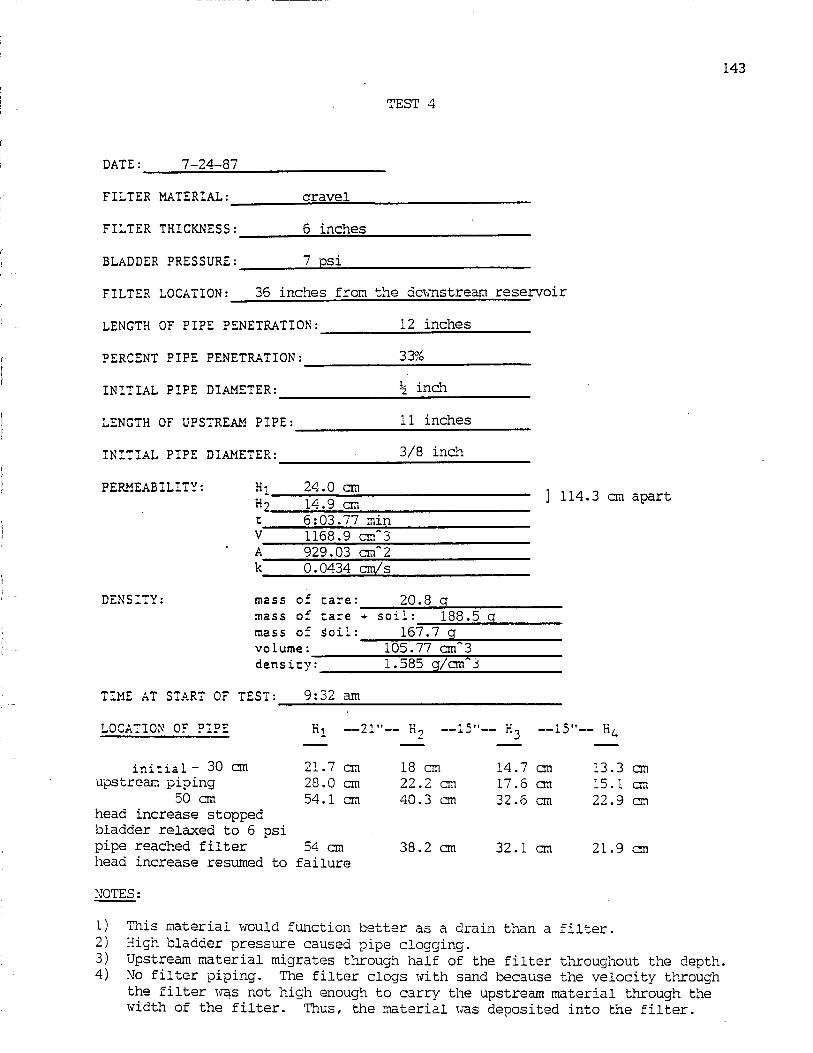
143
TEST 4
DATE: 7-24-87
FILTER MATERIAL: gravel
FILTER THICKNESS: 6 inches
BLADDER PRESSURE: 7 psi
FILTER LOCATION: 36 inches from the downstream reservoir
LENGTH OF PIPE PENETRATION: 12 inches
PERCENT PIPE PENETRATION: 33%
INITIAL PIPE DIAMETER: h inch
LENGTH OF UPSTREAM PIPE: 11 inches
INITIAL PIPE DIAMETER: 3/8 inch
PERMEABILITY: Hi 24.0 cm .J 114.3 cm apartH2 14.9 cm
tVAk
6:03.77 min1168.9 oif3929.03 cm" 20.0434 cm/s
DENSITY: mass of care: 20.8 q188.5 q
mass of Soil: 167.7 gvolume: 105.77 arT3density: 1.585 g/CKT3
TIME AT START OF TEST: 9:32 am
LOCATION OF PIPE K, —21"— K ? —15"— K, —15"— H L,
initial- 30 on 21.7 cm 18 cm 14.7 cm 13.3 cmupstream piping 28.0 cm 22.2 cm 17.6 cm 15.1 cm
50 cm 54.1 cm 40.3 cm 32.6 on 22.9 cmhead increase stoppedbladder relaxed to 6 psipipe reached filter 54 cm 38.2 on 32.1 cm 21.9 cmhead increase resumed to failure
NOTES;
1) This material would function better as a drain than a filter.2) High bladder pressure caused pipe clogging.3) Upstream material migrates through half of the filter throughout the depth.4) No filter piping. The filter clogs with sand because the velocity through
the filter was not high enough to carry the upstream material through thewidth of the filter. Thus, the material was deposited into the filter.

144
TEST 5
DATE: 7-28-87
FILTER MATERIAL: gravel
FILTER THICKNESS: 3 inches
BLADDER PRESSURE: 5 psi
FILTER LOCATION: 49 inches from the downstream reservoir
LENGTH OF PIPE PENETRATION: 13 inches
PERCENT PIPE PENETRATION: 26%
INITIAL PIPE DIAMETER: % inch
LENGTH OF UPSTREAM PIPE: None
INITIAL PIPE DIAMETER: N/A
PERMEABILITY: Hi 25.2 cm] 114.3 cm apartH? 15.5 cm
tVAk
8:43.152065.6929.030.0501
minorf 3cm" 2cm/s
DENSITY: mass of tare: 23.6 qmass of care + soil: 230.45 qmass of soil: 206.45 gvolume: 131.87 cm 3density: 1.568 g/cm 3
TIME AT START OF TEST: 9:30 am
LOCATION OF PIPE Hi —21"— Ho —15"— K3 —15"—
initial- 30 cm 36.2 cm 32.2 cm 25.5 cm 18.6 cm50 cm 48 cm 42.2 cm 31.5 cm 20.4 cm
head increase stopped80 cm 52 cm 46.9 on 34.7 cm 22.6 on
head increase resumedpipe reached filter 65 cm 23.8 cm 16.7 cm
NOTES:
1) The head falls as the pipes reach the filter because the water and upstreammaterial is flowing freely through the filter.
2) The upstream material flows into the filter, and the filter fails bycomplete migration of the upstream material through the filter.
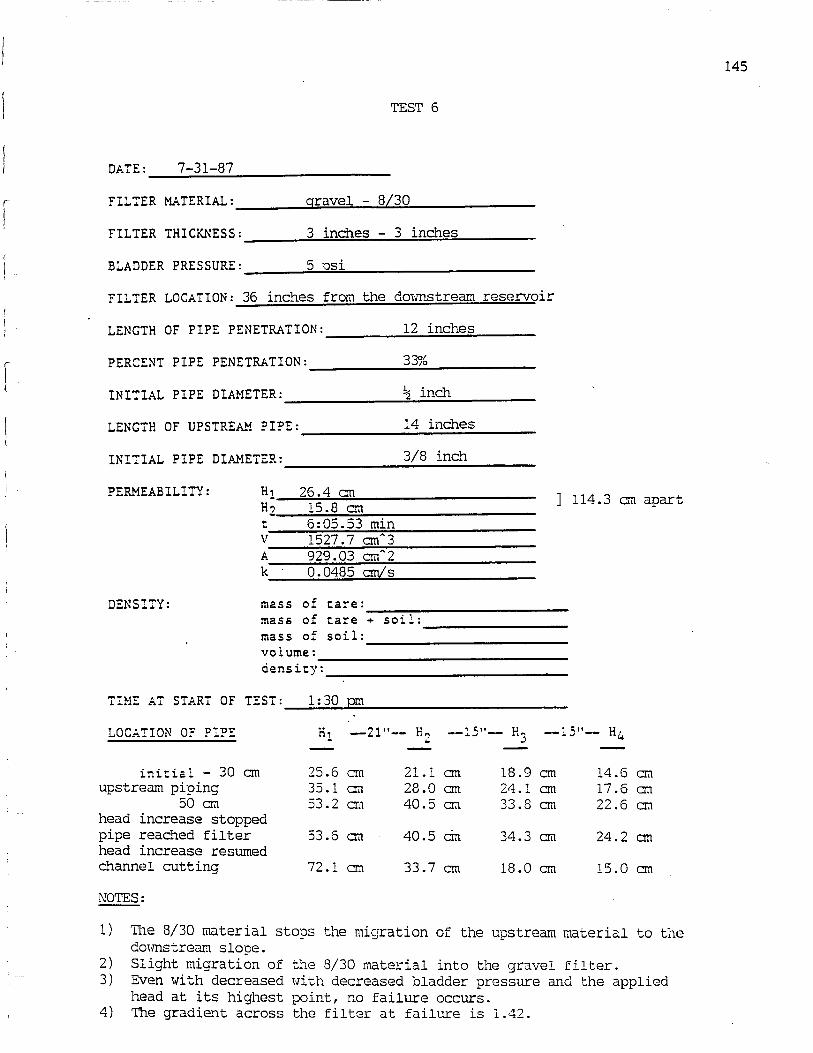
145
TEST 6
DATE: 7-31-87
FILTER MATERIAL: gravel - 8/30
FILTER THICKNESS: 3 inches - 3 inches
BLADDER PRESSURE: 5 psi
FILTER LOCATION: 36 inches from the downstream reservoir
LENGTH OF PIPE PENETRATION: 12 inches
PERCENT PIPE PENETRATION: 33%
INITIAL PIPE DIAMETER: \h
LENGTH OF UPSTREAM PIPE: 14 inches
INITIAL PIPE DIAMETER: 3/8 inch
PERMEABILITY: HiH?CVAk '
26.4 on15.8 on6:05.53 min1527.7 on" 3929.03 cnf 20.0485 cm/s
] 114.3 on apart
DENSITY: mass of care:mass of tare •*• soil:mass of soil:volume:dens i cy:
TIME AT START OF TEST: 1:30 pm
LOCATION OF PIPE K, —21"— H? —15"— H, —15"— H
initial - 30 on 25.6 cm 21.1 cm 18.9 on 14.6 cmupstream piping 35.1 cm 28.0 cm 24.1 cm 17.6 on
50 crc 53.2 era 40.5 era 33.8 cm 22.6 cmhead increase stoppedpipe reached filter 53.6 on 40.5 cm 34.3 on 24.2 onhead increase resumedchannel cutting 72.1 cm 33.7 cm 18.0 cm 15.0 cm
NOTES:
1) The 8/30 material stops the migration of the upstream material to thedownstream slope.
2) Slight migration of the 8/30 material into the gravel filter.3) Even with decreased with decreased bladder pressure and the applied
head at its highest point, no failure occurs.4) The gradient across the filter at failure is 1.42.

146TEST 7A
DATE: 8-28-87
FILTER MATERIAL: 8/20 (30/65 base soil)
FILTER THICKNESS: 3 inches
BLADDER PRESSURE: 7 psi
FILTER LOCATION.-36 inches from the downstream reservoir
LENGTH OF PIPE PENETRATION: 12 inches
PERCENT PIPE PENETRATION: 33%
INITIAL PIPE DIAMETER: 3/8 inch
LENGTH OF UPSTREAM PIPE: 14.5 inches
INITIAL PIPE DIAMETER: 3/8 inch
PERMEABILITY: HIK?
cVAk
29.6 on17.1 on1:55.71 rain1355.2 orf3929.03 otf 20.1153 on/s
] 114.3 on apart
DENSITY: mass of care: 20.80 qmass of care - soil: 184.67 qmass of soil: 163.87 g.volume: 105.77 cm 3density; 1.549 q/cm 3
TIME AT START OF TEST: 10:00 am
LOCATION OF PIPE K-, —21"— H0 —15"— K, —15"— H4
initial- 30 cm 34.6 cm 27.9 on 23.0 cm 17.0 cmupstream piping 53.9cm 41.7 on 33.0cm 21.4cm
50 a*1 63.1 cm 47.6 cm 36.6 cm 21.6 cmhead increase stopped5 cm before filter - bladder pressure lowered to 6 psi and head increased
NOTES:
1) The 30/65 base soil piped uniformly and very straight, progressingquickly. The soil flows very easily and becomes sheet flow 'beforethe initial pipe reaches the filter.
2) The bladder pressure vas lowersd because the pipes were fillingreaching the filter.
3) The filter collapsed due to excessive erosion of the base soil andlack of support.

147
TEST 7B
DATE: 9-1-87
FILTER MATERIAL: 3/20 (30/65 base soil)
FILTER THICKNESS: 3 inches
BLADDER PRESSURE: 7 psi
FILTER LOCATION: 21 inches from the downstream reservoir
LENGTH OF PIPE PENETRATION: 8 inches
PERCENT PIPE PENETRATION: 38%
INITIAL PIPE DIAMETER: 3/8 inch
LENGTH OF UPSTREAM PIPE: 17 inches
INITIAL PIPE DIAMETER: 3/8 inch
PERMEABILITY: HIH2
CVAk
19.513.32:17868.929.
cmcm
.98 min7 orf 303 cm" 2
0.1249 on/s
] 114.3 cm apart
DENSITY: mass of tare: 23.7 gmass of tare - soil: 229.5 qmass of soil: 205.8 gyolume: 131.87 aiT3density: 1.5606 g/cm 3
TIME AT START OF TEST: 9:45 am
LOCATION OF PIPE H: —21"— K2 —15"— F>3 —15"— K4
initial - 8 inches 36 cm 29 cm 27.8 cm 17.9 on35 cm 59.1 cm 46.2 cm 34.1 cm 24.9 cm45 on 63.7 on 50 cm 36.8 cm 27.2 cm
head increase stopped48 an 63.7 cm 51 cm 36.8 cm 27.1 cm
head increase resumed
NOTES;
1) Filter failed again as a result of loss of support.2) The results were identical to that of Test 7a.