evaluation of feedback mechanisms to improve water and
TRANSCRIPT

Evaluation of Feedback Mechanisms to Improve Water and Sanitation Service Delivery in Informal Settlements in Cape Town
Date: 04/26/2021Client: City of Cape TownTeam: Crystal Avila, Alvaro Contente, Pankti Dalal, Hiroaki Ishihara, Mihir MullothInstructor: Daniel Shemie
1

MEET OUR
TEAMAlvaro ContenteProject ManagerSantiago, Chile
Hiroaki IshiharaSIPA LiaisonTokyo, Japan
Mihir MullothDeliverable Editor
Scranton, USA
Pankti DalalField Work Coordinator
Mumbai, India
Crystal AvilaClient Liaison
New York, USA
Daniel ShemieSupervisor
New York, USA
2

Under the United Nations Sustainable Development Goals, Goal Six highlights the importance of ensuring availability and sustainable management of water and sanitation for all. In 2018, Cape Town, South Africa became known as the city that almost ran out of water. Our research found that the group most disproportionately affected are residents living in informal settlements. Yet, the number of water and sanitation complaints received by the City of Cape Town from formal settlements is six times higher than those received from informal settlements.
In this context, the City of Cape Town, South Africa has tasked the Columbia Capstone team with providing informed recommendations on how to improve customer feedback and City responsiveness for the effective provision of water and sanitation services in informal settlements. The team utilized a variety of qualitative and quantitative assessments in order to determine its ultimate recommendations.
3
Executive Summary 1/2The team designed the project around three guiding researching questions, them being:
1. What is the current status quo of WASH feedback mechanisms for informal settlement residents in Cape Town?
2. How can the City of Cape Town increase community adoption and participation of WASH feedback mechanisms within informal settlements?
3. How can the City of Cape Town increase internal capacity and improve performance with regards to its WASH feedback mechanisms?
Specifically, the team utilized a methodology consisting of desk research, stakeholder interviewing and customer surveying to develop recommendations. The main findings of the project highlighted that improving accessible communication channels, stakeholder partnership, community awareness, context-specific problem-solving, and data management processes have the greatest potential to increase the success of service delivery feedback in informal settlements in the City of Cape Town.

The team generated recommendations intended to increase community adoption and participation as well as increase internal capacity and improve performance.
1. Councillor Code: Complaints reported to local councillors are not directly registered in the formal service management system. Therefore, by registering complaints with the constituency code of the local councillors, the elected representatives would be able hold the city administration accountable and be active players in service delivery.
2. Toll-Free Number: By providing a toll-free number the city would further be able to bolster the number of complaints received and therefore increase access to disadvantaged groups in seeking grievance redressal.
3. Develop Customer-Centric KPIs: Creating key performance indicators built within the C3 system can help the City of Cape Town better analyze the data they receive and adapt current processes to be more responsive to the community. That would allow the executive leadership to transition from an anecdotal to a quantitative decision making process.
4. Increase Interdepartmental Communication: Several departments and divisions are involved in the delivery of basic services. Creating efficient lines of communication and investing in collaboration with other departments providing basic services can minimize redundancies and incentivize the sharing of innovations.
5. Invest in Overall Capacity Building: Due to the expansion of informal settlements, increasing overall capacity and staffing can greatly reduce the burden and increase the overall ability to deliver quality services. An expansion of the janitorial services through the EPWP is one possible solution to consider to combat this growing issue.
4
Executive Summary 2/2

5
Table of ContentsBackground 6
Methodology 12
Main Findings 23
Stakeholder interviews 24
Process Mapping 27
Customer Survey 35
Desk Research 39
Case Studies 42
Recommendations 50
Ideating Solutions 51
Key Recommendations 54

01BACKGROUND
6

A Tale of Two Cities
7
Cape Town is the legislative capital and the second most populated city in South Africa. In South Africa, every person has a constitutional right to safe water and sanitation. It is an institutional obligation for the government to provide adequate and safe access to basic services. This provision originates from the country’s colonial past, where historically marginalized communities were cut off from essential services under the apartheid rule.
Today, around 12% of the residents in Cape Town live in informal settlements. Similar to the economy, the urban landscape of the city is deeply divided; low-income neighborhoods tend to have large populations of residents who continue to face infrastructure barriers. This difference is shown in the figure on the right, where it can be seen that areas with higher concentration of informal settlements fall behind in terms of WASH infrastructure and overall access.
Moreover, townships are not all the same either, including in terms of quality of WASH services. These particularities have been recognized by the City in its discourse, but remain a challenge in the City’s approach and actions to the informal settlements’ situation.
Figure: Percentage of Access to Water Data Source: City of Cape Town
*Customer Perception and Satisfaction Survey 2017/18, Results Report by Department of Water and Sanitation, City of Cape Town (August 2019).

Varying Levels of Access
8
Sources:(1) Brookings Global Monitor Report 2014(2) Own elaboration from CCT (2016) - Enumeration Report: Kosovo Informal Settlement Pocket, (3) Geopol - Mobile penetration in South Africa (2021)(4) Clark et al (2016) - Improving Service Delivery to Informal Settlements through Data
Management, Water Services and Urban Water Cycle(5) ITWeb - SA smartphone penetration now at over 80%, says ICASA(6) World Bank - Mobile Usage at the Base of the Pyramid in South Africa
South Africa’s income inequality is a pervasive force that hinders access and quality to a variety of services for the less privileged. Moreover, Cape Town’s Water and Sanitation department experiences an overarching conundrum: the growth of informal settlements outpaces the department’s capacity and resources.
Given that technological penetration has broken the access barrier set by inequality (see table on the left), every project targeting informal settlements should consider what role technology and ICTs can play to improve outcomes. As stated in World Bank’s International Bank for Reconstruction and Development “mobile ownership at the base of the pyramid level in South Africa is relatively high compared to other African countries and tracks the rest of the pyramid access and usage patterns very closely” (6).
Comparison of selected demographics and technology penetration to city average and informal settlements in Cape Town
Indicator CCT average Informal settlements
GDP per capita (ZAR PPP) $439,410 (1) $69,788* (2)
Mobile phone usage 95%* (3) 94%* (4)
Smartphone usage 82%* (5) 63%* (4)
* Value is a proxy, taken from similar group or population.
9
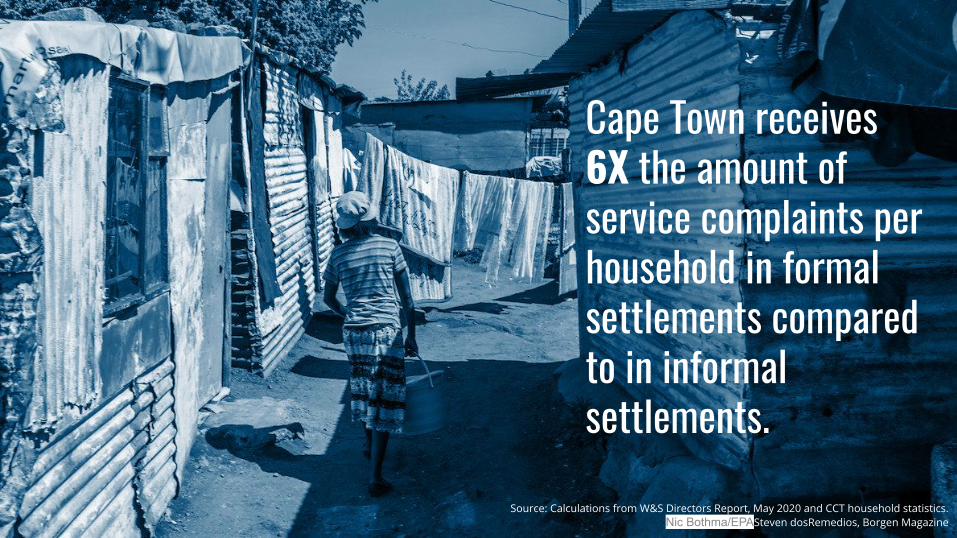
Cape Town receives 6X the amount of service complaints per household in formal settlements compared to in informal settlements.
Source: Calculations from W&S Directors Report, May 2020 and CCT household statistics. Nic Bothma/EPASteven dosRemedios, Borgen Magazine
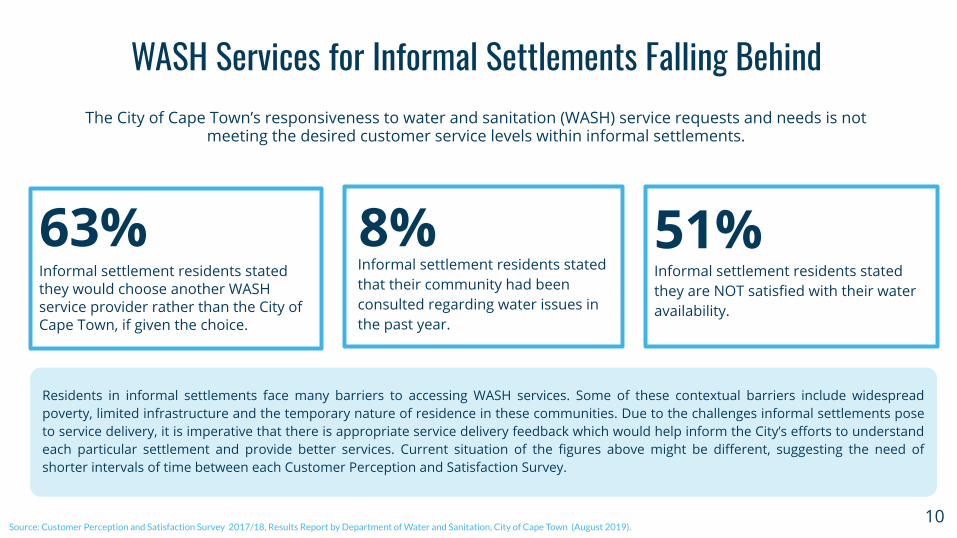
Informal settlement residents stated they would choose another WASH service provider rather than the City of Cape Town, if given the choice.
63%Informal settlement residents stated that their community had been consulted regarding water issues in the past year.
8%
The City of Cape Town’s responsiveness to water and sanitation (WASH) service requests and needs is not meeting the desired customer service levels within informal settlements.
Source: Customer Perception and Satisfaction Survey 2017/18, Results Report by Department of Water and Sanitation, City of Cape Town (August 2019).
WASH Services for Informal Settlements Falling Behind
10
51%Informal settlement residents stated they are NOT satisfied with their water availability.
Residents in informal settlements face many barriers to accessing WASH services. Some of these contextual barriers include widespread poverty, limited infrastructure and the temporary nature of residence in these communities. Due to the challenges informal settlements pose to service delivery, it is imperative that there is appropriate service delivery feedback which would help inform the City’s efforts to understand each particular settlement and provide better services. Current situation of the figures above might be different, suggesting the need of shorter intervals of time between each Customer Perception and Satisfaction Survey.
12% of Cape Town residents live in informal settlements, but only constitute 5% of total water consumption*
5%

Little Feedback Yields Fewer Results
11
Incomplete Customer Feedback
Non-performing Assets (Taps, Toilets,
Pipes)
Poor Services and Higher Maintenance
Costs for CCT
Source: Future Cities, October 2020.
The lack of service feedback allows for WASH service assets (such as toilets, water taps, and pipes) to become non-performing. This happens because as assets become damaged, there are no efficient feedback services that allow for employees to fix these assets. This results in poor WASH services overall for residents of informal settlements and higher maintenance costs for the City of Cape Town.
The graph on the left compares the percentage of functional vs. nonfunctional assets in selected settlements, as reported by the Future Cities initiative in October 2020. It can be seen that while for a majority of the settlements most of the installed assets are working, there are also some settlements with a concerning level of stranded assets. Since the current service ratio targets that the City keeps relates to the installed capacity and not with the working capacity, getting more complete customer feedback would give the city a better understanding of the actual service levels it is providing.
Functional assets in selected informal settlements of Cape Town

02METHODOLOGY
12Image source: Nic Bothma/EPA

How can the City of Cape Town increase internal capacity and improve performance?
03 ● Targeted Interviews with Staff at the Water & Sanitation Department
● Background Literature Review
How can the City of Cape Town increase community adoption and participation?
02● Targeted interviews with Informal Settlement Residents● Background Literature Review● Case Study Analysis
What is the Current Status Quo of Cape Town?
● End-to-end Process Mapping● Targeted Interviews with Civil Society● Background Literature Review
01
13
Guiding Research QuestionsDrawing from the Terms of Reference, the Columbia consulting team devised three guiding research questions to drive
the engagement process.
14
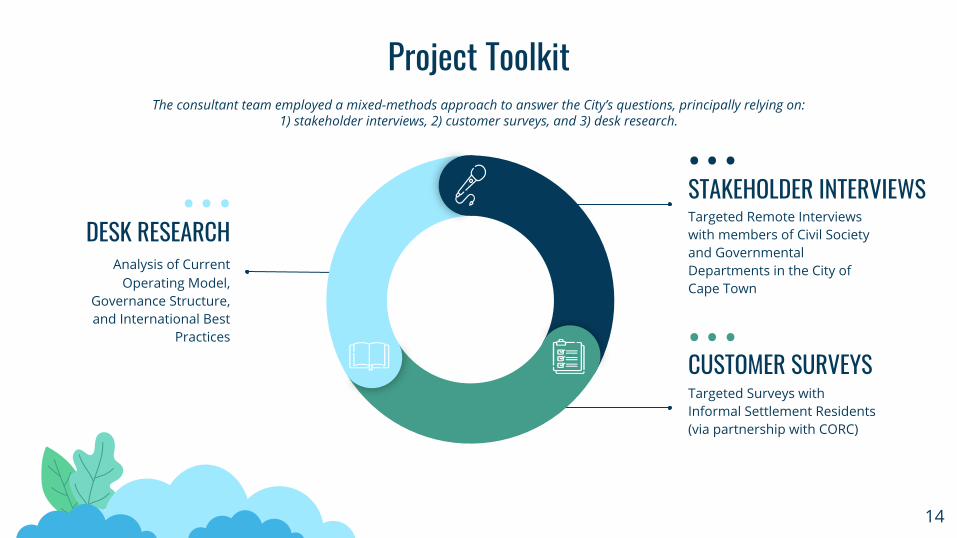
Project Toolkit
DESK RESEARCH Analysis of Current
Operating Model, Governance Structure, and International Best
Practices
STAKEHOLDER INTERVIEWSTargeted Remote Interviews with members of Civil Society and Governmental Departments in the City of Cape Town
CUSTOMER SURVEYSTargeted Surveys with Informal Settlement Residents (via partnership with CORC)
The consultant team employed a mixed-methods approach to answer the City’s questions, principally relying on: 1) stakeholder interviews, 2) customer surveys, and 3) desk research.
15
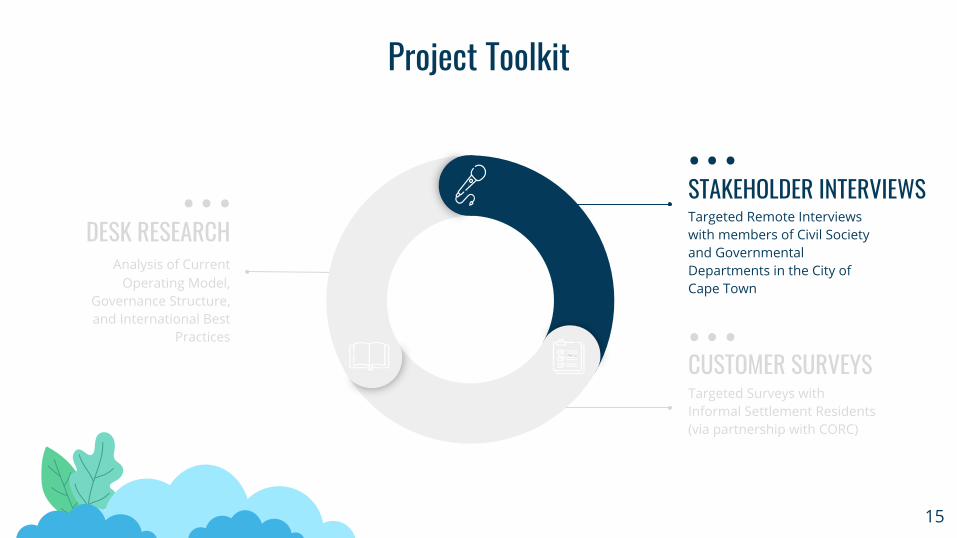
Project Toolkit
DESK RESEARCH Analysis of Current
Operating Model, Governance Structure, and International Best
Practices
STAKEHOLDER INTERVIEWSTargeted Remote Interviews with members of Civil Society and Governmental Departments in the City of Cape Town
CUSTOMER SURVEYSTargeted Surveys with Informal Settlement Residents (via partnership with CORC)

16
CSOs/NGOs/Consulting Firms
3 INTERVIEWEES
Academics & International Dev.
Organizations
2 INTERVIEWEES
It Takes a Village14 individuals were interviewed across sectors, with a primary focus on City government staff. A full list of
interviewees is included in the Appendix.
City of Cape Town Government Staff
9 INTERVIEWEES

17
Project Toolkit
DESK RESEARCH Analysis of Current
Operating Model, Governance Structure, and International Best
Practices
STAKEHOLDER INTERVIEWSTargeted Remote Interviews with members of Civil Society and Governmental Departments in the City of Cape Town
CUSTOMER SURVEYSTargeted Surveys with Informal Settlement Residents (via partnership with CORC)

Customer Surveys
18
Although the City conducts its own Customer Satisfaction Survey (CSS) (the most recent being the 2017/2018 report), the consulting team developed its own survey to assess the current situation of feedback mechanisms in informal settlements. These results would then be compared with the ones from the previous CSS report to gain perspective on what the residents’ main concerns are.
Utilizing feedback gathered from the stakeholder interviewing process, the consultant team reached out to the nonprofit Community Organisation Resource Centre (CORC) in order to partner with them for this project. CORC has extensive experience working in informal settlements on issues such as evictions, basic services and citizenship. The organization also has a high level of technical expertise in survey data collection.
The mandated surveys were conducted in four different informal settlements with around 50 residents from each settlement. The following are the main demographics of the participants:
● 6% were community leaders.● 65% household’s heads and an additional 12% of partners/spouses of the household heads.● 65% females.
19
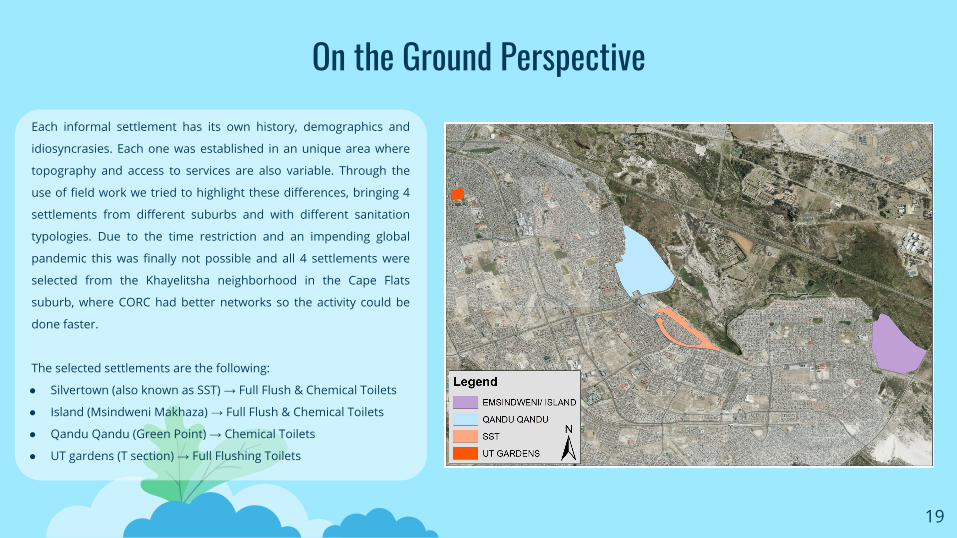
On the Ground PerspectiveEach informal settlement has its own history, demographics and
idiosyncrasies. Each one was established in an unique area where
topography and access to services are also variable. Through the
use of field work we tried to highlight these differences, bringing 4
settlements from different suburbs and with different sanitation
typologies. Due to the time restriction and an impending global
pandemic this was finally not possible and all 4 settlements were
selected from the Khayelitsha neighborhood in the Cape Flats
suburb, where CORC had better networks so the activity could be
done faster.
The selected settlements are the following:
● Silvertown (also known as SST) → Full Flush & Chemical Toilets
● Island (Msindweni Makhaza) → Full Flush & Chemical Toilets
● Qandu Qandu (Green Point) → Chemical Toilets
● UT gardens (T section) → Full Flushing Toilets

20
Project Toolkit
DESK RESEARCH Analysis of Current
Operating Model, Governance Structure, and International Best
Practices
STAKEHOLDER INTERVIEWSTargeted Remote Interviews with members of Civil Society and Governmental Departments in the City of Cape Town
CUSTOMER SURVEYSTargeted Surveys with Informal Settlement Residents (via partnership with CORC)

Desk Research: Process Mapping
21
Compile
Compile information about currently
available communication
channels.
Test
Personally testing feedback channels +
interviewing city officials & stakeholders about
each process.
Map Out
Visualize the workflow of complaint processing
from the viewpoint of residents (primarily
front end).
Insights
Identify Pain Points that can contribute to
feedback improvement.
Given the sheer number of customers the City has, it is only reasonable to make use of every technological channel available to connect with them. However, for the ease they
provide, these mechanisms also entail intrinsic communication difficulties to users which relate to culture, education and preconceived notions. In light of the Design Thinking
methodology, the consulting team mapped each feedback channel process with the purpose to foreshadow possible bottlenecks and pain points that may appear when informal
settlements’ residents contact the City. In the figure below, it can be seen the 4 steps the consulting team took to accomplish these mappings.

MajiVoice, Nairobi, Kenya
Stellenbosch, South Africa
CCRS, Mumbai, India
The consultant team looked at over 17 academic research papers and case studies that concerned with providing effective service delivery and feedback mechanisms in informal settlements. Given that developing countries around the world face a rapidly urbanising population and limited resources, the following criteria was used to find best practices from cities around the world that would be relevant and replicable to Cape Town.
CRITERIA:
● Countries: Developing Economies
● City Population: Metropolis over 3M, Income Inequality
● Services: Basic (WASH, Electricity, Waste)
● Years: 2010 - 2021Chile Barrio, Chile
Insights from Around the World
22
SLB-Connect, India CFMP, Pakistan

03MAIN FINDINGS
23Image source: Associated Press

24
Project Toolkit
DESK RESEARCH Analysis of Current
Operating Model, Governance Structure, and International Best
Practices
STAKEHOLDER INTERVIEWSTargeted Remote Interviews with members of Civil Society and Governmental Departments in the City of Cape Town
CUSTOMER SURVEYSTargeted Surveys with Informal Settlement Residents (via partnership with CORC)

25
“In informal settlements, the approach we’ve been using is not optimal. We’ve been treating these settlements as temporary...but our view is that actually these informal settlements aren’t going to go away. If anything they’re going to grow..so we need to shift the way we’re actually servicing these informal settlements to recognize them as permanent and allow for more formal servicing to take place.” - City of Cape Town Staff
“Informal settlements have riots. Then and now it affects us to send in teams to work because whatever is happening in the area is not safe. And also the vandalism of our infrastructure. Currently we’ve got 25 pump stations that are vandalized...Now we first need to fix the pump stations, which is costing more than 2.5 million per pump station. So that is the huge challenge we are facing.” - City of Cape Town Staff
“The amount of new structures entering informality far outstrips our current ability to provide services at that scale. So we really are fighting a losing battle in terms of the amount of settlements and the amount of sanitation we are able to provide in the interim.” - City of Cape Town Staff
During the interviews with City government staff, a recurring theme surfaced regarding how macro-level
population trends are straining government capacity. Informal settlements
show rapid growth which has only been exacerbated by the COVID-19 pandemic,
with settlements sprouting up in new locations around Cape Town, including on
private land or land not suitable for habitation. Paired with persistent safety
and vandalism concerns within these communities, the challenge of adequately
servicing residents within informal settlements extends beyond the Water & Sanitation department and is outpacing
City staffing and resources.

“...while we have perhaps the technical acumen to design and implement
projects, it’s always doing something on behalf of communities, and not
necessarily working with communities to find
solutions.”

There are several communication channels available for Cape Town residents. However, none of them were designed specifically for informal settlements customers.
When communication channels are tailored to successfully reach informal settlements’ residents, then customers feel as though officials want to hear their concerns, which increases trust in the city government.
It is critical for the communication channels to be not only reliable but accessible to the populations that will use them. Therefore, the consulting team analyzed selected communication channels. Through this process mapping and stakeholder interviews, we identified several pain points and insights to improve the system.
27
Communication is EssentialFindings from Feedback Channels’ Process Mapping

WebsiteEmail SMS
Janitors in the Field
WhatsApp/CT app
Call Center
Check IT app
● Currently not used well
● User interface issue
● Not currently available
● Reported by Field Workers hired by NGO
● On going in 3+ settlements
● Can’t Verify Information
● One way Communication
● Most Requests Come from Calls or Reports to Janitors
● 2-way Communication
● Rarely Used
Easily Available, Logistically Difficult, Currently Not AvailableSource: Diagram based on materials provided by CCT and team's assumptions.
non-official/temporary path
Local Representative
Walk-in Centres /
Mobile Offices
● Limited location● Calls are free
● Highly influenced by politics.
Civil Society/NGO
● Submit complaints on behalf of residents
Current Feedback Channels
28
● Preferred because face-to-face comm.
One part of our analysis entailed recreating the process of submitting complaints from a user perspective for each of the feedback channels.

Sources: 1) CUSTOMER PERCEPTION AND SATISFACTION SURVEY 2017/18.2) Customer experiences and perceptions of Water and Sanitation services in Informal Settlements (2020).3) https://mybroadband.co.za/news/cellular/281759-the-cheapest-way-to-make-a-voice-call-in-south-africa.html
Call Center
29
Customer Needs to Submit a Complaint
Search for Call Center Number(086 010 3089)
Call and Talk with Call Center Operator Backend Process Check the Status
through Call
Call centre number could be more readily available in the City’s website.
Process Map #1
After a complaint is submitted, only the Call Center operator can communicate back directly with the customer, but not the other way around, leaving residents unable to easily check the status of the complaint.
187 Free call lines are available in municipal buildings and mobile offices (as per 2019)
Call fee is paid by the customer
Single number for all issues means more time waiting to be directed to corresponding operator
Operator manually inputs complaint to C3 system → possibility of human error
Operator needs to locate the faulty asset only through conversation and geographical cues provided by the customer
Client cannot easily track the status of the complaint
Could the call centre automatize the process of status checking (having a automatic message once the customer enters the tracking number)
Specially useful for people that don’t have a smartphone, but then how do they find where to call?
Finding the number partially depends on how technologically literate is the client.
Single-window for all call requests Average WASH related call
takes 3 minutes and it cost ~R 4.5.

30
Customer Needs to Submit a Complaint
Search for email Address Send Complaint Backend Process Check the Status
through Email
May be useful to discourage this channel in favor of others more easily manageable for the City (webform?)
Process Map #2
While a convenient channel, lack of uniformity from customer emails makes it difficult to respond to complaints made in this manner
The client can submit complementary information to accurately locate the asset or show the fault (images, Google Maps, etc.)
There are no instructions on the required information to submit a complaint through this channel
Operator manually inputs complaint to C3 system → possibility of human error
Client cannot easily track the status of the complaint
How is inbox being managed by the Customer Services Dept.?
Several email addresses are available in the City’s website, not single-window
Are auto-replies providing sufficient status feedback?
Replies from operators take more time than other channels.

SMS
31
Customer Needs to Submit a Complaint
Search for SMS Number (31373) Send Complaint Backend Process Check the Status
through Call
May be useful to discourage this channel in favor of others more easily manageable for the City (webform?)
Process Map #3
SMS is one of the most commonly used feedback channels within informal settlements in Cape Town, although it is lagging behind compared with more modern tools available
This mechanism is seen by the city as more useful for one-way communication from the city to residents (i.e. notice of planned interruptions)
Required data in the SMS: 1) Issue, 2) Physical Address, 3) Name of Resident. (there are no address for informal settlements)
Operator manually inputs complaint to C3 system → possibility of human error
Different numbers for WASH and electricity
Max length of message of 160 characters may be insufficient
Approximate cost of sending an SMS message: R0.5, WhatsApp is much cheaper
When message doesn’t come with required information, operator calls back the client
Reference number is given which can be used later on by client
Is it possible to provide clients the chance to check status without incurring in the cost of a call

Website
32
Customer Needs to Submit a Complaint
Search Link to web form Complete the form
QR codes in assets, mobile offices and municipal buildings could possibly make access easier
Process Map #4
Informal settlements’ residents should be able to specify their location
One of the cheapest options available currently as internet use is cheaper than SMS and calls at this time
Drop-down lists have too many options
Web form is hard to find through web search
Map feature is too difficult to use and too slow
No possibility to select an asset in informal settlements, no address.

Reporting to Janitors in the Field
33
Customer Needs to Submit a Complaint Search for Janitor Report to Janitor Backend Process Check the Status
through Janitors
Janitors could be trained to teach residents about other ways of submitting complaints
Process Map #5
Reporting complaints directly to janitors is one of the most commonly used feedback channels within informal settlements. Janitors are often residents of informal settlements themselves and are trusted in their
communities.
Janitors might not be able to check the issue immediately
Depends on availability of janitor, there is no regular schedule to reach them
Should the City give economic incentives to the janitors to gather more complaints?
Janitors must relay complaints to supervisor, who calls the Call Center to submit it
Checking status through Janitors might interrupt their work
Sometimes janitors fix the issue immediately, not submitting the complaint in the C3 system later on → less legibility for the City officials
Janitors are not present in all settlements (depends on the toilets being used)

Feedback Service Pain Points
34
Common Pain Points Gathered by this Analysis:
● Geolocation is a major need in informal settlement areas.
● Inability to interact with customers reduces the opportunity to receive quality feedback and optimize service delivery
● While there are current efforts to address this, as it stands, much information is lost through miss or under communication between collaborating departments.
Hard to find the location of the service requests.
1 Geolocation
Often cannot re-engage with complaint filing customers
Two-Way Communication2
Lack of in-house complaint management within the W&S department
Siloed Corporate Communications3

35
Project Toolkit
DESK RESEARCH Analysis of Current
Operating Model, Governance Structure, and International Best
Practices
STAKEHOLDER INTERVIEWSTargeted Remote Interviews with members of Civil Society and Governmental Departments in the City of Cape Town
CUSTOMER SURVEYSTargeted Surveys with Informal Settlement Residents (via partnership with CORC)

Summary StatisticsThe following are the key statistics of the consulting team survey process conducted by CORC in
Cape Town informal settlements.
36
Settlement Name Frequency Percent
Emsindweni/Island 85 37,6%
Qandu-Qandu 44 19,5%
SST 32 14,2%
UT Gardens 65 28,8%
Total 226
Relationship to the Household Frequency Percent
Household head 148 65,5%
Child of household head 41 18,1%
Partner of household head 15 6,6%
Spouse of household head 13 5,8%
Dependent of household head 6 2,7%
Boarder/Non relative 3 1,3%
Sex of respondent Frequency Percent
Female 147 65,0%
Male 79 35,0%
Total 226
Percentage of people that know that they can report issues to
WASH dept.
Emsindweni/Island 97,6%
Qandu-Qandu 93,2%
SST 90,6%
UT Gardens 92,3%
Variance 0.0009
Based on the results for the question “Did you know you can report issues with the
water & sanitation services to the City?” we can infer that the results are consistent
across the different informal settlements surveyed.
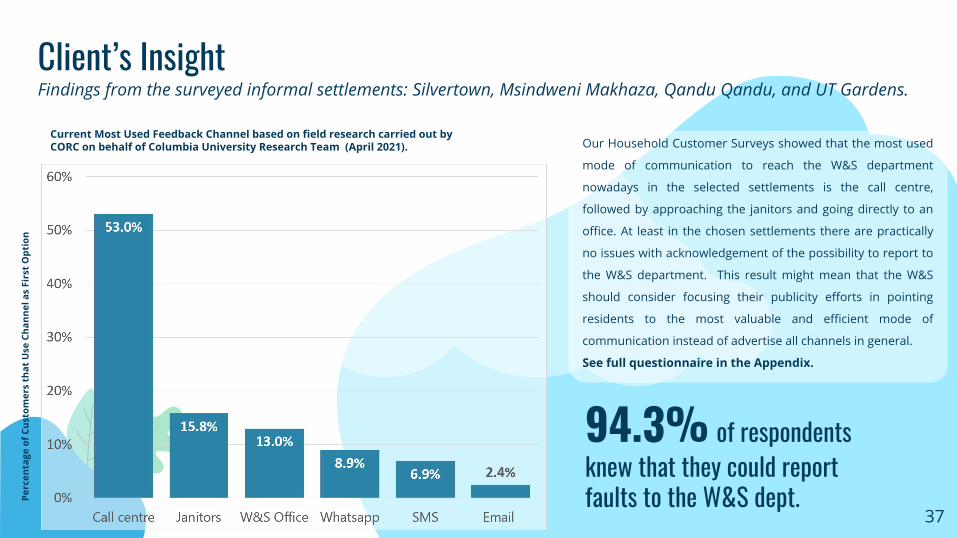
Client’s InsightFindings from the surveyed informal settlements: Silvertown, Msindweni Makhaza, Qandu Qandu, and UT Gardens.
37
Our Household Customer Surveys showed that the most used
mode of communication to reach the W&S department
nowadays in the selected settlements is the call centre,
followed by approaching the janitors and going directly to an
office. At least in the chosen settlements there are practically
no issues with acknowledgement of the possibility to report to
the W&S department. This result might mean that the W&S
should consider focusing their publicity efforts in pointing
residents to the most valuable and efficient mode of
communication instead of advertise all channels in general.
See full questionnaire in the Appendix.
94.3% of respondents knew that they could report faults to the W&S dept.
Current Most Used Feedback Channel based on field research carried out by CORC on behalf of Columbia University Research Team (April 2021).
Perc
enta
ge o
f Cus
tom
ers
that
Use
Cha
nnel
as
Firs
t O
ptio
n

Heard Around TownThe challenges highlighted by residents mirror the reforms they desire.
38
Voiced Challenges Wanted Reforms
There were open ended questions in the surveys conducted by CORC. When asked about challenges and wanted reforms, customers expressed the following themes, a majority of which relate simply to better customer service communications

Communication that Generates TrustFindings from CORC Surveys Contrasted with Customer Satisfaction Report 2017/2018
Sources: Field research carried out by CORC on behalf of Columbia University Research Team (April 2021) and Customer Perception and Satisfaction Survey (CPSS) 2017/18, Results Report by Department of Water and Sanitation, City of Cape Town (August 2019). Field report only includes councilors for the CPSS.
One important finding from the customer surveying is that the preferred modes of communication for residents are those that allow two-way communication, such as field reports and calling by phone. The graph on the right compares the results for preferred channels of communication according to the last Customer Satisfaction Report from the CCT and the field work results.Communication through devices ranked higher in the survey. This result may be explained by COVID-19 and the impossibility of in-person communication. Furthermore, it should be noticed that walk-ins and mobile offices were not available for part of 2020 due to COVID restrictions. It is recommended that as the pandemic is overcome the City should reevaluate these results to see if the increased preference for device communication is a persistent change in culture or preferences shift back to walk-in offices and other in-person means of communication.
39
Preferred Feedback Channels for informal settlements’ residents according to consulting team field research and Customer Perception and Satisfaction Survey
Preferences as percentage of total responses

40
Project Toolkit
DESK RESEARCH Analysis of Current
Operating Model, Governance Structure, and International Best
Practices
STAKEHOLDER INTERVIEWSTargeted Remote Interviews with members of Civil Society and Governmental Departments in the City of Cape Town
CUSTOMER SURVEYSTargeted Surveys with Informal Settlement Residents (via partnership with CORC)

41
● CCRS, India
● This would enhance accountability from elected representatives.
● Allow tracking of complaints made informally.
Councillor Code as Geographical Workaround
● Innovation Challenges of Utilities, East Africa
● Developing the capacity of field staff to build trust when engaging in informal settlements.
Develop Capacity of Field Staff
● MajiVoice, Kenya ● CCRS, India ● Citizen Feedback
Monitoring Program (CFMP), Pakistan
● SLB-Connect India
● Dashboard to evaluate KPIs on a real-time basis.
● Helps identify performance gaps.
● Helps benchmark resolution time.
Generation of KPIs Dashboard
Description Associated Case Study
Key Highlights from International Best Practices 1/2
CCT Status
42
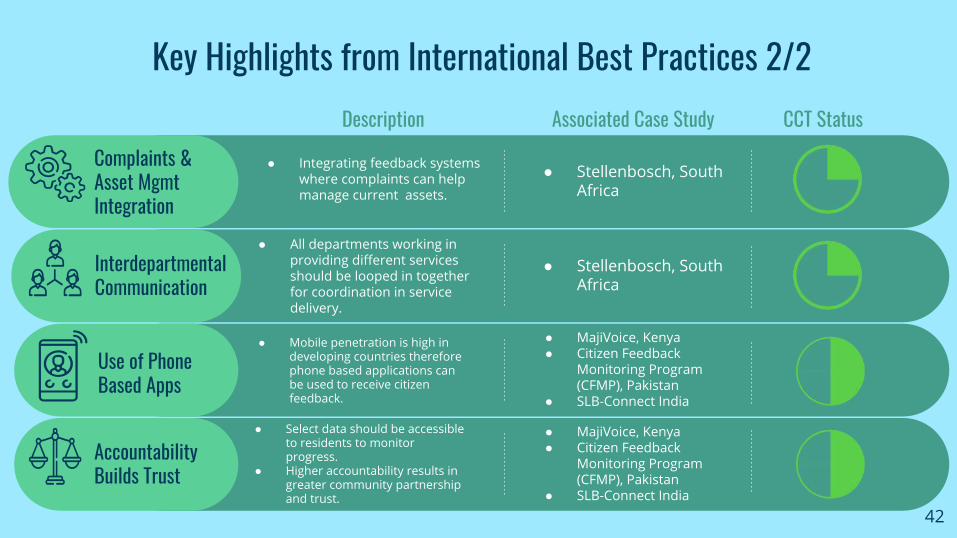
● MajiVoice, Kenya ● Citizen Feedback
Monitoring Program (CFMP), Pakistan
● SLB-Connect India
● Select data should be accessible to residents to monitor progress.
● Higher accountability results in greater community partnership and trust.
Accountability Builds Trust
● MajiVoice, Kenya ● Citizen Feedback
Monitoring Program (CFMP), Pakistan
● SLB-Connect India
● Mobile penetration is high in developing countries therefore phone based applications can be used to receive citizen feedback.
Use of Phone Based Apps
● Stellenbosch, South Africa
● All departments working in providing different services should be looped in together for coordination in service delivery.
Interdepartmental Communication
● Stellenbosch, South Africa
● Integrating feedback systems where complaints can help manage current assets.
Complaints & Asset Mgmt Integration
Key Highlights from International Best Practices 2/2Description Associated Case Study CCT Status

Case Study Analysis
43
A major portion of the desk research consisted of assessing various international examples of successful service delivery feedback innovations. To this end, the team analyzed six different case
studies from across the globe, each one highlighting a policy or procedure. The specific case studies were chosen because their specific demographic contexts are similar to those in informal settlements
in Cape Town or the feedback solution discussed is easily adaptable to a Cape Town context.
1
CCRS, Mumbai, India Citizen Feedback Monitoring Program,
Pakistan
2
Improving Service Delivery in Informal
Settlements, Stellenbosch, South
Africa
3
SLB Connect, India
4
MajiVoice, Nairobi, Kenya
5
Chile Barrio Program, Chile
6
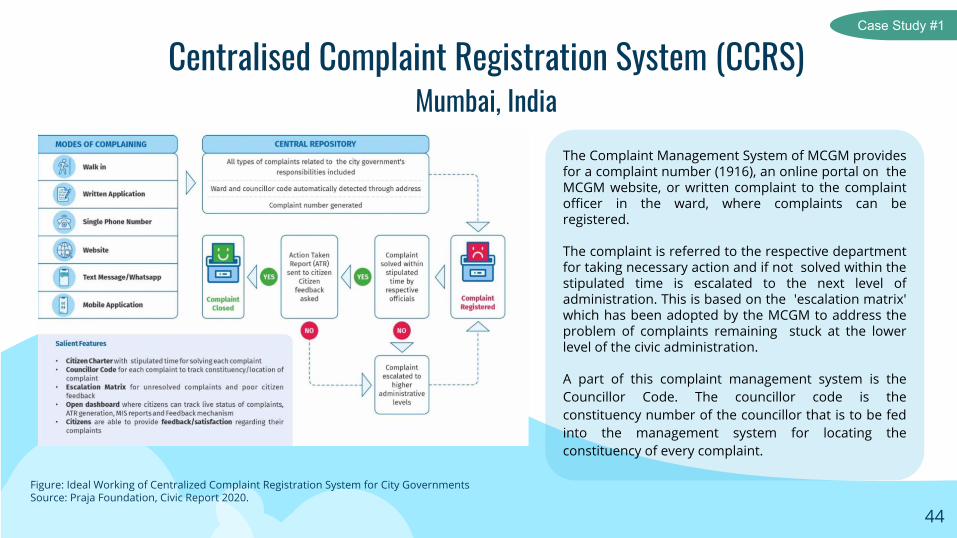
Centralised Complaint Registration System (CCRS)Mumbai, India
44
Figure: Ideal Working of Centralized Complaint Registration System for City GovernmentsSource: Praja Foundation, Civic Report 2020.
The Complaint Management System of MCGM provides for a complaint number (1916), an online portal on the MCGM website, or written complaint to the complaint officer in the ward, where complaints can be registered.
The complaint is referred to the respective department for taking necessary action and if not solved within the stipulated time is escalated to the next level of administration. This is based on the 'escalation matrix' which has been adopted by the MCGM to address the problem of complaints remaining stuck at the lower level of the civic administration.
A part of this complaint management system is the Councillor Code. The councillor code is the constituency number of the councillor that is to be fed into the management system for locating the constituency of every complaint.
Case Study #1
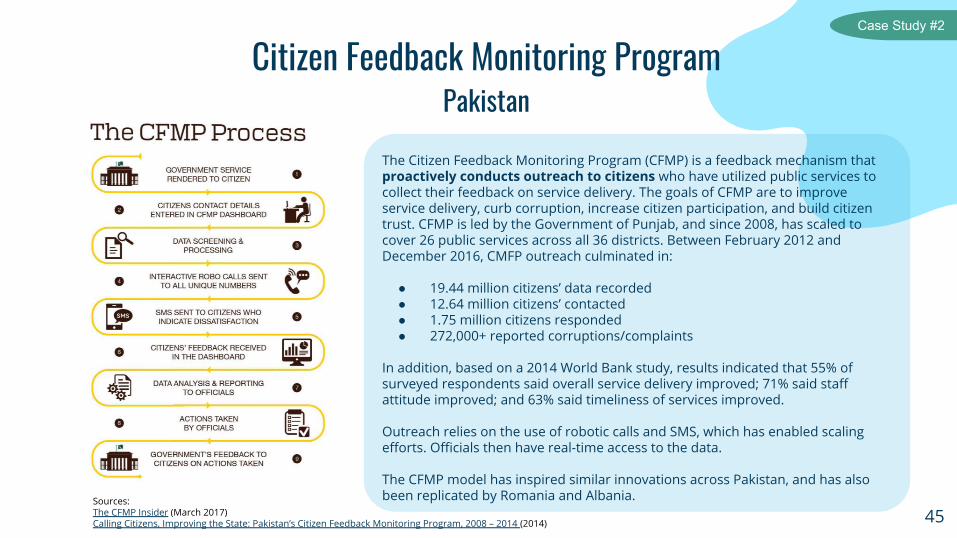
Citizen Feedback Monitoring ProgramPakistan
45Sources: The CFMP Insider (March 2017)Calling Citizens, Improving the State: Pakistan’s Citizen Feedback Monitoring Program, 2008 – 2014 (2014)
The Citizen Feedback Monitoring Program (CFMP) is a feedback mechanism that proactively conducts outreach to citizens who have utilized public services to collect their feedback on service delivery. The goals of CFMP are to improve service delivery, curb corruption, increase citizen participation, and build citizen trust. CFMP is led by the Government of Punjab, and since 2008, has scaled to cover 26 public services across all 36 districts. Between February 2012 and December 2016, CMFP outreach culminated in:
● 19.44 million citizens’ data recorded● 12.64 million citizens’ contacted● 1.75 million citizens responded● 272,000+ reported corruptions/complaints
In addition, based on a 2014 World Bank study, results indicated that 55% of surveyed respondents said overall service delivery improved; 71% said staff attitude improved; and 63% said timeliness of services improved.
Outreach relies on the use of robotic calls and SMS, which has enabled scaling efforts. Officials then have real-time access to the data.
The CFMP model has inspired similar innovations across Pakistan, and has also been replicated by Romania and Albania.
Case Study #2

Improving Service Delivery in Informal Settlements Stellenbosch, South Africa
46
The goal of this project was to identify communication platforms and data management solutions to improve the service delivery process to informal settlements under the jurisdiction of Stellenbosch Municipality, South Africa.
The following recommendations were suggested to the Stellenbosch municipality. ● Community profiling to supplement data collected through enumeration were recommended for the Stellenbosch Informal
Settlement Management Unit (ISMU).● In order for the community members to clearly identify services when reporting a problem, a numbering system was developed
that could be tagged onto each tap, skip, electrical pole, and ablution facility. This numbering system would be used to efficiently report service requests to the municipality through the use of a suggested WhatsApp messaging system.
● Facebook and Twitter should be supplements to WhatsApp as additional platforms for general updates from the municipality. To accommodate people without smartphones, the use of SMS short code service request system was suggested.
● Slack was recommended as an interdepartmental communication platform to replace email and make the process more reliable and organised. Busybot is an additional program embedded into Slack that will generate lists of service tasks automatically. This will aid in tracking service requests and providing periodic feedback to all parties. This platform would have at least two representatives from each relevant department.
● To maintain constant improvement in Stellenbosch’s systems, some sort of communication should be formed between the ISMU in Stellenbosch Municipality and its counterpart in the City of Cape Town.
Source: Improving Service Delivery to Informal Settlements through Data Management, Worcester Polytechnic Institute, 2016.
Case Study #3

47
Source: Mainstreaming citizen feedback on service delivery using ICTs Findings and lessons from ICT-based feedback surveys on water supply and sanitation services in Indian cities (2017)
SLB Connect India
SLB Connect (SLB-C) was launched by the Government of India’s Water and Sanitation Program, in partnership with the Ministry of Urban
Development. SLB-C collects and analyzes citizen feedback on water supply and sanitation services.
As of early 2017, SLB-C had been implemented in eight cities covering six states. Notably, in 2014 the initiative was launched in two slum
settlements in Delhi in partnership with an NGO, the Centre for Urban and Regional Excellence.
Across the five cities in which scaled up demonstrations were implemented (reaching ~28,000 households), between 4% to 48% of
survey respondents within each city resided in slum areas.
Overall, feedback has been collected from over 35,000 households using various methods, principally the Mobile Aided Personal Interview
(MAPI) method, followed by telephone surveys and SMS polls.
One relevant finding is that within cities in which service delivery was a municipal responsibility (ex. Pimpri Chinchwad, Jabalpur), citizens
preferred channeling their complaints through councilors (especially residents living in slums).
Case Study #4
Implementation of SLB-Connect

-120 days
Source: “MajiVoice: A New Accountability Tool to Improve Public Services.” World Bank Group
MajiVoiceNairobi, Kenya
MajiVoice, originating in Nairobi, Kenya, is a WASH complaints processing program. Through its creation, Nairobi has been able to streamline the way it receives and process complaints while decreasing resolution time for solving WASH service issues.
Nairobi is not a perfect corollary to the context of Cape Town. While MajiVoice was created with Nairobi’s urban poor population in mind, the city does not have informal settlements very similar to Cape Town’s. Furthermore, their WASH regulatory services are organized differently than the City of Cape Town’s, as seen in the figure on the right.
However, the MajiVoice system was able to achieve some of the goals the City of Cape Town is wishing to as well. Specifically, MajiVoice helped Nairobi increase the number of WASH service complaints received and resolved while decreasing the average resolution time for closing a complaint. MajiVoice was able to achieve these successes because all complaints are integrated into a singular, organized database regardless of how a complaint is logged. Furthermore, the hierarchical nature of their organizational structure increases their efficiency in resolving complaints. While there are clear delineation of roles and responsibilities for each department, everything is overseen by one regulatory board that focuses on the holistic view of service delivery and feedback.
Case Study #5
MajiVoice’s “Accountability Chain” Organizational Structure
MajiVoice Complaints at Nairobi City Water and Sewerage Company
48

49
The Chile Barrio program from Chile was a nationwide program that began in 1997, with the purpose of improving the capacity of informal settlements’ residents to rise out of their condition of social and economic marginalization. Lasting until 2006, there were four components to the program:
1. Housing and Neighborhood Improvement (which included the provision of Basic Services)
2. Community Development and Social Insertion3. Labor and Productive Habilitation4. Institutional Strengthening of Programs Targeting Poverty Reduction
One key learning from the Chile Barrio case is that while it attempted to be intersectorial, it was not able to achieve this goal. This is due to the fact that the different relevant institutions responsible for implementing the programs had a hard time to collaborating. The study emphasized that the primary reason for this “silo” phenomenon was a lack of a strong coordinating entity to guide the appropriate departments on how to work together, causing a lack of drive to accomplish the program’s goals..The department that was placed in charge of project implementation, the Ministry of Housing, didn’t prioritize the program because it required too many adjustments to their already entrenched operating model. To be able to successfully work together there must be a willingness and enthusiasm among all parties in order to change habits and buy-in to new ideas..
Case Study #6
Source: ESTUDIOS DE CASOS 88 N°98 “Diagnóstico y Evaluación de la Gestión del Programa Chile Barrio”. Claudio Martínez Villa.
Chile Barrio ProgramChile

50
Improved Data Collection & ManagementCustomer data must be thoughtfully organized in
order to streamline request services
The Big Picture
No “One-Size-Fits-All” ApproachAll settlements pose their own service challenges that require different, context-dependent solutions
Community Awareness is a MustOften residents of informal settlements do not know about the services that are already available
Partnership is KeyCollaboration between all
stakeholders involved (including residents, civil society groups, NGOs,
and various governmental departments) is necessary to ensure
quality service is provided
Accessible Communication Channels
Essential that residents and support staff are able to easily communicate
with each other to guarantee feedback is heard and acted upon

04RECOMMENDATIONS
51Image source: Associated Press

Ideating Solutions
52
Based on the results of the stakeholder interviews, desk research, and customer surveys, the Columbia consulting team mapped out recommendations that had surfaced throughout the engagement process using an Action Priority Matrix. The horizontal axis measures feasibility (how easily can a given recommendation be advanced and implemented), and the vertical axis measures its potential for impact. Based on this framework, recommendations with high feasibility and high impact were considered as “Quick Wins”, those with low feasibility but high impact as “Major Projects,” those with both low feasibility and low impact as “Thankless Tasks”, and finally those with high feasibility and low impact as “Fill-Ins.”
The consulting team developed two matrices, in which the potential recommendations were organized by the following guiding research questions:
● How Can the City of Cape Town Increase Community Adoption and Participation?● How Can the City of Cape Town Increase Internal Capacity and Improve Performance?
On April 13, 2021, during the final client call with City of Cape Town governmental staff, the consulting team led an interactive brainstorming session to:
1) Validate where recommendations should fall on the feasibility/impact matrix2) Determine whether there were any missing key potential solutions3) Identify which recommendations generate the most excitement
The final matrices developed through this exercise can be viewed on the following page, complete with notes taken throughout the discussion.

53
Results of Action Priority Matrix Exercise 1/2
54
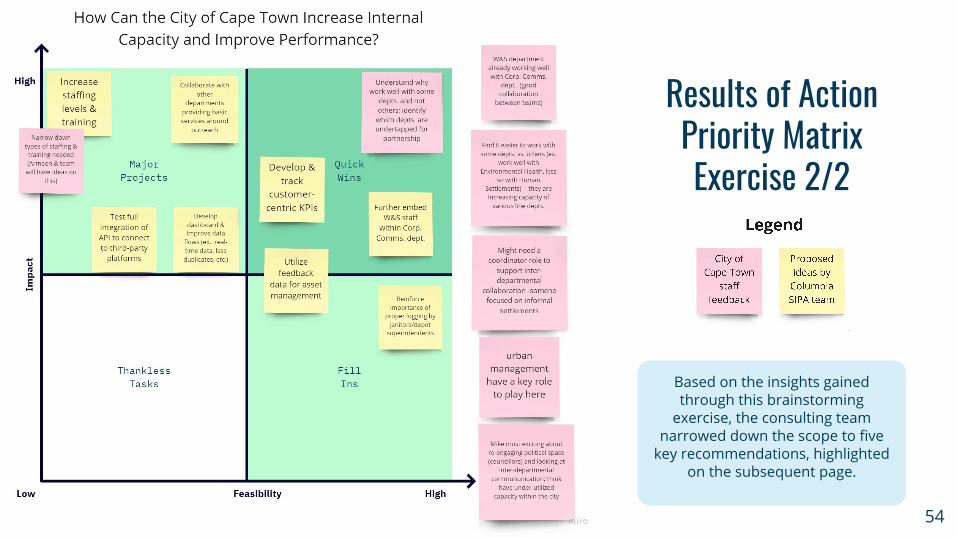
Results of Action Priority Matrix Exercise 2/2
Based on the insights gained through this brainstorming
exercise, the consulting team narrowed down the scope to five
key recommendations, highlighted on the subsequent page.
55
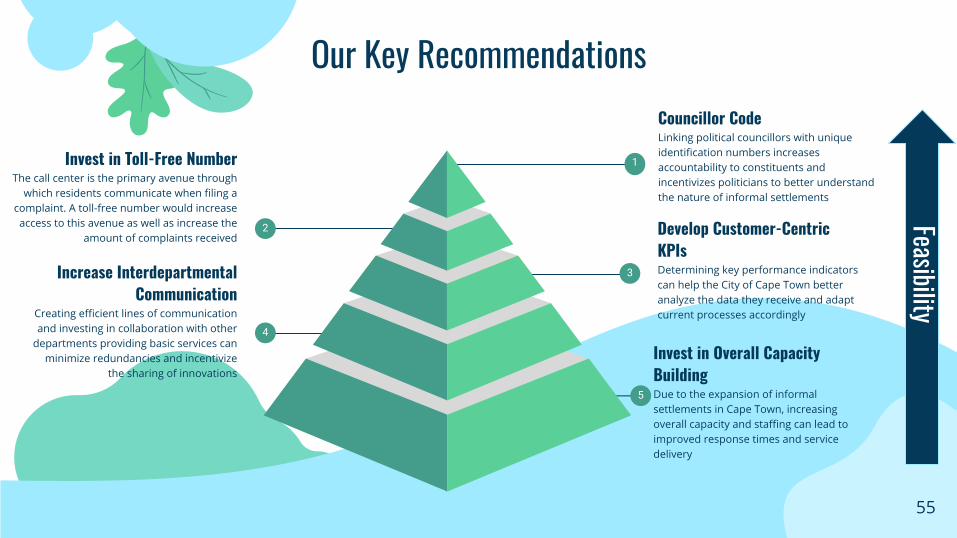
1
Councillor CodeLinking political councillors with unique identification numbers increases accountability to constituents and incentivizes politicians to better understand the nature of informal settlements
3
Invest in Toll-Free NumberThe call center is the primary avenue through
which residents communicate when filing a complaint. A toll-free number would increase access to this avenue as well as increase the
amount of complaints received
5
Invest in Overall Capacity BuildingDue to the expansion of informal settlements in Cape Town, increasing overall capacity and staffing can lead to improved response times and service delivery
2
Increase Interdepartmental Communication
Creating efficient lines of communication and investing in collaboration with other
departments providing basic services can minimize redundancies and incentivize
the sharing of innovations
4
Develop Customer-Centric KPIsDetermining key performance indicators can help the City of Cape Town better analyze the data they receive and adapt current processes accordingly
Our Key RecommendationsFeasibility

A significant proportion of complaints are received informally through local councillors. In order to leverage the use of this feedback channel, the consulting team proposes that the City adopt a councillor coding system to support its tracking of complaints.
How Does It Work?
● The councillor code is the constituency number of the councillor that is to be fed into the complaint management system for locating the constituency of every complaint.
● This means that all complaints entered through the C3 system should also include the name of the administrative ward/councillor constituency. When entering the address of the complaint the code can also automatically be detected based on the zipcode of the location in the system.
Councillor Code
56
How Does This Help?
● This enables the councillor to be aware of complaints filed and to hold the administration accountable for addressing complaints in a timely manner.
● Proper implementation of mandatory entry of councillor code for every complaint must be done for better accountability in the system.
Implementation in Mumbai:
● In Mumbai, under the centralised complaint management system followed by the city, entering the name of the administrative ward in the online form has been made compulsory. As of 2019, councillor code was filled in 22% of the total complaints received by the city.
Key Rec #1

● Having a toll free number would mean the use of walk-in centres for these usee would reduce.
● The consulting team generated a rough estimate on the cost to the City of providing a toll free number for WASH related issues using information from CCT’s 2020 Customer Experiences and Perceptions of Water and Sanitation Services Report .
● The key assumptions for these exercise are:○ fixed costs of $30-50/month○ variable costs of $0.03-0.07/min*
● Three examples were generated to approximate the cost of a toll free line
○ Case0 = Estimation of Yearly Cost for Toll Free Line if Informal Settlements’ Complaints number stays the same.
○ Case1 = Estimation of Yearly Cost for Toll Free Line if Informal Settlements complain at same frequency as formal settlements
○ Case2 = Estimation of Yearly Cost for Toll Free Line if Complaints doubled for Informal Settlements.
● The estimated total cost of a toll free number would then range between $83K and $102K USD per year
57
Toll Free Number
* Example of toll free number service providers: callhippo.com, Toll Free Numbers South Africa** See detail calculation in appendix
Key Rec #2
The call center is a primary avenue through which informal settlements’ residents communicate when filing a complaint. A toll-free number would increase access to this channel as well as increase the amount of feedback received.

Dashboard of KPIs to Improve the Decision-Making Process
58
Strategy (+ 5 Years)Prescriptive
● Customer Satisfaction● # of Complaints/Service Depot
Worker/Month● % of Households with Adequate
Toilet and Water Access
Operations (Day-to-Day)Descriptive
● Resolution Time/Complaint● Total # of complaints● Complaints/Asset
Tactics (1-2 Years)Diagnostics - Predictive
● Last Check-Up or Repair/Asset● % Complaints Resolved on Time● % of Assets in Need of Repair or
Servicing
Creating a Dashboard of KPIs to track the status and progress of the City’s WASH assets and delivery of services would require a considerable investment, but one that would bring substantial efficiency gains not only to the operations but also to the department’s strategy.As a first part of the journey to realize the potentiality of ITCs, the department should make decisions on the following key questions:
● Which department and staff within the municipality structure will govern and champion this Data Analytics project?● How much technical involvement will the City have throughout the development of the project? How will the City pursue
contracting services (ie. SaaS, tailored development)? What training will CIty officials have in order to fully operate the platform?
● What spatial granularity would be needed from the data? From assets → quadrants (how big?) → Settlements.● Will this be a joint effort from W&S and other departments (ie. health, education, police)? Will it share the same database
and platform or will it be done through API queries?
Key Rec #3

A Hawk-Eye for the CityGIS as Complement for a Dashboard
59
According to data from Future Cities, WASH assets registry in the CoCT is updated every 2 years. Why does it take so long? There’s a lack of ICT tools to automate and make the job easier. That is one of many reasons why the City should evaluate optimize its use of Geographical Information Systems.
The CoCT already has a great tool to build upon GIS projects; the C3 system based in SAP, which can be integrated into GIS. One of the first challenges the city would have to address is how to locate assets in a highly fluid environment as informal settlements. One low-tech, low-cost option could be to localize assets through the use of QR codes, which can be read by cell phones (the La Reina municipality in Chile, uses QR codes to register trees). Another alternative is What3words, which assigns a three word tag for each three-meter square of land in the world.
Finally, one complete data management solution worth noting is the MWater platform, an open access software used in 180 countries, which could be use as template by the City.
Key Rec #3

Interdepartmental Communication
60
In order to foster innovation and minimize the duplication of efforts, the Water & Sanitation Department should deepen interdepartmental communication, particularly with other departments also providing basic service delivery. Included below is an illustrative list of other departments that provide basic services.
● City Health Department● Electricity Generation and Distribution Department● Fire and Rescue Service Department● Law Enforcement, Traffic and Coordination Department● Human Settlements● Metropolitan Police Services Department● Solid Waste Management Department● Transport Department
While it is not expected that the W&S team prioritize deepening relationships with all of these departments, the consulting team encourages the W&S department to consider:
● Which departments does the W&S team currently collaborate well with, and why?● Which existing relationships should the W&S team prioritize deepening - why and how?● What new relationships may help the W&S department advance its strategic priorities and goals, and how might the
team begin cultivating those relationships?
Given that the Customer Relations Department manages service requests and complaints across City departments, Customer Relations is uniquely positioned to advance opportunities for cross-departmental collaboration.
In addition, the Water & Sanitation Department may consider creating a staff/coordinator position exclusively dedicated to fostering interdepartmental collaboration in order to formalize these efforts within the department.
Key Rec #4
Building Internal Capacity through the EPWP Janitorial Program
61
* Cost Feasibility Impact
Option 1
Option 2
Option 3
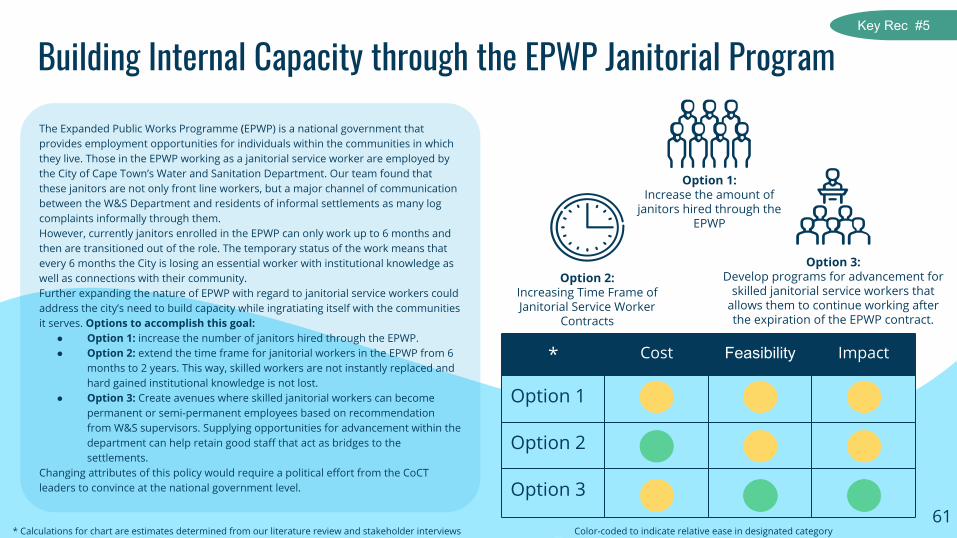
Option 2: Increasing Time Frame of Janitorial Service Worker
Contracts
Option 3: Develop programs for advancement for
skilled janitorial service workers that allows them to continue working after the expiration of the EPWP contract.
* Calculations for chart are estimates determined from our literature review and stakeholder interviews
The Expanded Public Works Programme (EPWP) is a national government that provides employment opportunities for individuals within the communities in which they live. Those in the EPWP working as a janitorial service worker are employed by the City of Cape Town’s Water and Sanitation Department. Our team found that these janitors are not only front line workers, but a major channel of communication between the W&S Department and residents of informal settlements as many log complaints informally through them. However, currently janitors enrolled in the EPWP can only work up to 6 months and then are transitioned out of the role. The temporary status of the work means that every 6 months the City is losing an essential worker with institutional knowledge as well as connections with their community. Further expanding the nature of EPWP with regard to janitorial service workers could address the city’s need to build capacity while ingratiating itself with the communities it serves. Options to accomplish this goal:
● Option 1: increase the number of janitors hired through the EPWP. ● Option 2: extend the time frame for janitorial workers in the EPWP from 6
months to 2 years. This way, skilled workers are not instantly replaced and hard gained institutional knowledge is not lost.
● Option 3: Create avenues where skilled janitorial workers can become permanent or semi-permanent employees based on recommendation from W&S supervisors. Supplying opportunities for advancement within the department can help retain good staff that act as bridges to the settlements.
Changing attributes of this policy would require a political effort from the CoCT leaders to convince at the national government level.
Key Rec #5
Option 1: Increase the amount of
janitors hired through the EPWP
Color-coded to indicate relative ease in designated category

Appendix
62Image source: David Harrison (www.businesslive.co.za)

63
Project Toolkit
DESK RESEARCH Analysis of Current
Operating Model, Governance Structure, and International Best
Practices
STAKEHOLDER INTERVIEWSTargeted Remote Interviews with members of Civil Society and Governmental Departments in the City of Cape Town
CUSTOMER SURVEYSTargeted Surveys with Informal Settlement Residents (via partnership with CORC)

Questionnaire for Field Survey Questions:
1. Did you know you can report issues with the water & sanitation services to the City? (Yes or No Question)
2. When you face an issue with your water and sanitation services, how do you file complaints/provide feedback with the city department? (select all applicable, multiple choice)
3. How would you like to approach the city government when you face water and sanitation service issues? (Select 1st preferable option)
Possible Answers (2-3):1. Call Center 2. Email3. SMS4. Water and Sanitation Department Website 5. Whatsapp6. Janitors/ EPWP workers on field 7. Walk in Centres/ Mobile Offices 8. Elected Local Representative 9. Local leadership within settlement (non-elected)
10. Civil Society/Local NGO 11. Check IT app12. City PFO (Principle Field Officer)13. Others (Please specify) 64
4. What is your preferred mode of communication in your daily life? (choose the 2 most preferable ones)
5. What are some of the challenges you face when communicating about water and sanitation issues with the city? (Open-Ended Question)
6. If there was anything to change what would it be? (Open-Ended Question)
7. Is there anything else you would like to share with us? (Open-Ended Question)
Possible Answers (4):1. Phone call 2. SMS 3. Radio 4. Whatsapp5. Email6. Facebook 7. Twitter 8. In-Person conversation9. Others (Please specify)

65
Project Toolkit
DESK RESEARCH Analysis of Current
Operating Model, Governance Structure, and International Best
Practices
STAKEHOLDER INTERVIEWSTargeted Remote Interviews with members of Civil Society and Governmental Departments in the City of Cape Town
CUSTOMER SURVEYSTargeted Surveys with Informal Settlement Residents (via partnership with CORC)

Interviews: City of Cape Town Governmental Staff First Name Last Name RoleMichael Webster Executive Director
Armeen Mallick Acting Manager for Informal Settlements Basic Services (ISBS)
Nonzuzo Jacob Supervisor, Manager of Operations, Contact Center
David Sekels Administrative Officer 3: Informal Settlements Basic Services
Thembisa Gqamane Senior Professional Officer: Water Demand Management and Water Conservation, Water and Sanitation, ISBS-COVID-19 Response Programme
Mogamad Zahier Abrahams Professional Officer: Informal Settlements Basic Services – Water and Sanitation
Nolufefe Mondliwa Head (ISBS) of Operations and Maintenance
Deelin Naidoo Lead: Strategy Implementation Support Unit
Helourine Seyffert Senior Professional Officer: Customer Relations, Corporate Services
66
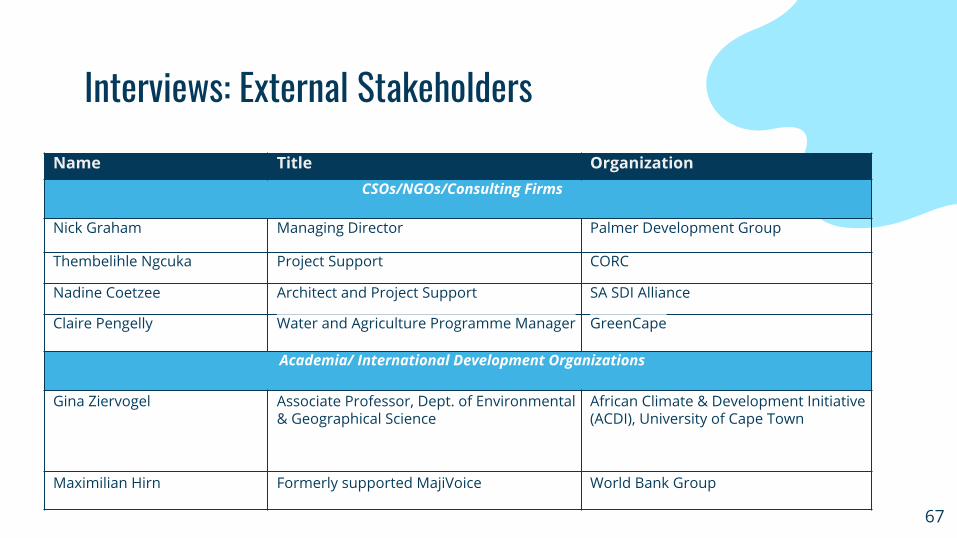
Name Title OrganizationCSOs/NGOs/Consulting Firms
Nick Graham Managing Director Palmer Development Group
Thembelihle Ngcuka Project Support CORC
Nadine Coetzee Architect and Project Support SA SDI Alliance
Claire Pengelly Water and Agriculture Programme Manager GreenCape
Academia/ International Development Organizations
Gina Ziervogel Associate Professor, Dept. of Environmental & Geographical Science
African Climate & Development Initiative (ACDI), University of Cape Town
Maximilian Hirn Formerly supported MajiVoice World Bank Group
Interviews: External Stakeholders
67

Interview TemplateHighlighted below are sample interview questions used with City of Cape Town staff. However, it should be noted that we tailored our interview questions to each individual, based on their organizational affiliation, expertise/experience, and role.
● What brought you to the Water & Sanitation department and this work? What does your current role entail? ● What is the most exciting part of the water strategy?● With regards to improving service delivery and communication within informal settlements, where has the
department had success in the past? How does the department currently track its progress?● How does service delivery within informal settlements fit into the overall strategy of the department? Where
do you see this work headed moving forward, and where do you see the greatest opportunities for growth?● What are the key challenges to improving feedback mechanisms within informal settlements? What internal
capabilities may need to be strengthened in order to support this work?● How do you envision success in this work, and how might you measure it? What KPIs would you use?● Are there any specific local or international examples related to this work that you know of that you
recommend we look into? ● Is there anything we did not get to that you would like to add?
68

69
Project Toolkit
DESK RESEARCH Analysis of Current
Operating Model, Governance Structure, and International Best
Practices
STAKEHOLDER INTERVIEWSTargeted Remote Interviews with members of Civil Society and Governmental Departments in the City of Cape Town
CUSTOMER SURVEYSTargeted Surveys with Informal Settlement Residents (via partnership with CORC)

Description Case Type Scale Location Key Takeaways/Important Points
Data Management, Stellenbosch Municipality, South Africa
Analysis/Recommendations
City-wideStellenbosch, South Africa
Community Profiling, Asset Management, ICT-SMS/Whatsapp, interdepartmental communication platform
Centralised Complaint Registration System (CCRS), Mumbai, India
Analysis/Recommendations
City-wide Mumbai, IndiaCitizen Charter, Resolution Time, Action Taken Report, Citizen feedback, Councillor Code, Complaints Dashboard
Local Management Systems of Rural Water Facilities
Case StudyRural district
Sekyere East District, Ghana
Rural, Community Partnership
Citizen Feedback Monitoring Program (CFMP) Case Study National PakistanCitizen Feedback Monitoring Program, Social Audit, Service Performance Benchmarks, Data-driven responses
Innovation Challenges of UtilitiesAnalysis/Case Study
City-wideAnalysis of Multiple East AfricanCities
Organisational Capacity Building, Local Opportunities, Trust Building, Nature of Informality
SLB-Connect Case Study National IndiaCitizen Surveys, Sanitation Rankings, Transparency- Open Data, Accountability, Data-Driven Responses, ICT
Maji Voice Case Study City-wide Nairobi, KenyaAccountability, Resolution Rate, Statistical Analysis, OnlineMonitoring Platform, Integrated Inputs
Chile Barrio Case Study National ChileHousing Improvement, Community Development, Social Insertion, Poverty Reduction Programming
Case Study References
70

Title Author Interest Area (Scale, Cost, Replicability, Impact)
Location
Customer Satisfaction Survey 2017-18, Cape Town
City of Cape Town Impact, Scale City of Cape Town
Citizenship: the right to flush and the urban sanitation imaginary
Morales et al. Impact Buenos Aires, Argentina
System Approaches to Water, Sanitation, and Hygiene: A Systematic Literature Review
Valcourt et al. Replicability, Impact Various
Turning Slums Around: The Case for Water and Sanitation
Timeyin Uwejamomere (WaterAid) Cost Dhaka, Bangladesh
Leaving no one behind? Analysis of trends in access to water and sanitation services in the slum areas of Nairobi, 2003–2015
Chikozho et al. Replicability Nairobi, Kenya
Unlocking the Potential of Information Communications Technology to Improve Water and Sanitation Services: Summary of Findings and Recommendations
Mouhamed Fadel Ndaw Impact, Scale N/A
Citizen Feedback and Delivery of Urban Services
Deichmann and Lall Impact Various
Assessing equity: a way to improve sanitation service delivery in South African informal settlements
Pan, Armitage and van Ryneveld Replicability Cape Town, Johannesburg and eThekwini
Estimating the cost of sanitation infrastructure for selected sites in Khayelitsha in City of Cape Town
Cornerstone Economic Research Impact, Scale City of Cape Town
Additional References
71
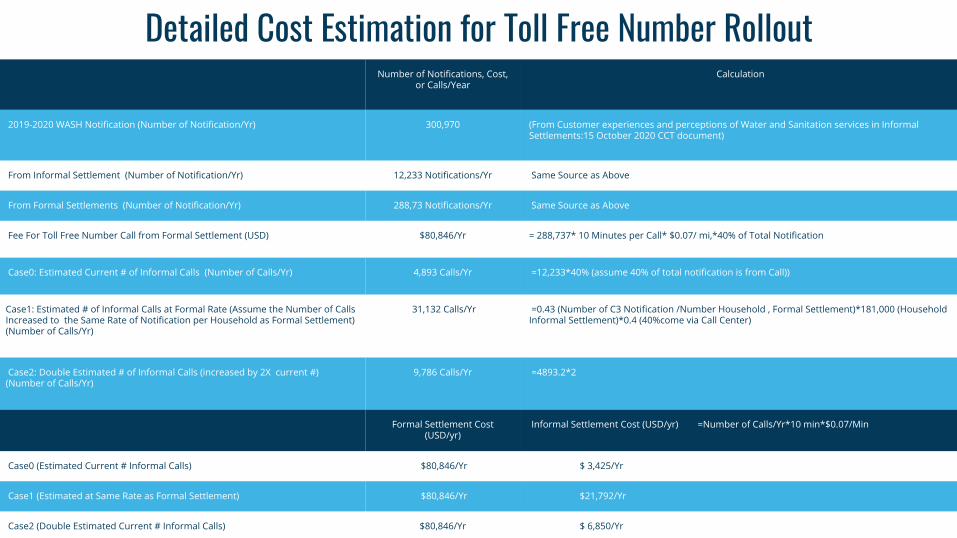
Number of Notifications, Cost, or Calls/Year
Calculation
2019-2020 WASH Notification (Number of Notification/Yr) 300,970 (From Customer experiences and perceptions of Water and Sanitation services in Informal Settlements:15 October 2020 CCT document)
From Informal Settlement (Number of Notification/Yr) 12,233 Notifications/Yr Same Source as Above
From Formal Settlements (Number of Notification/Yr) 288,73 Notifications/Yr Same Source as Above
Fee For Toll Free Number Call from Formal Settlement (USD) $80,846/Yr = 288,737* 10 Minutes per Call* $0.07/ mi,*40% of Total Notification
Case0: Estimated Current # of Informal Calls (Number of Calls/Yr) 4,893 Calls/Yr =12,233*40% (assume 40% of total notification is from Call))
Case1: Estimated # of Informal Calls at Formal Rate (Assume the Number of Calls Increased to the Same Rate of Notification per Household as Formal Settlement) (Number of Calls/Yr)
31,132 Calls/Yr =0.43 (Number of C3 Notification /Number Household , Formal Settlement)*181,000 (Household Informal Settlement)*0.4 (40%come via Call Center)
Case2: Double Estimated # of Informal Calls (increased by 2X current #) (Number of Calls/Yr)
9,786 Calls/Yr =4893.2*2
Formal Settlement Cost (USD/yr)
Informal Settlement Cost (USD/yr) =Number of Calls/Yr*10 min*$0.07/Min
Case0 (Estimated Current # Informal Calls) $80,846/Yr $ 3,425/Yr
Case1 (Estimated at Same Rate as Formal Settlement) $80,846/Yr $21,792/Yr
Case2 (Double Estimated Current # Informal Calls) $80,846/Yr $ 6,850/Yr
Detailed Cost Estimation for Toll Free Number Rollout

73

74

75

76

77

CREDITS: This presentation template was created by Slidesgo, including icons by Flaticon, infographics & images by Freepik and illustrations by Stories
Columbia SIPA Capstone Project:Evaluation of Feedback Mechanisms to Improve Water and Sanitation Service Delivery in Informal Settlements in Cape Town
]]