evaluation of eurocode 8 rules for wall shear demands … · evaluation of eurocode 8 rules for...
TRANSCRIPT

EVALUATION OF EUROCODE 8 RULES FOR WALL SHEAR DEMANDS IN WALL-FRAME RC BUILDINGS
Kyriakos ANTONIOU1, Georgios TSIONIS2 and Michael N. FARDIS3
ABSTRACT
Nonlinear response-history analyses are performed for 16 five- or eight-storey prototype regular reinforced concrete wall-frame buildings designed to Eurocode 8 for Ductility Class Medium or High. The aim is to assess the rules of Eurocode 8 for the post-elastic amplification of wall shears due to higher modes and the adequacy of the specified design envelopes for shear forces and moments. The results show that there is indeed post-elastic amplification of wall shear forces due to higher modes, but that it is overestimated by the current approach for Ductility Class High in Eurocode 8. A recently proposed modal superposition procedure is more accurate and cost-effective for the wall base, but unsafe for the upper storeys. The design envelope of wall shears prescribed in Eurocode 8 offers protection from shear failure throughout the height, whereas the design envelope of wall moments does not safeguard against plastic hinging at upper levels. Nonlinear response-history analysis seems to be the only means to estimate the post-elastic higher mode effects on wall shears, in the context of the assessment of the seismic vulnerability of walls.
INTRODUCTION
Eurocode 8 (CEN 2004) adopts the simple approach proposed by Eibl and Keintzel (1988) for estimating the inelastic amplification of shear forces in ductile reinforced concrete walls. The design shear force, VEd(z), is obtained from the shear force, V’Ed(z), calculated from elastic analysis under the reduced (by the behaviour factor q) 5%-damped response spectrum for the design seismic action as:
2 2
Ed Rd Rwo a C
Ed Edwo a 1
( ) ( )0.1
' ( ) ( )
V z M S Tq q
V z M S T
(1)
where MRwo is the moment resistance at the wall base, MEdwo is the moment from the elastic analysis, γRd is an overstrength factor and Sa(Tc) and Sa(T1) are respectively the spectral acceleration at the upper limit period of the constant-acceleration region of the spectrum and at the fundamental period of vibration of the building. Eurocode 8 extends the scope along the full height of the wall. Eq. (1) applies to Ductility Class (DC) High (H) walls. For simplicity, VEd(z)/V’Ed(z) = 1.5 is taken in DC Medium (M) walls. This approach was found by Rutenberg and Nsieri (2006) and Rejec et al. (2012) to be unconservative for single cantilever walls designed for DC M and over-conservative for those designed for DC H; likewise for coupled walls (Rutenberg and Nsieri, 2006) and wall-frame systems with walls of the same or different size (Kappos and Antoniadis, 2007). 1 MSc, University of Patras, Patras, Greece 2 PhD, University of Patras, Patras, Greece, [email protected] 3 Professor, University of Patras, Patras, Greece, [email protected]

Rejec et al. (2012) proposed to use Eq. (1) at the base (z = 0) of DC H or M walls, using as V’Ed(z) the base shear due to the first mode from Modal Response Spectrum Analysis (MRSA), V’Ed,1, and to cap the final outcome by q times the base shear from MRSA, V’Ed(z=0). They proposed also to do the same at any level z, using as V’Ed(z) the first mode shear, V’Ed,1(z), and replacing the factor 0.1 in the second term by the ratio of the sum of squares of the second and third mode shears to the square of the first mode shear at level z. The distribution of shear with height is thus:
2
22Rd RwoEd Ed,1 Ed,i
1Edwo
( ) ' ( ) ' ( )i
MV z V z q V z
M
(2)
where V’Ed,i(z) is the shear force at level z due to mode i.
A recent study of wall-frame buildings employing simplified nonlinear static analysis and applying the amplification of shear forces per Eurocode 8 concluded that, while the prescribed performance goals are met in a consistent and uniform way across building types and a wide range of geometric and design parameters, walls designed for DC M may fail early in shear (Fardis et al., 2012). This group of wall-frame buildings is revisited here, this time with Non-Linear Response History Analysis (NLRHA).
Apart from constructing the wall fragility curves using more accurate analysis and modelling, this paper studies the post-elastic amplification of wall shears due to higher modes and assesses the relevant rules of Eurocode 8 and their modification in Eq. (2). Moreover, it examines the adequacy of the design envelopes for wall shear forces and moments specified in Eurocode 8.
DESCRIPTION OF FRAME-WALL STRUCTURES
A total of 16 prototype regular reinforced concrete wall-frame five- or eight-storey buildings are studied. They have been designed (Fardis et al., 2012) to Eurocodes 2 and 8, for DC M or H, the recommended Type 1 spectrum for soil type C and a design PGA at the top of the ground, Sαg, of 0.20g or 0.25g (αg is the design PGA on rock and S the soil factor, equal to 1.15 for soil type C). There are 5×5 frame bays in plan, as shown in Figure 1. There are two parallel rectangular walls per horizontal direction, connected to the floor slabs directly, without beams framing into them. So, individually each wall works as a vertical cantilever, without engaging in frame action with beams.
Figure 1. Plan of prototype wall-frame building
The storey height is 3.0 m and the bay length lb = 5.0 m. The beams have a width of 0.3 m and constant depth throughout the building. The columns are square, of constant size in all storeys. The slabs are 150 mm thick. The member dimensions are listed in Table 1. Table 1 and the figures use a five-character notation for each building, which includes the value of Sαg (20 or 25 cm/sec2), the DC (M or H), the number of storeys (nst, equal to 5 or 8) and the structural system per Eurocode 8 (CEN, 2004).

Frame-equivalent dual (FE), wall-equivalent dual (WE) and wall systems (WS) are defined as per Eurocode 8, i.e., as those where the fraction of the total seismic base shear taken by the two walls, Vwall/Vtotal, is between 35 and 50 %, 50 and 65 %, or above 65 %, respectively. Table 1 lists also the PGA up to which the structure stays elastic according to the design, Sαg/q, and the first three modal periods computed per Eurocode 8 with 50% of the uncracked section stiffness.
Table 1. Study buildings: member dimensions, portion of total base shear taken by walls, natural
periods
Building Sag (g)
Sag/q (g)
nst DC beam
depth (m) column size (m) wall (m) Vwall/Vtot
(%) First three periods (s) for stiffness:
interior exterior length thick. 50% of uncracked effective 20M5FE 0.20 0.05 5 M 0.40 0.40 0.35 1.50 0.25 37 1.00 0.30 0.16 1.99 0.56 0.2625M5FE 0.25 0.06 5 M 0.45 0.45 0.40 2.00 0.25 44 0.81 0.24 0.12 1.66 0.45 0.2025H5FE 0.25 0.04 5 H 0.45 0.45 0.40 2.00 0.25 44 0.80 0.24 0.12 1.63 0.46 0.2220M8FE 0.20 0.05 8 M 0.45 0.45 0.40 2.00 0.25 42 1.34 0.41 0.22 2.61 0.73 0.3325M8FE 0.25 0.06 8 M 0.50 0.45 0.40 2.00 0.25 40 1.26 0.39 0.21 2.50 0.70 0.3420M5WE 0.20 0.06 5 M 0.40 0.40 0.35 2.00 0.25 53 0.94 0.27 0.13 1.83 0.48 0.2125M5WE 0.25 0.07 5 M 0.45 0.45 0.40 2.50 0.25 57 0.76 0.21 0.10 1.46 0.37 0.1525H5WE 0.25 0.05 5 H 0.45 0.45 0.40 2.50 0.25 57 0.75 0.21 0.10 1.50 0.39 0.1720M8WE 0.20 0.06 8 M 0.45 0.45 0.40 3.00 0.25 63 1.22 0.35 0.17 1.22 0.35 0.1725M8WE 0.25 0.07 8 M 0.50 0.45 0.40 3.00 0.25 61 1.15 0.34 0.17 2.32 0.67 0.3320M5WS 0.20 0.07 5 M 0.40 0.40 0.35 2.50 0.25 65 0.87 0.24 0.11 1.63 0.40 0.1625M5WS 0.25 0.08 5 M 0.45 0.45 0.40 3.50 0.25 73 0.66 0.17 0.08 1.24 0.28 0.1125H5WS 0.25 0.06 5 H 0.45 0.45 0.40 3.50 0.50 81 0.55 0.13 0.06 1.15 0.25 0.1020M8WS 0.20 0.07 8 M 0.45 0.45 0.40 4.00 0.25 76 1.10 0.29 0.13 2.11 0.51 0.2125M8WS 0.25 0.08 8 M 0.50 0.45 0.40 4.00 0.25 74 1.04 0.28 0.13 1.92 0.46 0.1925H8WS 0.25 0.06 8 H 0.50 0.45 0.40 5.50 0.50 90 0.74 0.17 0.07 1.57 0.33 0.13
NON-LINEAR RESPONSE HISTORY ANALYSIS
Three-dimensional models are subjected to NLRHA, following the rules and guidance given in Parts 1 and 3 of Eurocode 8 (CEN, 2004; 2005). A prismatic 3D beam element is used for each beam, column, or wall storey. For its inelastic behaviour a point hinge model is used, with bilinear moment-rotation curve for monotonic loading and a modified-Takeda hysteresis rule for cyclic. The secant-to-yield-point stiffness, (EI)eff, per Part 3 of Eurocode 8 (CEN, 2005) is used as the elastic stiffness of each member. It takes into account the shear flexibility of the member before flexural yielding, as well as the apparent flexibility arising from the fixed-end rotation of its end sections due to slippage of its longitudinal bars from the joints. For walls, the secant-to-yield-point stiffness of the bottom section in each storey is used, taking as shear span 50% of the height from that section to the top of the wall. The impact of axial load variation on the flexural properties of columns is considered.
Mean material properties are used. Vertical elements are taken fixed at the base. Beam-column joints and floor diaphragms are considered rigid. Rayleigh damping is applied, with damping ratio equal to 5% specified at the first two modes. P-Δ effects are included, through the linearised geometric stiffness matrix of vertical elements. The first three modal periods of the elastic structure modelled with (EI)eff as the elastic stiffness of members are listed at the last three columns of Table 1.
The analysis is performed under a single horizontal component of the seismic action. Semi-artificial ground motions are used as input. They derive from the two horizontal components recorded in seven historic earthquakes, modified to match the 5%-damped elastic response spectrum used in the building design. The motions are scaled to different values of peak acceleration at 0.05g increments.
POST-ELASTIC AMPLIFICATION OF WALL SHEARS DUE TO HIGHER MODES
To study the dynamic amplification of shear forces in the wall’s storeys after plastic hinging at the base, the average value of the peak storey shears from NLRHA for the 14 input motions is normalised to the storey shear from MRSA; the latter is capped by its value at the PGA level for which the MRSA-moment at the wall base reaches the yield moment. The so computed ratio is plotted in Figure 2 against the PGA

of the motion. If there were no post-elastic dynamic amplification of wall shears, that ratio would have stayed around 1.0. Indeed it does, up to the design PGA divided by q, Sαg/q, and often beyond. For higher PGA, around Sαg, the ratio of shears grows with increasing PGA, confirming the post-elastic dynamic amplification of wall shear. The increase is larger at the upper storeys. The spread between upper and lower storeys increases with decreasing Vwall/Vtotal-ratio.
Storey 1 Storey 2 Storey 3Storey 4 Storey 5 Storey 6Storey 7 Storey 8 Series8Sag Sag/q #REF!Eq. (1)
Sag/qSag
Sag/q
20M8FE
20M8WE
20M8WS
25M8FE
25M8WE
0.0 0.1 0.2 0.3 0.4 0.5 0.6Peak ground acceleration (g)
25M8WS
0.0 0.1 0.2 0.3 0.4 0.5 0.6Peak ground acceleration (g)
25H8WS
0
1
2
3
4
5
6
Vinelastic/ V' Ed
20M5FE
0
1
2
3
4
5
6
Vinelastic/ V' Ed
20M5WE
0
1
2
3
4
5
6
Vinelastic/ V' Ed
20M5WS
25M5FE
25M5WE
25M5WS
0
1
2
3
4
5
6
Vinelastic/ V' Ed
25H5FE
0.0 0.1 0.2 0.3 0.4 0.5 0.6Peak ground acceleration (g)
25H5WE
0
1
2
3
4
5
6
0.0 0.1 0.2 0.3 0.4 0.5 0.6
Vinelastic/ V' Ed
Peak ground acceleration (g)
25H5WS
Figure 2. Ratio of peak storey shear from NLRHA to storey shear from MRSA using secant-to-yield-point stiffness, compared to Eq. (1) for no overstrength (MEdwo = γRdMRdwo) and for q equal to the ratio of the PGA to
the PGA at wall plastic hinging
Figure 2 shows also the dependence on PGA of the right-hand-side of Eq. (1), computed for MEdwo = γRdMRdwo, T1 calculated using (EI)eff and q taken equal to the ratio of the PGA considered, to its value at plastic hinging of the wall base (i.e., the PGA causing MEdwo = γRdMRdwo, with γRdMRdwo taken equal to the yield moment for mean material strengths). That line is the benchmark for assessing whether the way the Keintzel approach was adopted in Eurocode 8 for DC H agrees with the post-elastic dynamic amplification of wall shears according to NLRHA. Figure 2 shows that there is agreement only in some of the upper storeys of the two wall systems designed for DC H and of the five-storey wall system designed for DC M and a design PGA of 0.25g. In the wall-equivalent dual systems and, even more, in the frame-equivalent ones, the post-elastic dynamic response increases wall shears much less than suggested by Eq. (1). In fact, if there is no flexural overstrength (γRdMRdwo = MEdwo), the indiscriminate increase of MRSA-shears by 1.5 specified in Eurocode 8 for DC M walls appears sufficient at the design-PGA level at the wall base, and, at least in wall systems, at the upper levels as well. At that PGA, the 1.5-factor does not cover the upper storeys of dual systems, especially of frame-equivalent ones.
To check the margins arising from the specific rules of Eurocode 8 for DC H, Figure 3 plots for each storey the average value of the peak wall shear from NLRHA for the 14 input motions, divided by the wall shear from MRSA using the design spectrum and 50% of the uncracked section stiffness. That ratio is contrasted in Figure 3 to the value of the right-hand-side in Eq. (1), computed with γRdMRdwo equal to the yield moment at the wall base for mean values of material strengths, MEdwo, as computed

from MRSA for the design spectrum, T1 calculated with 50% of the uncracked section stiffness and q taken equal to the value specified in Eurocode 8 for the system.
Storey 1 Storey 2Storey 3 Storey 4Storey 5 Storey 6Storey 7 Storey 8Sag Sag/qe=1.5 Eq. (1)
Sag/q
VEd=1.5V'Ed
Sag
20M8FE
20M8WE
20M8WS
25M8FE
25M8WE
0.0 0.1 0.2 0.3 0.4 0.5 0.6Peak ground acceleration (g)
25M8WS
0.0 0.1 0.2 0.3 0.4 0.5 0.6Peak ground acceleration (g)
25H8WS
0
1
2
3
4
5
6
Vinelastic/ V' Ed
20M5FE
0
1
2
3
4
5
6
Vinelastic/ V' Ed
20M5WE
0
1
2
3
4
5
6
Vinelastic/ V' Ed
20M5WS
25M5FE
25M5WE
25M5WS
0
1
2
3
4
5
6
Vinelastic/ V' Ed
25H5FE
0.0 0.1 0.2 0.3 0.4 0.5 0.6Peak ground acceleration (g)
25H5WE
0
1
2
3
4
5
6
0.0 0.1 0.2 0.3 0.4 0.5 0.6
Vinelastic/ V' Ed
Peak ground acceleration (g)
25H5WS
Figure 3. Ratio of peak storey shear from NLRHA to storey shear from MRSA, compared to amplification per Eq. (1) with γRdMRdwo equal to the wall yield moment for mean material strengths, MEdwo computed from MRSA
for the design spectrum and 50% of uncracked section stiffness and q the value used in the design
The aim of Figure 3 is to compare the peak wall shears in the storeys from NLRHA to the design shears according to the rules in Eurocode 8 for DC H (applied here to DC M as well). The solid horizontal lines in Figure 3 give the value of the right-hand-side of Eq. (1). If the line expressing the ratio of NLRHA wall shear to MRSA shear crosses that solid horizontal line to the right of the vertical line marking the design PGA, Sαg, the Eurocode approach is safe-sided; if it crosses to the left of Sαg, it is unconservative. Figure 3 shows that it is indeed safe-sided, except at one storey in the upper third of wall or wall-equivalent dual systems with five storeys, or in two such storeys of eight-storey wall or wall-equivalent buildings. In frame-equivalent dual systems, it is safe-sided only at the ground and top storeys and in eight-storey buildings at the second storey too.
Witness for the DC M buildings in Figure 3 the horizontal line at the constant amplification factor of 1.5 specified in Eurocode 8 for DC M. That factor is indeed sufficient at the ground storey of the DC M buildings and essentially at the top one as well. It is far from safe-sided at the storeys in-between, especially as Vwall/Vtotal decreases.
Figure 3 contradicts the finding of Rejec et al. (2012) that, at the design PGA level, Eq. (1) gives good agreement with the average peak shear from NLRHA at the base if T1 < 1.0 sec (in the present case, for all five-storey buildings and for 25H8WS). Note that Rejec et al. (2012) studied only single walls and employed in the NLRHA 50% of the uncracked flexural and shear stiffness as elastic stiffness (in lieu of the secant-to-yield-point stiffness used here) and nominal material strengths factored by the partial factors used in the design (in lieu of the mean material strengths used herein). The results in Figure 3 agree better in this respect with those reached by Kappos and Antoniadis (2007) for DC M or H wall-frame buildings with walls taking about 90% of the base shear, using assumptions and material properties in the NLRHA more similar to those used herein.

Figure 4 depicts the variation with PGA of the average of the peak storey shears from NLRHA for the 14 input motions divided by the storey shear from Eq. (2), using modal shears obtained from MRSA with member stiffness equal to (EI)eff, but capped by the modal shear at the PGA at which the MRSA-moment at the wall base, MEdwo, reaches its yield moment for mean material strengths, taken here equal to γRdMRdwo (so that in the first term γRdMRdwo/MEdwo = 1) and q equal to the ratio of the PGA considered, to its value at plastic hinging of the wall base. Perfect matching of Eq. (2) to the average peak storey shears from NLRHA for the 14 input motions would correspond to a flat line at an ordinate of 1.0. Below that level, Eq. (2) is safe-sided; above, it isn’t. As shown in Figure 4, Eq. (2) is quite accurate for wall systems, becoming safe-sided in wall-equivalent dual – especially at the ground floor – and even more so in frame-equivalent ones.
Storey 1 Storey 2 Storey 3
Storey 4 Storey 5 Storey 6
Storey 7 Storey 8 Series11
Sag Sag/qSag/qSag
20M8FE
20M8WE
20M8WS
25M8FE
25M8WE
0.0 0.1 0.2 0.3 0.4 0.5 0.6Peak ground acceleration (g)
25M8WS
0.0 0.1 0.2 0.3 0.4 0.5 0.6Peak ground acceleration (g)
25H8WS
0
1
2
3
Vinelastic/ VEd(z)
20M5FE
0
1
2
3
Vinelastic/ VEd(z)
20M5WE
0
1
2
3
Vinelastic/ VEd(z)
20M5WS
25M5FE
25M5WE
0
1
2
3
Vinelastic/ VEd(z)
25H5FE
0.0 0.1 0.2 0.3 0.4 0.5 0.6Peak ground acceleration (g)
25H5WE
0
1
2
3
0.0 0.1 0.2 0.3 0.4 0.5 0.6
Vinelastic/ VEd(z)
Peak ground acceleration (g)
25H5WS
25M5WS
Figure 4. Ratio of peak storey shear from NLRHA to storey shear from Eq. (2), namely shears from MRSA computed with the secant-to-yield-point stiffness and the PGA causing MEdwo = γRdMRdwo and q taken equal to the
ratio of PGA to the PGA at wall plastic hinging
Figure 5 depicts the variation with PGA of the average of the peak storey shears from NLRHA for the 14 input motions, divided by the storey shear from Eq. (2). That shear is computed with γRdMRdwo taken equal to the yield moment at the wall base for mean values of material strengths, MEdwo and V’Ed,i(z) obtained from MRSA for the design spectrum using 50% of the uncracked section stiffness and q equal to the value specified in Eurocode 8 for the system in question. Eq. (2) is safe-sided if the intersections of the individual lines with the vertical at the design PGA, Sαg, correspond to values on the vertical axis below 1.0. Figure 5 shows that, in general, this happens only at the ground floor. Only wall systems may claim that they provide overall good accuracy and safety at the other storeys. Frame-equivalent dual systems fare worse than wall systems; wall-equivalent ones fall in-between.

20M8FE
20M8WE
20M8WS
25M8FE
25M8WE
0.0 0.1 0.2 0.3 0.4 0.5 0.6Peak ground acceleration (g)
25M8WS
0.0 0.1 0.2 0.3 0.4 0.5 0.6Peak ground acceleration (g)
25H8WS
Storey 1 Storey 2 Storey 3
Storey 4 Storey 5 Storey 6
Storey 7 Storey 8 Series11
Sag Sag/qSag Sag/q
0
1
2
3Vinelastic/ VEd(z)
20M5FE
0
1
2
3
Vinelastic/ VEd(z)
20M5WE
0
1
2
3
Vinelastic/ VEd(z)
20M5WS
25M5FE
25M5WE
25M5WS
0
1
2
3
Vinelastic/ VEd(z)
25H5FE
0.0 0.1 0.2 0.3 0.4 0.5 0.6Peak ground acceleration (g)
25H5WE
0
1
2
3
0.0 0.1 0.2 0.3 0.4 0.5 0.6
Vinelastic/ VEd(z)
Peak ground acceleration (g)
25H5WS
Figure 5. Ratio of peak storey shear from NLRHA to storey shear from Eq. (2), with shears and MEdwo from MRSA for the design spectrum and 50% of uncracked section stiffness and q the value used in the design
The conclusions from Figure 5 concerning the safety provided by Eq. (2) above the ground storey at the design PGA seem to contradict those drawn from Figure 4. Conflicting factors are at play: 1. The MRSA-shears used in Figure 4 are computed with the secant-to-yield-point stiffness, which is
less than 50% of the uncracked section stiffness. Hence, if the spectrum is anchored to the same PGA in both cases, the MRSA-shears in Figure 4 are smaller than those used in Figure 5.
2. The MRSA-shears used in Figure 4 are derived from a spectrum anchored to the PGA causing MEdwo = γRdMRdwo which normally significantly exceeds the design PGA to which the spectrum used in Figure 5 is anchored.
3. The q-factor in Figure 5 is the design value, while that used in Figure 4 is the ratio of the design PGA to the PGA at wall plastic hinging and is smaller than the design value.
Factor no. 2 normally overrides the two others combined; the net effect reduces the outcome of Eq. (2) in Figure 5, compared to that of Figure 4 at the design PGA. Hence, Eq. (2) appears to provide lower safety at the design PGA if applied in a pure design context (as in Figure 5), than when its aim is to capture the peak inelastic shear response.
Overall, Eq. (2) is more accurate and cost-effective than Eq. (1), but the safety it provides at the upper storeys of dual systems needs improvement. As a matter of fact, in Eurocode 8 that case is covered by the special rules for the design shears in the upper-two-thirds of the walls of dual systems, explained in the next paragraph.
Figure 6 plots the average value of the peak shears from NLRHA under the 14 input motions at each storey at selected PGA levels of excitation, ranging from below the design PGA, Sαg, to twice that value. It also shows the envelope of design shears per Eurocode 8, anchored at the base to the shear calculated in the form the Keintzel approach was adopted in Eurocode 8 for DC H, namely in the form of Eq. (1) with V’Ed(0) computed via MRSA for the design spectrum and 50% of the uncracked section stiffness. For comparison, the Eurocode 8 envelope is depicted anchored at the base to the shear from Eq. (2), again with V’Ed,i(0) from MRSA for the design spectrum and 50% of the uncracked section stiffness. Figure 6 shows that, at the design PGA, the Eurocode 8 envelope is safe-sided throughout the

height of the wall. As a matter of fact, it is still safe – and even more cost-effective – to amplify the base shear with Eq. (2) instead of Eq. (1). Even with the simple multiplication of shears in DC M buildings by a constant factor of 1.5, the Eurocode 8 envelope is safe, albeit marginally.
0 400 800 1200 1600Shear force (kN)
25M5FE
0 500 1000 1500 2000Shear force (kN)
25M5WE
0 750 1500 2250 3000Shear force (kN)
25M5WS
0 500 1000 1500 2000Shear force (kN)
25H5WE
0
1
2
3
4
5
0 250 500 750 1000
Storey
Shear force (kN)
20M5FE
0
1
2
3
4
5
0 300 600 900 1200
Storey
Shear force (kN)
20M5WE
0
1
2
3
4
5
0 500 1000 1500 2000
Storey
Shear force (kN)
20M5WS
0
1
2
3
4
5
0 300 600 900 1200
Storey
Shear force (kN)
25H5FE
0
1
2
3
4
5
0 1000 2000 3000 4000
Storey
Shear force (kN)
25H5WS
0 500 1000 1500 2000Shear force (kN)
25M8FE
0 750 1500 2250 3000Shear force (kN)
25M8WE
0 1000 2000 3000 4000Shear force (kN)
25M8WS
0.15g0.20g0.25g0.30g0.40g0.50gEq. (2)Eq. (3)e = 1.5
Envelope for VEd(0)/V'Ed(0) from Eq. (1)Envelope for VEd(0)/V'Ed(0) from Eq. (2)Envelope for VEd(0)/V'Ed(0) = 1.5
012345678
0 400 800 1200 1600
Storey
Shear force (kN)
20M8FE
012345678
0 500 1000 1500 2000
Storey
Shear force (kN)
20M8WE
012345678
0 750 1500 2250 3000
Storey
Shear force (kN)
20M8WS
012345678
0 2000 4000 6000 8000
Storey
Shear force (kN)
25H8WS
Figure 6. Peak storey shear from NLRHA versus Eurocode 8 design envelope
MOMENT ENVELOPES ALONG THE HEIGHT OF THE WALL
The average value of the peak storey moments from NLRHA for the 14 input motions is plotted in Figure 7 along the height of the wall, for PGA levels ranging from less than the design PGA to twice that value. Plotted is also the yield moment of the wall section, My, for mean material properties and the design envelope according to Eurocode 8. An alternative to this design envelope is also depicted, as a dashed straight line connecting the value of My ≈ γRdMRdwo at the base to the top of the wall.
At the design PGA of 0.20g or 0.25g, the average NLRHA moments normally exceed the linear design envelope per Eurocode 8 over most of the wall height. Thanks to overdesign, due to detailing and minimum wall reinforcement per Eurocode 8, the wall’s yield moment normally well exceeds the design envelope per Eurocode 8. However, plastic hinging of the wall above the base takes place in some cases, but only at twice the design PGA. Note that the average NLRHA moment at plastic hinges often exceeds the yield moment of the wall, because of strain hardening; this often happens at the base. Witness also that, under the design PGA, the average NLRHA moments often exceed even the alternative linear moment envelope from a value of My ≈ γRdMRdwo at the base to the top of the wall. This seems to be the rule in the upper half to two-thirds of the wall in frame-equivalent dual systems. It may be the case also in the upper half of the walls of wall-equivalent dual, but not in wall systems. Plastic hinging at those locations is prevented under the design PGA by the large flexural overstrength over the
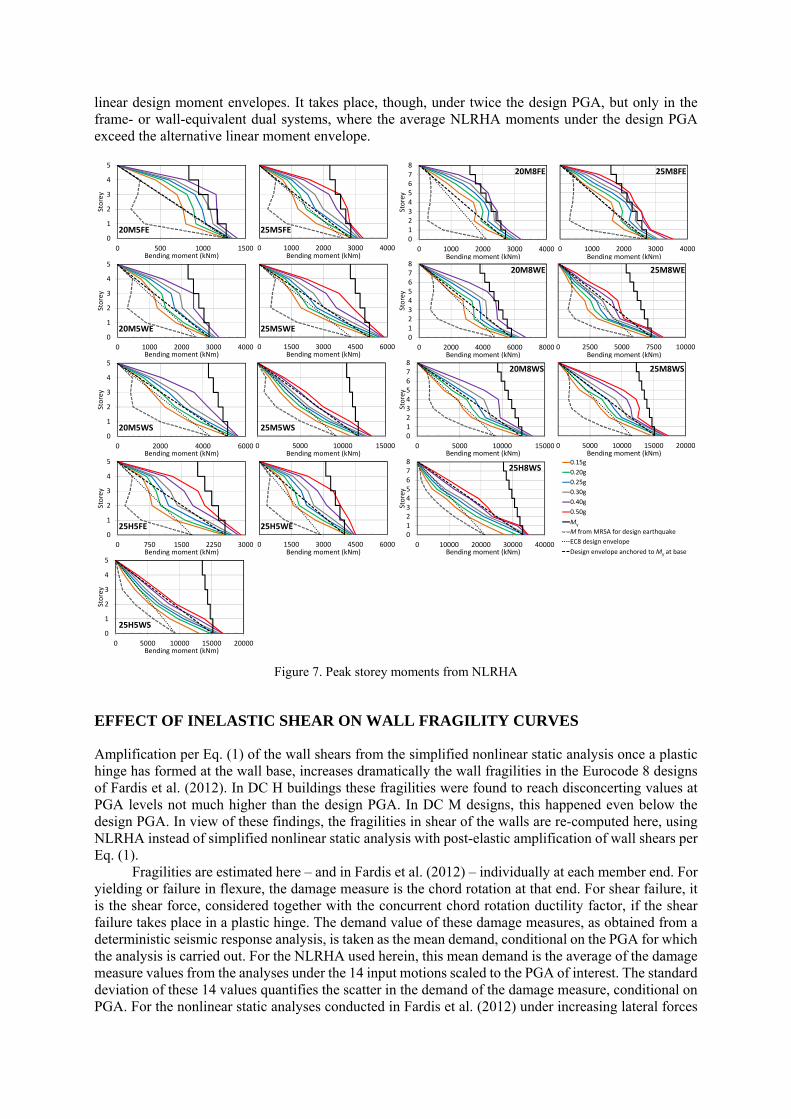
linear design moment envelopes. It takes place, though, under twice the design PGA, but only in the frame- or wall-equivalent dual systems, where the average NLRHA moments under the design PGA exceed the alternative linear moment envelope.
0 1000 2000 3000 4000Bending moment (kNm)
25M5FE
0 1500 3000 4500 6000Bending moment (kNm)
25M5WE
0 5000 10000 15000Bending moment (kNm)
25M5WS
0 1500 3000 4500 6000Bending moment (kNm)
25H5WE
0
1
2
3
4
5
0 500 1000 1500
Storey
Bending moment (kNm)
20M5FE
0
1
2
3
4
5
0 1000 2000 3000 4000
Storey
Bending moment (kNm)
20M5WE
0
1
2
3
4
5
0 2000 4000 6000
Storey
Bending moment (kNm)
20M5WS
0
1
2
3
4
5
0 750 1500 2250 3000
Storey
Bending moment (kNm)
25H5FE
0
1
2
3
4
5
0 5000 10000 15000 20000
Storey
Bending moment (kNm)
25H5WS
0 1000 2000 3000 4000Bending moment (kNm)
25M8FE
0 2500 5000 7500 10000Bending moment (kNm)
25M8WE
0 5000 10000 15000 20000Bending moment (kNm)
25M8WS
0.15g
0.20g
0.25g
0.30g
0.40g
0.50g
My
M MRSA
Series10
Series8
M from MRSA for design earthquake
EC8 design envelope
My
Design envelope anchored to My at base
012345678
0 1000 2000 3000 4000
Storey
Bending moment (kNm)
20M8FE
012345678
0 2000 4000 6000 8000
Storey
Bending moment (kNm)
20M8WE
012345678
0 5000 10000 15000
Storey
Bending moment (kNm)
20M8WS
012345678
0 10000 20000 30000 40000
Storey
Bending moment (kNm)
25H8WS
Figure 7. Peak storey moments from NLRHA
EFFECT OF INELASTIC SHEAR ON WALL FRAGILITY CURVES
Amplification per Eq. (1) of the wall shears from the simplified nonlinear static analysis once a plastic hinge has formed at the wall base, increases dramatically the wall fragilities in the Eurocode 8 designs of Fardis et al. (2012). In DC H buildings these fragilities were found to reach disconcerting values at PGA levels not much higher than the design PGA. In DC M designs, this happened even below the design PGA. In view of these findings, the fragilities in shear of the walls are re-computed here, using NLRHA instead of simplified nonlinear static analysis with post-elastic amplification of wall shears per Eq. (1).
Fragilities are estimated here – and in Fardis et al. (2012) – individually at each member end. For yielding or failure in flexure, the damage measure is the chord rotation at that end. For shear failure, it is the shear force, considered together with the concurrent chord rotation ductility factor, if the shear failure takes place in a plastic hinge. The demand value of these damage measures, as obtained from a deterministic seismic response analysis, is taken as the mean demand, conditional on the PGA for which the analysis is carried out. For the NLRHA used herein, this mean demand is the average of the damage measure values from the analyses under the 14 input motions scaled to the PGA of interest. The standard deviation of these 14 values quantifies the scatter in the demand of the damage measure, conditional on PGA. For the nonlinear static analyses conducted in Fardis et al. (2012) under increasing lateral forces

with a fixed pattern, a higher standard deviation value is postulated for these damage measures, to account for the larger model uncertainty. The mean capacity for the damage measure is estimated per CEN (2005), Biskinis and Fardis (2010a; 2010b) and Biskinis et al. (2004), as appropriate. Estimates of its standard deviation for given mean material properties are obtained from these latter sources. The first and second moments of the probability distributions of demand and capacity are used to compute the fragility, which is taken equal to the probability of the damage measure capacity being exceeded by the demand for that PGA value. Note that, as the seismic response analysis is deterministic and based on mean properties, only plastic hinging which has taken place with a – conditional on PGA – probability of at least 50% impacts the mechanical response of the rest of the system. Neglected is also the mechanical effect of a drastic drop in resistance upon a failure in shear or flexure, even if its – conditional on PGA – probability of occurrence exceeds 50%.
The fragility curves of the 16 buildings of this research were constructed using three analysis approaches: a) NLRHA as detailed above; b) nonlinear static analysis, with certain simplifying assumptions concerning the behaviour of the
frame, as in Fardis et al. (2012); and c) full-fledged nonlinear static analysis in 3D per CEN (2004), with the same nonlinear modelling as in
(a) and without the simplifying assumptions of (b) which were made for the frames in Fardis et al. (2012).
The fragility curves obtained from the three analysis methods for flexural yielding or failure of beams, columns or walls were in fairly good agreement. Those from type-(b) analysis were, in general, more conservative than those from NLRHA; those from full-fledged pushover analysis were in-between (Antoniou, 2013). This agreement did not extend to wall shear failures.
Figure 8 compares the shear fragility curves of the walls from NLRHA, to those from analysis of type (b) above and amplification of the shears per Eq. (1) after plastic hinging of the wall. Depicted are also the fragility curves from the simplified nonlinear static analysis of type (b) above, but without multiplying wall shears by the right-hand-side of Eq. (1). Fragility curves from nonlinear static analysis of type (b) above start close to those from NLRHA. However, once the wall yields in flexure, these curves follow the same pattern as those from simplified nonlinear static analysis without amplification of the shears per Eq. (1). In general, the fragility curves from NLRHA are closer to those from simplified nonlinear static analysis without amplification, than to those with amplification. As a matter of fact, in some cases the fragilities from NLRHA are even below those from the unamplified nonlinear static ones. Overall, the differences between the three families of curves are major, but not systematic. This points to the value of NLRHA as maybe the only means to estimate with certain confidence the post-elastic higher mode effects on wall shears.
CONCLUSIONS
The results presented in this paper show that the current approach for DC H in Eurocode 8 overestimates the post-elastic amplification of wall shears. It is safe-sided, except at one or two storeys in the upper third of wall or wall-equivalent systems. In frame-equivalent dual systems, it was found to be safe-sided only at the ground and top storeys. The constant amplification factor of 1.5, specified for DC M in Eurocode 8, is sufficient at the ground and top storeys of the DC M buildings, but far from safe-sided at the storeys in-between, especially in buildings where the walls are less dominant.
The modification proposed by Rejec et al. (2012) gives much better agreement with NLRHA. When its aim is to capture the peak inelastic shear response, it is accurate or safe-sided in wall systems. It becomes more safe-sided in wall-equivalent dual and even more in frame-equivalent ones. In a design context, though, it underestimates the inelastic shears above the ground storey in dual systems, especially frame-equivalent ones.

0.0 0.2 0.4 0.6 0.8Peak ground acceleration (g)
25M8WS
0.0 0.2 0.4 0.6 0.8Peak ground acceleration (g)
20M8WS
0.0 0.2 0.4 0.6 0.8Peak ground acceleration (g)
25H5WE
20M8FE
20M8WE
25M8FE
25M8WE
0.0
0.2
0.4
0.6
0.8
1.0
0.0 0.2 0.4 0.6 0.8
Probability
Peak ground acceleration (g)
25M5WS
0.0
0.2
0.4
0.6
0.8
1.0
Probability
20M5WE
0.0
0.2
0.4
0.6
0.8
1.0
Probability
20M5WS
25M5FE
25M5WE
25M5WS
0.0
0.2
0.4
0.6
0.8
1.0
Probability
25H5FE
0.0
0.2
0.4
0.6
0.8
1.0Probability
20M5FE
Shear amplified per Eq. (1)
NLRHA
No amplification
Figure 8. Fragility curves for failure of walls in shear
The safety shortfalls in the upper storeys are covered by the design envelope of wall shears specified in Eurocode 8 for dual buildings. Its applicability should be extended to wall systems as well. Even with the simple multiplication of shears in DC M buildings by 1.5, the Eurocode 8 envelope is safe at the design PGA, albeit marginally. It would be better to replace the 1.5-factor by a more targeted calculation of the flexural overstrength at the base, e.g., through γRdMRdwo/MEdwo.
Another conclusion is that the design envelope of the wall moments at the base moment resistance should be anchored to the moment resistance, instead of the moment from elastic analysis with the design spectrum. Even after such modification, a linear design envelope will not preclude flexural plastic hinging in upper storeys.
NLRHA of a set of wall-frame buildings tempers the alarming conclusion of Fardis et al. (2012) concerning safety of the walls. The fragilities of the walls in shear were found closer to the ones from simplified nonlinear static analysis without post-elastic shear amplification per Eq. (1), than to those with such amplification. However, it was not possible to identify a simple way to modify the fragilities of the walls in shear from nonlinear static analysis without post-elastic shear amplification, in order to approximate the fragilities obtained from NLRHA. The conclusion is that NLRHA seems to be the only means to estimate with certain confidence the post-elastic higher mode effects on wall shears.
REFERENCES
Antoniou K (2013) Seismic fragility of RC frame and wall-frame (dual) buildings designed to EN-Eurocodes, MSc Thesis, University of Patras, Greece
Biskinis DE and Fardis MN (2010a) “Flexure-controlled ultimate deformations of members with continuous or lap-spliced bars”, Structural Concrete, 11(2):93-108
Biskinis DE and Fardis MN (2010b) “Deformations at flexural yielding of members with continuous or lap-spliced bars”, Structural Concrete, 11(3):127-138

Biskinis DE, Roupakias G, Fardis MN (2004) “Degradation of shear strength of RC members with inelastic cyclic displacements”, ACI Structural Journal, 101(6):773-783
Eibl J and Keintzel E (1988) “Seismic shear forces in RC cantilever shear walls”, Proceedings of the 9th World Conference on Earthquake Engineering, Tokyo-Kyoto, Japan, 2-9 August, Vol. 6, 5-10
CEN (2004) EN 1998-1:2004 Eurocode 8: Design of structures for earthquake resistance – Part 1: General rules, seismic actions, rules for buildings, European Committee for Standardization, Brussels
CEN (2005) EN 1998-3:2005 Eurocode 8: Design of structures for earthquake resistance – Part 3: Assessment and retrofitting of buildings, European Committee of Standardization, Brussels
Fardis MN, Papailia A, Tsionis G (2012) “Seismic fragility of RC framed and wall-frame buildings designed to the EN-Eurocodes”, Bulletin of Earthquake Engineering 10(6):1767-1793
Kappos AJ and Antoniadis P (2007) “A contribution to seismic shear design of RC walls in dual structures”, Bulletin of Earthquake Engineering 5(3):443-466
Rejec K, Isaković T, Fischinger M (2012) “Seismic shear force magnification in RC cantilever structural walls, designed according to Eurocode 8”, Bulletin of Earthquake Engineering 10(2):567-586
Rutenberg A and Nsieri E (2006) “The seismic shear demand in ductile cantilever wall systems and the EC8 provisions”, Bulletin of Earthquake Engineering 4(1):1-21