evaluation of equivalency in two recordings of ... · originales para la grabación en inglés...
TRANSCRIPT

J Am Acad Audiol 17:350–366 (2006)
350
*Washington University School of Medicine, St. Louis, Missouri; †University of Wisconsin-Madison, Madison, Wisconsin;‡Kent State University, Kent, Ohio; §Cochlear Americas, Englewood, Colorado; **University of Toronto, Toronto, Ontario,Canada
Margaret W. Skinner, Department of Otolaryngology—Head and Neck Surgery, 660 South Euclid Avenue, Campus Box8115, St. Louis, Missouri 63110; Phone: 314-362-7125; Fax: 314-362-7346; E-mail: [email protected]
Portions of this manuscript were presented as a poster at the VIII International Cochlear Implant Conference, Indianapolis,Indiana, May 10–13, 2004.
This research was supported by Grant R01 DC000581 from the National Institute on Deafness and Other CommunicationDisorders and Cochlear Americas.
Evaluation of Equivalency in Two Recordingsof Monosyllabic Words
Margaret W. Skinner*Laura K. Holden*Marios S. Fourakis†John W. Hawks‡Timothy Holden*Jennifer Arcaroli§Martyn Hyde**
Abstract
Thirty “new” lists of monosyllabic words were created at the University ofMelbourne and recorded by Australian and American English speakers. Thesenew lists and the ten original CNC lists (Peterson and Lehiste, 1962) were usedduring the feasibility study of the Nucleus Research Platform 8 CochlearImplant System (Holden et al, 2004). Performance was similar across originaland new lists for six implanted Australian subjects; for four implanted U.S.subjects, mean performance was 23 percentage points lower with the new thanwith the original lists. To evaluate differences between original and new listsfor the American English recording, 22 CI recipients were administered all 40CNC lists (30 new and 10 original lists). The overall mean word score for thenew lists was significantly lower (22.3 percentage points) than for the originallists. Acoustic analysis revealed that decreased performance was most likelydue to reduced amplitudes of certain initial and final consonants. The new CNClists can be used as more difficult test material for clinical research.
Key Words: Acoustic analyses, clinical research, cochlear implant, consonants,monosyllabic words
Abbreviations: CI = cochlear implant; CNC = consonant-vowel nucleus-consonant;pps/ch = pulses per second per channel; RP8 = Research Platform 8
Sumario
Se crearon treinta “nuevas” listas de palabras monosilábicas en la Universidadde Melbourne, grabadas por hablantes de inglés australiano y americano. Seusaron estas nuevas listas y las diez listas CNC originales (Peterson y Lehiste,

Word Test Equivalency/Skinner et al
351
The CNC (consonant-vowel nucleus-consonant) monosyllabic word test(Peterson and Lehiste, 1962) has been
widely accepted in North America forevaluating open-set speech recognition ofadult cochlear implant (CI) recipients.The ten50-word lists are part of the Minimum SpeechTest Battery for Adult Cochlear ImplantUsers (Luxford et al, 2001). Each of theselists includes similar but not identicaldistributions of phonemes. When these listswere created in 1959 and revised in 1962, thephoneme distribution in each list wasproportional to that found in AmericanEnglish CNC words (Thorndike and Lorge,1944). The majority of words included wereused frequently in written and spokenAmerican English with only a few occurringwith a frequency of less than five words permillion words (word lists and frequency ofeach word’s use is given in Peterson andLehiste, 1962). Some infrequently used wordsin the CNC lists (e.g., salve, rout, mirth, andzeal) may be novel to CI recipients whoseverbal skills and vocabularies are limited.Many other recipients may not understandsome CNC words because of their impairedauditory processing capabilities. For both ofthese reasons, audiologists instruct CIrecipients to respond by saying (or writing)what they hear even if they do not knowsome of the words.
Since 1995, many CI recipients have beenevaluated with the CNC recorded listsrecommended by Luxford et al, 2001(originally recorded for Cochlear Corporation);relatively few have had scores that are below10% or above 90%. Based on these results, thistest has been of appropriate difficulty tomonitor the performance of individuals andcompare performance across recipients.Withthe advent of new cochlear implant systemsand sound-processing strategies, recipients’performance is expected to improve with morescores reaching above 90%. When this so-called ceiling effect occurs, it is impossible toknow how much better a recipient couldperform. In this case, a recorded list of wordsthat is more difficult to understand is required.Although performance can be degraded withnoise, testing in quiet avoids the possibility ofa particular recipient having a low scorebecause he or she has more difficulty thanother recipients understanding speech innoise.
Recently, 30 new lists of words werecreated at the University of Melbourne(McDermott, pers. comm., 2004) based on thesame selection criteria as was used for theoriginal ten CNC lists except that all 30 listshad identical distributions of phonemes.Thisdistribution was the average of theoccurrences of each phoneme across the tenoriginal CNC lists. Words where the final
1962) durante el estudio de factibilidad para el Sistema de Implante CoclearNucleus Research Platform 8 (Holden y col., 2004). Los desempeños fueronsimilares con las listas originales y las nuevas para seis sujetos australianosimplantados; para cuatro sujetos americanos implantados, el desempeñopromedio fue 23 puntos porcentuales más bajo con las listas nuevas que conlas originales. Para evaluar las diferencias entre las listas nuevas y lasoriginales para la grabación en inglés americano, se le aplicaron todas las 40listas CNC a 22 portadores de CI (30 listas nuevas y 10 originales). El puntajeglobal medio para las nuevas listas fue significativamente más bajo (22.3 puntosporcentuales) que para las listas originales: El análisis acústico reveló que eldesempeño más pobre era posiblemente debido a amplitudes reducidas deciertas consonantes iniciales y finales. Las nuevas listas CNC pueden serutilizadas como un material de prueba más difícil para investigación clínica.
Palabras Clave: Análisis acústicos, investigación clínica, implante coclear,consonantes, palabras monosilábicas
Abreviaturas: CI = implante coclear; CNC = consonante-núcleo vocal-consonante; pps/ch = pulsos por segundo por canal; RP8 = Plataforma deInvestigación 8

phoneme is not explicitly pronounced inAustralian English (e.g., “car”) were excluded.The lists included seven words used inAustralian English but not in AmericanEnglish.These words, their meanings, and thelists in which they occurred are as follows:“chook” (chicken; 20 and 28), “gorse” (type ofbush; 23), “jape” (joke; 29), “kip” (nap; 26),“ruck” (set up in rugby; 10, 30), “toff” (snob;16, 25), and “weir” (small dam or spillway; 10,14).When the word “weir” is spoken, its soundis identical to the American English word“we’re.” For that reason, only six words werelikely unknown to American English subjects.Recordings of these new CNC lists were madeby Australian as well as American Englishtalkers. For the American English recording,the new lists were spoken by the same maletalker as for the original CNC word lists.These recordings of the original and newCNC lists were used during the feasibilitystudy of the Nucleus Research Platform 8(RP8) Cochlear Implant System in Australiaand in the United States (Holden et al, 2004).Performance was very similar across originaland new CNC lists for the six Australiansubjects, but the four U.S. subjects’ meanscores were 23 percentage points lower withthe new lists than the original lists. Not allof the original and new lists were used fortesting every subject in this feasibility study.
The purpose of this study was to
determine whether the difference between CIrecipients’ recognition of the original andnew CNC lists for the American Englishrecordings was significant with a sufficientlylarge sample of subjects, and whether theintelligibility of the lists is equivalent amongthe original ten lists as well as among the 30new lists. Performance was evaluated with alllists presented at 60 dB SPL to represent anormal conversational level. Warble-tonethresholds were obtained to determinewhether subjects’ speech processor programsmade soft sounds audible.
METHOD
Subjects
Twenty-two adult CI recipients and fivenormal-hearing adults participated in thestudy. Demographic information for CIsubjects is given in Table 1.Twenty-one of theCI subjects had postlinguistic and one hadprelinguistic onset of profound hearing loss.For participation in the study, CI subjectswere required to have scores of at least 20%(60 dB SPL presentation level) on the originalCNC recordings at their most recentevaluation. Subjects ranged in age from 22 to79 years with a mean of 56 years. Durationof severe-to-profound hearing loss prior to
Journal of the American Academy of Audiology/Volume 17, Number 5, 2006
352
Table 1. Biographical Information
Subject Sex Etiology # Yrs. of Deafness Age at Study Length of CI Use (yrs.)
1 F Unknown .66 73 2.52 M Unknown 43 43 1.53 F Genetic 4 48 14 F Unknown 2 78 25 F Genetic 7 51 36 F Unknown 2 54 1.57 F Unknown 8 34 18 M Genetic 2 69 49 F Auto Immune 5 44 1.510 F Otosclerosis 4 55 111 F Genetic 6 53 312 M Noise 9 75 413 M Meningitis 2 60 114 M Otosclerosis 11 77 1615 M Noise 2 79 416 F Genetic 5 48 117 M Genetic 1 51 718 F Genetic 3 82 1.519 F Otosclerosis 5 56 820 M Ushers’ 3 48 221 F Genetic 6 22 322 F Unknown 3 42 4
Word Test Equivalency/Skinner et al
353
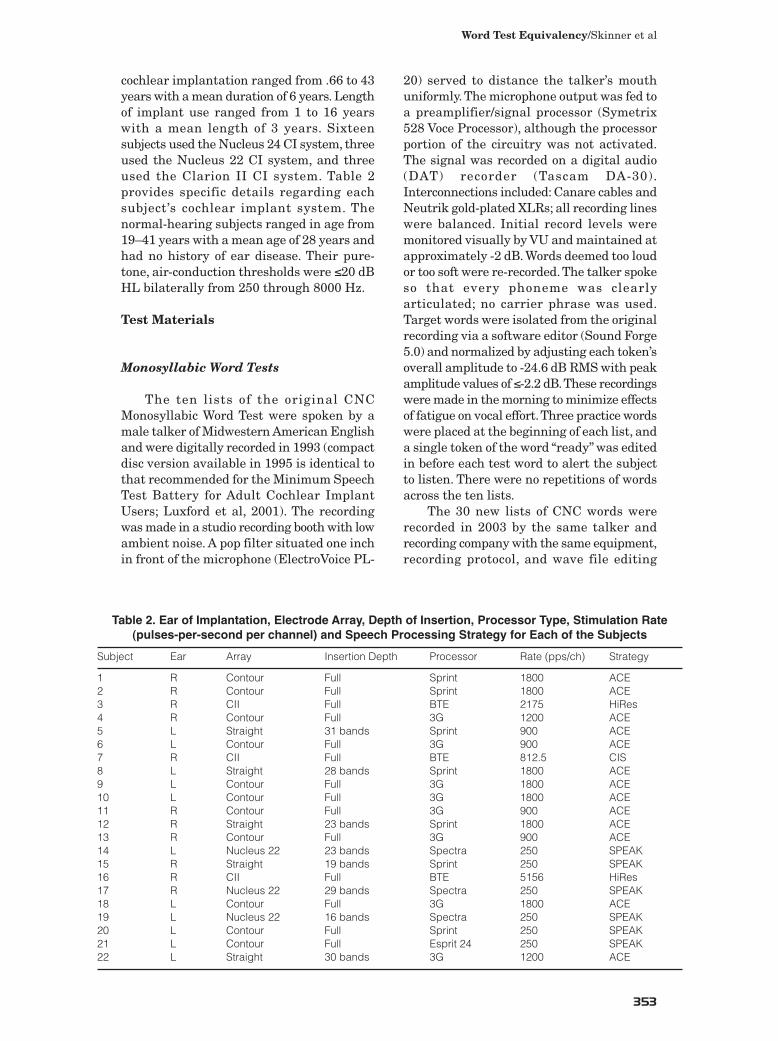
cochlear implantation ranged from .66 to 43years with a mean duration of 6 years. Lengthof implant use ranged from 1 to 16 yearswith a mean length of 3 years. Sixteensubjects used the Nucleus 24 CI system, threeused the Nucleus 22 CI system, and threeused the Clarion II CI system. Table 2provides specific details regarding eachsubject’s cochlear implant system. Thenormal-hearing subjects ranged in age from19–41 years with a mean age of 28 years andhad no history of ear disease. Their pure-tone, air-conduction thresholds were ≤20 dBHL bilaterally from 250 through 8000 Hz.
Test Materials
Monosyllabic Word Tests
The ten lists of the original CNCMonosyllabic Word Test were spoken by amale talker of Midwestern American Englishand were digitally recorded in 1993 (compactdisc version available in 1995 is identical tothat recommended for the Minimum SpeechTest Battery for Adult Cochlear ImplantUsers; Luxford et al, 2001). The recordingwas made in a studio recording booth with lowambient noise. A pop filter situated one inchin front of the microphone (ElectroVoice PL-
20) served to distance the talker’s mouthuniformly. The microphone output was fed toa preamplifier/signal processor (Symetrix528 Voce Processor), although the processorportion of the circuitry was not activated.The signal was recorded on a digital audio(DAT) recorder (Tascam DA-30).Interconnections included: Canare cables andNeutrik gold-plated XLRs; all recording lineswere balanced. Initial record levels weremonitored visually by VU and maintained atapproximately -2 dB. Words deemed too loudor too soft were re-recorded.The talker spokeso that every phoneme was clearlyarticulated; no carrier phrase was used.Target words were isolated from the originalrecording via a software editor (Sound Forge5.0) and normalized by adjusting each token’soverall amplitude to -24.6 dB RMS with peakamplitude values of ≤-2.2 dB.These recordingswere made in the morning to minimize effectsof fatigue on vocal effort.Three practice wordswere placed at the beginning of each list, anda single token of the word “ready” was editedin before each test word to alert the subjectto listen. There were no repetitions of wordsacross the ten lists.
The 30 new lists of CNC words wererecorded in 2003 by the same talker andrecording company with the same equipment,recording protocol, and wave file editing
Table 2. Ear of Implantation, Electrode Array, Depth of Insertion, Processor Type, Stimulation Rate(pulses-per-second per channel) and Speech Processing Strategy for Each of the Subjects
Subject Ear Array Insertion Depth Processor Rate (pps/ch) Strategy
1 R Contour Full Sprint 1800 ACE2 R Contour Full Sprint 1800 ACE3 R CII Full BTE 2175 HiRes4 R Contour Full 3G 1200 ACE5 L Straight 31 bands Sprint 900 ACE6 L Contour Full 3G 900 ACE7 R CII Full BTE 812.5 CIS8 L Straight 28 bands Sprint 1800 ACE9 L Contour Full 3G 1800 ACE10 L Contour Full 3G 1800 ACE11 R Contour Full 3G 900 ACE12 R Straight 23 bands Sprint 1800 ACE13 R Contour Full 3G 900 ACE14 L Nucleus 22 23 bands Spectra 250 SPEAK15 R Straight 19 bands Sprint 250 SPEAK16 R CII Full BTE 5156 HiRes17 R Nucleus 22 29 bands Spectra 250 SPEAK18 L Contour Full 3G 1800 ACE19 L Nucleus 22 16 bands Spectra 250 SPEAK20 L Contour Full Sprint 250 SPEAK21 L Contour Full Esprit 24 250 SPEAK22 L Straight 30 bands 3G 1200 ACE

procedure.There were 572 new words includedin the 30 lists (see Appendix A; six AustralianEnglish words not used in American Englishare shown in bold type. The word “weir” thatsounds the same as the American Englishword “we’re” is not shown in bold). Of the 500words in the original ten lists, 355 (71%) werereused within the 30 new lists; 204 of thesewords were repeated twice; and 55 wererepeated a third time. Within each of thethree sets of ten lists (i.e., 1–10, 11–20, and21–30), there were no repetitions of theoriginal CNC words; however, there wererepetitions across the three sets.The repeatedwords were uniquely spoken for each list.Theword “ready” was placed before each test word.The male talker did not recall speaking thenew lists differently from the original listsduring recording; however, they were spokenten years later.
Warble Tones
The warble tones (centered at .25, .5, .75,1, 1.5, 2, 3, 4, and 6 kHz) were sinusoidalcarriers modulated with a triangular functionover the standard bandwidths recommendedfor use in the sound field by Walker et al(1984). The modulation rate was 10 Hz. Aconversion from dB SPL to dB HL in thesound field was made using data obtained byPascoe (1975) and Skinner (1988) at CentralInstitute for the Deaf (CID). For thisconversion, the following values aresubtracted from the dB SPL values: 15, 11,9, 7, 5, 3, -2, -3, and 6 dB at .25, .5, .75, 1, 1.5,2, 3, 4, and 6 kHz, respectively.
Equipment/Test Environment
The warble tones and recordings of theoriginal and new CNC lists were presented tosubjects in a double-walled sound attenuatingbooth (IAC; model 1204-A; 254 cm x 264 cmx 198 cm) through a loudspeaker placed at ear-level height at 0 degrees azimuth and 1.5meters from the center of the subjects’ headsin their absence. Test materials werepresented via an IBM compatible, Pentium IIcomputer that controlled a mixing andattenuation network (Tucker-DavisTechnologies) to present sound through apower amplifier (Crown model D-150) andloudspeaker (Urei; model 809). Warble tonesand words were stored as wave files on thehard disk. The sound pressure level (SPL) of
the stimuli was measured with themicrophone (Brüel and Kjaer, Model 4155) ofthe sound level meter (Brüel and Kjaer, Model2230) at the position of the subject’s headduring testing. The overall SPL of the wordswas taken as the average of peaks on theslow, rms, linear scale. These measurementswere made for the original and new lists.With software control, the overall presentationlevel of every list was the same, 60 dB SPL.
Procedures
This study followed a randomized-block(within subjects) design for which a differentrandom ordering of the 40 lists (Lists 1–30:new lists; Lists 31–40: original lists) wasassigned to each subject. Each list waspresented only once, except that the last twolists (one new and one original list) assignedto each subject were presented as practicelists at the beginning of testing.These practicelists were used to familiarize subjects with thetest materials and to minimize learningeffects. Subjects used the same speechprocessor program or map and sensitivityand volume control settings for testing asthey used in everyday life. At each of fourtest sessions spaced one week apart, ten CNClists were presented.Warble-tone, soundfieldthreshold levels were obtained for each of theCI subjects during the first and third sessionsto insure that all subjects had threshold levelsat 30 dB HL or less across the frequencyrange and that no changes in hearingsensitivity occurred during the study.
For the past 20 years, speech recognitiontests have been presented to cochlear implantrecipients at a raised-to-loud level of 70 dBSPL. In this study, the words were presentedat 60 dB SPL in quiet. A 60 dB SPLpresentation level was chosen because it ismore representative of conversational speech(Pearsons et al, 1976). In addition, a study byFirszt et al (2004) showed that a group of 78CI users did not perform significantly pooreron CNC words (original recording) presentedat 60 dB SPL (39%) than at 70 dB SPL (42%).
Data Analysis
Rationale for Number of Subjects
The inclusion of 22 CI subjects was based
Journal of the American Academy of Audiology/Volume 17, Number 5, 2006
354

Word Test Equivalency/Skinner et al
355
on the following analysis. List equivalence canbe defined by a consensus criterion that notwo lists of 50 words each shall differ inexpected score by three items or more (i.e.,≤6%). A contrast of any two lists isappropriately modeled by the difference inbinomial variates. Such contrasts are leastsensitive at the point of maximum variance,in the region of 50% correct. The samplingdistribution of the difference is well-approximated by a normal variate withvariance 2 x 50 x p(1-p) where p is theBernoulli parameter for each list item; formaximum variance, p is 0.5.The conventionalcomputation based on the standard normaldeviate yields a minimum number of CIsubjects of 22 for a two-sided alpha of 0.05 anda minimum power of 0.8 to detect a truedifference in size of at least 6%.
Statistical Analyses
The first null hypothesis was that groupmean scores (across CI recipients) would beequivalent for the 30 new CNC lists. Thesecond null hypothesis was that group meanscores (across CI recipients) would beequivalent for the ten original CNC lists.The third null hypothesis was that thegroup mean scores (across CI subjects andlists) for the new and original CNC listswould be equivalent. These hypotheses weretested for word and phoneme scoresseparately.
The first two hypotheses were testedusing the Friedman test (two-way analysis ofvariance [ANOVA] by ranks). The thirdhypothesis was tested with the Wilcoxon testusing paired differences between subjectmeans for original lists versus new lists. Thedata also were analyzed using parametricGeneral Linear Model (GLM) RepeatedMeasures ANOVA with Geisser-Greenhouseadjustments, with similar results. Theconventional arcsine (root) transformationof raw scores to promote variancehomogeneity was applied only to theparametric analyses. Interactions andextreme values were explored by examiningresiduals from the parametric ANOVAs forthe original and new sets of lists. In this way,potentially deviant lists could be identified.Differences between pairs of lists wereexamined using the Tukey HSD test based on
the Studentized range.
Acoustic Analyses
As stated above, 355 of the 500 words inthe original lists were used within the newlists, and many of these words were repeatedtwice and some three times in the new lists(henceforth called “shared words”). Thisrepetition afforded the opportunity toexamine the subjects’ responses to differenttokens of the same word. We chose three listsfor analysis on which the mean scores acrossCI subjects were identical. These originallists (numbers 32, 35, and 36) contained 108words that occurred 159 times in the newlists. The 108 words as spoken in the originaland new lists were transcribed, and allsubjects’ responses to these words (in bothsets of lists) were converted from theorthographic representation that the subjectsused to a phonetic representation usingstandard American English as a guideline.Percent correct identification scores werecomputed for each shared word in the originaland new lists. Words for which theidentification score was at least 20% lower (n= 71) in the new compared to the original listswere selected for acoustic analysis. Theanalysis involved the examination of thewaveform of each word, measurements ofclosure, burst, voice onset time, and RMS(root mean square) amplitude of consonantrelated intervals. Furthermore, confusionmatrices were created for initial consonants,medial vowels, and final consonants.
Word duration measurements were madeof 49 words in original lists 32, 35, and 36 forwhich CI subjects had scores that were≥20% poorer for the same words that occurred70 times in the new lists. These measureswere obtained to determine whether therewas a significant decrease in word durationthat could have contributed to the poorerperformance.
RESULTS
Warble-Tone, Soundfield Thresholds
Group mean warble-tone, soundfieldthresholds from 250 to 6000 Hz for the CIsubjects are shown in Figure 1. These

Journal of the American Academy of Audiology/Volume 17, Number 5, 2006
356
thresholds range from 19.3 to 23.8 dB HL forindividual frequencies; the group meanthreshold across frequencies and CI subjectsis 21.6 dB HL. According to ArticulationTheory (e.g., Pavlovic et al, 1985), thesethresholds suggest that audibility should notbe a limiting factor in the recognition of thesewords presented at 60 dB SPL.
Individual CI Subjects’ Performanceacross Word Lists
Each CI subject’s mean word score acrossthe 30 new lists as well as the 10 original listsis shown in Figure 2. The range of meanscores for the 30 new lists is 12.9 to 59.2% andfor the original lists is 25.4 to 81.0%. Nosubject had lower than a 4% word score onany list. Scores on the original lists showthat the performance criterion for subjectselection of ≥20% was met, a wide range ofperformance was represented, andperformance on the new lists was abovechance for all subjects. Although the groupmean difference in word score across subjectsand lists was 22.3 percentage points betweenthe new and original lists, there was
Figure 1. Mean warble-tone, soundfield thresholds(dB HL) from 250 through 6000 Hz across the CI sub-jects. Error bars are ±1 standard error of the mean.
Figure 2. Individual subjects’ word scores (percent correct) for the 30 new and 10 original lists for the 22 CIsubjects. The filled and open circles represent the new and original list results, respectively. Error bars are ±1standard error of the mean.

Word Test Equivalency/Skinner et al
357
considerable individual variability in thesescore differences.
Each CI subject’s mean phoneme scoreacross the 30 new lists as well as the tenoriginal lists is shown in Figure 3. The rangeof mean scores across the new lists is 44.0 to81.8% and across the original lists is 54.0 to92.7%.The group mean difference in phonemescore across subjects and lists is 13.3percentage points, a difference that isconsiderably smaller than that for words(22.3 percentage points). The reason for thisdifference is that subjects often responded totwo out of three phonemes correctly in thewords. For example, the subject with thelowest word score on any list (4%) notedabove had a phoneme score of 48%.
Group Performance of CI andNormally Hearing Subjects for WordLists
The mean word score for each list acrossCI subjects (circles) and across normallyhearing subjects (diamonds) are shown inFigure 4. For CI subjects, mean list scores
range from 26.9 to 42.9% with an overallmean of 34.4% for the new lists; scores rangefrom 51.3 to 62.9% with an overall mean of56.7% for the original lists.The large standarderror ranges are expected given theconsiderable variability in CI subjects’performance shown in Figure 2. The totalrange of mean list scores is larger with thenew lists (16.0%) than for the original lists(11.6%).
Statistical analyses revealed that all nullhypotheses were rejected. That is, the groupmean word scores for the 30 new lists werenot equivalent (p < 0.0001; Friedmannonparametric ANOVA); group mean scoresfor the ten original lists were not equivalent(p < 0.0001; Friedman nonparametricANOVA); and scores for the new lists were notequivalent to the original lists (p < 0.0001;Wilcoxon test).
Visual inspection of the rank-orderedmean scores across subjects for each of thenew lists (Figure 5) suggests that List 6 (rank 1)and List 26 (rank 30) might be substantivelydifferent from the remaining body of lists.Thedifferences between these lists and their
Figure 3. Individual subjects’ phoneme scores (percent correct) for the 30 new and 10 original lists for the 22CI subjects. The filled and open circles represent the new and original list results, respectively. Error bars are±1 standard error of the mean.

Journal of the American Academy of Audiology/Volume 17, Number 5, 2006
358
Figure 4. Group mean word score (percent correct) across CI subjects (circles) and normally hearing subjects(diamonds) for each of the new and original lists. Error bars are ±1 standard error of the mean. The upper andlower dashed gray lines represent the mean word score across original and new lists, respectively.
Figure 5. Group mean phoneme score across CI subjects for the new and original lists. The scores are rankordered from lowest to highest score. Error bars are ±1 standard error of the mean. The upper and lower dashedgray lines represent the mean phoneme score across original and new lists, respectively.

Word Test Equivalency/Skinner et al
359
nearest neighbors are larger than otherdifferences between adjacent-ranked listsbut did not achieve statistical significance onthe conservative post hoc Tukey HSD test(with a computed 95% critical Studentizedrange difference of 5%). Nevertheless, thepossibility that Lists 6 and 26 are genuinelydeviant from the main body of lists should beconsidered carefully in the light of a variancecomponent. Of the old lists, visual inspectionof Figure 5 shows that List 39 (rank 40) ispossibly deviant as well. While the extreme-ranked new lists are clearly, significantlydifferent from each other on the basis of theglobal ANOVA, judgments about the“deviance” of individual lists from this dataset are speculative and hypothesis generating.Confirmatory studies would be required toestablish deviance of the suspect lists usinga priori contrasts with nominal type I errorrates.
The group-mean scores for the normal-hearing subjects on the new lists ranged from94.4 to 99.6% with an overall mean of 97.7%.The scores on the original lists ranged from96.0 to 100% with an overall mean of 99%.Although only five normal-hearing subjectswere tested, the results showed near perfectperformance for the original as well as the
new lists. For this reason, additional normal-hearing subjects were not evaluated andfurther statistical analyses were notperformed.
The mean phoneme score for each listacross CI subjects (circles) and normal-hearing subjects (diamonds) are shown inFigure 6. For CI subjects, list scores rangefrom 57.2 to 69.5% with an overall mean of64.1% for the new lists; scores range from 75.9to 80.3% with an overall mean of 77.4% forthe original lists. As for the words, meanphoneme scores for new Lists 6 and 26 as wellas for original List 39 were found to bepossibly deviant.
Statistical analyses revealed that thefollowing null hypotheses were rejected. Thegroup mean phoneme scores for the new lists,for the new lists with Lists 6 and 26 removed,and for the new lists compared to the originallists were not equivalent at the 0.0001 level.In addition, the group-mean scores for theoriginal lists were not equivalent at the 0.012level. However, when List 39 was removed,the group mean scores across the remainingnine original lists were equivalent (i.e., thescores were no longer significantly different;p = 0.20). For normal-hearing subjects, groupmean phoneme scores ranged from 98.2 to
Figure 6. Group mean word score (percent correct) across CI subjects (circles) and normally hearing subjects(diamonds) for each of the new and original lists. The filled and open symbols represent the new and originallist results, respectively. Error bars are ±1 standard error of the mean. The upper and lower dashed gray linesrepresent the mean word score across original and new lists, respectively.

Journal of the American Academy of Audiology/Volume 17, Number 5, 2006
360
100% across new and original lists with anoverall mean of 99%. Statistical analyses ofthese scores were not performed because thescores were nearly perfect.
Comparison of Performance onAustralian and American EnglishWords
The six Australian English words in thenew lists were unknown to the subjects inthis study. The mean scores of the normal-hearing and CI subjects respectively onthese words are as follows: “chook” (60%;14%); “gorse” (40%; 0%); “jape” (100%; 0%);“kip” (100%; 0%); “ruck” (100%; 9%); and“toff ” (100%; 0%). The normal-hearingsubjects identified four of the six words with100% accuracy; for the other two words, allbut one of the errors were for one phonemein each word. For the CI subjects, most of theerrors also were for one phoneme in eachword. Whereas the majority of these“unknown” words were identified accuratelyby the normal-hearing subjects, the CIsubjects identified most of them incorrectly.For both groups of subjects, errors weremainly on one of the three phonemes ineach word. It is important to consider theseresults in the comparison with AmericanEnglish words in the new lists with whichboth normal-hearing and CI subjects haddifficulty. For example, normal-hearing andCI subjects had mean scores, respectively, onthe following words: “bane” (40%; 0%); “fin”(20%; 0%); and “sheaf” (40%; 0%). That is, lowperformance occurred for both Australianand American English words.
Each list in which an Australian Englishword occurred included only one of thesewords. For these lists (i.e., 10, 16, 20, 23, 25,26, 28, 29, and 30), the group mean scores (seeFigure 4 and Appendix B) for the CI subjectswere close to the mean across lists (34.4%)except for List 26. For this list, the groupmean score for the normal-hearing and CIsubjects was 100% and 26.9%, respectively.These results suggest that the inclusion of thenine tokens of the six Australian Englishwords among a total of 1500 word tokensincluded in the 30 new lists did notsignificantly impact the overall performanceof the CI subjects.
Comparison of Performance onShared Words
Overall
The shared words were identified by theCI subjects with 58.8% accuracy whenpresented from the original recording andwith 41.2% accuracy when presented from thenew recording. The difference of 17.6percentage points is consistent with theoverall mean difference of 22.3 percentagepoints found between the new and originallists. Next, confusion matrices were examinedto determine whether there was any specificclass of sounds that was affected more thanothers, starting with broad classes such asinitial and final consonants or vowels as wellas more specific subclasses (i.e., stops andfricatives). Overall, initial consonants showedthe highest decrement, with 73.5% correctidentification in the original lists versus56.1% identification in the new lists. Finalconsonants also showed a decrement with75.3% identification in the original listsversus 63.3% in the new lists. Vowels alsowere affected but not as much as theconsonants. Vowels in the original lists wereidentified with 84.4% accuracy versus 78.2%in the new lists. Because consonants weremost affected, initial and final consonantswere divided into the following classes: stops[p, b, t, d, k, g]; weak fricatives [f, v, θ, δ, h];strong fricatives [s, ∫, z, =]; affricates [t∫, d=];nasals [m, n] and [η] in final position only; and[w, y, r, l] in initial position and [r, l] in finalposition.
Initial Consonants
Table 3 shows the percent correctidentification scores for the differentconsonant classes in initial position for thenew and original lists.The largest decrementsin score between the original and new listswere for stop (30 percentage points), affricate(19 percentage points), and weak fricative(16 percentage points) classes. Percent correctidentification scores for each stop is shown inTable 3. The largest decrement in scorebetween the original and new lists was for thealveolar stop [t] (40 percentage points)followed by [d] (36 percentage points), [k] (34percentage points), and [g] (29 percentagepoints).

Word Test Equivalency/Skinner et al
361
Examination of the confusion matricesshowed an increase of [h] error responses towords starting with stops, in both absolutenumbers (original lists: 68; new lists: 277) aswell as in percentage points (original: 8.1;new: 19.7). In addition, there was an increasein the number of “no response” errors to wordinitial stops (original: 2.5%; new: 8.9%).Although weak or absent bursts are verycommon in running speech, the CNC wordswere spoken in citation form following one-second silence between “ready” and thestimulus word. Correct identification of astop consonant in the initial position iscritically dependent on the presence of theburst, regardless of the place of articulation.When no burst is heard, then the presence ofany aspiration noise may induce theperception of a weak fricative like [h]. Thisexplanation is consistent with the largeincrease in error responses of [h] with the newlists. Acoustic analyses showed two probablereasons why the bursts were not correctlyidentified in the new lists. First, the burstswere on average 9 dB lower in amplitude, andsecond, some words had no bursts comparedto the same words in original lists. Forexample, the words “dock” and “care” hadstrong initial bursts in the original lists andno discernible bursts in the new lists. Thesewords were associated with a large decrementin score from the original to the new lists.Themean score for “dock” decreased from 82% to5% and for “care” from 65% to 0% for theoriginal and new lists, respectively.
Table 3 also shows the percent correct
identification scores for each of the initialweak fricatives and affricates that occurredamong the shared words.The voiced affricate[d=] and the voiceless glottal fricative [h] hadthe largest decreases in correct identificationscores (25 and 19 percentage points,respectively).The voiced affricates were mostoften confused as stops, with 43 [t] and [d]responses, accounting for more than two-thirds of the error responses. This resultsuggests that subjects were not hearing thefrication part of the affricate. The acousticanalysis did not show any consistent patternthat could be identified as a cause for thisincrease. The decrease in the correctidentification of [h] resulted from an increasein “no responses” from 1.5% in the originallists to 11.3% in the new lists, as well as anincrease in errant stop responses from 22.7%in the original lists to 29.5% in the new lists.Acoustic analysis revealed two factors thatmight account for this decrement. One wasa slight average decrease of 3.2 dB in overallamplitude that was coupled with an average29 msec decrease in duration of this phoneme(mean duration in old lists = 83 msec; in newlists = 54 msec).
Final Consonants
Table 4 shows the percent correctidentification scores for each subclass ofconsonants in final position for the sharedwords. The greatest decrease in performanceoccurred for final nasals (24 percentagepoints) in the new lists compared to the
Table 3. Mean Percent Correct Identification Scores for the Different Consonant Classes in InitialWord Position for Both the Original and New CNC Lists
Consonant Class
List Stops Fricatives (Weak) Fricatives (Strong) Affricates Nasals w, r, y, l
Original Lists 73 50 90 92 74 75New Lists 43 34 86 73 64 67
Stops
List p b t d k g
Original Lists 35 71 92 80 79 83New Lists 13 53 52 44 45 54
Weak Fricatives and Affricates
List f v θ h t∫ d=Original Lists 56 26 5 66 88 93 New Lists 43 16 7 47 76 68

original lists, followed by affricates (21percentage points) and stops (13 percentagepoints). Excluding cases where the nasalityfeature was correctly identified but place ofarticulation was not, there appear to be twoacoustic factors contributing to the decrementin correct identification of final nasals in thenew lists. That is, these nasals were about 64msec shorter (25%) and 7.6 dB weaker thanin the original lists. This may account forthe increase of errant stop responses from 8%to 11% and [v] responses from 2.4% to 6%. Inaddition, place of articulation errors increasedfrom 10% in the original lists to 15.5% inthe new lists. The decrease in affricateidentification was due to an increase of [t] and[d] error responses which occurred only 6%of the time with the original lists but 18% ofthe time with the new lists. These errorresponses were not supported by anyconsistent acoustic differences betweenshared words in the two sets of recordings.
Table 4 shows the percent correctidentification scores for each stop separately.It can be seen that the voiced bilabial stop [b]was most affected; that is, it was identifiedwith 75% and 42% accuracy in the original andnew lists, respectively. For example, acousticanalysis of the word “robe” showed that thefinal [b] in this word in the original recordingexhibited very strong voicing during closureand a very strong burst that was 18 dBstronger than the burst for the final [b] in thesame word in the new recording. As notedfor initial stops, the decrease in score wasaccompanied by much lower burst amplitudein the new versus the original lists.
Word Duration Measurements
The mean duration of 49 of the sharedwords in original Lists 32, 35, and 36 was 568
msec (SD = 74.0 msec). There were 70occurrences of these words in the new lists;their mean duration was 521 msec (SD =77.5 msec). Thus, the words in the new listswere 8.3% shorter than those in the originallists. A pairwise t-test showed that there wasa significant difference in mean duration (t [69] = 5.646, p < .01). However, regressionanalysis attempting to predict the scoredifference from the durational differenceyielded a nonsignificant standard betacoefficient. Therefore, it is unlikely that theshortening of these words in the new lists isresponsible for the 22.3 percentage pointdecrease in overall performance with thenew lists.
Summary
The decrease in performance for wordsoccurring in both the new and original listsis likely due to the reduced amplitudes forcertain classes of consonants for whichamplitude can be an important perceptualcue. Most affected were stops, affricates, andweak fricatives in initial position and nasals,affricates, and stops in final position.
DISCUSSION
The decrease in group mean score (22.3percentage points) with the new versus
the original CNC lists for the CI subjects inthis study agrees closely with the 23 per-centage point mean decrease in score by U.S.recipients of the Nucleus RP8 CI System(Holden et al, 2004).Acoustic analysis coupledwith analysis of confusion matrices of wordsoccurring in both original and new lists sug-gests that the major reason for this decrementin score for the CI recipients was a decreasein amplitude of stop bursts, affricates, weak
Journal of the American Academy of Audiology/Volume 17, Number 5, 2006
362
Table 4. Mean Percent Correct Identification Scores for the Different Consonant Classes in Final WordPosition for Both the Original and New CNC Lists
Consonant Classes
List Stops Fricatives (Weak) Fricatives (Strong) Affricates Nasals r, l
Original Lists 80 37 90 86 68 88New Lists 67 34 86 65 44 84
Stops
List p b t d k g
Original Lists 67 75 87 83 81 71New Lists 58 42 70 68 71 69

fricatives, and nasals in the new lists. Thatis, these phonemes were incorrectly identifiedmore often on the new lists because theircues were either absent or weak. This dif-ference is seemingly not related to the record-ing equipment, recording procedure, or edit-ing software because all were identical for theoriginal and new lists. In addition, it cannotbe argued that the original and new listswere spoken at speaking rates that differedsignificantly for the following reasons. First,two studies of the effect of clear versus con-versational speaking rates on speech recog-nition (Picheny et al, 1985 and 1986) revealedthat words were twice as long (100 versus 200words per minute) for the clear rate. Second,analyses in the present study showed that theduration of shared words in the original listswere only about 8% longer than those in thenew lists. This difference in rate is muchsmaller than that found by Picheny et al. Itis improbable that word duration was animportant reason for the decrease in per-formance with the new lists.The same talkerwas used for recording both the original andnew lists. When the new lists were recordedten years after the original lists, it appearsthat he spoke some consonant classes (listedabove) with substantially reduced amplitudewhen recording the new lists. Finally, thenormal-hearing subjects obtained scores thatwere well above 90% on original and newlists, indicating that the decrease in phonemeamplitude did not affect their performancenearly as much as it did for the CI subjects.If the new lists are to be used with CI recip-ients, one must take into account thephonemes with reduced amplitude and theireffect on performance.As described above, theinclusion of six Australian English wordsunknown to the American English speakingsubjects did not appear to have a substantivenegative impact on overall performance on thenew lists.
While the initial intent of creating the 30new lists was to generate lists of equivalentdifficulty to the original ten lists, the resultis that the new lists are more difficult thanthe original. However, these new lists may beuseful as a more difficult speech recognitiontest for CI recipients. The CI subjects in thisstudy were chosen to demonstrate a widerange of speech recognition performance.Individual mean word scores across the tenoriginal CNC lists ranged from 25% to 81%.However, half of the subjects in this study had
mean word scores (across original lists) ofgreater than 65% and mean phoneme scoresof greater than 80%. As technology continuesto advance, speech recognition will likelycontinue to improve as well. Thus, a morechallenging monosyllabic word test is neededto assess CI recipients’ ability to understandspeech.
Furthermore, in clinical research, it isimportant to minimize sources of test-scorevariability as well as to minimize learningeffects. To accomplish this, a number ofequally intelligible lists are needed. Statisticalanalysis revealed that the ten original CNClists were not equally intelligible nor were the30 new lists. However, by averaging meanscores for the pair of lists with the lowest andhighest scores and working toward the middlelists pair-wise (e.g., Lists 26 and 6, Lists 14and 5, Lists 19 and 7, etc. [see Appendix B])will provide two-list (100 word) combinationsthat should yield very homogeneous scores.Using this method gives 15 pairs of new listswith scores ranging from 33.5% to 34.9% andfive pairs of the original lists with scoresranging from 55.9% to 57.4% (see AppendixesB and C). This strategy of pairing observedextreme-ranked lists is likely to produce morehomogeneous combined lists, because thedifferences between the extreme-ranked listsare highly significant statistically and are notattributable to chance. However, the strategycapitalizes on chance as expressed by randomerrors in this particular dataset. Thehomogeneity of the specified combined listswould be established more definitely byconfirmatory studies.
CONCLUSION
For the CI subjects, the overall mean wordscore (across subjects and lists) for the 30
new CNC lists created at the University ofMelbourne and recorded in the United Statesis significantly lower (22.3 percentage points)than the same score for the ten original CNClists. Five normal-hearing subjects had nearperfect scores for both the original and newlists. Statistical analysis revealed that thenew lists are not equally intelligible nor arethe original lists; however, pairing extreme-ranked lists gives 15 (100-word) pairs of newlists and five (100-word) pairs of originallists that yield very homogeneous scores(range: <3% for both sets), which can be usedfor clinical assessment as well as for research.
Word Test Equivalency/Skinner et al
363

Acoustic analysis of the same words occurringin both the new and original lists revealedthat the difference in performance betweenthe two sets of lists is most likely due toreduced amplitudes of certain initial andfinal consonants in the new lists despite theuse of identical overall presentation level fororiginal and new lists.
Acknowledgments. This research was supportedby Grant RO1 DC000581 from the National Instituteon Deafness and Other Communication Disorders.Cochlear Americas funded the recording of originaland new word lists, evaluation of normal-hearing sub-jects’ performance, and generation of phonetictranscriptions of CI subjects’ responses to “sharedwords.” Appreciation is expressed to the 27 subjectswho graciously gave their time and effort to partici-pate in this study; to Jon Shallop who was the talkerfor the original and new CNC recordings; to KennetPlantell and Bjarne Blume of AVCOM MediaProductions, Inc. who made the original and newrecordings; and to Brenda Gotter, Christine Brenner,and Sallie Vanderhoof for assistance in data collec-tion and entry. This research was approved by theHuman Studies Committee at Washington UniversitySchool of Medicine.
REFERENCES
Firszt JB, Holden LK, Skinner MW, Tobey EA,Peterson A, Gaggl W, Runge-Samuelson C, Wackym,PA. (2004) Recognition of speech presented at soft toloud levels by adult cochlear implant recipients ofthree cochlear implant systems. Ear Hear25(4):375–387.
Holden LK, Plant K, Skinner MW,Arcaroli J,WhitfordL, Nel E, Cowan R. (2004) Evaluation of new codingstrategies in the Nucleus research platform 8 system.Poster presentation at the VIII International CochlearImplant Conference, Indianapolis.
Luxford W, Ad Hoc Subcommittee. (2001) Minimumspeech test battery for postlinguistically deafenedadult cochlear implant patients. Otolaryngol HeadNeck Surg 124:125–126.
Pascoe DP. (1975) Frequency responses of hearingaids and their effects on the speech perception of hear-ing-impaired subjects. Ann Otol Rhinol Laryngol 84(Suppl. 23):1–40.
Pavlovic CV, Studebaker GA, Sherbecoe RL. (1985)An articulation index based procedure for predictingthe speech recognition performance of hearing-impaired individuals. J Acoust Soc Am 80:50–57.
Pearsons KS, Bennett RL, Fidell S. (1976) Speechlevels in various environments. Bolt, Beranek andNewman Report No. 321. Canoga Park, CA: Bolt,Beranek and Newman.
Peterson GE, Lehiste I. (1962) Revised CNC lists forauditory tests. J Speech Hear Disord 27:62–70.
Picheny MA, Durlach NI, Braida LD. (1985) Speakingclearly for the hard of hearing I: Intelligibility dif-ferences between clear and conversational speech. JSpeech Hear Res 28:96–103.
Picheny MA, Durlach NI, Braida LD. (1986) Speakingclearly for the hard of hearing. II: Acoustic charac-teristics of clear and conversational speech. J SpeechHear Res 29:434–446.
Skinner MW. (1988) Hearing Aid Evaluation.Englewood Cliffs, NJ: Prentice Hall.
Thorndike EL, Lorge I. (1944) The Teacher’s WordBook of 30,000 Words. New York: Bureau ofPublications.
Walker G, Dillon H, Byrne D. (1984) Sound-fieldaudiometry: recommended stimuli and procedures.Ear Hear 5:13–21.
Journal of the American Academy of Audiology/Volume 17, Number 5, 2006
364

BADGEBAITBANBANEBANGBAREBARGEBARKBARNBASEBATBATCHBEADBEEFBEERBEESBIDEBILEBILLBIRDBOARDBOGBOONBOOTHBORNBOSSBOUTBOWELBUCKBUDGEBUFFBULLBUSBUYSCADCAKECANECAPCARVECASECHAFECHAFFCHAPCHARMCHASECHEATCHESSCHEWEDCHIDECHIMECHIPCHIRPCHOKECHOOKCHOPCHOSECHUCKCHUGCHURCHCHURNCOACHCODCODECOG
COILCOMECONCOOKCOOPCOPCOPECORDCORKCORNCOULDCOURSECOURTCOVECOWSCUDCUFFCULLCURBCURLCURSECURTDADDALEDAMEDAREDARKDARNDASHDAUBDEAFDEBTDEEDDEEMDEERDEIGNDELLDIALDICEDIEDDILLDINEDIRTDOESDOLLDOMEDONEDOTDOTEDOWELDUBDUCKDUDDUGDUKEDUTCHDYKEFADFAIRFAMEFANGFARMFATFATE
FAWNFEARFEDFEEDFEIGNFELLFETCHFIBFIGHTFILEFINFIZZFOILFORCEFORMFOURTHFOYERFUNFURLFURSGAFFGALLGAMEGAPEGATEGAUGEGAVEGELGIGGILLGIRDGIRTHGNATGNOMEGOADGOATGODGOOFGOONGORSEGOUTGUILEGUISEGUMGUSHGUTGYMHACKHADHAGHANGHARKHARMHATHATCHHAULHAWKHEARHEARSEHEARTHHEATHHEIGHTHELLHERB
HISHIVEHOARDHOGHONEHOOKHOOTHORNHORSEHOSEHUBHUFFHUGHUMHUNGHUTCHHYPEJABJACKJAGJAPEJEEPJEERJEWELJIGJIVEJOGJOWLJOYSJUNEJUTJUTEKEELKILLKINKIPKISSKITKNACKKNAVEKNEELKNOWNLACELADLAIDLAIRLAMELANELASSLATCHLAWSLAYERLAZELEAFLEASHLEDGELEECHLEGLESSLETLEWDLIARLICELICK
LIDLIEDLIESLIKELIMELINELITLOAMLOBELODGELOINLOLLLOOMLORDLOUSELOUTLOWERLOYALLUGLURCHLURELURKLUSHMACEMADMADEMAILMAIMMAREMARKMARSHMASHMASSMATMAUVEMAZEMEALMENMEREMESHMIGHTMILEMIMEMISSMITTMOANMOATMOOSEMOOTMOPEMOTHMOWERMUCKMULLMUMMURKMUSHNABNANNAPENAUGHTNERVENIBNIL
NITNODNODENOOKNOONNORMNOTNOTCHNUBNUNONEPAINPAIRPALPARCHPARKPARTPATPAWNPAWSPEACEPEASPECKPEEKPEEPPEERPEGPENPERTPETPHASEPIESPIKEPINPIPPIPEPITPOKEPORCHPORKPORTPOUCHPOUREDPOUTPUPPURRSPUSPUSHPUTPUTTRACERACKRAKERAMRANRANGRAPERARERASHRATERAVEREAMREEFREEK
REELRHYMERICHRIFERIGHTRILERIMRIPRISEROAMROAREDROCKRODRODEROGUEROOKROVEROYALRUBRUCKRUDERUGRULERUNGRUSERUTSAGESALESANGSASHSATSAUCESAWNSAYSSEALSEEMSETSEWEDSEWERSEWNSHALESHAMESHAPESHARESHARKSHAVESHEAFSHEARSHEATHSHEDSHEETSHELLSHINSHIRESHIRKSHOESSHOOKSHORESSHORTSHOVESHOWERSHOWNSHUNSICK
SIEVESIGHTSIGNSILLSIPSIRESITESOAKSOILSOOTSORTSOUPSUITSUMSUPSURFSURGESWORDTABTACKTAGTAILTAMETANTAPTARTTAUGHTTEACHTEAKTEARTEETHTENTERSETHEMETHICKTHIEFTHIGHSTHONGTHORNTHOUGHTTHUDTHUGTIDETIEDTIERTIFFTIGHTTILETOFFTONTONGTONGUETORCHTORNTOUGHTOURTOYSTUBTUCKTUGTURFTYPEUSEVEER
VERBVERGEVERSEVETVICEVIEDVILEVOGUEVOWEDWADWADEWAGEWAIFWAITWALKWALLWANEWARDWARMWARPWARTWAVEWAYSWEANWEARWEDWEDGEWEIRWHARFWHEREWHIFFWHIRLWHIZZWHO'DWICKWIDEWINEWIPEWISEWOKEWOOEDWOOLWORNWORSEWORTHWRAPWREATHWRENWRETCHWROTEYACHTYAKYAPYARDYARNYAWNYEARYELLYENYET
Word Test Equivalency/Skinner et al
365
Appendix A. Words (n = 572) in New Lists That Were Not in the Original CNC Lists
Note: Six Australian English words not used in American English are shown in bold type.
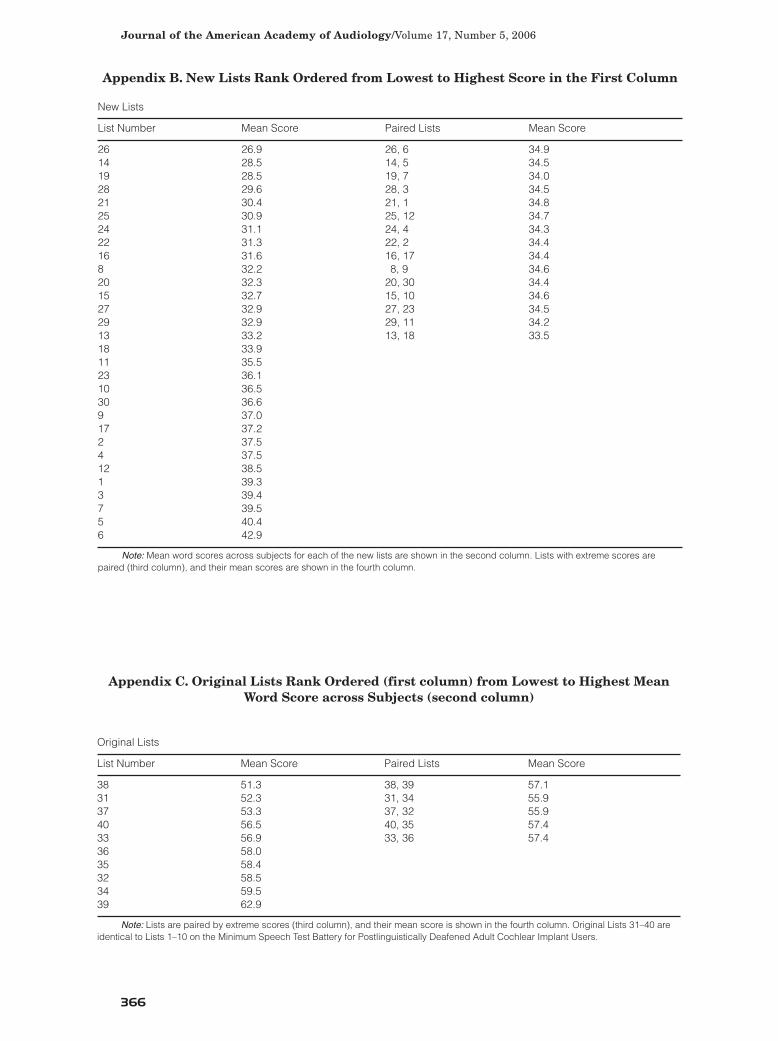
Original Lists
List Number Mean Score Paired Lists Mean Score
38 51.3 38, 39 57.131 52.3 31, 34 55.937 53.3 37, 32 55.940 56.5 40, 35 57.433 56.9 33, 36 57.436 58.035 58.432 58.534 59.539 62.9
Note: Lists are paired by extreme scores (third column), and their mean score is shown in the fourth column. Original Lists 31–40 areidentical to Lists 1–10 on the Minimum Speech Test Battery for Postlinguistically Deafened Adult Cochlear Implant Users.
New Lists
List Number Mean Score Paired Lists Mean Score
26 26.9 26, 6 34.914 28.5 14, 5 34.519 28.5 19, 7 34.028 29.6 28, 3 34.521 30.4 21, 1 34.825 30.9 25, 12 34.724 31.1 24, 4 34.322 31.3 22, 2 34.416 31.6 16, 17 34.48 32.2 8, 9 34.620 32.3 20, 30 34.415 32.7 15, 10 34.627 32.9 27, 23 34.529 32.9 29, 11 34.213 33.2 13, 18 33.518 33.911 35.523 36.110 36.530 36.69 37.017 37.22 37.54 37.512 38.51 39.33 39.47 39.55 40.46 42.9
Note: Mean word scores across subjects for each of the new lists are shown in the second column. Lists with extreme scores arepaired (third column), and their mean scores are shown in the fourth column.
Journal of the American Academy of Audiology/Volume 17, Number 5, 2006
366
Appendix B. New Lists Rank Ordered from Lowest to Highest Score in the First Column
Appendix C. Original Lists Rank Ordered (first column) from Lowest to Highest MeanWord Score across Subjects (second column)