evaluation of environmental impacts of two common ... · of two common restoration methodologies...
TRANSCRIPT

EVALUATION OF ENVIRONMENTAL IMPACTS
OF TWO COMMON RESTORATION METHODOLOGIES
FOR PIPES THAT CONVEY STORMWATER RUNOFF
FINALCONTRACT REPORT
VTRC 11-CR3
http://www.virginiadot.org/vtrc/main/online_reports/pdf/11-cr3.pdf
DIANJUN RENGraduate Research Associate
JAMES A. SMITH, Ph.D., P.E.Professor
Department of Civil & Environmental EngineeringUniversity of Virginia

Standard Title Page - Report on Federally Funded Project 1. Report No.: 2. Government Accession No.: 3. Recipient’s Catalog No.: FHWA/VTRC 11-CR3
4. Title and Subtitle: 5. Report Date: October 2010 6. Performing Organization Code:
Evaluation of Environmental Impacts of Two Common Restoration Methodologies for Pipes that Convey Stormwater Runoff
7. Author(s): Dianjun Ren and James A. Smith, Ph.D.
8. Performing Organization Report No.: VTRC 11-CR3
10. Work Unit No. (TRAIS): 11. Contract or Grant No.:
9. Performing Organization and Address: Virginia Transportation Research Council 530 Edgemont Road Charlottesville, VA 22903
92134
12. Sponsoring Agencies’ Name and Address: 13. Type of Report and Period Covered: Final Contract 14. Sponsoring Agency Code:
Virginia Department of Transportation 1401 E. Broad Street Richmond, VA 23219
Federal Highway Administration 400 North 8th Street, Room 750 Richmond, VA 23219-4825
15. Supplementary Notes: 16. Abstract:
The Virginia Department of Transportation (VDOT) is responsible for the maintenance of underground pipes that convey stormwater runoff from roadways and other relatively impervious surfaces. Due to normal fatigue, cracks can develop in these pipes over time. Excavation and replacement of the damaged pipe section are expensive, intrusive, and time-consuming. As an alternative, VDOT has used pipe-repair technologies that involve the insertion of the synthetic liner material inside the damaged pipe. Although this technology can effectively seal water leaks caused by cracks in the pipe, the environmental impact of chemicals that leach from the liner materials into water in the pipe are not known. In this work, we have investigated two common commercial pipe-repair technologies: Ultraliner and Troliner. Both technologies employ a synthetic liner material. Troliner installation also requires the use of grout that helps to provide an effective seal between the synthetic liner and the original host pipe wall.
Review of the materials safety data sheets of the liner materials revealed three possible plasticizers of potential environmental concern: bisphenol A (BPA), bis(2-ethylhexyl) phthalate (DEHP), and benzyl butyl phthalate (BBP). A high-performance liquid chromatography (HPLC) analysis methodology was developed to quantify trace concentrations of these compounds in water. In addition, a generic gas-chromatography scan with a flame ionization detector (GC-FID) was developed to identify other possible organic constituents that could possibly leach from the liner materials. Kinetic batch experiments were conducted to determine if contaminants were leaching from Ultraliner, Troliner, and/or the grout. In all cases and for all incubation times up to 48 hr, none of the three plasticizers was detected in water in contact with any of the pipe-repair materials. In addition, the generic GC-FID scan did not detect any unidentified compounds relative to control samples. It is possible that one or more of the target analytes were released from the liner materials at concentrations below the analytical detection limit. To investigate this possibility, a mathematical model of plasticizer leaching from the pipe-liner material was developed with the assumption that the leached pollutant concentration after a 48-hr period exactly equals the analytical detection limit. By normalizing this leaching rate to the surface area of the liner materials, the concentration of each plasticizer in pipe water could be estimated as a function of time, pipe diameter, and discharge of water through the pipe. Both flowing and stagnant conditions were considered. In all cases, simulated aqueous concentrations of the target analytes were well below drinking-water limits. In summary, these experiments and analyses suggest that both Ultraliner and Troliner are technologies that are not expected to have any significant, adverse environmental impact. 17 Key Words: 18. Distribution Statement: pipe restoration; pipe excavation; trenchless repair; pipe liners No restrictions. This document is available to the public
through NTIS, Springfield, VA 22161. 19. Security Classif. (of this report): 20. Security Classif. (of this page): 21. No. of Pages: 22. Price: Unclassified Unclassified 23
Form DOT F 1700.7 (8-72) Reproduction of completed page authorized

FINAL CONTRACT REPORT
EVALUATION OF ENVIRONMENTAL IMPACTS OF TWO COMMON RESTORATION METHODOLOGIES FOR PIPES THAT CONVEY
STORMWATER RUNOFF
Dianjun Ren Graduate Research Associate
James A. Smith, Ph.D., P.E.
Professor
Department of Civil & Environmental Engineering University of Virginia
Project Manager G. Michael Fitch, Virginia Transportation Research Council
Contract Research Sponsored by the Virginia Transportation Research Council
(A partnership of the Virginia Department of Transportation and the University of Virginia since 1948)
In Cooperation with the U.S. Department of Transportation
Federal Highway Administration
Charlottesville, Virginia
October 2010 VTRC 11-CR3
ii
DISCLAIMER
The project that is the subject of this report was performed under contract for the Virginia Department of Transportation, Virginia Transportation Research Council. The contents of this report reflect the views of the authors, who are responsible for the facts and the accuracy of the data presented herein. The contents do not necessarily reflect the official views or policies of the Virginia Department of Transportation, the Commonwealth Transportation Board, or the Federal Highway Administration. This report does not constitute a standard, specification, or regulation. Any inclusion of manufacturer names, trade names, or trademarks is for identification purposes only and is not to be considered an endorsement.
Each contract report is accepted for publication by Research Council staff with
expertise in related technical areas. Final editing, peer review, and proofreading of the report were performed by the contractor.
Copyright 2010 by the Commonwealth of Virginia. All rights reserved.
iii
ABSTRACT
The Virginia Department of Transportation (VDOT) is responsible for the maintenance of underground pipes that convey stormwater runoff from roadways and other relatively impervious surfaces. Due to normal fatigue, cracks can develop in these pipes over time. Excavation and replacement of the damaged pipe section are expensive, intrusive, and time-consuming. As an alternative, VDOT has used pipe-repair technologies that involve the insertion of the synthetic liner material inside the damaged pipe. Although this technology can effectively seal water leaks caused by cracks in the pipe, the environmental impact of chemicals that leach from the liner materials into water in the pipe are not known. In this work, we have investigated two common commercial pipe-repair technologies: Ultraliner and Troliner. Both technologies employ a synthetic liner material. Troliner installation also requires the use of grout that helps to provide an effective seal between the synthetic liner and the original host pipe wall.
Review of the materials safety data sheets of the liner materials revealed three possible plasticizers of potential environmental concern: bisphenol A (BPA), bis(2-ethylhexyl) phthalate (DEHP), and benzyl butyl phthalate (BBP). A high-performance liquid chromatography (HPLC) analysis methodology was developed to quantify trace concentrations of these compounds in water. In addition, a generic gas-chromatography scan with a flame ionization detector (GC-FID) was developed to identify other possible organic constituents that could possibly leach from the liner materials. Kinetic batch experiments were conducted to determine if contaminants were leaching from Ultraliner, Troliner, and/or the grout. In all cases and for all incubation times up to 48 hr, none of the three plasticizers was detected in water in contact with any of the pipe-repair materials. In addition, the generic GC-FID scan did not detect any unidentified compounds relative to control samples.
It is possible that one or more of the target analytes were released from the liner materials at concentrations below the analytical detection limit. To investigate this possibility, a mathematical model of plasticizer leaching from the pipe-liner material was developed with the assumption that the leached pollutant concentration after a 48-hr period exactly equals the analytical detection limit. By normalizing this leaching rate to the surface area of the liner materials, the concentration of each plasticizer in pipe water could be estimated as a function of time, pipe diameter, and discharge of water through the pipe. Both flowing and stagnant conditions were considered. In all cases, simulated aqueous concentrations of the target analytes were well below drinking-water limits. In summary, these experiments and analyses suggest that both Ultraliner and Troliner are technologies that are not expected to have any significant, adverse environmental impact.

FINAL CONTRACT REPORT
EVALUATION OF ENVIRONMENTAL IMPACTS OF TWO COMMON RESTORATION METHODOLOGIES FOR PIPES THAT CONVEY
STORMWATER RUNOFF
Dianjun Ren Graduate Research Associate
James A. Smith, Ph.D., P.E.
Professor
Department of Civil & Environmental Engineering University of Virginia
INTRODUCTION
Many stormwater pipes and culverts installed and maintained by the Virginia Department of Transportation (VDOT) have reached the end of their service life or have otherwise become damaged. Consequently, repair or replacement of worn or damaged pipes is a significant maintenance concern. VDOT specifications allow for the use of several “trenchless” pipe-repair technologies whereby existing underground pipes are repaired in place rather than using the conventional method of unearthing and replacing sections of damaged pipe. These less disruptive and potentially economical trenchless alternatives, however, have not been evaluated under VDOT’s approved products list evaluation criteria.
According to the study conducted by the Virginia Transportation Research Council
(VTRC), it is suspected that one of these methods, cured-in-place pipe (CIPP) rehabilitation, has the potential to contaminate downstream water during and after installation, particularly when certain installation variables (e.g., resin and cure-water containment) are not properly controlled (Donaldson, 2009). Following further analyses of CIPP technology and subsequent changes to VDOT’s specifications for CIPP installations, VDOT’s Environmental Division requested that VTRC review other pipe rehabilitation products and processes used by VDOT. This investigation identified two main technologies currently used: Troliner (Figure 1) and Ultraliner (Figure 2).
Troliner is the main component of the Trolining pipe rehabilitation system. It has
specially designed embedment studs on its outer surface (Figure 1, right), and the invert is smooth toward flowing stormwater. A powder-like grout is used to fill the annular void between the host pipe surface and the Troliner.

2
Figure 1. Troliner installed in an egg-shaped brick work sewer sized 1.4 x 2.1 m inner diameter (left); close-
up picture of Troliner surface (right).
Figure 2. Ultraliner PVC Alloy Pipeliner (ranging in sizes from 4-12 in) is coiled in a flat shape and folded during insertion (left); Ultraliner PVC Alloy Pipeliners with diameters greater than or equal to 15 in are
coiled in an "H" shape (right).
Ultraliner is an alternative to Troliner provided by the same vendor. It expands when applied with air pressure or steam. During installation, either the coiled or H-shaped Ultraliner is inserted into the host pipe from one end to the other. Then either the air pressure or steam is applied to expand the Ultraliner tightly against the inner walls of the host pipe. Unlike Troliner, Ultraliner does not require grout to fill the voids between the liner and the pipe surface.
PURPOSE AND SCOPE
The purpose of this study was to determine the impacts of pipe rehabilitation on water quality using the commercial products Troliner and Ultraliner. The focus of the work was to quantify leaching of anthropogenic constituents from the rehabilitation grout or coatings into water discharged from the pipe following restoration.
The study was designed to develop analytical methods to quantify trace aqueous
concentrations of the suspected contaminants leaching from these two commercial pipe-restoration techniques, and using these methods, to actually quantify the chemicals of concern for these same two techniques. Based on review of material safety data sheets, the target analytes chosen for quantification were bisphenol A (BPA), bis(2-ethylhexyl) phthalate (DEHP),

3
and benzyl butyl phthalate (BBP). We also investigated the release of a potentially wide spectrum or trace organic compounds using a generic gas-chromatography scan (with a flame-ionization detector) for each pipe-restoration material to account for the other possible chemicals that are potentially released. A mathematical model was developed to predict aqueous-phase concentrations of BPA, DEHP, and BBP following pipe restoration as a function of water depth in the pipe, pipe diameter, and discharge. Application of the model with typical field parameters allowed us to evaluate concentration data under different scenarios.
METHODS
This study consisted of four primary tasks: (1) a comprehensive search of relevant scientific literature to identify contaminants that have the greatest potential for release from Troliner and Ultraliner and that are also of environmental concern; (2) development of a high-performance liquid chromatographic analytical method to quantify trace concentrations of BPA, DEHP, and BBP in water samples and development of a gas chromatography method to generally account organic compounds released from the pipe-liner materials; (3) batch desorption tests (with appropriate control samples) to quantify the rate of desorption of contaminants from the pipe-liner materials; and (4) incorporation of the batch desorption data into a simulation model to predict the concentration of the target analytes in water inside a newly renovated pipe under a variety of field conditions. A detailed description of these methodologies is provided here.
Task 1: Identification of Target Organic Contaminants
Material safety data sheets for materials used in the rehabilitation efforts were reviewed
to determine constituents that could potentially impair water quality. In examining the content, it was noticed that the main constituents in these products that are potential pollutants are plasticizers. Phthalate acid esters (PAEs) have been extensively used by industry as plastic additives since the 1930s. Di-(2-ethylhexyl) phthalate (DEHP) accounts for about 50% of the total production of PAEs. Butyl benzyl phthalate (BBP) and bisphenol A (BPA) are also ubiquitous in industrial applications (Ecobilan, 2001).
Extensive prior research has pointed out that phthalates have negative effects on the
reproductive physiology of fish (Norrgren et al., 1999) and mammals (Catherine et al., 1997; Moore, 2000; Kavlock et al., 2002a; Kavlock et al., 2002b). Since 2000, the Water Frame Directive (DCE 2000/60/CE) in Europe listed DEHP as one of 33 hazardous substances that must be regulated. The U.S. Environmental Protection Agency (EPA) lists DEHP and BBP as priority pollutants. Considering the existence of these contaminants in products and their potential action as endocrine disruptors, DEHP, BBP and BPA were selected as the target contaminants for this investigation (see Table 1). It is hypothesized that these compounds may leach from commercial pipe-repair products into water following installation.

4
Table 1. Physical-chemical properties of targeted compounds (BPA, DEHP and BBP)
Name
Chemical Structure Molecular Formula
Molecular Weight (g/mol)
Density (g/cm3)
Solubility in Water
BPA
C15H16O2 228.29 1.2 120–300 mg/L (at 21.5 °C)
DEHP
C24H38O4 390.56 0.9861 0.285 mg/L (at 24 °C)
BBP
C19H20O4 312.37 1.1 2.2 mg/L (at 25 °C)
Task 2: Analytical Methods Development Chemicals and Materials
All reagents were analytical grade and were used as received. DEHP, BBP, BPA, HPLC-
grade acetonitrile, and HPLC-grade water were all provided by Sigma-Aldrich (Milwaukee, Wisconsin). Deionized, organic-free water used in batch reactor experiments was obtained directly from a Nanopure ultrawater system. Syringe filters used in sample processing were 0.45-µm polytetrafluoroethylene (PTFE) filters purchased from Fisher Scientific.
A stock solution of 10 mg/L BPA, 9.8 mg/L DEHP, and 5.5 mg/L BBP was prepared and stored in the dark at 5 ˚C. Due to the low solubility of these compounds in water, the solutes were mixed with 1% HPLC grade methanol (v/v) and then filled to the desired volume with water. For HPLC calibration, this stock solution was diluted to make serial standards. HPLC and GC Analyses
Identification and detection of BPA, DEHP, and BBP were performed using an Agilent LC1100 high-performance liquid chromatography with a UV-Vis detector (HPLC UV-Vis). Total organic carbon was quantified through a generic gas chromatography scan with a Perkin-Elmer Autosystem gas chromatograph and flame ionization detector (GC-FID). Details of each analytical method are provided in Table 2.

5
Table 2. Instrument settings for chromatographic analyses High Performance Liquid Chromatography Gas Chromatography
Column Agilent TC-C18 Column (i.d. 5 μm, 4.6×150 mm)
Column Supleco PTE-5 fused silica capillary column, 30 m × 0.32 mm i.d.
Flow rate 0.5 ml/min Carrier gas Helium, purity: 99.99%. Flow rate: 10 psi Detection wavelength
227 nm Injector 1 μL splitless, injection temperature 260 °C
Sampler 20 μL injection by autosampler Detector Flame ionization detector, 320 °C Gradient wash program
water: acetonitrile = 50:50 from 0 to 5 min, 5:95 from 5 to 18 min; 50:50 from 18 to 20 min
Oven temperature program
Keep 50 °C for 5 min, raise to 320 °C at a rate of 5 °C/min and remain for another 5 min
Task 3: Batch Desorption of Solutes from Liner Materials
To quantify the possible leaching of the target solutes or other unidentified organic
solutes, a series of batch reactors was prepared. Five grams of each liner material (either Ultraliner, Troliner, or grout) was placed in twelve 50-mL (nominal volume) plastic tubes. Water was added to minimize headspace in each tube. Tubes were then placed on a mechanical shaker at a rate of 200 rpm to ensure complete mixing. Batch reactors were sacrificially sampled over time, typically over a 48-hr period. Throughout the 2-day experimental period, sampling was carried out at predetermined time intervals: every hour for the first 6 hr, every 3 hr for hours 6 through 12, every 6 hr from hours 12 through 24, and every 12 hr for the remaining 24 hr.
Sample Collection For both HPLC and GC analyses, a 1.5-mL (nominal volume) sampling vial was used to hold a 1-mL water sample. Specifically, for Troliner and Ultraliner products, at the predetermined sampling time, a 0.99-mL sample was directly withdrawn from the centrifuge tube into a sampling vial and then filled to 1 mL with 0.01 mL methanol. The methanol was added so that actual samples had the same methanol volume fraction as standards used for instrument calibration. Extra preparation steps for samples of grout were necessary for separation. For these samples, the tube was centrifuged for 30 min at 1150 g. Two milliliters of supernatant was then filtered through a 0.45-μm PTFE syringe filter, 0.99 mL of which was injected into the sampling vial. Another 0.01 mL of methanol was added to give a final volume of 1 mL. Quality Assurance Protocols For quality assurance, a 50-mL batch reactor was filled with deionized, organic-free water (but without any pipe-liner repair materials) and was handled identically to other batch reactors. This “blank” batch reactor was included to determine if any contamination of laboratory water or reactors occurred.
To monitor for potential loss of chemicals during the batch experiments due to either the sorption to the inner surface of the batch reactors or the evaporation into headspace, a known concentration of BPA, DEPH, and BBP was added to batch reactors and serve as a control. These control reactors did not have any pipe-liner repair materials. Similar to the blank samples,

6
these control samples were handled identically to the other batch reactors and were sampled and analyzed over the 48-hr incubation period.
Leaching experiments conducted with grout provided an additional challenge owing to
the fine particle size of the material and the associated difficulty of separating the aqueous phase from the grout for analysis. Therefore, as noted previously, each grout batch reactor was sampled by passing the aqueous suspension through the 0.45-µm syringe filter prior to chromatographic analysis. To ensure that dissolved solutes were not removed from aqueous solution by sorption to the filter media, standard samples of each target analyte were prepared, passed through the filter, and analyzed by HPLC UV-vis. Filtered sample concentrations were then compared to pre-filtration sample concentrations to determine if significant losses of solute occurred by filtration.
Task 4: Simulations to Predict Pollutant Leaching to Water in the Field
Batch experiments provide only a zero-dimensional measurement of pollutant leaching rates as a function of particle surface area. To predict aqueous-phase concentrations of the target solutes in water in a restored pipe, a mathematical model was developed. The model was tested for different field scenarios, including stagnant and flowing water in the restored pipe and pipes with different surface-area to volume ratios. Using leaching data from the batch experiments, predictions of solute concentrations in the pipe water were calculated and evaluated.
RESULTS AND DISCUSSION
Standard Sample Calibration
A variety of mobile phase combinations including methanol/water (Lin et al., 2003),
acetonitrile/water (Suzuki et al., 2001), and ethanol/water (Cai et al., 2003; Katsumata et al., 2004) were considered for the analyses. An acetonitrile/water mobile phase provided optimum sensitivity along with good chromatographic separation of our target analytes. Figure 3 demonstrates a typical liquid chromatogram of a mixture of BPA, DEHP, and BBP at concentrations of 10 mg/L, 9.8 mg/L, and 5.5 mg/L, respectively. Table 3 provides linear regression equations and goodness-of-fit measures (R2 values) for calibration data for each target solute. These data indicate that over the calibration concentrations, the detector is highly linear. Quantification limits are also shown in Table 3 and range from 29 µg/L to 450 µg/L. In addition, recoveries of spiked samples ranged from 93.5% to 99.9%.

7
Figure 3. Example HPLC chromatogram for a standard sample containing the target analytes BPA, DEHP,
and BBP at aqueous concentrations of 10 mg/L, 9.8 mg/L, and 5.5 mg/L, respectively.
Table 3. Chromatographic data for the three target analytes (BPA, DEHP, and BBP)
Chemicals
Calibration Equation
R2 Recovery Rate
(%) Retention
Time (min) LOD* (mg/L)
BPA Y=335.35x+5.267 0.99991 99.9% 4.119 0.029 BBP Y=131.03x+159.25 0.99997 93.5% 8.544 0.191 DEHP Y=109.77x+38.852 0.99934 94.9% 12.374 0.447 *Limit of detection.
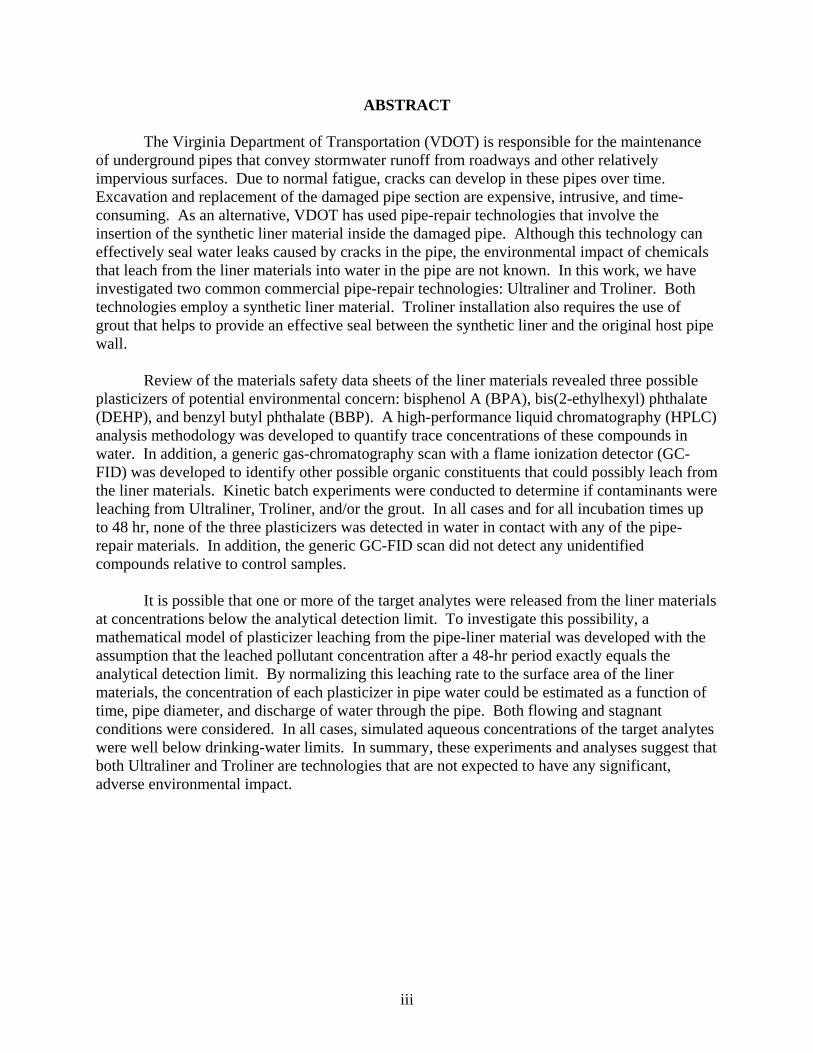
Figure 4 presents the chromatogram for a control batch reactor sampled at 0 and 48 hr.
As described in the Methods section, control batch reactors consist of water and a spiked concentration of the three target analytes. Figure 4 shows that the concentrations of BPA, DEHP, and BBP do not change significantly during the 48-hr incubation period according to the t-test (n = 6, p = 0.05). These data indicate that potential losses of the target analytes by processes such as volatilization, biodegradation, or sorption to the batch reactor are negligible.
8
Figure 4. Chromatograms for a control batch reactor samples at 0 hr and 48 hr. The peak areas of the target analytes (BPA, DEHP, and BBP) do not change with time, indicating that solute losses from the batch reactor
are negligible over a 48-hr period.
To quantify the potential loss of the target analytes by sample filtration through a 0.45-μm PTFE membrane, an aqueous sample containing known concentrations of BPA, DEHP, and BBP was passed through the filter. The concentrations of the analytes were determined before and after the filtration step by HPLC. Figure 5 shows the chromatograms of both samples. These plots show that the concentration of each target analyte is essentially unchanged by filtration. Comparison of pre- and post-filtration concentrations of each analyte using a t-test of replicate experiments (n = 6) showed no significant difference (p = 0.05). Therefore, filtration of batch reactors containing grout does not reduce the aqueous concentration of any of the three target analytes.
Figure 5. Chromatograms of aqueous samples containing known concentrations of BPA, DEHP, and BBP
before and after filtration through an 0.45-µm membrane.

9
Batch Desorption Experiments
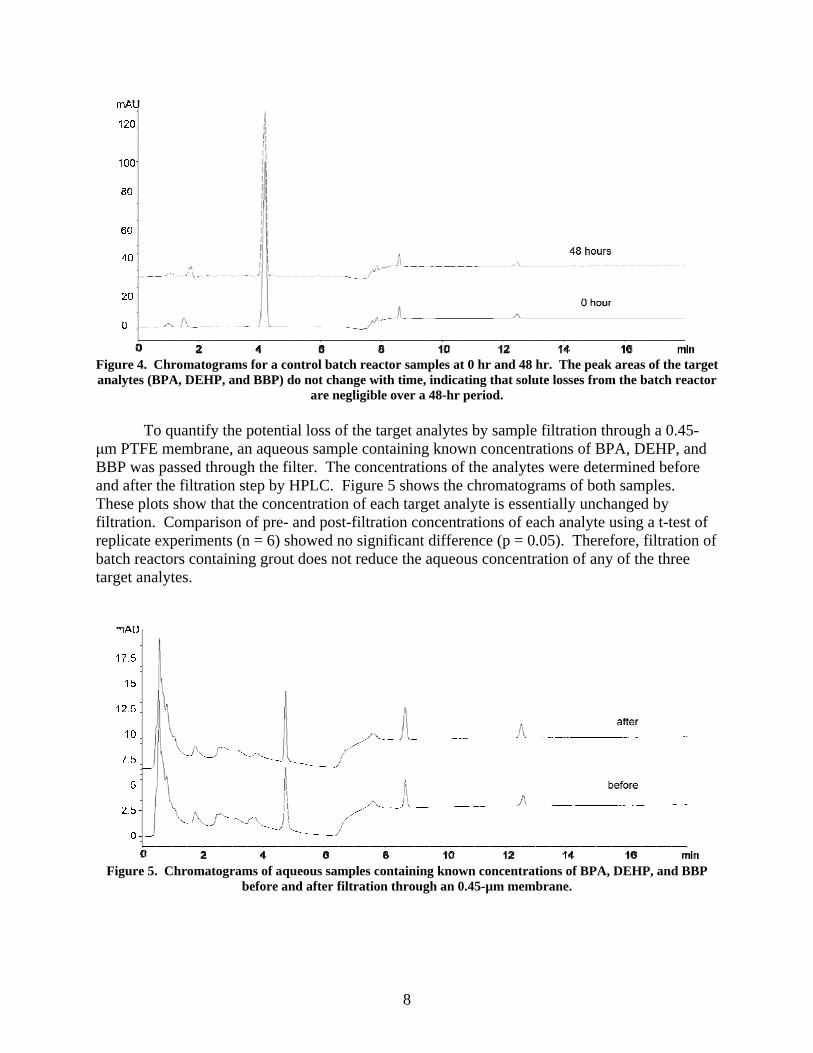
Figure 6 through Figure 8 show chromatograms derived from analysis of aqueous samples in contact with the different pipe-liner materials at different incubation times, representing Troliner, Ultraliner, and grout, respectively. Aqueous samples in the batch reactors in contact with each liner material were sampled at 0, 6, 12, and 24 hr. For each figure, the uppermost chromatogram is a blank sample (e.g., the batch reactor contained water but no liner material). As noted earlier, the grout is used in conjunction with Ultraliner and is placed between the Ultraliner synthetic liner and the damaged pipe wall. In theory, contact between water and the grout should be minimal if the Ultraliner is installed properly.
The chromatograms for each liner material and for each time point are similar. In
addition, each chromatogram for a pipe-liner material is similar to the chromatogram for the blank. None of the target analytes was detected in any sample. These results indicate that even after a 48-hour incubation period, no detectable levels of the three target analytes can be found in the aqueous phase. Although a few small peaks are present during the first 2 min of the chromatographic separation period, these peaks are also present in the blank samples and are likely caused by the addition of 1% methanol to each sample. Overall, these results are encouraging and suggest that at most, only trace levels of the three target analytes are leached from the liner materials into water.
Figure 6. HPLC chromatograms for aqueous samples equilibrated with Troliner in 50-mL batch reactors for
different equilibration times. The uppermost chromatogram is for a blank sample (water with no Troliner present). Chromatograms below the blank sample (a) from top to bottom correspond to equilibration times
of 0, 6, 12, 24, and 48 hr (b to f), respectively.
10
Figure 7. HPLC chromatograms for aqueous samples equilibrated with Ultraliner in 50-mL batch reactors
for different equilibration times. The uppermost chromatogram is for a blank sample (water with no Troliner present). Chromatograms below the blank sample from top to bottom correspond to equilibration
times of 0, 6, 12, 24, and 48 hr, respectively.
Figure 8. HPLC chromatograms for aqueous samples equilibrated with grout in 50-mL batch reactors for different equilibration times. The uppermost chromatogram is for a blank sample (water with no Troliner present). Chromatograms below the blank sample (a) from top to bottom correspond to equilibration times
of 0, 6, 12, 24, and 48 hr (b to f), respectively.
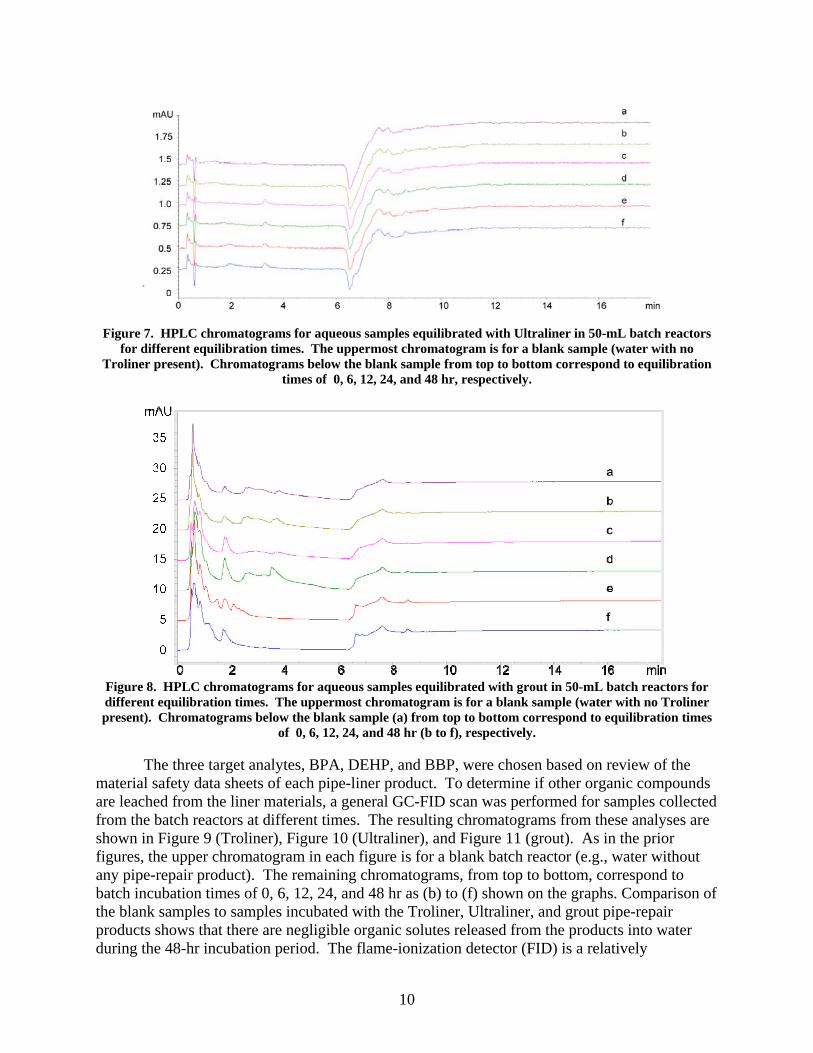
The three target analytes, BPA, DEHP, and BBP, were chosen based on review of the material safety data sheets of each pipe-liner product. To determine if other organic compounds are leached from the liner materials, a general GC-FID scan was performed for samples collected from the batch reactors at different times. The resulting chromatograms from these analyses are shown in Figure 9 (Troliner), Figure 10 (Ultraliner), and Figure 11 (grout). As in the prior figures, the upper chromatogram in each figure is for a blank batch reactor (e.g., water without any pipe-repair product). The remaining chromatograms, from top to bottom, correspond to batch incubation times of 0, 6, 12, 24, and 48 hr as (b) to (f) shown on the graphs. Comparison of the blank samples to samples incubated with the Troliner, Ultraliner, and grout pipe-repair products shows that there are negligible organic solutes released from the products into water during the 48-hr incubation period. The flame-ionization detector (FID) is a relatively

11
nonspecific detector capable of responding to a wide range of organic compounds. Therefore, these results lend further encouragement to the idea that these pipe-repair materials do not leach significant quantities of trace pollutants into water for incubation times up to 48 hr.
Figure 9. GC-FID chromatograms for aqueous samples equilibrated with Troliner in 50-mL batch reactors
for different equilibration times. The uppermost chromatogram is for a blank sample (water with no Troliner present). Chromatograms below the blank sample (a) from top to bottom correspond to
equilibration times of 0, 6, 12, 24, and 48 hr (b to f), respectively.
Figure 10. GC-FID chromatograms for aqueous samples equilibrated with Ultraliner in 50-mL batch
reactors for different equilibration times. The uppermost chromatogram is for a blank sample (water with no Troliner present). Chromatograms below the blank sample (a) from top to bottom correspond to
equilibration times of 0, 6, 12, 24, and 48 hr (b to f), respectively.

12
Figure 11. GC-FID chromatograms for aqueous samples equilibrated with grout in 50-mL batch reactors for different equilibration times. The uppermost chromatogram is for a blank sample (water with no Troliner present). Chromatograms below the blank sample (a) from top to bottom correspond to equilibration times
of 0, 6, 12, 24, and 48 hr (b to f), respectively.
Mathematical Prediction of Chemical Release
The results of the batch desorption experiments described in the previous section resulted in no detection of the target analytes and no evidence of other organic solutes leaching from the pipe-liner materials based on the GC-FID scans. However, it is possible that the target analytes are released into water at concentrations that are below the method detection limit. We developed and executed a mathematical model to simulate the kinetic release of the target analytes from the pipe-liner material. We assumed the worst-case scenario within the context of our batch experimental data. To do this, we assumed that after a 48-hour desorption time, the concentration of the target analytes was exactly equal to our limit of detection. This kinetic desorption rate, combined with estimates of the sorbent surface area per unit volume of water, allowed us to predict aqueous concentrations of the target analytes over time in simulated pipes under active flow and stagnant conditions and for different pipe diameters. We modeled the release from only Troliner and Ultraliner materials because the grout is a binding agent installed between Ultraliner and the inner surface of the pipe. Therefore, the grout should not have direct contact with the water in the pipe.
The first scenario we considered is that water flows through the repaired pipe section
continuously after installation, which represents the most typical scenario expected to occur in field situations. We also investigated the stagnant water case. Although unlikely, we chose this case because it represents a worst-case scenario for water contamination by the pipe-liner materials. Our simulations showed it produces the highest concentrations of analytes because the pipe section is not being replenished with clean, incoming water.
We assumed that desorption obeys zero-order kinetics over 48 hr and the concentrations
of analytes at the end of the experiment exactly equal our analytical detection limit. The release rates of the target analytes from Troliner and Ultraliner were assumed to be proportional to the
13
surface area of the material in contact with water and the contact time. The rates calculated in this manner from the batch experiments are given in Table 4.
Table 4. Release rate of chemicals from Troliner and Ultraliner per unit surface area
Release Rate (μg/m2/hr) Troliner Ultraliner BPA 3.20 15.0 DEHP 21.2 98.3 BBP 49.5 229
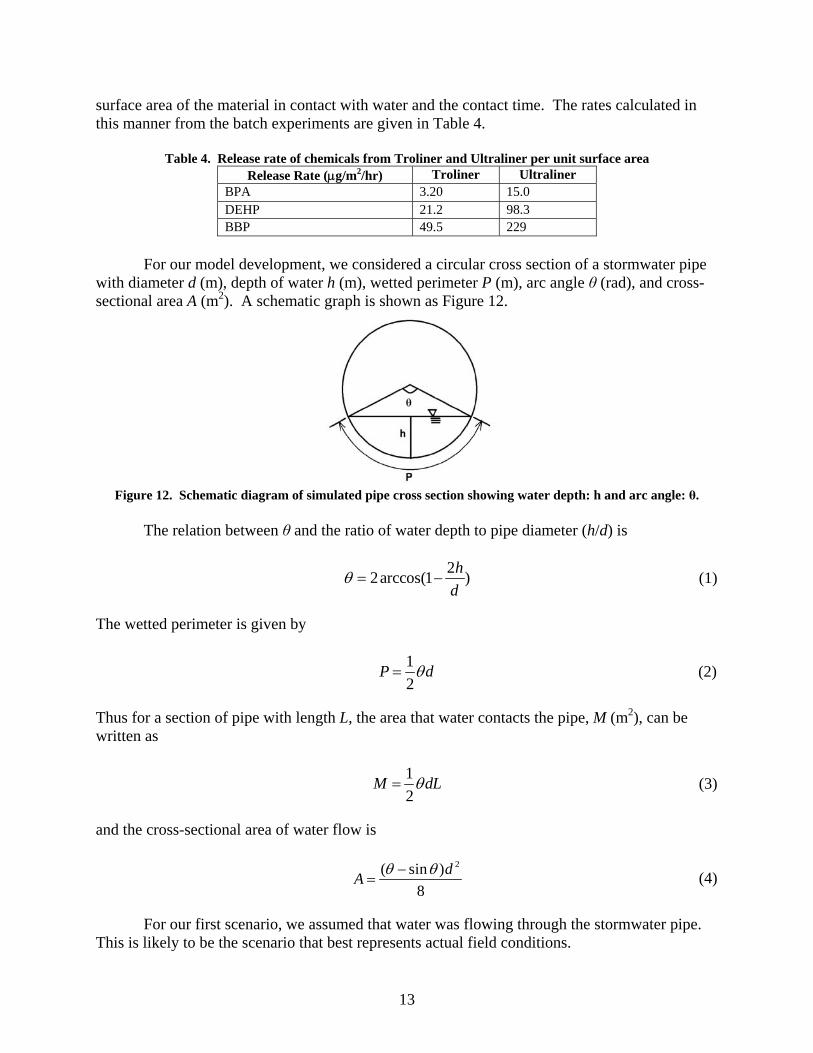
For our model development, we considered a circular cross section of a stormwater pipe
with diameter d (m), depth of water h (m), wetted perimeter P (m), arc angle θ (rad), and cross-sectional area A (m2). A schematic graph is shown as Figure 12.
Figure 12. Schematic diagram of simulated pipe cross section showing water depth: h and arc angle: θ.
The relation between θ and the ratio of water depth to pipe diameter (h/d) is
22arccos(1 )hd
θ = − (1)
The wetted perimeter is given by
12
P dθ= (2)
Thus for a section of pipe with length L, the area that water contacts the pipe, M (m2), can be written as
12
M dLθ= (3)
and the cross-sectional area of water flow is
2( sin )
8dA θ θ−
= (4)
For our first scenario, we assumed that water was flowing through the stormwater pipe.
This is likely to be the scenario that best represents actual field conditions.

14
For each target analyte, i, the governing equation for solute transport in the flowing water can be expressed as
2
2i i i
iC C CD vt x x
λ∂ ∂ ∂= − +
∂ ∂ ∂ (5)
where
D is the longitudinal dispersion coefficient (m2/s) t is the elapsed time since the water enters the repaired section (s) v is cross sectional average velocity of water (m/s) Ci is the concentration of analyte i (mg/L) λi is the zero-order kinetic solute desorption rate constant (mg/(L·s)).
with initial condition ( ,0) 0C x = (6) and boundary conditions (0, ) 0C t = (7)
( , ) 0C L tx
∂=
∂ (8)
The zero-order rate coefficient, λi, can be calculated using ki values from Table 4 that were in turn determined from our batch experiments. The relation between λi and ki is as follows for the circular pipe geometry:
4( sin )
i ii
k M kV d
θλθ θ
= =−
(9)
The analytical solution to the advection-dispersion-reaction equation above (and subject to the specified boundary and initial conditions) is already given. (M. Th. van Genuchten, 1982): 1 2( , ) ( ) ( , )C x t B x B x t= − (10) where
1 2
( 1)( ) exp( ) exp( )i ix D v x vB xv v D Dλ λ −⎡ ⎤= + − −⎢ ⎥⎣ ⎦
(11)

15
22
2 21 2
( , ) exp2 4
( , )
2
im m
mm
vx v tE x DtD D D
B x tvD
λβ β
β
∞
=
⎛ ⎞− −⎜ ⎟
⎝ ⎠=⎡ ⎤⎛ ⎞+⎢ ⎥⎜ ⎟
⎝ ⎠⎢ ⎥⎣ ⎦
∑ (12)
and
2
2
2 sin( )( , )
2 2
m mm
m
xE xv vD D
β βββ
=⎡ ⎤⎛ ⎞+ +⎢ ⎥⎜ ⎟
⎝ ⎠⎢ ⎥⎣ ⎦
(13)
The eigenvalues mβ are the positive roots of
cot( ) 02m mvD
β β + = (14)
For our second scenario, we considered stagnant water in the pipe. This represents the
worst-case scenario for water contamination. Compared to the first scenario, the model is relatively simple.
For stagnant flow conditions, the volume of water (V) in a section of pipe with length L
is
( )2
sin8
d LV θ θ= − (15)
After a certain period of time t, the concentration of a target solute in water can be
calculated by:
4( sin )
ii
k tCd
θθ θ
=−
(16)
For our simulations, we assumed 0.25, 0.5, and 1.0 m-diameter stormwater conveyance
pipes and a 10-m-long repair section. Water velocity in the pipe can be quite variable. We chose a relatively low average velocity of 2.5 cm/s, as larger velocities will result in lower plasticizer concentrations. The dispersion coefficient D (2.54 cm2/s) was selected to be on the same order of magnitude as the advection velocity based on published data from Fischer (Fischer, 1979) and Guo (Guo, 2003). Matlab was used to solve the governing equations (10) and (16) for flowing and stagnant water, respectively. Simulation results reported in the next section show plasticizer concentrations at the effluent end of the renovated pipe section as a function of time for the flow scenario and at any location as a function of time for the stagnant scenario.
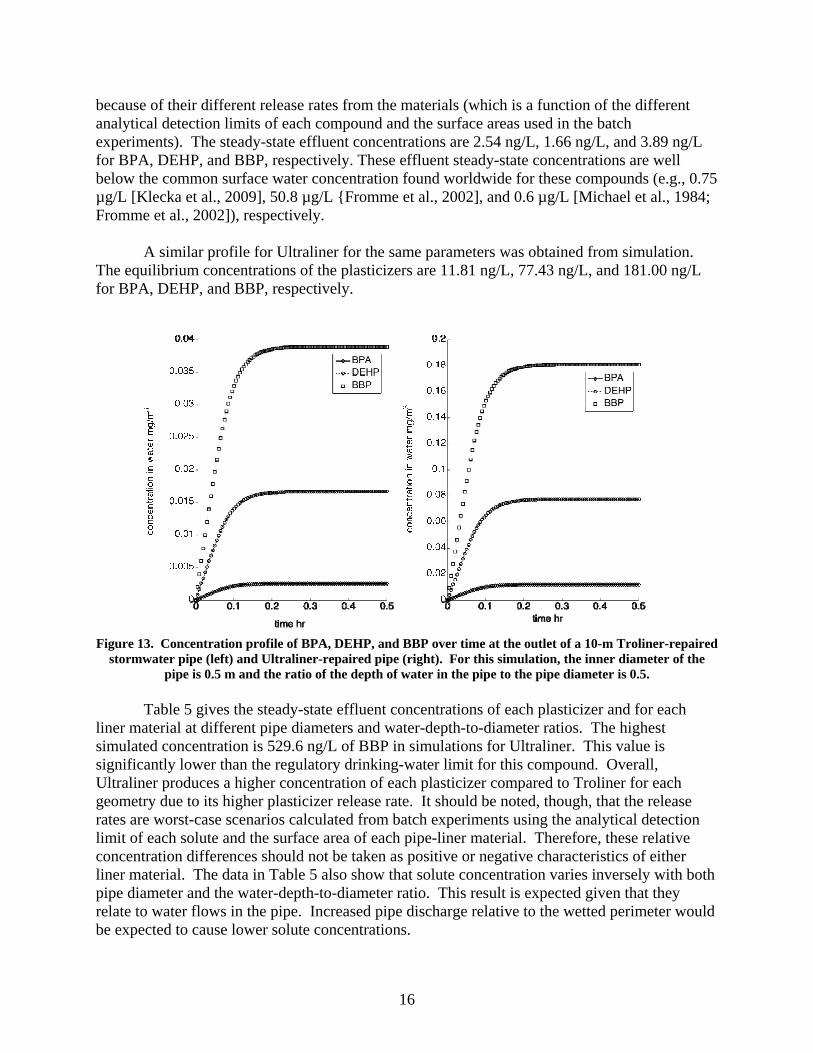
Figure 13 shows the simulated concentration of each plasticizer as a function of time at
the effluent end of the renovated pipe section for Troliner (left graph) and Ultraliner (right graph) for one pipe geometry. The concentrations of each plasticizer increase over time until they reach equilibrium at times less than 0.3 hr. The equilibrium concentrations differ for each plasticizer
16
because of their different release rates from the materials (which is a function of the different analytical detection limits of each compound and the surface areas used in the batch experiments). The steady-state effluent concentrations are 2.54 ng/L, 1.66 ng/L, and 3.89 ng/L for BPA, DEHP, and BBP, respectively. These effluent steady-state concentrations are well below the common surface water concentration found worldwide for these compounds (e.g., 0.75 µg/L [Klecka et al., 2009], 50.8 µg/L {Fromme et al., 2002], and 0.6 µg/L [Michael et al., 1984; Fromme et al., 2002]), respectively.
A similar profile for Ultraliner for the same parameters was obtained from simulation.
The equilibrium concentrations of the plasticizers are 11.81 ng/L, 77.43 ng/L, and 181.00 ng/L for BPA, DEHP, and BBP, respectively.
Figure 13. Concentration profile of BPA, DEHP, and BBP over time at the outlet of a 10-m Troliner-repaired
stormwater pipe (left) and Ultraliner-repaired pipe (right). For this simulation, the inner diameter of the pipe is 0.5 m and the ratio of the depth of water in the pipe to the pipe diameter is 0.5.
Table 5 gives the steady-state effluent concentrations of each plasticizer and for each liner material at different pipe diameters and water-depth-to-diameter ratios. The highest simulated concentration is 529.6 ng/L of BBP in simulations for Ultraliner. This value is significantly lower than the regulatory drinking-water limit for this compound. Overall, Ultraliner produces a higher concentration of each plasticizer compared to Troliner for each geometry due to its higher plasticizer release rate. It should be noted, though, that the release rates are worst-case scenarios calculated from batch experiments using the analytical detection limit of each solute and the surface area of each pipe-liner material. Therefore, these relative concentration differences should not be taken as positive or negative characteristics of either liner material. The data in Table 5 also show that solute concentration varies inversely with both pipe diameter and the water-depth-to-diameter ratio. This result is expected given that they relate to water flows in the pipe. Increased pipe discharge relative to the wetted perimeter would be expected to cause lower solute concentrations.

17
Table 5. Steady-state aqueous concentrations of BPA, DEHP, and BBP at the outlet of stormwater pipes with different geometries for both Troliner and Ultraliner
Troliner (ng/L) Ultraliner (ng/L) Diameter (m)
Depth/Diameter Ratio BPA DEHP BBP BPA DEHP BBP
0.3 7.40 4.87 11.38 34.54 226.50 529.60 0.5 5.10 3.33 7.78 23.62 154.80 362.00
0.25
0.8 4.20 2.74 6.39 19.41 127.30 297.50 0.3 3.70 2.45 5.69 17.27 113.20 264.80 0.5* 2.54 1.66 3.89 11.81 77.43 181.00
0.5
0.8 2.10 1.37 3.22 9.71 63.62 148.80 0.3 1.90 1.22 0.28 8.64 56.61 132.40 0.5 1.30 0.83 1.95 5.90 37.81 90.50
1
0.8 1.00 0.68 1.60 4.85 31.81 74.38 * Concentration profile given in Figure 13.
Finally, Figure 14 represents the concentration of each plasticizer in the repaired pipe section as a function of time for a stagnant-water scenario. Since no plasticizer-free water is entering the pipe section over time, this simulation is a worst-case scenario with respect to plasticizer concentrations. From the graphs in Figure 14, it can be seen that the plasticizer concentrations increase linearly over time throughout the 48-hr simulation period. Despite this worst-case scenario, plasticizer concentrations are still well below 1 µg/L in all cases.
Figure 14. Concentrations of BPA, DEHP, and BBP over time in a 10-m section of Troliner-repaired
stormwater pipe (left) and Ultraliner-repaired pipe (right) under stagnant (no-flow) conditions. For this simulation, the inner diameter of the pipe is 0.5 m and the ratio of the depth of water in the pipe to the pipe
diameter is 0.5.
18
CONCLUSIONS
• Review of the material safety data sheets for the two synthetic liner materials tested, Troliner and Ultraliner, and the scientific literature suggests that the mostly likely compounds of environmental concern that may leach from these lining materials are BPA, DEHP, and BBP.
• A high-performance liquid chromatographic method was successfully developed and tested
to quantify trace levels of these target analytes in water. • Recognizing the possibility that other unknown solutes may also leach from the two pipe-
lining materials, a gas chromatographic method that employs a general scan of an aqueous sample with a flame-ionization detector was also developed.
• Batch leaching tests conducted using both liner materials over varying time intervals and
analyzed by way of both the HPLC and GC methods detected none of the target analytes. In addition, no other compounds were detected by the GC-FID scan relative to control samples.
• Simulations based on worst-case scenarios (i.e., each of the target analytes were leached
from the liner material to a concentration equal to the limit of detection after a 48-hr period) revealed that concentrations of the target analytes in the pipe will not exceed 1 µg/L.
• These experimental and mathematical analyses indicate that both Ultraliner and Troliner
products do not appear to pose a significant risk to aquatic ecosystems. It is possible that other materials unknown to our research team but used in actual field installations could be hazardous. However, the materials tested in our laboratory and claimed to be the only products used in installation appear to be environmentally benign.
RECOMMENDATIONS
1. VDOT’s Materials Division should permit Ultraliner to remain on its Approved Products List as an option for trenchless pipe repair.
2. VDOT’s Approved Products Committee should add Troliner to its Approved Products List as
an option for trenchless pipe repair. 3. Following the next installation of these products in the field by VDOT, it is recommended
that VTRC analyze water samples (using the methods developed as a part of this study) for the target analytes BPA, DEHP, and BBP. The findings resulting from these field analyses should be reviewed by VTRC and VDOT’s Environmental Division personnel to ensure they are consistent with the laboratory findings presented here.

19
BENEFITS AND IMPLEMENTATION PROSPECTS By having both Ultraliner and Troliner on VDOT’s Approved Products List, personnel at the district and residency levels responsible for pipe and culvert maintenance will have two more repair methods or technologies from which to choose for their particular projects. These additional options increase the likelihood of selecting a pipe rehabilitation technique that is both cost-competitive and appropriate for the specific conditions for these sites.
ACKNOWLEDGMENTS
The authors thank the Virginia Transportation Research Council for providing support for this research. We also thank G. Michael Fitch for technical support throughout the course of this work.
REFERENCES
Cai, Y.Q., Jiang, G.B., Liu, J.F. and Zhou, Q.X. Multi-walled carbon nanotubes packed cartridge for the solid-phase extraction of several phthalate esters from water samples and their determination by high performance liquid chromatography. Analytica Chimica Acta, Vol. 494, 2003, pp. 149-156.
Catherine, H., Pirkko, H., Malcolm G.P., and John P.S. The Estrogenic Activity of Phthalate
Esters in Vitro. Environmental Health Perspectives, Vol. 105, 1997, pp. 802-811. Donaldson, B.M. Environmental Implications of Cured-in-Place Pipe Rehabilitation
Technology. Transportation Research Record, No. 2123, 2009, pp. 172-179. Ecobilan. Eco-profile of high volume commodity phthalate esters (DEHP/DINP/DIDP).
European Council for Plasticisers and Intermediates, 2001. Fischer, H.B. Mixing in Inland and Coastal Waters. Academic Press, New York, 1979. Fromme, H., Küchler, T., Otto, T., Pilz, K., Müller, J., and Wenzel, A. Occurrence of phthalates
and bisphenol A and F in the environment. Water Research, Vol. 36, 2002, pp. 1429-1438.
Guo, J.C.Y. Urban storm water design. Water Resources Publications, LLC, 2003. Katsumata, H., Begum, A., Kaneco, S., Suzuki, T., and Ohta, K. Preconcentration of phthalic
acid esters in water samples by Saccharomyces cerevisiae immobilized on silica gel. Analytica Chimica Acta, Vol. 502, 2004, pp.167-172.

20
Kavlock, R., Boekelheide, K., Chapin, R., Cunningham, M., Faustman, E., Foster, P., Golub, M., Henderson, R., Hinberg, I., Little, R., Seed, J., Shea, K., Tabacova, S., Tyl, R., Williams, P., and Zacharewski, T. NTP Center for the Evaluation of Risks to Human Reproduction: phthalates expert panel report on the reproductive and developmental toxicity of butyl benzyl phthalate. Reproductive Toxicology, Vol. 16, 2002a, pp. 453-487.
Kavlock, R., Boekelheide, K., Chapin, R., Cunningham, M., Faustman, E., Foster, P., Golub, M.,
Henderson, R., Hinberg, I., Little, R., Seed, J., Shea, K., Tabacova, S., Tyl, R., Williams, P. and Zacharewski, T. NTP Center for the Evaluation of Risks to Human Reproduction: phthalates expert panel report on the reproductive and developmental toxicity of di(2-ethylhexyl) phthalate. Reproductive Toxicology, Vol. 16, 2002b, pp. 529-653.
Klecka, G.M., Staples, C.A., Clark, K.E., van der Hoeven, N., Thomas, D.E., and Hentges, S.G.
Exposure Analysis of Bisphenol A in Surface Water Systems in North America and Europe. Environmental Science & Technology, Vol. 43, 2009, pp. 6145-6150.
Lin, Z.P., Ikonomou, M.G., Jing, H.W., Mackintosh, C., and Gobas, F.A.P.C. Determination of
phthalate ester congeners and mixtures by LC/ESI-MS in sediments and biota of an urbanized marine inlet. Environmental Science & Technology, Vol. 37, 2003, pp. 2100-2108.
Moore, N.P. The oestrogenic potential of the phthalate esters. Reproductive Toxicology, Vol.
14, 2000, pp. 183-192. Norrgren, L., Blom, A., Andersson, P.L., Börjeson, H., Larsson, D.G.J., and Olsson, P.E. Effects
of potential xenoestrogens (DEHP, nonylphenol and PCB) on sexual differentiation in juvenile Atlantic salmon (Salmo salar). Aquatic Ecosystem Health and Management, Vol 2, 1999, pp. 311-317.
Suzuki, T., Yaguchi, K., Suzuki, S., and Suga, T. Monitoring of phthalic acid monoesters in
river water by solid-phase extraction and GC-MS determination. Environmental Science & Technology, Vol. 35, 2001, pp. 3757-3763.
Van Genuchten, M.T., and Alves, W.J. Analytical solutions of the one-dimensional convective-
dispersive solute transport equation. In Technical Bulletin 1661, U.S. Department of Agriculture, Agricultural Research Service, Washington, DC, 1982.