evaluation of environmental benefits and impacts of
TRANSCRIPT

Evaluation of Environmental Benefits and Impacts of Compost and Industry Standard Erosion and Sediment Control Measures used in Construction Activities
by
BRITT FAUCETTE
(Under the Direction of Carl F. Jordan)
ABSTRACT
Soil erosion is considered the biggest contributor to nonpoint source pollution in the
United States according to the federally mandated National Pollution Discharge Elimination
System. Soil loss rates from construction sites are 10-20 times that of agricultural lands. Nearly
70% of the nation’s Municipal Solid Waste is organic material and could be composted if source
separated. Georgia leads the nation in poultry production, generating approximately 1.36 metric
tons of poultry litter annually in addition to over 1.81 million metric tons per year of food
processing waste, 2.26 million metric tons per year of wood waste, and almost 362,000 metric
tons per year of municipal biosolids. It is important to divert these materials from landfills by
developing off-site uses and markets for these materials. The use of surface applied organic
amendments has been shown to reduce runoff and erosion. Four types of compost blankets,
hydroseed, silt fence and a bare soil (control) were applied in field test plots. Treatments were
seeded with common bermuda grass. A rainfall simulator applied rainfall at an average rate
equivalent to the 50 yr/1 hr storm event, and runoff samples were collected and analyzed for
solids, nutrients and runoff quantity. Three simulated rain events were conducted: immediately
after treatment application, at vegetation establishment, and at vegetation maturity. Vegetative
growth and soil quality characteristics were also evaluated. Results showed compost provided a
quicker vegetative cover than hydroseed; however, due to weed invasion hydroseed produced the
greatest biomass after one year. In the short term, hydroseeding was not very effective at
reducing runoff compared to compost, and compost reduced runoff more over time than
hydroseeding or a bare soil. Compost showed greater infiltration of rainfall compared to
hydroseed. All treatments proved better than the control at reducing solids loss. Total solids
loads were as much as 350% greater from the conventional methods compared to the composts
during the first storm and as much as 36 times greater during the second storm. Materials high in
inorganic N released greater amounts of nitrogen in storm runoff; however, these materials
showed reduced N loss over time. Hydroseeding generated higher P concentrations and loads
compared to compost in storm runoff, particularly during the first storm. Compost blankets
showed increased soil microbial biomass compared to hydroseed treated soils, and increased
surface soil total C, compared to bare soils, an indication of improved soil quality. Soils treated
with hydroseed experienced elevated levels of soil phosphorus near the surface throughout the
study.
INDEX WORDS: Compost, mulch, hydroseed, silt fence, storm water runoff, erosion
control, solids loss, nutrient loss, nutrient loading, soil quality, vegetative
growth, rainfall simulation

ii
Evaluation of Environmental Benefits and Impacts of Compost and Industry Standard Erosion and Sediment Control Measures used in Construction Activities
by
BRITT FAUCETTE
B.S., Appalachian State University, 1995
B.A., Appalachian State University, 1995
M.S., Slippery Rock University of Pennsylvania, 2000
A Dissertation Submitted to the Graduate Faculty of The University of Georgia in Partial
Fulfillment of the Requirements for the Degree
DOCTOR OF PHILOSOPHY
ATHENS, GEORGIA
2004

© 2004
BRITT FAUCETTE
All Rights Reserved
Evaluation of Environmental Benefits and Impacts of Compost and Industry Standard Erosion and Sediment Control Measures used in Construction Activities
by
BRITT FAUCETTE
Major Professor: Carl F. Jordan Committee: L Miguel Cabrera David C. Coleman K.C. Das
Electronic Version Approved: Maureen Grasso Dean of Graduate School The University of Georgia August 2004

iv
ACKNOWLEGEMENTS
It is amazing how many people and groups of people impact or influence a project of this
magnitude, I sincerely apologize if I have left anyone out. First, I must think those who
contributed financially to this project, as without them we would have no research or educational
outreach and thus no program – which we definitely have. These would be the U.S. Poultry and
Egg Association, the Animal Waste Management Center at North Carolina State University, Erth
Products, Cobb County Department of Solid Waste, The University of Georgia and the Pollution
Prevention Assistance Division of the Georgia Department of Natural Resources. A huge thanks
to my doctoral committee for their guidance, ideas, in some instances – wisdom, and most
importantly their time commitment. In particular, Carl Jordan who always reminded me of the
big picture outside of this project and for the use of the farm to conduct the research; Mark Risse,
who far and above provided the most guidance for this project, help with funding, always kept a
healthy balance between research and real world application, and may have had the original idea
to start this project – not to mention to make it the focus of my doctoral research; KC Das who
introduced me to the world of composting research; Miguel Cabrera, who could answer virtually
any question I had, which was consistently proven by the way all the others deferred to him on
the hard questions; Dave Coleman, for his open and fun attitude, and reminding me that I really
am an ecologist; and finally, Larry West for stepping in and participating at the last minute,
never an easy or often wanted task – thank you! I certainly have to thank my department head,
Dale Threadgill, and my supervisor, Tom Adams, for seeing the worth and relevance in this
project and to allow me to work on it as a percentage of my job responsibilities – not sure how I

could have done it otherwise. Thanks soooo much to those that contributed their time and
energy, the most precious of all resources, to moving this project forward; Jason Governo (jack
of all trades, picking up the slack for me in other areas when I was busy with this project, and
most importantly never too busy to help – and always had a good attitude about it), Julia Gaskin
(de facto committee member, my mentor to paying attention to detail – I am still trying, and the
one who challenged me in the areas I needed it most), Rebecca Byrd (countless hours in the lab,
helping to keep us organized, and who did a little bit of everything in moving the research
forward), Tom Maddox and Molly Neely-Burnam (for putting up with me and my samples and
for mentoring me in the art of nutrient analysis), Ryan Adolphson (for the tanker truck, driving
expertise, and a joke every now and again), Wayne King (director of “moving this technology
forward in the real world” and always providing ideas for further research needs, a real
trailblazer), and finally to Nora Goldstein and Rod Tyler who were not intimately involved in
this project but nevertheless added to its overall worth, application and dissemination – which
has only just begun. Thanks to the Engineering Outreach Staff and the Sustainable Agriculture
Discussion Lab for having to hear so much about this project (maybe more that you ever
wanted), particularly Yolima Carillo and Laura Ediger (who also provided a lot of the fun and
balance to this mammoth undertaking, never underestimate the importance of that). Finally, and
possibly most important, all the technicians, student workers, and “good Samaritans” who
contributed to the construction and data collection for this project: Jackson (the real savior and
original workhorse in getting the experiment in the ground), Javier Sayago, Erin Childers, Bryan
Graffagnini, Anna Moss, Brian Bivens, and others I know I am leaving out, I apologize. I cannot
forget the graduate students in the Statistics Department Consulting Lab for helping someone
who knew next to nothing about statistics before this project. And the biggest thanks of all

vi
undoubtedly goes to my parents, Jeff and Kay Faucette, for providing unconditional and
unflinching support to me for 30 years and counting, and as cliché as it sounds – I wouldn’t be
here without them. Thanks to you all.

TABLE OF CONTENTS
Page
ACKNOWLEDGEMENTS…………………………………………………………………….iv
PREFACE…………………………………………………………………………………….…..1
INTRODUCTION AND LITERATURE REVIEW…………………………………………...3
RUNOFF, EROSION, AND NUTRIENT LOSSES FROM COMPOST AND MULCH
BLANKETS UNDER SIMULATED RAINFALL…………………………………………...29
EVALUATION OF ENVIRONMENTAL BENEFITS AND IMPACTS OF
COMPOST AND INDUSTRY STANDARD EROSION AND SEDIMENT
CONTROL MEASURES USED IN CONSTRUCTION ACTIVITIES…………………….47
SUMMARY AND CONCLUSIONS…………………………………………………………..81
APPENDIX A - MATERIALS AND METHODS……………………………………………84
APPENDIX B – RESULTS AND DISCUSSION: VEGETATIVE GROWTH…………...113
APPENDIX C – RESULTS AND DISCUSSION: STORM WATER RUNOFF
AND SEDIMENT LOSS……………………………………………………………………...130
APPENDIX D – RESULTS AND DISCUSSION: NUTRIENT LOSS…………………….168
APPENDIX E – RESULTS AND DISCUSSION: SOIL QUALITY………………………201
APPENDIX F - OUTREACH AND TECHNOLOGY TRANSFER……………………….230

1
PREFACE
The original idea for this research project was developed in the fall of 2000. It’s purpose,
at the time, was to evaluate the erosion control capability of poultry litter compost and to a
provide a catalyst to increase it’s market demand as an effective erosion control measure.
Frequent field reports appearing in trade journals were reporting successful applications using
compost for erosion control; however, scientific research supporting these claims was almost
nonexistent. The original project grew to include not just poultry litter compost, but also a
variety of composted materials as well as mulch from wood and yard waste. This project was
conducted in the summer of 2001 and is presented as the second chapter of this dissertation
reprinted by permission from the Journal of Soil and Water Conservation on June 7, 2004. The
culmination of the proliferation of demonstration sites showing the anecdotal and empirical
benefits of using compost to control runoff and erosion, the early development of state approved
specifications, and our own education from “field practitioners” helped lead us in to the next,
much larger phase, of this project.
Results from this “preliminary research” conducted in the summer of 2001 demonstrated
that compost can be beneficial in controlling erosion, but nutrient loss may be an issue and
mulch may do a better job at reducing soil loss in the short term. However, we knew this was
not telling the whole story of how compost can be beneficial in this type of application. For
example, we did not follow any specifications (which is considered crucial to the industry), in
some cases the composts used were not mature and were of low quality, vegetation was not used,
the rain events we simulated were at a rate and duration that rarely happens outside of
2
hurricanes, we only conducted one rainfall event, and we did not compare it to any current
industry standard or best management practice (BMP).
This set the stage for a research project that would incorporate the inherent weaknesses of
the first project and take a systems approach at evaluating quality composted materials with
conventional BMPs, over a longer period of time. In addition, the research site was prepared to
simulate a construction site. Conducting three storm events over a one year time period and
using vegetation growth, runoff, solids loss, nutrient loss, and soil quality as overall performance
parameters, this research has helped to answer many of the questions the preliminary research
project did not – in addition to raising new ones. This second, and much larger phase of the
research is summarized in chapter three while the appendices provide most of the detail and
discussion for each section in this very abbreviated chapter. Cheers!

3
CHAPTER 1
INTRODUCTION AND LITERATURE REVIEW
In response to public concern regarding potential groundwater pollution potential and
reduction in landfill capacity the Georgia General Assembly established a statewide waste
reduction goal of 25% to be achieved by 1996, enabled through the 1992 Georgia Solid Waste
Management Act. As a first step, the state issued a ban on yard waste going to landfills on
September 1st, 1996. At the time, yard waste accounted for 18% of the national average of the
municipal solid waste (MSW) stream and was the second leading source of waste after paper and
paperboard (US EPA, 1999).
Georgia leads the nation in poultry production, processing nearly 1.5 billion birds per
year and generating approximately 1.36 million metric tons (1.5 million tons) of poultry litter
annually (Faucette, 2001). Nutrient management in the highly eroded soils of the Georgia
piedmont is increasingly important with the rapid growth of the poultry industry. Poultry litter is
high in phosphorus and is typically applied at levels greater than crop phosphorus needs. Much
of Georgia’s soils already have elevated phosphorus indices (Weld, 2003) making on-farm land
application and nutrient management extremely complicated. National Resource Conservation
Service (NRCS) guidelines for nutrient management make on-farm application of poultry litter
increasingly difficult for poultry producers. Since most poultry farms import more nutrients in
feed than they export in meat and crops, increasing the off-farm use of poultry litter may be one
of the few truly sustainable solutions to water quality problems.
4
In addition to the poultry industry, nearly 70% of Georgia's Municipal Solid Waste is
organic material (according to national averages) and could be composted if source separated
(US EPA, 1999). For example, Georgia currently produces over 1.81 million metric tons (2
million tons) of food processing waste (Magbunua, 2000), 2.26 million metric tons (2.5 million
tons) of wood waste (Benson, 2000), and almost 362,000 metric tons (400,000 tons) of municipal
biosolids (Governo, 2000) annually.
According to the United States Environmental Protection Agency (US EPA)(1999)
organic waste in our landfills is the number one source of methane production in the US, a
greenhouse gas 20 to 25 times more potent than carbon dioxide. By diverting organic materials
from landfills we reduce potential ground water pollution from landfill leachate, reduce the
amount of methane released to the atmosphere, reduce the need to expand existing landfills and
construct new ones, and potentially improve soil quality by replacing organic matter and
recycling nutrients if applied to our highly depleted soils. Therefore, it is important to divert
these materials from landfills by developing off-site uses and markets for these materials.
Currently, 38 composting operations recycle approximately 501,008 metric tons (553,600
tons) per year of our state’s organic wastes (Gaskin et al., 2002) successfully relieving pressure
on landfills, however the increase in compost operations has created a need for new markets that
can utilize large amounts of compost. Creating new markets and value-added products will
increase utilization of compost, creating greater revenue generation and lead to a more
sustainable composting industry and increased infrastructure. This will increase recycling of
organic waste materials, and create a greater standard of living based on increased environmental
quality in our communities. Every community has a need to reduce materials going to landfills.
Producing and using compost locally can make the production of new compost products, like
5
compost used for erosion and sediment control, local rather than having to haul them over long
distances.
Soil loss from both agricultural and nonagricultural lands in the United States amounts to
over 4 billion metric tons each year due to erosion (Brady and Weil, 1996). While erosion is a
natural occurrence, anthropogenic activities can significantly increase erosion and sedimentation
rates. For example, forestlands lose an average of 0.36 metric tons/ha (1 ton/acre) per year;
agriculture loses an average of 5.5 metric tons/ha (15 tons/acre) per year while construction sites
average 73.3 metric tons/ha (200 tons/acre) per year (GA SWCC, 2002).
Erosion removes very thin layers of fertile soil, rich in nutrients and organic matter,
which reduces the ability of plants to establish, grow, and remain healthy in the soil. A reduction
in plant growth and subsequent plant residue results in less soil cover allowing the erosion
process to perpetuate and become worse. The danger to this process is that it can be
imperceptible and eventually lead to infertile land void of topsoil (Risse and Faucette, 2001).
The most serious impacts of soil erosion occur once the sediment leaves the site and
enters surface waters. When eroded sediment is transported from its site of origin to nearby
surface waters it also carries fertilizers, pesticides, fuels and other contaminants and substances
commonly spilled at construction sites that readily attach to soil particles (Risse & Faucette,
2001). For example, total annual loss of nitrogen, phosphorus and potassium due to soil erosion
is estimated to be over 38 million Mg. Most of this is in the soil organic matter lost with the
sediment (Brady and Weil, 1996). As a result, sediment can be five times as high in organic
matter and nitrogen as in the original topsoil (Brady and Weil, 1996). It is estimated that the
annual cost to society for on-site loss of soil, nutrients, water and yield reduction due to soil
erosion is over $27 billion per year (Brady and Weil, 1996).

6
The US EPA has declared that sediment contamination of our surface waters is the
biggest threat to our nation’s water resources. Surface water that is loaded with sediment can
lead to reduced drainage capacity, increased flooding, decreased aquatic organism populations,
decreased commercial and recreational fishing catches, clogged and damaged commercial and
industrial irrigation systems, increased expenditures at water treatment plants to clean the water,
and decreased recreational and aesthetic value of water resources (Risse and Faucette, 2001). In
addition to sediment build up in US river systems, another 1.5 billion Mg of sediment are
deposited in the nation’s reservoirs annually (Brady and Weil, 1996). The Clayton County
Water Authority in Georgia paid over $30,000 to dredge one reservoir in 2001 while the Metro
Atlanta area pays an estimated $4,000,000 per year to treat highly turbid water (Pihera, personal
communication 2002). It is estimated that the national cost to society due to sedimentation of
eroded soil is over $17 billion per year, bringing the total cost of erosion and sedimentation to
society in the United States to over $44 billion per year (Brady and Weil, 1996).
Soil erosion is considered the biggest contributor to nonpoint source pollution in the
United States according to the federally mandated National Pollution Discharge Elimination
System (NPDES) (US EPA, 1997). The US Environmental Protection Agency is moving ahead
with major new regulations to control erosion and runoff from farms, construction sites, and
roads in an effort to make over 20,000 rivers, lakes, and estuaries safe for swimming and fishing
(US EPA, 2000).
In 1987, amendments to the federal Clean Water Act mandated that construction sites
must control storm water, erosion, and sediment originating from their site (US EPA, 2000a). In
1990, NPDES Phase 1 Rules mandated that all construction sites over 2.03 ha (5 acres) were
required to have land-disturbing permits and pollution prevention plans (US EPA, 2000a). In

7
2003, the federally mandated NPDES Phase II went into effect extending the storm water
management plan requirement to any land-disturbing activity over 0.4 ha (1 acre) (US EPA,
2000a). This system affects 30 counties and 54 municipalities across Georgia (Kundell, personal
communication 2003). In August 2000, Georgia’s Erosion and Sediment Control Act was
amended to support NPDES Phase II, which created one of the nation’s toughest regulations on
soil erosion and sedimentation originating from construction sites, according to US EPA
officials. The new regulations label development zones as “point sources” requiring better
erosion control practices, new permitting programs, increased monitoring, and more site
inspections by state and local officials.
In the new Erosion and Sediment Control Law, construction sites are prohibited from
impacting any warm water stream by more than 25 Nephelometric Turbidity Units (NTU) and
any trout stream by more than 10 NTUs (GA Soil and Water Conservation Commission, 2002).
In addition, construction contractors are responsible for collecting and reporting storm water
runoff samples from their sites. Samples must be collected from the first 1.25 cm (½ inch) rain
event after clearing and grading, and again either after 90 days or after major soil disturbances
have commenced (Shahlaee, personal communication 2003). The state can and has levied
penalties up to $2,500 (USD) per day per violation of compliance with the new Erosion and
Sediment Control Law (GA Soil and Water Conservation Commission, 2002). In addition,
violators can also be held in noncompliance with the federal Clean Water Act can be fined up to
$100,000 (USD) day (GA Soil and Water Conservation Commission, 2002).
Construction and development projects, where topsoil is cleared of vegetation or moved,
are particularly subject to erosion problems. These project zones often present a significant
challenge in reestablishing vegetation to protect the soil due to reduced soil quality and fertility.
8
In many cases the existing topsoil has been totally removed making the challenge even greater.
In addition, heavy machinery and constant traffic compact the soil creating a “hard pan” that
decreases infiltration, increases runoff, and prevents plant establishment and growth (Brady and
Weil, 1996).
The Federal Highway Administration (FHA) regulates storm water and erosion and
sediment control for highway construction projects. They also develop erosion and sediment
control guidelines for state departments’ of transportation (DOTs) through the Intermodal
Efficiency Act of 1991 and the Transportation Equity Act for the 21st Century of 1998 (Federal
Highway Administration, 1997) and are held to the same standards in the Clean Water Act and
the NPDES permit program.
Although soil loss rates from construction sites are 10-20 times that of agricultural lands
(US EPA, 2000a), much less research has been done in this area. Turbidity and concentration of
suspended solids from storm runoff are the most commonly cited water quality impacts during
and immediately following highway construction projects (Barrett et al., 1995). Ehrhart et al.
(2002) reported that suspended sediment concentrations in storm water sampled from
construction site sediment basin effluent pipes were as much as 17 times higher than
measurements taken upstream. This Pennsylvania study also concluded that suspended
sediments remained high 100 meters downstream (Ehrhart et al, 2002).
While little research has been done on erosion and water quality impacts from
construction sites, what has been done evaluates silt fences, hydroseeding, sedimentation ponds,
check dams, synthetic fiber mats, and sediment barriers (Barrett et al., 1995). Currently, the
most common erosion control methods employed in Georgia include silt fences, hydroseeding,
geotextile blankets and straw mats. Several recent studies and field projects have suggested that
9
recycled organic material and/or compost applications can be a superior and cost effective
alternative to current erosion and sediment control best management practices (BMPs). For
example, the Georgia Department of Transportation and Georgia Soil and Water Conservation
Commission only require that straw mats and mulches provide 70-75% soil cover (GA Soil and
Water Conservation Commission, 2002), but Adams (1966) claims a 90% cover is needed for
appreciable differences in infiltration rates. Compost blankets when applied correctly provide
nearly 100% surface coverage. Studies by Adams (1966) and Meyer et al (1972) found that
significant rilling can develop under straw mats, where most soil loss occurs, while no rilling
developed under wood mulches. While synthetic blankets and mats provide a ground cover they
do not protect the structural stability of the slope, as rilling and gullying are common underneath
these measures. Compost blankets are designed and applied so that when runoff occurs it moves
over the surface of the blanket, not underneath. Heavier mulch materials, like compost, are
much less likely to blow off slopes in windy conditions compared to straw mulch, thus protecting
the soil from wind erosion (Meyer et al, 1972). Finally, compost filter berms may have less of
an impact on wildlife migration patterns than silt fence, since filter berms can be easily scaled or
traversed by terrestrial organisms.
Aside from the minimal effects of soil erosion from splashing, if runoff can be reduced or
prevented, then so too can soil erosion. As much as one-third of precipitation can be lost to
surface runoff and lead to subsequent erosion of the soil (Brady and Weil, 1996). The use of
surface applied organic amendments has been shown to reduce runoff and erosion (Adams, 1966;
Meyer et al., 1972; Laflen et al., 1978, Vleeschauwer et al., 1978, Foster et al., 1985). Land
application of animal manure has been shown to decrease runoff by up to 62% and soil loss up to
65% in agricultural operations where manure is added annually and subject to natural rainfall
10
conditions (Gilley and Risse, 2000). Poultry litter applications can reduce soil erosion and runoff
on bare soils with moderate 7% slopes, and can greatly reduce runoff on grassed slopes (Giddens
and Barnett, 1980). In addition, increasing the application rate of manure and litter can decease
runoff and soil loss rate (Giddens and Barnett, 1980; Gilley and Risse, 2000).
In forested landscapes, surface layers of organic matter reduce the energy of raindrop
impact and allow water to percolate into the soil, reducing surface runoff and erosion (Jordan,
1998). In addition, increasing water percolation in the soil can help to recharge groundwater
supplies, as 20% of all water used in the US comes from these sources (Brady and Weil, 1996).
Because of better soil contact and reduced susceptibility to movement from wind or water, wood
mulches are superior to hay and straw mats (Holmberg, 1983; Lyle, 1987). Shredded bark and
straw mulches will intercept and dissipate the energy of raindrops and prevent soil surface
crusting; they also break up overland flow of runoff and hold more water at the soil surface
allowing more water to infiltrate the soil (Adams, 1966; Gorman et al., 2000). Runoff from
mulched soils can be reduced to only a fraction of that from unmulched soils and can nearly
eliminate soil erosion (Epstein et al., 1966; Meyer et al., 1972; Laflen et al., 1978; Foster et al.,
1985; Meyer, 1985; Mills, et al., 1986). Adams (1966) found that soils covered with mulch
averaged less than 0.36 metric tons/ha (1 ton/acre) of soil loss compared to 7.4 metric tons/ha
(20.2 tons/acre) from uncovered soils, during a 21 cm (8.5-inch) storm event. Meyer et al (1972)
found on highway construction slopes of 20% and 45 meters (150 feet) long during a 6 cm (2.5
inch) storm event wood mulches yielded less than 1.8 metric tons (2 tons) per hectare soil loss
compared to over 36 metric tons (40 tons) per hectare soil loss from other measures. In addition,
berms made from mulch can act to filter moving sediment from storm runoff preventing it from

11
leaving construction sites and reaching nearby surface waters (GA Soil and Water Conservation
Commission, 1993).
In the last ten years compost has been used for slope stabilization, erosion and sediment
control, storm water filtration, and vegetative establishment applications (Tyler, 2001).
Composted wood waste has been shown to increase water infiltration and water holding capacity
by improving soil structure (Demars et al., 2000). Applications of composted municipal solid
waste can provide efficient control of storm runoff by dissipating the impact of water droplets
and reducing runoff flow velocity (Agassi, 1998). MSW compost has been shown to absorb
approximately 85% of applied rainfall compared to 42% and 52% from control plots (Agassi,
1998). Runoff rates were significantly lower on newly constructed highway embankments when
using compost instead of topsoil (Glanville et al, 2001; Glanville et al, 2002). Once incorporated
in the soil, compost can increase water infiltration up to 125% (Demars, 1998).
By increasing infiltration and reducing runoff, compost can reduce and potentially
prevent soil erosion from occurring. Compost used for erosion control in a French vineyard
reduced soil loss by two orders of magnitude (Ballif & Herre, 1988). In Portland, Oregon yard
waste composts used for erosion control in residential construction projects exhibited reduced
erosion and improved water quality over conventional erosion and sediment control measures
(Portland Metro, 1994). Ettlin and Stewart (1993) found that slopes up to 42% could effectively
use yard waste compost for slope stabilization and erosion control. Compost applications at
four-inch depths will effectively control erosion on 45% slopes up to 3 years (Michaud, 1995).
A study conducted by the Connecticut Department of Transportation found composts and
mulches reduced soil erosion ten-fold compared to bare soil surfaces on a 2:1 slope (Demars and
Long, 1998). Furthermore, Demars and Long (1998) report that when compared to silt fences,
12
compost is 99% more effective in keeping sediment out of nearby surface waters, and 38% more
effective than hydroseeding. By protecting the soil surface, compost blankets in general have
been demonstrated to prevent soil particle dislodgement and subsequent erosion (Demars et al.,
2000; CA Environmental Protection Agency, 2000; Portland Metro, 1994). Tyler (2001) states
that one of the reasons composts perform so well is they are often high in organic materials that
are more flexible, lighter, and absorb more water than soils; this helps in allowing the water to
infiltrate the soil underneath. Further, he states the variety of particle sizes in compost blankets
create an interlocking cover that allows water to travel on top while trapping the movement of
soil particles (Tyler, 2001).
Perhaps the best way to reduce runoff and control erosion is to establish permanent
vegetation as quickly as possible. Because of their dense cover characteristics undisturbed
forests and grassed areas provide the best natural protection against soil loss; they are nearly
equal in their capacity (Brady and Weil, 1996). The foliage of these vegetative covers can
intercept between 5 and 40% of total precipitation never allowing it to even touch the soil
surface, thus reducing runoff and potential soil loss (Brady and Weil, 1996). Grain sorghum
reduces soil erosion compared to plots with no surface cover from 0.97 metric tons/ha (2.64
tons/acre) to 0.34 metric tons/ha (0.92 tons/acre), mainly because of raindrop interception by
leaves and the binding actions of the fibrous roots near the soil surface (Adams, 1966). In
addition, a layer of organic litter on the soil surface insulates the soil and reduces evaporation,
creating a better environment for germination and root growth for establishing vegetation
(Adams, 1966; Jordan, 1998). Field studies by the University of California Cooperative
Extension staff found that compost out-performed conventional and slow-release fertilizers in
turf grass applications in the following areas; improved turf color throughout the year, delayed

13
onset of dormancy, lower weed populations, and consistently higher quality turf grass ratings
(Block, 2000). A project sponsored by the Federal Highway Administration and the US EPA
reported superior vegetative growth of compost over hydromulch and fertilizer on highway
construction embankments (US EPA, 1997). The Texas Department of Transportation and the
Texas Natural Resources Conservation Commission (TNRCC) found that composted dairy and
cattle manure substantially increased vegetative growth and reduced soil erosion on roadway
slopes (Block, 2000; US EPA, 2000). When comparing vegetative growth and erosion, Storey et
al. (1995) found compost amended slopes outperformed synthetic chemical tackifiers and
shredded wood on sandy soils. A study performed by Iowa State University found compost
applied to highway roadsides established vegetation equal to topsoil, while outperforming topsoil
in weed control (Richard et al, 2002).
It is important to delineate the advantage of compost over mulches in the ability to grow
vegetation. Mulches can often have a detrimental effect on plant growth because of nitrogen
immobilization (Meyer et al, 1972) while compost often has a carbon to nitrogen ratio optimum
for plant uptake and can provide a slow release of nutrients (Maynard, 2000; Granberry et al,
2001) that sustains prolonged healthy plant growth.
One of the advantages in using compost for erosion control applications is its ability to
maintain vegetation permanently because of its ability to increase soil organic matter and overall
soil quality. Aside from studies already mentioned that demonstrate how compost can contribute
to increased soil structure, water holding capacity, water infiltration and reduced soil erosion, it
has also been shown to act as a slow release nutrient source (Maynard, 2000; Granberry et al,
2001), disease suppressant (De Cuester and Hoitink, 1999; Graham, 1998), pH buffer (Maynard,
2000), and source of beneficial soil organisms (Zibilske, 1999). Soil erosion studies have also

14
shown that soil quality characteristics such as bulk density and aggregate stability can affect soil
loss (Bradford and Foster, 1996) and additions of organic amendments can increase aggregate
stability by resisting the beating action of rain and reducing soil erosion even when runoff occurs
(Adams, 1966; Piccolo and Mbagwu, 1990; Brady and Weil, 1996). The ability of compost to
positively influence these soil quality parameters is tantamount to its ability to maintain
vegetation permanently which can insure reduced erosion and sedimentation.
While many states report having demonstration sites utilizing compost for erosion and
sediment control, few have established specifications on what type or quality of compost to use
and how to apply the material. The Departments of Transportation in Texas, Maine, Oregon,
California, Connecticut, Washington, Idaho, and Michigan all have existing specifications on the
use of compost for erosion control (Alexander, 2003). The Oregon Department of
Environmental Quality, the Pennsylvania Division of Waterways, Wetlands and Erosion Control,
and the Coalition of Northeastern Governors also have specifications for using compost in
erosion and sediment control (Alexander, 2003). The American Association of State Highway
Transportation Officials (AASHTO) has recently released provisional specifications that have
been approved for the adoption by state departments of transportation (Alexander, 2003). The
University of Georgia has a set of recommended guidelines based on most of these specifications
(Risse and Faucette, 2001).
The Georgia Department of Transportation has recently approved some compost products
as an erosion and sediment control measure but has not released final specifications on how to
apply the material. The Georgia Soil and Water Conservation Commission (1993) which has
been charged with approving and publishing best management practices (BMPs) for construction
sites and land disturbing activities is considering the approval of compost as a BMP in the next

15
addition of the state Manual for Erosion and Sediment Control, commonly referred to as the
“Greenbook”.
While 9 states have approved specifications as of 2002, very little research has evaluated
the environmental impacts of different types of composts compared to industry standard
measures of controlling soil erosion and preventing sedimentation. Scientific investigations in
using compost for erosion control should seek to answer the following questions: how much can
compost increase rain water infiltration and reduce storm water runoff volume; what is the
optimum water content for composts to effectively be applied, reduce runoff and establish
vegetation; what turbidity and suspended solids levels can be expected from the application of
compost blankets; and are there water quality concerns related to nutrient loading from storm
water runoff from compost blankets? If so, what types of composts should be avoided and/or
how much buffer area should be maintained between compost application and surface waters;
how effective are compost berms in filtering chemical spills and petroleum products in storm
water runoff; and on how steep of a slope can compost be applied? In addition, what type of
compost establishes erosion control vegetation the quickest and provides the best long-term
vegetative cover; what is the optimum range of particle size distibution for water infiltration,
runoff reduction, particle movement entrapment, and vegetation establishment and growth?
And, what is the optimum depth for compost blankets and dimensions for compost filter berms -
seeded and unseeded; what is the maximum concentrated flow velocity a compost blanket and
compost filter berm can withstand; and what is the most cost effective way to apply compost
blankets and filter berms? Finally, and possibly most important, is it cost competitive with
industry standard erosion and sediment control measures?
16
As is usually the case, industry needs and consumer demand will steer the research. Most
current specifications for compost address some of these issues, while none address them all.
When developing specifications it is important to incorporate current research that addresses
optimum application procedures, economic feasibility and environmental impacts.
There is very limited literature on the cost to apply compost in erosion and sediment
control applications. Rexius Products of Eugene, Oregon constructs compost filter berms for
$1.50 per linear 30 cm (1 ft) (Alexander, 1999). A Texas highway erosion control project
utilizing compost cost the state $17,000 compared to standard measures employing topsoil,
seeding and erosion control blankets that would have cost $30,000 (Block, 2000).
The ultimate goal of this research is to determine the environmental benefits and impacts
of using compost for erosion and sediment control in construction site applications. Specifically,
to determine the water quality impacts from nutrient and sediment loading, runoff volumes, and
vegetative establishment and growth over 12 months compared to recognized industry standards
- hydroseeding and silt fence. In addition, the research will measure the effects on soil quality
and the overall cost to apply compost blankets and filter berms compared to conventional
measures. Results from this study will be used by the Georgia Soil and Water Conservation
Commission and a joint project by the US Department of Transportation, American Association
of State Highway Transportation Officials and the US Composting Council in developing new
specifications.
General Description of Compost Blankets and Compost Filter Berms
There are two basic methods for using compost in erosion and sediment control; compost
blankets and compost filter berms. Generally, compost blankets are used to prevent soil erosion
17
from occurring and filter berms are used to prevent moving sediments from leaving a designated
area or from entering surface waters. In most cases, both methods can be used in combination.
Generally, a mix of fine and course grades of compost is best for controlling erosion
(Risse and Faucette, 2001). The fine compost (passing through a 0.6 – 1.25 cm (¼ - ½ in)
screen) will penetrate the soil surface and increase water infiltration and water holding capacity.
In addition, the fine compost is important for rapid vegetation establishment and long term soil
and plant health. The long-term nutrient value that compost supplies generally comes from the
fine compost. Coarse grades of compost (passing through a 5 – 7.5 cm (2-3 in) screen) although
harder to plant into, help to prevent splashing of raindrops directly on the soil surface and are
less likely to be disturbed by storm runoff. The coarse grades also perform as filters by
“stopping” or “catching” soil particles already in motion (Risse and Faucette, 2001).
Compost blankets or mats are surface applications of specified high quality composts on
areas with erosive potential (Risse and Faucette, 2001). Compost blankets can be used to
prevent erosion on disturbed areas such as construction sites, state DOT development (and
planting) projects, exposed stream banks, and any disturbed or excavated land area with a 2:1
slope or less. The primary purpose of the compost blanket is to protect the soil surface until
vegetation is established (Risse and Faucette, 2001). Therefore, it is important to insure that the
compost material will encourage plant growth and that the slope is seeded with or directly
following the compost application. Field demonstrations conducted in Georgia have shown that
application rates should be between 2.5 to 7.5 cm (1 to 3 in) in depth, while some gradual slopes
may require as little as 1.9 cm (¾ in). Particle sizes should be a mix of fine grade and coarse
grades. Coarse grades may be larger if rapid vegetation establishment is not a primary goal.

18
Finally, a mixture ratio of 3:1 (fine: coarse) has been shown to work well in some of these field
demonstrations.
Compost filter berms are contoured runoff and erosion filtration devices usually used for
steeper slopes with high erosive potential (Risse and Faucette, 2001). The filter berm allows
runoff water to flow through while filtering sediment and pollutants from the water. Filter berms
also slow the flow down, allowing soil particles to settle out. Berm size and construction may
vary based on slope steepness and the amount of expected rainfall; larger berms are
recommended for steeper slopes and areas with greater runoff potential. Compost berms are
typically contoured to the base of the slope but a second berm may be used on the shoulder
contour of steeper slopes to prevent concentrated flow from running onto the compost blanket.
Berms may be windrow or trapezoidal (allows maximum water penetration) in shape and should
be placed uncompacted on bare soil immediately after soil disturbance. Windrow shaped berms
(as used in this study) should be between 30 to 60 cm (1 to 2 ft) high and 75 to 120 cm (2.5 to 4
ft) wide (Risse and Faucette, 2001). Trapezoidal berms should be approximately 60 cm (2 ft)
high, 60 to 90 cm (2 to 3 ft) wide at the top, and at least 120 cm (4 ft) wide at the base (Risse and
Faucette, 2001). Compost filter berms are not recommended for use in runoff channels, ditches,
or gullies. Particle sizes should be a mix of fine and coarse grades of compost with no particle
sizes exceeding 7.5 cm (3 in) in length (Risse and Faucette). The mixture ratio should include a
greater fraction of coarser grade compost (1:1) compared to compost blankets if vegetation
establishment on the berm is not a primary goal, or if there is a high runoff quantity potential
(Risse and Faucette, 2001).
19
Specifications for Compost Material and Compost Application in Erosion and Sediment
Control
Specifications for compost use in erosion and sediment control applications are a
relatively new development. Certainly composts can vary considerably in quality and often a
product that claims to be compost, really may not have undergone the necessary biological
processes. Specifications attempt to standardize high quality composts and formulate them in a
manner that will provide optimum performance when applied correctly. Specifications may
include: particle size, moisture content, nutrient content, organic matter content, pH, soluble salt
content, heavy metals content, human made inert contents, stability and maturity indices,
application rates, sand/silt/clay content, and/or certification by a third party.
For the purposes of this research, the recommended specifications developed by the
University of Georgia were used. These recommendations, developed in the spring of 2001,
were based on the specifications developed by Texas, Oregon, Connecticut, and California;
interviews with the researchers and field professionals that developed these specifications; and
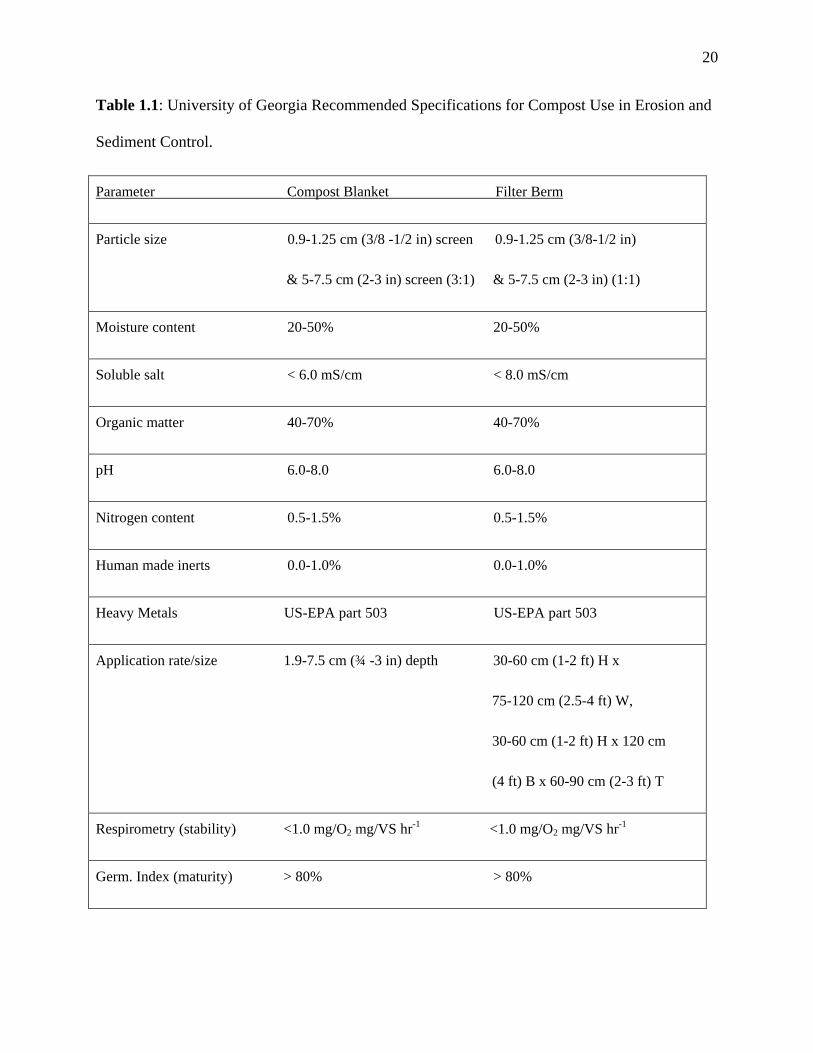
trial and error in field demonstration projects in Georgia. Table 1.1 shows the recommended
specifications developed by the University of Georgia (Risse and Faucette, 2001). Since this
study was conducted, updated specifications have been developed for the American Association
of State Highway Transportation Officials (Alexander, 2003) and are recommended for use in
future projects.
20
Table 1.1: University of Georgia Recommended Specifications for Compost Use in Erosion and
Sediment Control.
Parameter Compost Blanket Filter Berm
Particle size 0.9-1.25 cm (3/8 -1/2 in) screen 0.9-1.25 cm (3/8-1/2 in)
& 5-7.5 cm (2-3 in) screen (3:1) & 5-7.5 cm (2-3 in) (1:1)
Moisture content 20-50% 20-50%
Soluble salt < 6.0 mS/cm < 8.0 mS/cm
Organic matter 40-70% 40-70%
pH 6.0-8.0 6.0-8.0
Nitrogen content 0.5-1.5% 0.5-1.5%
Human made inerts 0.0-1.0% 0.0-1.0%
Heavy Metals US-EPA part 503 US-EPA part 503
Application rate/size 1.9-7.5 cm (¾ -3 in) depth 30-60 cm (1-2 ft) H x
75-120 cm (2.5-4 ft) W,
30-60 cm (1-2 ft) H x 120 cm
(4 ft) B x 60-90 cm (2-3 ft) T
Respirometry (stability) <1.0 mg/O2 mg/VS hr-1 <1.0 mg/O2 mg/VS hr-1
Germ. Index (maturity) > 80% > 80%
21
References Cited
Adams, J.E. 1966. Influence of mulches on runoff, erosion, and soil moisture depletion.
Soil Science Society of America Proceedings 30:110-114.
Agassi, M., A. Hadas, Y. Benyamini, G.J. Levy, L. Kautsky, L. Avrahamov, and H.
Zhevelev. 1998. Mulching effects of composted msw on water percolation and compost
degradation rate. Compost Science and Utilization. JG Press. Emmaus, PA. 6:3, 34-41.
Alexander, R. 2003. National Erosion/Sediment Control Specifications for Composted Products.
Recycled Materials Resource Center, University of New Hampshire and American
Association of State Highway Transportation Officials. Durham, New Hampshire.
Alexander, R. 1999. Compost markets grow with environmental applications. p. 43-
48. BioCycle: Journal of Composting and Organics Recycling. April, 1999. JG Press.
Emmaus, PA.
Ballif, J.L., C. Herre. 1988. Research on the runoff of soil vineyard in Champagne area.
Effects of municipal compost mulching. Comptes Rendus de Academie Agriculture de
France. p. 105-110.
Barrett, M.E., R.D. Zuber, E.R. Collins, J.F. Malina, R.J. Charbeneau, and G.H. Ward.
1995. A review and evaluation of literature pertaining to the quantity and control of
pollution from highway runoff construction. Center for Research in Water Resources.
University of Texas.
Benson, L. 2000. Quantification, characterization and marketing of wood wastes in
Georgia. University of Georgia. Engineering Outreach Report. September, 2000.
Block, D. 2000. Controlling erosion from highway projects. BioCycle: Journal of
Composting and Organics Recycling. JG Press. Emmaus, PA. 41:1. p. 59-62.
22
Bradford, J.M., G.R. Foster. 1996. Interrill soil erosion and slope steepness factors. Soil
Science Society of America. 60:909-915.
Brady, N.C., R.R. Weil. 1996. The Nature and Properties of Soils: 11th Edition. Prentice
Hall, Inc. New Jersey.
California Environmental Protection Agency, California Integrated Waste Management
Board. 2000. Use of compost and co-compost as a primary erosion control material.
January, 2000. Placer County, CA.
De Ceuster, T., H. Hoitink. 1999. Prospects for composts and biocontrol agents as
substitutes for methyl bromide in biological control of plant diseases. Compost
Science and Utilization. Emmaus, PA. JG Press. Vol. 7, No. 3, 6-15.
Demars, K.R., R.P. Long, and J.R. Ives. 2000. New England Transportation Consortium use
of wood waste materials for erosion control. April, 2000.
Demars, K.R., R.P. Long. 1998. Field evaluation of source separated compost and
Coneg model procurement specifications for Connecticut DOT projects. University of
Connecticut and Connecticut Department of Transportation. December, 1998. JHR 98-
264.
Ehrhart, B.J., R.D. Shannon, and A.R. Jarrett. 2002. Effects of construction site
sedimentation basins on receiving stream ecosystems. Transactions of the ASAE. 45:3;
675-680.
Epstein, E., W.F. Grant, and R.A. Struchtemeyer. 1966. Effects of stones on runoff, erosion
and soil moisture. Soil Science Society of America Proceedings, 30:638-640.
Ettlin, L., B. Stewart. 1993. Yard debris compost for erosion control. BioCycle: Journal
of Composting and Organics Recycling. JG Press. Emmaus, PA. 34:12. p.46-47.

23
Faucette, B. 2001. Georgia builds poultry litter composting infrastructure. BioCycle:
Journal Composting and Organics Recycling. JG Press. Emmaus, PA. August, 2001. p.
23-26.
Federal Highway Administration. 1997. Erosion and sediment control, dirty work
everyone should do. Greener Roadsides. Federal Highway Administration. 4:2. p.1.
Foster, G.R., R.A. Young, M.J.M. Romkens, and C.A. Onstad. 1985. Processes of soil
erosion by water. In: Follet, R.F. and B.A. Stewart. Soil Erosion and Crop Productivity.
ASA, CSSA and SSSA, Madison, WI. Pp. 137-162.
Gaskin, J., J. Governo, B. Faucette, and D. Borden. 2002. Closing the Organic Byproduct
Loop: Part 1 An Overview of Large-Scale Composting in Georgia. Engineering Outreach
Service, University of Georgia. Engineering Outreach Report. September, 2002.
Georgia Soil and Water Conservation Commission. 2002. Erosion and Sediment Control
Course Manual. Georgia Soil and Water Conservation Commission.
Georgia Soil and Water Conservation Commission. 1993. Manual for Erosion and
Sediment Control in Georgia. Pp. 6:19-191.
Giddens, J., A.P. Barnett. 1980. Soil loss and microbiological quality of runoff from land
treated with poultry litter. Jounal of Environmental Quality. 9(3):518-520.
Gilley, J.E., L.M. Risse. 2000. Runoff and soil loss as affected by the application of
manure. Transactions of the ASAE. 43:6.
Glanville, T.D., R.A. Persyn, and T.L. Richard. 2001. Impacts of compost application on
highway construction sites in Iowa. 2001 ASAE Annual International Meeting.
Sacramento, CA. Paper 01-012076.
Glanville, T.D., R.A. Persyn, and T.L. Richard. 2002. Water quality impacts of using
24
composted organics on highway rights-of-way. 2002 ASAE Annual International
Meeting. Chicago, IL. Paper 022052.
Gorman, J.M., J.C. Sencindiver, D.J. Horvath, R.N. Singh, and R.F. Keefer. 2000.
Erodibility of fly ash used as a topsoil substitute in mineland reclamation. Journal of
Environmental Quality. 29:805-811.
Governo, J. 2000. Characterization and quantification of Georgia’s municipal
biosolids production and disposal. University of Georgia. Engineering Outreach Report
June 2000.
Graham, J.H. 1998. Composted municipal wastes increase growth, yield and disease
tolerance of citrus. Composting in the Southeast: 1998 Conference Proceedings. Athens,
GA, University of Georgia.
Granberry, D., W. Kelley, D. Langston, K. Rucker, and J. Diaz-Perez. 2001. Testing compost
value on pepper plants. BioCycle: Journal Composting and Organics Recycling.
Emmaus, PA., JG Press. Vol. 42, No. 10.
Holmberg, G.V. 1983. Landuse, soils, and revegetation. p. 279-350. In L.V.A. Sendlein.
Surface mining environmental monitoring and reclamation handbook. Elsevier Science
Publishers, New York, NY.
Jordan, C.F. 1998. Working with Nature: Resource management for sustainability.
Harwood Academic Publishers, Netherlands.
Kundell, J. 2003. Director, Environmental Policy Program, Vinson Institute of Government,
University of Georgia. Personal Communication.
Laflen, J.M., J.L. Baker, R.O. Hartwig, W.A. Buchele, and H.P. Johnson. 1978. Soil and
water loss from conservation tillage systems. Trans. ASAE, 21:881-885.
25
Lyle, E.S. 1987. Surface mine reclamation manual. Elsevier Science Publishers, New
York, NY.
Magbunua, B. 2000. An assessment of the recovery and potential of residuals and
byproducts from the food processing and institutional food sectors in Georgia. University
of Georgia. Engineering Outreach Report. June, 2000.
Maynard, A. 2000. Applying leaf compost to reduce fertilizer use in tomato production.
Compost Science and Utilization. Emmaus, PA. JG Press. Vol. 8, No. 3, 203-209.
Meyer, L.D., C.B. Johnson, and G.R. Foster. 1972. Stone and woodchip mulches for erosion
control on construction sites. Journal of Soil and Water Conservation., 27:264-269.
Meyer, L.D. 1985. Interrill erosion rates and sediment characteristics. In: El-Swaify,
S.A., W.C. Moldenhauer and A. Lo. (eds.) Soil Erosion and Conservation. Soil
Conservation Society of America, Ankeny, IA, pp. 167-177.
Michaud, M. 1995. Recycled materials used as erosion control mulches. In: Compost
Utilization in Horticultural Cropping Systems, eds. P.J. Stofella and B.A. Kahn, Lewis
Publishers.
Mills, W.C., A.W. Thomas, and G.W. Langdale, G.W. 1986. Estimating soil loss probabilities
for Southern Piedmont cropping-tillage systems. Trans. ASAE, 29:948-955.
Piccolo, A., J.S.C. Mbagwu. 1990. Effects of different organic waste amendments on soil
microaggregates stability and molecular sizes of humic substances. Kluwer Academic
Publishers, Netherlands.
Pihera, G. 2002. Personal communication. Clayton County Water Authority.
26
Portland Metro. 1994. Summary of projects using yard debris compost for erosion
prevention and control. Final Report. June, 1994. Solid Waste and Planning Department.
Portland, OR.
Richard, T., R.A. Persyn, T.D. Glanville. 2002. Cover crop production and weed control
on highway right-of-ways using composted organics. 2002 ASAE Annual
International Meeting. Chicago, IL. Paper 022051.
Risse, L.M., B. Faucette. 2001. Compost utilization for erosion control.
University of Georgia Cooperative Extension Service Bulletin 1189. CAES-UGA.
Athens, GA
Shahlaee, K. 2003. Personal communication. Program Manager for Urban Water
Resources, Georgia Soil and Water Conservation Commission.
Storey, B.B., J.A. McFalls, S.H. Godfrey. 1995. The use of compost and shredded
brush on rights of way for erosion control: Final report. Texas Transportation
Institute, Texas A&M University System. College Station, TX. Contract No. 0-1352.
Tyler, R. 2001. Compost filter berms take on the silt fence. BioCycle: Journal
of Composting and Organics Recycling. January, 2001. JG Press. Emmaus, PA. P.
26-31.
US EPA. 1997. Innovative uses of compost: erosion control, turf remediation and
landscaping. EPA 530-F-97-043. October, 1997.
US EPA. 1998. Transportation Equity Act provides new funds to protect water quality.
Nonpoint Source News Notes. No. 54. p.1-3.
US EPA. 1999. A Collection of Solid Waste Resources: Fall 1999 Edition. CD-ROM.
27
US EPA. 2000. Bosque watershed doesn’t waste manure. Nonpoint Source News Notes.
No. 63. p. 21-22.
US EPA. 2000a. Storm Water Phase II Final Rule: Construction site runoff control minimum
control measure. Office of Water (4203). EPA 833-F-00-008, Fact Sheet 2.6.
Vleeschauwer, D.D., M.D. Boodt. 1978. The comparative effects of surface applications
of organic mulch versus chemical soil conditioners on physical and chemical
properties of the soil and on plant growth. Catena 5:337-349.
Weld, J. 2003. Summary of phosphorus indices: management category ranges. USDA,
Agricultural Research Pasture Systems and Watershed Management Research Unit.
http://pswmru.arsup.psu.edu/phosphorus/Summary_Pindex_Ranges.pdf, date accessed 5-
6-2004.
Zibilske, L.M. 1999. Composting of organic wastes. In: Principles and Applications of
Soil Microbiology. Prentice Hall, Inc. New Jersey.

28
CHAPTER 2
RUNOFF, EROSION, AND NUTRIENT LOSSES FROM COMPOST AND MULCH
BLANKETS UNDER SIMULATED RAINFALL1
1Faucette, L.B.,L.M. Risse, M.A. Nearing, J.W. Gaskin , and L.T. West. Accepted by the Journal
of Soil and Water Conservation
Reprinted here with permission of publisher, 6/7/2004

29
Runoff, Erosion, and Nutrient Losses from Compost and Mulch Blankets under
Simulated Rainfall
Abstract
Control of soil erosion and associated nonpoint source pollution is essential to improving water
quality. The use of compost or mulch blankets as a soil cover can help control soil erosion and
provide sustainable alternatives to disposal for many biomass resources. The objective of this
study was to investigate the amounts of runoff, erosion, and nutrient losses obtained under
simulated rainfall using a variety of compost and mulch materials. Treatments included aged
poultry litter, two different types of poultry litter compost, municipal solid waste compost,
biosolids compost, food waste compost, yard waste compost, three different types of wood
mulch, and bare soil. Results indicated that all of the treatments except for aged poultry litter
were effective at reducing total solids loss in the runoff. Nutrient losses from most of the
compost treatments, however, were higher than those from bare soil or mulch treatments.
Treatments with lower respiration rates and nitrate-nitrogen concentrations tended to have less
erosion and transport of solids. Nitrate-nitrogen content, respiration rates, soluble salt, sodium,
and potassium contents were good indicators of ammonium and phosphorus losses.
Keywords: Compost, erosion control, mulch, nutrient loss, runoff, water quality
30
Sediment has been identified as one of the most important nonpoint source pollutants of
streams, lakes, and estuaries. Sediment is recognized as a pollutant that has an impact on
aquatic organisms, habitat, and is also a carrier of other nonpoint source pollutants (Ermine and
Ligon, 1988). While sources of sediment and other nonpoint source pollutants include
agriculture and forestry, other land uses such as construction, development, and roads are
being recognized as the major contributors in urban and developing areas. In fact, soil loss rates
from construction sites are typically 10-20 times those from agricultural land (USEPA, 1997).
Amendments in 1987 to the Clean Water Act label construction activities as “point sources”
under the National Pollution Discharge Elimination System, requiring improved erosion control
practices and new permitting programs (USEPA, 2003). In addition, road construction and
maintenance are commonly recognized as significant sources of sediment requiring substantial
investment in erosion control and vegetation establishment.
Currently, common erosion control practices for construction projects and road
development in Georgia consist of silt fences, hydroseeding, and establishing vegetation.
Demonstration projects and experimental research have suggested that the use of compost and
mulch applications could improve upon existing erosion control technologies (Demars et al.,
2000, Glanville et al., 2001, Mitchell, 1997). The use of compost and mulches in erosion control
has additional benefits of being a more sustainable method of dealing with “waste” materials.
With agricultural byproducts such as animal manure, it represents a method of improving the
nutrient balance on the farm through the development of off-farm uses. Utilization of other
organic byproducts such as municipal biosolids, wood waste, food processing residuals, and
municipal solid waste could also be improved through composting if value added markets were
available. Using these organic materials to rebuild soils and control soil erosion offers
significant advantages over landfilling provided it is done in an environmentally sound manner.
Additionally, many of these organic by-products are generated near urban and developing areas
where the need for erosion control technologies is often greatest.
31
Conventional methods to control sediment include silt fencing and riprap; while
hydroseeding, wood fiber mats, coconut hull fiber mats and straw mats are conventional means
to prevent soil erosion from occurring. Surface applied organic mulches to protect the soil
surface can significantly reduce both runoff and soil erosion (Adams, 1966; Meyer et al., 1972;
Laflen et al., 1978; Vleeschauwer et al., 1978; Foster et al, 1985; Agassi et al., 1998). The
mechanisms behind these reductions include less soil crust formation in the underlying soil,
dissipation of the energy associated with raindrop impact, and a reduction in the shear forces
exerted on the soil surface. Surface layers of organic matter reduce the energy of raindrop
impact and allow water to percolate into the soil, reducing surface runoff and erosion. The
rougher surface created by mulches and some composts also allows for greater water storage
and percolation and lower runoff velocities (Kramer and Meyer, 1969). Composted wood waste
has also been shown to increase water infiltration and water holding capacity by improving soil
structure (Demars et al., 2000). Applications of animal manure to soil surfaces can also reduce
runoff and soil erosion. However, the mechanisms behind these reductions are not well defined
(Gilley and Risse, 2001; Giddens and Barnett, 1980). In addition, a layer of organic litter on the
soil surface insulates the soil and reduces evaporation creating a better environment for
germination and root growth and therefore improved vegetative cover (Jordan, 1998).
Establishment of vegetative cover can then provide for long-term protection of the soil surface.
Studies conducted on 10.6 m by 3.1 m (35 ft by 10.2 ft) plots at a 2:1 slope by the
Connecticut Department of Environmental Protection and Transportation showed that blankets
of both yard waste mulch and yard waste compost reduced erosion by an order of magnitude
and that the compost treatments performed as well or better than the conventional treatment of
hay and seed (Demars et al., 2000). In Texas, Storey et al. (1996) compared compost
amended plots and plots mulched with shredded wood to commonly used synthetic chemical
tackifiers. They found that the compost amended plots reduced erosion as well or better than
the other treatments with the greatest reductions occurring on sandy soils. Glanville et al.
32
(2001) compared three types of compost to bare soil and traditionally treated soils on new
highway embankments in Iowa. They found that runoff from all three compost plots was
significantly lower than the control and runoff from bio-industrial and yard waste compost was
significantly lower than from plots amended with topsoil; however, plots amended with
composted biosolids were not significantly different. All of the composts produced significantly
less interrill erosion than topsoil amended plots. While differences in the growth of the planted
cover crop were statistically indistinguishable, weed growth was significantly lower on some of
the compost treatments.
Although erodibility is defined as a soil property and is quantified in terms of sediment
loss, composts and mulches should display a similar property relative to the total solids lost from
a surface cover. Very few people have investigated the measurement of erodibility on composts
or mulches. Westerman et al. (1983) studied the erodibility of layer manure and broiler litter on
sand and clay soils. They found that the addition of manure or litter resulted in increased
transport of total solids and nutrients in the runoff, yet the erodibility of the manure was between
that of the sand and clay. Many of the previously mentioned studies have attempted to quantify
the total solids lost from compost or mulch blankets but few have related these data to the
characteristics of the cover material. The erodibility of composts and mulches should be an
important factor in their ability to control erosion.
The overall goal of this project is to develop a better understanding of the characteristics
of composts and mulches as related to their use in erosion control technologies. Specifically, the
objectives of this work were to test the runoff quantity, sediment loss and nutrient loss of various
compost and mulch materials used as blankets under simulated rainfall and to correlate the
physical and chemical properties of the materials to the measured losses.
33
Methods and Materials
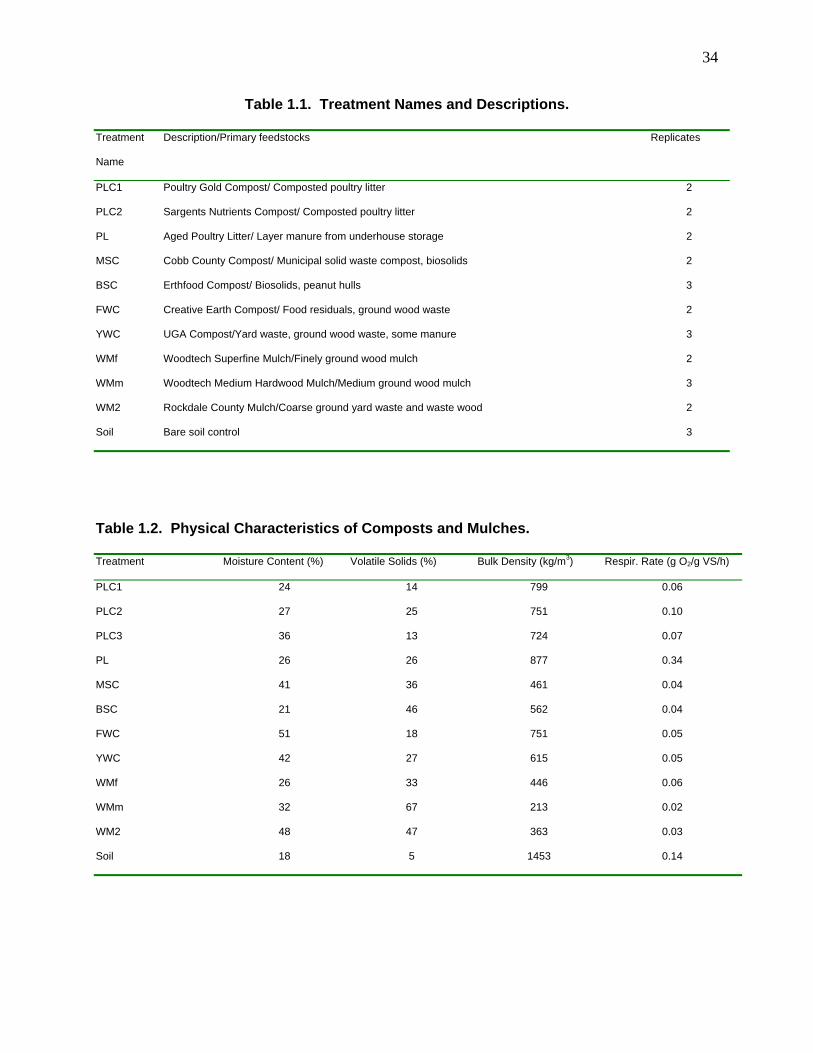
Eleven treatments including three poultry litter composts, a municipal solid waste compost, a
food waste compost, a yard waste compost, a biosolids/peanut hull compost, three grades of
wood mulches and a bare soil control were selected for use in this study (Table 1.1). Compost
is defined as organic material that has undergone a controlled, microbiological heat process and
has decomposed to a biologically stable, humus rich material (Alexander, 1996). Mulch is
simply a ground woody material generally derived from wood waste or yard debris. It has a
relatively wide carbon to nitrogen ratio, a low nutrient content and has not gone through a
controlled biological heat process. These treatments were selected based on their commercial
availability in Georgia. Each of the materials was supplied by a commercial vendor and was
tested as supplied. The bare soil control was obtained from a construction site that had
undergone extensive grading and soil relocation. The site was originally mapped as an eroded
Cecil sandy clay loam soil. Approximately, 1.81 metric tonnes (2 tons) of fill material was
removed from the site, and passed through a 1.27 cm (0.5 in) screen to remove rocks and large
aggregates. Initial plans called for three replicates of each treatment; however, due to limited
supplies fewer replicates were used with several of the materials (Table 1.1).
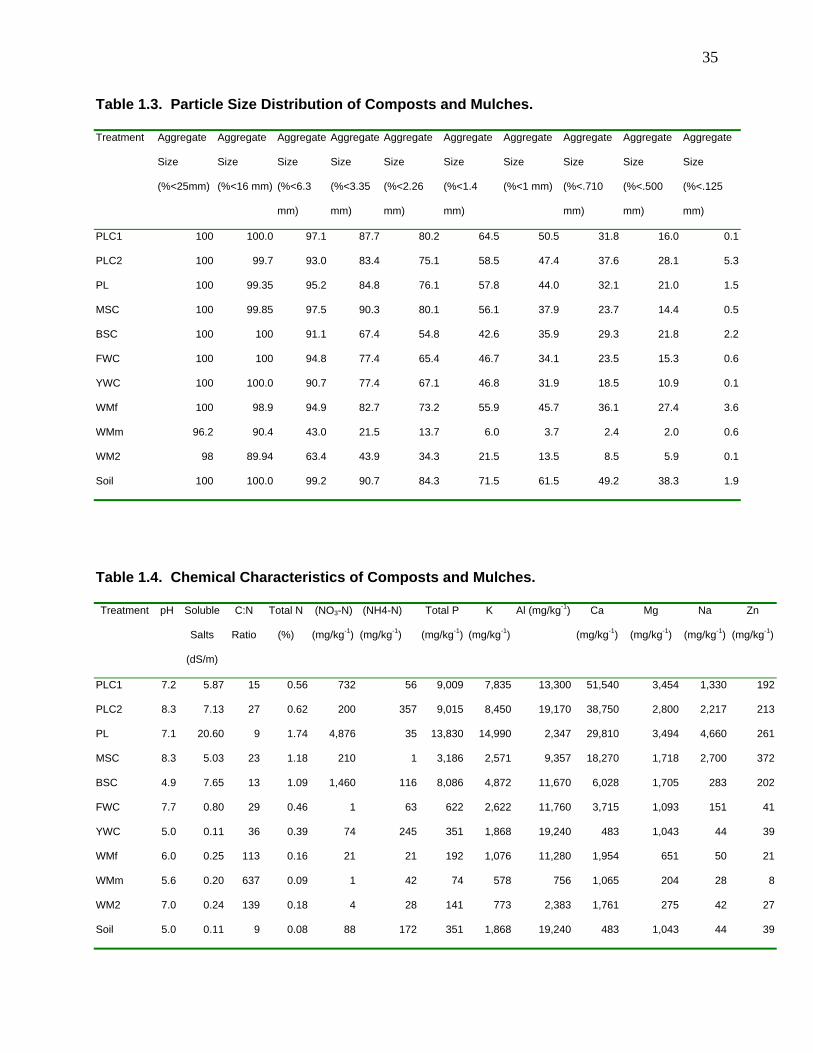
Tables 1.2, 1.3 and 1.4 present the physical and chemical properties of each treatment.
Bulk density, aggregate size, soluble salts, and respiration rate were measured at the University
of Georgia Bioconversion laboratory using procedures outlined in Test Methods for the
Examination of Compost (USCC, 1997). The remaining parameters were measured at the
University of Georgia Agricultural and Environmental Services Laboratory using EPA or AOAC
approved procedures (University of Georgia, 2004). Metals were analyzed and all of the
treatments were below the pollutant concentration levels as specified in USEPA part 503 Table
4 (USEPA 1993).
34
Table 1.1. Treatment Names and Descriptions.
Treatment
Name
Description/Primary feedstocks Replicates
PLC1 Poultry Gold Compost/ Composted poultry litter 2
PLC2 Sargents Nutrients Compost/ Composted poultry litter 2
PL Aged Poultry Litter/ Layer manure from underhouse storage 2
MSC Cobb County Compost/ Municipal solid waste compost, biosolids 2
BSC Erthfood Compost/ Biosolids, peanut hulls 3
FWC Creative Earth Compost/ Food residuals, ground wood waste 2
YWC UGA Compost/Yard waste, ground wood waste, some manure 3
WMf Woodtech Superfine Mulch/Finely ground wood mulch 2
WMm Woodtech Medium Hardwood Mulch/Medium ground wood mulch 3
WM2 Rockdale County Mulch/Coarse ground yard waste and waste wood 2
Soil Bare soil control 3
Table 1.2. Physical Characteristics of Composts and Mulches.
Treatment Moisture Content (%) Volatile Solids (%) Bulk Density (kg/m3) Respir. Rate (g O2/g VS/h)
PLC1 24 14 799 0.06
PLC2 27 25 751 0.10
PLC3 36 13 724 0.07
PL 26 26 877 0.34
MSC 41 36 461 0.04
BSC 21 46 562 0.04
FWC 51 18 751 0.05
YWC 42 27 615 0.05
WMf 26 33 446 0.06
WMm 32 67 213 0.02
WM2 48 47 363 0.03
Soil 18 5 1453 0.14
35
Table 1.3. Particle Size Distribution of Composts and Mulches.
Treatment Aggregate
Size
(%<25mm)
Aggregate
Size
(%<16 mm)
Aggregate
Size
(%<6.3
mm)
Aggregate
Size
(%<3.35
mm)
Aggregate
Size
(%<2.26
mm)
Aggregate
Size
(%<1.4
mm)
Aggregate
Size
(%<1 mm)
Aggregate
Size
(%<.710
mm)
Aggregate
Size
(%<.500
mm)
Aggregate
Size
(%<.125
mm)
PLC1 100 100.0 97.1 87.7 80.2 64.5 50.5 31.8 16.0 0.1
PLC2 100 99.7 93.0 83.4 75.1 58.5 47.4 37.6 28.1 5.3
PL 100 99.35 95.2 84.8 76.1 57.8 44.0 32.1 21.0 1.5
MSC 100 99.85 97.5 90.3 80.1 56.1 37.9 23.7 14.4 0.5
BSC 100 100 91.1 67.4 54.8 42.6 35.9 29.3 21.8 2.2
FWC 100 100 94.8 77.4 65.4 46.7 34.1 23.5 15.3 0.6
YWC 100 100.0 90.7 77.4 67.1 46.8 31.9 18.5 10.9 0.1
WMf 100 98.9 94.9 82.7 73.2 55.9 45.7 36.1 27.4 3.6
WMm 96.2 90.4 43.0 21.5 13.7 6.0 3.7 2.4 2.0 0.6
WM2 98 89.94 63.4 43.9 34.3 21.5 13.5 8.5 5.9 0.1
Soil 100 100.0 99.2 90.7 84.3 71.5 61.5 49.2 38.3 1.9
Table 1.4. Chemical Characteristics of Composts and Mulches.
Treatment pH Soluble
Salts
(dS/m)
C:N
Ratio
Total N
(%)
(NO3-N)
(mg/kg-1)
(NH4-N)
(mg/kg-1)
Total P
(mg/kg-1)
K
(mg/kg-1)
Al (mg/kg-1) Ca
(mg/kg-1)
Mg
(mg/kg-1)
Na
(mg/kg-1)
Zn
(mg/kg-1)
PLC1 7.2 5.87 15 0.56 732 56 9,009 7,835 13,300 51,540 3,454 1,330 192
PLC2 8.3 7.13 27 0.62 200 357 9,015 8,450 19,170 38,750 2,800 2,217 213
PL 7.1 20.60 9 1.74 4,876 35 13,830 14,990 2,347 29,810 3,494 4,660 261
MSC 8.3 5.03 23 1.18 210 1 3,186 2,571 9,357 18,270 1,718 2,700 372
BSC 4.9 7.65 13 1.09 1,460 116 8,086 4,872 11,670 6,028 1,705 283 202
FWC 7.7 0.80 29 0.46 1 63 622 2,622 11,760 3,715 1,093 151 41
YWC 5.0 0.11 36 0.39 74 245 351 1,868 19,240 483 1,043 44 39
WMf 6.0 0.25 113 0.16 21 21 192 1,076 11,280 1,954 651 50 21
WMm 5.6 0.20 637 0.09 1 42 74 578 756 1,065 204 28 8
WM2 7.0 0.24 139 0.18 4 28 141 773 2,383 1,761 275 42 27
Soil 5.0 0.11 9 0.08 88 172 351 1,868 19,240 483 1,043 44 39
36
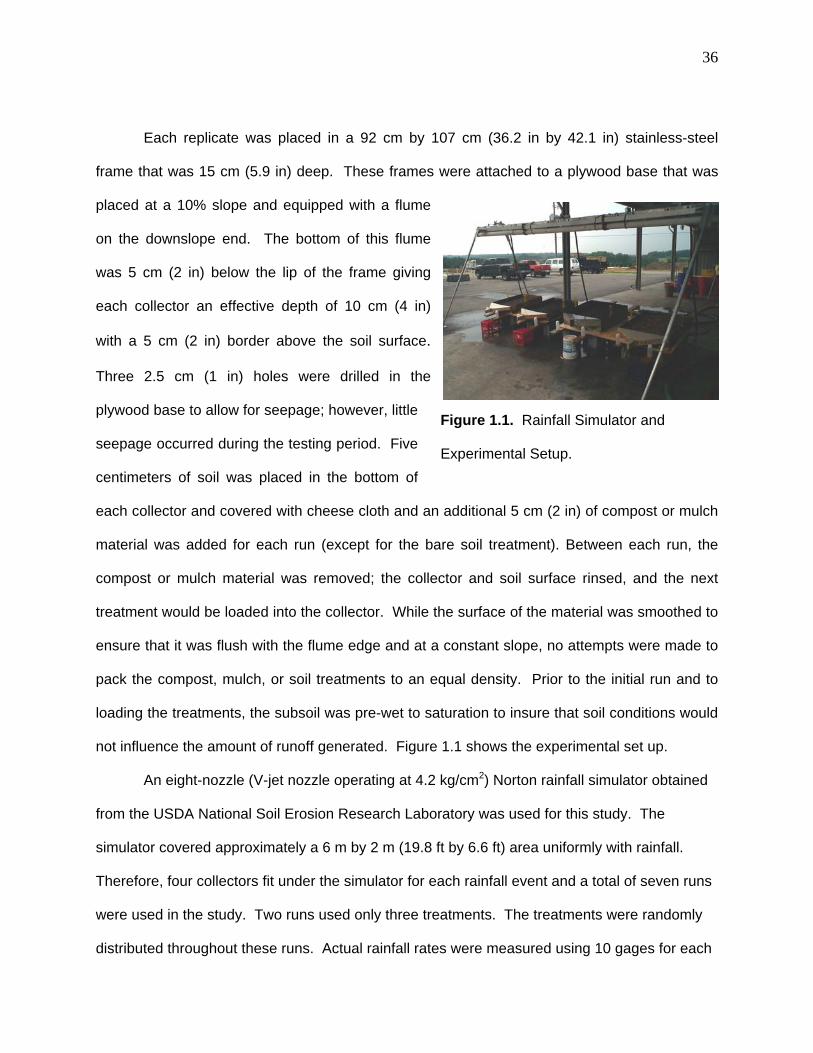
Figure 1.1. Rainfall Simulator and
Experimental Setup.
Each replicate was placed in a 92 cm by 107 cm (36.2 in by 42.1 in) stainless-steel
frame that was 15 cm (5.9 in) deep. These frames were attached to a plywood base that was
placed at a 10% slope and equipped with a flume
on the downslope end. The bottom of this flume
was 5 cm (2 in) below the lip of the frame giving
each collector an effective depth of 10 cm (4 in)
with a 5 cm (2 in) border above the soil surface.
Three 2.5 cm (1 in) holes were drilled in the
plywood base to allow for seepage; however, little
seepage occurred during the testing period. Five
centimeters of soil was placed in the bottom of
each collector and covered with cheese cloth and an additional 5 cm (2 in) of compost or mulch
material was added for each run (except for the bare soil treatment). Between each run, the
compost or mulch material was removed; the collector and soil surface rinsed, and the next
treatment would be loaded into the collector. While the surface of the material was smoothed to
ensure that it was flush with the flume edge and at a constant slope, no attempts were made to
pack the compost, mulch, or soil treatments to an equal density. Prior to the initial run and to
loading the treatments, the subsoil was pre-wet to saturation to insure that soil conditions would
not influence the amount of runoff generated. Figure 1.1 shows the experimental set up.
An eight-nozzle (V-jet nozzle operating at 4.2 kg/cm2) Norton rainfall simulator obtained
from the USDA National Soil Erosion Research Laboratory was used for this study. The
simulator covered approximately a 6 m by 2 m (19.8 ft by 6.6 ft) area uniformly with rainfall.
Therefore, four collectors fit under the simulator for each rainfall event and a total of seven runs
were used in the study. Two runs used only three treatments. The treatments were randomly
distributed throughout these runs. Actual rainfall rates were measured using 10 gages for each

37
run. Average measured rainfall rates were 16 ± 0.7 cm/h (6.3 ± 0.3 in/h). The high rate of
rainfall exceeds the 1-hour, 100-year storm event for Athens, Georgia (US Department of
Commerce, 1961); however, it was our intention to evaluate these treatments under a “worst-
case” scenario, because most erosion occurs during these large events. Since there was
similar variability in rainfall rates within the runs as between them, no attempt was made to
correct for rainfall rate. As soon as runoff began, which ranged from 3 minutes (soil) to 23
minutes (mulch) after rainfall was started, an initial sample of approximately 500 ml (16.9 oz) of
runoff was collected. Additional samples were then collected at 5-minute intervals until a total
time of 60 minutes had elapsed. An analysis of the data revealed that almost all the plots
appeared to reach steady-state conditions during this period as the runoff rates were fairly
constant near the end of the sampling period.
The runoff rate at 5-minute intervals during the simulation was plotted and the total
runoff amount was calculated by summing the area under the runoff curve. In addition, each
bottle was oven dried at 105°C until constant weight was achieved to determine the total solids
content and total amount of solids lost from the plot. Volatile solids (VS), total solids (TS), total
phosphorus (TP), ortho-phosphorus (PO4), total nitrogen (TN), nitrate-nitrogen (NO3-N), and
ammonium-nitrogen (NH4-N) were analyzed for the first flush sample and at the end of the run
(steady-state sample). The TS and VS were measured using methods 2540 B Total Solids
Dried at 103-105° C and method 2540 Fixed and Volatile Solids Ignited at 550° C (USEPA,
1983). Nitrate-nitrogen and total nitrogen were measured using EPA standard method 353.2
(colorimetric, automated, cadmium reduction), ammonium-nitrogen using EPA standard method
350.1 (colorimetric, automated phenate), and phosphorus using EPA standard method 365.1
(colorimetric, automated, ascorbic acid) (USEPA, 1983). A persulfate digest for water (Qualls,
1989) was used as a pretreatment for determination of total nitrogen and phosphorus. Total

38
nutrient loads were estimated by averaging the concentrations of the first flush and steady state
and multiplying by the runoff volume.
SAS version 8.2 (SAS, 2001) was used for the statistical analyses. Analysis of variance
(PROC ANOVA) using Duncan’s Multiple Range test for significant differences with unequal cell
sizes was used to determine any significant differences between the treatments (p≤0.05).
Correlation analysis (PROC CORR) was used to determine which of the physical and chemical
treatment parameters were correlated to the measured runoff, total solids, and nutrient
concentrations and loads.
Results and Discussion
Table 1.5. Mean Runoff, Solids and Nutrient Loss Data.
Treatment Runoff Volume
(L)
Total
Solids
Loss (g)
TN Load
(mg)
NO3 -N Load
(mg)
NH4-N Load
(mg)
TP Load
(mg)
PO4 Load
(mg)
PLC1 74 ab 552 bc 4128 bc 2343 bc 138 b 10046 b 7588 b
PLC2 44 bcd 208 cd 1272 cd 751 c 45 b 1589 b 1253 c
PL 83 a 1221 a 1327 cd 14 c 6573 a 30266 a 23755 a
MSC 47 bcd 236 cd 645 d 410 c 194 b 294 b 242 c
BSC 53 abcd 154 d 8113 a 6301 a 241 b 2693 b 2217 c
FWC 37 cd 139 d 628 d 840 c 33 b 219 b 213 c
YWC 63 abcd 111 d 744 d 321 c 57 b 199 b 170 c
WMf 35 d 102 d 64 d 6 c 15 b 28 b 23 c
WMm 48 abcd 144 d 97 d 20 c 7 b 32 b 16 c
WM2 66 abcd 74 d 434 d 32 c 94 b 357 b 304 c
Soil 71 abc 646 b 150 d 42 c 20 b 52 b 57 c
* Treatments with the same letter are not significantly different at p≤0.05.

39
There was significant variability in the runoff volume and total solids loss between the
treatments (Table 1.5). The poultry litter treatment had a runoff volume that was significantly
higher than three of the composts (MSC, FWC, PLC2) and one of the mulches (WMf). This was
probably due to the fact that the poultry litter appeared to be somewhat hydrophobic. At the end
of the rainfall simulation, it was noted that the wetting front had not advanced through the layer
of poultry litter. The poultry litter at the upper end of these plots was still dry after one hour of
intense rainfall. None of the other treatments exhibited this and most appeared totally
saturated. Although not significantly different, the composted poultry litters had less runoff and
behaved more like the other treatments. The composting process appeared to reduce the
hydrophobic properties of the poultry litter. The fine and medium mulches had the lowest runoff
volumes. Although not significantly correlated to particle size distribution, mulches had the most
storage volume (pore space) and took the longest to generate runoff due to the higher infiltration
rate. The second wood mulch treatment (WM2) did not display these lower runoff rates. This
may be due to the fact that this mulch contained post consumer wood waste, more hardwood
that appeared to absorb less water and had a higher initial moisture content.
Compared to the bare soil, most of the compost and mulch treatments had less runoff
and total solids loss (Figure 1.2). This indicates that almost all of the treatments were effective
in reducing erosion.
There were very few differences in runoff among the compost treatments. In fact, these
treatments only varied from 55% to 102% of the runoff observed on the bare soil treatment and
overall there was only an average of 20% less runoff on the treated plots than the bare soil
control. The point at which runoff began and the time to reach a semi steady-state condition
appeared to vary from treatment to treatment but the steady-state rates were similar. Under
these test conditions, the rainfall rate was much greater than the infiltration rate of the soil layer
beneath the treatment. Therefore, excess water would pond on the soil surface in the cover
treatment until it reached the lip of the flume and began to run off.

40
0.000.501.001.502.002.50
PLC1
PLC2 PL
MSCBSC
FWCYW
CWMf
WMm
WM2Soil
Loss
Rel
ativ
e to
Con
trol
Total Runoff Volume (L) Total Solids Lost (g)
Figure 1.2. Total Runoff Volume and Total Solids Loss Relative to that from the Bare Soil
Control.
Near the end of the simulation, when most of the cover treatment was saturated, all of
the treatments with the exception of the poultry litter and mulches had similar runoff rates, but
the differences were not significant. The runoff rates only varied from 17 to 26 ml/s (0.6 oz to
0.9 oz/s) and this could probably be attributed to differences in the rainfall rates and plot
preparation. Under field conditions where the treatments are given time to influence vegetation
and soil properties or with lower rainfall rates, greater differences in runoff rates and volumes
would be expected.
The sediment loss data exhibited more differences between treatments. The total solids
concentration over time was highly variable. In general, the first flush of runoff, when runoff
rates were lower, had higher total solids concentrations, which generally decreased over time in
an erratic manner. Due to the high variability between measurements, total solids lost, which
aggregates the data, is probably a better indicator of performance than the first flush or steady-
state concentration. Total solids loss for the poultry litter treatment was significantly higher than
any other treatment. Total solids loss on the bare soil was significantly higher than all but one of
the compost treatments (PLC1). Generally, the mulch treatments had the lowest total solids
loss although these were not statistically different than many of the compost treatments. During
41
the simulation, the poultry litter treatment and the bare soil control were the only treatments that
displayed rill formation indicating erosion by flow stresses rather than just raindrop impact and
sheet flow. By protecting the soil surface, all of the treatments, except the aged poultry litter,
visually appeared to reduce or eliminate the impacts of concentrated flow and rill erosion.
Table 1.5 shows the nutrient loss data for each treatment. The biosolids compost had
significantly higher total nitrogen and nitrate losses than any other treatment, even though the
poultry litter had higher total nitrogen and nitrate contents in the initial analysis of materials. The
poultry litter had significantly higher ammonium losses than any other treatment even though
many other treatments had higher ammonium contents in the initial analysis. This indicates that
the nutrients in some of the compost treatments were more available to runoff than equivalent
concentrations in other treatments. The mulch and bare soil treatments generally had lower
total nitrogen, nitrate, and ammonium losses; however, these were often not statistically
significant. The phosphorus losses were significantly higher for the poultry litter treatment. Even
though this was the only statistically significant difference, many of the compost treatments had
phosphorus losses one or two orders of magnitude greater than the bare soil or mulch
treatments. The high nutrient levels may be due to the fact that this simulation was conducted
under worst case conditions including first flush following application with little opportunity for
available nutrients to move into the soil, no vegetation, and very intense prolonged rainfall.
Nevertheless, this does indicate that the environmental impacts of nutrient losses from these
treatments must be weighed against the environmental benefits of reduced runoff and soil
erosion. Future work should investigate the changes in nutrient losses over time from each of
these treatments.
All of the physical and chemical characteristics in Tables 1.2, 1.3 and 1.4 were
correlated against all measured outputs in Table 1.5, but only those that were highly correlated
(r>0.70, p≤0.05) are reported (Table 1.6). None of the independent variables measured were
well correlated with total runoff volumes. Total solids loss was correlated with the respiration

42
rate, nitrate-nitrogen, soluble salt, potassium and sodium contents of the treatment. Treatments
with lower respiration rates and nitrate concentrations tended to show a reduction in the loss of
total solids. The bare soil and poultry litter had the highest respiration rates (respiration rate is
measured per gram of volatile solids and the bare soil had a very low amount of volatile solids
and higher respiration rate) and the highest loss of total solids. Likewise, nitrate-nitrogen
content, respiration rates, soluble salt, sodium, potassium, and total nitrogen contents were
good indicators of ammonium and phosphorus losses. The fact that respiration rate was
correlated to the total solids loss may be an indication that the biological processes involved in
the composting process do influence the ability of the materials to resist detachment and
movement. This was especially evident in the poultry litter composts, where those that had
lower respiration rates showed reduced solids loss. This relationship warrants further research,
as it could be an important component for standards involving compost use in storm water
management applications. Soil erosion studies have indicated that particle size has a
significant impact on erodibility (Foster et al, 1985, Wischmeier and Smith, 1978); however, the
aggregate size analysis in this study was not well correlated to the erosion observed.
Table 1.6. Results from Correlation Analysis. All variables were tested against the
complete list of parameters in Tables 1.2, 1.3 and 1.4. This table lists all the variables
with significant correlation (r>0.70) or the most highly correlated variable.
Independent Variable Variable with Significant Correlation (Correlation Coefficient)*
Total runoff volume Res. (0.59)
Total solids loss Res. (0.92), NO3-N (0.83), SS (0.78), K (0.78), Na (0.72)
Total N loss P (0.45)
Nitrate-N loss P (0.33)
Ammonium N loss NO3-N (0.96), Res. (0.92), SS (0.88), K (0.88), Na (0.72), Total N (0.72)
Total P loss NO3-N (0.96), SS (0.91), K (0.89), Res. (0.88), Na (0.79), P (0.79), Total
N (0.72), Mg (0.72)

43
PO4 loss NO3-N (0.96), SS (0.91), K (0.89), Res. (0.88), Na (0.80), P (0.79), Total
N (0.72), Mg (0.71)
*SS= Soluble Salts, Res.= Respiration rate, BD= Bulk density
Summary and Conclusions
All of the treatments tested, except for the poultry litter treatment, were effective at reducing
total solids lost compared to a bare soil under these simulated conditions. The poultry litter
treatment had significantly more runoff than did the mulch treatments. The poultry litter
treatment also lost significantly more total solids than any other treatments. The bare soil lost
significantly less total solids than the poultry litter treatment, but significantly more than all of the
other treatments except for one of the poultry litter composts. In all cases, composted poultry
litter treatments had less runoff, erosion, and nutrient loss than did aged poultry litter. The
mulch treatments had lower total solids loss and less runoff than most of the composts;
however, these differences were often not statistically significant. Losses of nutrients tended to
be higher for the poultry litter and biosolids compost treatments. Total nitrogen loads were
significantly higher for the biosolids compost treatment and two of the poultry litter composts
were significantly higher than the other treatments. Total phosphorus losses were significantly
higher for the poultry litter. Treatments with lower respiration rates, nitrate-nitrogen, soluble salt,
potassium, and sodium concentrations tended to have less erosion and transport of solids.
Nitrate-nitrogen content, respiration rates, soluble salt, sodium, potassium, and total nitrogen
contents were good indicators of ammonium and phosphorus losses. Further work is needed to
better quantify the relationships between the physical and chemical properties of the treatments
and the runoff, erosion, and nutrient losses. The goal of a soil cover should be to provide short-
term protection with little environmental impact while vegetation is being established.
Ultimately, the vegetation establishment is an equally important goal and the nutrients in the
compost treatments should aid in this process. Further work is ongoing to investigate similar

44
compost and mulch materials to determine which are effective at establishing and maintaining
long-term vegetative cover and soil quality. Ultimately, the results from both studies should be
combined to develop decision aids in the selection of compost and mulch materials for erosion
control.
Acknowledgements
The authors would like to express their appreciation to the U.S. Poultry and Egg Research
Foundation and the various compost and mulch producers who contributed funding and/or
materials for this study.
References Cited
Adams, J.E. 1966. Influence of mulches on runoff, erosion, and soil moisture depletion. Soil
Science Society of America Proceedings 30:110-114.
Agassi, M., A. Hadas, Y. Benyamini, G.J. Levy, L. Kautsky, L. Avrahamov, and H. Zhevelev.
1998. Mulching effects of composted MSW on water percolation and compost degradation rate. Compost
Science and Utilization 6(3):34-41.
Alexander, R. 1996. Field guide to compost use. The Composting Council, Alexandria, VA.
Demars, K., R. Long, and J. Ives. 2000. Use of wood waste materials for erosion control.
Technical Report prepared for The New England Transportation Consortium, April, 2000.
NETCR 20. Project # 97-3, The University of Connecticut, Storrs, CT.
Ermine, D.C., and F.K. Ligon. 1988. Effects of discharge fluctuation and the addition of fine
sediment on stream fish and macroinvertebrates below a water filtration facility. Environmental Management
12(1):85-97.
Foster, G.R., R.A. Young, M.J.M. Romkens, and C.A. Onstad. 1985. Processes of soil erosion
by water. In: Follet, R.F. and B.A. Stewart (eds.). Soil Erosion and Crop Productivity. American Society of
Agronomy, Crop Science Society of America, and Soil Science Society of America. Madison, WI. Pp.137-
162.
Glanville, T.D., R.A. Persyn and T.L. Richard. 2001. Impacts of compost application on

45
highway construction sites. American Society Agricultural Engineers Meeting Paper No. 01-012076. St.
Joseph, MI: American Society Agricultural Engineers .
Giddens, J. and A.P. Barnett. 1980. Soil loss and microbiological quality of runoff from land
treated with poultry litter. Journal of Environmental Quality 9(3):518-520.
Gilley, J.E. and L.M. Risse. 2001. Runoff and soil loss as affected by the application of
manure. Transactions of the American Society Agricultural Engineers 43(6):1583-1588.
Jordan, C.F. 1998. Working with nature: resource management for sustainability.
Harwood Academic Publishers, Netherlands.
Kramer, L.A. and L.D. Meyer. 1969. Small amounts of surface mulch reduce soil erosion and
runoff velocity. Transactions of the American Society Agricultural Engineers 12:638-641.
Laflen, J.M., J.L. Baker, R.O. Hartwig, W.A. Buchele, and H.P. Johnson. 1978. Soil and water
losses from conservation tillage systems. Transactions of the American Society Agricultural Engineers
21:881-885.
Meyer, L.D., C.B. Johnson, and G.R. Foster. 1972. Stone and wood chip mulches for erosion
control on construction sites. Journal Soil Water Conservation, 27:264-269.
Mitchell, D. 1997. Compost utilization by departments of transportation in the United States.
Florida Department of Transportation Report. Tallahassee, Florida.
Qualls, R.G. 1989. Determination of total nitrogen and phosphorus in water using persulfate
oxidation: a modification for small sample volumes. Appendix A pp. 131-138. In: The biogeochemical
properties of dissolved organic matter in a hardwood forest ecosystem: their influence on the retention of
nitrogen, phosphorus, and carbon. Ph.D. dissertation, University of Georgia Institute of Ecology, Athens,
Georgia, University Microfilms, Inc., no. DEX9003448.
SAS, 2001. SAS OnlineDoc®, Version 8.2. The SAS Institute Inc. Cary, North Carolina.
Storey, B.B., J.A. McFalls, and S.H. Godfrey. 1996. The use of compost and shredded brush
on rights-of -way for erosion control: final report no. 1352-2F. Texas Transportation Institute. Austin, Texas.
University of Georgia, 2004. Agriculture and environmental services laboratory methods.
http://aesl.ces.uga.edu/publications/methods/index.html, date accessed, 2-16-2004.
USCC, 1997. Test methods for the examination of composting and compost, first edition. The
United States Composting Council, Amherst, Ohio.
US Department of Commerce, National Weather Service. 1961. Technical paper #40 of the National Weather
Service. www.erh.noaa.gov/er/hq/Tp40s.htm, date accessed, 2-16-2004.
46
USEPA, 1983. Methods for chemical analysis of water and wastes, EPA-600/4 4-79-020.
United States Environmental Protection Agency, Cincinnati, Ohio.
USEPA, 1993. 40 CFR Part 503 – Standards for use and disposal of sewage sludge: final rule
federal register 58:9248-9415.
USEPA, 1997. Innovative uses of compost – erosion control, turf remediation, and
landscaping. EPA530-F-97-043. United States Environmental Protection Agency, Washington, DC.
USEPA. 2003. www.cfpub.epa.gov/npdes/ - Permit, storm water, construction activities,
phase 1 & phase II, faqs, publications, regulations. Date accessed. 2-16-2004.
Vleeschauwer, D.D., R. Lal, and M.D. Boodt. 1978. The comparative effects of surface
applications of organic mulch versus chemical soil conditioners on physical and chemical properties of the
soil and on plant growth. Catena 5:337-349.
Westerman, P.W., T.L. Donnelly, and M.R. Overcash. 1983. Erosion of soil and poultry
manure- a laboratory study. Transactions of the American Society Agricultural Engineers 26(5):1070-1078.
Wischmeier, W.H., and D.D Smith. 1978. Predicting rainfall-erosion losses: a guide to conservation planning. US
Department of Agriculture, Agricultural Handbook No. 537, Washington, DC.

47
CHAPTER 3
EVALUATION OF ENVIRONMENTAL BENEFITS AND IMPACTS OF
COMPOST AND INDUSTRY STANDARD EROSION AND SEDIMENT
CONTROL MEASURES USED IN CONSTRUCTION ACTIVITIES
In response to public concern regarding potential groundwater pollution potential and
reduction in landfill capacity the Georgia General Assembly established a statewide waste
reduction goal of 25% to be achieved by 1996, enabled through the 1992 Georgia Solid Waste
Management Act. Nearly 70% of Georgia's Municipal Solid Waste is organic material and could
be composted if source separated (US EPA, 1999). Georgia leads the nation in poultry
production, generating approximately 1.36 metric tons (1.5 million tons) of poultry litter
annually (Faucette, 2001) in addition to over 1.81 million metric tons (2 million tons) per year of
food processing waste (Magbunua, 2000), 2.26 million metric tons (2.5 million tons) per year of
wood waste (Benson, 2000), and almost 362,000 metric tons (400,000 tons) per year of
municipal biosolids (Governo, 2000). By diverting organic materials from landfills we reduce
potential ground water pollution from landfill leachate, reduce the amount of methane released to
the atmosphere, reduce the need to expand existing landfills and construct new ones, and
potentially improve soil quality by replacing organic matter and recycling nutrients to our highly
depleted soils. Therefore, it is important to divert these materials from landfills by developing
off-site uses and markets for these materials.
The US EPA has declared that sediment contamination of our surface waters is the
biggest threat to our nation’s water resources. Soil erosion is considered the biggest contributor
48
to nonpoint source pollution in the United States according to the federally mandated National
Pollution Discharge Elimination System (US EPA, 1997). Soil loss rates from construction sites
can be 10-20 times that of agricultural lands (US EPA, 2000). For example, forestlands lose an
average of 0.36 metric tons/ha (1 ton/acre) per year; agriculture loses an average of 5.5 metric
tons/ha (15 tons/acre) per year while construction sites average 73.3 metric tons/ha (200
tons/acre) per year (GA SWCC, 2002). In 2003, the federally mandated NPDES Phase II went
into effect extending the storm water management plan requirement to any land-disturbing
activity over 0.4 ha (1 acre). The new regulations label development zones as “point sources”
requiring better erosion control practices, new permitting programs, increased monitoring, and
more site inspections by state and local officials.
The use of surface applied organic amendments has been shown to reduce runoff and
erosion (Adams, 1966; Meyer et al., 1972; Laflen et al., 1978, Vleeschauwer et al., 1978, Foster
et al., 1985). In forested landscapes, surface layers of organic matter reduce the energy of
raindrop impact and allow water to percolate into the soil, reducing surface runoff and erosion
(Jordan, 1998). Because of better soil contact and reduced susceptibility to movement from wind
or water, wood mulches are superior to hay and straw mats (Holmberg, 1983; Lyle, 1987).
Shredded bark and straw mulches will intercept and dissipate the energy of raindrops and prevent
soil surface crusting; they also break up overland flow of runoff and hold more water at the soil
surface allowing more water to infiltrate the soil (Adams, 1966; Gorman et al., 2000).
In the last ten years compost has been used successfully for slope stabilization, erosion
and sediment control, storm water filtration, and vegetative establishment applications. Compost
used for erosion control in a French vineyard reduced soil loss by two orders of magnitude
(Ballif and Herre, 1988). In Portland, Oregon yard waste composts used for erosion control in
49
residential construction projects exhibited reduced erosion and improved water quality over
conventional erosion and sediment control measures (Portland Metro, 1994). Ettlin and Stewart
(1993) found that slopes up to 42% could effectively use yard waste compost for slope
stabilization and erosion control. Compost applications at four-inch depths will effectively
control erosion on 45% slopes up to 3 years (Michaud, 1995). A study conducted by the
Connecticut Department of Transportation found composts and mulches reduced soil erosion
ten-fold compared to bare soil surfaces on a 2:1 slope (Demars and Long, 1998). Furthermore,
Demars and Long (1998) report that when compared to silt fences, compost is 99% more
effective in keeping sediment out of nearby surface waters, and 38% more effective than
hydroseeding. For a more exhaustive literature review see Chapter 1.
MATERIALS AND METHODS
Epstein (1997) and Storey et al. (1995) define compost as a relatively stable decomposed
organic material resulting from the accelerated biological degradation of organic material under
controlled, aerobic conditions. Storey et al. (1995) adds that it is the disinfected and stabilized
product of the decomposition process that is used or sold for use as a soil amendment, artificial
topsoil, or growing medium amendment.
Seven treatments were randomly assigned and applied to 1 m by 4.8 m cleared and 10%
graded field test plots: a biosolids compost blanket with compost filter berm; a yardwaste
compost blanket with compost filter berm; a municipal solid waste compost (MSW) and mulch
blanket with mulch filter berm; a poultry litter compost, mulch and gypsum blanket and mulch
filter berm; hydroseed and silt fence; hydroseed and mulch filter berm; and a bare soil (control)
plot. Table 2.1 shows the layout of the test plots. Compost blankets were manually applied at
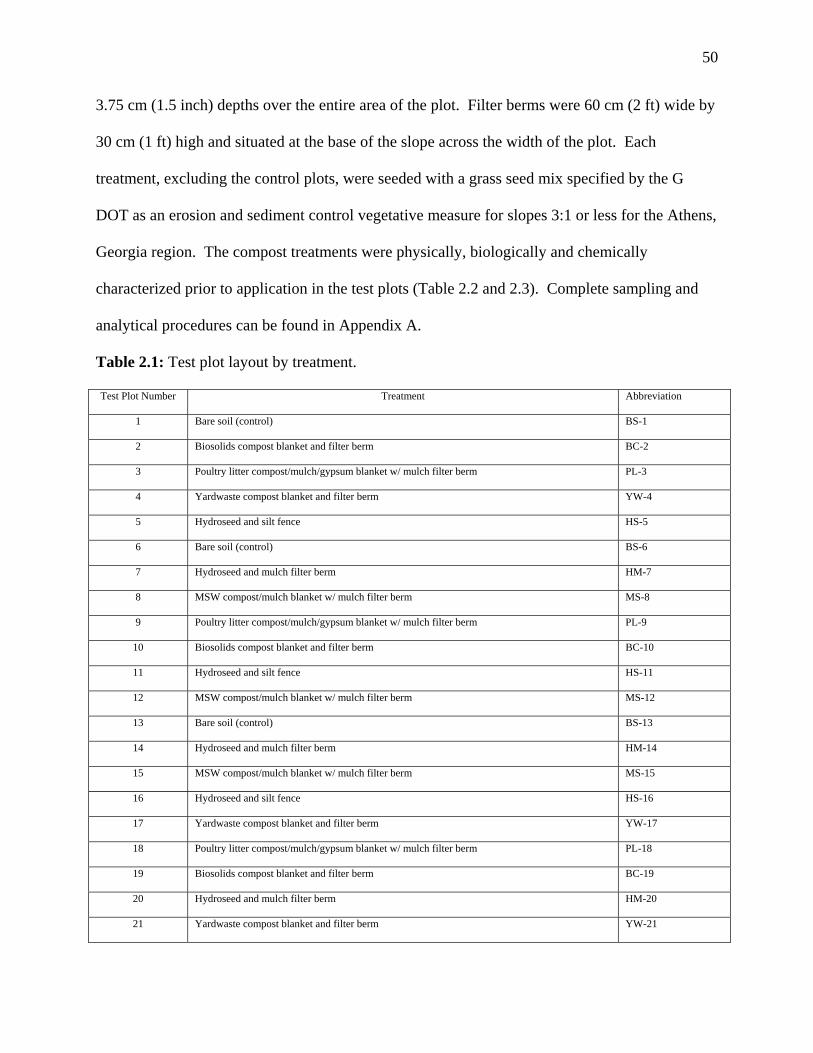
50
3.75 cm (1.5 inch) depths over the entire area of the plot. Filter berms were 60 cm (2 ft) wide by
30 cm (1 ft) high and situated at the base of the slope across the width of the plot. Each
treatment, excluding the control plots, were seeded with a grass seed mix specified by the G
DOT as an erosion and sediment control vegetative measure for slopes 3:1 or less for the Athens,
Georgia region. The compost treatments were physically, biologically and chemically
characterized prior to application in the test plots (Table 2.2 and 2.3). Complete sampling and
analytical procedures can be found in Appendix A.
Table 2.1: Test plot layout by treatment.
Test Plot Number Treatment Abbreviation
1 Bare soil (control) BS-1
2 Biosolids compost blanket and filter berm BC-2
3 Poultry litter compost/mulch/gypsum blanket w/ mulch filter berm PL-3
4 Yardwaste compost blanket and filter berm YW-4
5 Hydroseed and silt fence HS-5
6 Bare soil (control) BS-6
7 Hydroseed and mulch filter berm HM-7
8 MSW compost/mulch blanket w/ mulch filter berm MS-8
9 Poultry litter compost/mulch/gypsum blanket w/ mulch filter berm PL-9
10 Biosolids compost blanket and filter berm BC-10
11 Hydroseed and silt fence HS-11
12 MSW compost/mulch blanket w/ mulch filter berm MS-12
13 Bare soil (control) BS-13
14 Hydroseed and mulch filter berm HM-14
15 MSW compost/mulch blanket w/ mulch filter berm MS-15
16 Hydroseed and silt fence HS-16
17 Yardwaste compost blanket and filter berm YW-17
18 Poultry litter compost/mulch/gypsum blanket w/ mulch filter berm PL-18
19 Biosolids compost blanket and filter berm BC-19
20 Hydroseed and mulch filter berm HM-20
21 Yardwaste compost blanket and filter berm YW-21

51
Table 2.2: Physical, chemical and biological characterization of treatments.
Treatment Bulk Density (g/cm3) Bulk Density (lbs/yd3) % Inerts Stability - 02 uptake (mg
O2/g VM Hr-1) Germination Index (%) Biosolids compost 0.51 1292.5 < 1% 0.02 96 Yard waste compost 0.5 1122.9 < 1% 0.09 100 Poultry litter compost w/ mulch & gypsum 0.59 1316.8 < 1% 0.06 100 MSW compost w/ mulch 0.32 743.2 < 1% 0.1 100 Mulch (fines & medium grade) 0.18 670.5 < 1% 0.05 86 Soil 2.23 3,758.8 < 1% nd nd Treatment Water (%) pH SS (mS/cm) OM g kg-1 (550 C) C:N C N NH4 NO3 P Biosolids compost 31.3 7 1.62 202 17 100900 5830 2480 1960 4470 Yard waste compost 40.66 7.8 0.645 193 19 97500 5010 40 70 3240 Poultry litter compost w/ mulch & gypsum 32.2 7.2 5.93 212 22 131500 5980 70 240 4290 MSW compost w/ mulch 45.7 8.1 4.96 360 20 175200 8660 140 180 1910 Mulch (fines & medium grade) 32.4 7.2 0.544 497 101 268900 2670 180 100 960 Soil Nd 4.7 Nd Nd 18 250 14 0.74 0.053 348
Treatment Al B Ca Cr Cu Fe K Mg Mn Mo Na Ni Pb S Si Zn Biosolids compost 9480 8 3046 12.56 46.7 6780 1794 755.8 108.7 1.74 124.1 6.5 < 2.5 1393 190.8 117.1Yard waste compost 11600 11.8 8147 11.96 < 0.5 11360 3241 1976 374.8 < 0.5 177.9 7.31 < 2.5 805.8 215.4 65.82Poultry litter compost w/ mulch & gypsum 9000 19.3 16610 6.76 10.95 5191 4292 1215 88.75 < 0.5 180.8 2.59 < 2.5 9463 132.6 45.59MSW compost w/ mulch 11690 32.5 1443 22.72 74.89 11260 2465 1332 213.4 1.33 2944 17.64 78.93 2118 170.1 248.3Mulch (fines & medium grade) 8558 4.14 1713 5.9 < 0.5 5418 963.4 540.7 125.2 < 0.5 137.7 3.18 < 2.5 189 253.1 20.22Soil nd nd 173 nd Nd Nd 130 23 15 50 nd nd nd nd nd 0.17 All nutrients and metals expressed in mg kg-1.

52
Table 2.3: Particle size characterization of treatments.
Sieve Size Unit MSWC % PLC % Mulch % YWC % BSC % 25 mm 0 100 4.9 99.5 2.4 99.3 0 100 0 100
16 1.1 99.8 6.2 98.8 17.1 94.6 2.7 99.6 0 100 9.5 38.9 91.6 17 97.0 37.1 84.4 16.1 97.2 14.6 98.1
6.3 34.5 84.4 36.8 93.0 61.6 67.4 41.8 91.0 134.3 80.7 4 35.4 77.0 53.4 87.2 64.1 49.7 65 81.4 166.6 59.1 3.35 19.8 72.9 23.4 84.7 23.8 43.1 27.5 77.3 46.3 53.1 2.36 46.3 63.2 47.2 79.6 35.5 33.3 54.6 69.2 68.9 44.1 2 31.9 56.5 31 76.2 36.1 23.4 34.3 64.1 27.5 40.6 1.4 61.9 43.6 71.9 68.4 18.4 18.3 84.2 51.6 51.1 33.9
1.18 27.6 37.8 35.3 64.6 5.6 16.7 19.5 48.7 24.3 30.8 1 34.5 30.6 41.9 60.1 9.3 14.2 34.6 43.6 28 27.1
850 µm 19.8 26.4 23.5 57.6 1.9 13.6 20 40.6 17.5 24.9 710 32 19.7 50.5 52.1 11.5 10.5 44.7 34.0 37.8 20.0
600 16.1 16.4 46.1 47.1 3.6 9.5 34 29.0 27.4 16.4 500 13.2 13.6 49.1 41.8 4.8 8.1 33.1 24.1 25.6 13.1
250 40.2 5.2 228.3 17.1 19.1 2.9 112.3 7.4 78.5 2.9 125 19.4 1.2 120.2 4.1 8.2 0.6 40.6 1.4 20.9 0.2
Pan 5.5 0 38.1 0 2.2 0 9.3 0 1.5 0 Total (g) 478.1 924.8 362.3 674.3 770.8
Research test plots were at Spring Valley Farm in Athens/Clarke County, Georgia, USA
at 33° 57’ N latitude and 83° 19’ W longitude. Today Spring Valley Farm is a research and
education site for Agroecological and Agroforestry production practices. Prior to this the farm
was used extensively for pasture and intensive cotton production for over 100 years. These
practices have left the research site area devoid of topsoil, and low in soil fertility and overall soil
quality. The research site was surrounded by open and unmanaged pasture with scrub
vegetation. The soil was originally classified as an eroded Pacolet Sandy Clay Loam (USDA,
1968) and has a high soil erodibility factor (K value) of approximately 0.36 (Wischmeier and
Smith, 1978). The area receives an average annual rainfall of 1214.7 mm, with January through
March as the wettest period. The average annual high temperature for the area is 22° C, the
average low is 11°C, with a mean annual temperature of 17°C (Weather Channel, 2004).

53
The land was cleared of vegetation and topsoil to simulate a construction site soil surface.
A 10% grade was applied to the exposed subsoil (Bt horizon). Test plot borders were installed to
prevent cross contamination of plots. Fifteen cm (6 in) stainless steel was used to avoid potential
metal contamination in the runoff. The borders were trenched 7.5 cm (3 in) into the soil. Seven
and a half centimeters of the border extended above ground. The plots were sized to fit the
greatest effective rainfall distribution from the rainfall simulator. Preliminary tests showed this
to be 1.0 m (3.3 ft) wide by 4.8 m (16 ft) long, for an effective area of 4.8 m2 (53 ft2). A
removable flume was installed at the base of each plot prior to each simulated rainfall event.
Nine rain gauges were installed in each plot to measure rainfall quantity. Three each were
placed 1.2 m (4 ft), 2.4 m (8 ft) and 3.6 m (12 ft) from the top of the plot. Gauges were also
spaced evenly across the width of the plot.
The rainfall erosion index (R value), a value used to account for the erosive effects of
storms using rainfall intensity and total rainfall data, is relatively high for this region of the
United States, between 250 and 300, making it highly susceptible to soil erosion (USDA, 1995).
A rainfall simulator was calibrated to produce a 7.75 cm (3.1 in) per hour storm event for one-
hour duration. This is equivalent to the one-hour storm event for a 50-year return for the Athens,
Georgia region, based on historical rainfall records (US Department of Commerce, 1961). It was
our intention to evaluate these treatments under a “worst-case” scenario, because most erosion
occurs during these large events.
A Norton Rainfall Simulator with 4 variable speed V-jet oscillating nozzles was used to
simulate storm events. Water pressure to the nozzles was maintained at 0.42 kg/cm2 (6 psi)
during rain events. A 7569 liter (2000 gal) tanker truck was used to supply and pump water to
54
the rainfall simulator. Municipal tap water was used in the study. The water was monitored and
tested for NO3-N (0.673 mg L-1) and P04-P (0.093 mg L-1) contents prior to use in the study.
Three simulated rainstorms were conducted; at the beginning of the experiment, at 3
months and one year. These time intervals were chosen based on the predicted establishment of
the vegetation. The first storm event was intended to provide information on the performance of
the treatments prior to vegetation establishment. The second storm event was intended to
provide information on how the performance of the treatments changed when vegetation was
newly established. The final storm event was to provide information on how the treatments
reacted once vegetation was fully established. A stainless steel border was inserted at the base of
each plot between storm events to maintain the structure and integrity of the plot.
The week prior to the first simulated storm event the research site received no natural
rainfall, while 31 mm (1.22 in) of rain fell on the plots during the week of the simulated storm
events. During the three months between the second and third storm event the site only received
90.7 mm (3.57 in) of natural rainfall, with only 16.8 mm (0.66 in) falling in the third month.
These extremely dry conditions likely affected vegetation growth. The week prior to the second
storm the research site received no natural rainfall, while during the weeklong simulated storm
trials the site received 6.9 mm (0.27 in) of natural rain. The week before the final storm event
the research site received 102.4 mm (4.03 in) of natural rain and 35.8 mm (1.41 in) during the
week of storm simulations. This led to saturated field conditions during the final simulated
storm event.
Two vegetative growth analyses were conducted; at three months (as vegetation was
establishing) and one year (vegetation mature). Three soil analyses were conducted; at the

55
beginning of the experiment, at 6 months and 18 months. Complete sampling and analytical
procedures can be found in Appendix B.
Analyses for storm water included: rainfall amount, antecedent soil water, time until start
of runoff, time until steady state of runoff, runoff volume, runoff rate, rainfall infiltration, rainfall
infiltration to runoff ratio, total sediment loads, sediment loss ratios, total N concentration and
load, NO3-N concentration and load, NH4-N concentration and load, total P concentration and
load, dissolved reactive P concentration and load, and total P load to dissolved reactive P load
ratios. Vegetation analysis included: percent cover at three months and twelve months; number
of weed species and weed plants at three months and number of weed species and percent cover
of weeds at twelve months; and Bermuda grass, weed and total biomass at twelve months. Soil
analysis included: bulk density, water infiltration rate, extractable organic carbon, total C, total
N, C:N ratio, total P, plant available P, K, Ca, Mg, Zn, pH, and organic matter at 0 to 5 cm and 0
to 15 cm depths. Complete sampling and analytical procedures can be found in Appendix B.
SAS version 8.2 (SAS, 2001) was used for statistical analysis. Analysis of variance
(PROC ANOVA) used Duncan’s Multiple Range test for significant differences between cells
was used to determine any significant differences between treatments (p≤0.05). Correlation
analysis (PROC CORR) was used to determine which of the independent variables, including:
physical, chemical, and biological treatment parameters (as expressed in tables 2.2, 2.3, and 2.4),
and all reported vegetation and rainfall characteristics were correlated to the response variables,
including: all results from vegetation, runoff, solids loss, nutrient loss, and soil quality
parameters. For more detail on the materials and methods see Appendix B.
A survey was conducted in Georgia in 2001 to determine which compost operations
could potentially enter the erosion and sediment control market and what they would charge for

56
installation of compost blankets (per yd2) and filter berms (per linear ft). Price was based on a
3.75 cm (1.5 in) deep compost blanket and 0.3 m high by 0.6 m wide (1 ft by 2 ft) compost filter
berm. Prices are compared to industry standard measures and are presented as the total installed
price (material cost + installation cost). All information was collected by telephone survey
and/or site visits.
RESULTS AND DISCUSSION
Vegetative Growth
Based on this study and under these environmental conditions, compost did better than
hydroseeding and bare soil at providing a quick vegetative cover (Table 2.4). However, in the
long term hydroseeding may be a better option. The caveat was that the better long term
performance of the hydroseeding was due to the invasion of weeds, not the intended vegetation
(Table 2.5). From a practical standpoint to control erosion this was a good result, but from an
industry or commercial standpoint this may be undesirable. Additionally, this may provide
evidence that some composts can suppress the growth of weeds. It should also be noted that
wherever vegetation has not been established by hydroseeding, soil erosion will continue to
occur and potentially get worse over time; unlike compost which still covers the soil surface in
areas where vegetation may not have established. Composts with high germination rates, total
nitrogen, total phosphorus, and potassium concentrations lead to a quicker vegetative cover
(Table 2.6). Additionally, plenty of rainfall or moisture may be required. High nutrient,
biologically stable, mature composts that get plenty of rainfall will provide the best and quickest
cover. However, composts with high ammonium nitrogen, high nitrate nitrogen, and low C:N

57
ratios appear to create greater weed growth, in number of species, number of plants, and
biomass.
For erosion control professionals deciding on which measure to use for vegetation
establishment, compost provides a quicker vegetative cover with less weed growth – particularly
under conditions of heavy rainfall and drought (as experienced in this study), while hydroseeding
(utilizing Bermuda grass seed) may require additional applications to provide sufficient and
permanent vegetative cover without weed proliferation. See Appendix B for more results and
discussion.
Table 2.4: Average percent cover by treatment at three months and twelve months, n=3.
Treatment 3 months SD 12 months SD
PLC/Mulch/Gypsum 64a 28 73a 22
Biosolids Compost 57a 6 86a 15
MSW Compost/Mulch 59a 20 72a 16
Yardwaste Compost 62a 19 68a 17
Hydroseed/Mulch Berm 22b 7 86a 2
Hydroseed/Silt Fence 22b 16 81a 20
Bare Soil (not seeded) 17b 14 24b 15
Treatments with same letter are not significantly different at α = 0.05 using Duncan’s Multiple Multiple Range test.
Table 2.5: Average biomass of Bermuda grass, weed, and total vegetation in g/m2 (10.8 ft2) and
ratio of average Bermuda grass biomass to average weed biomass by treatment at 12 months,
n=3.
Treatment Bermuda SD Weed SD Total SD Bermuda:weed
PLC/Mulch/Gypsum 244a 230.2 80.6bc 25.0 324.6ab 206.3 3.03:1
Biosolids Compost 128.5a 111.4 168.9b 74 297.4ab 173.1 0.76:1
MSW Compost/Mulch 191.5a 256.9 65.1bc 10.7 256.6ab 247.1 2.94:1

58
Yardwaste Compost 148a 139.0 43.2c 13.1 191.2ab 149.5 3.43:1
Hydroseed/Mulch Berm 199.5a 69.8 286a 71.4 485.5a 32.2 0.70:1
Hydroseed/Silt Fence 158.8a 105.7 287a 78.7 445.7a 27.4 0.55:1
Bare Soil (not seeded) 0a 0 76.7bc 63 76.7b 63 0
Treatments with same letter are not significantly different at α = 0.05 using Duncan’s Multiple Range test.
Table 2.6: Results from correlation analysis. This table lists all variables with significant
correlation (r>0.70, α = 0.05, n = 21).
Response Variable Independent Variable (treatment) with Correlation Coefficient
Vegetative cover at 3 months Germination rate (0.71), K (0.71), rainfall amount from 1st storm
(0.70), N (0.69), compost - P (0.68)
# of weed species at 3 months NH4 (0.81), NO3 (0.82), # of weed plants (0.92)
# of weed plants at 3 months NH4 (0.84), NO3 (0.85), # of weed species (0.94)
Weed cover at 12 months Weed biomass at 12 months (0.81), total biomass at 12 months (0.72)
Weed biomass at 12 months C:N ratio (0.78), weed cover at 12 months (0.87), total biomass at 12
months (0.76)
Storm Water Runoff and Solids Loss
MSW compost was the best tool at reducing runoff volume in the short and long term. It
also appeared that hydroseeding was not very effective at reducing runoff compared to a bare
soil, while compost was effective (Table 2.7). Additionally, compost reduced runoff more over
time than hydroseeding or a bare soil. Support for this is evident in the amount of rainfall that
infiltrated each treatment, again the composts outperformed hydroseeding, and the MSW
compost did particularly well. All of the treatments allowed for better infiltration than the
control. Based on the time it takes for runoff to commence, compost may be a better tool to
prevent runoff from occurring during small storm events (Table 2.8). The MSW compost was

59
particularly effective in this area. Based on correlation analysis, general characteristics of high
quality compost such as a high biological stability rating, high germination rate, and a neutral pH
are good indicators that there will be greater infiltration and less runoff (Table 2.9). This is
likely since these characteristics lead to good vegetation establishment, which in turn can lead to
greater infiltration and less runoff. Additional parameters that provide good vegetative growth,
such low bulk density, adequate N, P, and K and to some extent the particle size distribution of
the compost, are important to increasing infiltration and reducing runoff. This provides
compelling evidence that compost may be well suited for a variety of storm water management
applications, particularly where it can eliminate runoff, thus preventing most erosion from ever
occurring. For erosion control professionals deciding on which measure to use for managing
storm water and reducing runoff, compost is a better tool than hydroseeding for increasing
infiltration and reducing storm runoff. For more results and discussion see Appendix C.
Table 2.7: Total runoff volume (mm) by treatment at day one, three months, and twelve months,
n=3.
DAY ONE THREE MONTHS TWELVE MONTHS
Treatment AVG SD AVG SD AVG SD
PLC/Mulch/Gypsum 32.0ab 12.7 5.0c 4.9 15.9c 7.0
Biosolids Compost 38.1ab 7.9 9.6c 6.9 21.6bc 17.0
MSW Compost/Mulch 22.5b 13.1 1.8c Nd 21.9bc 2.2
Yardwaste Compost 33.0ab 5.6 8.1c 4.1 25.0abc 7.0
Hydroseed/Mulch Berm 36.7ab 5.8 20.2bc 2.4 34.2ab 9.9
Hydroseed/Silt fence 30.0ab 11.6 32.3ab 28.3 27.6abc 5.1
Bare Soil (not seeded) 42.3a 5.6 45.9a 20.6 40.8a 8.9
Treatments with same letter are not significantly different at α = 0.05 using Duncan’s Multiple Range test.
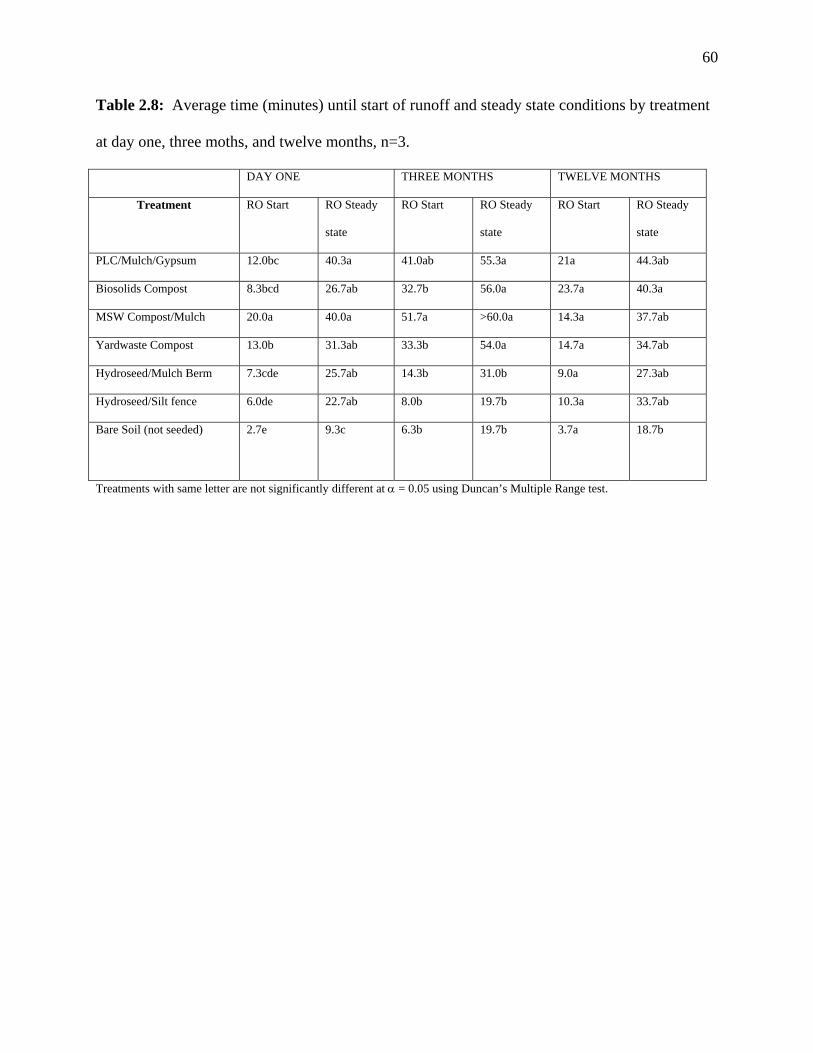
60
Table 2.8: Average time (minutes) until start of runoff and steady state conditions by treatment
at day one, three moths, and twelve months, n=3.
DAY ONE THREE MONTHS TWELVE MONTHS
Treatment RO Start RO Steady
state
RO Start RO Steady
state
RO Start RO Steady
state
PLC/Mulch/Gypsum 12.0bc 40.3a 41.0ab 55.3a 21a 44.3ab
Biosolids Compost 8.3bcd 26.7ab 32.7b 56.0a 23.7a 40.3a
MSW Compost/Mulch 20.0a 40.0a 51.7a >60.0a 14.3a 37.7ab
Yardwaste Compost 13.0b 31.3ab 33.3b 54.0a 14.7a 34.7ab
Hydroseed/Mulch Berm 7.3cde 25.7ab 14.3b 31.0b 9.0a 27.3ab
Hydroseed/Silt fence 6.0de 22.7ab 8.0b 19.7b 10.3a 33.7ab
Bare Soil (not seeded) 2.7e 9.3c 6.3b 19.7b 3.7a 18.7b
Treatments with same letter are not significantly different at α = 0.05 using Duncan’s Multiple Range test.
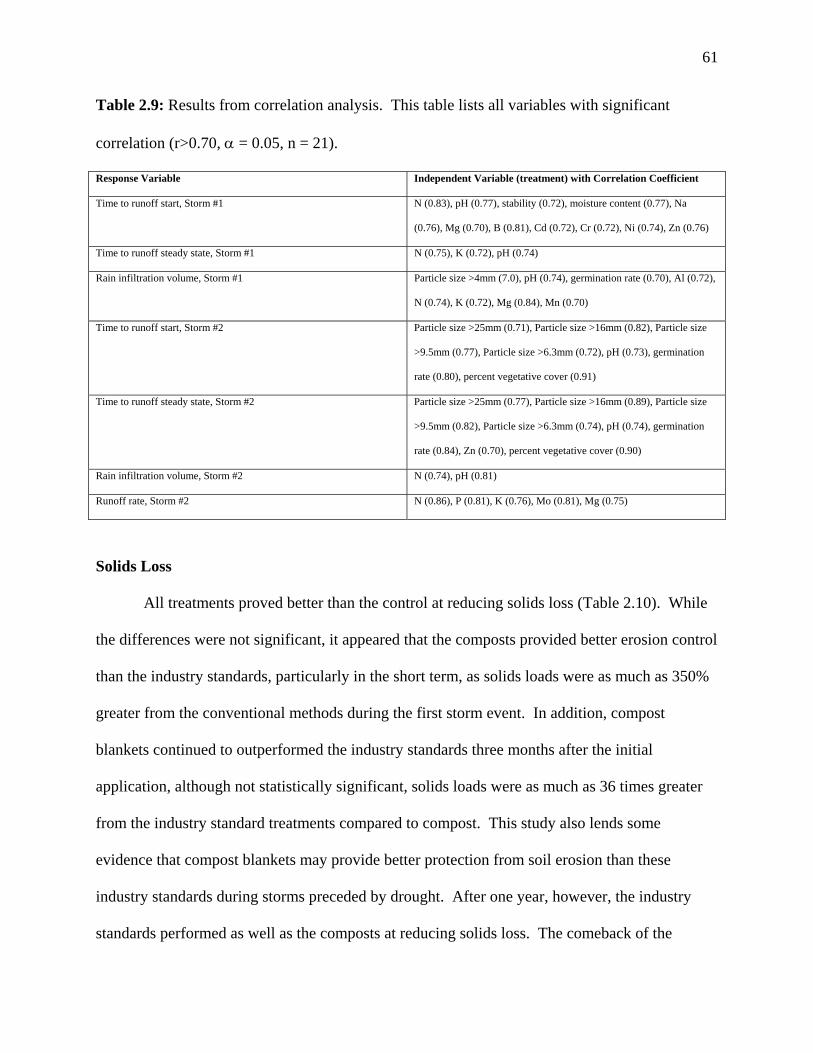
61
Table 2.9: Results from correlation analysis. This table lists all variables with significant
correlation (r>0.70, α = 0.05, n = 21).
Response Variable Independent Variable (treatment) with Correlation Coefficient
Time to runoff start, Storm #1 N (0.83), pH (0.77), stability (0.72), moisture content (0.77), Na
(0.76), Mg (0.70), B (0.81), Cd (0.72), Cr (0.72), Ni (0.74), Zn (0.76)
Time to runoff steady state, Storm #1 N (0.75), K (0.72), pH (0.74)
Rain infiltration volume, Storm #1 Particle size >4mm (7.0), pH (0.74), germination rate (0.70), Al (0.72),
N (0.74), K (0.72), Mg (0.84), Mn (0.70)
Time to runoff start, Storm #2 Particle size >25mm (0.71), Particle size >16mm (0.82), Particle size
>9.5mm (0.77), Particle size >6.3mm (0.72), pH (0.73), germination
rate (0.80), percent vegetative cover (0.91)
Time to runoff steady state, Storm #2 Particle size >25mm (0.77), Particle size >16mm (0.89), Particle size
>9.5mm (0.82), Particle size >6.3mm (0.74), pH (0.74), germination
rate (0.84), Zn (0.70), percent vegetative cover (0.90)
Rain infiltration volume, Storm #2 N (0.74), pH (0.81)
Runoff rate, Storm #2 N (0.86), P (0.81), K (0.76), Mo (0.81), Mg (0.75)
Solids Loss
All treatments proved better than the control at reducing solids loss (Table 2.10). While
the differences were not significant, it appeared that the composts provided better erosion control
than the industry standards, particularly in the short term, as solids loads were as much as 350%
greater from the conventional methods during the first storm event. In addition, compost
blankets continued to outperformed the industry standards three months after the initial
application, although not statistically significant, solids loads were as much as 36 times greater
from the industry standard treatments compared to compost. This study also lends some
evidence that compost blankets may provide better protection from soil erosion than these
industry standards during storms preceded by drought. After one year, however, the industry
standards performed as well as the composts at reducing solids loss. The comeback of the

62
hydroseeded plots, after obvious seed wash during the first storm event, can be partly attributed
to the prolific growth characteristic of the vegetation chosen (Bermuda grass) for this study.
While the compost treatments consistently showed a near 100% reduction (no less than
97%) in solids loss compared to the control, the industry standards maintained solids loss
reductions no less than 95%. In addition, although differences were not statistically significant,
the hydroseed with mulch filter berm consistently yielded less solids loss compared to silt fence
throughout the entire study. Finally, it appears that the bulk density and organic matter content
of compost is correlated to solids loading (Table 2.11). For erosion control professionals
deciding on which measure to use to provide the greatest protection against solids loss, compost
generally outperforms hydroseeding and silt fence – particularly in short term applications, and
mulch filter berms can provide better solids filtration than silt fence. For more results and
discussion see Appendix C.
Table 2.10: Average total solids loads (g/m2) and total solids loss ratio (treatment to control) by
treatment at day one, three months, and twelve months, n=3.
DAY ONE THREE MONTHS TWELVE MONTHS
Treatment AVG SD RATIO AVG SD RATIO AVG SD RATIO
PLC/Mulch/Gypsum 158.9b 91.3 0.025 14.6b 8.3 0.003 10.8b 4.5 0.010
Biosolids Compost 105.8b 13.0 0.016 18.9b 13.2 0.003 8.8b 6.4 0.008
MSW Compost/Mulch 191.9b 107.8 0.030 6.0b nd 0.001 17.8b 6.8 0.016
Yardwaste Compost 88.5b 45.3 0.014 13.7b 6.6 0.002 17.1b 6.2 0.015
Hydroseed/Mulch Berm 265.1b 32.3 0.041 78.1b 21.7 0.014 10.9b 6.1 0.010
Hydroseed/Silt Fence 307.9b 127.8 0.048 219.6b 72.0 0.039 14.5b 6.7 0.013
Bare Soil (not seeded) 6428.1a 2182.7 5464.2a 3290.4 1109.7a 987.7
Treatments with same letter are not significantly different at α = 0.05 using Duncan’s Multiple Range test.

63
Table 2.11: Results from correlation analysis. This table lists all variables with significant
correlation (r>0.70, α = 0.05, n = 21).
Response Variable Independent Variable (treatment) with Correlation Coefficient
Total sediment concentration, Storm #1 Bulk density (0.93)
Total sediment load, Storm #1 Bulk density (0.90), organic matter (0.78)
Total sediment concentration, Storm #2 Bulk density (0.87), organic matter (0.71)
Total sediment load, Storm #2 Bulk density (0.73), organic matter (0.77)
Total sediment concentration, Storm #3 Bulk density (0.76)
Total sediment load, Storm #3 Bulk density (0.75)
Nutrient Loss
Materials high in ammonium N and nitrate N will release greater amounts of each form
of nitrogen in storm runoff, in both concentration and load (Table 2.12 and 2.13). These
materials showed reduced N loss over time, particularly after the first storm event; however, high
N content composts and hydroseeding applications may still have elevated levels of N in the
runoff during the next large storm event. Over time, N losses from composts and hydroseed
treated soils were negligible. Additionally, composts high in ammonium N may be more
susceptible to weed growth. It does not appear that mulch filter berms substantially reduce total
N or nitrate N in runoff from hydroseed applications; however, there may be evidence that mulch
berms can filter ammonium N from storm water runoff. For professionals utilizing compost
blankets it is recommended that composts have a high percentage of organic N content relative to
inorganic N.
Soil application of hydroseeding can lead to high P concentrations and loads in storm
runoff; however, this may only be a concern for the first storm event after application (Table
2.14 and 2.15). Generally, composts pose a much lower risk than hydroseeding, particularly
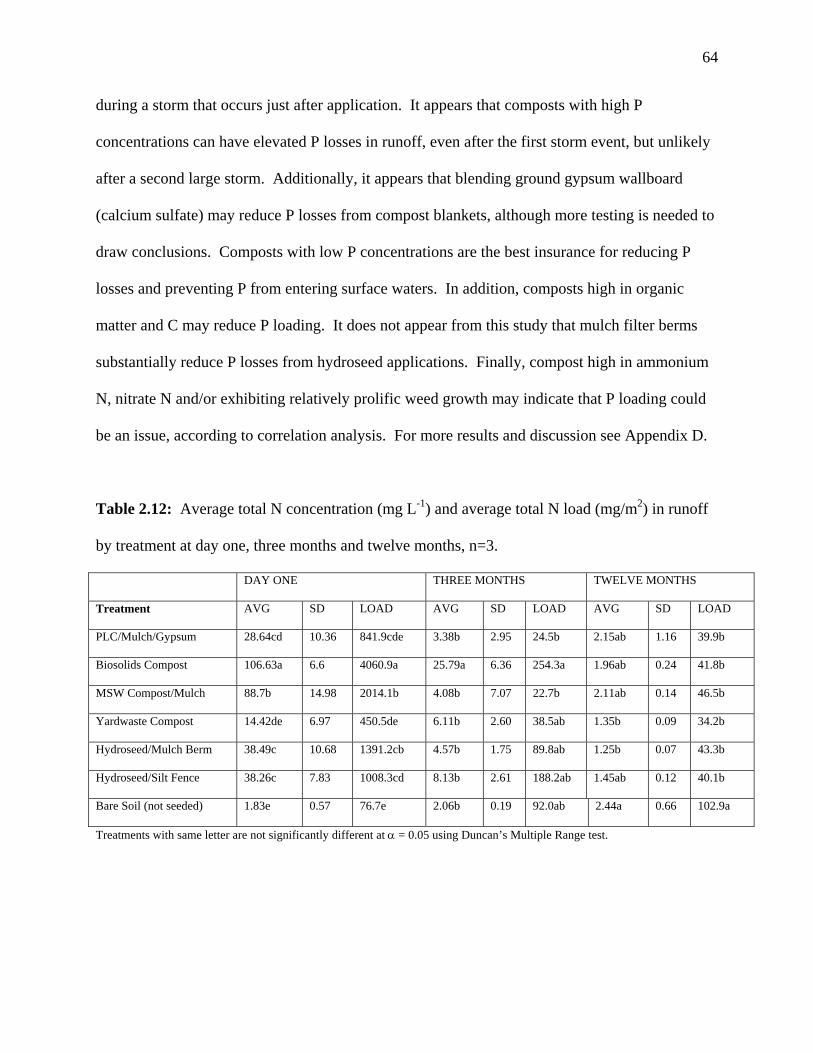
64
during a storm that occurs just after application. It appears that composts with high P
concentrations can have elevated P losses in runoff, even after the first storm event, but unlikely
after a second large storm. Additionally, it appears that blending ground gypsum wallboard
(calcium sulfate) may reduce P losses from compost blankets, although more testing is needed to
draw conclusions. Composts with low P concentrations are the best insurance for reducing P
losses and preventing P from entering surface waters. In addition, composts high in organic
matter and C may reduce P loading. It does not appear from this study that mulch filter berms
substantially reduce P losses from hydroseed applications. Finally, compost high in ammonium
N, nitrate N and/or exhibiting relatively prolific weed growth may indicate that P loading could
be an issue, according to correlation analysis. For more results and discussion see Appendix D.
Table 2.12: Average total N concentration (mg L-1) and average total N load (mg/m2) in runoff
by treatment at day one, three months and twelve months, n=3.
DAY ONE THREE MONTHS TWELVE MONTHS
Treatment AVG SD LOAD AVG SD LOAD AVG SD LOAD
PLC/Mulch/Gypsum 28.64cd 10.36 841.9cde 3.38b 2.95 24.5b 2.15ab 1.16 39.9b
Biosolids Compost 106.63a 6.6 4060.9a 25.79a 6.36 254.3a 1.96ab 0.24 41.8b
MSW Compost/Mulch 88.7b 14.98 2014.1b 4.08b 7.07 22.7b 2.11ab 0.14 46.5b
Yardwaste Compost 14.42de 6.97 450.5de 6.11b 2.60 38.5ab 1.35b 0.09 34.2b
Hydroseed/Mulch Berm 38.49c 10.68 1391.2cb 4.57b 1.75 89.8ab 1.25b 0.07 43.3b
Hydroseed/Silt Fence 38.26c 7.83 1008.3cd 8.13b 2.61 188.2ab 1.45ab 0.12 40.1b
Bare Soil (not seeded) 1.83e 0.57 76.7e 2.06b 0.19 92.0ab 2.44a 0.66 102.9a
Treatments with same letter are not significantly different at α = 0.05 using Duncan’s Multiple Range test.
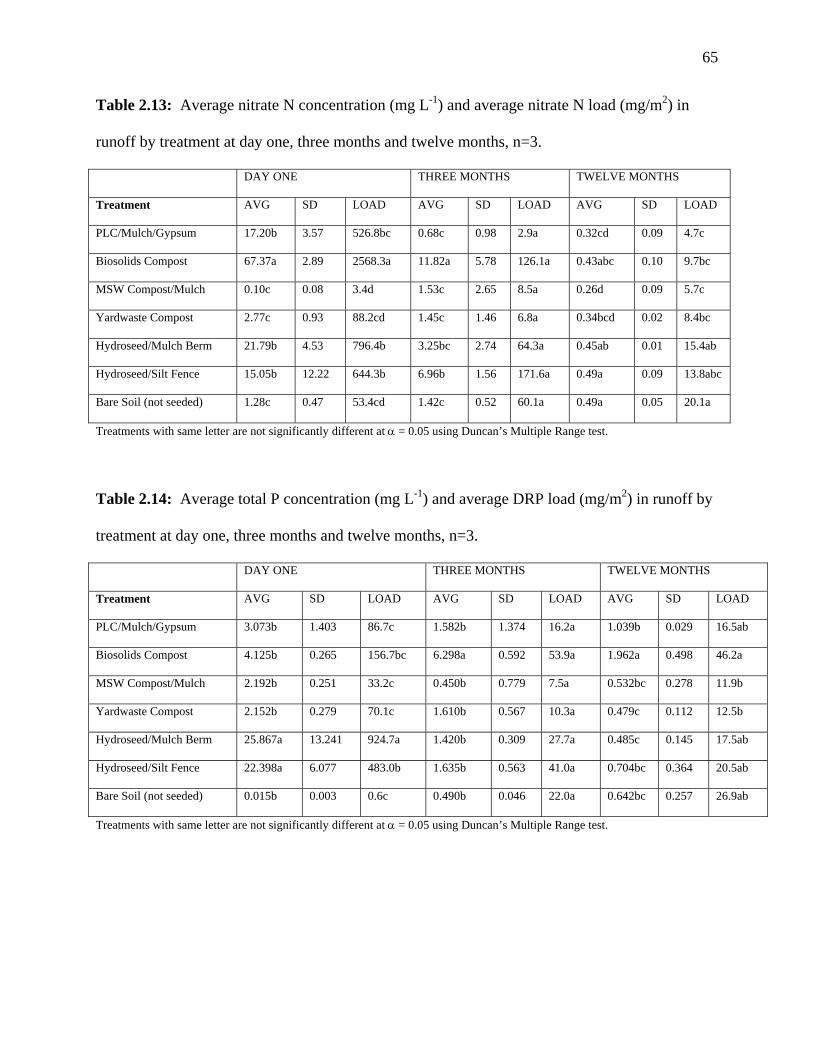
65
Table 2.13: Average nitrate N concentration (mg L-1) and average nitrate N load (mg/m2) in
runoff by treatment at day one, three months and twelve months, n=3.
DAY ONE THREE MONTHS TWELVE MONTHS
Treatment AVG SD LOAD AVG SD LOAD AVG SD LOAD
PLC/Mulch/Gypsum 17.20b 3.57 526.8bc 0.68c 0.98 2.9a 0.32cd 0.09 4.7c
Biosolids Compost 67.37a 2.89 2568.3a 11.82a 5.78 126.1a 0.43abc 0.10 9.7bc
MSW Compost/Mulch 0.10c 0.08 3.4d 1.53c 2.65 8.5a 0.26d 0.09 5.7c
Yardwaste Compost 2.77c 0.93 88.2cd 1.45c 1.46 6.8a 0.34bcd 0.02 8.4bc
Hydroseed/Mulch Berm 21.79b 4.53 796.4b 3.25bc 2.74 64.3a 0.45ab 0.01 15.4ab
Hydroseed/Silt Fence 15.05b 12.22 644.3b 6.96b 1.56 171.6a 0.49a 0.09 13.8abc
Bare Soil (not seeded) 1.28c 0.47 53.4cd 1.42c 0.52 60.1a 0.49a 0.05 20.1a
Treatments with same letter are not significantly different at α = 0.05 using Duncan’s Multiple Range test.
Table 2.14: Average total P concentration (mg L-1) and average DRP load (mg/m2) in runoff by
treatment at day one, three months and twelve months, n=3.
DAY ONE THREE MONTHS TWELVE MONTHS
Treatment AVG SD LOAD AVG SD LOAD AVG SD LOAD
PLC/Mulch/Gypsum 3.073b 1.403 86.7c 1.582b 1.374 16.2a 1.039b 0.029 16.5ab
Biosolids Compost 4.125b 0.265 156.7bc 6.298a 0.592 53.9a 1.962a 0.498 46.2a
MSW Compost/Mulch 2.192b 0.251 33.2c 0.450b 0.779 7.5a 0.532bc 0.278 11.9b
Yardwaste Compost 2.152b 0.279 70.1c 1.610b 0.567 10.3a 0.479c 0.112 12.5b
Hydroseed/Mulch Berm 25.867a 13.241 924.7a 1.420b 0.309 27.7a 0.485c 0.145 17.5ab
Hydroseed/Silt Fence 22.398a 6.077 483.0b 1.635b 0.563 41.0a 0.704bc 0.364 20.5ab
Bare Soil (not seeded) 0.015b 0.003 0.6c 0.490b 0.046 22.0a 0.642bc 0.257 26.9ab
Treatments with same letter are not significantly different at α = 0.05 using Duncan’s Multiple Range test.
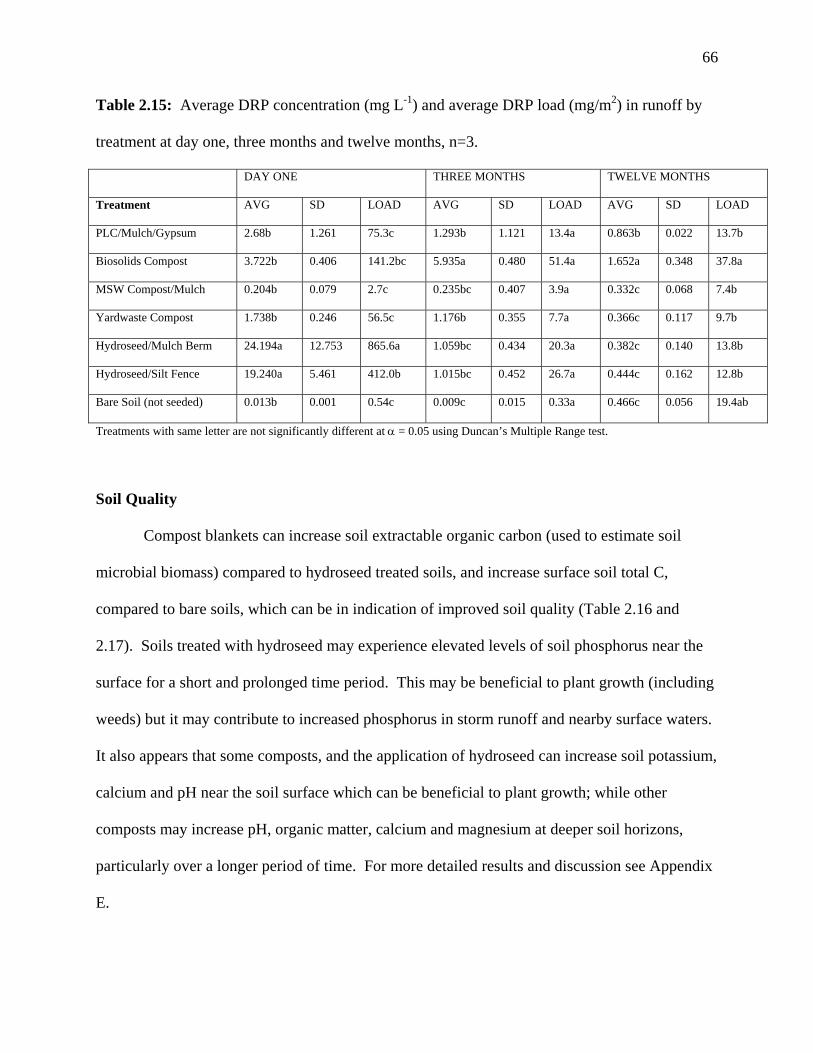
66
Table 2.15: Average DRP concentration (mg L-1) and average DRP load (mg/m2) in runoff by
treatment at day one, three months and twelve months, n=3.
DAY ONE THREE MONTHS TWELVE MONTHS
Treatment AVG SD LOAD AVG SD LOAD AVG SD LOAD
PLC/Mulch/Gypsum 2.68b 1.261 75.3c 1.293b 1.121 13.4a 0.863b 0.022 13.7b
Biosolids Compost 3.722b 0.406 141.2bc 5.935a 0.480 51.4a 1.652a 0.348 37.8a
MSW Compost/Mulch 0.204b 0.079 2.7c 0.235bc 0.407 3.9a 0.332c 0.068 7.4b
Yardwaste Compost 1.738b 0.246 56.5c 1.176b 0.355 7.7a 0.366c 0.117 9.7b
Hydroseed/Mulch Berm 24.194a 12.753 865.6a 1.059bc 0.434 20.3a 0.382c 0.140 13.8b
Hydroseed/Silt Fence 19.240a 5.461 412.0b 1.015bc 0.452 26.7a 0.444c 0.162 12.8b
Bare Soil (not seeded) 0.013b 0.001 0.54c 0.009c 0.015 0.33a 0.466c 0.056 19.4ab
Treatments with same letter are not significantly different at α = 0.05 using Duncan’s Multiple Range test.
Soil Quality
Compost blankets can increase soil extractable organic carbon (used to estimate soil
microbial biomass) compared to hydroseed treated soils, and increase surface soil total C,
compared to bare soils, which can be in indication of improved soil quality (Table 2.16 and
2.17). Soils treated with hydroseed may experience elevated levels of soil phosphorus near the
surface for a short and prolonged time period. This may be beneficial to plant growth (including
weeds) but it may contribute to increased phosphorus in storm runoff and nearby surface waters.
It also appears that some composts, and the application of hydroseed can increase soil potassium,
calcium and pH near the soil surface which can be beneficial to plant growth; while other
composts may increase pH, organic matter, calcium and magnesium at deeper soil horizons,
particularly over a longer period of time. For more detailed results and discussion see Appendix
E.

67
Table 2.16: Average soil extractable organic carbon (mg kg-1) from by treatment at six months
and eighteen months, n=3.
SIX MONTHS EIGHTEEN MONTHS ONE YR CHANGE
Treatment AVG SD AVG SD AVG
PLC/Mulch/Gypsum 19.09a 17.08 57.4b 16.96 38.31bc
Biosolids Compost 18.46a 12.32 58.88b 0.37 40.42ab
MSW Compost/Mulch 32.71a 8.09 93.95a 13.46 61.24a
Yardwaste Compost 27.02a 12.33 41.2b 9.4 14.18d
Hydroseed/Mulch Berm 30.74a 15.99 58.74b 24.63 28.0bcd
Hydroseed/Mulch Berm 30.74a 15.99 58.74b 24.63 28.0bcd
Hydroseed/Silt Fence 28.36a 14.69 48.34b 11.44 19.98bcd
Bare Soil (not seeded) 33.74a 22.38 50.78b 12.8 17.04cd
Treatments with same letter are not significantly different at α = 0.05 using Duncan’s Multiple Range test.

68
Table 2.17: Selected soil chemical characteristics from 0-5 cm (0-2 in) by treatment at day one, six months and eighteen months, n=3.
DAY ONE SIX MONTHS EIGHTEEN MONTHS 1.5 YR CHANGE
Characteristic Total C
(mg kg-1)
Total N
(mg kg-1)
C:N Ratio Total C
(mg kg-1)
Total N
(mg kg-1)
C:N Ratio Total C
(mg kg-1)
Total N
(mg kg-1)
C:N Ratio Total C
(mg kg-1)
Treatment Avg SD Avg SD Avg SD Avg SD Avg SD Avg SD Avg SD Avg SD Avg SD Avg
PLC/Mulch/Gypsum 5833 3900 593 331 9.34 3.16 8250 3748 585 177 13.77ab 2.2 14270 12830 670 680 25.89 10.1 8437a
Biosolids Compost 5543 3711 476 205 10.31 4.37 7667 4219 553 298 13.83ab 0.56 7380 4490 370 180 18.84 3.82 1837ab
MSW
Compost/Mulch
7143 2467 627 319 11.99 2.38 9367 1762 583 127 16.1a 0.68 9580 1210 480 130 20.58 2.92 2437ab
Yardwaste Compost 3503 3679 353 181 8.22 4.96 7033 3350 470 286 15.7ab 1.9 7480 2206 290 180 30.58 12.0 3977ab
Hydroseed/Mulch
Berm
5023 3705 400 175 11.2 4.87 4800 400 367 116 12.59ab 2.36 8050 2110 310 130 27.44 5.81 3027ab
Hydroseed/Silt
Fence
7347 3709 560 275 12.84 0.90 6033 560 490 150 11.79b 3.26 8500 3170 400 220 22.99 4.91 1153ab
Bare Soil (not
seeded)
7350 1247 526 101 14.04 0.64 6367 526 393 140 16.2a 2.52 5950 1160 260 28 24.95 0.88 -1400b
Treatments with same letter are not significantly different at α = 0.05 using Duncan’s Multiple Range test.
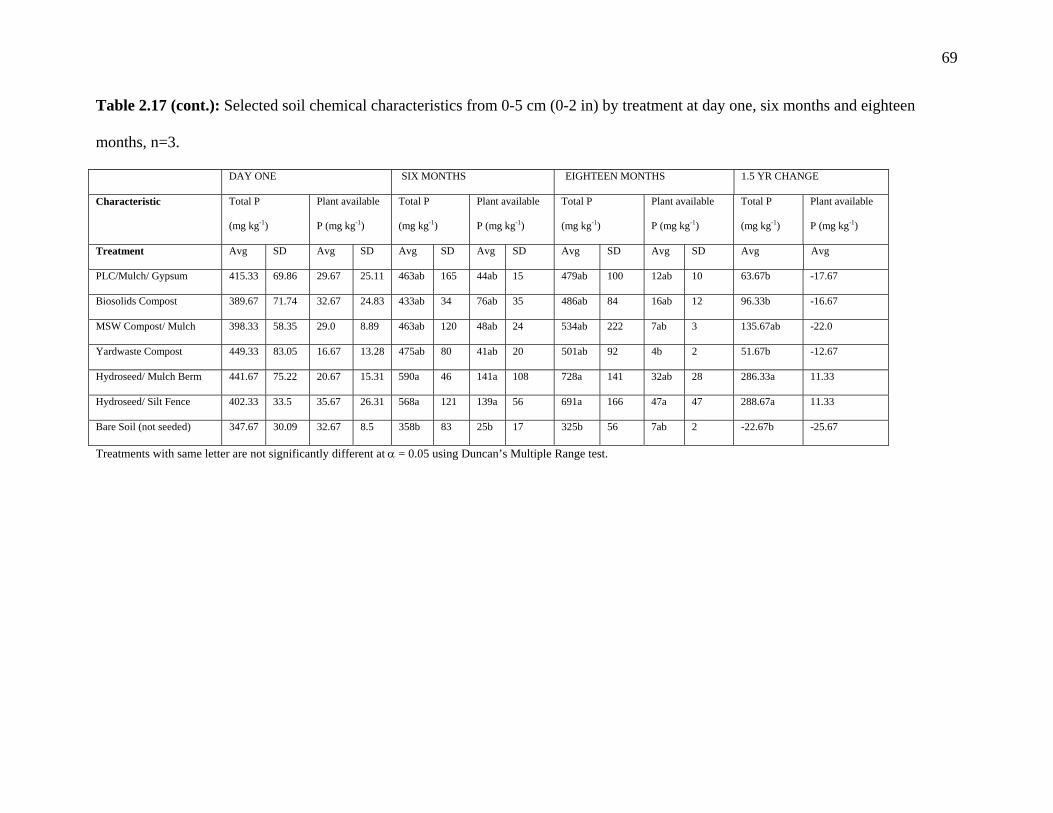
69
Table 2.17 (cont.): Selected soil chemical characteristics from 0-5 cm (0-2 in) by treatment at day one, six months and eighteen
months, n=3.
DAY ONE SIX MONTHS EIGHTEEN MONTHS 1.5 YR CHANGE
Characteristic Total P
(mg kg-1)
Plant available
P (mg kg-1)
Total P
(mg kg-1)
Plant available
P (mg kg-1)
Total P
(mg kg-1)
Plant available
P (mg kg-1)
Total P
(mg kg-1)
Plant available
P (mg kg-1)
Treatment Avg SD Avg SD Avg SD Avg SD Avg SD Avg SD Avg Avg
PLC/Mulch/ Gypsum 415.33 69.86 29.67 25.11 463ab 165 44ab 15 479ab 100 12ab 10 63.67b -17.67
Biosolids Compost 389.67 71.74 32.67 24.83 433ab 34 76ab 35 486ab 84 16ab 12 96.33b -16.67
MSW Compost/ Mulch 398.33 58.35 29.0 8.89 463ab 120 48ab 24 534ab 222 7ab 3 135.67ab -22.0
Yardwaste Compost 449.33 83.05 16.67 13.28 475ab 80 41ab 20 501ab 92 4b 2 51.67b -12.67
Hydroseed/ Mulch Berm 441.67 75.22 20.67 15.31 590a 46 141a 108 728a 141 32ab 28 286.33a 11.33
Hydroseed/ Silt Fence 402.33 33.5 35.67 26.31 568a 121 139a 56 691a 166 47a 47 288.67a 11.33
Bare Soil (not seeded) 347.67 30.09 32.67 8.5 358b 83 25b 17 325b 56 7ab 2 -22.67b -25.67
Treatments with same letter are not significantly different at α = 0.05 using Duncan’s Multiple Range test.
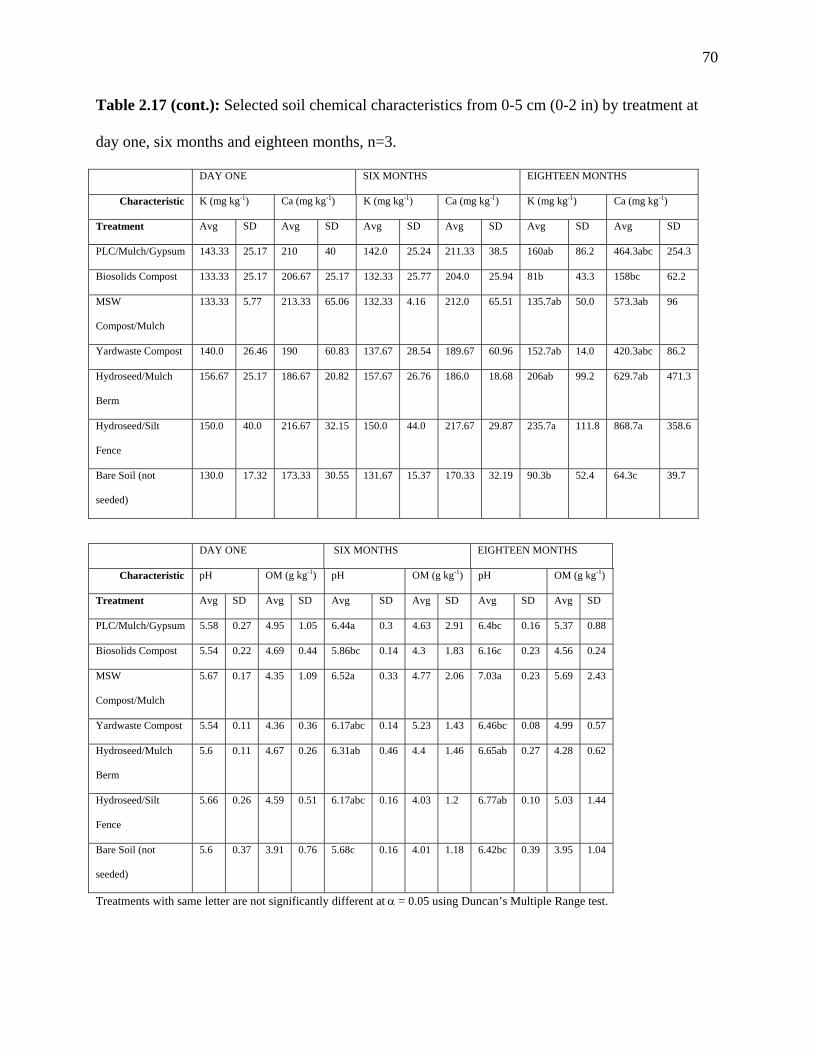
70
Table 2.17 (cont.): Selected soil chemical characteristics from 0-5 cm (0-2 in) by treatment at
day one, six months and eighteen months, n=3.
DAY ONE SIX MONTHS EIGHTEEN MONTHS
Characteristic pH OM (g kg-1) pH OM (g kg-1) pH OM (g kg-1)
Treatment Avg SD Avg SD Avg SD Avg SD Avg SD Avg SD
PLC/Mulch/Gypsum 5.58 0.27 4.95 1.05 6.44a 0.3 4.63 2.91 6.4bc 0.16 5.37 0.88
Biosolids Compost 5.54 0.22 4.69 0.44 5.86bc 0.14 4.3 1.83 6.16c 0.23 4.56 0.24
MSW
Compost/Mulch
5.67 0.17 4.35 1.09 6.52a 0.33 4.77 2.06 7.03a 0.23 5.69 2.43
Yardwaste Compost 5.54 0.11 4.36 0.36 6.17abc 0.14 5.23 1.43 6.46bc 0.08 4.99 0.57
Hydroseed/Mulch
Berm
5.6 0.11 4.67 0.26 6.31ab 0.46 4.4 1.46 6.65ab 0.27 4.28 0.62
Hydroseed/Silt
Fence
5.66 0.26 4.59 0.51 6.17abc 0.16 4.03 1.2 6.77ab 0.10 5.03 1.44
Bare Soil (not
seeded)
5.6 0.37 3.91 0.76 5.68c 0.16 4.01 1.18 6.42bc 0.39 3.95 1.04
Treatments with same letter are not significantly different at α = 0.05 using Duncan’s Multiple Range test.
DAY ONE SIX MONTHS EIGHTEEN MONTHS
Characteristic K (mg kg-1) Ca (mg kg-1) K (mg kg-1) Ca (mg kg-1) K (mg kg-1) Ca (mg kg-1)
Treatment Avg SD Avg SD Avg SD Avg SD Avg SD Avg SD
PLC/Mulch/Gypsum 143.33 25.17 210 40 142.0 25.24 211.33 38.5 160ab 86.2 464.3abc 254.3
Biosolids Compost 133.33 25.17 206.67 25.17 132.33 25.77 204.0 25.94 81b 43.3 158bc 62.2
MSW
Compost/Mulch
133.33 5.77 213.33 65.06 132.33 4.16 212.0 65.51 135.7ab 50.0 573.3ab 96
Yardwaste Compost 140.0 26.46 190 60.83 137.67 28.54 189.67 60.96 152.7ab 14.0 420.3abc 86.2
Hydroseed/Mulch
Berm
156.67 25.17 186.67 20.82 157.67 26.76 186.0 18.68 206ab 99.2 629.7ab 471.3
Hydroseed/Silt
Fence
150.0 40.0 216.67 32.15 150.0 44.0 217.67 29.87 235.7a 111.8 868.7a 358.6
Bare Soil (not
seeded)
130.0 17.32 173.33 30.55 131.67 15.37 170.33 32.19 90.3b 52.4 64.3c 39.7
71
Results from Infrastructure and Market Survey in Georgia
Currently, five composting operations in Georgia have used their products in erosion and
sediment control applications at nearly 15 demonstration sites. Four companies have established
themselves as compost applicators for erosion and sediment control. Three county government
agencies in Metro Atlanta have requested demonstration sites to be set-up in their county. The
Georgia Department of Transportation has approved the use of compost for erosion and sediment
control and is currently developing appropriate specifications. The American Association of
State Highway Transportation Officials has approved specifications that can be adopted by all
fifty state DOTs. The Georgia Soil and Water Conservation Commission is considering
including compost in its next edition of Erosion and Sediment Control in Georgia.
A market survey of Georgia’s 38 composting facilities found 11 could potentially enter
the erosion control market. Compost blankets ranged from $0.69/m2 to $3.63/m2 ($0.83/yd2 to
$4.32/yd2). Filter berms ranged from $0.23 to $0.61/linear meter ($0.74 to $2.00/linear ft).
Hydroseed is the least expensive erosion control method costing $0.38/m2 ($0.45/yd2) while rip-
rap is the most expensive at $9.61/m2 ($31.50/yd2). The most comparative methods, straw mats
and geotextile blankets, cost slightly more than compost blankets. The filter berms were cost
competitive with class A silt fences and less expensive than class C silt fences, which are
specified more often. In addition, silt fences have an associated maintenance, removal, and
disposal cost, creating a life cycle cost that could be more than double a compost filter berm.
While compost blankets are more expensive than hydroseed, hydroseeding often requires more
than one application to achieve the minimum 70% cover required by the G DOT. For more
information on market infrastructure and educational outreach see Appendix F.

72
SUMMARY AND CONCLUSIONS
It is inappropriate to conclude which treatment works best because every situation in the
field is different, and specific characteristics of a particular compost or an industry standard
method may fit with a specific challenge in the field. However, there were evident trends from
the results that cannot be ignored. First, stable and mature composts will consistently provide
the best results for each of the parameters examined in this study, additionally, it is important to
follow approved specifications and in some cases these specifications may be improved –
although that is not in the scope of this study.
In very broad terms, mature composts that meet specifications provide better vegetative
growth, less runoff, less solids loss from erosion, less nutrient loss and increased soil quality.
Phosphorus loading from hydroseed should be a major concern to erosion control and water
quality specialists, while compost as well as hydroseed with high mineral N should be used with
caution and are not recommended for use near surface water. Conversely, compost with low
total N and P and/or high organic N and P contents should pose little threat to water quality.
Finally, it may be worthwhile to reexamine existing compost specifications based on these
results, particularly regarding nutrient content and their potential loss in runoff.
FUTURE RECOMMENDATIONS
Developing an expansive market infrastructure through continual research, demonstration
projects, product and application specifications, and supporting product certification are the
cornerstones to a successful and sustainable composting industry seeking to recycle ever more
organic waste. The following is a list of recommendations for the sustainable development of
compost in erosion and sediment control applications and markets:
73
1. Research. As a relatively new technology there is a tremendous amount of research that
can be done in this area. Here are a few ideas: how close to surface water can compost
blankets be applied; what is the optimum particle size ratio for filter berms to filter
sediment from storm water; is compost effective in areas on concentrated water flow;
what is the optimum particle size ratio and lowest possible nutrient content of a compost
blanket that can still provide a rapidly established and permanent vegetative cover; how
steep of a grade can compost blankets be applied to; and will the addition of a tackifier
significantly increase the physical stability of a compost blanket on a steep slope.
2. Demonstration sites. There is no better training and educational tool than to see how it
works in the field. Strategically located demonstration sites can expose a large audience
and significant stakeholders to this emerging technology.
3. Education. Educational and technical assistance through workshops, trainings,
conferences, multi-media and personnel communication to architects, engineers,
regulators, inspectors and other related professionals and stakeholders is essential to the
widespread adoption of this material.
4. Development and Adoption of Specifications. During the short time period this study
was conducted the development and adoption of specifications for this application has
grown significantly. The Georgia Department of Transportation has developed and
adopted new specifications (with assistance from this project), the Georgia Soil and
Water Conservation Commission is considering following suit. The American

74
Association of State Highway Transportation Officials, supported by the Federal
Highway Administration, has adopted specifications (with assistance from this project)
that have been sent to the DOTs of the fifty states. The continued adoption of these
specifications throughout state and federal agencies that deal with erosion and sediment
control is essential.
5. Marketing. Compost operators need to be aggressive in marketing their material to this
market. This may include hiring a marketing specialist and/or sales personnel,
researching and making bids for erosion control jobs with the DOT, meeting with
building architects who specify which erosion control measures will be employed on a
particular project, and leading/participating in education and outreach activities.
6. Being Competitive. This application normally requires very large volumes of material
per project with compost that can be blended with less expensive mulch or “overs”
materials. With this in mind compost operators can charge less for their compost relative
to other markets. If composters do not reduce their cost, on a cubic yard or tonnage basis,
to a level that is competitive with industry standard measures, it will likely never be
adopted on a large scale. If composters can demonstrate that their product is less
expensive than standard measures, the financial rewards could be overwhelming. In
addition, small operations may enter partnerships to fulfill the quantity demanded for
large storm water projects.

75
7. Quality Products. Providing consistent, high quality compost that meets specification is
essential to the growth of this application. One or two bad applications or failures can
devastate the adoption of this technology. Most specifications include quality standards
as insurance to all parties and the industry a whole.
8. Establishment of Storm Water Utilities. Storm water utilities that charge counties or
municipalities based on the quantity of impervious surface under their jurisdiction could
lead to a greater awareness and demand for the use of compost in storm water
applications.
9. Polluter Pays Program. Erosion Control enforcement agencies could charge violators
based on the turbidity unit increase to the ambient upstream flow of a designated surface
water. This may help push the adoption of more effective best management practices
(BMPs), including compost.
10. Erosion and Sediment Control (E&SC) Plan Fee Waiver. The EPD could offer reduced
fees or no fee waivers to contractors or submitters of E&SC and storm water management
plans that specify recycled materials in their plans, which helps the state achieve another
goal – 25% waste reduction.
11. Evaluation of Current E&SC BMPs. Many industry and field specialists feel that some
currently approved BMPs do not perform well in erosion and sedimentation applications.
Quantitative research that comparatively evaluates currently approved BMPs may show

76
the ineffectiveness of many of these measures, particularly once compared to one
another.
77
REFERENCES CITED
Adams, J.E. 1966. Influence of mulches on runoff, erosion, and soil moisture depletion.
Soil Science Society of America Proceedings 30:110-114.
Ballif, J.L., C. Herre. 1988. Research on the runoff of soil vineyard in Champagne area.
Effects of municipal compost mulching. Comptes Rendus de Academie Agriculture de
France. p. 105-110.
Benson, L. 2000. Quantification, characterization and marketing of wood wastes in
Georgia. University of Georgia. Engineering Outreach Report. September, 2000.
Demars, K.R., R.P. Long. 1998. Field evaluation of source separated compost and
Coneg model procurement specifications for Connecticut DOT projects. University of
Connecticut and Connecticut Department of Transportation. December, 1998. JHR 98-
264.
Epstein, E. 1997. The Science of Composting. Technomic Publishing Co., Inc.,
Lancaster, PA. 487 pages.
Ettlin, L., B. Stewart. 1993. Yard debris compost for erosion control. BioCycle: Journal
of Composting and Organics Recycling. JG Press. Emmaus, PA. 34:12. p.46-47.
Faucette, B. 2001. Georgia builds poultry litter composting infrastructure. BioCycle:
Journal Composting and Organics Recycling. JG Press. Emmaus, PA. August, 2001. p.
23-26.
Foster, G.R., R.A. Young, M.J.M. Romkens, and C.A. Onstad. 1985. Processes of soil
erosion by water. In: Follet, R.F. and B.A. Stewart. Soil Erosion and Crop Productivity.
ASA, CSSA and SSSA, Madison, WI. Pp. 137-162.
Georgia Soil and Water Conservation Commission. 2002. Erosion and Sediment Control
78
Course Manual. Georgia Soil and Water Conservation Commission.
Gorman, J.M., J.C. Sencindiver, D.J. Horvath, R.N. Singh, and R.F. Keefer. 2000.
Erodibility of fly ash used as a topsoil substitute in mineland reclamation. Journal of
Environmental Quality. 29:805-811.
Governo, J. 2000. Characterization and quantification of Georgia’s municipal
biosolids production and disposal. University of Georgia. Engineering Outreach Report
June 2000.
Holmberg, G.V. 1983. Landuse, soils, and revegetation. p. 279-350. In L.V.A. Sendlein.
Surface mining environmental monitoring and reclamation handbook. Elsevier Science
Publishers, New York, NY.
Jordan, C.F. 1998. Working with Nature: Resource management for sustainability.
Harwood Academic Publishers, Netherlands.
Laflen, J.M., J.L. Baker, R.O. Hartwig, W.A. Buchele, and H.P. Johnson. 1978. Soil and
water loss from conservation tillage systems. Trans. ASAE, 21:881-885.
Lyle, E.S. 1987. Surface mine reclamation manual. Elsevier Science Publishers, New
York, NY.
Magbunua, B. 2000. An assessment of the recovery and potential of residuals and
byproducts from the food processing and institutional food sectors in Georgia. University
of Georgia. Engineering Outreach Report. June, 2000.
Meyer, L.D., C.B. Johnson, and G.R. Foster. 1972. Stone and woodchip mulches for erosion
control on construction sites. Journal of Soil and Water Conservation., 27:264-269.
Michaud, M. 1995. Recycled materials used as erosion control mulches. In: Compost

79
Utilization in Horticultural Cropping Systems, eds. P.J. Stofella and B.A. Kahn, Lewis
Publishers.
Portland Metro. 1994. Summary of projects using yard debris compost for erosion
prevention and control. Final Report. June, 1994. Solid Waste and Planning Department.
Portland, OR.
SAS, 2001. SAS System 8.2 for Microsoft Windows. The SAS Institute, Inc. Cary, North
Carolina.
Storey, B.B., J.A. McFalls, S.H. Godfrey. 1995. The use of compost and shredded
brush on rights of way for erosion control: Final report. Texas Transportation
Institute, Texas A&M University System. College Station, TX. Contract No. 0-1352.
USDA. 1995. Agricultural Handbook, No. 703, Washington, DC: USDA.
US Department of Commerce, National Weather Service. 1961. Technical paper #40 of
the National Weather Service. www.erh.noaa.gov/er/hq/Tp40s.htm, accessed 2-17-2004.
US EPA. 1997. Innovative uses of compost: erosion control, turf remediation and
landscaping. EPA 530-F-97-043. October, 1997.
US EPA. 1999. A Collection of Solid Waste Resources: Fall 1999 Edition. CD-ROM.
US EPA. 2000. Storm Water Phase II Final Rule: Construction site runoff control minimum
control measure. Office of Water (4203). EPA 833-F-00-008, Fact Sheet 2.6.
Vleeschauwer, D.D., M.D. Boodt. 1978. The comparative effects of surface applications
of organic mulch versus chemical soil conditioners on physical and chemical
properties of the soil and on plant growth. Catena 5:337-349.
Weather Channel. 2004. www.weather.com/weather/climatology/monthly/30602 date accessed,
4-17-2004.

80
Wischmeier, W.J.; D.D. Smith. 1978. Predicting Rainfall Erosion Loss – A Guide to
Conservation Planning, Agr. Handbook No. 537, Washington DC: USDA.

81
CHAPTER 4
SUMMARY AND CONCLUSION
It is inappropriate to conclude which treatment works best because every situation in the
field is different, and specific characteristics of a particular compost or an industry standard
method may fit with a specific challenge in the field. However, there were evident trends from
the results that cannot be ignored. First, stable and mature composts will consistently provide
the best results for each of the parameters examined in this study. Additionally, it is important to
follow approved specifications and in some cases these specifications may be improved –
although that is not in the scope of this study.
Composts with high germination rates, total nitrogen, total phosphorus, and potassium
concentrations lead to the quickest vegetative cover. However, composts with high ammonium
nitrogen, high nitrate nitrogen, and low C:N ratios can create greater weed growth. Further
testing would show if this was because these composts were not thoroughly composted or if high
nutrient content leads to greater weed growth. Hydroseeding (utilizing Bermuda grass seed) may
require additional applications to provide sufficient and permanent vegetative cover to prevent
weed proliferation and to sufficiently cover the soil, particularly after rain events that produce
runoff.
Compost provides greater infiltration and less runoff than hydroseed treated soils, as
hydroseed treated soils performed similarly to bare soil prior to vegetation establishment.
82
General characteristics of high quality compost that provide good vegetative growth, such as low
bulk density, high maturity, near neutral pH, adequate N, P, and K and the particle size
distribution of the compost, are important to increasing infiltration and reducing runoff. This
provides compelling evidence that compost may be well suited for a variety of storm water
management applications, particularly in small to medium storms where it can eliminate runoff,
thus preventing most erosion from ever occurring.
Compost provides better protection from solids loss than hydroseed and silt fence;
however, the difference is reduced over time, particularly if weeds are left unchecked in
hydroseed treated areas. Composts with low bulk density and high organic matter may be better
suited to reduce solids loss, although further testing is needed. Mulch filter berms can provide
better filtration of solids in storm water compared to silt fence.
Materials high in total N and total P are likely to lose more of each nutrient to storm
runoff; however, these nutrient concentrations will diminish over time. Because hydroseed is
applied with inorganic N and soluble P it is more likely that these nutrients will be lost to storm
runoff and consequently are in more reactive forms that lead to eutrophication. In addition,
hydroseed is likely to cause P build up in soil, which can lead to elevated P loss in runoff over a
prolonged time period. Composts high in inorganic N are likely to lose higher concentrations of
N to runoff, therefore it is recommended that composts have a much higher percentage of
organic N of the total N content. Additionally, high concentrations of C, organic matter and Ca
(as added gypsum) in compost may reduce P loss in runoff.
Compost blankets can increase soil microbial biomass, total C, potassium, calcium and
pH in surface soil; and pH, organic matter, calcium and magnesium at deeper soil horizons.

83
Hydroseed can increase soil phosphorus, potassium, calcium and pH near the soil surface. The
increase in surface soil P may lead to increase P loss in runoff over a prolonged period of time.
In very broad terms, mature composts that meet specifications provide quicker vegetative
growth, less runoff, less solids loss from erosion, less nutrient loss and increased soil quality.
Manufacturing compost that meets locally prescribed specifications can be a challenge in itself.
Finally, it may be worthwhile to reexamine existing specifications based on some of these
results, particularly regarding nutrient content and potential losses.

84
APPENDIX A
MATERIALS AND METHODS
Compost Definition
Composting is the controlled, biological process of decomposition and recycling of
organic materials into a humus rich soil amendment (Risse and Faucette, 2001). It includes
mixing of organic waste materials with attention to C, N, water, and aeration for optimum
microbial aerobic conditions to achieve a desired heat followed by a decline in temperatures until
biological stability is reached. Epstein (1997) and Storey et al. (1995) define compost as a
relatively stable decomposed organic material resulting from the accelerated biological
degradation of organic material under controlled, aerobic conditions. Storey et al. (1995) adds
that it is the disinfected and stabilized product of the decomposition process that is used or sold
for use as a soil amendment, artificial topsoil, or growing medium amendment.
Treatments
Seven treatments were randomly assigned and applied to 1 m by 4.8 m test plots: a
biosolids compost blanket with compost filter berm; a yardwaste compost blanket with compost
filter berm; a municipal solid waste compost (MSW) and mulch blanket with mulch filter berm;
a poultry litter compost, mulch and gypsum blanket and mulch filter berm; hydroseed and silt
fence; hydroseed and mulch filter berm; and a bare soil (control) plot. The compost and mulch

85
blankets were blended on a 3:1(compost:mulch) volumetric basis. The poultry litter compost and
mulch blanket included 5% (volumetric) ground gypsum from scrap wallboard. Each treatment
was replicated three times, creating a total of 21 test plots. Table 2.1 presents the plot

86
assignment of the treatments. The composts and mulch were chosen because they were readily
and commercially available in Georgia. Hydroseeding and silt fence were chosen because they
represent industry standard erosion and sediment control measures. All are considered quality
products in their respective industries.
Compost blankets were manually applied at 3.75 cm (1.5 inch) depths over the entire area
of the plot. Filter berms were 60 cm (2 ft) wide by 30 cm (1 ft) high and situated at the base of
the slope across the width of the plot. The silt fence was Georgia Department of Transportation
(G DOT) certified, trenched 15 cm (6 in) deep at the base of the slope and across the width of the
plot. The hydroseed was a mixture of pelletized lime, 10-4.4-8.3 fertilizer (commercially
recognized as 10-10-10), wood fiber, green pigment, water and Common Bermuda (Cynodon
dactylon) grass seed. A certified professional mechanically applied the hydroseed.
Table 2.1: Test plot layout by treatment.
Test Plot
Number
Treatment Abbreviation
1 Bare soil (control) BS-1
2 Biosolids compost blanket and filter berm BC-2
3 Poultry litter compost/mulch/gypsum blanket w/ mulch
filter berm
PL-3
4 Yardwaste compost blanket and filter berm YW-4
5 Hydroseed and silt fence HS-5
6 Bare soil (control) BS-6
7 Hydroseed and mulch filter berm HM-7
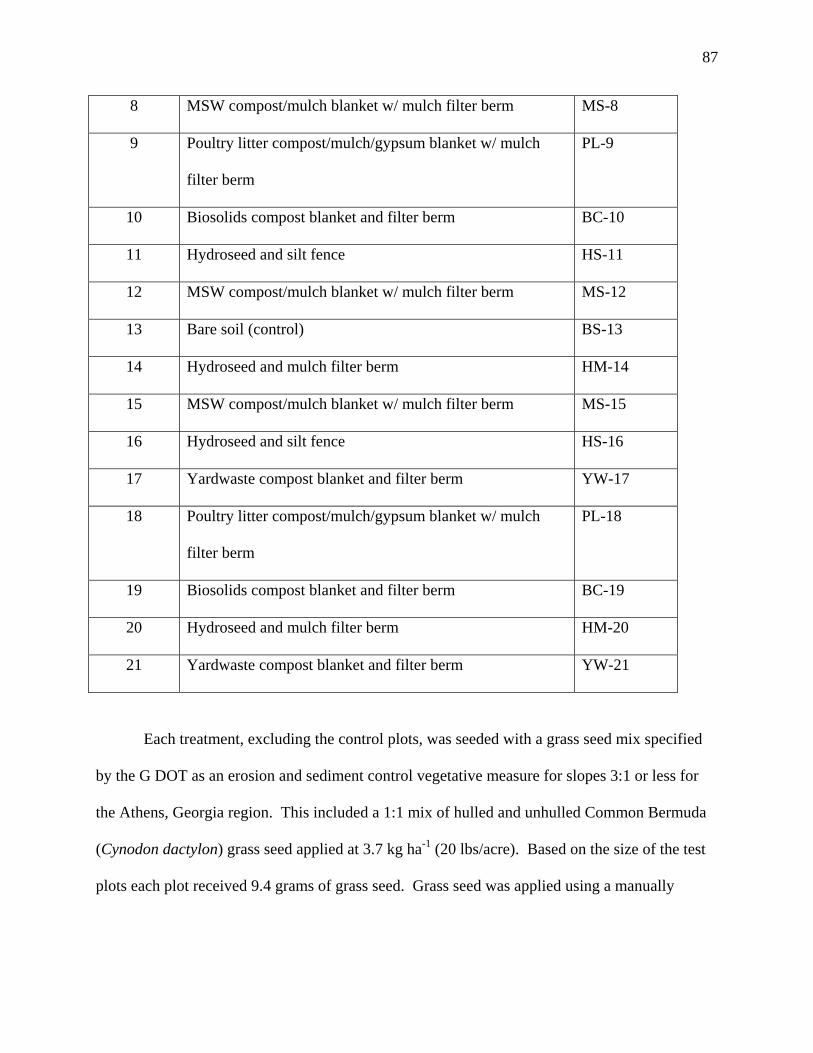
87
8 MSW compost/mulch blanket w/ mulch filter berm MS-8
9 Poultry litter compost/mulch/gypsum blanket w/ mulch
filter berm
PL-9
10 Biosolids compost blanket and filter berm BC-10
11 Hydroseed and silt fence HS-11
12 MSW compost/mulch blanket w/ mulch filter berm MS-12
13 Bare soil (control) BS-13
14 Hydroseed and mulch filter berm HM-14
15 MSW compost/mulch blanket w/ mulch filter berm MS-15
16 Hydroseed and silt fence HS-16
17 Yardwaste compost blanket and filter berm YW-17
18 Poultry litter compost/mulch/gypsum blanket w/ mulch
filter berm
PL-18
19 Biosolids compost blanket and filter berm BC-19
20 Hydroseed and mulch filter berm HM-20
21 Yardwaste compost blanket and filter berm YW-21
Each treatment, excluding the control plots, was seeded with a grass seed mix specified
by the G DOT as an erosion and sediment control vegetative measure for slopes 3:1 or less for
the Athens, Georgia region. This included a 1:1 mix of hulled and unhulled Common Bermuda
(Cynodon dactylon) grass seed applied at 3.7 kg ha-1 (20 lbs/acre). Based on the size of the test
plots each plot received 9.4 grams of grass seed. Grass seed was applied using a manually

88
operated seed spreader. Each plot was covered with plastic after treatment application until the
first rainfall simulation.
Background of Treatments
Each compost treatment was produced at its respective processing yard. No additional
composting or curing was conducted after procurement.
The poultry litter compost was a blend of poultry litter, culled vegetables, municipal yard
waste, wood fiber, peanut hay, and straw. The composting facility is an outdoor windrow
operation that meticulously monitors temperature, moisture, aeration, and carbon dioxide
respiration.
The biosolids compost was a blend of municipal biosolids and peanut hulls and was
processed in large aerated static piles. The entire operation including curing, screening, and
finished piles is under roof. Meticulous attention is paid to temperature levels, moisture,
aeration, and screening. This facility adheres to EPA part 503 temperature requirements to kill
pathogens and maintains a processing certification by the U.S. Composting Council’s (USCC)
Seal of Testing Assurance (STA) program.
The municipal solid waste (MSW) compost was a blend of MSW and municipal biosolids
and was processed in large Bedminster rotational drums for one week and then processed in
large aerated static piles. Next the material was screened to remove inert materials and
contaminants. All three processes are managed indoors where temperature, leachate, moisture,
and aeration are monitored and EPA part 503 temperature requirements are achieved. The
compost is then transported to an outdoor facility where it is cured in windrows for several
months prior to sale.
89
The yard waste compost was a blend of yard waste, animal bedding and paper bags. The
materials are processed in outdoor windrows for approximately 6 to 9 months and screened prior
to use.
The mulch consisted mostly of ground softwood and hardwood trees from land clearing
debris, often referred to as green waste within the industry. It was a 1:1 blend of mulch screened
to 0.6 cm (¼ in) minus (particles < screen size) and mulch screened to 5 cm (2 in) minus. This
material was stored in large static piles where some heating occurred, but was not monitored.
The gypsum used in the poultry litter compost blanket was ground scrap wallboard from
a residential construction site. The gypsum was used as a potential calcium additive to reduce
phosphorus loss from the poultry litter compost. Scrap wallboard is a major byproduct of the
construction industry in Georgia that is rarely recycled.
Physical, Chemical and Biological Characteristics of Treatments
The compost treatments were characterized after blending and prior to application in the
test plots (Table 2.2 & Table 2.3). Bulk density levels ranged between 0.32 to 1.49 g/cm3 (743 to
2512 lbs/yd3). All treatments met US Composting Council guidelines for inerts percentage
analysis for high quality composts (1997).
Respirometry analysis, used to determine biological stability, found all treatments were
biologically stable. Unstable composts typically exhibit a stability index greater than 2.0 mg O2/g
VM Hr-1 (Epstein, 1997). The percentage of cucumber seeds that germinated was used to
determine compost maturity, the point when organic materials have been sufficiently composted
and cured, and therefore optimum for plant growth. All treatments exhibited a germination rate
that was optimum for seed germination – above 80% (Barberis and Nappi, 1996).
90
Water contents of the treatments ranged between 31% and 45%, which may have affected
the treatments ability to hold moisture and affect the runoff yield from each treatment. pH
ranged from 7.0 in the biosolids compost to 8.1 in the MSW compost, which may have had an
effect on vegetative growth and nutrient availability. Organic matter ranged from 23.3 g kg-1 in
the bare soil control to 360 g kg-1 in the MSW compost. This may affect soil quality over time.
The American Association of State Highway Transportation Officials (AASHTO) specifies that
5 mS/cm or less is acceptable for compost used for erosion control blankets (Alexander, 2003).
The poultry litter compost did not meet this requirement. Elevated levels of soluble salts could
have an effect on vegetative growth.
A C:N ratio for finished compost of 20:1 or less is recommended to avoid N
immobilization by soil microorganisms. The poultry litter compost blend was the only treatment
that exceeded this guideline. Total C, total N, ammonium-nitrogen (NH4-N), nitrate-nitrogen
(NO3-N), and total P levels ranged quite a bit between treatments and may effect vegetative
growth and water quality of the storm runoff. No treatment had heavy metals levels that would
be a concern and all met US EPA part 503 code 40 standards (1993).
Current literature suggests a range of particle sizes is optimum for filtering moving
sediments and for holding the soil in place. While a higher ratio of larger particles may work
better to filter moving sediments and be more resistant to dislodgment from rainfall impact, they
may be less effective for plant establishment and growth. Field demonstration projects indicate
that particle size may be the most important factor in compost’s ability to keep sediment out of
nearby surface waters.
Based on the University of Georgia recommended specifications all compost treatments
adhered to the parameters for moisture content, soluble salt, nitrogen content, human made

91
inerts, heavy metals, application rate/size, respirometry, and germination rate. All treatments,
with the exception of the mulch filter berms, were below the minimum organic matter
recommendation. All treatments, excluding the MSW compost, met the pH recommendation.
All treatments had particle size distributions that were too high in small particles, i.e. greater than
3:1 for blankets and 1:1 for filter berms, according to the recommended specifications presented
here.
Site Location and Description
Research test plots were at Spring Valley Farm in Athens/Clarke County, Georgia, USA
at 33° 57’ N latitude and 83° 19’ W longitude. The plots are situated towards the west-northwest
end of the farm property. Figure 1.1 depicts the location of the research site relative to Georgia.
Figure 1.2 represents the location of the site within Clarke County and Figure 1.3 is a more
detailed map of where the test plots are in relation to the farm.
Today Spring Valley Farm is a research and education site for Agroecological and
Agroforestry production practices. Prior to this the farm was used extensively for pasture and
intensive cotton production for over 100 years. These practices have left the research site area
devoid of topsoil, and low in soil fertility and overall soil quality. The research site was
surrounded by open and unmanaged pasture with scrub vegetation.
The soil was originally classified as an eroded Pacolet Sandy Clay Loam (USDA, 1968)
and has a high soil erodibility factor (K value) of approximately 0.36 (Wischmeier and Smith,
1978). Table 2.4 shows the average percent sand, silt and clay and its soil type by treatment
prior to treatment application. No significant differences were found. The area receives an
average annual rainfall of 1214.7 mm, with January through March as the wettest period. The

92
average annual high temperature for the area is 22° C, the average low is 11°C, with a mean
annual temperature of 17°C (Weather Channel, 2004).
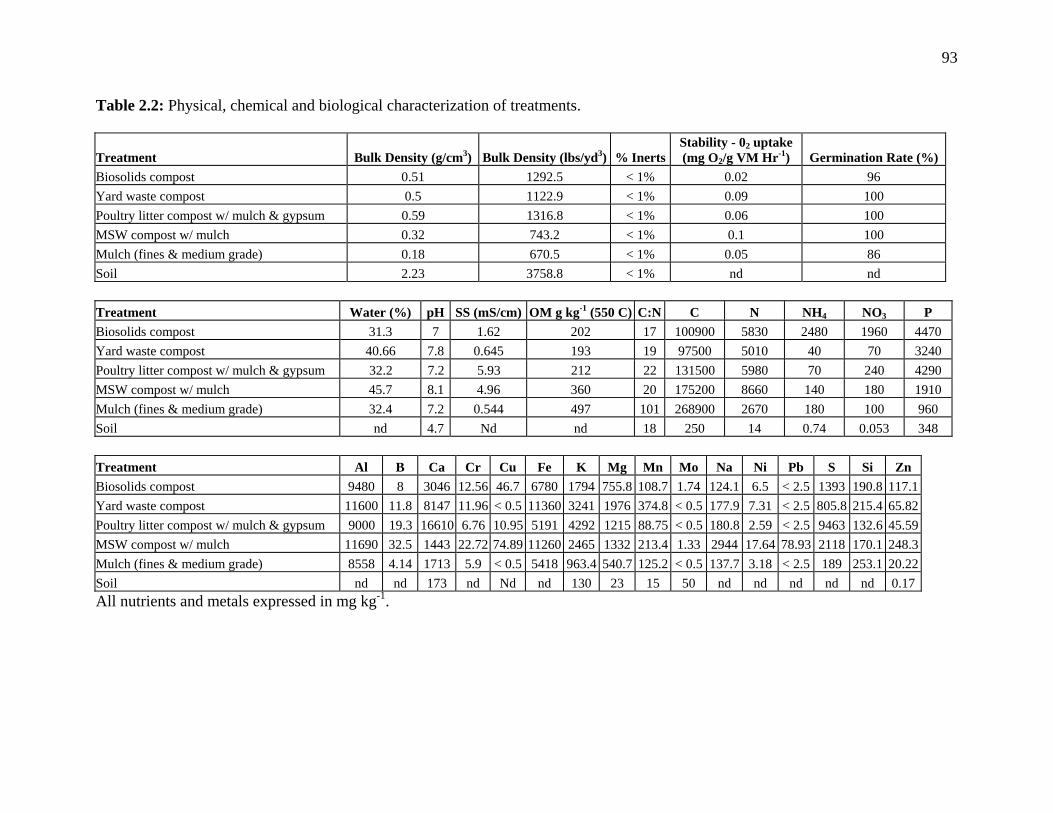
93
Table 2.2: Physical, chemical and biological characterization of treatments.
Treatment Bulk Density (g/cm3) Bulk Density (lbs/yd3) % InertsStability - 02 uptake (mg O2/g VM Hr-1) Germination Rate (%)
Biosolids compost 0.51 1292.5 < 1% 0.02 96 Yard waste compost 0.5 1122.9 < 1% 0.09 100 Poultry litter compost w/ mulch & gypsum 0.59 1316.8 < 1% 0.06 100 MSW compost w/ mulch 0.32 743.2 < 1% 0.1 100 Mulch (fines & medium grade) 0.18 670.5 < 1% 0.05 86 Soil 2.23 3758.8 < 1% nd nd Treatment Water (%) pH SS (mS/cm) OM g kg-1 (550 C) C:N C N NH4 NO3 P Biosolids compost 31.3 7 1.62 202 17 100900 5830 2480 1960 4470 Yard waste compost 40.66 7.8 0.645 193 19 97500 5010 40 70 3240 Poultry litter compost w/ mulch & gypsum 32.2 7.2 5.93 212 22 131500 5980 70 240 4290 MSW compost w/ mulch 45.7 8.1 4.96 360 20 175200 8660 140 180 1910 Mulch (fines & medium grade) 32.4 7.2 0.544 497 101 268900 2670 180 100 960 Soil nd 4.7 Nd nd 18 250 14 0.74 0.053 348 Treatment Al B Ca Cr Cu Fe K Mg Mn Mo Na Ni Pb S Si Zn Biosolids compost 9480 8 3046 12.56 46.7 6780 1794 755.8 108.7 1.74 124.1 6.5 < 2.5 1393 190.8 117.1Yard waste compost 11600 11.8 8147 11.96 < 0.5 11360 3241 1976 374.8 < 0.5 177.9 7.31 < 2.5 805.8 215.4 65.82Poultry litter compost w/ mulch & gypsum 9000 19.3 16610 6.76 10.95 5191 4292 1215 88.75 < 0.5 180.8 2.59 < 2.5 9463 132.6 45.59MSW compost w/ mulch 11690 32.5 1443 22.72 74.89 11260 2465 1332 213.4 1.33 2944 17.64 78.93 2118 170.1 248.3Mulch (fines & medium grade) 8558 4.14 1713 5.9 < 0.5 5418 963.4 540.7 125.2 < 0.5 137.7 3.18 < 2.5 189 253.1 20.22Soil nd nd 173 nd Nd nd 130 23 15 50 nd nd nd nd nd 0.17All nutrients and metals expressed in mg kg-1.
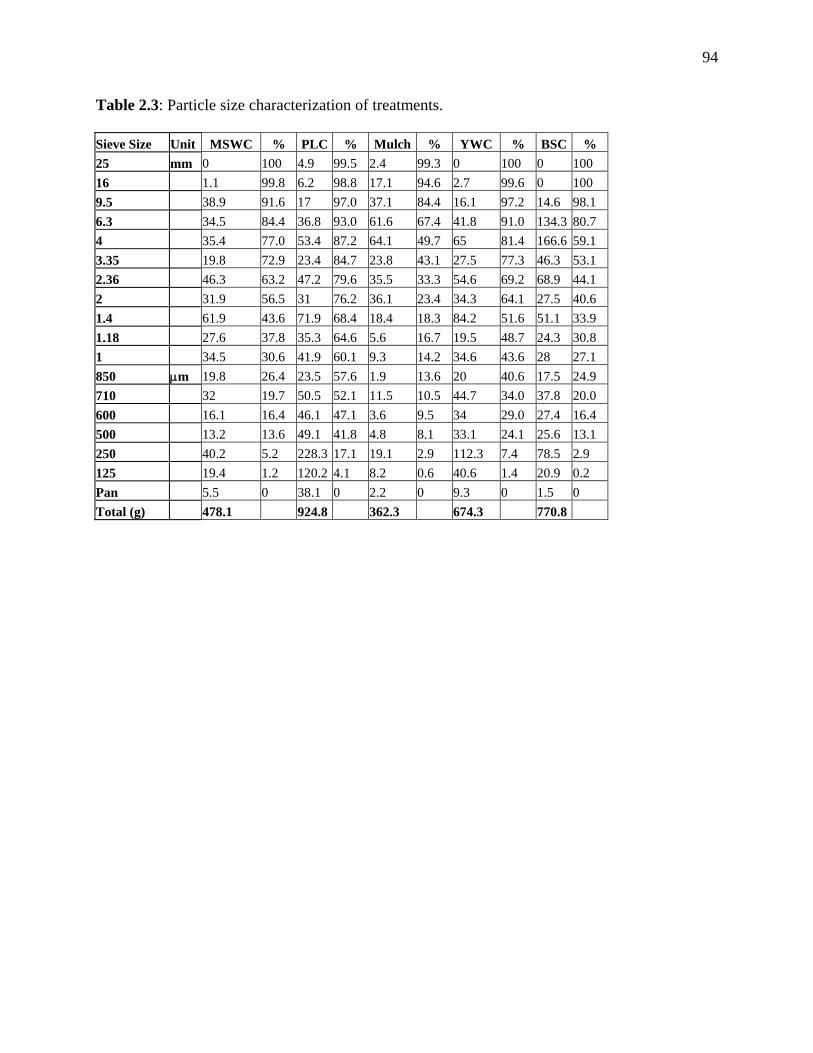
94
Table 2.3: Particle size characterization of treatments.
Sieve Size Unit MSWC % PLC % Mulch % YWC % BSC % 25 mm 0 100 4.9 99.5 2.4 99.3 0 100 0 100 16 1.1 99.8 6.2 98.8 17.1 94.6 2.7 99.6 0 100 9.5 38.9 91.6 17 97.0 37.1 84.4 16.1 97.2 14.6 98.1 6.3 34.5 84.4 36.8 93.0 61.6 67.4 41.8 91.0 134.3 80.7 4 35.4 77.0 53.4 87.2 64.1 49.7 65 81.4 166.6 59.1 3.35 19.8 72.9 23.4 84.7 23.8 43.1 27.5 77.3 46.3 53.1 2.36 46.3 63.2 47.2 79.6 35.5 33.3 54.6 69.2 68.9 44.1 2 31.9 56.5 31 76.2 36.1 23.4 34.3 64.1 27.5 40.6 1.4 61.9 43.6 71.9 68.4 18.4 18.3 84.2 51.6 51.1 33.9 1.18 27.6 37.8 35.3 64.6 5.6 16.7 19.5 48.7 24.3 30.8 1 34.5 30.6 41.9 60.1 9.3 14.2 34.6 43.6 28 27.1 850 µm 19.8 26.4 23.5 57.6 1.9 13.6 20 40.6 17.5 24.9 710 32 19.7 50.5 52.1 11.5 10.5 44.7 34.0 37.8 20.0 600 16.1 16.4 46.1 47.1 3.6 9.5 34 29.0 27.4 16.4 500 13.2 13.6 49.1 41.8 4.8 8.1 33.1 24.1 25.6 13.1 250 40.2 5.2 228.3 17.1 19.1 2.9 112.3 7.4 78.5 2.9 125 19.4 1.2 120.2 4.1 8.2 0.6 40.6 1.4 20.9 0.2 Pan 5.5 0 38.1 0 2.2 0 9.3 0 1.5 0 Total (g) 478.1 924.8 362.3 674.3 770.8

95
Figure 1.1: Research site location in Athens, Georgia, USA.
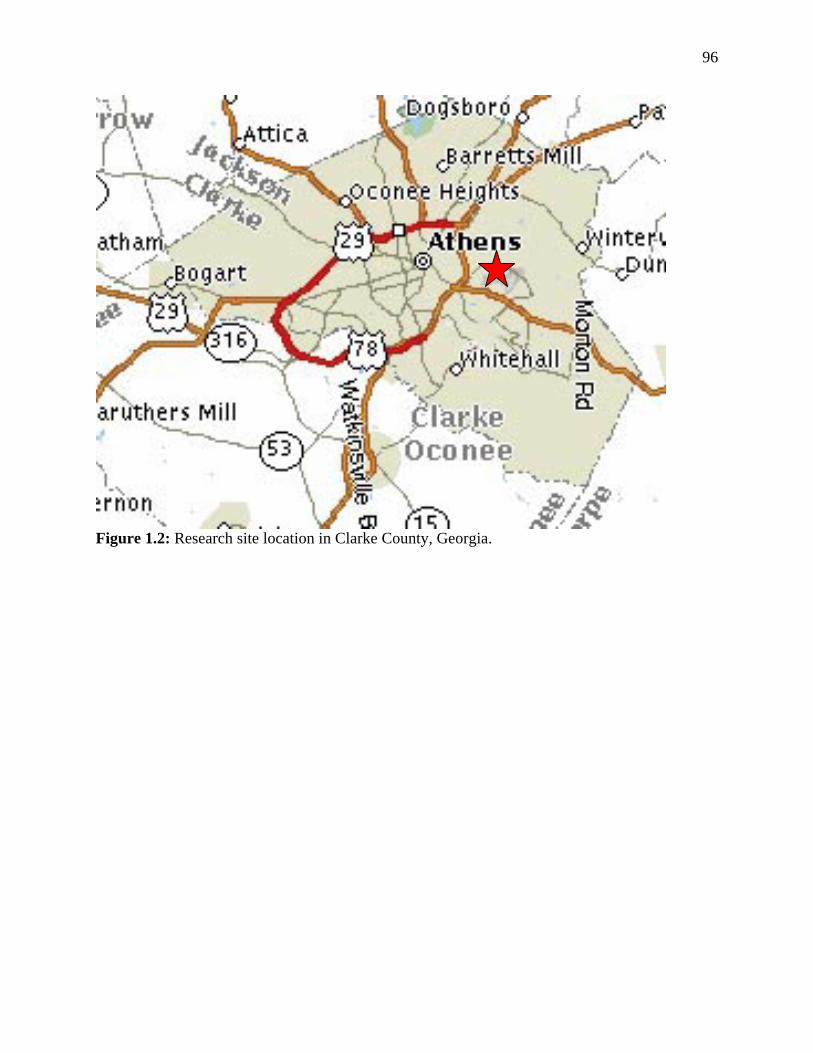
96
Figure 1.2: Research site location in Clarke County, Georgia.

97
Figure 1.3: Research plots located on Spring Valley Farm.

98
Table 2.4: Average percent sand, silt, clay and predominant soil type from 0-15 cm by treatment
prior to treatment application.
Treatment Sand Silt Clay Type
PLC/Mulch/Gypsum 60.67 8.67 30.67 Sandy
clay loam
Biosolids Compost 61.33 8.67 30.0 Sandy
clay loam
MSW
Compost/Mulch
62.67 6.67 30.67 Sandy
clay loam
Yardwaste Compost 53.33 11.33 35.33 Clay
Hydroseed/Mulch
Berm
52.67 10.67 36.67 Sandy
clay
Hydroseed/Silt
Fence
64.0 8.0 28.0 Sandy
clay loam
Bare Soil (not
seeded)
66.0 8.67 25.33 Sandy
clay loam
Treatments were not significantly different at α = 0.05
Experimental Test Plots
The land was cleared of vegetation and topsoil to simulate a construction site soil surface.
A 10% grade was applied to the exposed subsoil (Bt horizon). Test plot borders were installed to
prevent cross contamination of plots. Fifteen cm (6 in) stainless steel was used to avoid potential
metal contamination in the runoff. The borders were trenched 7.5 cm (3 in) into the soil. Seven
and a half centimeters of the border extended above ground. The plots were sized to fit the
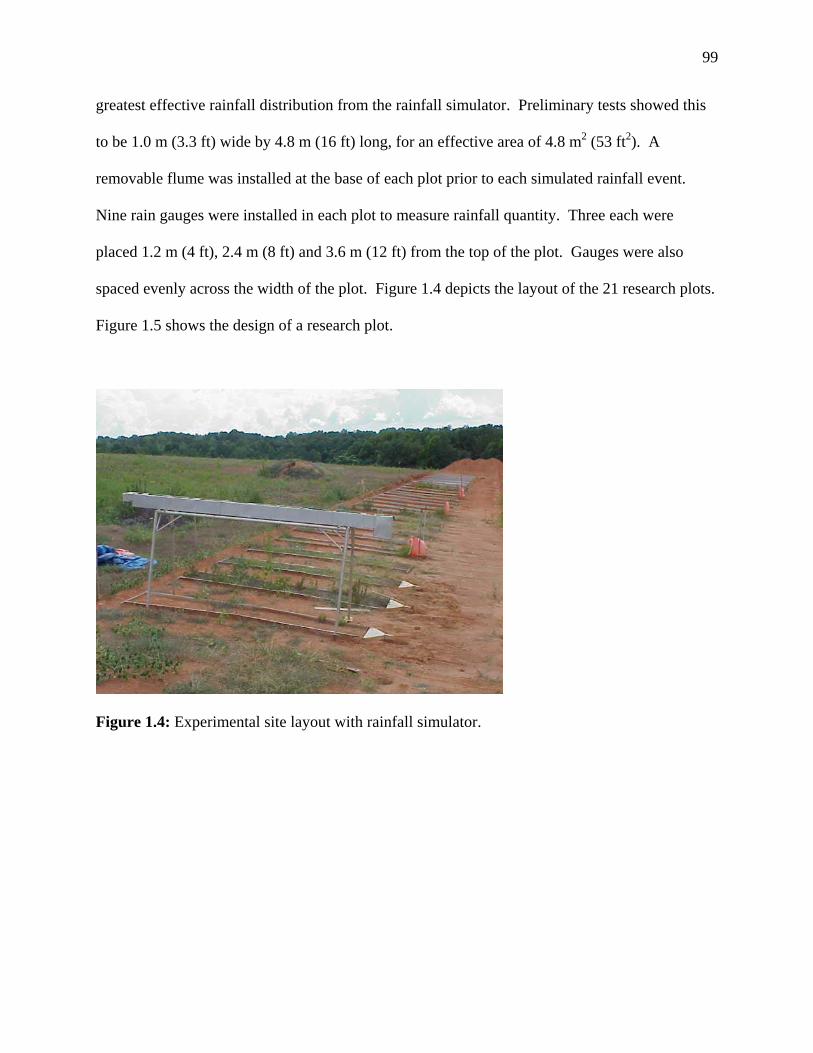
99
greatest effective rainfall distribution from the rainfall simulator. Preliminary tests showed this
to be 1.0 m (3.3 ft) wide by 4.8 m (16 ft) long, for an effective area of 4.8 m2 (53 ft2). A
removable flume was installed at the base of each plot prior to each simulated rainfall event.
Nine rain gauges were installed in each plot to measure rainfall quantity. Three each were
placed 1.2 m (4 ft), 2.4 m (8 ft) and 3.6 m (12 ft) from the top of the plot. Gauges were also
spaced evenly across the width of the plot. Figure 1.4 depicts the layout of the 21 research plots.
Figure 1.5 shows the design of a research plot.
Figure 1.4: Experimental site layout with rainfall simulator.
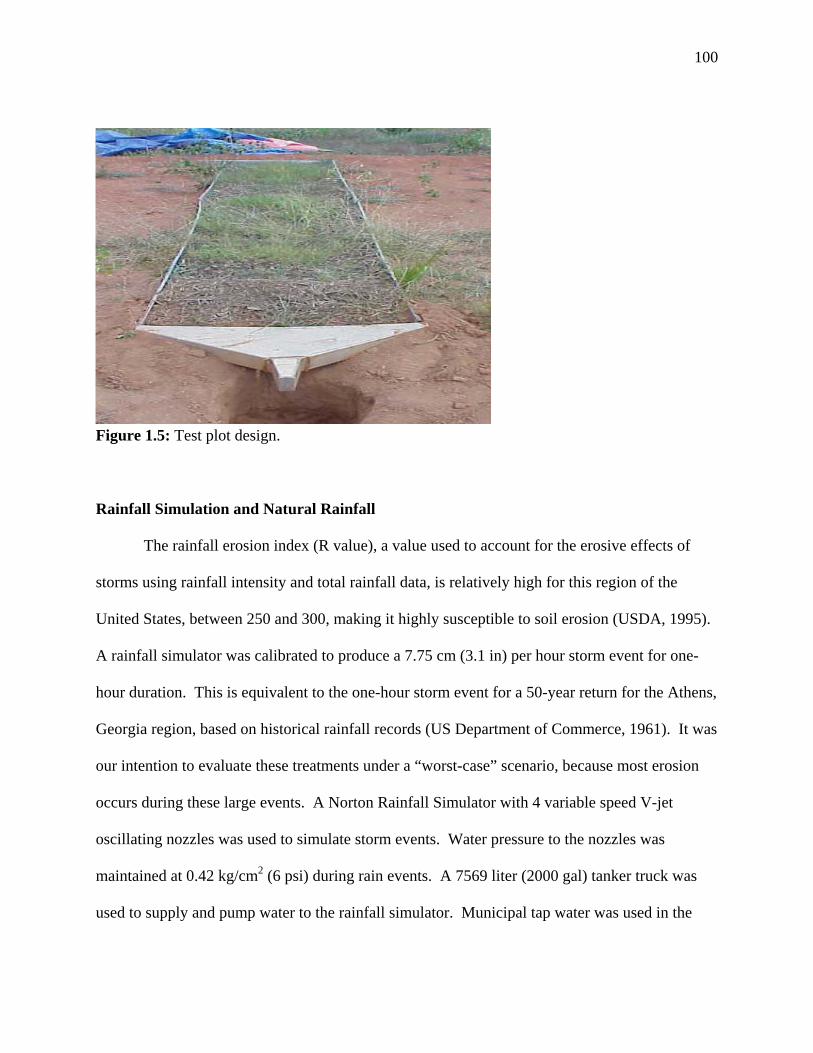
100
Storm Events and Rainfall Simulation
Figure 1.5: Test plot design.
Rainfall Simulation and Natural Rainfall
The rainfall erosion index (R value), a value used to account for the erosive effects of
storms using rainfall intensity and total rainfall data, is relatively high for this region of the
United States, between 250 and 300, making it highly susceptible to soil erosion (USDA, 1995).
A rainfall simulator was calibrated to produce a 7.75 cm (3.1 in) per hour storm event for one-
hour duration. This is equivalent to the one-hour storm event for a 50-year return for the Athens,
Georgia region, based on historical rainfall records (US Department of Commerce, 1961). It was
our intention to evaluate these treatments under a “worst-case” scenario, because most erosion
occurs during these large events. A Norton Rainfall Simulator with 4 variable speed V-jet
oscillating nozzles was used to simulate storm events. Water pressure to the nozzles was
maintained at 0.42 kg/cm2 (6 psi) during rain events. A 7569 liter (2000 gal) tanker truck was
used to supply and pump water to the rainfall simulator. Municipal tap water was used in the

101
study. The water was monitored and tested for NO3-N (0.673 mg L-1) and P04-P (0.093 mg L-1)
concentration prior to use in the study.
Three simulated rainstorms were conducted; at the beginning of the experiment, at 3
months and one year. These time intervals were chosen based on the predicted establishment of
the vegetation. The first storm event was intended to provide information on the performance of
the treatments prior to vegetation establishment. The second storm event was intended to
provide information on how the performance of the treatments changed when vegetation was
newly established. The final storm event was to provide information on how the treatments
reacted once vegetation was fully established. A stainless steel border was inserted at the base of
each plot between storm events to maintain the structure and integrity of the plot.
The week prior to the first simulated storm event the research site received no natural
rainfall, while 31 mm (1.22 in) of rain fell on the plots during the week of the simulated storm
events. During the three months between the second and third storm event the site only received
90.7 mm (3.57 in) of natural rainfall, with only 16.8 mm (0.66 in) falling in the third month.
These extremely dry conditions likely affected vegetation growth. The week prior to the second
storm the research site received no natural rainfall, while during the weeklong simulated storm
trials the site received 6.9 mm (0.27 in) of natural rain. The week before the final storm event
the research site received 102.4 mm (4.03 in) of natural rain and 35.8 mm (1.41 in) during the
week of storm simulations. This led to saturated field conditions during the final simulated
storm event.

102
Rainfall Average and Distribution
Rainfall averages were calculated by averaging the rainfall depths for the nine rain gages.
The rainfall distribution pattern was calculated by averaging the difference from each rain gage
from the average rainfall for the entire test plot, for all 21 test plots, and for each storm event.
Soil Moisture
Antecedent soil moisture conditions were measured prior to the first and third rainfall
simulation using time domain reflectometry (TDR) with a Tektronix Cable Tester (Ferre and
Topp, 2002). Each plot used three TDR probes at intervals of 0.9 m (3 ft). The USDA
Agricultural Research Service (1980) TACQ program was used to process and convert
wavelengths to moisture content.
Sampling Procedures
Storm water runoff:
Runoff samples were collected from a flume placed at the base of each plot. The first
sample was taken once water began to “trickle” from the flume aperture, the point determined to
be the beginning of runoff. After the first sample was collected, samples were taken every five
min until the 60-min storm was finished.
Runoff samples were analyzed for runoff quantity, runoff rate, total solids, total N, NH4-
N, NO3-N, total P, and dissolved reactive P (DRP). Runoff quantity and solids samples used one
500 ml Nalgene bottle per time interval sample and were timed until the bottle was full. Nutrient
samples used separate 500 ml Nalgene bottles and were filled for five seconds (s) duration. This
103
created a single volume weighted sample for the event. Each five-s nutrient sample, taken every
five-min, was placed in a 3.8 liter (1 gal) bottle for easy transportation.
Soil:
Soil samples were taken to evaluate the effects of the treatments on soil quality with
special attention given to the Bt horizon (A was removed). Soil samples were taken at the
beginning of the study (after clearing and grading but before application of treatments), at 6
months and at 18 months. At the 6 and 18 month sampling periods the compost treatment was
removed prior to sampling the soil. Soil core samples were taken at 0-5 cm (0-2 in) and 0-15 cm
(0-6 in) depths. Five randomly sampled replicates were taken for composite samples for each
depth at each plot. The 0-5 cm (0-2 in) samples were analyzed for total N, total P, plant
available P (Mehlich 1), K, Ca, Mg, pH, organic matter, and extractable organic carbon (as an
indicator of soil microbial biomass). The 0-15 cm (0-6 in) samples were analyzed for total N,
total P, plant available P (Mehlich 1), K, Ca, Mg, pH, and organic matter. Bulk density samples
were taken from 0-7.5 cm (0-3 in), and replicated three times per plot. Soil sampling at six
months did not include bulk density or the 0-15 cm (0-6 in) core sample analyses. It was
assumed that little difference would be noticed from these tests after six months time. Water
infiltration rate and extractable organic carbon tests were performed only at the six-mo and
eighteen-mo sampling periods.
Vegetative growth and weeds:
Vegetative growth and weed analysis was performed at 3 months and 12 months,
coinciding with storm events. Analysis included the percentage of vegetative cover of each plot
104
area, total number of weed plants and species, and biomass of the vegetation. Harvest for
biomass analysis was only conducted at the end of the study.
Percent vegetative cover was measured using a one meter (3.3 ft) wide by 4.8 m (16 ft)
long grid with string lines set four inches apart on all sides. Vegetation was counted only if it
was found directly under each intersect. A total of 480 intersects per plot were used in the
calculation to obtain the percent cover.
Weeds (defined as any species other than Bermuda grass) may help control erosion and
sediment loss but they are also regarded as a nuisance and undesirable in field applications. The
total number of different weed species and the total number of weed plants were counted for
each plot at three months and twelve months. Total number of weed species and number of
plants were low enough at three months to manually count and identify for the plot as a whole.
At twelve months, a grid measuring 9.3 dm2 (1 ft2) was randomly placed once in each third of
each plot to sub-sample number of weed species, number of weeds and percent cover of weeds
(i.e. excluding Bermuda grass). The sub-samples were averaged to obtain a composite for each
plot.
Composite samples for biomass analysis were harvested using a 9.3 dm2 (1 ft2) sampling
area replicated three times, once in each third of each plot. Vegetation was clipped and
harvested at the soil surface. Harvested biomass was sorted into weed biomass and Bermuda
grass biomass, and then oven dried separately. Biomass was calculated as dry weight divided by
the area. The addition of the weed biomass and Bermuda grass biomass were used to calculate
the total biomass.
105
Analytical Methods
Treatment characterization:
Physical and biological analyses of the treatments were performed at the University of
Georgia’s Bioconversion Research and Education Center laboratory. Water content (method
07.09-A), human made inert analysis (method 07.08), and germination rate (method 09.05-A) of
the treatments followed the procedures outlined in the United States Composting Council’s Test
Methods for the Examination of Composting and Compost (USCC, 1997). Bulk density
followed USDA guidelines for soil quality (1998), and biological stability (as oxygen uptake)
was determined using methods described by Iannotti et. al (1993). Chemical characterizations
were performed at the University of Georgia Agricultural and Soil, Plant and Water Laboratory
using EPA or AOAC approved procedures (University of Georgia Soil, Plant and Water Analysis
Lab, 2004). Total C and total N were determined by Micro-Dumas combustion, organic matter
used the loss on ignition method, pH was from water, nitrate-N and ammonium-N used the
colormetric autoanalyzer method, soluble salts were determined by conductivity and the
remaining chemical elements were analyzed by ICP method (University of Georgia Soil, Plant
and Water Analysis Lab, 2004). Metals were analyzed and all of the treatments were below the
pollutant concentration levels as specified in US EPA part 503 Table 4 (USEPA 1993).
Water quality:
For each rainfall run, the total weight of runoff and the time over which it was collected
was recorded. Each bottle was oven dried at 105° C until constant weight was achieved to
determine the total solids content and total amount of solids lost from the plot. The total solids
were measured using methods 2540 B Total Solids Dried at 103-105° C (USEPA, 1983).
106
Laboratory analysis of the nutrients was conducted at the University of Georgia’s
Institute of Ecology Analytical Chemistry Laboratory for the first two rainfall events. Nitrate-N
and total N were measured using EPA standard method 353.2 (colorimetric, automated,
cadmium reduction), ammonia nitrogen using EPA standard method 350.1 (colorimetric,
automated phenate), and total P and DRP using EPA standard method 365.1 (colorimetric,
automated, ascorbic acid) (USEPA, 1983). A persulfate digest for water (Qualls, 1989) was used
as a pretreatment for determination of total N and total P. The University of Georgia’s
Biological and Agricultural Engineering Water Quality Laboratory analyzed runoff nutrients
from the final rainfall event. Standard procedural methods were the same as those followed by
the Institute of Ecology except they were processed on a TRAACS automated sampler; DRP
(Method No. US-781-86D-multitest MT1), nitrate-N (Method No. US-782-86C- Multitest MT1),
and ammonium-N (Method No. US-780-86C-Multitest MT1) (Bran and Luebbe, 1996).
From these data, the steady state runoff rate was calculated by averaging the last three
five-minute interval samples during the simulated storm. The time until steady state was
achieved was measured once two time adjacent samples were equal in the elapsed time to fill the
sample bottle. The total runoff volume was calculated by summing the averages of each two
time adjacent samples. Total solid and nutrient loads were calculated by summing the average of
each two time adjacent concentration samples multiplied by the average of the same two samples
for runoff volume. Infiltration volumes were calculated as total rainfall volume subtracted by
total runoff volume, where total rainfall volume was rainfall total multiplied by the total area of
the plot. Total solid load ratios were calculated by dividing the treatment average by the control
average. Results less than one show a benefit to erosion control by the treatment.

107
Soil quality:
Soil chemical characterizations for the 0-5 cm (0-2 in) core samples and were performed
at the University of Georgia’s Institute of Ecology Analytical Chemistry Lab. Total C and total
N were determined by Micro-Dumas combustion (University of Georgia Institute of Ecology,
2004). Total P used an acid-persulfate digest (Nelson, 1987) and was determined using EPA
standard method 365.1 (colorimetric, automated, ascorbic acid) (USEPA, 1983). Plant available
P used EPA standard method 365.1 (colorimetric, automated, ascorbic acid), K used EPA
standard method 258.1 (atomic absorption, direct aspiration), Ca used EPA standard method
215.1 (atomic absorption, direct aspiration) (USEPA, 1983); and all followed Mehlich I
extraction methods (Mehlich, 1953). Organic matter was determined by ash free dry weight
analysis (Jackson, 1958), and pH was from water (Peech, 1965). Full analytical methods and
references can be found on their website (University of Georgia Institute of Ecology, 2004).
Soil texture and chemical analysis for the 0-15 cm (0-6 in) soil core samples were
performed at the University of Georgia Soil, Plant and Water Analysis Lab. Total P, K, Ca, Mg,
and Zn were extracted by Mehlich 1 extraction methods (Mehlich, 1953) and analyzed by ICP
(Munter and Grande, 1981). Organic matter used the same method as the 0-5 cm samples
(Jackson, 1958), pH was also from water (Peech, 1965) and soil texture used the Bouyoucos
method (Bouyoucos, 1936). Full analytical methods and references can be found on their
website (University of Georgia Soil, Plant and Water Analysis Lab, 2004).
Bulk density and water infiltration rate analysis followed test methods in the USDA Soil
Quality Test Guide (1998). Extractable organic C extractions were performed by using 0.5ml
K2SO4 on a 1:4 basis (soil:extractant), agitated for one hour, centrifuged, and the resulting
supernatant was analyzed for extractable organic C (Ross, 1992; Christensen and Christensen,

108
1991). Extractable organic C analysis was performed with an ASI 5000A auto sampler
according to EPA standard method 5310B (combustion-infared)(USEPA, 1983).
Statistical Analysis
SAS version 8.2 (SAS, 2001) was used for statistical analysis. Analysis of variance
(PROC ANOVA) used Duncan’s Multiple Range test for significant differences between cells
was used to determine any significant differences between treatments (p≤0.05). Correlation
analysis (PROC CORR) was used to determine which of the independent variables, including:
physical, chemical, and biological treatment parameters (as expressed in tables 2.2, 2.3, and 2.4),
and all reported vegetation and rainfall characteristics were correlated to the response variables,
including: all results from vegetation, runoff, solids loss, nutrient loss, and soil quality
parameters.
Compost Market Survey
A survey was conducted in Georgia in 2001 to determine which compost operations
could potentially enter the erosion and sediment control market and what they would charge for
installation of compost blankets (per yd2) and filter berms (per linear ft). Price was based on a
3.75 cm (1.5 in) deep compost blanket and 0.3 m high by 0.6 m wide (1 ft by 2 ft) compost filter
berm. Prices are compared to industry standard measures and are presented as the total installed
price (material cost + installation cost). All information was collected by telephone survey
and/or site visits.
109
References Cited
Barberis, R., P. Nappi. 1996. Evaluation of compost stability. In: The Science of
Composting. Chapman and Hall, London, UK. p.175-184.
Bouyoucos, G.J. 1936. Directions for making mechanical analysis of soils by the hydrometer
method. Soil Science. 42:3, 225-229.
Bran and Luebbe, 1996. TRAACS Applications Manual. Norderstedt, Germany.
Christensen, S., B.T. Christensen. 1991. Organic matter available for denitrification in different
soil fractions: effect of freeze-thaw cycles and straw disposal. 42:637-647.
Epstein, E. 1997. The Science of Composting. Technomic Publishing Co., Inc.,
Lancaster, PA. 487 pages.
Ferre, P.A., G.C. Toppe. 2002. Time domain reflectometry. In: J.H. Dane, G.C. Topp (eds)
Methods of Soil Analysis, Part 4, pp. 434-445. Soil Science Society of America.
Madison, WI.
Iannotti, D.A., T. Pang, B.L. Toth, D.L. Elwell, H.M. Keener, H. Hoitink. 1993. A quantitative
respirometric method for monitoring compost stability. Compost Science and Utilization.
1:3, 52-65.
Jackson, M.L. 1958. Soil Chemical Analysis, Prentice Hall, Inc. Englewood Cliffs, NJ. 219-
220.
Mehlich, A. 1953. Determination of P, K, Na, Ca, Mg and NH4. Soil test division mimeo, North
Carolina Department of Agriculture. Raleigh, North Carolina.
Munter, R.C., R.A. Grande. 1981. Plant tissue and soil extracts analysis by ICP-atomic emission
spectroscopy. In: R.M. Barnes (ed), Developments in Atomic Plasma Analysis. 653-672.
110
Nelson, N. 1987. An acid-persulfate digestion procedure for determination of phosphorus in
sediments. Communications in Soil Science and Plant Analysis, 18, 359-369.
Peech, M. 1965. Hydrogen-ion activity. In: C.A. Black (ed), Methods of Soil Analysis, Part 2,
Chemical and Microbiological Properties #9, American Society of Agronomy. Madison,
WI. 914-925.
Qualls, R.G. 1989. Determination of total nitrogen and phosphorus in water using persulfate
oxidation: a modification for small sample volumes. Appendix A pp. 131-138. In: The
biogeochemical properties of dissolved organic matter in a hardwood forest ecosystem:
their influence on the retention of nitrogen, phosphorus, and carbon. Ph.D. dissertation,
University of Georgia Institute of Ecology, Athens, Georgia, University Microfilms, Inc.,
no. DEX9003448.
Risse, M., B. Faucette. 2001. Compost utilization for erosion control. University of
Georgia, College of Agriculture and Environmental Sciences. Cooperative Extension Service
Bulletin no. 1200.
Ross, D.J. 1992. Influence of sieve mesh size on estimates of microbial carbon and nitrogen by
fumigation-extraction procedures in soils under pasture. Soil Biology and Biochemistry.
24:343-350.
SAS, 2001. SAS System 8.2 for Microsoft Windows. The SAS Institute, Inc. Cary, North
Carolina.
Storey, B.B., J.A. McFalls, S.H. Godfrey. 1995. The use of compost and shredded
brush on rights of way for erosion control: Final report. Texas Transportation
Institute, Texas A&M University System. College Station, TX. Contract No. 0-1352.
111
US Composting Council. 1997. Test Methods for the Examination of Composting and
Compost. First Edition. The United States Composting Council, Amherst, OH.
USDA, Soil Conservation Service. 1968. Soil Survey Clarke and Oconee Counties,
Georgia. Washington, DC.
USDA, Agricultural Resource Service. 1980. TACQ Time Domain Reflectometry (TDR)
Systems Control Program. 2300 Experiment Station Road, Bushland TX.
USDA. 1995. Agricultural Handbook, No. 703, Washington, DC: USDA.
USDA. 1998. Soil Quality Test Kit Guide. US Department of Agriculture. Washington, DC, p.7-
10, 55-58.
US Department of Commerce, National Weather Service. 1961. Technical paper #40 of
the National Weather Service. www.erh.noaa.gov/er/hq/Tp40s.htm, accessed 2-17-2004.
US EPA, 1983. Methods for chemical analysis of water and wastes, EPA-600/4 4-79-020.
United States Environmental Protection Agency, Cincinnati, Ohio.
US EPA, 1993. 40 CFR Part 503 – Standards for use and disposal of sewage sludge: final rule
federal register 58:9248-9415.
University of Georgia Institute of Ecology, 2004. Institute of ecology analytical chemistry lab
methods for soil chemical analysis. www.uga.edu/sisbl/ - Soil Analysis, date accessed, 2-
16-2004.
University of Georgia Soil, Plant and Water Analysis Lab, 2004. Soil, plant and water lab
methods reference/soil methods summary - analytical methods for soil chemical and
texture analysis. http://aesl.ces.uga.edu/publications/methods/stl-soil.html, date accessed,
2-16-2004.

112
Weather Channel. 2004. www.weather.com/weather/climatology/monthly/30602 date accessed,
4-17-2004.
Wischmeier, W.J.; D.D. Smith. 1978. Predicting Rainfall Erosion Loss – A Guide to
Conservation Planning, Agr. Handbook No. 537, Washington DC: USDA.

113
APPENDIX B
RESULTS AND DISCUSSION: VEGETATIVE GROWTH
Rapid vegetative establishment and permanent vegetative cover are perhaps the two most
important factors in controlling erosion and sedimentation. Each test plot was evaluated for
vegetative growth characteristics at the time of each simulated rainfall. Due to site construction,
there was no vegetation at the time of the first simulated rain event but there was significant
growth by the second and third rain events, at three months and one year after the start of the
experiment, respectively.
Each treatment, except the control, was seeded with Common Bermuda Grass (Cynodon
dactylon) at 3.7 kg/ha (20 lbs/acre) equivalent (specified by the GA Department of
Transportation) and was evaluated for: percent cover at three months and twelve months; number
of weed species and weed plants at three months and number of weed species and percent cover
of weeds at twelve months; and Bermuda grass, weed and total biomass at twelve months. It was
hypothesized that those treatments that established vegetation the quickest and fullest would be
more effective at controlling soil erosion as well as reducing potential nutrient loss in storm
runoff over time.

114
Percent Cover
Percent cover results for all treatments at three months were lower than expected due to
extreme drought conditions over the 3-mo time period (90.7 mm of rain). No supplemental
irrigation was used. After three months the poultry litter compost treatment had the highest
percent cover of vegetation followed closely by the yard waste compost (Table 3.1). There were
no significant differences in cover between the compost treatments. The bare soil control had the
lowest cover, as it was the only treatment that was not seeded, followed closely by the
hydroseeded treatments, as much of the seed washed of the plot during the first storm event.
There was no significant difference between the control and the hydroseeded treatments,
however the difference between these treatments and the compost treatments was statistically
significant. Any vegetative cover found in the control plots was presumed to be from weed
seeds blown-in from adjacent fields. Increased percent cover results from the compost
treatments may be due to their ability to hold moisture better than the hydroseeded or bare soil
treatments. This can be critical to plant growth during periods of drought as experienced during
the first three months of this study. Additionally, recent evidence indicates that plants grown in
highly weathered soils may rely more on easily soluble organic phosphorus (like that in compost)
rather than inorganic phosphorus (like that in the hydroseed), since soluble inorganic P can react
quickly with Fe and Al thus becoming insoluble and unavailable to plants.
After twelve months the biosolids compost had the highest percent cover, although it had
the lowest percent cover of the compost treatments at three months. Interestingly, while the yard
waste compost had nearly the highest percent cover at the three months it had the lowest after
twelve months, excluding the control. This may be due to the low nutrient content of the yard
waste compost. Both hydroseeded treatments improved remarkably from the three-month to the

115
twelve-month sampling period. This may be due to the ability of Bermuda grass to spread
rapidly over the soil surface, as it appeared that much of the hydroseed had washed down slope
after the first rain event. The bare soil control remained the treatment with the lowest percent
cover, although it did increase between the sampling periods. This was likely due to weed seeds
blowing into the test plots between sampling periods. After twelve months only the control was
significantly different from the remaining experimental treatments. There were no significant
differences among the rest of the treatments at this time period. Figure 2.1 compares the percent
cover of each treatment between the three-month and twelve-month sampling periods.
Table 3.1: Average percent cover by treatment at three months and twelve months, n=3.
Treatment 3 months SD 12 months SD
PLC/Mulch/Gypsum 64a 28 73a 22
Biosolids Compost 57a 6 86a 15
MSW Compost/Mulch 59a 20 72a 16
Yardwaste Compost 62a 19 68a 17
Hydroseed/Mulch Berm 22b 7 86a 2
Hydroseed/Silt Fence 22b 16 81a 20
Bare Soil (not seeded) 17b 14 24b 15
Treatments with same letter are not significantly different at α = 0.05 using Duncan’s Multiple
Range test.

116
020406080
100120
PLC BC MS YW HM HS BS
Treatment
% C
over
3 months 12 months
Figure 2.1: Comparison of average percent cover at three and twelve months by treatment, n =
3.
Number of Weed Species and Weed Plants
Weeds in compost blankets may aid in the control of erosion and sedimentation, however
from a product and marketing standpoint it can significantly devalue the compost product. It was
not determined whether the weeds that appeared in the composted treatments came from the
compost or were from seeds that blew in from the surrounding field. Some of the weeds from
these treatments were not identified in the surrounding field during the study period. The
hydroseeded treatments and MSW compost treatments had the least number of weed species,
while the yardwaste compost and control had the same number of weed species after three
months (Table 3.2). The biosolids compost had the highest level of weed species followed by
the poultry litter compost treatments. The increased levels of weed species in the biosolids and

117
poultry litter compost treatments could have been a function of the compost processing or
heightened nutrient levels in these composts that aided in weed species proliferation. The
biosolids compost was the only treatment that was statistically significant in the number of weed
species at three months.

118
Table 3.2: Average number of weed species per 0.093 m2 (1 ft2) by treatment at three months and twelve months and average number
of weed plants by treatment at three months (total plot) and percent cover of weed plants by treatment at twelve months, n=3.
Treatment Weed species,
3 mo
SD Weed species,
12 mo
SD Weed plants
(total #), 3 mo
SD Weed plants
(%), 12 mo
SD
PLC/Mulch/Gypsum < 1b 0 10ab 6 4bc 1 19b 10
Biosolids Compost < 1a 0 8ab 4 15a 4 43ab 6
MSW Compost/Mulch < 1b 0 12a 3 1c 1 28b 8
Yardwaste Compost < 1b 0 11a 5 4bc 2 21b 9
Hydroseed/Mulch Berm < 1b 0 10ab 2 0c 1 61a 27
Hydroseed/Silt Fence < 1b 0 8ab 3 0c 1 69a 24
Bare Soil (not seeded) < 1b 0 3b 4 6b 3 15b 13
Treatments with same letter are not significantly different at α = 0.05 using Duncan’s Multiple Range test.

119
After twelve months the control had the least number of weed species followed by the
hydroseeded treatments. The MSW compost had the highest level of weed species and the
biosolids compost had the lowest of the compost treatments followed by the poultry litter
compost. The number of weed species was significantly higher among the MSW compost and
yard waste compost compared to the control. This may provide evidence that the increased
quantities of weed species at three months in the biosolids and poultry litter composts were
originally from these treatments and did not blow in from the surrounding field. Figure 2.2
compares the number of weed species between treatments at twelve months.
0
5
10
15
20
PLC BC MS YW HM HS BS
Treatment
wee
ds/ 0
.093
m2
12 months
Figure 2.2: Average number of weed species per 0.093 m2 (1 ft2) by treatment at twelve months,
n = 3.
The total number of weed plants was also counted in each plot at three months (Table
3.2). The results were similar to the number of weed species per treatment. The hydroseeded
and MSW compost treatments had almost no weeds, while the biosolids compost had a
comparatively large number of weed plants. Interestingly, the control plot had the second

120
highest number of weeds per plot indicating that much of the weed growth was probably due to
blown-in weed seeds from the surrounding field. Statistically, the biosolids compost had the
greatest number of weeds per plot, followed by the control. While there were significant
differences between the biosolids compost, the control, and the remaining five treatments, there
was no significant difference among these remaining five treatments.
After twelve months, weeds had increased in number so high that determining the percent
cover of weeds was more feasible (Table 3.2). At this sampling period the hydroseeded
treatments had the greatest percent cover of weeds followed by the biosolids compost treatments.
Both hydroseeded treatments were significantly greater than the control and most of the compost
treatments. The poultry litter compost and yard waste compost had the lowest percent cover of
weeds among the compost treatments, however the control had the lowest of any treatment. The
results show that the majority of weed growth was probably due to blown-in weed seeds from the
adjacent fields, particularly because of the increase in weeds from the three to twelve month
sampling periods in the hydroseeded and the control treatments; however, the consistently high
results reported from the biosolids compost treatment probably signify that some weed seeds
were brought in with the compost. Figure 2.3 compares the number of weed plants at three
months and the percent cover of weed plants at twelve months between treatments.
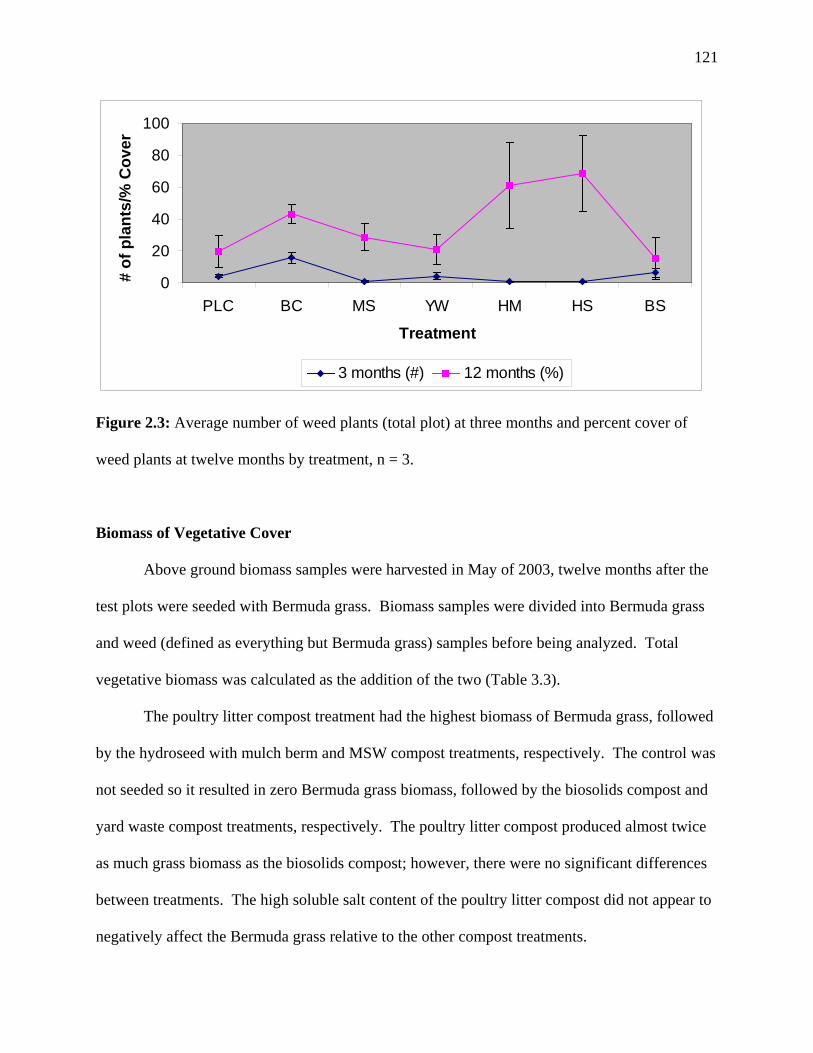
121
0
20
40
60
80
100
PLC BC MS YW HM HS BS
Treatment
# of
pla
nts/
% C
over
3 months (#) 12 months (%)
Figure 2.3: Average number of weed plants (total plot) at three months and percent cover of
weed plants at twelve months by treatment, n = 3.
Biomass of Vegetative Cover
Above ground biomass samples were harvested in May of 2003, twelve months after the
test plots were seeded with Bermuda grass. Biomass samples were divided into Bermuda grass
and weed (defined as everything but Bermuda grass) samples before being analyzed. Total
vegetative biomass was calculated as the addition of the two (Table 3.3).
The poultry litter compost treatment had the highest biomass of Bermuda grass, followed
by the hydroseed with mulch berm and MSW compost treatments, respectively. The control was
not seeded so it resulted in zero Bermuda grass biomass, followed by the biosolids compost and
yard waste compost treatments, respectively. The poultry litter compost produced almost twice
as much grass biomass as the biosolids compost; however, there were no significant differences
between treatments. The high soluble salt content of the poultry litter compost did not appear to
negatively affect the Bermuda grass relative to the other compost treatments.
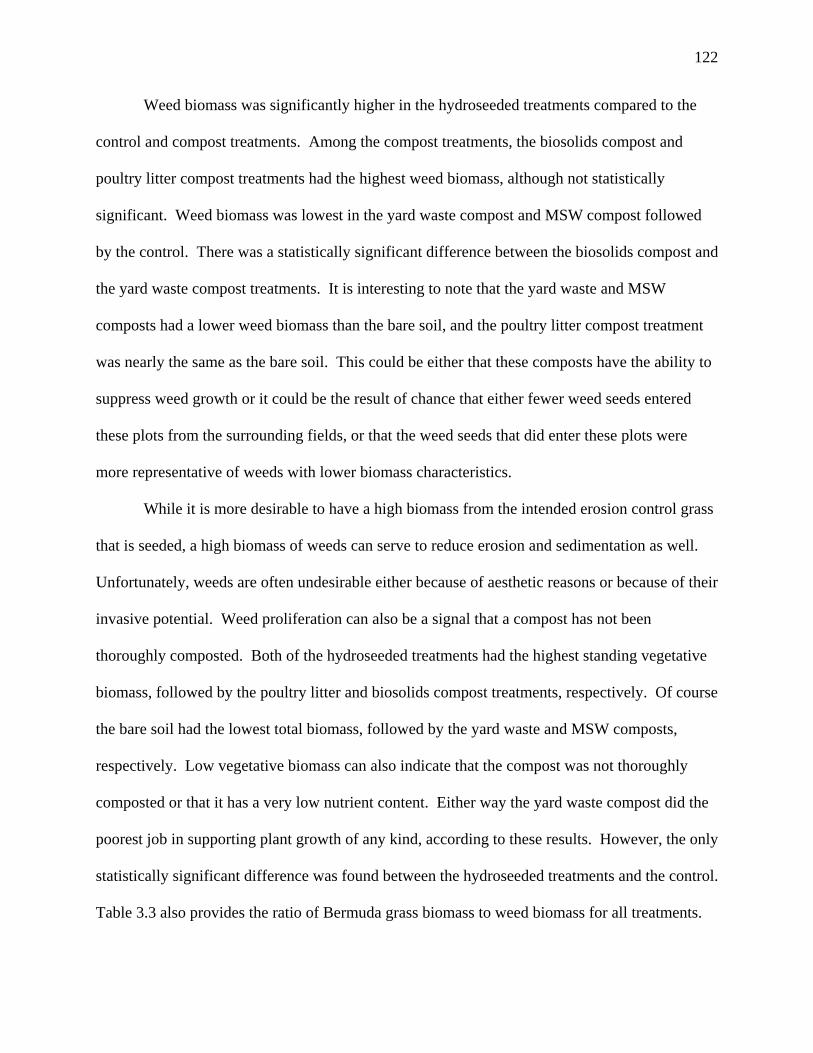
122
Weed biomass was significantly higher in the hydroseeded treatments compared to the
control and compost treatments. Among the compost treatments, the biosolids compost and
poultry litter compost treatments had the highest weed biomass, although not statistically
significant. Weed biomass was lowest in the yard waste compost and MSW compost followed
by the control. There was a statistically significant difference between the biosolids compost and
the yard waste compost treatments. It is interesting to note that the yard waste and MSW
composts had a lower weed biomass than the bare soil, and the poultry litter compost treatment
was nearly the same as the bare soil. This could be either that these composts have the ability to
suppress weed growth or it could be the result of chance that either fewer weed seeds entered
these plots from the surrounding fields, or that the weed seeds that did enter these plots were
more representative of weeds with lower biomass characteristics.
While it is more desirable to have a high biomass from the intended erosion control grass
that is seeded, a high biomass of weeds can serve to reduce erosion and sedimentation as well.
Unfortunately, weeds are often undesirable either because of aesthetic reasons or because of their
invasive potential. Weed proliferation can also be a signal that a compost has not been
thoroughly composted. Both of the hydroseeded treatments had the highest standing vegetative
biomass, followed by the poultry litter and biosolids compost treatments, respectively. Of course
the bare soil had the lowest total biomass, followed by the yard waste and MSW composts,
respectively. Low vegetative biomass can also indicate that the compost was not thoroughly
composted or that it has a very low nutrient content. Either way the yard waste compost did the
poorest job in supporting plant growth of any kind, according to these results. However, the only
statistically significant difference was found between the hydroseeded treatments and the control.
Table 3.3 also provides the ratio of Bermuda grass biomass to weed biomass for all treatments.

123
The yard waste compost and poultry litter compost have the highest ratios, respectively. The
hydroseeded treatments had the lowest ratios, followed by the biosolids compost, all three had
ratios below one.
Table 3.3: Average biomass of Bermuda grass, weed, and total vegetation in g/m2 (10.8 ft2) and
ratio of average Bermuda grass biomass to average weed biomass by treatment at 12 months,
n=3.
Treatment Bermuda SD Weed SD Total SD Bermuda:weed
PLC/Mulch/Gypsum 244a 230.2 80.6bc 25.0 324.6ab 206.3 3.03:1
Biosolids Compost 128.5a 111.4 168.9b 74 297.4ab 173.1 0.76:1
MSW
Compost/Mulch
191.5a 256.9 65.1bc 10.7 256.6ab 247.1 2.94:1
Yardwaste Compost 148a 139.0 43.2c 13.1 191.2ab 149.5 3.43:1
Hydroseed/Mulch
Berm
199.5a 69.8 286a 71.4 485.5a 32.2 0.70:1
Hydroseed/Silt Fence 158.8a 105.7 287a 78.7 445.7a 27.4 0.55:1
Bare Soil (not seeded) 0a 0 76.7bc 63 76.7b 63 0
Treatments with same letter are not significantly different at α = 0.05 using Duncan’s Multiple
Range test.
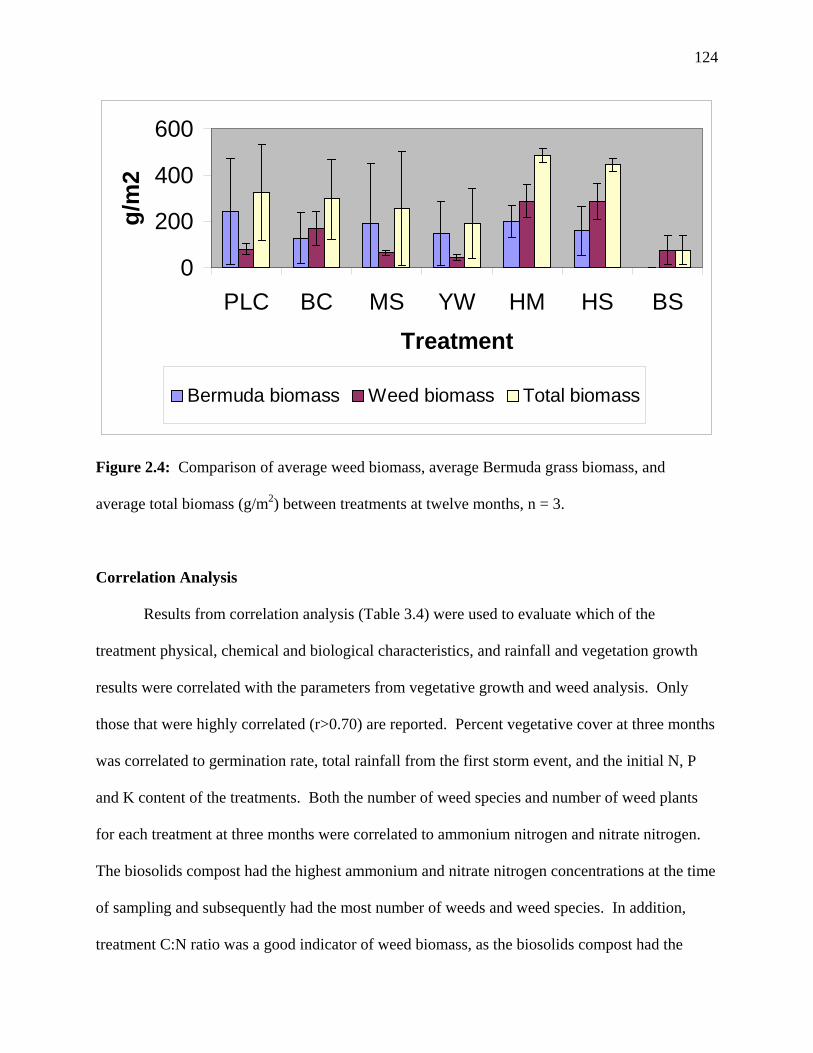
124
0
200
400
600
PLC BC MS YW HM HS BS
Treatment
g/m
2
Bermuda biomass Weed biomass Total biomass
Figure 2.4: Comparison of average weed biomass, average Bermuda grass biomass, and
average total biomass (g/m2) between treatments at twelve months, n = 3.
Correlation Analysis
Results from correlation analysis (Table 3.4) were used to evaluate which of the
treatment physical, chemical and biological characteristics, and rainfall and vegetation growth
results were correlated with the parameters from vegetative growth and weed analysis. Only
those that were highly correlated (r>0.70) are reported. Percent vegetative cover at three months
was correlated to germination rate, total rainfall from the first storm event, and the initial N, P
and K content of the treatments. Both the number of weed species and number of weed plants
for each treatment at three months were correlated to ammonium nitrogen and nitrate nitrogen.
The biosolids compost had the highest ammonium and nitrate nitrogen concentrations at the time
of sampling and subsequently had the most number of weeds and weed species. In addition,
treatment C:N ratio was a good indicator of weed biomass, as the biosolids compost had the

125
lowest (narrowest) C:N ratio and the highest weed biomass of the compost treatments. Weed
biomass and total biomass at twelve months were good indicators of weed cover at twelve
months, as the hydroseeded treatments led in all three categories. Consequently, weed cover and
total biomass at twelve months were good indicators of weed biomass.
Table 3.4: Results from correlation analysis. This table lists all variables with significant
correlation (r>0.70, α = 0.05, n = 21).
Response Variable Independent Variable (treatment) with Correlation Coefficient
Vegetative cover at 3 months Germination rate (0.71), K (0.71), rainfall amount from 1st storm
(0.70), N (0.69), compost - P (0.68)
# of weed species at 3 months NH4 (0.81), NO3 (0.82), # of weed plants (0.92)
# of weed plants at 3 months NH4 (0.84), NO3 (0.85), # of weed species (0.94) Weed cover at 12 months Weed biomass at 12 months (0.81), total biomass at 12 months (0.72)
Weed biomass at 12 months C:N ratio (0.78), weed cover at 12 months (0.87), total biomass at 12
months (0.76)
Summary and Conclusion
Based on this study and under these environmental conditions, compost did better than
hydroseeding and bare soil at providing a quick vegetative cover. However, in the long term
hydroseeding may be a better option. The caveat was that the better long term performance of
the hydroseeding was due to the invasion of weeds, not the intended vegetation. From a practical
standpoint, to control erosion this is a good result, but from an industry or commercial standpoint
this may be undesirable. Additionally, this may provide evidence that some composts can
suppress the growth of weeds when compared to hydroseeding. It should also be noted that
wherever vegetation has not been established by hydroseeding, soil erosion will continue to
occur and potentially get worse over time; unlike compost which still covers the soil surface in
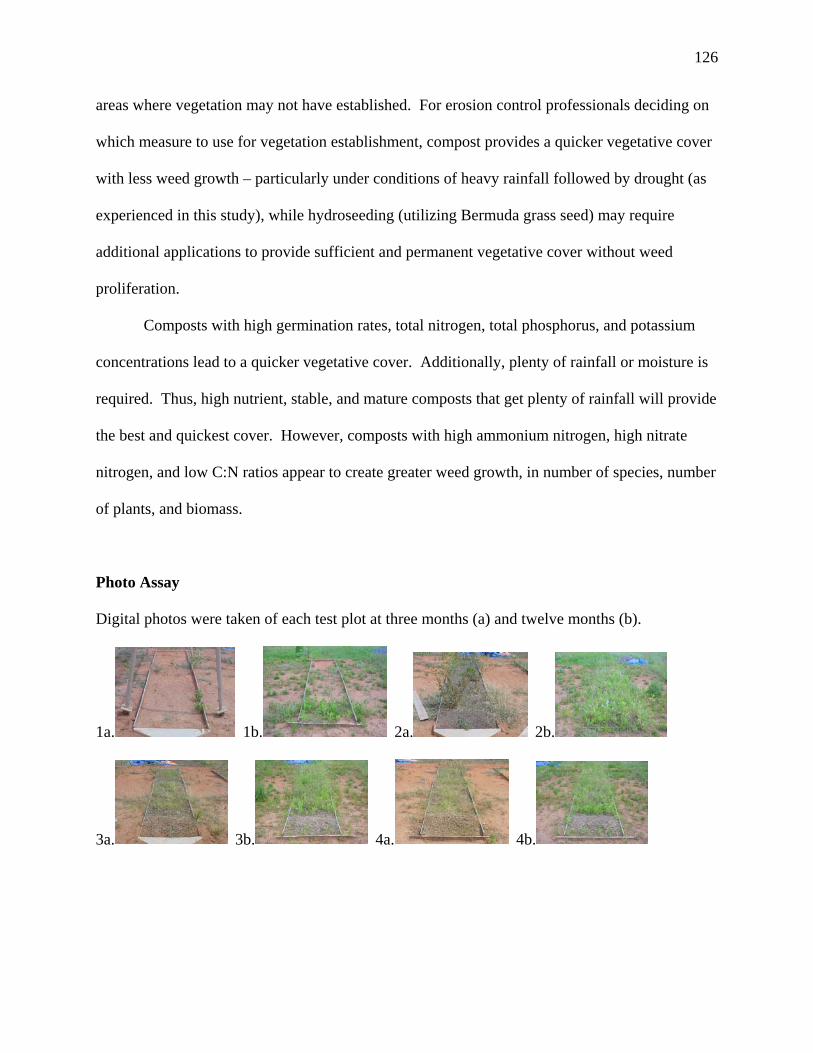
126
areas where vegetation may not have established. For erosion control professionals deciding on
which measure to use for vegetation establishment, compost provides a quicker vegetative cover
with less weed growth – particularly under conditions of heavy rainfall followed by drought (as
experienced in this study), while hydroseeding (utilizing Bermuda grass seed) may require
additional applications to provide sufficient and permanent vegetative cover without weed
proliferation.
Composts with high germination rates, total nitrogen, total phosphorus, and potassium
concentrations lead to a quicker vegetative cover. Additionally, plenty of rainfall or moisture is
required. Thus, high nutrient, stable, and mature composts that get plenty of rainfall will provide
the best and quickest cover. However, composts with high ammonium nitrogen, high nitrate
nitrogen, and low C:N ratios appear to create greater weed growth, in number of species, number
of plants, and biomass.
Photo Assay
Digital photos were taken of each test plot at three months (a) and twelve months (b).
1a. 1b. 2a. 2b.
3a. 3b. 4a. 4b.

127
5a. 5b. 6a. 6b.
7a. 7b. 8a. 8b.
9a. 9b. 10a. 10b.
11a. 11b. 12a. 12b.
13a. 13b. 14a. 14b.
15a. 15b. 16a. 16b.
17a. 17b. 18a. 18b.

128
19a. 19b. 20a. 20b.
21a. 21b.
Test Plot
Number
Treatment
1 Bare soil (control)
2 Biosolids compost blanket and filter berm
3 Poultry litter compost/mulch/gypsum blanket w/ mulch filter berm
4 Yardwaste compost blanket and filter berm
5 Hydroseed and silt fence
6 Bare soil (control)
7 Hydroseed and mulch filter berm
8 MSW compost/mulch blanket w/ mulch filter berm
9 Poultry litter compost/mulch/gypsum blanket w/ mulch filter berm
10 Biosolids compost blanket and filter berm
11 Hydroseed and silt fence
12 MSW compost/mulch blanket w/ mulch filter berm
13 Bare soil (control)
14 Hydroseed and mulch filter berm
15 MSW compost/mulch blanket w/ mulch filter berm
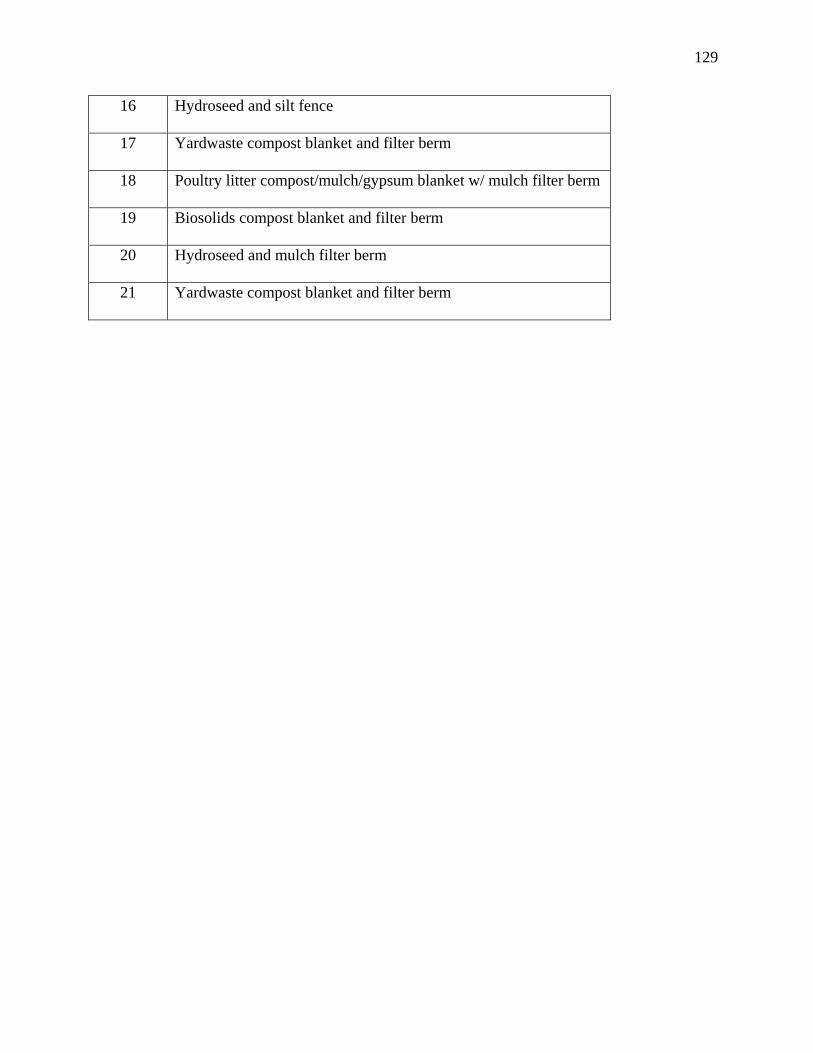
129
16 Hydroseed and silt fence
17 Yardwaste compost blanket and filter berm
18 Poultry litter compost/mulch/gypsum blanket w/ mulch filter berm
19 Biosolids compost blanket and filter berm
20 Hydroseed and mulch filter berm
21 Yardwaste compost blanket and filter berm

130
APPENDIX C
RESULTS AND DISCUSSION: STORM WATER RUNOFF AND SOLIDS LOSS
Storm Water Runoff
Few erosion and sediment control measures employed by the industry today work to
decrease storm water runoff. If storm water runoff can be reduced or even eliminated through
infiltration and/or increased water holding capacity of soils or soil covers, then erosion and
sedimentation may be reduced and/or eliminated.
Three simulated storm events were conducted for each plot; at the time materials were
applied (no vegetation), three months (vegetation established), and twelve months (vegetation
matured). Each test plot was exposed to a simulated storm event, for one-hour duration, at a rate
approximate to the 50-year/1 hour storm event for Athens, Georgia. Municipal tap water was
used in the study. The water was monitored and tested for NO3-N (0.673 mg L-1) and P04-P
(0.093 mg L-1) contents prior to use in the study. Runoff was collected at the base of each plot as
soon as runoff began to trickle from the installed flume. Parameters measured included: rainfall
amount, antecedent soil water, time until start of runoff, time until steady state of runoff, runoff
volume, and runoff rate. Rainfall infiltration and rainfall infiltration to runoff ratio were
calculated from the results. See Materials and Methods for more information.

131
Average Rainfall and Soil Water
Actual rainfall amounts for each simulated storm event and the antecedent water content
of the soil (Table 4.1) can have a profound effect on storm water runoff and varied considerably
in this study. These differences can have significant effects on total runoff, runoff rate, time
until start and steady state of runoff, infiltration rate, and sediment and nutrient concentrations
and loads in the runoff.
Due to variability from the rainfall simulator, average rainfall totals from the first storm
event ranged from a high of 97 mm (3.87 in) applied to the yardwaste compost treatments to a
low of 73 mm (2.93 in) applied to the control (bare soil). The second storm event had an average
total rainfall high of 89 mm (3.57 in) applied to the hydroseed with mulch berm treatment and a
low of 77 mm (3.09 in) applied to the yard waste compost treatment. The final storm event had
the lowest overall average totals for the three storm events. The yardwaste compost had the
highest average total of 76 mm (3.03 in) and the control had the lowest at 58 mm (2.32 in). The
yard waste compost did receive significantly greater rainfall than the control, poultry litter
compost and hydroseed with silt fence treatments. There was an overall 39 mm (1.55 in)
difference between the lowest and the highest average total rainfall amounts among treatments
and between storm events. Variability from the rainfall simulator was caused by minor pump
(from the tanker truck) and control box wiring malfunctions. No attempt was made to correct for
differences in rainfall.
Average antecedent soil water content during the first storm event ranged from a high of
0.148 g g-1 underneath the yardwaste compost to a low of 0.109 g g-1 under the biosolids
compost treatment. No data were collected on soil water for the hydroseeded treatments. No
antecedent soil water contents were analyzed during the second storm event. Nearly all

132
experimental plots were at saturated conditions during the final storm event due to natural rain
events (102.4 mm one week prior to rain simulations, and 35.8 mm during the week of rain
simulations). Variation during the final storm event ranged from a high of 0.411 g g-1 under the
yardwaste compost treatment to a low of 0.296 g g-1 under the hydroseed with silt fence
treatment. This may indicate that composts have a greater ability to hold water than hydroseed,
even after one year. The poultry litter compost, biosolids compost and MSW compost had
significantly greater antecedent soil water content than that of the control. There was a 0.302 g
g-1 difference in antecedent water content between the lowest and the highest treatments between
the first and final storm event. Figure 3.1 compares rainfall totals and antecedent soil water for
each treatment and storm event.
Table 4.1: Total rainfall amount (mm) and antecedent soil water content (g g-1) measured by
treatment at day one, three months and twelve months, n=3.
DAY ONE THREE MONTHS TWELVE MONTHS
Treatment AVG
rainfall
SD AVG soil
water content
AVG
rainfall
SD AVG
rainfall
SD AVG soil
water content
PLC/Mulch/Gypsum 87a 16.1 0.123a 79a 4.6 64b 4.9 .367a
Biosolids Compost 83a 17.0 0.109a 78a 3.8 66ab 4.3 .354a
MSW
Compost/Mulch
83a 17.3 0.132a 81a 2.1 67ab 2.0 .346a
Yardwaste Compost 97a 12.8 0.148a 77a 3.1 76a 10.6 .411ab
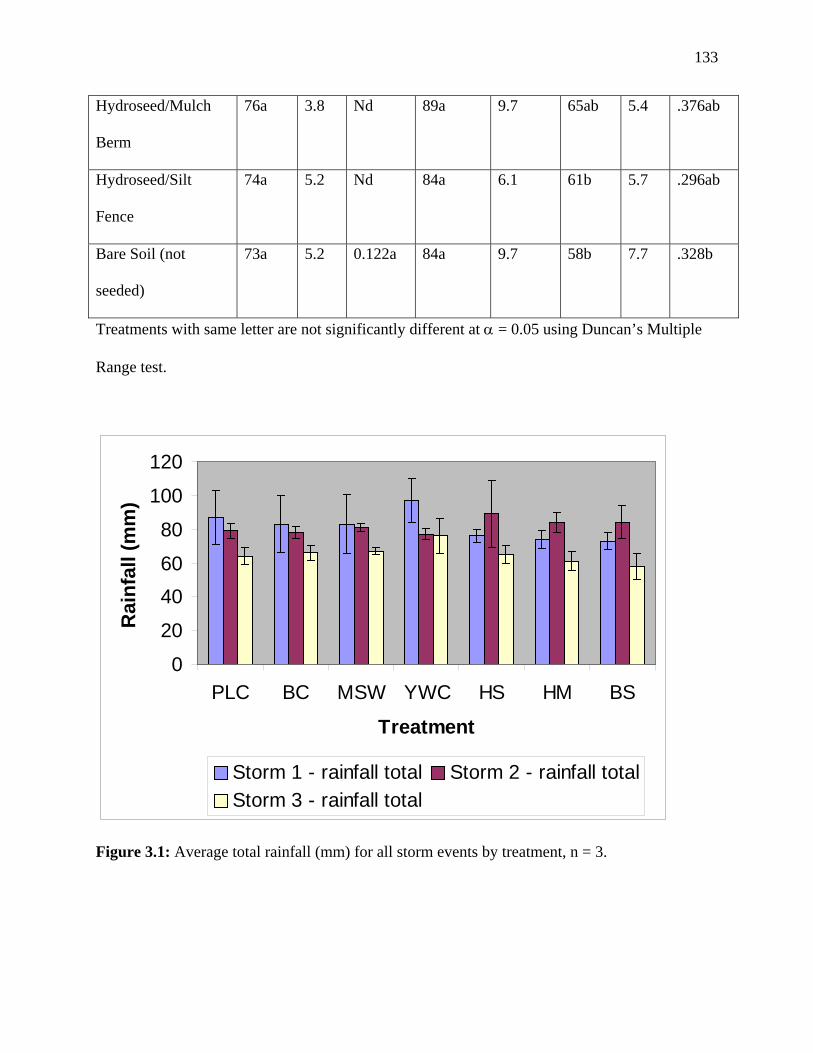
133
Hydroseed/Mulch
Berm
76a 3.8 Nd 89a 9.7 65ab 5.4 .376ab
Hydroseed/Silt
Fence
74a 5.2 Nd 84a 6.1 61b 5.7 .296ab
Bare Soil (not
seeded)
73a 5.2 0.122a 84a 9.7 58b 7.7 .328b
Treatments with same letter are not significantly different at α = 0.05 using Duncan’s Multiple
Range test.
0
20
4060
80
100
120
PLC BC MSW YWC HS HM BS
Treatment
Rai
nfal
l (m
m)
Storm 1 - rainfall total Storm 2 - rainfall totalStorm 3 - rainfall total
Figure 3.1: Average total rainfall (mm) for all storm events by treatment, n = 3.

134
Rainfall Distribution Pattern
Rainfall distribution can have an effect on runoff patterns and erosion potential. The
rainfall distribution produced by the rainfall simulator was extremely variable. Results from
distribution pattern analysis show that much of the rainfall was concentrated in the middle
column of the test plots, while the left side of the plots received slightly more than the right side
(Figure 3.2, 3.3, 3.4). This may have created a concentrated flow in the middle column of the
plot, creating a greater likelihood for erosion in this area. The rainfall distribution pattern was
calculated by averaging the difference from each rain gage from the average rainfall for the
entire test plot, for all 21 test plots for each storm event.
topleft side
right side-30
-20
-10
0
10
20
30
rainfall (mm)
left side middle right side
Figure 3.2: Rainfall distribution, average recorded difference of plot location from total plot
average for first storm event, n = 21.

135
top left sidemiddle
right side-20
-10
0
10
20
30
rainfall (mm)
rows
left side middle right side
Figure 3.2: Rainfall distribution, average recorded difference of plot location from total plot
average for second storm event, n = 21.
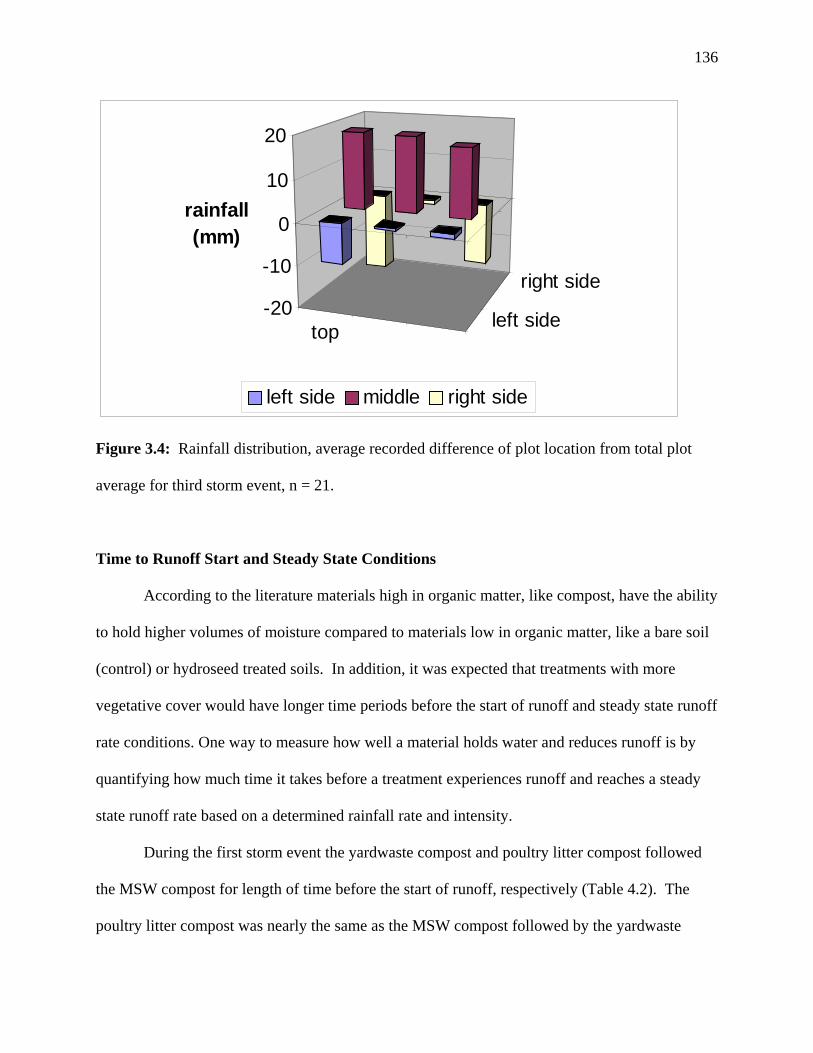
136
top left side
right side-20
-10
0
10
20
rainfall (mm)
left side middle right side
Figure 3.4: Rainfall distribution, average recorded difference of plot location from total plot
average for third storm event, n = 21.
Time to Runoff Start and Steady State Conditions
According to the literature materials high in organic matter, like compost, have the ability
to hold higher volumes of moisture compared to materials low in organic matter, like a bare soil
(control) or hydroseed treated soils. In addition, it was expected that treatments with more
vegetative cover would have longer time periods before the start of runoff and steady state runoff
rate conditions. One way to measure how well a material holds water and reduces runoff is by
quantifying how much time it takes before a treatment experiences runoff and reaches a steady
state runoff rate based on a determined rainfall rate and intensity.
During the first storm event the yardwaste compost and poultry litter compost followed
the MSW compost for length of time before the start of runoff, respectively (Table 4.2). The
poultry litter compost was nearly the same as the MSW compost followed by the yardwaste
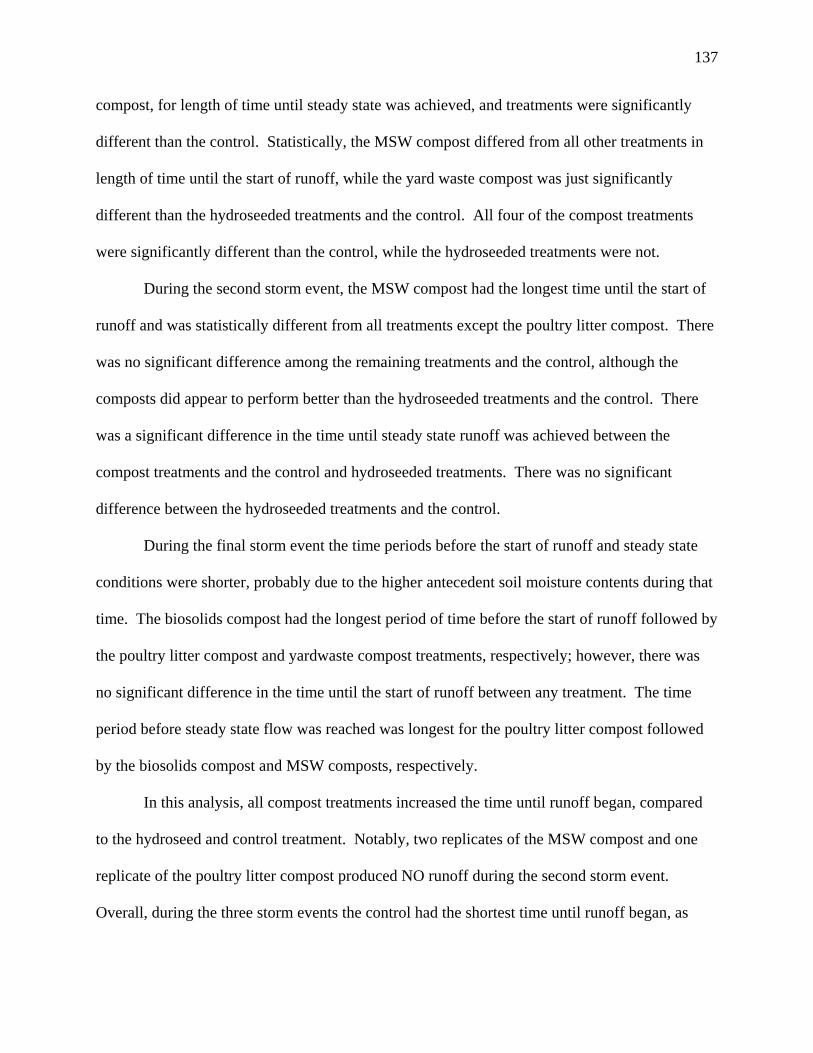
137
compost, for length of time until steady state was achieved, and treatments were significantly
different than the control. Statistically, the MSW compost differed from all other treatments in
length of time until the start of runoff, while the yard waste compost was just significantly
different than the hydroseeded treatments and the control. All four of the compost treatments
were significantly different than the control, while the hydroseeded treatments were not.
During the second storm event, the MSW compost had the longest time until the start of
runoff and was statistically different from all treatments except the poultry litter compost. There
was no significant difference among the remaining treatments and the control, although the
composts did appear to perform better than the hydroseeded treatments and the control. There
was a significant difference in the time until steady state runoff was achieved between the
compost treatments and the control and hydroseeded treatments. There was no significant
difference between the hydroseeded treatments and the control.
During the final storm event the time periods before the start of runoff and steady state
conditions were shorter, probably due to the higher antecedent soil moisture contents during that
time. The biosolids compost had the longest period of time before the start of runoff followed by
the poultry litter compost and yardwaste compost treatments, respectively; however, there was
no significant difference in the time until the start of runoff between any treatment. The time
period before steady state flow was reached was longest for the poultry litter compost followed
by the biosolids compost and MSW composts, respectively.
In this analysis, all compost treatments increased the time until runoff began, compared
to the hydroseed and control treatment. Notably, two replicates of the MSW compost and one
replicate of the poultry litter compost produced NO runoff during the second storm event.
Overall, during the three storm events the control had the shortest time until runoff began, as

138
quick as 2.7 minutes, and the shortest times until the runoff reached a steady state, as quick as
9.3 minutes. The hydroseed treatments had the next shortest times after the control, as the
hydroseed with mulch treatment performed slightly better than the hydroseed with silt fence
treatment during the first and second storm events. This was probably due to the mulch filter
berm’s increased ability to hold water or slow down the flow of runoff. Of the four compost
treatments the MSW compost had the longest time period before the start of runoff, as long as 51
min, and steady state for the first and second storm events. The longer an erosion control tool
can prevent runoff from occurring and/or eventually reaching its maximum flow (steady state)
the less likely there will be erosion and solids loss from that area. Figure 3.5 compares the time
before the start of runoff and steady state flow between treatments and storm events.
Table 4.2: Average time (minutes) until start of runoff and steady state conditions by treatment
at day one, three moths, and twelve months, n=3.
DAY ONE THREE MONTHS TWELVE MONTHS
Treatment RO Start RO
Steady
state
RO Start RO
Steady
state
RO Start RO
Steady
state
PLC/Mulch/Gypsum 12.0bc 40.3a 41.0ab 55.3a 21a 44.3ab
Biosolids Compost 8.3bcd 26.7ab 32.7b 56.0a 23.7a 40.3a
MSW
Compost/Mulch
20.0a 40.0a 51.7a >60.0a 14.3a 37.7ab
Yardwaste Compost 13.0b 31.3ab 33.3b 54.0a 14.7a 34.7ab

139
Hydroseed/Mulch
Berm
7.3cde 25.7ab 14.3b 31.0b 9.0a 27.3ab
Hydroseed/Silt fence 6.0de 22.7ab 8.0b 19.7b 10.3a 33.7ab
Bare Soil (not
seeded)
2.7e 9.3c 6.3b 19.7b 3.7a 18.7b
Treatments with same letter are not significantly different at α = 0.05 using Duncan’s Multiple
Range test.
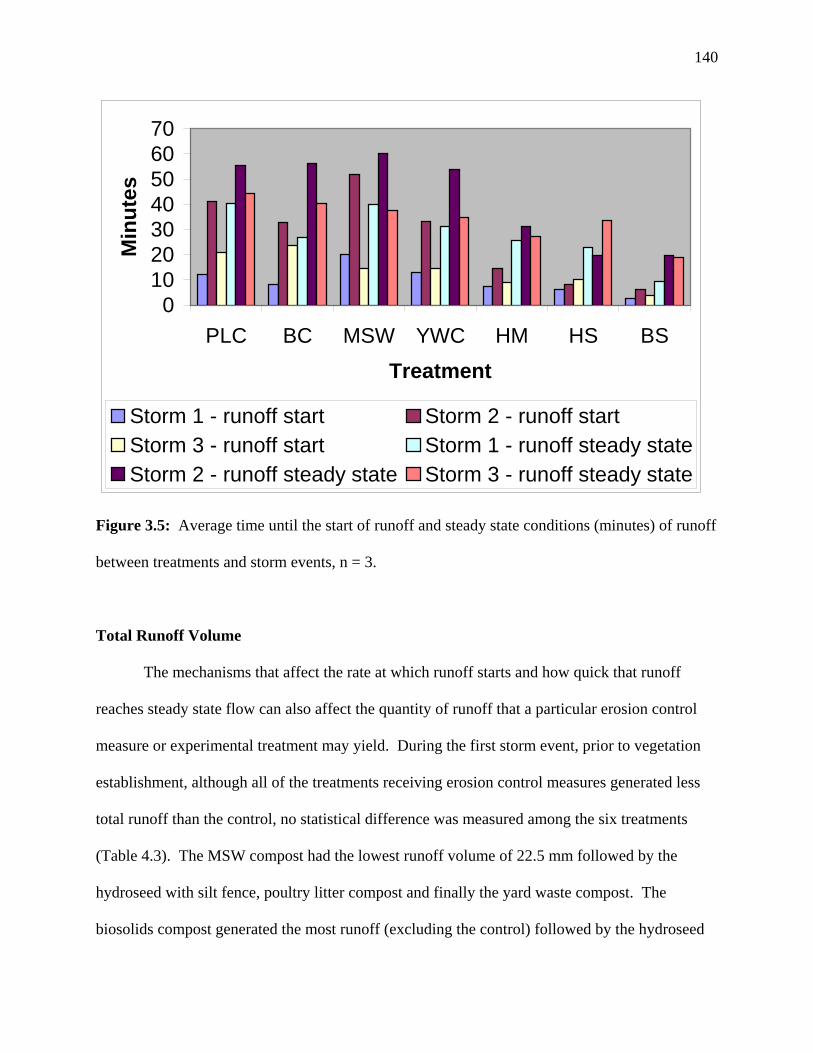
140
010203040506070
PLC BC MSW YWC HM HS BSTreatment
Min
utes
Storm 1 - runoff start Storm 2 - runoff startStorm 3 - runoff start Storm 1 - runoff steady stateStorm 2 - runoff steady state Storm 3 - runoff steady state
Figure 3.5: Average time until the start of runoff and steady state conditions (minutes) of runoff
between treatments and storm events, n = 3.
Total Runoff Volume
The mechanisms that affect the rate at which runoff starts and how quick that runoff
reaches steady state flow can also affect the quantity of runoff that a particular erosion control
measure or experimental treatment may yield. During the first storm event, prior to vegetation
establishment, although all of the treatments receiving erosion control measures generated less
total runoff than the control, no statistical difference was measured among the six treatments
(Table 4.3). The MSW compost had the lowest runoff volume of 22.5 mm followed by the
hydroseed with silt fence, poultry litter compost and finally the yard waste compost. The
biosolids compost generated the most runoff (excluding the control) followed by the hydroseed

141
with mulch berm treatment (Figure 3.6). Compared to the control the MSW compost generated
47% less runoff, the hydroseed with silt fence generated 29% less runoff, the poultry litter
compost produced 24% less, the yard waste compost produced 22% less, the hydroseed with
mulch berm generated 13% less and the biosolids compost generated 10% less runoff.
Statistically, the MSW compost was the only treatment that generated significantly less runoff
than the control. All other treatments were statistically similar. It should be noted that
difficulties were experienced collecting runoff during the first storm event with the silt fence
treatment because it produced a damming effect, this may have reduced total runoff volumes in
this treatment.
During the second storm event, as vegetation was beginning to establish, total runoff
volumes plummeted in five of the treatments, while runoff volumes in the hydroseed with silt
fence and control treatments showed small increases. It should be noted that during the three-
month mid-summer period, between the first and second storm events, only 90.7 mm (3.57) of
natural rainfall was recorded, with only 6.9 mm (0.27 in) recorded in the third month. This
likely affected the water content of the treatments and soil. The unexpected increase in runoff
from the hydroseed with silt fence treatment could be due to the sampling error from the first
storm event, which may have produced artificially low runoff volumes. The increase could also
be the result of soil surface crusting from the previous storm event. It should also be noted that
two of the MSW compost treatments and one of the poultry litter compost treatments generated
no runoff during the second storm. Statistically, the control generated more runoff than all
treatments, except the hydroseed with silt fence, which also generated significantly more runoff
than the compost treatments.
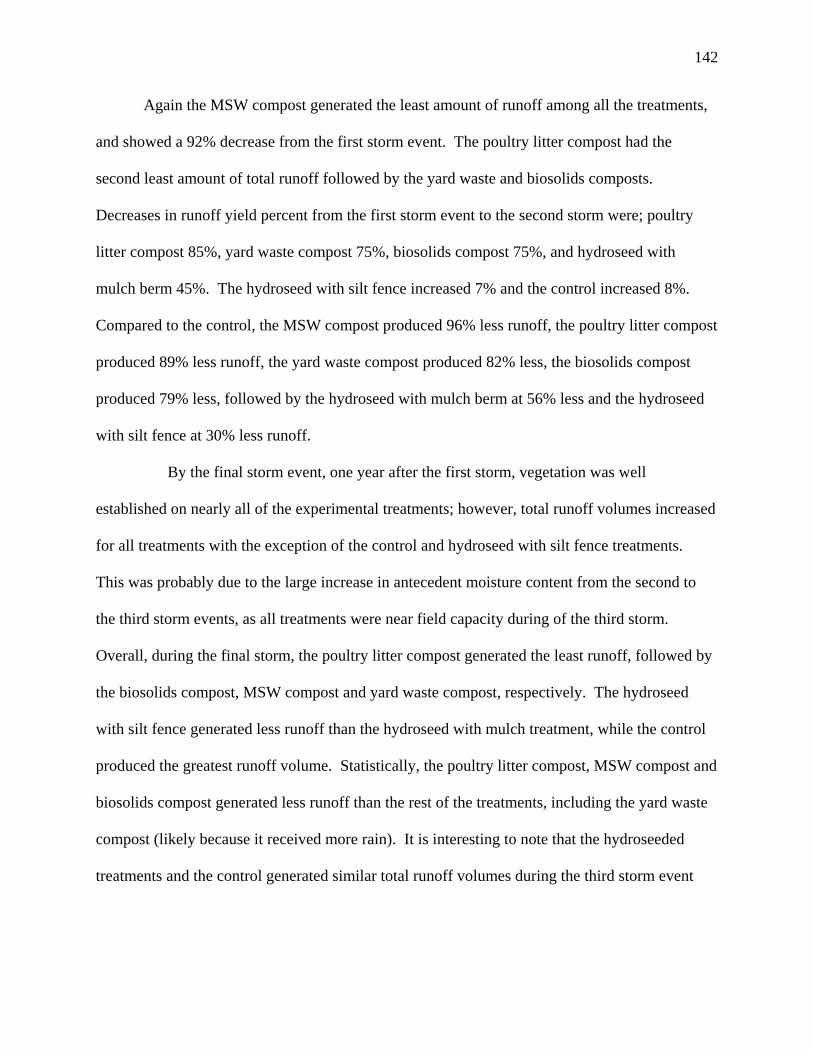
142
Again the MSW compost generated the least amount of runoff among all the treatments,
and showed a 92% decrease from the first storm event. The poultry litter compost had the
second least amount of total runoff followed by the yard waste and biosolids composts.
Decreases in runoff yield percent from the first storm event to the second storm were; poultry
litter compost 85%, yard waste compost 75%, biosolids compost 75%, and hydroseed with
mulch berm 45%. The hydroseed with silt fence increased 7% and the control increased 8%.
Compared to the control, the MSW compost produced 96% less runoff, the poultry litter compost
produced 89% less runoff, the yard waste compost produced 82% less, the biosolids compost
produced 79% less, followed by the hydroseed with mulch berm at 56% less and the hydroseed
with silt fence at 30% less runoff.
By the final storm event, one year after the first storm, vegetation was well
established on nearly all of the experimental treatments; however, total runoff volumes increased
for all treatments with the exception of the control and hydroseed with silt fence treatments.
This was probably due to the large increase in antecedent moisture content from the second to
the third storm events, as all treatments were near field capacity during of the third storm.
Overall, during the final storm, the poultry litter compost generated the least runoff, followed by
the biosolids compost, MSW compost and yard waste compost, respectively. The hydroseed
with silt fence generated less runoff than the hydroseed with mulch treatment, while the control
produced the greatest runoff volume. Statistically, the poultry litter compost, MSW compost and
biosolids compost generated less runoff than the rest of the treatments, including the yard waste
compost (likely because it received more rain). It is interesting to note that the hydroseeded
treatments and the control generated similar total runoff volumes during the third storm event

143
and the first storm event, even though the hydroseeded treatments had a vegetative cover by the
final storm.
Table 4.3: Total runoff volume (mm) by treatment at day one, three months, and twelve months,
n=3.
DAY ONE THREE MONTHS TWELVE MONTHS
Treatment AVG SD AVG SD AVG SD
PLC/Mulch/Gypsum 32.0ab 12.7 5.0c 4.9 15.9c 7.0
Biosolids Compost 38.1ab 7.9 9.6c 6.9 21.6bc 17.0
MSW
Compost/Mulch
22.5b 13.1 1.8c Nd 21.9bc 2.2
Yardwaste Compost 33.0ab 5.6 8.1c 4.1 25.0abc 7.0
Hydroseed/Mulch
Berm
36.7ab 5.8 20.2bc 2.4 34.2ab 9.9
Hydroseed/Silt
Fence
30.0ab 11.6 32.3ab 28.3 27.6abc 5.1
Bare Soil (not
seeded)
42.3a 5.6 45.9a 20.6 40.8a 8.9
Treatments with same letter are not significantly different at α = 0.05 using Duncan’s Multiple
Range test.
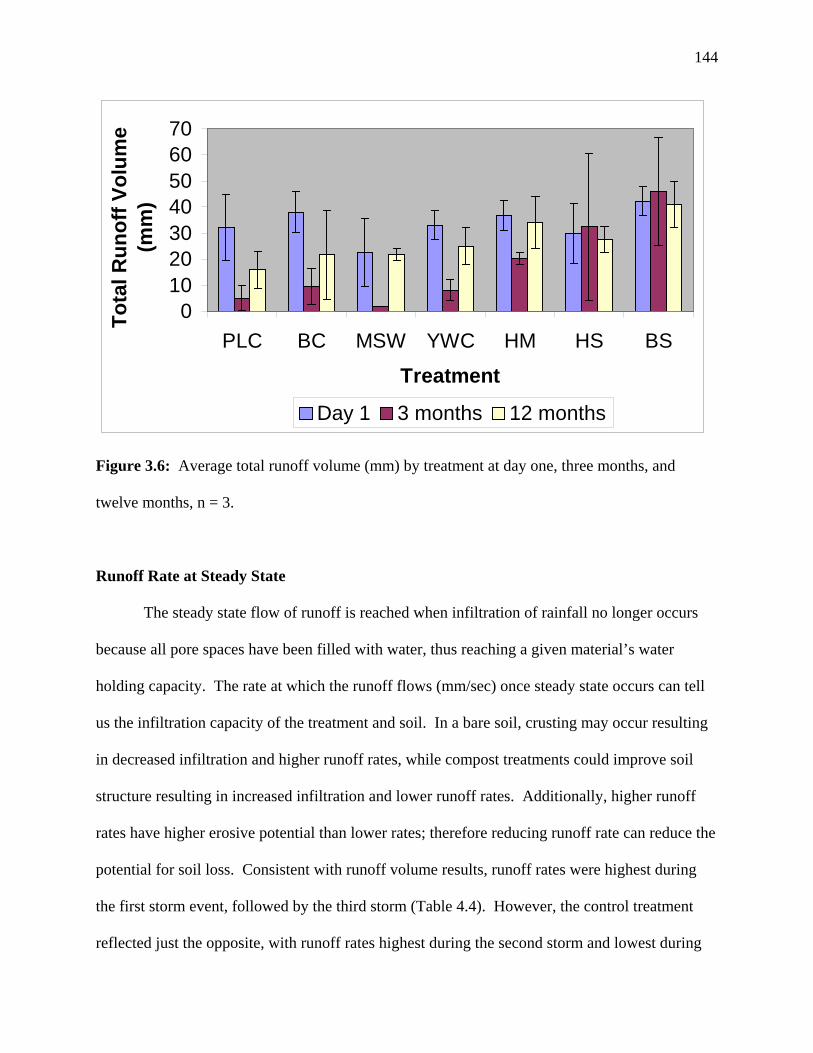
144
010203040506070
PLC BC MSW YWC HM HS BS
Treatment
Tota
l Run
off V
olum
e (m
m)
Day 1 3 months 12 months
Figure 3.6: Average total runoff volume (mm) by treatment at day one, three months, and
twelve months, n = 3.
Runoff Rate at Steady State
The steady state flow of runoff is reached when infiltration of rainfall no longer occurs
because all pore spaces have been filled with water, thus reaching a given material’s water
holding capacity. The rate at which the runoff flows (mm/sec) once steady state occurs can tell
us the infiltration capacity of the treatment and soil. In a bare soil, crusting may occur resulting
in decreased infiltration and higher runoff rates, while compost treatments could improve soil
structure resulting in increased infiltration and lower runoff rates. Additionally, higher runoff
rates have higher erosive potential than lower rates; therefore reducing runoff rate can reduce the
potential for soil loss. Consistent with runoff volume results, runoff rates were highest during
the first storm event, followed by the third storm (Table 4.4). However, the control treatment
reflected just the opposite, with runoff rates highest during the second storm and lowest during

145
the first storm event (Figure 3.7), this was likely the result of soil crusting during the second
storm event.
During the first storm event the hydroseed with silt fence had the lowest runoff rate
(probably because of the damming effect created by the silt fence), followed by the MSW
compost, the control, the hydroseed with mulch, the poultry litter compost, the yard waste
compost and finally the biosolids compost. It should be noted that this may not be reflective of
what is actually happening across the soil surface where the runoff is occurring, since samples
were taken after passing through the silt fence and filter berms.
By the second storm the order had shifted dramatically, as all of the composts had lower
runoff rates than the hydroseeded treatments, and all six treatments utilizing erosion control
measures had lower rates than the control. The MSW compost had the lowest runoff rate,
followed by the poultry litter compost, the biosolids compost, and yard waste compost, the
hydroseed with silt fence, the hydroseed with mulch berm, and the control, respectively.
Statistically, the MSW compost, poultry litter compost and biosolids compost had lower runoff
rates than the control. This was partly influenced by the lack of two replicates of the MSW
compost and one replicate of the poultry litter compost to reach a steady state runoff flow. This
was likely due to the extremely dry conditions coupled with the ability of the compost treatment
to continue to hold water or slow down overland runoff flow.
By the final storm event the poultry litter compost had the lowest runoff rate followed by
the biosolids compost, the MSW compost, and the yard waste compost. Again, the composts had
lower runoff rates than the hydroseeded treatments (the hydroseed with silt fence was lower of
the two), and the control had the highest runoff rate. However, the only significant difference
was between the control and the poultry litter compost. Over the one-year study, all four

146
compost treatments showed a reduction in runoff rate, while the hydroseed with silt fence runoff
rate remained unchanged and the bare soil runoff rate increased (Table 4.4). This may be the
result of the compost blankets gradually increasing soil structure and water infiltration in the soil
surface, while the control may have experienced soil crusting. Of the compost treatments the
poultry litter and biosolids compost treatments reduced runoff rates the most over the one-year
study period.
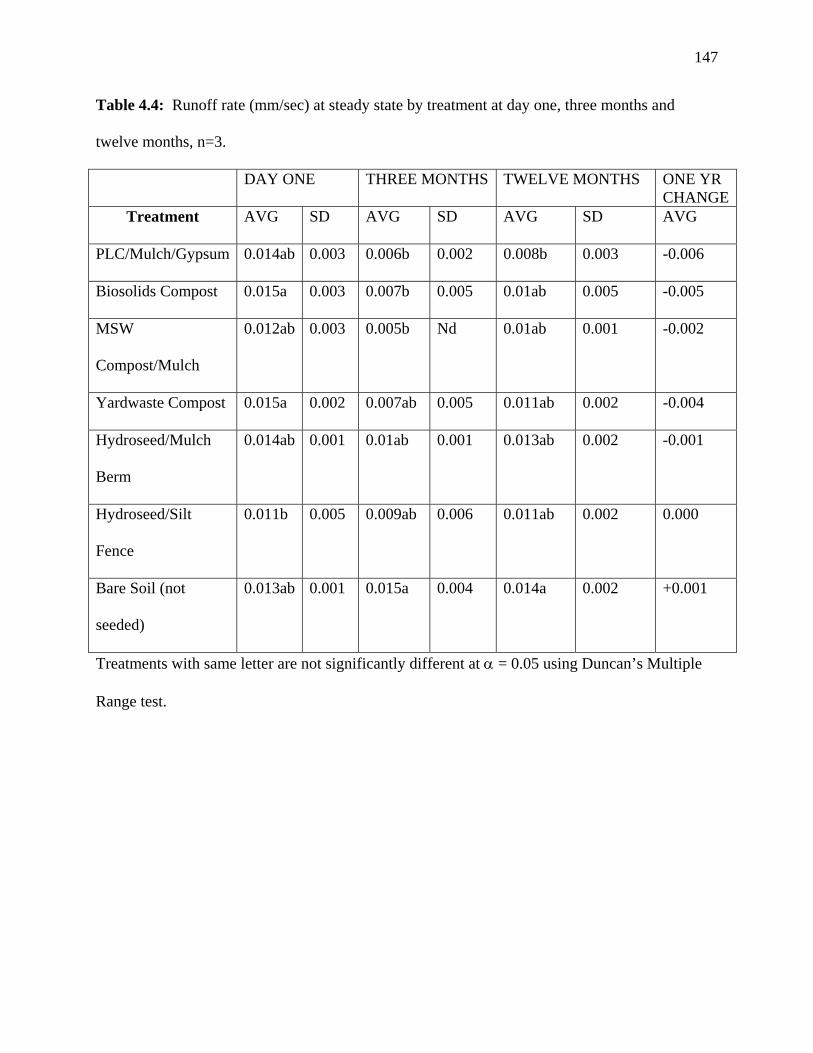
147
Table 4.4: Runoff rate (mm/sec) at steady state by treatment at day one, three months and
twelve months, n=3.
DAY ONE THREE MONTHS TWELVE MONTHS ONE YR CHANGE
Treatment AVG SD AVG SD AVG SD AVG
PLC/Mulch/Gypsum 0.014ab 0.003 0.006b 0.002 0.008b 0.003 -0.006
Biosolids Compost 0.015a 0.003 0.007b 0.005 0.01ab 0.005 -0.005
MSW
Compost/Mulch
0.012ab 0.003 0.005b Nd 0.01ab 0.001 -0.002
Yardwaste Compost 0.015a 0.002 0.007ab 0.005 0.011ab 0.002 -0.004
Hydroseed/Mulch
Berm
0.014ab 0.001 0.01ab 0.001 0.013ab 0.002 -0.001
Hydroseed/Silt
Fence
0.011b 0.005 0.009ab 0.006 0.011ab 0.002 0.000
Bare Soil (not
seeded)
0.013ab 0.001 0.015a 0.004 0.014a 0.002 +0.001
Treatments with same letter are not significantly different at α = 0.05 using Duncan’s Multiple
Range test.
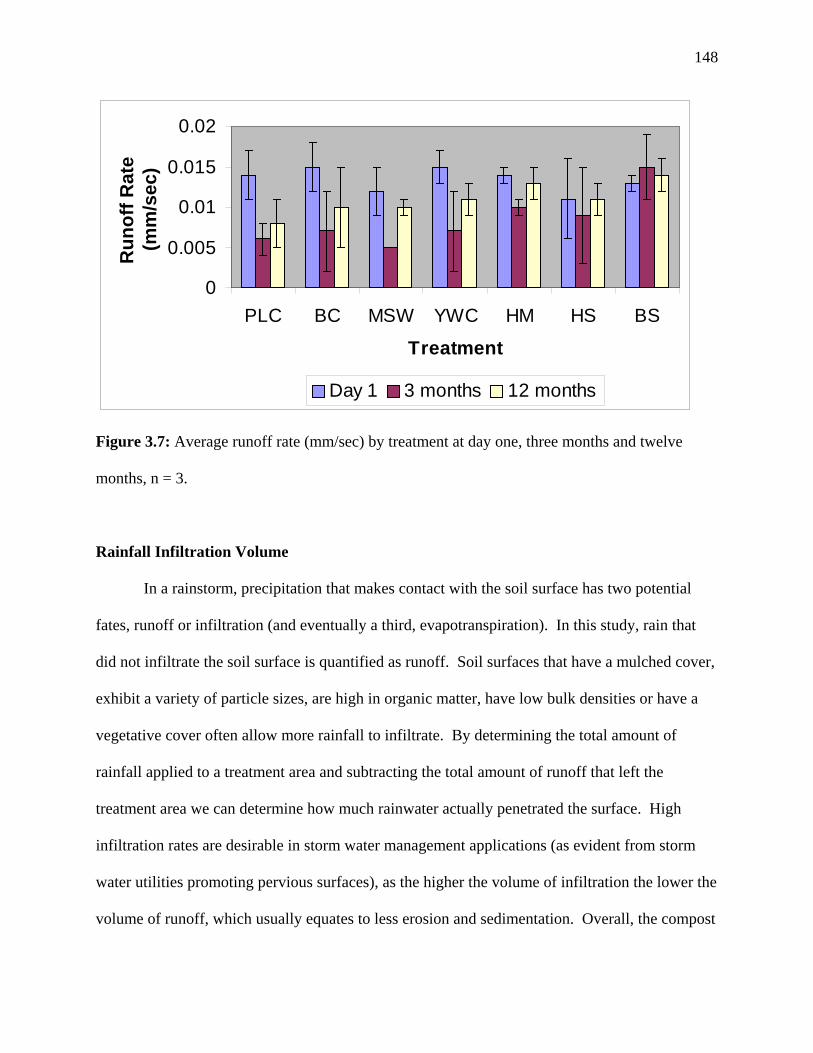
148
0
0.005
0.01
0.015
0.02
PLC BC MSW YWC HM HS BS
Treatment
Run
off R
ate
(mm
/sec
)
Day 1 3 months 12 months
Figure 3.7: Average runoff rate (mm/sec) by treatment at day one, three months and twelve
months, n = 3.
Rainfall Infiltration Volume
In a rainstorm, precipitation that makes contact with the soil surface has two potential
fates, runoff or infiltration (and eventually a third, evapotranspiration). In this study, rain that
did not infiltrate the soil surface is quantified as runoff. Soil surfaces that have a mulched cover,
exhibit a variety of particle sizes, are high in organic matter, have low bulk densities or have a
vegetative cover often allow more rainfall to infiltrate. By determining the total amount of
rainfall applied to a treatment area and subtracting the total amount of runoff that left the
treatment area we can determine how much rainwater actually penetrated the surface. High
infiltration rates are desirable in storm water management applications (as evident from storm
water utilities promoting pervious surfaces), as the higher the volume of infiltration the lower the
volume of runoff, which usually equates to less erosion and sedimentation. Overall, the compost
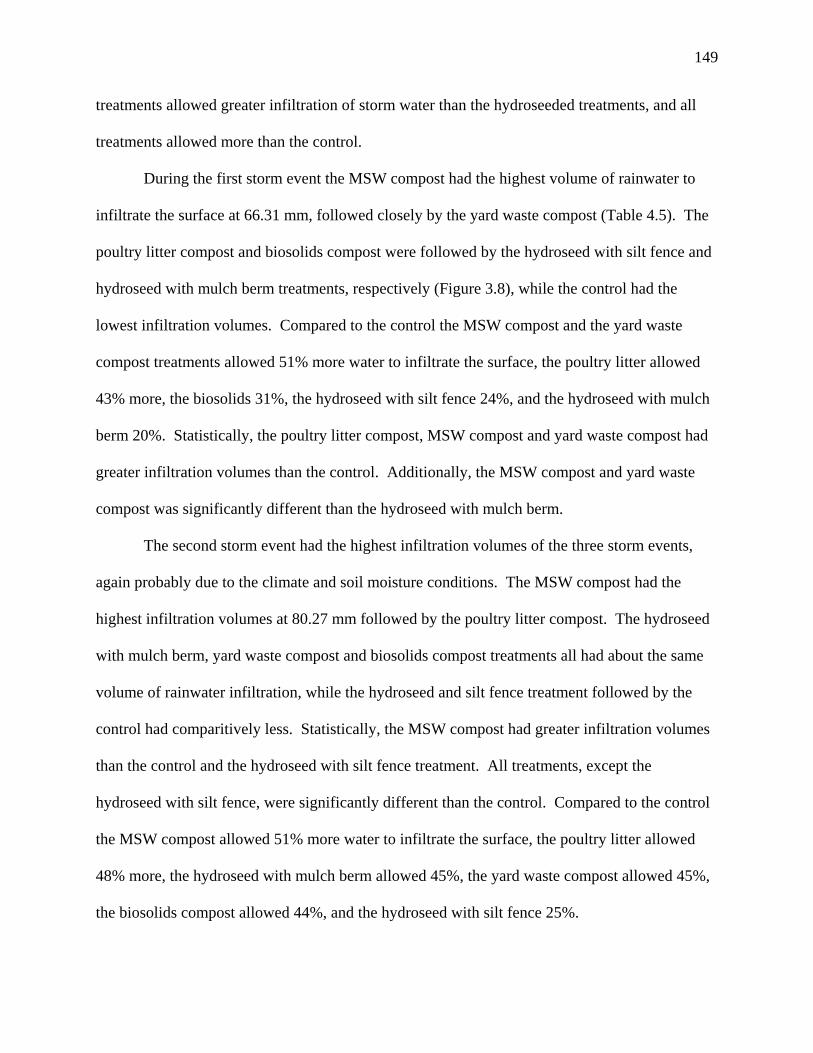
149
treatments allowed greater infiltration of storm water than the hydroseeded treatments, and all
treatments allowed more than the control.
During the first storm event the MSW compost had the highest volume of rainwater to
infiltrate the surface at 66.31 mm, followed closely by the yard waste compost (Table 4.5). The
poultry litter compost and biosolids compost were followed by the hydroseed with silt fence and
hydroseed with mulch berm treatments, respectively (Figure 3.8), while the control had the
lowest infiltration volumes. Compared to the control the MSW compost and the yard waste
compost treatments allowed 51% more water to infiltrate the surface, the poultry litter allowed
43% more, the biosolids 31%, the hydroseed with silt fence 24%, and the hydroseed with mulch
berm 20%. Statistically, the poultry litter compost, MSW compost and yard waste compost had
greater infiltration volumes than the control. Additionally, the MSW compost and yard waste
compost was significantly different than the hydroseed with mulch berm.
The second storm event had the highest infiltration volumes of the three storm events,
again probably due to the climate and soil moisture conditions. The MSW compost had the
highest infiltration volumes at 80.27 mm followed by the poultry litter compost. The hydroseed
with mulch berm, yard waste compost and biosolids compost treatments all had about the same
volume of rainwater infiltration, while the hydroseed and silt fence treatment followed by the
control had comparitively less. Statistically, the MSW compost had greater infiltration volumes
than the control and the hydroseed with silt fence treatment. All treatments, except the
hydroseed with silt fence, were significantly different than the control. Compared to the control
the MSW compost allowed 51% more water to infiltrate the surface, the poultry litter allowed
48% more, the hydroseed with mulch berm allowed 45%, the yard waste compost allowed 45%,
the biosolids compost allowed 44%, and the hydroseed with silt fence 25%.
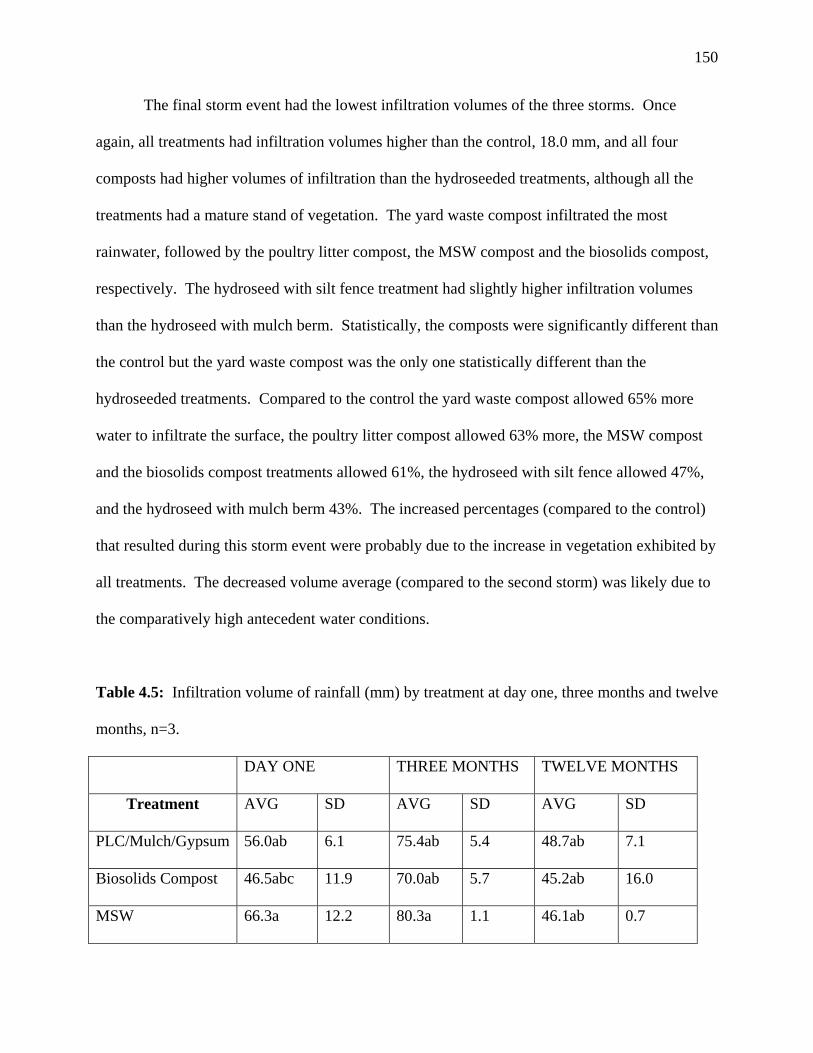
150
The final storm event had the lowest infiltration volumes of the three storms. Once
again, all treatments had infiltration volumes higher than the control, 18.0 mm, and all four
composts had higher volumes of infiltration than the hydroseeded treatments, although all the
treatments had a mature stand of vegetation. The yard waste compost infiltrated the most
rainwater, followed by the poultry litter compost, the MSW compost and the biosolids compost,
respectively. The hydroseed with silt fence treatment had slightly higher infiltration volumes
than the hydroseed with mulch berm. Statistically, the composts were significantly different than
the control but the yard waste compost was the only one statistically different than the
hydroseeded treatments. Compared to the control the yard waste compost allowed 65% more
water to infiltrate the surface, the poultry litter compost allowed 63% more, the MSW compost
and the biosolids compost treatments allowed 61%, the hydroseed with silt fence allowed 47%,
and the hydroseed with mulch berm 43%. The increased percentages (compared to the control)
that resulted during this storm event were probably due to the increase in vegetation exhibited by
all treatments. The decreased volume average (compared to the second storm) was likely due to
the comparatively high antecedent water conditions.
Table 4.5: Infiltration volume of rainfall (mm) by treatment at day one, three months and twelve
months, n=3.
DAY ONE THREE MONTHS TWELVE MONTHS
Treatment AVG SD AVG SD AVG SD
PLC/Mulch/Gypsum 56.0ab 6.1 75.4ab 5.4 48.7ab 7.1
Biosolids Compost 46.5abc 11.9 70.0ab 5.7 45.2ab 16.0
MSW 66.3a 12.2 80.3a 1.1 46.1ab 0.7
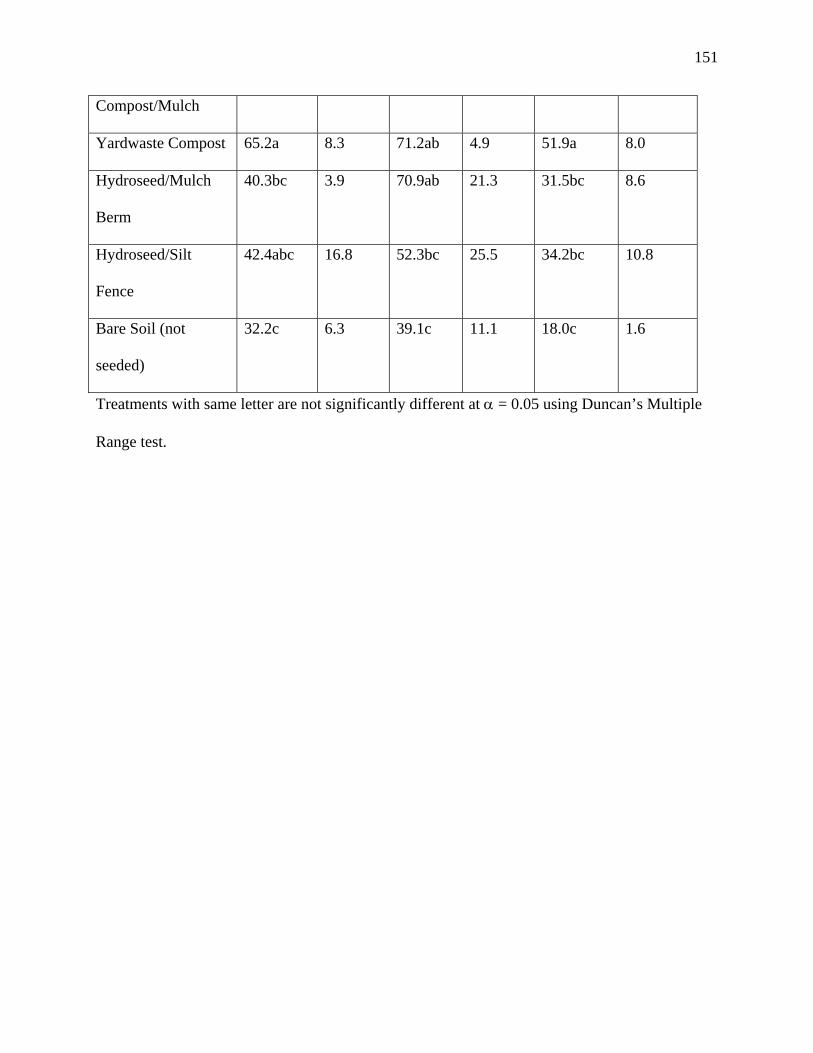
151
Compost/Mulch
Yardwaste Compost 65.2a 8.3 71.2ab 4.9 51.9a 8.0
Hydroseed/Mulch
Berm
40.3bc 3.9 70.9ab 21.3 31.5bc 8.6
Hydroseed/Silt
Fence
42.4abc 16.8 52.3bc 25.5 34.2bc 10.8
Bare Soil (not
seeded)
32.2c 6.3 39.1c 11.1 18.0c 1.6
Treatments with same letter are not significantly different at α = 0.05 using Duncan’s Multiple
Range test.
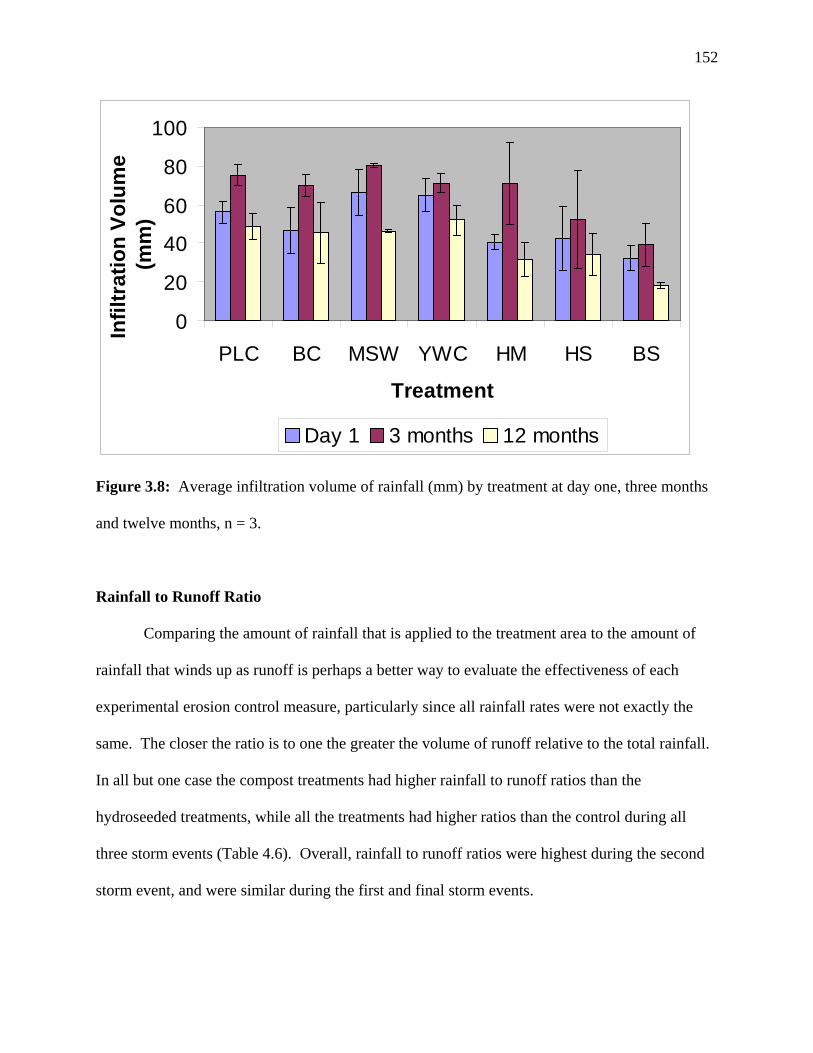
152
0
20
40
60
80
100
PLC BC MSW YWC HM HS BS
Treatment
Infil
trat
ion
Volu
me
(mm
)
Day 1 3 months 12 months
Figure 3.8: Average infiltration volume of rainfall (mm) by treatment at day one, three months
and twelve months, n = 3.
Rainfall to Runoff Ratio
Comparing the amount of rainfall that is applied to the treatment area to the amount of
rainfall that winds up as runoff is perhaps a better way to evaluate the effectiveness of each
experimental erosion control measure, particularly since all rainfall rates were not exactly the
same. The closer the ratio is to one the greater the volume of runoff relative to the total rainfall.
In all but one case the compost treatments had higher rainfall to runoff ratios than the
hydroseeded treatments, while all the treatments had higher ratios than the control during all
three storm events (Table 4.6). Overall, rainfall to runoff ratios were highest during the second
storm event, and were similar during the first and final storm events.

153
During the first event the MSW compost had the highest rainfall to runoff ratio at 3.09,
followed by the yardwaste compost, the poulty litter compost, the hydroseed with silt fence (the
one exception), the biosolids compost, the hydroseed with mulch berm, and the control,
respectively. No significant differences were observed. The unexpectedly high ratio of the
hydroseed with silt fence was probably due to either sampling difficulties or the damming effect
(which were related) the silt fence had on the runoff – which would artificially decrease the
amount of runoff on the treatment surface.
During the second storm event two MSW compost treatment plots and one poultry litter
compost treatment plot experienced no runoff, which explains the comparatively high rainfall to
runoff ratios for these treatments. Because of the ability to hold so much water, the MSW
compost had the highest ratio again (245.11), followed by the poultry litter compost, the
biosolids compost, the yard waste compost, the hydroseed with mulch berm, the hydroseed with
silt fence, and the control, respectively. However, the only significant difference was between
the MSW compost and all other treatments, with the exception of the poultry litter compost.
By the final storm event the biosolids compost had the highest rainfall to runoff ratio
(6.1), followed by the poultry litter compost, the yard waste compost, the MSW compost, the
hydroseed with silt fence, the hydroseed with mulch filter berm, and the control, respectively;
however, these differences were not statistically significant.

154
Table 4.6: Rainfall to runoff volume ratios by treatment at day one, three months and twelve
months, n=3.
DAY ONE THREE MONTHS TWELVE MONTHS
Treatment AVG SD AVG SD AVG SD
PLC/Mulch/Gypsum 1.90a 0.66 130.24ab 202.0 3.60a 1.6
Biosolids Compost 1.24a 0.33 16.08b 17.62 6.10a 8.2
MSW
Compost/Mulch
3.09a 0.74 245.11a 199.94 2.10a 0.2
Yardwaste Compost 1.99a 0.21 14.13b 12.08 2.20a 0.8
Hydroseed/Mulch
Berm
1.12a 0.29 3.66b 1.38 1.03a 0.6
Hydroseed/Silt
Fence
1.46a 2.90 3.23b 3.73 1.33a 0.7
Bare Soil (not
seeded)
0.78a 0.25 1.02b 0.57 0.43a 0.1
Treatments with same letter are not significantly different at α = 0.05 using Duncan’s Multiple
Range test.
Correlation Analysis
Results from correlation analysis (Table 4.7) were used to evaluate which of the
treatment physical, chemical, and biological characteristics, and rainfall and vegetation growth
results were correlated with the parameters from storm water runoff results. Only those that
were highly correlated (r>0.70) are reported. During the first storm event, time until the start of

155
runoff was correlated with total nitrogen, pH, stability, moisture content and various
micronutrients. Among the compost treatments, the higher the pH, moisture content, stability
index, and some micronutrients, the longer it took for runoff to begin. It is well known that high
moisture content can affect early commencement of runoff; however, these compost treatments
must have been under this range, as a general trend is not evident. Further research may be
useful to determine at what moisture content runoff commencement is significantly reduced.
Additionally, N, K and pH were good indicators of length of time before steady state was
achieved. The volume of rainwater that infiltrated the surface during the first storm event was
correlated to particle sizes passing 4mm, pH, germination rate, N, K, Al, and Mg. High
germination rate and high pH were particularly good indicators of high volumes of rainwater
infiltration. Based on the correlation analysis from the first storm event, characteristics of high
quality composts, such as high stability and germination rates, neutral pH, and adequate total N,
are the best indicator of increasing infiltration and decreasing runoff.
Total runoff volume in the second storm event was correlated to bulk density, N, P, K,
and, Mg; however, the best indicator of low runoff volume was low phosphorus concentration in
the compost treatment. Runoff rate was significantly correlated to the same parameters as total
runoff volume with the exception of bulk density. Again, low phosphorus concentration in the
compost was the best indicator of a low runoff rate. Rainwater infiltration volume was only
correlated to N and pH during this storm. Time until the beginning of runoff and steady state
conditions were correlated to particle sizes passing 25mm, 16mm, 9.5mm, 6.3mm, pH,
germination rate, and percentage of vegetative cover. High germination rate, a greater
percentage of particles passing through 9.5mm, and a greater percentage of vegetative cover
(excluding MSW compost) were the best indicators of a longer period of time before the

156
commencement of runoff. Based on this analysis, germination rate and the subsequent
vegetative cover as well as a variety of particle sizes were the best means to reduce storm water
runoff during the second storm event.
Infiltration volume from the final storm event was correlated to N, P, K, Mg, pH, and
percent cover at three months. The best indicators of high rainwater infiltration volume were
high K and Mg concentrations in the compost (excluding the poultry litter compost), and high
percent cover at three months (excluding the poultry litter compost). After one year, it appeared
that the parameters that most affect plant growth were the ones most correlated to increased
infiltration volumes, which can lead to reduced storm runoff.

157
Table 4.7: Results from correlation analysis. This table lists all variables with significant
correlation (r>0.70, α = 0.05, n = 21).
Response Variable Independent Variable (treatment) with Correlation Coefficient
Time to runoff start, Storm #1 N (0.83), pH (0.77), stability (0.72), moisture content (0.77), Na
(0.76), Mg (0.70)
Time to runoff steady state, Storm #1 N (0.75), K (0.72), pH (0.74)
Rain infiltration volume, Storm #1 Particle size >4mm (7.0), pH (0.74), germination rate (0.70), Al (0.72),
N (0.74), K (0.72), Mg (0.84)
Time to runoff start, Storm #2 Particle size >25mm (0.71), Particle size >16mm (0.82), Particle size
>9.5mm (0.77), Particle size >6.3mm (0.72), pH (0.73), germination
rate (0.80), percent vegetative cover (0.91)
Time to runoff steady state, Storm #2 Particle size >25mm (0.77), Particle size >16mm (0.89), Particle size
>9.5mm (0.82), Particle size >6.3mm (0.74), pH (0.74), germination
rate (0.84), percent vegetative cover (0.90)
Rain infiltration volume, Storm #2 N (0.74), pH (0.81)
Runoff rate, Storm #2 N (0.86), P (0.81), K (0.76), Mg (0.75)
Total Runoff, Storm #2 Bulk density (0.77), N (0.89), P (0.82), K (0.75), Mg (0.73)
Rain infiltration volume, Storm #3 N (0.73), P (0.70), K (0.75), Mg (0.77), pH (0.74), percent vegetative
cover at 3 months (0.78)
Summary and Conclusion
Based on this study and under these environmental conditions, MSW compost is the best
tool for reducing runoff volume in the short and long term. It also appears that hydroseeding is
not very effective at reducing runoff compared to a bare soil, while compost is effective.
Additionally, compost reduces runoff volume and runoff rate more over time than hydroseeding
or a bare soil. Support for this is evident in the amount of rainfall that infiltrated each treatment,
again the composts outperformed hydroseeding, and the MSW compost did particularly well.
All of the treatments allowed for better infiltration than the control. Based on the time it takes
for runoff to commence, compost may be a better tool to prevent runoff from occurring during

158
small and medium intensity storm events. The MSW compost was particularly effective in this
area.
Based on correlation analysis, general characteristics of high quality compost such as a
high biological stability, high germination rate, and neutral pH are good indicators that there will
be greater infiltration and less runoff. This is likely since these characteristics lead to good
vegetation establishment, which in turn can lead to greater infiltration and less runoff.
Additional parameters that provide good vegetative growth, such low bulk density, adequate N,
P, and K and to some extent the particle size distribution of the compost, are important to
increasing infiltration and reducing runoff. This provides compelling evidence that compost may
be well suited for a variety of storm water management applications, particularly where it can
eliminate runoff, thus preventing most erosion from ever occurring. For erosion control
professionals deciding on which measure to use for managing storm water and reducing runoff,
compost does a better job than hydroseeding at increasing infiltration and reducing storm runoff.
Solids Loss
While erosion prevention may be the best management for controlling sedimentation, the
primary focus of the erosion and sediment control industry and regulators are to prevent
sediment from leaving the designated site and/or reaching nearby surface waters. Establishing
vegetation as quick as possible is one of the main goals to controlling soil erosion and sediment
loss; however, establishing a permanent vegetative cover and providing a protective soil cover
before vegetation is established can be just as important. Three simulated storm events were
used to evaluate the performance of each treatment over time. Simulated storm events were
conducted at the time materials were applied (no vegetation), three months (vegetation

159
established), and twelve months (vegetation matured). Each test plot was exposed to a simulated
storm event, for one-hour duration, at a rate approximate to the 50-year/1 hour storm event for
Athens, Georgia. Runoff samples were collected at the base of each plot as soon as runoff
began. Total solids loads and solid loss ratios were used as parameters to evaluate the erosion
prevention and sediment control capabilities of each treatment during each storm event.
Total Solids Load
During the first storm event, before vegetation was established, all six treatments lost less
total solids than the control (Table 4.8). In addition, each of the four compost treatments yielded
less total solids than the two hydroseeded treatments (Figure 3.9). This is probably a result of
the immediate and more stable soil surface cover the compost blankets provided relative to the
hydroseed treatments. The hydroseed and mulch treatment produced less solids loss than the
hydroseed and silt fence treatment, which may be the function of superior sediment filtration by
the mulch berm over the silt fence. Of the composts, the yard waste and biosolids compost
treatments yielded less solids than the poultry litter and MSW composts; interestingly the former
had more runoff volume. The control was statistically greater than the rest of the treatments, and
there was no significant difference between the six treatments during the first storm event.
Visually, the control and hydroseeded plots had evidence of rilling, indicating erosion from flow
stress. The composts had no evidence of rilling but did show some bridging of material,
indicating potential erosion from flow stress.
During the second storm event, after three months of allowing vegetation to establish, all
six treatments with erosion control measures generated significantly less solids than the control.
In addition, all six treatments greatly reduced the loss of solids compared to the first storm event.
160
This was probably due to the establishment of vegetation coupled with the drought that ensued
between the two storm events (only 90.7 mm of natural rain). The composts continued to
perform better than either of the two hydroseed treatments, while the hydroseed with mulch berm
treatment continued to perform better than the hydroseed with silt fence treatment. The
difference in solids loss between the two hydroseed treatments was much greater during the
second storm event. The MSW compost provided the best protection against soil loss,
presumably because it produced very little runoff. The yard waste and poultry litter composts
generated nearly the same solids yield, followed by the biosolids compost. It should be noted
that two of the MSW compost treatments and one of the poultry litter compost treatments did not
produce runoff during this storm event. Finally, the control and hydroseeded treatments
continued to show some rilling from concentrated flow.

161
Table 4.8: Average total solids loads (g/m2) and total solids loss ratio (treatment to control) by treatment at day one, three months,
and twelve months, n=3.
DAY ONE THREE MONTHS TWELVE MONTHS
Treatment AVG SD RATIO AVG SD RATIO AVG SD RATIO
PLC/Mulch/Gypsum 158.9b 91.3 0.025 14.6b 8.3 0.003 10.8b 4.5 0.010
Biosolids Compost 105.8b 13.0 0.016 18.9b 13.2 0.003 8.8b 6.4 0.008
MSW
Compost/Mulch
191.9b 107.8 0.030 6.0b nd 0.001 17.8b 6.8 0.016
Yardwaste Compost 88.5b 45.3 0.014 13.7b 6.6 0.002 17.1b 6.2 0.015
Hydroseed/Mulch
Berm
265.1b 32.3 0.041 78.1b 21.7 0.014 10.9b 6.1 0.010
Hydroseed/Silt Fence 307.9b 127.8 0.048 219.6b 72.0 0.039 14.5b 6.7 0.013
Bare Soil (not seeded) 6428.1a 2182.7 1.0 5464.2a 3290.4 1.0 1109.7a 987.7 1.0
Treatments with same letter are not significantly different at α = 0.05 using Duncan’s Multiple Range test.

162
After twelve months of allowing vegetation to establish, all six treatments with erosion
control measures provided superior soil protection compared to the control. By this time both
hydroseed treatments experienced a “vegetation comeback” and the solids yield generated from
these treatments was quite similar to the compost treatments. However, solids loss reduction
among the compost treatments changed little from the second to the third storm event. The
biosolids compost treatment improved the most of the four composts, and provided the best
protection against solids loss during the final storm event, followed closely by the poultry litter
compost and hydroseed and mulch treatments. The hydroseed and silt fence treatment generated
less solids loss than the yard waste and MSW compost treatments, which produced similar
results. However, consistent with previous storms, there was no significant difference between
treatments, only between the control and the remaining six erosion control treatments. It should
be noted that the water content of the soils during the final storm event were near field capacity,
quite opposite conditions experienced during the second storm event. Finally, by this storm
event rilling was only evident in the control treatments, likely due to the vegetative growth
experienced by the hydroseeded treatments.
Treatment to Control Soil Loss Ratio
As predicted, all six treatments receiving grass seed improved over time as vegetation
became more established and provided better soil cover compared to the control (Table 4.8).
The biggest gains in solids loss reduction were made between the first and second storm events
for the composts and between the second and third storm events for the hydroseeded treatments.
Figure 3.10 depicts the solids loss ratios (treatment/control) of each treatment compared to the
control for each of the three storm events. The closer the ratio is to one, the greater the similarity
163
is to the performance of the control. Interestingly, the yard waste and MSW composts generated
more solids loss during the final storm event compared to the previous storm event. Although
some vegetative cover did establish on the non-seeded control plots, solids loss improved little
between the first and second storm events, and increased nearly two-fold between the second and
third storm events. These occurrences were probably due to the elevated antecedent soil water
conditions experienced during the third storm event, which led to greater runoff. While all
treatments produced runoff during the third storm event (unlike the second storm), the biggest
surprise to the researchers was the late but vigorous improvement of the hydroseeded treatments
between the second and final storm event.
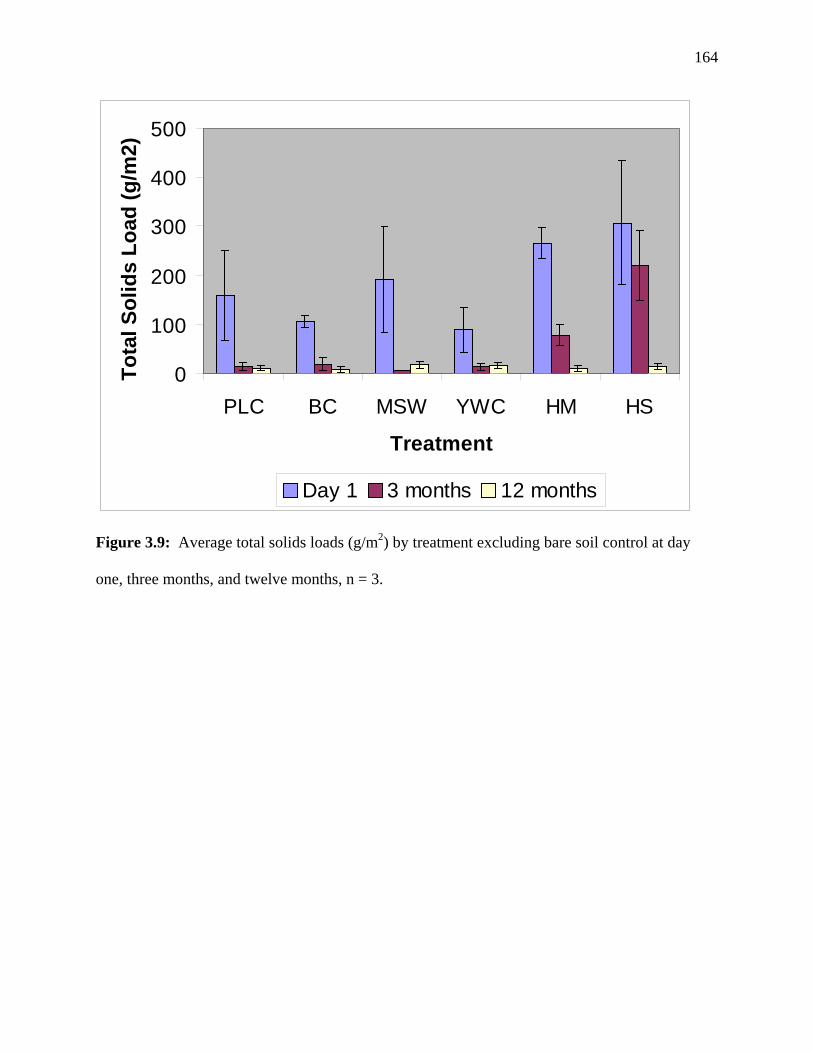
164
0
100
200
300
400
500
PLC BC MSW YWC HM HS
Treatment
Tota
l Sol
ids
Load
(g/m
2)
Day 1 3 months 12 months
Figure 3.9: Average total solids loads (g/m2) by treatment excluding bare soil control at day
one, three months, and twelve months, n = 3.

165
0
0.01
0.020.03
0.04
0.05
0.06
PLC BC MSW YWC HM HS
Treatment
Rat
io
Day 1 3 months 12 months
Figure 3.10: Average total solids loss ratio of treatment to control at day one, three months and
twelve months, n = 3.
Correlation Analysis
Results from correlation analysis (Table 4.9) were used to evaluate which of the
treatment physical, chemical, and biological characteristics, and rainfall and vegetation growth
results (independent variables) were correlated with the parameters from total sediment
concentrations and loads (response variables). Only those that were highly correlated (r>0.70)
are reported. Bulk density of the compost treatments was well correlated to solids loss
(concentration and load) for all three storm events. The MSW compost had the lowest bulk
density and highest solids load for the first storm event; however, by the second storm event it
had the lowest solids load of any treatment. Organic matter was correlated to solids load from
the first and second storm event for the compost treatments. The MSW compost and poultry

166
litter compost had the highest organic matter content and the highest solids loads for the first
storm event, however, by the second storm event the MSW compost had the lowest solids loads.
Table 4.9: Results from correlation analysis. This table lists all variables with significant
correlation (r>0.70, α = 0.05, n = 21).
Response Variable Independent Variable (treatment) with Correlation Coefficient
Total sediment concentration, Storm #1 Bulk density (0.93)
Total sediment load, Storm #1 Bulk density (0.90), organic matter (0.78)
Total sediment concentration, Storm #2 Bulk density (0.87), organic matter (0.71)
Total sediment load, Storm #2 Bulk density (0.73), organic matter (0.77)
Total sediment concentration, Storm #3 Bulk density (0.76)
Total sediment load, Storm #3 Bulk density (0.75)
Summary and Conclusion
Based on this study, all treatments were better than the control at reducing solids loss.
While the differences were not significant, it appeared that the composts provided better erosion
control than the industry standards, particularly in the short term, as solids loads were as much as
350% greater from the conventional methods during the first storm event. In addition, compost
blankets continued to outperformed the industry standards three months after the initial
application, although not statistically significant, solids loads were as much as 36 times greater
from the industry standard treatments compared to compost. This study also lends some
evidence that compost blankets may provide better protection from soil erosion than these
industry standards during storms preceded by drought. After one year, however, the industry
standards performed as well as the composts at reducing solids loss. The “vegetation comeback”
of the hydroseeded plots, after obvious seed wash during the first storm event, can be partly
attributed to the prolific growth that is characteristic of Bermuda grass (and weed growth).
167
While the compost treatments consistently showed a near 100% reduction (no less than 97%) in
solids loss compared to the control, the industry standards maintained solids loss reductions no
less than 95%. In addition, although differences were not statistically significant, the hydroseed
with mulch filter berm consistently yielded less solids loss compared to silt fence throughout the
entire study. Finally, it appears that the bulk density and organic matter content of compost is
correlated to solids loading. For erosion control professionals deciding on which measure to use
to provide the greatest protection against solids loss, compost generally outperforms
hydroseeding and silt fence – particularly in short term applications, and mulch filter berms can
provide better solids filtration than silt fence.

168
APPENDIX D
RESULTS AND DISCUSSION: NUTRIENT LOSS
Compost may be an effective tool in storm water management applications to control
erosion and sedimentation; however, there may be a concern with nutrient losses from the
composted materials. Composts that have not been well composted or are particularly high in N
and P are of greatest concern because nutrients from these materials are less stable and/or more
susceptible to losses in runoff. In addition, standard erosion control measures that utilize
commercial fertilizers, such a hydroseeding, should also be scrutinized in the same manner.
It is well understood that although N and P are necessary to establish vegetation quickly
and maintain vegetation permanently, it is important that applications do not exceed crop needs,
when possible, they should not be applied before a storm event. To reduce potential nutrient
losses in runoff, the poultry litter compost and MSW compost treatments were blended with
wood mulch on a 3:1 volumetric basis (compost:mulch). This ratio was chosen because it was
felt this was the most mulch that could be blended with these materials without adversely
affecting plant growth from N immobilization. In addition, the poultry litter compost was
blended with approximately 5% (volumetric basis) ground gypsum (CaSO4). This was done to
reduce potential P losses in the runoff from the reaction between P and CaSO4 to form the more
stable Ca3(PO4)2.

169
It was hypothesized that treatments higher in N and P concentrations would have higher
nutrient concentrations and loads in the storm water runoff. In addition, nutrient loading in the
runoff would decrease with each subsequent storm event and those with better vegetative stands
would be more likely to have lower nutrient loads in their runoff. Runoff samples were analyzed
for total N, NO3-N, NH4-N, total P and DRP. See Materials and Methods section for complete
treatment descriptions, sampling procedures, and analytical methods.
Total Nitrogen Concentrations and Loads
The total amount of nitrogen applied by each treatment was 132 g/m2 from the poultry
litter compost, 111 g/m2 from the biosolids compost, 104 g/m2 from the MSW compost, 94 g/m2
from the yard waste compost, and 10 g/m2 from the hydroseeded applications. The first
simulated storm event was conducted immediately after treatment application, thus there was no
vegetation and the potential for total N loss was greatest at this time period. Average total N
(organic nitrogen + ammonium nitrogen + nitrate nitrogen) concentration of the runoff was
highest from the biosolids compost treatment at 106.6 mg L-1, followed by the MSW compost at
88.7 mg L-1 and then by both hydroseeded treatments at 38 mg L-1 (Table 5.1). The control had
the lowest total N concentration (1.83 mg L-1), while the poultry litter compost and yard waste
compost represented the middle of the field at 28.6 and 14.4 mg L-1, respectively. The total N
concentration for the 25th percentile of reference streams is 0.03 mg L-1 (US EPA, 2000).
Statistically, the biosolids compost, MSW compost, poultry litter compost, and both hydroseeded
treatments were significantly different than the control, while the hydroseeded treatments were
statistically similar to the poultry litter compost. With the exception of the biosolids compost
and MSW compost the hydroseeded treatments had the highest total nitrogen concentrations in
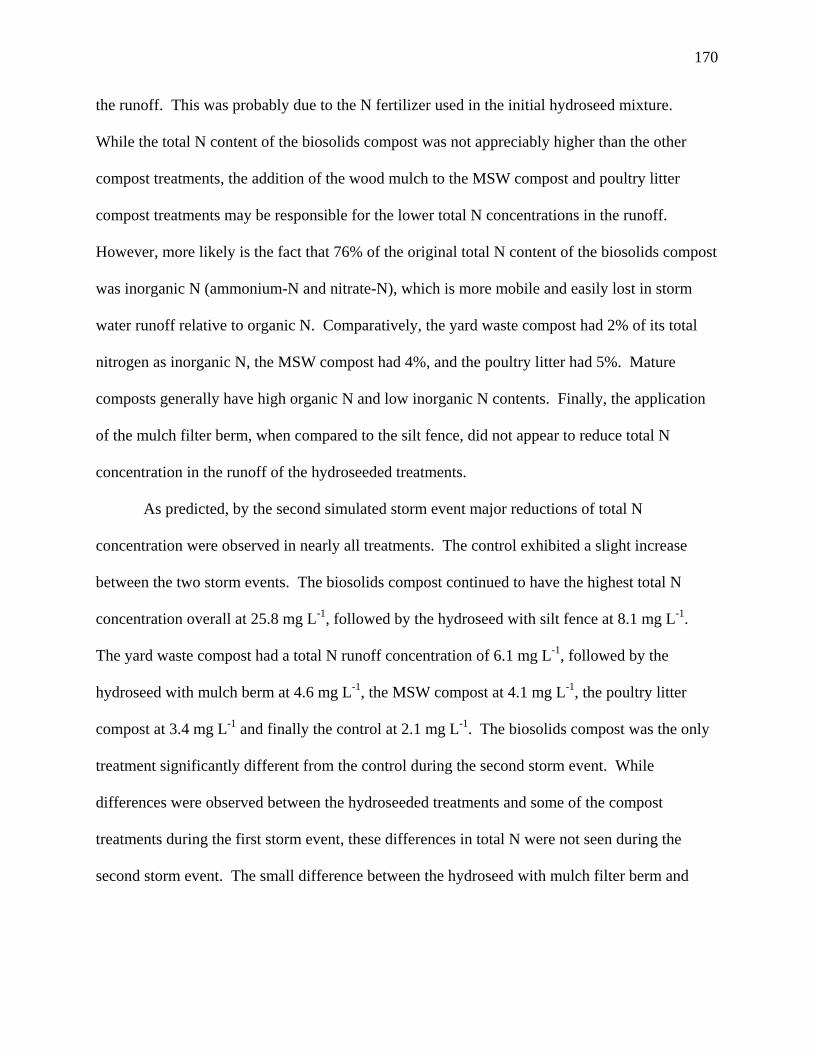
170
the runoff. This was probably due to the N fertilizer used in the initial hydroseed mixture.
While the total N content of the biosolids compost was not appreciably higher than the other
compost treatments, the addition of the wood mulch to the MSW compost and poultry litter
compost treatments may be responsible for the lower total N concentrations in the runoff.
However, more likely is the fact that 76% of the original total N content of the biosolids compost
was inorganic N (ammonium-N and nitrate-N), which is more mobile and easily lost in storm
water runoff relative to organic N. Comparatively, the yard waste compost had 2% of its total
nitrogen as inorganic N, the MSW compost had 4%, and the poultry litter had 5%. Mature
composts generally have high organic N and low inorganic N contents. Finally, the application
of the mulch filter berm, when compared to the silt fence, did not appear to reduce total N
concentration in the runoff of the hydroseeded treatments.
As predicted, by the second simulated storm event major reductions of total N
concentration were observed in nearly all treatments. The control exhibited a slight increase
between the two storm events. The biosolids compost continued to have the highest total N
concentration overall at 25.8 mg L-1, followed by the hydroseed with silt fence at 8.1 mg L-1.
The yard waste compost had a total N runoff concentration of 6.1 mg L-1, followed by the
hydroseed with mulch berm at 4.6 mg L-1, the MSW compost at 4.1 mg L-1, the poultry litter
compost at 3.4 mg L-1 and finally the control at 2.1 mg L-1. The biosolids compost was the only
treatment significantly different from the control during the second storm event. While
differences were observed between the hydroseeded treatments and some of the compost
treatments during the first storm event, these differences in total N were not seen during the
second storm event. The small difference between the hydroseed with mulch filter berm and

171
hydroseed with silt fence treatment may be a result of the mulch berm filtering nutrients, but
unlikely due to the similarity of total N concentrations during the first storm event.
By the final storm event, twelve months after the first storm, all treatments including the
control had total N runoff concentrations between 1.25 mg L-1 and 2.44 mg L-1. By this time
period the vegetation probably assimilated most of the total N that was not already lost from
previous storm events. However, the total N concentrations in the runoff from the yard waste
compost and hydroseed with mulch berm were significantly less than the control.
Perhaps a more constructive tool for evaluating the pollution potential of these treatments
is to compare total nitrogen loads (Figure 4.1). This is critical, for if a treatment exhibits
comparatively high concentrations of nutrient loss but is comparatively more effective at
reducing runoff, then it may be a more desirable method of erosion control, since in “real life”
applications it is the amount of nutrients entering nearby surface water that we are most
concerned.
During the first rainfall simulation the rank of treatments based on total N loads was the
same as the total nitrogen concentrations. The biosolids compost released 4,033 mg/m2 of total
N followed by the MSW compost at 2014 mg/m2, the hydroseed with mulch berm at 1391
mg/m2, the hydroseed with silt fence at 1008 mg/m2, the poultry litter compost at 842 mg/m2, the
yard waste compost at 451 mg/m2, and the control at 77 mg/m2 (Table 1). The biosolids
compost, MSW compost, poultry litter compost, and both hydroseeded treatments were
significantly different from the control. In addition, the biosolids compost was significantly
greater than all other treatments. Based on the data, the mulch berm did not reduce total N load
compared to silt fence among the hydroseeded treatments.
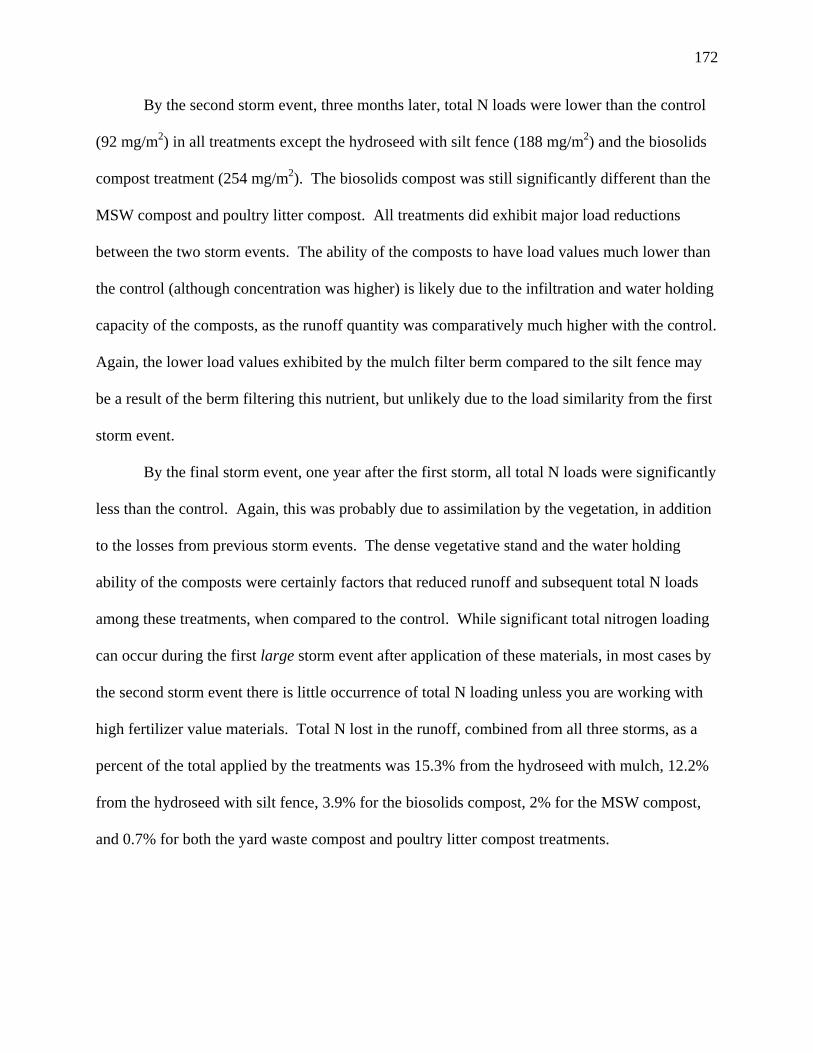
172
By the second storm event, three months later, total N loads were lower than the control
(92 mg/m2) in all treatments except the hydroseed with silt fence (188 mg/m2) and the biosolids
compost treatment (254 mg/m2). The biosolids compost was still significantly different than the
MSW compost and poultry litter compost. All treatments did exhibit major load reductions
between the two storm events. The ability of the composts to have load values much lower than
the control (although concentration was higher) is likely due to the infiltration and water holding
capacity of the composts, as the runoff quantity was comparatively much higher with the control.
Again, the lower load values exhibited by the mulch filter berm compared to the silt fence may
be a result of the berm filtering this nutrient, but unlikely due to the load similarity from the first
storm event.
By the final storm event, one year after the first storm, all total N loads were significantly
less than the control. Again, this was probably due to assimilation by the vegetation, in addition
to the losses from previous storm events. The dense vegetative stand and the water holding
ability of the composts were certainly factors that reduced runoff and subsequent total N loads
among these treatments, when compared to the control. While significant total nitrogen loading
can occur during the first large storm event after application of these materials, in most cases by
the second storm event there is little occurrence of total N loading unless you are working with
high fertilizer value materials. Total N lost in the runoff, combined from all three storms, as a
percent of the total applied by the treatments was 15.3% from the hydroseed with mulch, 12.2%
from the hydroseed with silt fence, 3.9% for the biosolids compost, 2% for the MSW compost,
and 0.7% for both the yard waste compost and poultry litter compost treatments.
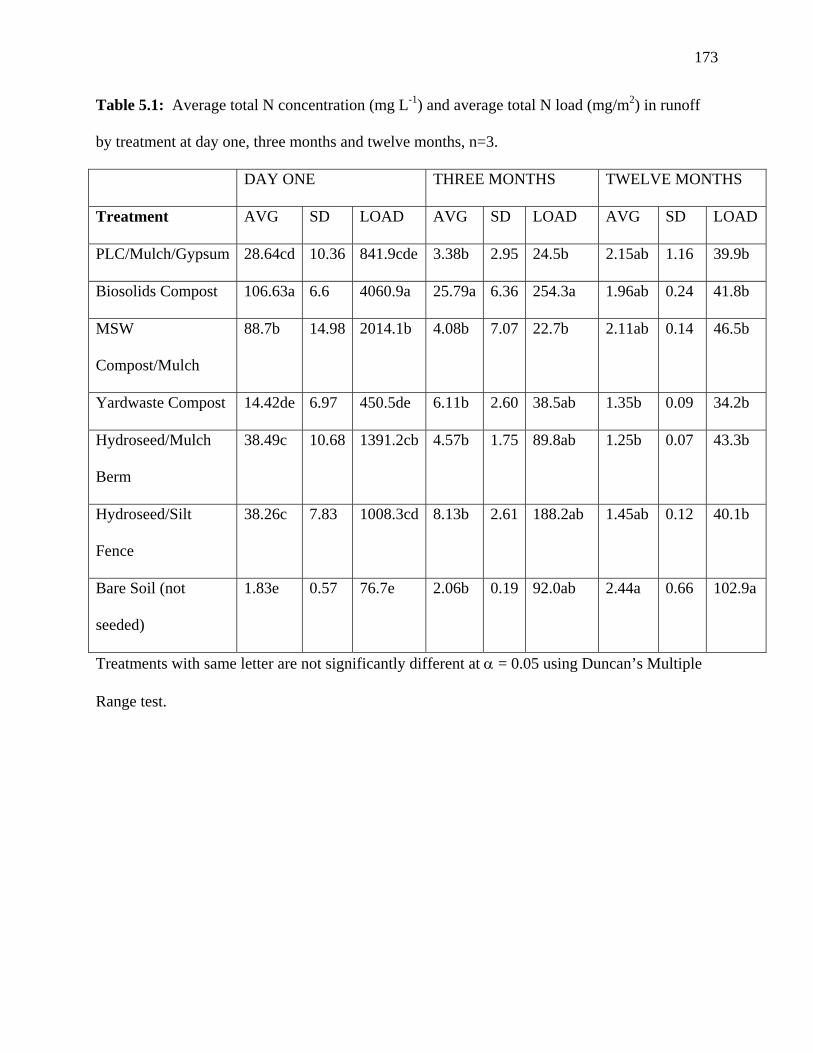
173
Table 5.1: Average total N concentration (mg L-1) and average total N load (mg/m2) in runoff
by treatment at day one, three months and twelve months, n=3.
DAY ONE THREE MONTHS TWELVE MONTHS
Treatment AVG SD LOAD AVG SD LOAD AVG SD LOAD
PLC/Mulch/Gypsum 28.64cd 10.36 841.9cde 3.38b 2.95 24.5b 2.15ab 1.16 39.9b
Biosolids Compost 106.63a 6.6 4060.9a 25.79a 6.36 254.3a 1.96ab 0.24 41.8b
MSW
Compost/Mulch
88.7b 14.98 2014.1b 4.08b 7.07 22.7b 2.11ab 0.14 46.5b
Yardwaste Compost 14.42de 6.97 450.5de 6.11b 2.60 38.5ab 1.35b 0.09 34.2b
Hydroseed/Mulch
Berm
38.49c 10.68 1391.2cb 4.57b 1.75 89.8ab 1.25b 0.07 43.3b
Hydroseed/Silt
Fence
38.26c 7.83 1008.3cd 8.13b 2.61 188.2ab 1.45ab 0.12 40.1b
Bare Soil (not
seeded)
1.83e 0.57 76.7e 2.06b 0.19 92.0ab 2.44a 0.66 102.9a
Treatments with same letter are not significantly different at α = 0.05 using Duncan’s Multiple
Range test.

174
0500
10001500200025003000350040004500
PLC BC MSW YWC HM HS BS
Treatment
mg/
m2
Day One Three Months Twelve Months
Figure 4.1: Average total N load (mg/m2) in runoff by treatment at day one, three months and
twelve months, n = 3.
Nitrate Nitrogen Concentrations and Loads
Nitrate nitrogen is a highly mobile form of N and is most commonly cited as the form of
nitrogen polluting ground water. High concentrations of NO3-N in drinking water have been
linked to negative health effects in humans as well as eutrophication in surface waters. The US
EPA has set safe drinking water standards for NO3-N at 10 mg L-1 (US EPA, 2004); however, it
should be noted that runoff concentrations would likely be diluted, by moving over land surfaces,
before reaching any water resource. During the first storm event nitrate nitrogen concentrations
in the runoff were highest in the biosolids compost at 67 mg L-1, followed by the hydroseed with
mulch berm at 22 mg L-1, the poultry litter compost at 17 mg L-1, the hydroseed with silt fence at
15 mg L-1, the yard waste compost at almost 3 mg L-1, the control at 1 mg L-1 and finally the
MSW compost at 0.10 mg L-1 (Table 5.2). The elevated concentrations of nitrate nitrogen from
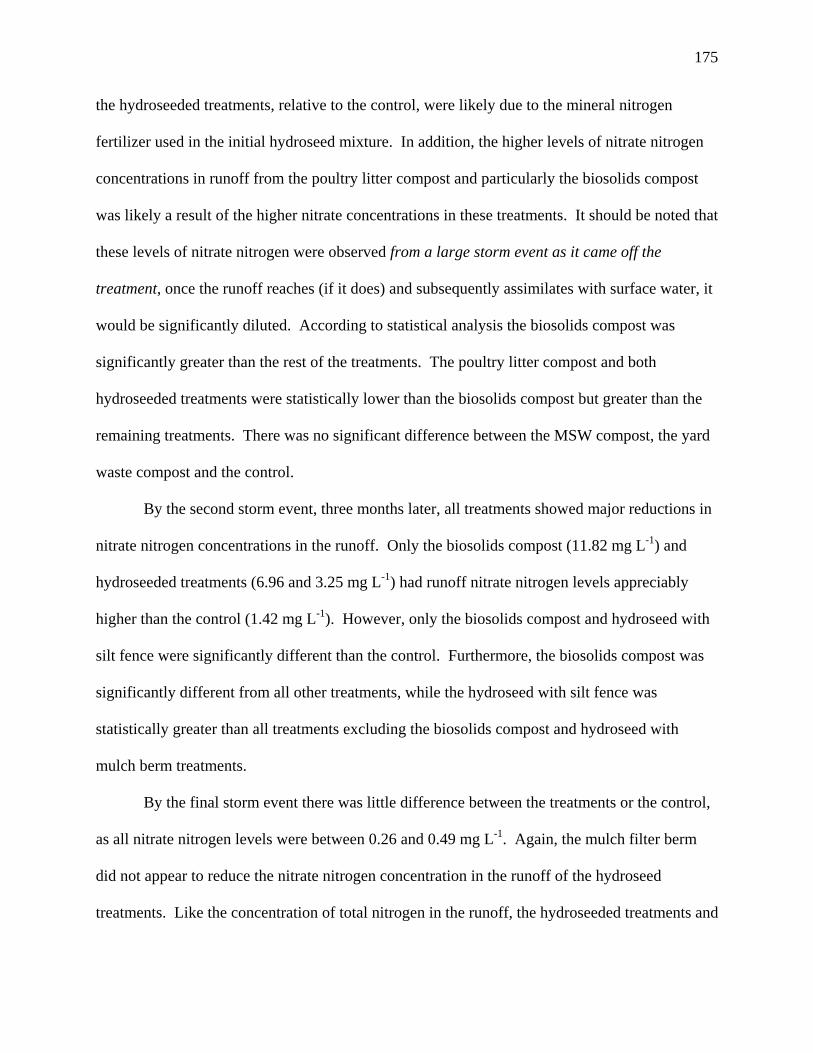
175
the hydroseeded treatments, relative to the control, were likely due to the mineral nitrogen
fertilizer used in the initial hydroseed mixture. In addition, the higher levels of nitrate nitrogen
concentrations in runoff from the poultry litter compost and particularly the biosolids compost
was likely a result of the higher nitrate concentrations in these treatments. It should be noted that
these levels of nitrate nitrogen were observed from a large storm event as it came off the
treatment, once the runoff reaches (if it does) and subsequently assimilates with surface water, it
would be significantly diluted. According to statistical analysis the biosolids compost was
significantly greater than the rest of the treatments. The poultry litter compost and both
hydroseeded treatments were statistically lower than the biosolids compost but greater than the
remaining treatments. There was no significant difference between the MSW compost, the yard
waste compost and the control.
By the second storm event, three months later, all treatments showed major reductions in
nitrate nitrogen concentrations in the runoff. Only the biosolids compost (11.82 mg L-1) and
hydroseeded treatments (6.96 and 3.25 mg L-1) had runoff nitrate nitrogen levels appreciably
higher than the control (1.42 mg L-1). However, only the biosolids compost and hydroseed with
silt fence were significantly different than the control. Furthermore, the biosolids compost was
significantly different from all other treatments, while the hydroseed with silt fence was
statistically greater than all treatments excluding the biosolids compost and hydroseed with
mulch berm treatments.
By the final storm event there was little difference between the treatments or the control,
as all nitrate nitrogen levels were between 0.26 and 0.49 mg L-1. Again, the mulch filter berm
did not appear to reduce the nitrate nitrogen concentration in the runoff of the hydroseed
treatments. Like the concentration of total nitrogen in the runoff, the hydroseeded treatments and
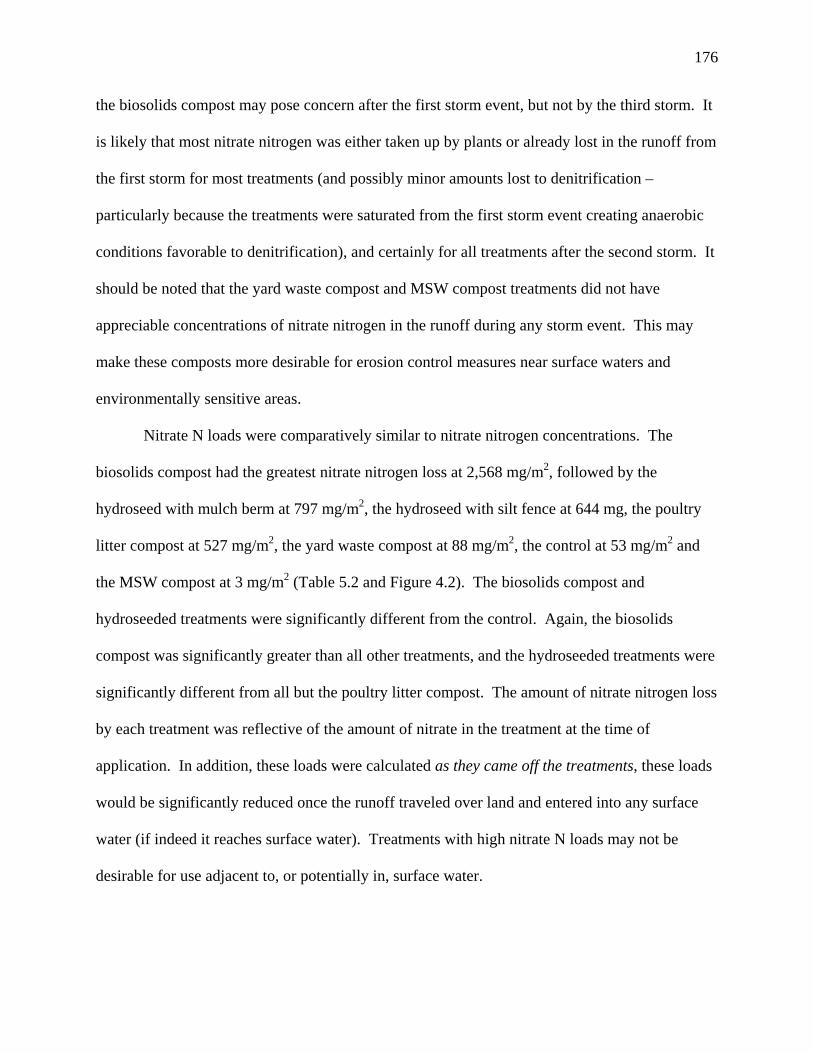
176
the biosolids compost may pose concern after the first storm event, but not by the third storm. It
is likely that most nitrate nitrogen was either taken up by plants or already lost in the runoff from
the first storm for most treatments (and possibly minor amounts lost to denitrification –
particularly because the treatments were saturated from the first storm event creating anaerobic
conditions favorable to denitrification), and certainly for all treatments after the second storm. It
should be noted that the yard waste compost and MSW compost treatments did not have
appreciable concentrations of nitrate nitrogen in the runoff during any storm event. This may
make these composts more desirable for erosion control measures near surface waters and
environmentally sensitive areas.
Nitrate N loads were comparatively similar to nitrate nitrogen concentrations. The
biosolids compost had the greatest nitrate nitrogen loss at 2,568 mg/m2, followed by the
hydroseed with mulch berm at 797 mg/m2, the hydroseed with silt fence at 644 mg, the poultry
litter compost at 527 mg/m2, the yard waste compost at 88 mg/m2, the control at 53 mg/m2 and
the MSW compost at 3 mg/m2 (Table 5.2 and Figure 4.2). The biosolids compost and
hydroseeded treatments were significantly different from the control. Again, the biosolids
compost was significantly greater than all other treatments, and the hydroseeded treatments were
significantly different from all but the poultry litter compost. The amount of nitrate nitrogen loss
by each treatment was reflective of the amount of nitrate in the treatment at the time of
application. In addition, these loads were calculated as they came off the treatments, these loads
would be significantly reduced once the runoff traveled over land and entered into any surface
water (if indeed it reaches surface water). Treatments with high nitrate N loads may not be
desirable for use adjacent to, or potentially in, surface water.

177
By the second storm event, major nitrate N load reductions were observed in all
treatments excluding the control and the MSW compost, which had comparatively low losses
from the first storm. Only the hydroseed with silt fence (172 mg/m2) and the biosolids compost
(126 mg/m2) had measurably higher nitrate N loads than the control (60 mg/m2), although
differences were not statistically significant. The other three compost treatments had extremely
low loads of nitrate N, between 3 to 9 mg/m2, partly because they generated relatively little
runoff during this storm event, an attribute that makes them attractive for other storm water
management applications.
During the final storm event, one year later, the control had the highest losses of nitrate N
in the runoff, followed by both hydroseeded treatments. This was probably due to the higher
volume of runoff produced by these treatments. All compost treatments lost less than half the
amount of nitrate N as the control, ranging between 5 mg/m2 and 10 mg/m2. Parallel to previous
discussion, the MSW compost and yard waste compost may be more desirable in applications
near surface water, as the nitrate N loads from these treatments were similar to a bare soil
throughout the study. After the first storm event, there would be reduced concern of nitrate N
loading from the poultry litter compost and hydroseed with mulch berm applications as well.
After the second storm event there is little concern for any of these treatments on nitrate N
loading of lakes, rivers or streams.
Table 5.2: Average nitrate N concentration (mg L-1) and average nitrate N load (mg/m2) in
runoff by treatment at day one, three months and twelve months, n=3.
DAY ONE THREE MONTHS TWELVE MONTHS
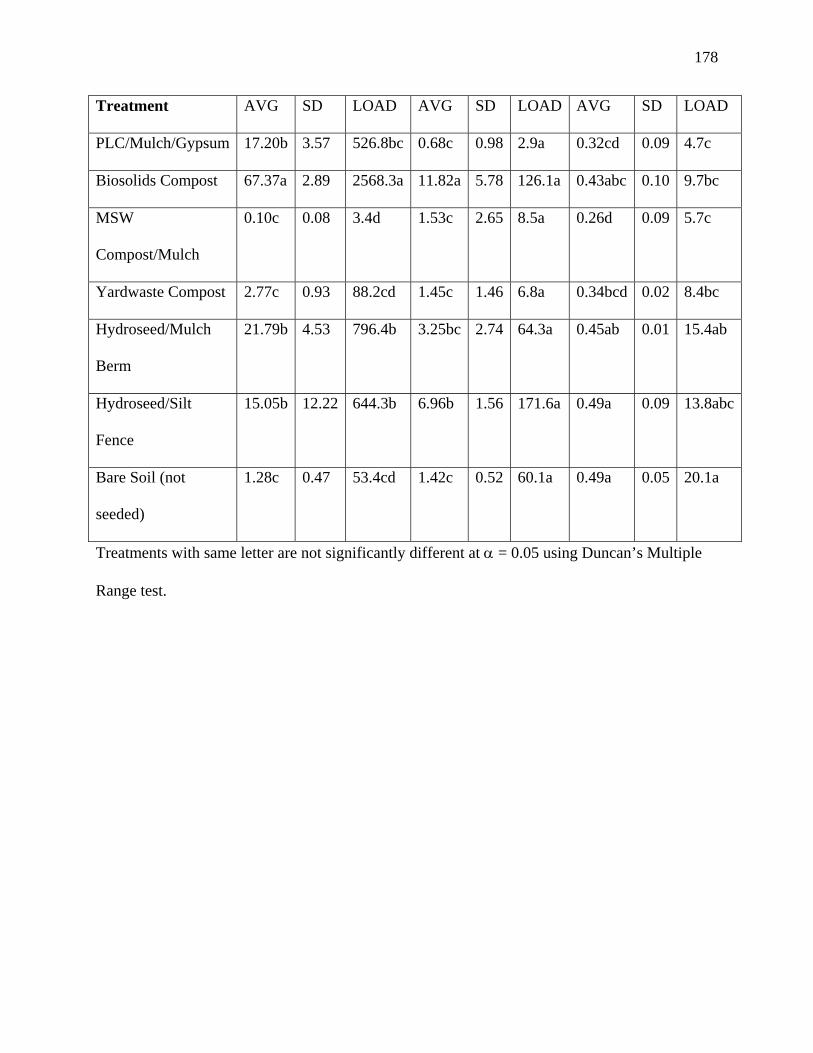
178
Treatment AVG SD LOAD AVG SD LOAD AVG SD LOAD
PLC/Mulch/Gypsum 17.20b 3.57 526.8bc 0.68c 0.98 2.9a 0.32cd 0.09 4.7c
Biosolids Compost 67.37a 2.89 2568.3a 11.82a 5.78 126.1a 0.43abc 0.10 9.7bc
MSW
Compost/Mulch
0.10c 0.08 3.4d 1.53c 2.65 8.5a 0.26d 0.09 5.7c
Yardwaste Compost 2.77c 0.93 88.2cd 1.45c 1.46 6.8a 0.34bcd 0.02 8.4bc
Hydroseed/Mulch
Berm
21.79b 4.53 796.4b 3.25bc 2.74 64.3a 0.45ab 0.01 15.4ab
Hydroseed/Silt
Fence
15.05b 12.22 644.3b 6.96b 1.56 171.6a 0.49a 0.09 13.8abc
Bare Soil (not
seeded)
1.28c 0.47 53.4cd 1.42c 0.52 60.1a 0.49a 0.05 20.1a
Treatments with same letter are not significantly different at α = 0.05 using Duncan’s Multiple
Range test.
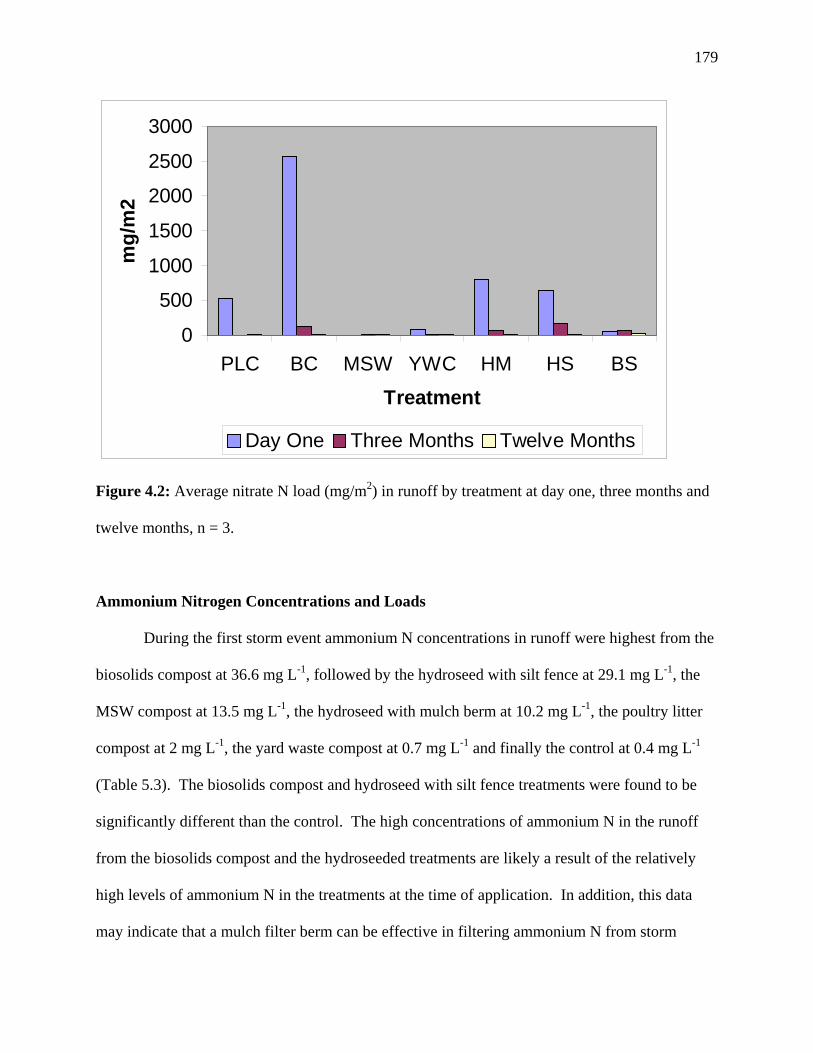
179
0
500
1000
1500
2000
2500
3000
PLC BC MSW YWC HM HS BS
Treatment
mg/
m2
Day One Three Months Twelve Months
Figure 4.2: Average nitrate N load (mg/m2) in runoff by treatment at day one, three months and
twelve months, n = 3.
Ammonium Nitrogen Concentrations and Loads
During the first storm event ammonium N concentrations in runoff were highest from the
biosolids compost at 36.6 mg L-1, followed by the hydroseed with silt fence at 29.1 mg L-1, the
MSW compost at 13.5 mg L-1, the hydroseed with mulch berm at 10.2 mg L-1, the poultry litter
compost at 2 mg L-1, the yard waste compost at 0.7 mg L-1 and finally the control at 0.4 mg L-1
(Table 5.3). The biosolids compost and hydroseed with silt fence treatments were found to be
significantly different than the control. The high concentrations of ammonium N in the runoff
from the biosolids compost and the hydroseeded treatments are likely a result of the relatively
high levels of ammonium N in the treatments at the time of application. In addition, this data
may indicate that a mulch filter berm can be effective in filtering ammonium N from storm

180
runoff; however, further replication would be required to draw definitive conclusions. Also, the
blending of wood mulch with the poultry litter compost may have been partly responsible for the
comparatively low levels of ammonium N in the runoff. The moderate levels of ammonium loss
by the MSW compost may be because of its high pH (8.1), which attracts base forming cations
like ammonium N.
During the second storm event ammonium N concentrations in the runoff were
appreciatively lower for the biosolids compost (9.8 mg L-1) and hydroseeded treatments (0.8 and
0.4 mg L-1); however, the biosolids compost remained significantly different from the control.
All other treatments including the control ranged from 0.35 to 1.48 mg L-1. Again, this was
likely due to plant uptake and losses from the previous storm. By the final storm event, there
appeared to be little difference in runoff ammonium N concentrations between treatments. The
poultry litter compost had the highest concentrations at 0.71 mg L-1, followed by the control at
0.36 mg L-1, the biosolids compost at 0.20 mg L-1, and the hydroseed with silt fence at 0.19 mg
L-1. The remaining treatments had concentrations under the detectable limit. Differences
between treatments during the final storm event were not statistically significant.
Based on this study, using yard waste compost as an erosion control measure, would have
about the same ammonium N concentration in the runoff as a bare soil, during the first large
storm event after application; while the hydroseeded treatments, biosolids compost, and MSW
compost may pose a risk if used directly adjacent to or potentially in surface water. After the
first large storm, the hydroseed treatments would likely no longer pose a risk, and after the
second storm none of these treatments would pose a risk from ammonium N concentrated runoff.
It is interesting to note that ammonium N would still be elevated in the biosolids compost runoff
three months after application (this may be an indication that the material was not well

181
composted prior to the study). Often ammonium N transforms to nitrite and then to nitrate N
through nitrification within several weeks (and during the curing phase of the composting
process) unless pH levels are high (they were not), this may be why ammonium N concentrations
were lower overall relative nitrate N concentrations during the second storm event. Another
reason ammonium N concentrations can be lower is that ammonium N adsorbs to clay and
humus colloids (both were in abundance – mature composts have high humus content), unlike
nitrate N, making it less susceptible to loss in runoff. Additionally, plants and microorganisms
would likely take up extra ammonium N.
Ammonium N loading may be a better indicator of the potential pollution of ammonium
N released from these experimental treatments during a storm event. During the first storm the
biosolids compost generated the highest ammonium N loads at 1400 mg/m2, followed by the
hydroseed with silt fence at 536 mg/m2, the hydroseed with mulch berm at 406 mg/m2, the MSW
compost at 298 mg/m2, the poultry litter compost at 52 mg/m2, the yard waste compost at 26
mg/m2 and finally the control at 18 mg/m2 (Table 5.3). Again, the biosolids compost and
hydroseed with silt fence treatments were significantly different than the control. Additionally,
the biosolids compost was significantly different than all other treatments, while hydroseed with
silt fence was significantly different from each of the compost treatments.
By the second storm event ammonium N loads decreased to levels below the control for
all treatments except the biosolids compost, which remained the only treatment significantly
different from the control (Figure 4.3). This was likely due to the comparatively high volumes of
runoff produced by the control, as well as the relatively high content of ammonium N in the
biosolids compost treatment. By the final storm event, only the poultry litter compost (17

182
mg/m2) had slightly greater ammonium N losses than the control (15 mg/m2), although the
difference was not statistically significant.
Under field application, all but the biosolids compost treatment would have a negligible
effect on ammonium N loading of surface water after the first large storm event. In fact, because
of reductions in runoff volumes of these treatments, relative to the control, there may be less
ammonium N loading from these erosion control measures than a bare soil.
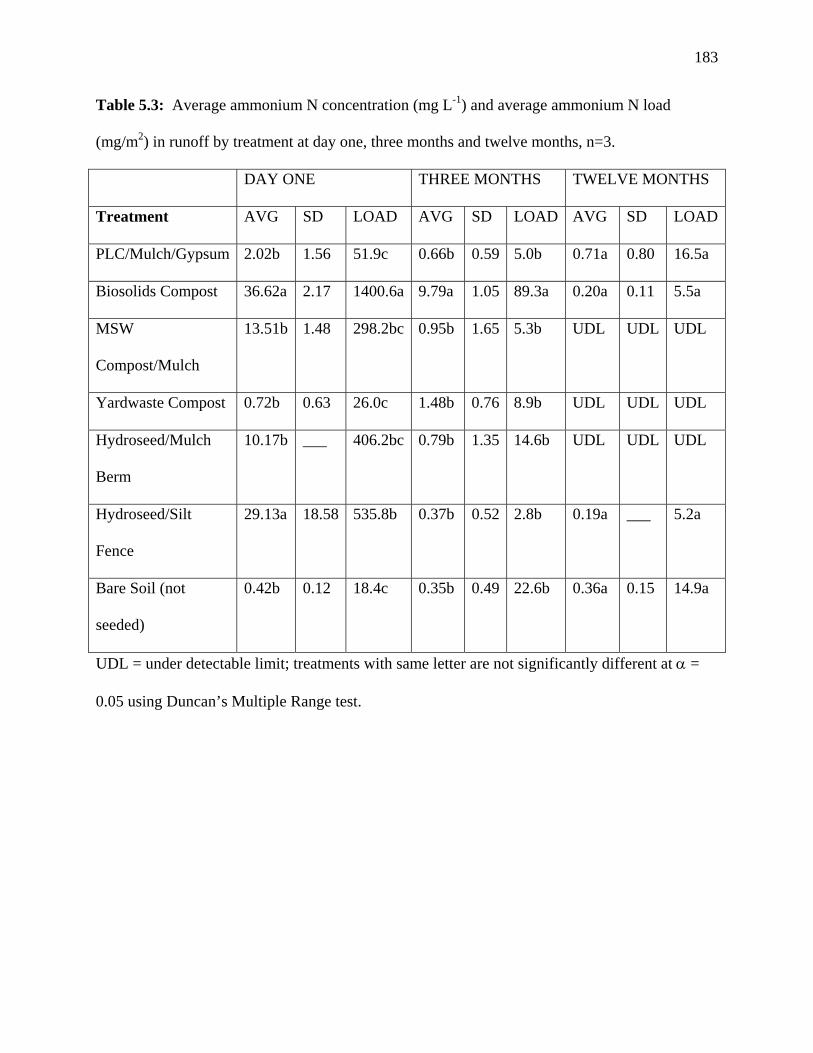
183
Table 5.3: Average ammonium N concentration (mg L-1) and average ammonium N load
(mg/m2) in runoff by treatment at day one, three months and twelve months, n=3.
DAY ONE THREE MONTHS TWELVE MONTHS
Treatment AVG SD LOAD AVG SD LOAD AVG SD LOAD
PLC/Mulch/Gypsum 2.02b 1.56 51.9c 0.66b 0.59 5.0b 0.71a 0.80 16.5a
Biosolids Compost 36.62a 2.17 1400.6a 9.79a 1.05 89.3a 0.20a 0.11 5.5a
MSW
Compost/Mulch
13.51b 1.48 298.2bc 0.95b 1.65 5.3b UDL UDL UDL
Yardwaste Compost 0.72b 0.63 26.0c 1.48b 0.76 8.9b UDL UDL UDL
Hydroseed/Mulch
Berm
10.17b ___ 406.2bc 0.79b 1.35 14.6b UDL UDL UDL
Hydroseed/Silt
Fence
29.13a 18.58 535.8b 0.37b 0.52 2.8b 0.19a ___ 5.2a
Bare Soil (not
seeded)
0.42b 0.12 18.4c 0.35b 0.49 22.6b 0.36a 0.15 14.9a
UDL = under detectable limit; treatments with same letter are not significantly different at α =
0.05 using Duncan’s Multiple Range test.

184
0200400600800
1000120014001600
PLC BC MSW YWC HM HS BS
Treatment
mg/
m2
Day One Three Months Twelve Months
Figure 4.3: Average ammonium N load (mg/m2) in runoff by treatment at day one, three months
and twelve months, n = 3.
Total Phosphorus Concentrations and Loads
While phosphorus is not toxic to animals and humans it is one of the main causes of
eutrophication in surface water, which can lead to impaired water quality. Total phosphorus
concentrations generally used for wastewater treatment plant discharges is 5 mg L-1, while the
critical concentration of total P (particulate P + dissolved P) in streams at which eutrophication is
triggered is 0.10 mg L-1, and 0.03 mg L-1 for dissolved P (Brady and Weil, 1996). The total
amount of phosphorus applied by each treatment was 95 g/m2 from the poultry litter compost, 85
g/m2 from the biosolids compost, 23 g/m2 from the MSW compost, 61 g/m2 from the yard waste
compost, and 10 g/m2 from the hydroseeding.

185
During the first storm event, immediately after treatment application, total phosphorus
concentration in the runoff was highest in the hydroseeded treatments, 25.87 mg L-1 from the
hydroseed with mulch berm and 22.4 mg L-1 from the hydroseed with silt fence (Table 5.4). This
was probably due to the high degree of soluble P fertilizer in the initial hydroseed mixture. All
treatments, including the four compost treatments, had higher concentrations of total P in the
runoff than the control, although only the hydroseeded treatments were statistically different than
the control. The biosolids compost treatment had the highest total P runoff concentration among
the composts with 4.13 mg L-1, followed by the poultry litter compost at 3.07 mg L-1. The MSW
compost and yard waste composts had the lowest total P concentrations among the composts,
with 2.19 and 2.15 mg L-1, respectively. It appeared that the mulch filter berm did not reduce
total P concentrations compared to silt fence among the hydroseeded treatments.
During the second storm event, three months after treatment application, all treatments
had reductions in total P concentration in runoff with the exception of a slight increase from the
control and the biosolids compost treatment. Only the biosolids compost was significantly
different than the control by this storm event. The hydroseeded treatments showed the greatest
decrease in total P concentrations in the runoff, probably because most if it was already lost after
the first storm event while the vegetation took up lesser amounts and/or it moved into the soil
profile. The biosolids compost had the highest concentrations of total P at 6.3 mg L-1 (up from
4.13 mg L-1), followed by the hydroseed with silt fence at 1.64 mg L-1, the yard waste compost at
1.61 mg L-1, the poultry litter compost at 1.58 mg L-1, and the hydroseed with mulch berm at
1.42 mg L-1. The MSW compost treatment had lower total P concentrations in the runoff during
the second storm event than the control.

186
During the third storm event, one year after the first storm, all treatments had reduced
concentrations of total P in the runoff from the first and second storm events, with the exception
of the control and MSW compost, which showed very slight increases. The biosolids compost
continued to have the highest total P concentration at 1.96 mg L-1 followed by the poultry litter
compost at 1.039 mg L-1. The biosolids compost remained the only treatment significantly
different than the control, while the poultry litter compost was significantly different than the
yard waste compost and hydroseed with mulch berm treatments. The yard waste compost had
the lowest concentrations during the final storm event at 0.479 mg L-1, followed closely by the
hydroseed with mulch berm at 0.485 mg L-1, the MSW compost at 0.532 mg L-1, the control at
0.642 mg L-1 and finally the hydroseed the silt fence at 0.704 mg L-1.
Table 5.4: Average total P concentration (mg L-1) and average total P load (mg/m2) in runoff by
treatment at day one, three months and twelve months, n=3.
DAY ONE THREE MONTHS TWELVE MONTHS
Treatment AVG SD LOAD AVG SD LOAD AVG SD LOAD
PLC/Mulch/Gypsum 3.073b 1.403 86.7c 1.582b 1.374 16.2a 1.039b 0.029 16.5ab
Biosolids Compost 4.125b 0.265 156.7bc 6.298a 0.592 53.9a 1.962a 0.498 46.2a
MSW
Compost/Mulch
2.192b 0.251 33.2c 0.450b 0.779 7.5a 0.532bc 0.278 11.9b
Yardwaste Compost 2.152b 0.279 70.1c 1.610b 0.567 10.3a 0.479c 0.112 12.5b
Hydroseed/Mulch
Berm
25.867a 13.241 924.7a 1.420b 0.309 27.7a 0.485c 0.145 17.5ab
Hydroseed/Silt 22.398a 6.077 483.0b 1.635b 0.563 41.0a 0.704bc 0.364 20.5ab
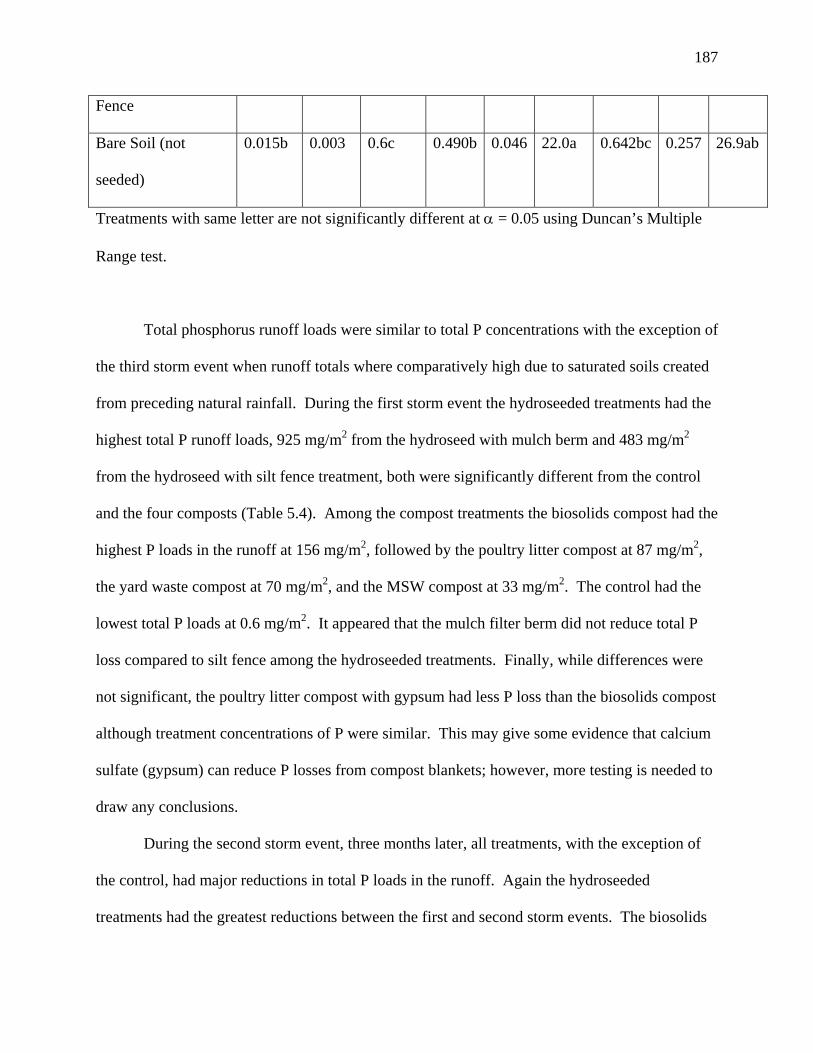
187
Fence
Bare Soil (not
seeded)
0.015b 0.003 0.6c 0.490b 0.046 22.0a 0.642bc 0.257 26.9ab
Treatments with same letter are not significantly different at α = 0.05 using Duncan’s Multiple
Range test.
Total phosphorus runoff loads were similar to total P concentrations with the exception of
the third storm event when runoff totals where comparatively high due to saturated soils created
from preceding natural rainfall. During the first storm event the hydroseeded treatments had the
highest total P runoff loads, 925 mg/m2 from the hydroseed with mulch berm and 483 mg/m2
from the hydroseed with silt fence treatment, both were significantly different from the control
and the four composts (Table 5.4). Among the compost treatments the biosolids compost had the
highest P loads in the runoff at 156 mg/m2, followed by the poultry litter compost at 87 mg/m2,
the yard waste compost at 70 mg/m2, and the MSW compost at 33 mg/m2. The control had the
lowest total P loads at 0.6 mg/m2. It appeared that the mulch filter berm did not reduce total P
loss compared to silt fence among the hydroseeded treatments. Finally, while differences were
not significant, the poultry litter compost with gypsum had less P loss than the biosolids compost
although treatment concentrations of P were similar. This may give some evidence that calcium
sulfate (gypsum) can reduce P losses from compost blankets; however, more testing is needed to
draw any conclusions.
During the second storm event, three months later, all treatments, with the exception of
the control, had major reductions in total P loads in the runoff. Again the hydroseeded
treatments had the greatest reductions between the first and second storm events. The biosolids

188
compost had the highest total P loads during the second storm event at 54 mg/m2, followed by
the hydroseed with silt fence at 41 mg/m2, the hydroseed with mulch berm at 28 mg/m2, the
control at 22 mg/m2, and the poultry litter compost at 16 mg/m2. The MSW compost had the
lowest total P loads followed by the yard waste compost at 7 mg/m2 and 10 mg/m2, respectively;
however, there were no significant differences between treatments during this storm event.
By the final storm event, the biosolids compost continued to have the highest total P
loads in the storm runoff at 46 mg/m2 followed by the control at 27 mg/m2. The MSW compost
and yard waste compost continued to have the lowest total P loads at 12 mg/m2 and 13 mg/m2,
respectively. Although not significantly different from the control, the biosolids compost was
significantly different from these two composts. Both hydroseeded treatments continued to have
higher total P loads than the poultry litter compost in the storm runoff. Total P lost in the runoff
as a percent of the total P applied from the treatments for all three storms combined was 9.7%
from the hydroseed with mulch berm, 5.4% from the hydroseed with silt fence, 0.4% from the
biosolids compost, 0.2% from the MSW compost, and 0.1% for both the yard waste compost and
poultry litter compost. See Figure 4.4 for total P loads in the storm runoff for all treatments and
storm events.

189
0
200
400
600
800
1000
PLC BC MSW YWC HM HS BS
Treatment
mg/
m2
DAY ONE THREE MONTHS TWELVE MONTHS
Figure 4.4: Average total P load (mg/m2) in runoff by treatment at day one, three months and
twelve months, n = 3.
Dissolved Reactive Phosphorus Concentrations and Loads
During the first storm event, just after treatment application, the runoff concentrations of
dissolved reactive phosphorus (DRP) were highest among the hydroseeded treatments, 24.19 mg
L-1 from the hydroseed with mulch berm and 19.24 mg L-1 from the hydroseed with silt fence
treatment (Table 5.5). These were the only treatments significantly different than the control for
this storm event. As with total P concentrations, the biosolids compost had the highest DRP
concentrations among the compost treatments at 3.72 mg L-1, followed by the poultry litter
compost at 2.68 mg L-1. Again the MSW compost had the lowest DRP concentrations after the
control, 0.20 and 0.01 mg L-1 respectively. These results were interesting for several reasons.
First, it is well documented that highly weathered clay soils (like Fe/Al oxides represented in this
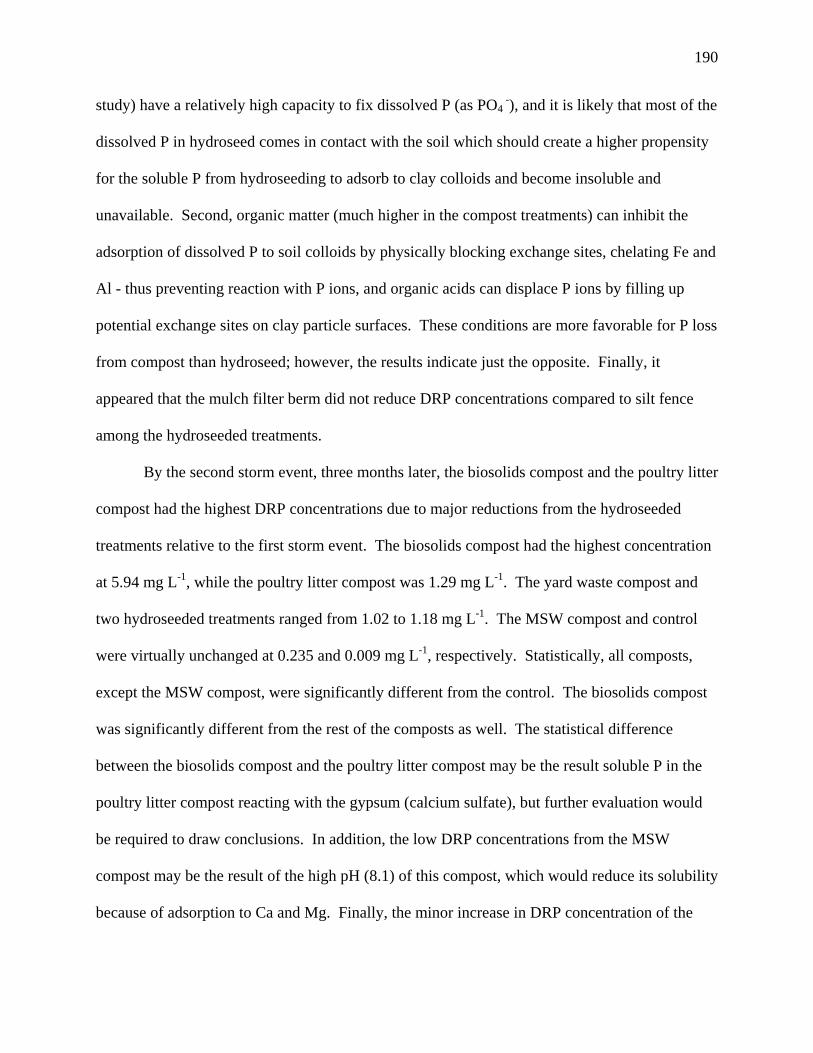
190
study) have a relatively high capacity to fix dissolved P (as PO4 -), and it is likely that most of the
dissolved P in hydroseed comes in contact with the soil which should create a higher propensity
for the soluble P from hydroseeding to adsorb to clay colloids and become insoluble and
unavailable. Second, organic matter (much higher in the compost treatments) can inhibit the
adsorption of dissolved P to soil colloids by physically blocking exchange sites, chelating Fe and
Al - thus preventing reaction with P ions, and organic acids can displace P ions by filling up
potential exchange sites on clay particle surfaces. These conditions are more favorable for P loss
from compost than hydroseed; however, the results indicate just the opposite. Finally, it
appeared that the mulch filter berm did not reduce DRP concentrations compared to silt fence
among the hydroseeded treatments.
By the second storm event, three months later, the biosolids compost and the poultry litter
compost had the highest DRP concentrations due to major reductions from the hydroseeded
treatments relative to the first storm event. The biosolids compost had the highest concentration
at 5.94 mg L-1, while the poultry litter compost was 1.29 mg L-1. The yard waste compost and
two hydroseeded treatments ranged from 1.02 to 1.18 mg L-1. The MSW compost and control
were virtually unchanged at 0.235 and 0.009 mg L-1, respectively. Statistically, all composts,
except the MSW compost, were significantly different from the control. The biosolids compost
was significantly different from the rest of the composts as well. The statistical difference
between the biosolids compost and the poultry litter compost may be the result soluble P in the
poultry litter compost reacting with the gypsum (calcium sulfate), but further evaluation would
be required to draw conclusions. In addition, the low DRP concentrations from the MSW
compost may be the result of the high pH (8.1) of this compost, which would reduce its solubility
because of adsorption to Ca and Mg. Finally, the minor increase in DRP concentration of the

191
biosolids compost from the first to the second storm event could be from minor acidification
caused by the rainfall, which could lead to an increase in the solubility of P.
By the final storm event, one year after the first event, all treatments showed reductions
in DRP concentrations with the exception of the MSW compost and control, which showed
slight increases. The biosolids compost again had the highest concentrations at 1.65 mg L-1,
followed by the poultry litter compost treatment at 0.86 mg L-1, the control at 0.47 mg L-1, the
hydroseed with silt fence at 0.44 mg L-1, the hydroseed with mulch berm at 0.38 mg L-1, the yard
waste compost at 0.37 mg L-1, and finally the MSW compost at 0.33 mg L-1. Both the biosolids
compost and poultry litter compost were significantly different from the control, and from each
other. The major reduction in DRP concentrations in the runoff of the hydroseeded treatments
between the first and second storm events was probably due to the same factors that led to the
reductions in the concentration of total P.
Table 5.5: Average DRP concentration (mg L-1) and average DRP load (mg/m2) in runoff by
treatment at day one, three months and twelve months, n=3.
DAY ONE THREE MONTHS TWELVE MONTHS
Treatment AVG SD LOAD AVG SD LOAD AVG SD LOAD
PLC/Mulch/Gypsum 2.68b 1.261 75.3c 1.293b 1.121 13.4a 0.863b 0.022 13.7b
Biosolids Compost 3.722b 0.406 141.2bc 5.935a 0.480 51.4a 1.652a 0.348 37.8a
MSW
Compost/Mulch
0.204b 0.079 2.7c 0.235bc 0.407 3.9a 0.332c 0.068 7.4b
Yardwaste Compost 1.738b 0.246 56.5c 1.176b 0.355 7.7a 0.366c 0.117 9.7b
Hydroseed/Mulch 24.194a 12.753 865.6a 1.059bc 0.434 20.3a 0.382c 0.140 13.8b
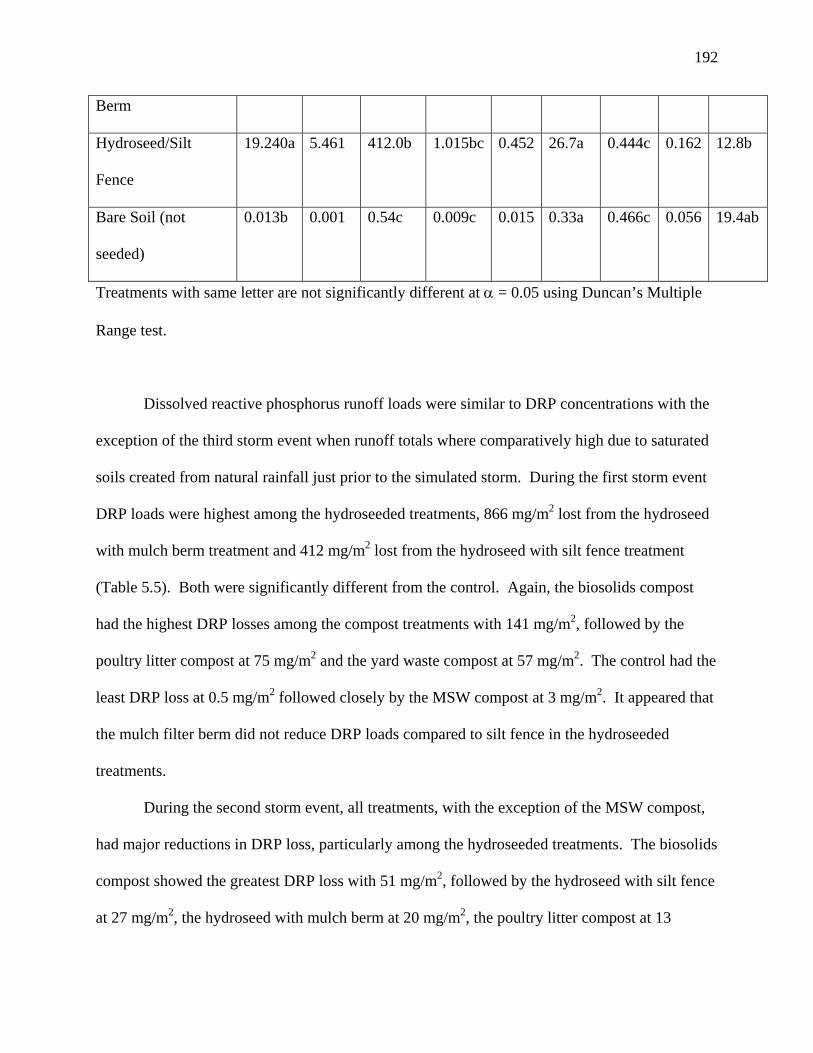
192
Berm
Hydroseed/Silt
Fence
19.240a 5.461 412.0b 1.015bc 0.452 26.7a 0.444c 0.162 12.8b
Bare Soil (not
seeded)
0.013b 0.001 0.54c 0.009c 0.015 0.33a 0.466c 0.056 19.4ab
Treatments with same letter are not significantly different at α = 0.05 using Duncan’s Multiple
Range test.
Dissolved reactive phosphorus runoff loads were similar to DRP concentrations with the
exception of the third storm event when runoff totals where comparatively high due to saturated
soils created from natural rainfall just prior to the simulated storm. During the first storm event
DRP loads were highest among the hydroseeded treatments, 866 mg/m2 lost from the hydroseed
with mulch berm treatment and 412 mg/m2 lost from the hydroseed with silt fence treatment
(Table 5.5). Both were significantly different from the control. Again, the biosolids compost
had the highest DRP losses among the compost treatments with 141 mg/m2, followed by the
poultry litter compost at 75 mg/m2 and the yard waste compost at 57 mg/m2. The control had the
least DRP loss at 0.5 mg/m2 followed closely by the MSW compost at 3 mg/m2. It appeared that
the mulch filter berm did not reduce DRP loads compared to silt fence in the hydroseeded
treatments.
During the second storm event, all treatments, with the exception of the MSW compost,
had major reductions in DRP loss, particularly among the hydroseeded treatments. The biosolids
compost showed the greatest DRP loss with 51 mg/m2, followed by the hydroseed with silt fence
at 27 mg/m2, the hydroseed with mulch berm at 20 mg/m2, the poultry litter compost at 13

193
mg/m2, and finally the yard waste compost with 8 mg/m2. Again the control had the lowest DRP
load with 0.3 mg/m2 followed by the MSW compost at 4 mg/m2 (up from 2.7 mg/m2). None of
these differences were statistically significant.
During the final storm event, DRP loads had decreased relative to the first storm event
but were similar to the second storm event, probably due to the increased runoff volumes
experienced during this storm. Only the hydroseeded and biosolids compost treatments showed
DRP load reductions between the second and final storm event. The biosolids compost had the
highest DRP loads at 38 mg/m2, followed by the control with 19 mg/m2, the hydroseed with
mulch berm at 13.8 mg/m2, the poultry litter compost at 13.7 mg/m2, the hydroseed with silt
fence at 12.8 mg/m2, the yard waste at 10 mg/m2, and finally the MSW compost at 7 mg/m2.
Interestingly, the biosolids compost was significantly different from all other treatments except
the control – likely due to the high runoff volumes generated by the control. See Figure 4.5 for
DRP loads among treatments and between storm events.

194
0
200
400
600
800
1000
PLC BC MSW YWC HM HS BS
Treatment
mg/
m2
DAY ONE THREE MONTHS TWELVE MONTHS
Figure 4.5: Average DRP load (mg/m2) in runoff by treatment at day one, three months and
twelve months, n = 3.
Dissolved Reactive Phosphorus to Total Phosphorus Load Ratio
Another way to look at P loss is to calculate the DRP to total P load ratio, particularly
because DRP is bioavailable while not all total P is bioavailable. It is DRP that reacts
immediately with plants causing eutrophication while the remaining P (that attached to sediment)
is not immediately bioavailable. A ratio of 1.0 signifies 100% of the total P lost was in the form
of DRP. During the first storm event the DRP:total P of the control was 0.9 (Table 5.6). The
biosolids compost, poultry litter compost, and both hydroseeded treatments had similar ratios.
The hydroseed with mulch berm treatment had the highest ratio of 0.94 while the MSW compost
had the lowest ratio at 0.08, signifying that most of the P lost from the hydroseed was
bioavailable while most lost from the MSW compost was not.
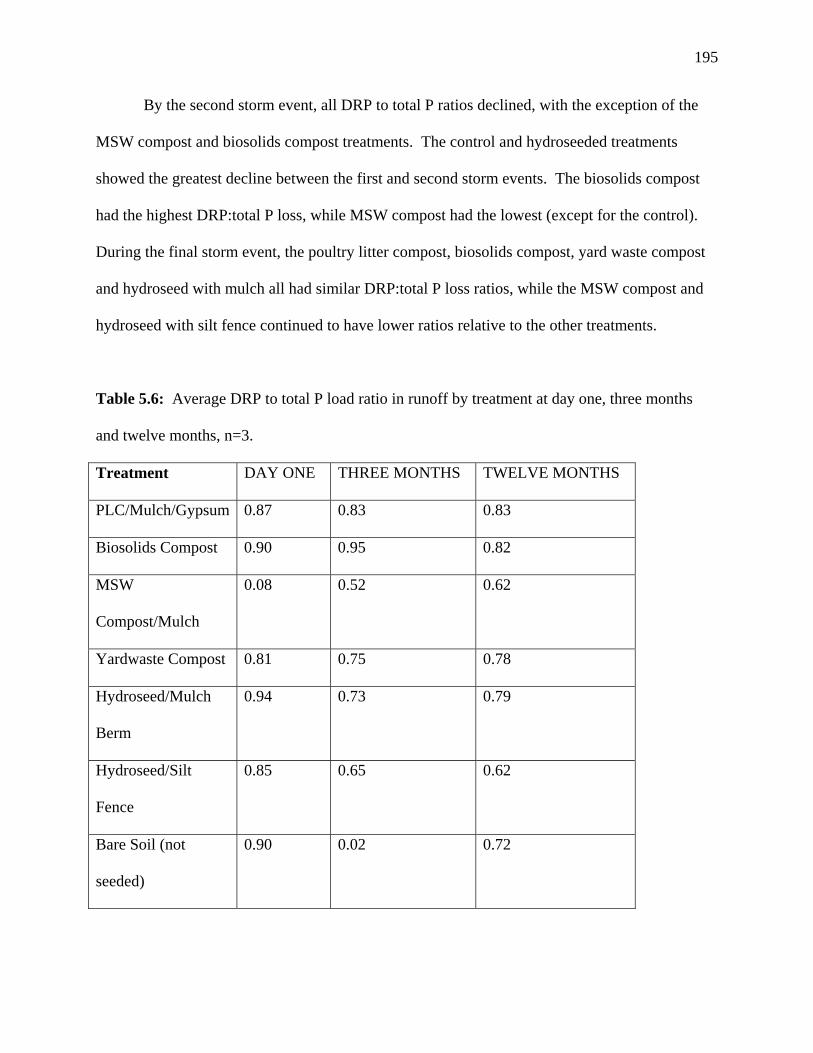
195
By the second storm event, all DRP to total P ratios declined, with the exception of the
MSW compost and biosolids compost treatments. The control and hydroseeded treatments
showed the greatest decline between the first and second storm events. The biosolids compost
had the highest DRP:total P loss, while MSW compost had the lowest (except for the control).
During the final storm event, the poultry litter compost, biosolids compost, yard waste compost
and hydroseed with mulch all had similar DRP:total P loss ratios, while the MSW compost and
hydroseed with silt fence continued to have lower ratios relative to the other treatments.
Table 5.6: Average DRP to total P load ratio in runoff by treatment at day one, three months
and twelve months, n=3.
Treatment DAY ONE THREE MONTHS TWELVE MONTHS
PLC/Mulch/Gypsum 0.87 0.83 0.83
Biosolids Compost 0.90 0.95 0.82
MSW
Compost/Mulch
0.08 0.52 0.62
Yardwaste Compost 0.81 0.75 0.78
Hydroseed/Mulch
Berm
0.94 0.73 0.79
Hydroseed/Silt
Fence
0.85 0.65 0.62
Bare Soil (not
seeded)
0.90 0.02 0.72
196
Correlation Analysis
Results from correlation analysis (Table 5.7) were used to evaluate which of the
treatment physical, chemical, and biological characteristics, and rainfall and vegetation growth
results (independent variables) were correlated with the parameters from nutrient loss results
(response variables). Only those that were highly correlated (r>0.70) are reported. Results from
the first storm event show that total N, nitrate N, and ammonium N concentrations and loads
were all highly correlated to the ammonium N and nitrate N content of the compost treatment.
Generally, the higher the nitrate and/or ammonium N content of the compost the greater the loss
of that nutrient in the runoff.
Total P and DRP concentrations and loads from the first storm event were correlated to
organic matter content, C content and C:N of the compost treatments. Generally, the higher the
organic matter content, C content, and C:N of the compost the lower the P concentration and
load in the resulting storm runoff; however, the yard waste compost did have comparatively low
organic matter, C and C:N along with relatively low losses of P. This may indicate that some
dissolved inorganic P in the runoff reacted with humus colloids in the compost treatments or that
microorganisms immobilized some dissolved inorganic P because of insufficient P relative to C.
This may also be an indication that composts with a higher percentage of organic P relative to
soluble P (although not directly tested) in compost can lead to less P loss. Also interesting to
note (although not well correlated in this analysis), is that the compost treatments that lost the
most P had near neutral pH, while the MSW compost and yard waste compost pH levels were
near 8.0, potentially meaning that the P was not as mobile in the latter composts because it was
bound to Ca and Mg. Additionally, the higher the total P concentration in the compost, the
greater the concentration and load in the runoff.

197
Analysis from the second storm event still show a high correlation with total N
concentrations, nitrate N concentrations, ammonium N concentrations, and ammonium N loads
with nitrate and ammonium content of the compost treatment. Additionally, the nitrate N
concentration, ammonium N concentration, and ammonium N load was correlated to the number
of weed species and weed plants at this time period. Generally, the greater the ammonium N
loss in the runoff, the greater the number of weed species and weed plants in the treatment. A
similar trend was found with nitrate N loss as well. This may signal that composts higher in
ammonium N and nitrate N are more susceptible to weed growth; additionally, ammonium N in
compost is often a signal that it has not been composted sufficiently which can also lead to
inadequate elimination of weed seeds during the composting process.
Interestingly, the parameters correlated to total P losses and DRP losses during the
second storm were not the same as the first storm. Total P concentration, DRP concentration and
DRP loads were correlated to nitrate N and ammonium N contents of the compost as well as the
number of weed species and weed plants present (excluding DRP loads). The greater the number
of weed plants and weed species, the higher the total P concentration, DRP concentration, and
DRP load in the runoff. These correlations may signify that composts high in P are more
susceptible to weed growth and that generally if compost is high in P it is more likely to have a
relatively high ammonium N and nitrate N content as well (at least among these four composts).
During the final storm event total P and DRP concentrations were correlated to nitrate N
and ammonium N content of the compost and to the number of weed species and percent cover
of weeds during the storm event. Generally, the higher the total P and DRP concentration in the
runoff, the higher the ammonium N and nitrate N content in the compost, and the fewer the
number of weed species growing the compost treatment.
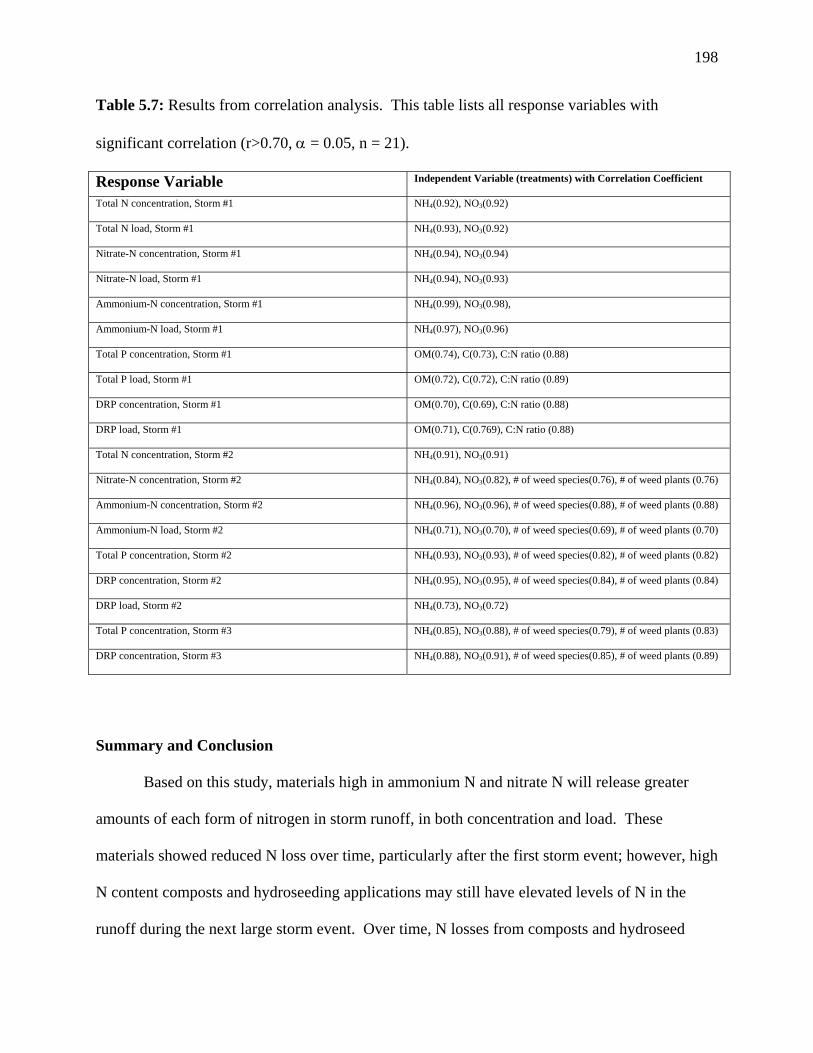
198
Table 5.7: Results from correlation analysis. This table lists all response variables with
significant correlation (r>0.70, α = 0.05, n = 21).
Response Variable Independent Variable (treatments) with Correlation Coefficient
Total N concentration, Storm #1 NH4(0.92), NO3(0.92)
Total N load, Storm #1 NH4(0.93), NO3(0.92)
Nitrate-N concentration, Storm #1 NH4(0.94), NO3(0.94)
Nitrate-N load, Storm #1 NH4(0.94), NO3(0.93)
Ammonium-N concentration, Storm #1 NH4(0.99), NO3(0.98),
Ammonium-N load, Storm #1 NH4(0.97), NO3(0.96)
Total P concentration, Storm #1 OM(0.74), C(0.73), C:N ratio (0.88)
Total P load, Storm #1 OM(0.72), C(0.72), C:N ratio (0.89)
DRP concentration, Storm #1 OM(0.70), C(0.69), C:N ratio (0.88)
DRP load, Storm #1 OM(0.71), C(0.769), C:N ratio (0.88)
Total N concentration, Storm #2 NH4(0.91), NO3(0.91)
Nitrate-N concentration, Storm #2 NH4(0.84), NO3(0.82), # of weed species(0.76), # of weed plants (0.76)
Ammonium-N concentration, Storm #2 NH4(0.96), NO3(0.96), # of weed species(0.88), # of weed plants (0.88)
Ammonium-N load, Storm #2 NH4(0.71), NO3(0.70), # of weed species(0.69), # of weed plants (0.70)
Total P concentration, Storm #2 NH4(0.93), NO3(0.93), # of weed species(0.82), # of weed plants (0.82)
DRP concentration, Storm #2 NH4(0.95), NO3(0.95), # of weed species(0.84), # of weed plants (0.84)
DRP load, Storm #2 NH4(0.73), NO3(0.72)
Total P concentration, Storm #3 NH4(0.85), NO3(0.88), # of weed species(0.79), # of weed plants (0.83)
DRP concentration, Storm #3 NH4(0.88), NO3(0.91), # of weed species(0.85), # of weed plants (0.89)
Summary and Conclusion
Based on this study, materials high in ammonium N and nitrate N will release greater
amounts of each form of nitrogen in storm runoff, in both concentration and load. These
materials showed reduced N loss over time, particularly after the first storm event; however, high
N content composts and hydroseeding applications may still have elevated levels of N in the
runoff during the next large storm event. Over time, N losses from composts and hydroseed
199
treated soils returned to background levels. Total N lost in the runoff as a percent of the total
applied by the composts after three large storms ranged between 0.7 and 3.9% compared to 12.2
to 15.3% for the hydroseeded treatments. Additionally, composts high in ammonium N and
Nitrate N may be more susceptible to weed growth. It does not appear that mulch filter berms
substantially reduce total N or nitrate N in runoff from hydroseeded applications; however, there
may be evidence that mulch berms can filter ammonium N from storm water runoff. For
professionals utilizing compost blankets it is recommended that composts have a high percentage
of organic N content relative to inorganic N to avoid pollution from runoff.
Based on this study, soil application of hydroseeding can lead to high P concentrations
and loads in storm runoff. However, this may only be a concern for the first storm event after
application. Generally, composts pose a much lower risk than hydroseeding, particularly just
after application. However, it appears that composts with high P concentrations can have
elevated P losses in runoff, even after the first storm event, but unlikely after a second large
storm. Additionally, it appears that blending ground gypsum wallboard (calcium sulfate) may
reduce P losses from compost blankets, although more testing is needed to draw conclusions.
Composts with low P concentrations are the best insurance for reducing P losses and preventing
P from entering surface waters. In addition, composts high in organic matter and C may reduce
P loading. This may provide evidence that composts with a higher relative content of organic P,
compared to plant available P, may have lower total P losses in runoff. Additionally, no more
than 0.4% of the total P applied by compost was lost in storm runoff from three large storm
events. It does not appear from this study that mulch filter berms substantially reduce P losses
from hydroseeding applications. Finally, compost high in ammonium N, nitrate N and/or exhibit
200
relatively prolific weed growth may indicate that runoff P concentrations may be elevated but not
P loads.
References Cited
Brady, N.C., R.R. Weil. 1996. The Nature and Properties of Soils: 11th Edition. Prentice
Hall, Inc. New Jersey.
US EPA. 2000. Ambient water quality criteria recommendations. Information supporting the
development of State and Tribal nutrient criteria. Rivers and streams in nutrient
ecoregion IX. Office of Water EPA 822-B-00-019.
www.epa.gov/waterscience/criteria/nutrient/ecoregions/rivers/rivers_9.pdf , accessed 4-
20-2004.
US EPA. 2004. List of contaminants and their MCLs. www.epa.gov/safewater/mcl.html#mcls,
accessed 4-20-2004.
201
APPENDIX E
RESULTS AND DISCUSSION: SOIL QUALITY
According to a review of the literature, applications of compost can benefit overall soil
quality. Although the principal objective of the experimental treatments is to evaluate their
effect on erosion and sediment control, the quality of the soil underneath these treatments may
have an effect on their ability to provide effective storm water management. Soil characteristics
such as increased water infiltration rates, reduced bulk density, increased organic matter content,
neutralized pH levels, increased nutrient contents, and increased microbiological populations all
can benefit the long term health of vegetation, which is essential to preventing soil erosion and
subsequent sedimentation. The sustained growth of healthy vegetation, in this type of
application, will serve to increase soil quality characteristics over time, creating a sustainable
cycle of perpetually increasing soil quality and plant growth with a net effect of reducing runoff
and steadily reducing soil loss. Unfortunately, little attention is given to soil quality in storm
water management applications and/or the erosion and sediment control industry. A paradigm
shift toward a focus on sustainable soil quality would have monumental affects on the
improvement of our water quality and our approach to managing storm water and other water
resources. See Materials and Methods (Appendix A) for complete sampling procedures and
analytical methods.

202
Bulk Density
Soil bulk density from 0-7.5 cm (0-3 in) was measured at the beginning of the study and
after a year and a half. The first measurement was taken before treatment application, while the
second measurement was sampled underneath the compost blanket (e.g. at the compost and soil
interface). At first sampling, all soils prior to treatment application classified as “restrictive for
root growth” (USDA, 1998). Soil bulk densities were consistent among the compost treatments
and the hydroseed with mulch berm treatment, ranging from 1.99 to 2.1 g/cm3. The hydroseed
with silt fence and control treatments had slightly denser soils of 2.24 and 2.23 g/cm3,
respectively, although there were no differences statistically between any treatments.
Eighteen months after treatment application, soil bulk densities decreased in all but the
poultry litter compost, which was unchanged, and the MSW compost, which increased slightly
(Table 6.1, Figure 5.1). The hydroseed with silt fence followed by the control showed the
greatest reduction in soil bulk density, 1.92 and 1.99 g/cm3, respectively. Of the compost
treatments, the biosolids compost showed the greatest reduction in soil bulk density over the
eighteen-month period, from 2.1 to 1.94 g/cm3. All bulk density levels were still classified as
such that would “restrict root growth” (USDA, 1998). Soils underneath the MSW compost and
yard waste composts were the densest, while soils under both hydroseeded treatments had the
lowest bulk densities. No statistically significant differences were observed.
Although reductions in soil density were observed, they appeared to be slight. This was
probably due to the unusually high density of the soils, as less dense soils would allow more
organic matter and compost to infiltrate the soil surface and subsequent soil horizons over time,
thus reducing overall bulk density. In addition, less dense soils would allow for better root
penetration, as there is evidence that although root growth was substantial in the compost

203
blankets, roots did not penetrate the soil surface, presumably because of soil density
characteristics. A longer period of time may show a gradual reduction in soil bulk densities in all
treatments due to prolonged root growth and with the compost treatments, organic matter
infiltration into the soil surface. Soil bulk densities may have decreased to a greater degree in the
hydroseeded treatments because there was no other growing medium where plant roots could
establish. Perhaps the compost blankets were thick enough and provided adequate nutrients and
moisture so plant roots did not need to exploit the hardened soil for additional resources.
Table 6.1: Average soil bulk density (g/cm3) and average water infiltration rate of soil
(minutes/cm) by treatment at six months and eighteen months by treatment at day one and
eighteen months, n=3.
DAY ONE EIGHTEEN MONTHS SIX MONTHS EIGHTEEN MONTHS
Treatment AVG SD AVG SD AVG SD Class AVG SD Class
PLC/Mulch/Gypsum 1.99a 0.301 1.99a 0.244 8.73a 4.45 Moderately Rapid 125.78a 85.24 Slow
Biosolids Compost 2.1a 0.41 1.94a 0.06 6.59a 9.66 Moderately Rapid 86.22a 54.58 Moderately Slow
MSW Compost/Mulch 2.08a 0.104 2.11a 0.193 17.24a 15.26 Moderate 139.33a 63.32 Slow
Yardwaste Compost 2.1a 0.25 2.0a 0.075 16.26a 9.87 Moderate 128.67a 23.10 Slow
Hydroseed/Mulch Berm 2.01a 0.251 1.93a 0.131 31.11a 27.44 Moderate 102.44a 68.83 Moderately Slow
Hydroseed/Silt Fence 2.24a 0.243 1.92a 0.165 25.16a 19.14 Moderate 82.0a 45.11 Moderately Slow
Bare Soil (not seeded) 2.23a 0.165 1.99a 0.165 3.96a 2.7 Rapid 38.44a 5.0 Moderate
Treatments with same letter are not significantly different at α = 0.05 using Duncan’s Multiple
Range test.

204
00.5
11.5
22.5
3
PLC BC MS YW HM HS BS
Treatment
(g/c
m3)
Day One Eighteen Months
Figure 5.1: Average soil bulk density (g/cm3) by treatment at day one and eighteen months, n =
3.
Water Infiltration Rate
Soil water infiltration rates were taken at six months and eighteen months after the
beginning of the study. It was decided after the first set of soil samples that infiltration rate
would supplant aggregate stability, because it would provide a more accurate analysis of the
soil’s ability to “handle” storm water. In addition, soil aggregate stability was no longer
evaluated after the initial sampling due to suspect results - likely due to the extremely dense
nature of the subsoil tested. Water infiltration rate of the soil after six months was faster under
205
all compost blanket treatments compared to hydroseeded treatments (Table 6.1). The biosolids
compost had the fastest infiltration rate, followed by the poultry litter compost, yard waste
compost and MSW compost, respectively. Although, the bare soil control showed the fastest
infiltration rates it is believed this was due to water leakage underneath the infiltration ring, as it
was not possible to insert the ring to its proper soil depth because the soil surface was so hard,
this did not occur for any other treatment. The same was true during the eighteen-month water
infiltration test.
Water infiltration rates at eighteen months were much slower overall than after six
months (Figure 5.2). This was probably due to the extreme dry nature of the soil at six months
(The test plots had no natural rainfall for nearly four months, and it was the middle of the
summer) compared to the eighteen-month sampling period. The hydroseed with silt fence plots
had the highest infiltration rate, followed by the biosolids compost, hydroseed with mulch berm,
poultry litter compost, yard waste compost and MSW compost, respectively; although
differences were not significant. The biosolids compost and hydroseeded treatments were
classified as “moderately slow”; the remaining treatments were all classified as “slow” according
to a USDA infiltration rate classification system (1998).
Better performance by the hydroseeded treatments during the eighteen-month testing
period, compared to the compost treatments, may be due to increased soil penetration by the
grass roots, even though, differences were not significant. Based on visual inspection, grass
roots established very well within the compost blankets but did not penetrate the underlying soil
well, probably because the compost provided a better or sufficient growing medium for the grass
roots. The hydroseeded plots had no soil amendment; therefore grass roots were forced to
penetrate through the dense soil to survive. This root penetration may have led to increased

206
water infiltration rates at the soil surface for the hydroseeded treatments. This would not be true
if water infiltration rate tests had included the composts blankets.
0
50
100
150
200
250
PLC BC MS YW HM HS BS
Treatments
min
/cm
Day One Eighteen Months
Figure 5.2: Average water infiltration rate of soil (minutes/cm) by treatment at six months and
eighteen months, n = 3.
Extractable Organic Carbon
Extractable organic soil carbon was evaluated at the 0-5 cm (0-2 in) horizon as an
estimate of the soil microbial biomass of the soil. Six months after treatment application soil
organic carbon levels were highest in the control at 33.74 mg kg-1, followed closely by MSW
compost treatment at 32.71 mg kg-1 and the hydroseed with mulch treatment at 30.74 mg kg-1
(Table 6.2). The biosolids compost treatment had the lowest total organic carbon levels at 18.46
mg kg-1, followed by the poultry litter compost at 19.09 mg kg-1. Differences were not
statistically significant.

207
Eighteen months after treatment application (one year after the previous soil analysis) soil
extractable organic carbon levels had increased in all treatments including the control. The
MSW compost had the highest soil organic carbon levels at 93.95 mg kg-1, followed by the
biosolids compost at 58.88 mg kg-1 and the hydroseed with mulch berm treatment at 58.74 mg
kg-1. The yard waste compost had the lowest levels at 41.2 mg kg-1, followed by the hydroseed
with silt fence at 48.34 mg kg-1. The control was 50.78 mg kg-1. The MSW compost was
significantly greater than the rest of the treatments during this sample period.
Between sample periods (one year duration) the MSW compost showed the greatest
increase in total soil organic carbon levels followed by biosolids compost and the poultry litter
compost treatments. The yard waste compost showed the lowest increas followed by the control.
With the exception of the yard waste compost, the compost treatments showed a greater increase
than the hydroseeded treatments and the control; however, only the MSW compost was
significantly greater than the hydroseeded treatments (Figure 5.3). The biosolids treatment was
significantly greater than the control. Based on extractable organic carbon analyis, MSW
compost and biosolids compost increase soil microbial biomass under these soil conditions.
Table 6.2: Average soil extractable organic carbon (mg kg-1) from by treatment at six months
and eighteen months, n=3.
SIX MONTHS EIGHTEEN MONTHS ONE YR CHANGE
Treatment AVG SD AVG SD AVG
PLC/Mulch/Gypsum 19.09a 17.08 57.4b 16.96 38.31bc
Biosolids Compost 18.46a 12.32 58.88b 0.37 40.42ab
MSW 32.71a 8.09 93.95a 13.46 61.24a
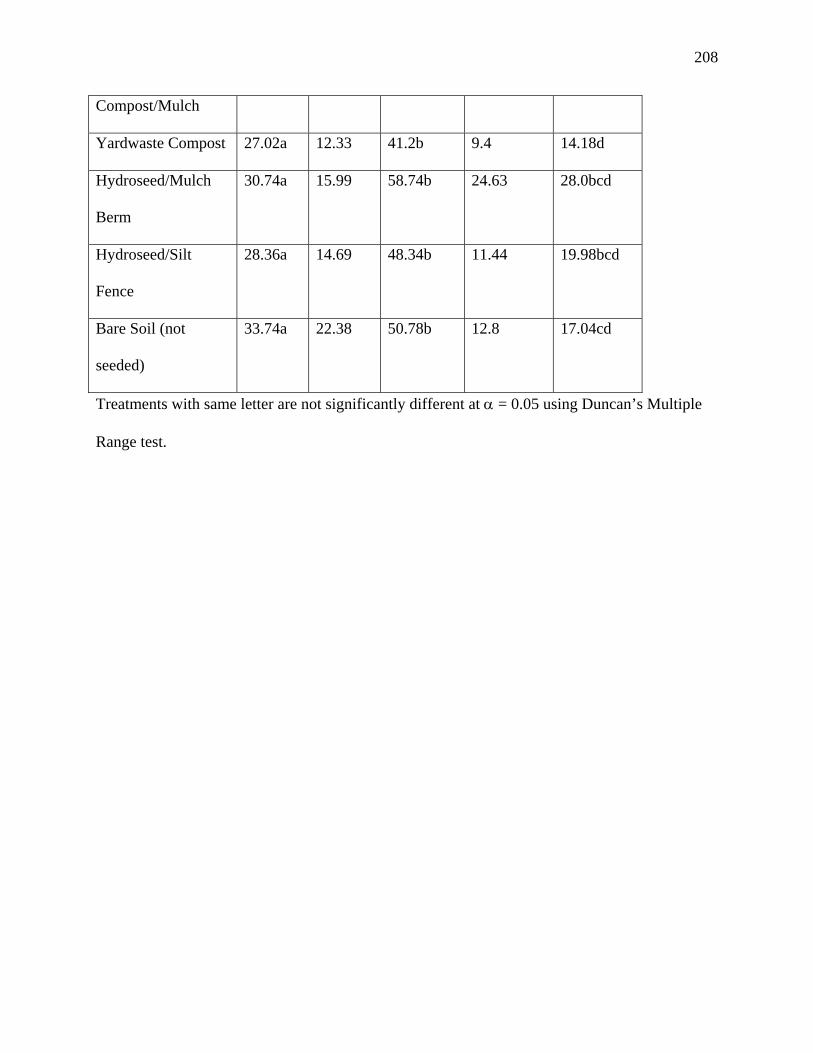
208
Compost/Mulch
Yardwaste Compost 27.02a 12.33 41.2b 9.4 14.18d
Hydroseed/Mulch
Berm
30.74a 15.99 58.74b 24.63 28.0bcd
Hydroseed/Silt
Fence
28.36a 14.69 48.34b 11.44 19.98bcd
Bare Soil (not
seeded)
33.74a 22.38 50.78b 12.8 17.04cd
Treatments with same letter are not significantly different at α = 0.05 using Duncan’s Multiple
Range test.
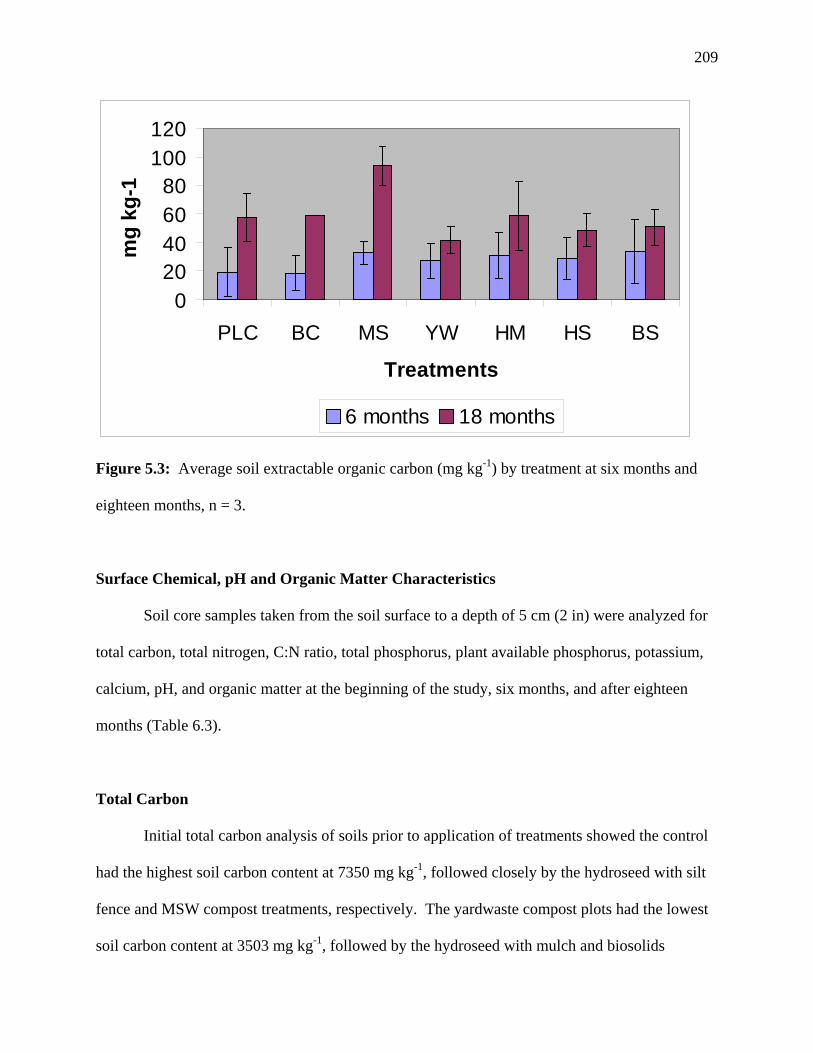
209
020406080
100120
PLC BC MS YW HM HS BS
Treatments
mg
kg-1
6 months 18 months
Figure 5.3: Average soil extractable organic carbon (mg kg-1) by treatment at six months and
eighteen months, n = 3.
Surface Chemical, pH and Organic Matter Characteristics
Soil core samples taken from the soil surface to a depth of 5 cm (2 in) were analyzed for
total carbon, total nitrogen, C:N ratio, total phosphorus, plant available phosphorus, potassium,
calcium, pH, and organic matter at the beginning of the study, six months, and after eighteen
months (Table 6.3).
Total Carbon
Initial total carbon analysis of soils prior to application of treatments showed the control
had the highest soil carbon content at 7350 mg kg-1, followed closely by the hydroseed with silt
fence and MSW compost treatments, respectively. The yardwaste compost plots had the lowest
soil carbon content at 3503 mg kg-1, followed by the hydroseed with mulch and biosolids

210
compost treatments, respectively. Six months after treatment application the MSW compost
treatment had the highest soil carbon content at 9367 mg kg-1 followed by the poultry litter
compost at 8250 and the biosolids compost at 7667 mg kg-1. The hydroseeded treatments had
the lowest soil carbon content followed by the control. Over the six month time period all
compost treatments had increased soil carbon contents, notably the yard waste compost treatment
more than doubled. During the same time period there was a slight reduction in soil carbon for
both hydroseeded treatments and the control. Eighteen months after treatment application the
poultry litter compost had the highest soil carbon levels at 14,270 mg kg-1 followed by the MSW
compost and hydroseed with silt fence treatments, respectively. Again the control experienced a
slight reduction in soil carbon levels, as well as the biosolids compost, from the previous soil
sampling. The greatest increases in soil carbon were found in the poultry litter compost followed
by both hydroseeded treatments. After eighteen months all treatments had higher levels of soil
carbon compared to the control.
The greatest increase in soil carbon over the eighteen-month study period was shown in
the poultry litter compost treatment, increasing from 5833 to 14270 mg kg-1, followed by the
yard waste compost, 3503 to 7480 mg kg-1, and the hydroseed with mulch berm treatment, 5023
to 8050 mg kg-1. The control was the only treatment that experienced a decrease in soil carbon
content over the entire study period. Differences between treatments were not statistically
significant at any time period; however, the increase in soil C from the poultry litter compost
over the eighteen-month study period was significantly different.

211
Total Nitrogen
Initial soil analysis for total nitrogen from the 0-5 cm (2 in) soil samples showed little
variation in soil N levels prior to treatment application (Table 6.3). The plots to be treated with
MSW compost had the highest levels at 627 mg kg-1, while the plots to be treated with yard
waste compost had 353 mg kg-1. Six months after treatment application little change was noticed
in soil N levels. The poultry litter compost, MSW compost, both hydroseeded treatments, and
the control all showed slight decreases in soil N levels. The yard waste compost and biosolids
compost treatments showed slight increases. Overall, the poultry litter compost and MSW
compost had the highest soil N levels after six months, followed closely by the biosolids
compost. Three of the four highest soil N levels after six months were from compost treatments
while the control had the lowest levels.
After eighteen months the control still had the lowest soil N levels, followed by the yard
waste compost and hydroseed with mulch berm treatments, respectively. The poultry litter
compost continued to have the highest levels of soil N followed by the MSW compost and
hydroseed with silt fence treatments, respectively. Between the last two sample periods the
poultry litter compost was the only treatment that showed an increase in soil nitrogen. The same
is true from the beginning to the end of the eighteen-month study period. However, no
differences observed were statistically significant for any sampling period.
Carbon to Nitrogen Ratio
Soil carbon to nitrogen ratios prior to treatment application ranged from a high of 14.04
in the control to a low of 8.22 with the yard waste treatment (Table 6.3). No significant
differences were observed. Six months after treatment application C:N ratios increased for all
212
treatments, including the control, with the exception of the hydroseed with silt fence treatment.
The yard waste compost treatment showed the greatest increase followed by the poultry litter
compost and MSW compost treatments, respectively. All four compost treatments showed
greater increases than the hydroseeded treatments and the control. Overall, the bare soil
treatment had the highest C:N ratio followed closely by the MSW compost and yard waste
compost treatments. The hydroseeded treatments had the lowest soil C:N ratios followed by the
poultry litter compost after six months. Statistically, the control and the MSW compost were
significantly different than the hydroseed with silt fence treatment.
By eighteen months the yard waste compost had the highest C:N ratio followed by the
hydroseed with mulch and poultry litter compost treatments. The biosolids compost had the
lowest C:N ratios followed by the MSW compost and hydroseed with silt fence treatments.
From the six month sampling period to the end of the study the yard waste compost showed the
highest increase in soil C:N ratio followed closely by the hydroseed with mulch berm and then
the poultry litter compost treatment. The MSW compost and biosolids compost showed less
increase in C:N ratio than the control.
Over the entire study period all treatments including the control showed increased soil
C:N ratios. The yard waste compost exhibited the greatest increase in soil C:N ratio followed by
the poultry litter compost and the hydroseed with mulch treatment, respectively. The lowest
increases were found in the biosolids compost and MSW compost treatments. Although
significant differences were observed from the six-month sample period, none were observed
from the eighteen month sample period.

213
Total Phosphorus
Total phosphorus levels of the soil sampled at the 0-5 cm (2 in) horizon, prior to
treatment application, ranged from a high of 449 mg kg-1, where the yard waste composts were to
be applied, to a low of 348 mg kg-1 in the control (Table 6.3). No significant differences were
found. Six months after treatment application total soil P levels increased under all treatments.
The hydroseeded treatments had the highest levels of total P as well as the greatest increase over
the six-month period. The hydroseed with mulch berm had a total soil P level of 590 mg kg-1
and the hydroseed with silt fence had an average of 568 mg kg-1, both significantly different than
the control. All four compost treatments were similar in range, from 475 mg kg-1 under the yard
waste compost to 433 mg kg-1 under the biosolids compost. Among the compost treatments, the
MSW compost increased soil total P the most, while the yard waste compost had the smallest
increase, over the six-month period. The control had the lowest soil total P during this sample
period at 358 mg kg-1.
After eighteen months total soil P levels, from the 0 to 5 cm (2 in) horizon, increased for
all treatments compared to the previous sample period, with the exception of the control. The
hydroseeded treatments had the highest total P levels, which were significantly greater than the
control. The hydroseeded treatments had the greatest increase in surface soil total P from the
previous sample period and were the only treatments that showed a significant increase in P over
the eighteen month study period. Among the compost treatments, the MSW compost had the
highest total soil P at 534 mg kg-1 as well as the greatest increase, while the poultry litter
compost had the lowest soil total P at 479 mg kg-1, and the least increase. The control decreased
to 325 mg kg-1. The high level of soil total P in the hydroseeded treatments was probably due to
the high level of P fertilizer in the initial hydroseed mixture. It is interesting to note that it

214
continued to increase after six months from an initial one-time application at the beginning of the
experiment. This relatively high level of soil total P near the soil surface by the hydroseeded
treatments over the eighteen-month period may contribute to prolonged P loss in runoff.
Plant Available Phosphorus
Plant available phosphorus from the 0 to 5 cm (2 in) soil horizon, prior to treatment
application, was quite low, ranging from 36 mg kg-1 under the future hydroseed with silt fence
application to 17 mg kg-1 where the yard waste compost treatments would soon be applied (Table
6.3). No significant differences were found. Six months after treatment application the
hydroseeded treatments showed the greatest increase and highest levels of plant available P,
additionally, they were the only treatments significantly different than the control. Among the
compost treatments, the biosolids compost showed the greatest increase and highest level of
plant available P. The yard waste compost had the lowest level of plant available P; however,
the poultry litter compost showed the least increase between the sample periods. The control
was the only treatment that showed a slight decrease in plant available P at this time.
After eighteen months, all treatments showed appreciable declines in plant available P
from the previous sample period; however, the hydroseeded treatments showed a net gain in
surface plant available P from the beginning of the study. These gains were significantly
different from the control, poultry litter compost and MSW compost treatments. The
hydroseeded treatments maintained the highest levels of plant available P, followed by the
biosolids compost. The yard waste compost had the lowest plant available P levels, followed
closely by the MSW compost and the control at the end of the eighteen-month study period. The
only treatments that were significantly different were the yard waste compost and the hydroseed

215
with silt fence treatment. As with soil total P levels, plant available P in the soil was high in the
hydroseeded treatments probably because of the plant available P fertilizer included in the initial
hydroseed mixture. The increasing level of soil plant available P near the soil surface by the
hydroseeded treatments over the eighteen-month period may contribute to prolonged P loss in
runoff, particularly if it does not adsorb to soil colloids. All four compost treatments exhibited
decreased soil plant available P over the eighteen-month period. This may be because the P in
mature compost is typically in organic form and less available until it is mineralized.
Potassium
Soil potassium at the 0 to 5 cm horizon was very similar among treatments prior to
treatment application (Table 6.3). No significant differences were observed. Levels ranged from
a low of 130 mg kg-1 in the control, to a high of 157 mg kg-1 in the hydroseed with mulch berm
treatment. Six months after treatment application soil K was virtually unchanged, with no more
than 2 mg kg-1 difference in any treatment between the two sampling periods. As expected, no
significant differences were found.
Eighteen months after treatment application soil K levels declined in the control and
biosolids compost treatments, while the remaining three compost treatments showed slight
increases in soil K. The poultry litter compost treatment increased soil K the most among the
compost treatments, but only by 18 mg kg-1. Overall, the greatest increases in soil K were found
by the hydroseeded treatments, likely due to the potassium fertilizer included in the initial
hydroseed mixture. The hydroseed with silt fence treatment had the highest soil K level at 236
mg kg-1, an increase of 86 mg kg-1 from the previous sampling period (one year prior).
Statistically, this was the only treatment that was significantly different from the control.
216
Calcium
Soil calcium levels at the 0 to 5 cm horizon were quite similar prior to treatment
application, with a low of 173 mg kg-1 from the control to high of 217 mg kg-1 from the
hydroseed with silt fence treatment (Table 6.3). No significant differences were found. Six
months after treatment applications soil Ca levels were virtually unchanged, with no more than 3
mg kg-1 variation from the initial soil analysis. The control continued to have the lowest soil Ca
at 170 mg kg-1 and the hydroseed with silt fence treatment had the highest soil Ca at 218 mg kg-1.
Still no statistically significant differences were found.
Eighteen months after treatment application, all treatments showed increases in soil Ca
content with the exception of the control and biosolids compost, which showed minor decreases.
The hydroseeded treatments showed the highest levels of soil Ca and the greatest increase from
the previous soil analyses. Of the compost treatments, the MSW compost and poultry litter
compost had the highest soil Ca, 573 mg kg-1 and 464 mg kg-1, respectively. The MSW compost
and the hydroseeded treatments were significantly different than the control. The biosolids
compost had the lowest soil Ca of the compost treatments at 158 mg kg-1, while the control was
64 mg kg-1. The increased levels of soil Ca in the hydroseeded treatments could be a result of the
lime in the application mixture. Likewise, the increase in soil Ca from the poultry litter compost
treatment may be from the gypsum addition.
pH
Soil pH levels at the 0 to 5 cm horizon were very similar among treatments prior to
treatment application (Table 6.3). Levels ranged from a low of 5.54 in the yard waste compost
and biosolids compost treatments to a high of 5.67 in the MSW compost treatments. Differences

217
were not statistically significant. After six months, all treatments including the control, showed
an increase. The MSW compost treatment had the highest soil pH at 6.52, followed by the
poultry litter compost and hydroseed with mulch berm, respectively. Each of these treatments
was significantly different from the control, and the two compost treatments were significantly
different from the biosolids compost. The control had the lowest soil pH followed by the
biosolids compost treatment. The poultry litter compost and MSW compost treatments showed
the greatest increase after six months, while the control followed by the biosolids compost
showed the lowest increases.
After eighteen months, the MSW compost treatment had the highest soil pH at 7.03,
followed by the hydroseeded treatments at 6.77 and 6.65. The biosolids compost had the lowest
pH at 6.16, followed by the poultry litter compost at 6.4. The pH of the control was 6.42.
Statistically, the MSW compost was the only treatment significantly different from the control,
additionally, it was significantly different from the other three compost treatments. This is likely
due to the higher initial pH of the MSW compost relative to the others. As well, the hydroseeded
treatments were significantly different from the biosolids and poultry litter compost treatments,
likely due to the lime included in the hydroseed application.
All treatments increased soil pH throughout the study period. The greatest increase in
soil pH over the entire study period was found with the MSW compost followed by both
hydroseeded treatments. The lowest increase was found with the biosolids compost, followed by
the control and poultry litter compost treatment. The reason for the lower increase from the
biosolids compost was probably due to the relatively low pH of the treatment itself; the converse
was true for the MSW compost. Increases in soil pH at this depth, over the length of the
experiment, may have increased the amount of soluble P near the soil surface, increasing both
218
vegetative growth and/or P losses in the runoff. Both were characteristic to the hydroseeded
treatments.
Organic Matter
Soil organic matter levels analyzed from 0 to 5 cm into the soil, prior to treatment
application, ranged from a low of 3.91 g kg-1 in the control to a high of 4.95 g kg-1 in the poultry
litter compost treatment (Table 6.3). Differences were not statistically significant. Six months
after treatment application, soils treated with yard waste compost had the highest organic matter
levels at 5.23 g kg-1, followed by the MSW compost at 4.77 g kg-1, and the poultry litter compost
at 4.63 g kg-1. The control had the lowest soil organic matter at 4.01 g kg-1, followed closely by
the hydroseed with silt fence at 4.03 g kg-1. The MSW compost and yard waste compost were
the only treatments to show an increase over the six-month period. Eighteen months after
treatment application the MSW compost had the highest soil organic matter, followed by the
poultry litter compost and hydroseed with silt fence, respectively. The control remained lowest
in soil organic matter followed by the hydroseed with mulch berm and the biosolids compost
treatment, respectively.
Over the entire study period the MSW compost, followed by the yard waste compost
showed the greatest increase in soil organic matter. The poultry litter compost and hydroseed
with silt fence also showed some increase in soil organic matter, while the control virtually
stayed the same. Interestingly, the hydroseed with mulch berm and biosolids compost showed
slight declines in soil organic matter at the 0 to 5 cm level. Although it appeared that most
treatments did increase soil organic matter levels, particularly among the compost treatments,
these differences were not statistically significant from the control.

219
Table 6.3: Selected soil chemical characteristics from 0-5 cm (0-2 in) by treatment at day one, six months and eighteen months, n=3.
DAY ONE SIX MONTHS EIGHTEEN MONTHS 1.5 YR CHANGE
Characteristic Total C
(mg kg-1)
Total N
(mg kg-1)
C:N Ratio Total C
(mg kg-1)
Total N
(mg kg-1)
C:N Ratio Total C
(mg kg-1)
Total N
(mg kg-1)
C:N Ratio Total C
(mg kg-1)
Treatment Avg SD Avg SD Avg SD Avg SD Avg SD Avg SD Avg SD Avg SD Avg SD Avg
PLC/Mulch/Gypsum 5833 3900 593 331 9.34 3.16 8250 3748 585 177 13.77ab 2.2 14270 12830 670 680 25.89 10.1 8437a
Biosolids Compost 5543 3711 476 205 10.31 4.37 7667 4219 553 298 13.83ab 0.56 7380 4490 370 180 18.84 3.82 1837ab
MSW
Compost/Mulch
7143 2467 627 319 11.99 2.38 9367 1762 583 127 16.1a 0.68 9580 1210 480 130 20.58 2.92 2437ab
Yardwaste Compost 3503 3679 353 181 8.22 4.96 7033 3350 470 286 15.7ab 1.9 7480 2206 290 180 30.58 12.0 3977ab
Hydroseed/Mulch
Berm
5023 3705 400 175 11.2 4.87 4800 400 367 116 12.59ab 2.36 8050 2110 310 130 27.44 5.81 3027ab
Hydroseed/Silt
Fence
7347 3709 560 275 12.84 0.90 6033 560 490 150 11.79b 3.26 8500 3170 400 220 22.99 4.91 1153ab
Bare Soil (not
seeded)
7350 1247 526 101 14.04 0.64 6367 526 393 140 16.2a 2.52 5950 1160 260 28 24.95 0.88 -1400b
Treatments with same letter are not significantly different at α = 0.05 using Duncan’s Multiple Range test.

220
Table 6.3 (cont.): Selected soil chemical characteristics from 0-5 cm (0-2 in) by treatment at day one, six months and eighteen
months, n=3.
DAY ONE SIX MONTHS EIGHTEEN MONTHS 1.5 YR CHANGE
Characteristic Total P
(mg kg-1)
Plant available
P (mg kg-1)
Total P
(mg kg-1)
Plant available
P (mg kg-1)
Total P
(mg kg-1)
Plant available
P (mg kg-1)
Total P
(mg kg-1)
Plant available
P (mg kg-1)
Treatment Avg SD Avg SD Avg SD Avg SD Avg SD Avg SD Avg Avg
PLC/Mulch/ Gypsum 415.33 69.86 29.67 25.11 463ab 165 44ab 15 479ab 100 12ab 10 63.67b -17.67
Biosolids Compost 389.67 71.74 32.67 24.83 433ab 34 76ab 35 486ab 84 16ab 12 96.33b -16.67
MSW Compost/ Mulch 398.33 58.35 29.0 8.89 463ab 120 48ab 24 534ab 222 7ab 3 135.67ab -22.0
Yardwaste Compost 449.33 83.05 16.67 13.28 475ab 80 41ab 20 501ab 92 4b 2 51.67b -12.67
Hydroseed/ Mulch Berm 441.67 75.22 20.67 15.31 590a 46 141a 108 728a 141 32ab 28 286.33a 11.33
Hydroseed/ Silt Fence 402.33 33.5 35.67 26.31 568a 121 139a 56 691a 166 47a 47 288.67a 11.33
Bare Soil (not seeded) 347.67 30.09 32.67 8.5 358b 83 25b 17 325b 56 7ab 2 -22.67b -25.67
Treatments with same letter are not significantly different at α = 0.05 using Duncan’s Multiple Range test.

221
Table 6.3 (cont.): Selected soil chemical characteristics from 0-5 cm (0-2 in) by treatment at day
one, six months and eighteen months, n=3.
DAY ONE SIX MONTHS EIGHTEEN MONTHS
Characteristic pH OM (g kg-1) pH OM (g kg-1) pH OM (g kg-1)
Treatment Avg SD Avg SD Avg SD Avg SD Avg SD Avg SD
PLC/Mulch/Gypsum 5.58 0.27 4.95 1.05 6.44a 0.3 4.63 2.91 6.4bc 0.16 5.37 0.88
Biosolids Compost 5.54 0.22 4.69 0.44 5.86bc 0.14 4.3 1.83 6.16c 0.23 4.56 0.24
MSW
Compost/Mulch
5.67 0.17 4.35 1.09 6.52a 0.33 4.77 2.06 7.03a 0.23 5.69 2.43
Yardwaste Compost 5.54 0.11 4.36 0.36 6.17abc 0.14 5.23 1.43 6.46bc 0.08 4.99 0.57
Hydroseed/Mulch
Berm
5.6 0.11 4.67 0.26 6.31ab 0.46 4.4 1.46 6.65ab 0.27 4.28 0.62
Hydroseed/Silt
Fence
5.66 0.26 4.59 0.51 6.17abc 0.16 4.03 1.2 6.77ab 0.10 5.03 1.44
Bare Soil (not
seeded)
5.6 0.37 3.91 0.76 5.68c 0.16 4.01 1.18 6.42bc 0.39 3.95 1.04
Treatments with same letter are not significantly different at α = 0.05 using Duncan’s Multiple
Range test.
DAY ONE SIX MONTHS EIGHTEEN MONTHS
Characteristic K (mg kg-1) Ca (mg kg-1) K (mg kg-1) Ca (mg kg-1) K (mg kg-1) Ca (mg kg-1)
Treatment Avg SD Avg SD Avg SD Avg SD Avg SD Avg SD
PLC/Mulch/Gypsum 143.33 25.17 210 40 142.0 25.24 211.33 38.5 160ab 86.2 464.3abc 254.3
Biosolids Compost 133.33 25.17 206.67 25.17 132.33 25.77 204.0 25.94 81b 43.3 158bc 62.2
MSW
Compost/Mulch
133.33 5.77 213.33 65.06 132.33 4.16 212.0 65.51 135.7ab 50.0 573.3ab 96
Yardwaste Compost 140.0 26.46 190 60.83 137.67 28.54 189.67 60.96 152.7ab 14.0 420.3abc 86.2
Hydroseed/Mulch
Berm
156.67 25.17 186.67 20.82 157.67 26.76 186.0 18.68 206ab 99.2 629.7ab 471.3
Hydroseed/Silt
Fence
150.0 40.0 216.67 32.15 150.0 44.0 217.67 29.87 235.7a 111.8 868.7a 358.6
Bare Soil (not
seeded)
130.0 17.32 173.33 30.55 131.67 15.37 170.33 32.19 90.3b 52.4 64.3c 39.7
222
Chemical, pH and Organic Matter Characteristics from 0 to 15 cm
Soil core samples taken from the soil surface to a depth of 15 cm (6 in) were analyzed for
pH, organic matter, phosphorus, potassium, calcium, magnesium, manganese, and zinc at the
beginning of the study and after eighteen months (end of study) (Table 6.4).
pH
Initial soil pH levels, prior to treatment application, had little variability, ranging from a
low of 4.6 (yard waste compost) to a high of 4.8 (MSW compost). After eighteen months pH
levels increased in the soils under all treatments, including the control. The poultry litter
compost and MSW compost treatments increased the most over the study period from 4.67 to
5.43 and 4.8 to 5.47, respectively. The least amount of change was observed under the
hydroseed with mulch berm treatment, 4.73 to 5.07, followed by the control, 4.7 to 5.13. The
difference between the poultry litter compost and the hydroseed with mulch berm treatment was
statistically significant. Overall, soil pH levels at this soil depth did not increase as much as soil
pH levels from the 0 to 5 cm horizon. In addition, soil pH levels remained low enough to keep
soil P insoluble and therefore unavailable to plants or subject to losses in runoff.
Organic Matter
The soil organic matter levels for all treatments were similar at the beginning of the
study, ranging from 2.4 (biosolids compost) to 2.65 g kg-1 (yard waste compost). These
differences were not statistically significant. The percentage of soil organic matter was relatively
unchanged in all but the poultry litter compost and biosolids compost treatments, the latter was
significantly different than the control. The soil organic matter under the biosolids compost plots
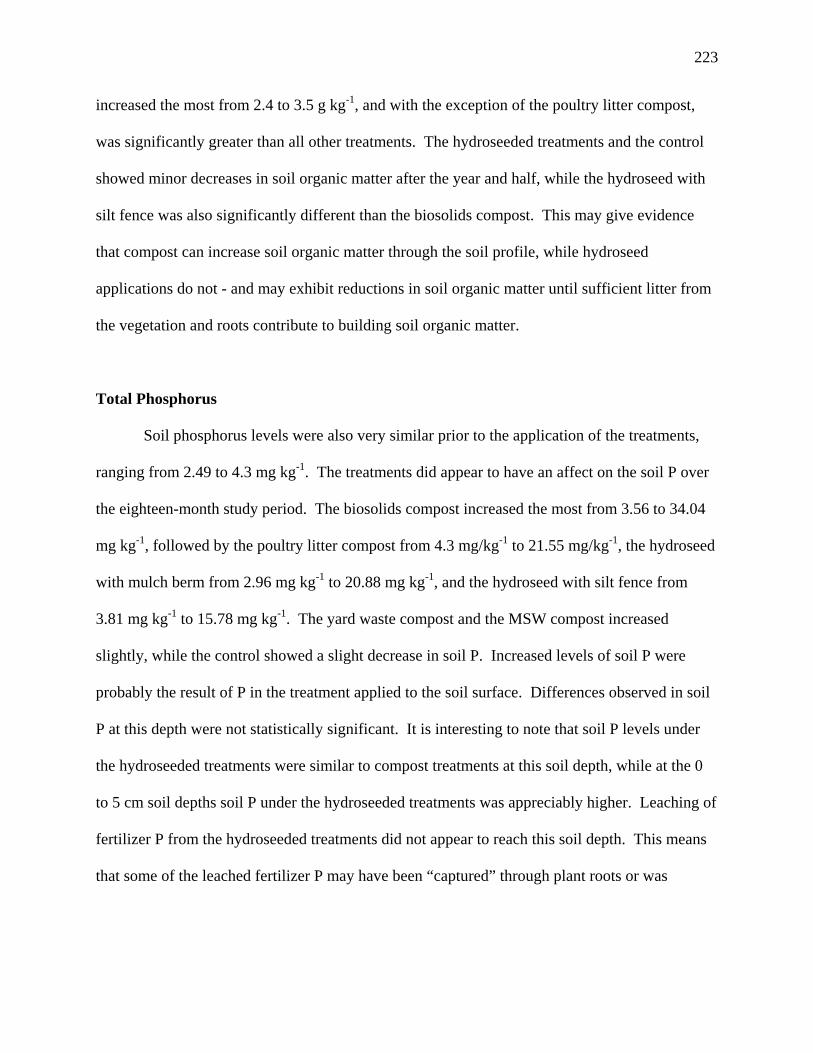
223
increased the most from 2.4 to 3.5 g kg-1, and with the exception of the poultry litter compost,
was significantly greater than all other treatments. The hydroseeded treatments and the control
showed minor decreases in soil organic matter after the year and half, while the hydroseed with
silt fence was also significantly different than the biosolids compost. This may give evidence
that compost can increase soil organic matter through the soil profile, while hydroseed
applications do not - and may exhibit reductions in soil organic matter until sufficient litter from
the vegetation and roots contribute to building soil organic matter.
Total Phosphorus
Soil phosphorus levels were also very similar prior to the application of the treatments,
ranging from 2.49 to 4.3 mg kg-1. The treatments did appear to have an affect on the soil P over
the eighteen-month study period. The biosolids compost increased the most from 3.56 to 34.04
mg kg-1, followed by the poultry litter compost from 4.3 mg/kg-1 to 21.55 mg/kg-1, the hydroseed
with mulch berm from 2.96 mg kg-1 to 20.88 mg kg-1, and the hydroseed with silt fence from
3.81 mg kg-1 to 15.78 mg kg-1. The yard waste compost and the MSW compost increased
slightly, while the control showed a slight decrease in soil P. Increased levels of soil P were
probably the result of P in the treatment applied to the soil surface. Differences observed in soil
P at this depth were not statistically significant. It is interesting to note that soil P levels under
the hydroseeded treatments were similar to compost treatments at this soil depth, while at the 0
to 5 cm soil depths soil P under the hydroseeded treatments was appreciably higher. Leaching of
fertilizer P from the hydroseeded treatments did not appear to reach this soil depth. This means
that some of the leached fertilizer P may have been “captured” through plant roots or was

224
adsorbed to iron and/or aluminum oxides (high P fixing capacity is characteristic of most clay
soils), since it appears to stop between 5 cm and 15 cm.
Potassium
Soil potassium levels were also very similar prior to treatment application, ranging from
45.56 mg kg-1 to 58.1 mg kg-1. Differences were not statistically significant. All but two
treatments, including the control, showed minor decreases in soil K after eighteen months,
ranging from 38.73 mg kg-1 in the yard waste compost to 50.69 mg kg-1 in the hydroseed with silt
fence. The two exceptions that showed slight increases in soil K included the poultry litter
compost, 55.73 mg kg-1 to 74.57 mg kg-1, and the hydroseed with mulch berm, 50.77 mg kg-1 to
57.98 mg kg-1. Both were significantly different from the control, and each other at eighteen
months.
Calcium
Soil calcium levels were fairly uniform across the soil plots prior to treatment application,
ranging from a low of 150.47 mg kg-1 under the biosolids compost to a high of 184.43 mg kg-1
under the MSW compost. No significant difference was observed. After eighteen months, all
the compost treatments increased soil Ca; the poultry litter compost had the highest level at 398
mg kg-1, followed by the MSW compost at 274 mg kg-1. The control and hydroseed with silt
fence treatments showed minor decreases in soil Ca levels, while the hydroseed with mulch berm
treatment remained relatively unchanged. The poultry litter compost was the only treatment
significantly different from the control; it was also the only compost treatment significantly

225
different from the hydroseeded treatments. This may be a result of the gypsum that was
originally blended with the poultry litter compost.
Magnesium
Soil magnesium levels were relatively similar at the beginning of the study, ranging from
23.23 mg kg-1 (control) to 36.9 mg kg-1 (yard waste compost). No significant differences were
found during the initial soil sampling. The poultry litter compost showed the greatest increase in
soil Mg levels over the study period, 28.67 mg kg-1 to 49.35 mg kg-1, while the MSW compost
and yard waste compost showed minor decreases. The yard waste compost, poultry litter
compost, and hydroseed with mulch berm were all significantly different from the control. In
addition, the poultry litter compost was significantly different from the biosolids compost, MSW
compost, and the hydroseed with silt fence treatments.
Zinc
Finally, all soil zinc levels increased, including the control, over the study period. The
biosolids compost had the greatest increase, from 0.12 mg kg-1 to 4.13 mg kg-1, followed by the
MSW compost, from 0.19 mg kg-1 to 2.6 mg kg-1; while the smallest increase was found with the
control, from 0.17 to 0.94 mg kg-1. No significant differences were found between treatments
during either sampling period.
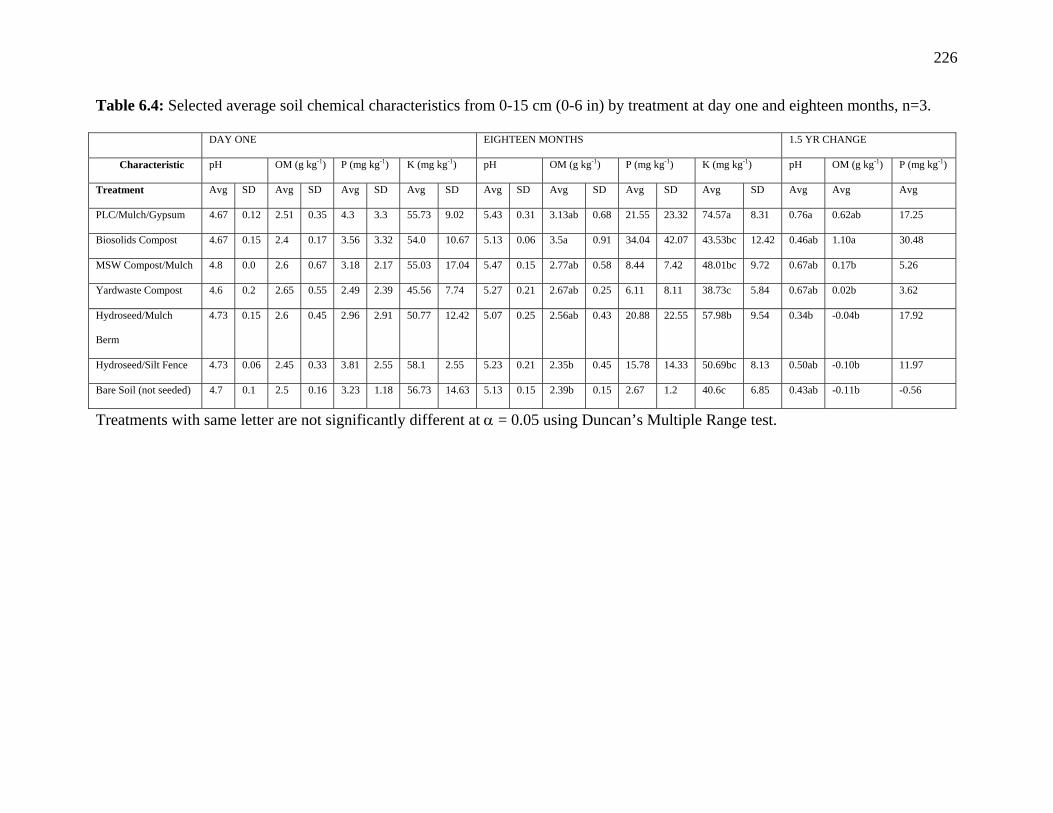
226
Table 6.4: Selected average soil chemical characteristics from 0-15 cm (0-6 in) by treatment at day one and eighteen months, n=3.
DAY ONE EIGHTEEN MONTHS 1.5 YR CHANGE
Characteristic pH OM (g kg-1) P (mg kg-1) K (mg kg-1) pH OM (g kg-1) P (mg kg-1) K (mg kg-1) pH OM (g kg-1) P (mg kg-1)
Treatment Avg SD Avg SD Avg SD Avg SD Avg SD Avg SD Avg SD Avg SD Avg Avg Avg
PLC/Mulch/Gypsum 4.67 0.12 2.51 0.35 4.3 3.3 55.73 9.02 5.43 0.31 3.13ab 0.68 21.55 23.32 74.57a 8.31 0.76a 0.62ab 17.25
Biosolids Compost 4.67 0.15 2.4 0.17 3.56 3.32 54.0 10.67 5.13 0.06 3.5a 0.91 34.04 42.07 43.53bc 12.42 0.46ab 1.10a 30.48
MSW Compost/Mulch 4.8 0.0 2.6 0.67 3.18 2.17 55.03 17.04 5.47 0.15 2.77ab 0.58 8.44 7.42 48.01bc 9.72 0.67ab 0.17b 5.26
Yardwaste Compost 4.6 0.2 2.65 0.55 2.49 2.39 45.56 7.74 5.27 0.21 2.67ab 0.25 6.11 8.11 38.73c 5.84 0.67ab 0.02b 3.62
Hydroseed/Mulch
Berm
4.73 0.15 2.6 0.45 2.96 2.91 50.77 12.42 5.07 0.25 2.56ab 0.43 20.88 22.55 57.98b 9.54 0.34b -0.04b 17.92
Hydroseed/Silt Fence 4.73 0.06 2.45 0.33 3.81 2.55 58.1 2.55 5.23 0.21 2.35b 0.45 15.78 14.33 50.69bc 8.13 0.50ab -0.10b 11.97
Bare Soil (not seeded) 4.7 0.1 2.5 0.16 3.23 1.18 56.73 14.63 5.13 0.15 2.39b 0.15 2.67 1.2 40.6c 6.85 0.43ab -0.11b -0.56
Treatments with same letter are not significantly different at α = 0.05 using Duncan’s Multiple Range test.
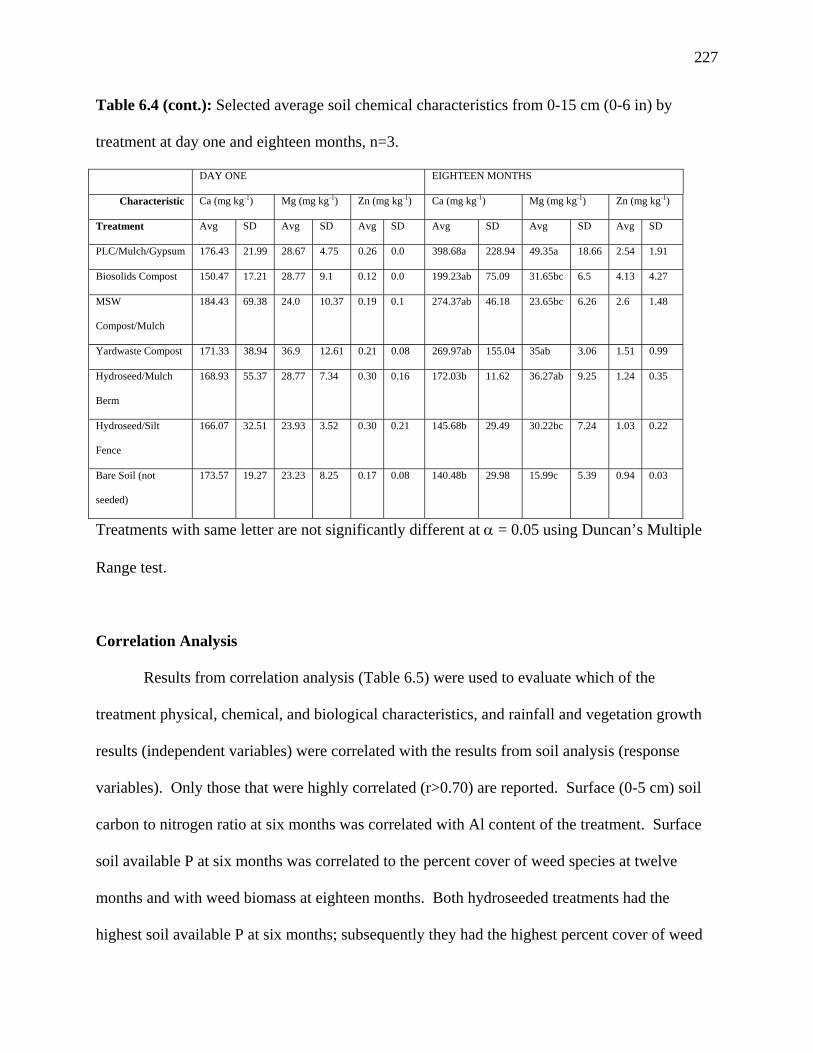
227
Table 6.4 (cont.): Selected average soil chemical characteristics from 0-15 cm (0-6 in) by
treatment at day one and eighteen months, n=3.
DAY ONE EIGHTEEN MONTHS
Characteristic Ca (mg kg-1) Mg (mg kg-1) Zn (mg kg-1) Ca (mg kg-1) Mg (mg kg-1) Zn (mg kg-1)
Treatment Avg SD Avg SD Avg SD Avg SD Avg SD Avg SD
PLC/Mulch/Gypsum 176.43 21.99 28.67 4.75 0.26 0.0 398.68a 228.94 49.35a 18.66 2.54 1.91
Biosolids Compost 150.47 17.21 28.77 9.1 0.12 0.0 199.23ab 75.09 31.65bc 6.5 4.13 4.27
MSW
Compost/Mulch
184.43 69.38 24.0 10.37 0.19 0.1 274.37ab 46.18 23.65bc 6.26 2.6 1.48
Yardwaste Compost 171.33 38.94 36.9 12.61 0.21 0.08 269.97ab 155.04 35ab 3.06 1.51 0.99
Hydroseed/Mulch
Berm
168.93 55.37 28.77 7.34 0.30 0.16 172.03b 11.62 36.27ab 9.25 1.24 0.35
Hydroseed/Silt
Fence
166.07 32.51 23.93 3.52 0.30 0.21 145.68b 29.49 30.22bc 7.24 1.03 0.22
Bare Soil (not
seeded)
173.57 19.27 23.23 8.25 0.17 0.08 140.48b 29.98 15.99c 5.39 0.94 0.03
Treatments with same letter are not significantly different at α = 0.05 using Duncan’s Multiple
Range test.
Correlation Analysis
Results from correlation analysis (Table 6.5) were used to evaluate which of the
treatment physical, chemical, and biological characteristics, and rainfall and vegetation growth
results (independent variables) were correlated with the results from soil analysis (response
variables). Only those that were highly correlated (r>0.70) are reported. Surface (0-5 cm) soil
carbon to nitrogen ratio at six months was correlated with Al content of the treatment. Surface
soil available P at six months was correlated to the percent cover of weed species at twelve
months and with weed biomass at eighteen months. Both hydroseeded treatments had the
highest soil available P at six months; subsequently they had the highest percent cover of weed

228
species and weed biomass by the end of the study. Total P (0-5 cm) at eighteen months was
correlated with total carbon content of the treatment and total biomass at the end of the study.
The hydroseeded treatments and biosolids compost had the highest soil total P at eighteen
months, and the highest total biomass. Soil pH (0-5 cm) and soil extractable organic carbon (0-5
cm) at eighteen months were good indicators of sodium content in the treatment; additionally,
the extractable organic carbon was a positive indicator of Cu in the treatment. Finally, soil K (0-
15 cm) at eighteen months was correlated with treatment sulfur content.
Table 6.5: Results from correlation analysis. This table lists all variables with significant
correlation (r>0.70, α = 0.05, n = 21).
Response Variable Independent Variable (treatments) with Correlation Coefficient
Soil C:N ratio at 6 months (0-5cm) Al (0.70)
Soil labile P at 6 months (0-5cm) % cover of weed plants at 12 months (0.72), weed biomass (0.72)
Soil total P at 18 months (0-5cm) C (0.73), total biomass (0.70)
Soil pH at 18 months (0-5) Na (0.73),
Soil TOC at 18 months (0-5cm) Na (0.75), Cu (0.75)
Soil K at 18 months (0-15cm) S (0.70)
Summary and Conclusion
Based on this study, under these environmental conditions compost blankets can increase
soil extractable organic carbon (used to estimate soil microbial biomass) compared to hydroseed
treated soils, and increase surface soil total C, compared to bare soils, which can be in indicator
of improved soil quality. Soils treated with hydroseed may experience elevated levels of soil
phosphorus near the surface for a short and long term period. This may be beneficial to plant
growth (including weeds) but it may contribute to increased phosphorus in storm water runoff
and any nearby surface waters contributing to eutrophication. It also appears that some

229
composts, and the application of hydroseed can increase soil potassium, calcium and pH near the
soil surface which can be beneficial to plant growth; while some composts may increase pH,
organic matter, calcium and magnesium at deeper soil horizons, particularly over a longer period
of time. Erosion control professionals that are deciding which measure to use should be aware
that hydroseed applications can cause P losses in runoff well after application because it tends to
increase surface soil P, including plant available P which is more mobile and available to algae.
Both hydroseed and compost have properties that can enhance plant growth; however, compost
has a better ability to increase soil quality at a variety of soil depths and can increase soil
microbial biomass – which can be beneficial to nutrient cycling and availability to plants over a
prolonged period of time.
References Cited
USDA. 1998. Soil Quality Test Kit Guide. US Department of Agriculture. Washington,
DC, p.7-10, 55-58.

230
APPENDIX F
OUTREACH AND TECHNOLOGY TRANSFER
It is often stated that researchers often conduct research for the sake of research with little
to no attempt at transferring the results to the “real world”. This chapter will focus on
demonstration sites that have been created in Georgia to educate professionals, legislators,
activists and the general public; it will report results of an economic survey that was designed to
assess the state’s market infrastructure on compost use for erosion and sediment control; it will
review the US EPA’s National Pollution Discharge Elimination System Storm Water Program
for construction activities – as these regulations above all others will govern the future use of
compost in this application; and finally, it will give recommendations to further develop and
sustain the growing momentum behind this new compost market.
Demonstration Sites
Establishing new markets and creating a fresh demand for an old product can be a
considerable challenge. The relatively new use of compost in erosion and sediment control
applications has generated widespread interest and attention in both the private and public sector.
Perhaps its greatest attribute is the fact that a recycled product can be used for another
environmental application, one of rapidly increasing concern and regulatory pressure. And while
the adoption of this new technology may seem a slow and laborious process for those at the
forefront, much progress has been made in a relatively short time.

231
Several universities and private organizations are conducting applied research; product
and application specifications are being developed at state and federal levels, new technologies
for application methods are being developed, government agencies responsible for approval and
enforcement of erosion and sediment control measures have supported and approved the use of
compost, engineers and architects responsible for erosion and sediment control plans have begun
to include compost in their designs, and related small businesses have sprung up all over the
country.
While all of this is evidence of a snowballing interest to create a new and sustainable
large market for compost and to alleviate growing concerns around water quality and storm
water management issues, perhaps the greatest contributing factor to propelling compost into the
largess market of erosion and sediment control products is the establishment of working
demonstration sites. After all, seeing is believing.
Support Network
The University of Georgia’s Engineering Outreach Service and the Georgia Composting
Association have worked extensively over the past year and a half to establish a variety of sites
demonstrating the use of compost in erosion and sediment control applications. The number of
private and public organizations that have supported and participated in these projects dictates
the widespread interest and potential impact that compost may have in reducing erosion and
improving water quality. Supporters/participators in Georgia include: Georgia Department of
Transportation, Pollution Prevention Assistance Division of the Georgia Department of Natural
Resources, Georgia Soil and Water Conservation Commission, Cobb County Solid Waste,
Rockdale County, Gwinnett County, Erth Products LLC, Filtrexx International, Gromor

232
Organics, Georgia Natural Compost, Poultry Gold Compost, Beers/Skanska USA Building,
Bobo Grinding, WoodTech Mulch, Metro Mulch Blowing Services, Rayonier Paper Products,
US Poultry and Egg Association and the Animal and Poultry Waste Management Center at North
Carolina State University. While demonstration sites rarely produce quantitative data and are
most often used to exhibit publicly what has been learned through research, they often provide
direction for future research projects, as many of the following demonstration sites have
contributed to the research that was conducted at the University of Georgia.
Kenworth Truck Dealership
Located in Cobb County, Georgia adjacent to Atlanta's perimeter/belt-way, I-285, this
demo site was featured at the BioCycle: Southeast Conference in August, 2001. Demonstrations
provided during the conference tour included compost blanket applications of poultry litter
compost (Georgia Natural) and MSW compost (Cobb County Bio-Blend); and equipment
demonstration and applications included blower trucks (Rexius and Metro Mulch) and filter
berm builders (Mill Creek Manufacturing Co.).
A long-term demonstration site was established at the Kenworth Dealership, prior to the
conference tour, to educate attendees and local erosion and sediment control professionals on
how compost blankets and filter berms perform over time. Biosolids compost (Erth Food)
blankets were established in three test plots, 2.5 cm seeded, 5 cm unseeded, and 5 cm seeded. A
Filtrexx Filter Sock filled with Erth Food was placed at the base of each plot. Additionally, a
mixed particle size mulch blanket and mulch filter berm plot, a hydroseeded plot, a bare soil plot
with a silt fence, and a bare soil plot with a Filtrexx Filter Sock were installed. A storm water
233
collection bucket and sampler were placed at the base of the silt fence plot and at the base of the
5 cm seeded compost blanket and filter sock plot.
Results from the first storm event (7.5 cm) showed much of the hydroseed, and sediment
from that plot, had washed away leaving the upper quarter of the plot with no cover. The storm
water collection device showed that no runoff left the 5 cm compost blanket/filter sock plot
while the 18.9 liter (5 gal) collection device at the base of the silt fence plot was nearly full of
sediment. No rilling was evident in the compost or mulch blanket plots, while significant rilling
was apparent in the bare soil and hydroseeded plots. Six months after application the vegetation
establishment on the compost plots was near 100%, while the hydroseeded plots had no cover on
the top half of the plot.
Georgia Department of Transportation
Three demonstration sites were established on Highway 53 extension near Interstate 85
and Pendergrass north of Atlanta. The first two sites used poultry litter compost blankets
exclusively (Poultry Gold, Georgia Natural and Gromor Organics) on a 3:1 slope and a 2:1 slope.
All plots were seeded with a rye and bermuda grass mix. Finn and Metro Mulch pneumatic
blower trucks were used for application. The third demo site featured Poultry Gold compost
filter berms using a Mill Creek Berm Builder. All products performed well and were approved
by the Georgia DOT.
Beers/Skanska USA
Beers/Skanska USA is a commercial construction company owned by Swedish parent
company Skanska. Beers/Skanska USA was building a new wastewater treatment facility north

234
of Atlanta adjacent to the very popular Mall of Georgia. After trying nearly everything to
stabilize the slopes of a large sediment retention pond on the site, biosolids seeded compost (Erth
Products) was applied to the slopes and over the shoulders of the pond. Filtrexx Filter Socks
were installed around the storm runoff intake drains feeding the sediment pond. Mulch from
ground land clearing debris was applied above the sediment pond culverts. Six months later,
vegetation was well established and the retention pond slopes well stabilized. The mulch
blankets and filter socks were effective in reducing sediment from building up in the retention
pond.
Rayonier Paper Products
Rayonier Paper Products produces specialty paper products for clients like NASA and the
US military. As part of a comprehensive waste management plan they compost their paper fiber,
a byproduct of their manufacturing process. While waste reduction and the subsequent cost
avoidance is the goal of Rayonier's composting efforts they have put some energy into marketing
their finished product. Two demonstration sites were set up at their facility to show how their
compost could be used for erosion and sediment control on sandy soils. Both were street
embankments, one pitched at a 2:1 slope the other a 1.5: 1 slope. While much of the compost did
hold to the 1.5:1 slope this was probably its steepness threshold. The compost applied to the 2:1
slope performed quite well.
Habitat for Humanity International Global Village & Museum
Located in downtown Americus, this six-acre site is a future model village for "smart
development". It will feature environmental landscape designs, a village market, a cultural

235
museum, a winding watercourse, and pedestrian friendly pathways, all within the design of the
residential neighborhood.
Stormwater management and erosion control were key issues at the inception of this
project, as alternative measures, such as compost, were included in the erosion and sediment
control designs. As Wayne King of Erth Products stated, "This particular construction site had a
history of problems with erosion caused by surrounding impervious surfaces and downhill
drainage. The blankets were used to control erosion and to improve the soil structure. This is part
of a program designed to use engineered soils and landscape systems to offset impervious
surfaces and retain stormwater on site."
Compost filter berms were constructed using ERTH Food compost screened to 1.25 cm
(½ in) minus. The berm dimensions were 30 cm (2 ft) wide x 60 cm (1 ft) high. Eight and twelve
inch Filtrexx filter socks were filled with the compost and used as ditch checks. The socks were
also used in lieu of silt fences and in a stream bank retaining wall. Compost blankets were
installed with filter berms and filter socks throughout the project site. The blankets were seeded
and application rates varied from 1.25 to 2.5 cm depths.
Gromor Organics
In the fall of 2002 Gromor Organics Inc. and the Georgia Composting Association
sponsored a Compost Field Day to coincide with the annual Sunbelt Agricultural Expo in
Moultrie, Georgia. There were two main objectives of the field day; to demonstrate the
production and utilization of compost blankets and filter berms to a group of visiting Russian
farmers, and to demonstrate and promote the use of compost as an erosion and sediment control
best management practice (BMP) to state legislators. Speakers from the University of Georgia
236
addressed the farmers on the use of compost in the production of vegetable seedlings and on
compost blankets and filter berms.
For demonstration purposes compost blankets were established on a 2:1 slope and
compost filter berms were established around the contour of the slope's base. Compost blankets
were seeded with rye grass and applied at a depth of 2.5 – 3.75 cm. The filter berms were
approximately 60 cm high by 90 cm wide at the base.
Glenwood Green
Located in Grant Park, a neighborhood of Atlanta, Glenwood Green is an apartment
complex with approximately 100 new apartments that were in various stages of construction in
May of 2002. Although erosion and sediment control BMPs were employed, the construction
site had high rates of storm runoff due to surrounding impervious surfaces as well as excessive
amounts of sediment discharge from the site's retention/detention pond. Area storm drains had to
be cleaned out and alternative measures adopted to manage the storm water more effectively, as
mandated by City of Atlanta officials.
Polyacrylamide (PAM) was initially suggested to stabilize the disturbed soil, however
compost was ultimately the new measure adopted to reduce the runoff and sediment leaving the
construction site. A 2.5 cm thick compost blanket was pneumatically applied to the exposed soil
surfaces to reduce runoff and prevent soil erosion. Filtrexx filter socks were placed around storm
drains to filter any moving sediment and prevent it from reaching the drains. Compost blankets
and filter berms were also used in lieu of silt fences to prevent sediment from entering streets and
parking areas.
237
Erthfood compost was used to provide the temporary soil stabilization necessary for this
project and was the same material later used for permanent vegetation and final landscaping
projects at the apartment site.
Oakview Detention Pond
Integrated Science and Engineering firm contracted with Erth Products through an EPA
319 grant to demonstrate how innovative and performance based BMPs can be used in
conjunction to increase biodiversity and soil stabilization around retention/detention ponds in the
city of Griffin. The retention/detention pond had 30.3 m (100 ft) long slopes slightly greater than
2:1. Compost blankets were applied with a pneumatic blower at one-inch depths and seeded
with a rye, wheat, and bermuda grass mix. For comparative purposes a standard geotextile mat
with hydroseed was applied next to the seeded compost blankets. After three months, significant
rilling was evident underneath the geotextile mat and none was evident in the compost.
Additionally, the compost blanket produced a near 100% vegetative cover while the hydroseeded
mat had nearly 50%, according to visual inspection by project managers. The site continues to
be used for educational and demonstrative purposes on the effectiveness of compost as a
temporary and permanent vegetative erosion and sediment control measure.
City of Griffin
The City of Griffin has recently set up a 12 ha (30 acre) demonstration site to evaluate the
use of new and innovative measures in storm water management. Five field plots, 15 m (50 ft)
by 30 m (100 ft), with modest slopes ranging from 3.5 to 10% have been established to evaluate
these techniques. Seeded compost blankets and filter berms are being evaluated as well filter

238
socks filled with compost. The compost filter sock is being compared to sediment fences and
straw bales as an alternative sediment-trapping device.
Infrastructure Behind the Market
Currently, five composting operations in Georgia have used their products in erosion and
sediment control applications at nearly 15 demonstration sites. Four companies have established
themselves as compost applicators for erosion and sediment control. Three county government
agencies in Metro Atlanta have requested demonstration sites to be set-up in their county.
The Georgia Department of Transportation has approved the use of compost for erosion and
sediment control and is currently developing appropriate specifications. The Georgia Soil and
Water Conservation Commission (the state agency charged with approving and publishing best
management practices for erosion and sediment control) is considering including compost in its
next edition of Erosion and Sediment Control in Georgia. While the widespread adoption of
compost in this new application may seem laggard the interest and support network it has
generated in a relatively short time period is not only impressive but vital to its forward
movement in being an approved equal or better.
Survey of Georgia Composts and Market Prices
Of the 38 composting operations in Georgia, 11 operations have or could enter the
erosion and sediment control market based on the ability to meet the recommended
specifications and the ability to produce a large enough quantity to fulfill potential demand. The
following information was gathered through phone interviews and site visits to each of Georgia’s
239
composting operations. Through field demonstrations it has become increasingly clear that cost
may be the limiting factor to the growth of this new market.
Below is a price survey of compost manufacturers (Table 7.1) that can or have produced
a compost product for erosion and sediment control compared with approved industry standard
measures of erosion and sediment control. All prices are “installed” (material and cost of
installation) in 2003 US dollars. Costs are based on application with a pneumatic blower truck,
which is the recommended application method for this technology. Three-fourths of a cubic
meter (1 yd3) of compost or mulch will provide 19.5 m2 (210 ft2) of blanket cover (3.75 cm
inches deep) or 7.3 linear meters (24 ft) of filter berm (30 cm high by 60 cm wide).
Compost blankets ranged from $0.69/m2 to $3.63/m2 ($0.83/yd2 to $4.32/yd2). Filter
berms ranged from $0.23 to $0.61/linear meter ($0.74 to $2.00/linear ft). Hydroseed is the least
expensive erosion control method costing $0.38/m2 ($0.45/yd2) while rip-rap is the most
expensive at $9.61/m2 ($31.50/yd2). The most comparative methods, straw mats and geotextile
blankets, cost slightly more than compost blankets. The filter berms were cost competitive with
class A silt fences and less expensive than class C silt fences, which are specified more often. In
addition, silt fences have an associated maintenance, removal, and disposal cost, creating a life
cycle cost that could be more than double a compost filter berm. While compost blankets are
more expensive than hydroseed, hydroseeding often requires more than one application to
achieve the minimum 70% cover required by the G DOT. In addition, because compost blankets
fill uneven areas and surface holes during application, unlike conventional erosion control mats
or hydroseeding, no final grading is required (along with its associated cost).

240
Table 7.1: Economic survey of composts and conventional erosion & sediment control measures
as reported by industry (units in US Customary)
Compost Cost per yd2 @ 1.5 inch depth (seeded)
Cost per linear ft. of filter berm (1'x2')
Sargent Nutrients $4.32 $2.00 (1:2)/2.69 Poultry Gold $1.62 $1.25 Gromor Organics $1.65 $1.40 Erth Products $1.34/$0.67 (3/4") ND Wood Tech $0.96 $0.85 Cobb Co. $0.96 $0.85 City of Brunswick $1.04 $0.93 Hutchins Farm $1.20 $1.07 Bricko Farms $1.87 $1.67 Shealy Farms $1.43 $1.40 Free material $0.83 $0.74
Erosion Control Method Cost per yd2 Cost per linear foot
Hydroseed $0.45 Silt fence (Class A) $1.25 – 3.00 Silt fence w/ wire reinforcement (Class C)
$4.00
Rip Rap $31.50 Coconut hull mat $2.50 - 3.00 Straw mat $1.50 - 2.00 Straw mat w/ hydroseed $1.75 - 2.50 Geotextile blanket (wood fiber mat) $1.25 - 2.00 Geotextile blanket w/ hydroseed $1.50 - $2.50 Mulch $0.83 - $0.95 $0.74 - $0.85 One inch = 2.5cm; One foot = 30cm or 0.305 m, One square yard = 0.84 square meters
Background and History of the National Pollution Discharge Elimination System
Polluted storm water runoff is the leading cause of impairment to the nearly 40 percent of
surveyed U.S. water bodies which do not meet water quality standards (US EPA, 2003). Over
land or via storm sewer systems, polluted runoff is discharged, often untreated, directly into local
water bodies (US EPA, 2003). This water pollution can result in the destruction of fish, wildlife,
241
and aquatic life habitats; a loss in aesthetic value; and threats to public health due to
contaminated food, drinking water supplies, and recreational waterways (US EPA, 2003).
Mandated by Congress under the Clean Water Act (CWA), the National Pollution
Discharge Elimination System (NPDES) Storm Water Program is a comprehensive two-phased
national program for addressing the non-agricultural sources of storm water discharges that
adversely affect the quality of our nation's surface waters (US EPA, 2003). The Program uses the
NPDES permitting mechanism to require the implementation of controls designed to prevent
harmful pollutants from being washed by storm water runoff into local water bodies (US EPA,
2003). For a copy of the federal Clean Water Act of 1977 go to the internet at
www.epa.gov/npdes/pubs/cwatxt.txt. The ultimate goal of the NPDES program is to clean up
over 20,000 rivers, lakes, and estuaries so they are safe for swimming and fishing (US EPA,
2000).
The Federal Water Pollution Control Act of 1956 was amended in 1972 to combine The
Water Quality Act of 1965, The Clean Water Restoration Act of 1966, and The Water Quality
Improvement Act of 1970 (US EPA, 2003). The 1977 amendments to the Federal Water
Pollution Control Act (known as the Clean Water Act) provides the statutory basis for the
NPDES permit program and the basic structure for regulating the discharge of pollutants from
point sources to waters of the United States (US EPA, 2003). Section 402 of the CWA
specifically required EPA to develop and implement the NPDES program (US EPA, 2003).
The CWA gives EPA the authority to set effluent limits on an industry-wide (technology-based)
basis and on a water-quality basis that ensure protection of receiving waters. The CWA requires
anyone who wants to discharge pollutants to first obtain an NPDES permit, or else that discharge
will be considered illegal.

242
The CWA allowed EPA to authorize the NPDES Permit Program to state governments,
enabling states to perform many of the permitting, administrative, and enforcement aspects of the
NPDES Program. In states that have not been authorized to implement CWA programs, EPA still
retains oversight responsibilities (US EPA, 2003).
The NPDES program areas include animal feeding operations, combined sewer
overflows, pretreatment, sanitary sewer overflows, and storm water. Activities covered under
the NPDES storm water area include municipal separate storm sewer systems (MS4s),
discharges from industrial facilities, and discharges from construction activities. This analysis
will focus specifically on storm water discharges from construction activities.
In response to the 1987 Amendments to the Clean Water Act, which mandated
construction sites to control storm water, erosion, and sediment originating from their site, the
U.S. EPA developed Phase I of the NPDES Storm Water Program in 1990 (US EPA, 2000). The
Phase I program addressed sources of storm water runoff that had the greatest potential to
negatively impact water quality. Under Phase I, EPA required NPDES permit coverage for storm
water discharges from eleven categories of industrial activity, which includes construction
activities that disturb five or more acres (2.03 ha) of land (US EPA, 2003).
The Phase II Final Rule, published in the Federal Register on December 8, 1999, requires
NPDES permit coverage for storm water discharges from construction activities (including other
land-disturbing activities) that disturb one acre (0.4 ha) or more to be regulated under the
NPDES storm water program (US EPA, 2003). On March 10, 2003, NPDES Phase II became
effective, thus extending coverage to construction sites that disturb one to five acres (0.4 – 2.03
ha) in size, including smaller sites that are part of a larger common plan of development (US
EPA, 2003).
243
Operators of regulated construction sites are required to develop and implement storm
water pollution prevention plans and to obtain permit coverage from an authorized state or from
EPA, if the state is not authorized by EPA to issue NPDES permits (US EPA, 2003). Currently,
most states are authorized to implement the NPDES permit program.
The Water Permits Division (WPD) within the U.S. Environmental Protection Agency's
Office of Wastewater Management leads and manages the National Pollutant Discharge
Elimination System permit program in partnership with EPA Regional Offices, states, tribes, and
other stakeholders. To ensure the NPDES permit program is effective, the WPD performs a wide
variety of activities, including: shaping the direction of the national NPDES permit program;
producing policies and regulations; developing technical and administrative tools to support
permit issuance; tracking and managing critical information related to permit issuance, permit
quality, and point source pollution abatement; overseeing the programs managed by the States
and Regional Offices; and providing access to information on NPDES permitting to promote
increased awareness and involvement in the NPDES permitting process (US EPA, 2003). The
Water Permits Division of the US EPA has twelve staff members (US EPA, 2003). The EPA’s
budget for Clean and Safe Water under which the NPDES program is funded in 2002 was
$3,738,990 (US EPA, 2003).
Program Objective, Process, Monitoring and Evaluation
The overall objective of the NPDES storm water program for construction activities is to
increase the nation’s surface water quality by increasing controls on erosion and sedimentation.
Specifically, the program is designed to decrease sediment loading in surface water, maintain
stream turbidity levels of surface water entering and leaving a construction site, and increase
244
numbers of sensitive aquatic organisms in local water bodies (US EPA, 2003). The EPA judges
the effectiveness of NPDES storm water program based on these parameters (US EPA, 2003).
The NPDES storm water program seeks to accomplish this objective by requiring all
construction sites and land disturbing activities greater than one acre (0.4 ha) to: submit a notice
of intent (NOI), submit a storm water pollution prevention and/or erosion and sediment control
plan, install and maintain approved best management practices (BMPs), follow established
procedures for site inspections by the regulatory agency, monitor the site by storm water
sampling and reporting results in accordance with 40 CFR Part 136 and EPA Method 180.1 (GA
SWCC, 2002), follow sanctions for noncompliance (issuance of stop work order or fine up to
$2,500/day and $100,000/day for noncompliance with the GA Erosion and Sediment Control Act
and Federal Clean Water Act, respectively), and submit a notice of termination (NOT) (US EPA,
2003).
To monitor the effectiveness of specific projects building contractors are responsible for
collecting and reporting storm water runoff samples from their sites. The first sample must be
collected at least 45 minutes after the start of the first ½ inch (1.25 cm) or more rain event after
soil disturbance. A final sample must be taken either 90 after the first sample or after major soil
disturbance has commenced (Shahlaee, 2003). Samples must be drawn from receiving streams
or from outfall before entering stream. Contractors are required to have all storm water samples
tested for turbidity and are prohibited from impacting any warm water stream by more than 25
Nephelometric Turbidity Units (NTUs) and any trout stream by more than 10 NTUs (GA Soil
and Water Conservation Commission, 2002). The results must be reported to the state regulatory
agency, in Georgia, the Environmental Protection Division (EPD). Violation exemptions can be
245
given if a storm event is equal to or greater than the 25-year/24-hour storm event for that given
region and approved erosion and sediment control BMPs were utilized and installed correctly.
Coordination with State Agencies
There is considerable overlap between the EPA’s NPDES program with state and even
local programs, particularly because the EPA has passed the responsibility on to the states. The
Georgia Erosion and Sediment Control Act has been amended to reflect Phase I and II of the
NPDES program. In Georgia, the EPD is responsible for enforcement of the Federal Clean
Water Act and the Georgia Erosion and Sediment Control Act, approving NPDES permits,
reviewing erosion and sediment control and land disturbing activity plans, evaluating monthly
storm water sample results, and accepting NOIs and NOTs (GA Soil and Water Conservation
Commission, 2002).
The Georgia Soil and Water Conservation Commission (GA SWCC) has been charged to
provide educational and technical assistance programs in storm water management and erosion
and sediment control measures. The GA SWCC provides training and certification to Erosion
and Sediment Control professionals, approves and publishes state BMPs for erosion and
sediment control measures, and in some cases is responsible for reviewing erosion and sediment
control plans. In some instances the approval of land disturbing activity permits, approval and
review of erosion and sediment control plans, and site inspections has been given to a local
issuing authority (county or municipality) through certification by the GA EPD and GA SWCC
(Shahlaee, 2003). This is common in the Metropolitan Atlanta area and is a result of the Georgia
Erosion and Sediment Control Act, not the NPDES program. The GA EPD has the ability to
revoke this responsibility from the local issuing authority.
246
Local Soil and Water Conservation Districts (SWCD) and the Natural Resource
Conservation Service (NRCS) are responsible for further technical and educational assistance,
and the NRCS is also involved in reviewing erosion and sediment control plans (GA Soil and
Water Conservation Commission, 2002). The NRCS, SWCD, EPD and SWCC are all involved
during complaint resolutions (GA Soil and Water Conservation Commission, 2002). The EPD
has the final word on submitted plans, violations and compliance statements (GA Soil and Water
Conservation Commission, 2002).
Assessment of NPDES Storm Water Program
In response to a mandate of the Appropriations Act, EPA conducted a review on the
status and effectiveness of the NPDES Phase I program. The sediment load reduction analysis
projects that Phase I construction BMP compliance prevents 73.2 percent of the sediments
generated during construction from reaching the nation’s streams, rivers and lakes (US EPA,
2000b). An average of 57 metric tons of sediment may be eroded from each of the 62,755
construction sites regulated by Phase 1 in 1999 (US EPA, 200b). This reduction equates to 2.6
million metric tons of sediment (264,000 dump trucks of soil) from being kept out of our
nation’s waters (EPA, 2000b). An EPA study in Florida that looked at erosion and sediment
control in eleven coastal watersheds, before and after Phase I BMPs were in place, found a 31%
reduction in sediment loading after the BMPs were established (EPA, 2000b). The US EPA’s
NPDES Storm Water Program appears to be achieving its objectives.
According to Karim Shahlaee (2003), Program Manager of Urban Water Resources for
the Georgia Soil and Water Conservation Commission the NPDES storm water program has its
share of strengths and weaknesses. Its strengths include its hefty fines of up to $100,000 day per

247
violation, the stringent turbidity limits, the monitoring requirements – particularly the frequency
of sampling, and the citizen lawsuits – where anyone can sue a violator not just someone who
has been negatively impacted (Shahlaee, 2003). Shahlaee adds that the Phase II rule does require
less sampling (frequency) but requires more site inspections which are funded through
significantly increased erosion and sediment control plan application fees to the EPD (2003).
The main weakness to the national program is that there is no provision for the review of erosion
and sediment control plans, which subsequently is a strength of the state law (Shahlaee, 2003).
Program Strengths
Overall, this program appears to be consistent with the EPA’s goals, cost effective and
fair to building contractors. The true evaluation of this program will be its sustainability, i.e.
flexibility to deal with changing storm water issues, and most important - will it really improve
the water quality of the nation’s, lakes, rivers and streams. Requiring approved BMPs, analytical
analysis of storm water discharges based on the use of these BMPs, consistent monitoring,
reporting and record keeping by the contractor, and making the contractor responsible for these
actions is an appropriate protocol to achieve the goals of this pollution prevention program.
Enforcement measures by the regulatory agency for negligence and/or non-compliance are also
appropriate tools, particularly the option of a stop work order.
Program Weaknesses
Potential weaknesses of this program include the reliance of the contractor to submit
analytical data of storm water turbidity results. While this reduces the cost to regulatory
agencies in both time and personnel and transfers the cost to the contractor (which can be passed

248
on to the buyer instead of the taxpayer), it leaves the ability of the contractor to misrepresent
analytical results, particularly when the enforcement measure may end the entire construction
project due to financial or time restraint issues. Other weaknesses include the potential cost of
some approved BMPs and their potential ineffectiveness. To mitigate this an extensive third
party research program to comparatively evaluate approved BMPs would be a good tool to
determine how effective these BMPs are at keeping sediment out of surface water. A
quantitative benchmark (ex. grams/soil loss per runoff quantity and/or grams/soil loss by rainfall
duration/intensity) could be established where all BMPs must pass to be approved. This study
should be easy and inexpensive to replicate so it is not a barrier to the approval of new and
innovative erosion and sediment control measures and technologies. The agency in charge of
approving BMPs and/or erosion and sediment control/storm water pollution prevention plans
should have the ability to verbally approve new measures temporarily to assess their
effectiveness in the field. This will not inhibit building contractors and designers of erosion and
sediment control plans from trying new ideas, particularly in challenging situations.
Recommendations for Improvement of NPDES Program
Based on this inquiry the NPDES storm water program for construction activities appears to
be effective at improving the nation’s surface waters. However, there is always room for
improvement, the following is a list of recommendations to further the goals of the NPDES
storm water program related to construction activities:
• Instead of a set fine amount, fines could be based on the sediment concentration or load
amount in storm water samples over the regulated limited. As the concentration or load
increases over the allowable limit the fine amount multiplies. Leeway will continue to be

249
given for extreme storm events and parties that have followed approved BMP measures
and their correct installation.
• More site inspections by the regulatory body, particularly with construction sites that
report storm samples over the allowable sediment limits (this appears to be happening in
2004-2005).
• Educational training and certification provided to building contractors that will be
conducting their own storm water sampling, record keeping, and reporting. Third party
agencies and companies sampling storm water must also be certified.
• Signs posted at all construction sites, once land disturbing activity has commenced, that
includes an emergency contact number to the regulatory agency (or third party agency
that is assisting) in the event of erosion and sediment control problems.
• Incentives provided to contractors who demonstrate improved stream water quality of
water leaving their site over water entering their site. A partial or total refund of the
erosion and sediment control plan application fee may be rewarded to the building
contractor.
• Analyzing and reporting of storm water samples for nitrogen and phosphorus should be
considered. Soil stabilization measures that include vegetation establishment often call
for fertilizer applications. Over application, application near surface water, and/or just
before a storm event can increase nutrient loading in lakes, rivers and streams. The
agricultural industry faces increasing regulation in this area, the construction industry
should be subject to the same standards.

250
Recommendations for Expanding Compost Use in Erosion and Sediment Control
In the fall of 2001 the University of Georgia’s Engineering Outreach Program (EOP)
completed a statewide composting survey designed to help expand the industry and organic
materials recycling in Georgia. The survey found Georgia had 38 facilities actively composting
that handle over 504,000 metric tons/year of organic materials in addition to 5 new facilities
coming on line later that year. While half of those facilities were private operations they handled
more than 80% of the recycled organics. More than 35% of the composted materials were
handled through operations that manage a variety of feedstocks, while yardwaste composting
operations handled the second most at nearly 20% of the total organic materials composted.
While standardizing finished compost products may help the composting industry in
Georgia, it may only serve a handful of the largest private composting operations and certainly
the consumer. The Georgia Composting Association (GCA) and the Engineering Outreach
Service at UGA are interested in creating standards for compost products produced in Geogia, as
well as specifications for various product applications. The Georgia Composting Association is
considering endorsing the USCC’s Seal of Testing Assurance (STA) program and may provide
incentives for GCA composters to become STA certified. In addition, the GCA may also create
their own stamp of approval for high quality compost products produced within the state. The
stamp can be used as a marketing tool for GCA composters and can serve to insure consumers
that the material they are buying is a certified, high quality material that was made in Georgia
with materials recycled from Georgia industries and municipalities. Developing an expansive
market infrastructure through continual research, demonstration projects, product and application
specifications, and supporting product certification are the cornerstones to a successful and
sustainable composting industry seeking to recycle ever more organic waste.

251
The following is a list of recommendations for the sustainable development of compost in
erosion and sediment control applications and markets:
1. Research. As a relatively new technology there is a tremendous amount of research that
can be done in this area. Here are a few ideas: how close to surface water can compost
blankets be applied, what is the optimum particle size ratio for filter berms to filter
sediment from storm water, is compost effective in areas on concentrated water flow,
what is the optimum particle size ratio and lowest possible nutrient content of a compost
blanket that can still provide a rapidly established and permanent vegetative cover, how
steep of a grade can compost blankets be applied to, and will the addition of a tackifier
significantly increase the physical stability of a compost blanket on a steep slope.
2. Demonstration sites. There is no better training and educational tool than to see how it
works in the field. Strategically located demonstration sites can expose a large audience
and significant stakeholders to this emerging technology.
3. Education. Educational and technical assistance through workshops, trainings,
conferences, multi-media and personnel communication to architects, engineers,
regulators, inspectors and other related professionals and stakeholders is essential to the
widespread adoption of this material.
4. Development and Adoption of Specifications. During the short time period this study
was conducted the development and adoption of specifications for this application has
grown significantly. The Georgia Department of Transportation has developed and

252
adopted new specifications (with assistance from this project), the Georgia Soil and
Water Conservation Commission is considering following suit. The American
Association of State Highway Transportation Officials, supported by the Federal
Highway Administration, has adopted specifications (with assistance from this project)
that have been sent to the DOTs of the fifty states. The continued adoption of these
specifications throughout state and federal agencies that deal with erosion and sediment
control is essential.
5. Marketing. Compost operators need to be aggressive in marketing their material to this
market. This may include hiring a marketing specialist and/or sales personnel,
researching and making bids for erosion control jobs with the DOT, meeting with
building architects who specify which erosion control measures will be employed on a
particular project, and leading/participating in education and outreach activities.
6. Being Competitive. This application normally requires very large volumes of material
per project with compost that can be blended with less expensive mulch or “overs”
materials. With this in mind compost operators can charge less for their compost relative
to other markets. If composters do not reduce their cost, on a cubic yard or tonnage basis,
to a level that is competitive with industry standard measures, it will likely never be
adopted on a large scale. If composters can demonstrate that their product is less
expensive than standard measures, the financial rewards could be overwhelming. In
addition, small operations may enter partnerships to fulfill the quantity demanded for
large storm water projects.

253
7. Quality Products. Providing consistent, high quality compost that meets specification is
essential to the growth of this application. One or two bad applications or failures can
devastate the adoption of this technology. Most specifications include quality standards
as insurance to all parties and the industry a whole.
8. Establishment of Storm Water Utilities. Storm water utilities that charge counties or
municipalities based on the quantity of impervious surface under their jurisdiction could
lead to a greater awareness and demand for the use of compost in storm water
applications.
9. Polluter Pays Program. Erosion Control enforcement agencies could charge violators
based on the turbidity unit increase to the ambient upstream flow of a designated surface
water. This may help push the adoption of more effective BMPS, including compost.
10. E&SC Plan Fee Waiver. The EPD could offer reduced fees or no fee waivers to
contractors or submitters of E&SC and storm water management plans that specify
recycled materials in their plans, which helps the state achieve another goal – 25% waste
reduction.
11. Evaluation of Current E&SC BMPs. Many industry and field specialists feel that some
currently approved BMPs do not perform well in erosion and sedimentation applications.

254
Quantitative research that comparatively evaluates currently approved BMPs may show
the ineffectiveness of many of these measures, particularly once compared to one
another.
References Cited
Georgia Soil and Water Conservation Commission. 2002. Erosion and Sediment Control
Course Manual. Georgia Soil and Water Conservation Commission.
Shahlaee, K. 2003. Personal communication. Program Manager for Urban Water
Resources, Georgia Soil and Water Conservation Commission.
US EPA. 2000. Bosque watershed doesn’t waste manure. Nonpoint Source News Notes.
No. 63. p. 21-22.
US EPA. 2000b. Report to Congress on Phase I Storm Water Regulations. Office of Water
(4203). EPA 833-R-00-001.
US EPA. 2003. www.cfpub.epa.gov/npdes/ - Permit, Storm Water, Construction Activities,
Phase 1 & Phase II, FAQS, Publications, Regulations.