evaluation of energy flexibility of buildings using...
TRANSCRIPT

Author: Bismark Torres Ruilova
Tutors: Cristian Fabrega / Joana Ortiz
Academic course: 2016 - 2017
Evaluation of energy flexibility of buildings
using structural thermal mass
Master of renewable energy and energy sustainability
Sostenibilitat Energètica

Dedication
This work is dedicated to my wife Ivetheyamel and my sons Camila and Santiago, who
inspire me to get better every day.
Acknowledgements
I thank Joana Ortiz, Ph.D, IREC researcher for all assistance provided me in this
process.
Part of this work stems from the activities carried out in the framework of the IEA-EBC
Annex 67 (International Energy Agency – Energy in Buildings and Communities
program) about Energy Flexibility in Buildings.

INDEX 1. Overview............................................................................................................................... 1
2. State of the art ...................................................................................................................... 2
2.1 Energy policy of the European Union ............................................................................... 2
2.2 Energy flexibility in buildings ........................................................................................... 3
3. Method ................................................................................................................................. 5
3.1 Objective ......................................................................................................................... 5
3.2 Model description ........................................................................................................... 5
3.3 Scenario .......................................................................................................................... 6
3.3.1 Reference scenario ................................................................................................... 7
3.3.2 ADR – Events scenario .............................................................................................. 7
3.4 Key Performance Indicators ............................................................................................. 8
3.4.1 Available structural storage capacity (CADR [kWh]) ..................................................... 8
3.4.2 Storage Efficiency (ƞADR [-]) ....................................................................................... 9
3.4.3 Thermal Comfort index: .......................................................................................... 11
3.4.4 Electricity consumption .......................................................................................... 11
3.4.5 Electricity cost. ....................................................................................................... 11
4. Results and discussion ......................................................................................................... 12
4.1 Cases “+1D/2H” and “-1D/2H” ....................................................................................... 12
4.1.1 Upward ADR event ................................................................................................. 12
4.1.2 Downward ADR event ............................................................................................. 14
4.1.3 Comparison of upward and downward ................................................................... 16
4.2 Effect of temperature variation ..................................................................................... 17
4.3 Effect of event duration ................................................................................................. 19
5. Conclusions ......................................................................................................................... 22
6. References .......................................................................................................................... 24

1
1. Overview
In order to mitigate the effects of climate change and to focus on sustainable development in the field of energy, the EU is committed to increase renewable
energies and energy efficiency, as we see in the objectives "20/20/20" and in the
strategies for 2030. Renewable energies solar and wind have had a great advance;
however they are very unpredictable because they depend on the climatic conditions,
which represent a disadvantage in its use. The development of these energies could be
compromised by the problems that could cause in the stability of the electrical network
if its penetration is high. There is a great deal of research focused on improving this
situation of instability through energy storage and distribution. The demand
management has been identified as a tool for the balance between energy generation
and demand. It has been found in the construction sector a great opportunity, taking
advantage of the fact that in 2020 all new buildings must be nearly Zero Energy
Building (nZEB). The trend is that buildings will become energy producers, and to
capable to store it. Then, determining the flexibility of a building's energy demand
becomes the key to proposing energy consumption strategies that favor the stability of
the power grid and the cost of energy.
There are several alternatives to store energy in a building. Its thermal inertia can be
widely used in heating and cooling systems, which represent the greatest demand for
energy in a home. This study is focused on determining the energy flexibility of the
heating system operation a nZEB using its structural mass. The energy flexibility has
been tested implementing advanced control strategy without compromise the thermal
comfort of the users. It has been evaluated with the indicators of available storage
capacity and the energy storage efficiency proposed by Reynders[1].
2
2. State of the art
2.1 Energy policy of the European Union
Energy is indispensable for the life of human beings. The energy access and security
of supply are keys to the development of modern societies. The dependence on fossil
fuels, the level of imports and the environmental impact of their use are some of the
major challenges facing the European Union (EU); without neglecting aspects such as
the price of energy, the increase of energy demand, the reliability of electric systems,
climate change, among others. Against this background, the EU establishes an energy
policy[2] aimed at achieving an integrated energy market, security of supply, and
sustainability of the energy sector.
As alternatives to energy production low in CO2 emissions and the reduction of
greenhouse gases (GHG), the EU launched the so-called "20-20-20 climate-energy
package"[3][4][5]]. It agrees to reduce GHG emissions by at least 20%, to use at least
20% of renewable energy sources (10% in transport), and to improve energy efficiency
by 20%; All these objectives must be achieved by 2020 and measured by reference to
1990. By 2030 [6], it has already set a new target of reducing 40% of GHGs and at
least 27% of energy consumption must be of renewable sources.
In the framework of these policies, the EU aims to move towards an energy future: low
in CO2 emissions, reliable, sustainable, and independent; where renewable energy,
energy storage, and smart grid will play a very important role. The great deployment of
solar and wind energy could be affected by the variability they have and the instability
that could occur in the smart grid, as they have greater penetration in the market. The
climatic conditions and the difficulty of storage are the main disadvantages, which face
this type of energies.
Under this situation new concepts such as energy flexibility and nearly zero energy
buildings (nZEBs) emerge. These buildings play a very important role in the generation,
storage, distribution and consumption of energy; becoming small energy centers;
helping to manage supply and demand; giving energy flexibility to the system; and
obtaining a decentralized, renewable, interconnected and variable economy.
The EU has provided that, as of 31 December 2020[7], all new buildings will nearly
zero energy building (nZEB). A nearly zero energy building is defined as “a building
that has very high energy performance. The nearly zero or very low amount of energy
required should be covered to a very significant extent by energy from renewable
sources, including energy from renewable sources produced on-site or nearby” [8].

3
The role of buildings in the management of renewable energy is becoming more
important; they can act as energy generators, as energy storage, or as controllers of
demand. Through an active demand response (ADR) event, demand can be managed,
to reduce energy demand to reduce peak demand or to avoid system failures[9]. The
demand responds to the habits of the consumers and this can be modified by different
strategies. As a result nZEBs are projected as renewable energy sources, with storage
capacity and demand flexibility.[10][11].
2.2 Energy flexibility in buildings
Energy flexibility is defined as “the ability to manage its demand and generation
according to local climate conditions, user needs and grid requirements” [12]. De
Coninck, defines it as “the possibility to deviate the electricity consumption from the
business as usual (BAU) consumption at a certain point in the time and during a certain
time span”.[13]
Several authors have presented indicators and methodologies to quantify the energy
flexibility[13][14][1][15]. It is generally considered the quantification of 3 aspects of
energy flexibility: time, energy quantity and storage efficiency. These parameters
determine how long can be delayed or forced the operation of Heating, Ventilating and
Air Conditioning (HVAC) systems, without jeopardizing thermal comfort, the amount of
energy that increases or decreases during this period, and the losses or efficiency of
storage.
The structure of a building (walls, floor, roof and furnishings) can also be considered as
a thermal storage system. A study by Braun[16] notes that both energy costs and
electrical use can be substantially reduced by adequate control of the thermal storage
of the building. Reynders[17], in his study of the impact of residential building design
parameters on the structural energy storage potential (STES) for the ADR, develops a
quantification method based on 4 performance indicators: the available storage
capacity, storage efficiency, power shifting capability and state of charge. The heat that
can be stored during an ADR event and the efficiency of this storage depends not only
on the structure of the building, but also on the properties of the heating and ventilation
systems, the climatic conditions of the environment and the behavior of users.
Available capacity and storage efficiency provide important information for the design
of buildings and power grids. In addition, the power change capability and the load
state quantify instantaneous flexibility in an operative phase.
A strategy of flexibility is to control the loads. It is possible to change part of the peak
period load to the period of lower demand, or to maximize the use or accumulation of

4
energy when the energy price is lower or vice versa. Most of the thermal energy will be
stored in the intrinsic structure and furniture when the temperature increases.
The energy demand in residential buildings is mainly composed by heating, cooling,
domestic hot water, lighting, and the use of electrical appliances. A large part of this
demand can be shifted over time and, therefore, increase its flexibility. Taking
advantage of the thermal inertia of building, it can be used to move the thermal loads of
heating or cooling at certain intervals without compromise the thermal comfort. The
effect of this shifty depends on thermal mass, heat loss, internal gains, user pattern
and actual climatic conditions.
The research developed into the energy flexibility that buildings can offer to help
stabilize power grids and facilitate the penetration of renewable energy is in its early
stages. There is still no overview of the amount of energy flexibility that buildings
according to type and use can offer to the electrical system. In this context, the
International Energy Agency (IEA) and Energy in Building and Community Program
(EBC) launched the Annex 67 Energy Flexible Buildings program[12], which aims to
increase knowledge, provide possible solutions that energy flexibility in buildings can
offer, and provide the means to exploit and control this flexibility. It also aims to develop
a methodology to characterize the energy flexibility of buildings, including on-site
generation research, energy storage, load management, user behavior and user
acceptance through simulations, laboratory tests and demonstrations in real buildings.
5
3. Method
3.1 Objective
The purpose of this project is to investigate the behavior of the energy flexibility of a
residential building in Mediterranean climate, through the activation of its structural
thermal mass by controlling a heating load to:
Implement different ADR strategies in the heating system operation.
Evaluate energy flexibility through the indicators: available storage capacity and
storage efficiency.
Investigate how to represent the energy flexibility.
Identify which is the best flexibility strategy to reduce the energy cost.
3.2 Model description
A residential building[18][19][20] located in Terrassa (Barcelona, Spain) has used to
evaluate the energy flexibility. Table 1 shows the main characteristics of the building,
which coincide with the characteristics of a nZEB: high energy efficiency building.
The apartment is located on the first floor of the building with two external facades
facing north and west; it is divided into 3 bedrooms, a living room, a kitchen, a study, a
hallway and a bathroom as shown in Figure 1. The building is modeled in TRNSYS,
including the external environment and its corresponding shade. Further details on the
hypothesis of the construction model are described in[10][21].
Table 1 Main characteristics of the building
Parameter Unit Values Floor area m2 108.5 Window area m2 19.6 Protected volume m3 263.6 U-value walls W/m2K 0.2 U-value windows W/m2K 2.5 g-value windows - 0.5 Ventilation - Natural Solar protections - Blinds (all openings), Awing (west facade) Heating and DHW Heat Pump Lighting system LED
The heating (SH) and domestic hot water (DHW) is produced by an air-water heat
pump with a COP of 5.25. The emitters of the system are water radiators, and once the
water flow stop, the radiator continues to emit heat until the water it contains cools

6
down. The radiators are controlled by a single thermostat placed in the living room.
Figure 1: 3D model, photo and floor plan of the study case building.[10]
The occupancy profile has been adapted according to the habits of the family, as
shown in the table 2.
Table 2 Occupation profile
Occupancy Day zone Occupancy Night zone Non-occupancy zone
06:00 – 09:00 and 19:00 – 21:00 21:00 – 06:00 09:00 – 19:00
The weather data used for the simulation are from a weather station located in the city
centre of Terrassa (official weather station nº 189C, “Agencia Estatal de
Meteorología”).
3.3 Scenario
In this study, a set of cases are defined to evaluate the energy flexibility in a nZEB by
the operation of the heating system. These cases involve the boundary conditions, the
behavior of the occupants and the reference scenario. The indicators analyzed quantify
the energy flexibility by analyzing a deviation from a reference scenario.
The thermal mass of the house is activated by performing ADR events. Reynders
defines an ADR event as "an active, temporary deviation from normal behavior without
violating comfort requirements". This can be interpreted as a short-term increase or
decrease of the temperature set point. The temperature control is performed by a
traditional thermostat, which is implemented a day-night program according table 2.
Table 4 shows an overview of the evaluated cases.

7
3.3.1 Reference scenario
It is considered as a reference scenario the normal operating conditions of the heating
system: the setpoint during occupancy day hours is 21.5 ºC and 20.5 ºC at occupancy
night or when the apartment is empty. These temperatures correspond to the middle of
the comfort range, as table 3 shows.
Table 3 Category and temperature ranges to maintain thermal comfort in day and night[22].
Category Operative temperature ranges (°C)
Day range. Assumptions: Night range. Assumptions: 1.2 met, 1 clo, 0.1 m/s 0.8 met, 2.5 clo, 0.1 m/s
Cat. II
19.2 - 23.8
17.8 - 22.7
3.3.2 ADR – Events scenario
The ADR events consist in changing the setpoint temperature for a certain time, in
order to shift the heating load. To define the ADR events is need to determine 3
parameters:
The setpoint variation. Increase or decrease the setpoint, and how many
degrees.
The duration of the event, for how long the setpoint will be modified.
When the ADR event will be done, e.g. at 01:00 or 17:00 of the day.
Table 4 List of cases
The cases presented in Table 4 correspond to:
CasesTemperature
setpoint occupancy day (ºC)
Temperature setpoint occupancy night and non-occupancy (ºC)
TemperatureSetpoint
variation (ºC)
Duration of the ADR event (h)
Projection horizon (h)
+1D/1H 21.5 20.5 +1 1H 24 H-1D/1H 21.5 20.5 -1 1H 24 H+1D/2H 21.5 20.5 +1 2H 24 H-1D/2H 21.5 20.5 -1 2H 24 H+2D/2H 21.5 20.5 +2 2H 24 H-2D/2H 21.5 20.5 -2 2H 24 H+1D/3H 21.5 20.5 +1 3H 24 H-1D/3H 21.5 20.5 -1 3H 24 H+1D/5H 21.5 20.5 +1 5H 24 H-1D/5H 21.5 20.5 -1 5H 24 H

8
Events with different variations in setpoint temperature and same period
duration.
Events with the same variation in setpoint temperature but different duration
time.
At each hour of the day, an event was implemented, for each case; and the flexibility
analysis was performed within a 24-hour horizon, counted from the start of the event.
The simulation of these cases aims to: identify the behavior of energy flexibility during
each hour of the day; define when and how much energy can be stored or decreased
consumption; when the maximum energy flexibility occurs and when it is zero; when
and under what conditions the cost of energy is minimized; i.e. to help increase the
knowledge of energy flexibility, to propose strategies that help to manage demand in
the best way.
3.4 Key Performance Indicators
For this study, the indicators of energy flexibility considered are available storage
capacity and storage efficiency. In addition, indicators of thermal comfort, electricity
cost and energy consumption are analyzed in order to evaluate the ADR events from
different points of view.
3.4.1 Available structural storage capacity (CADR [kWh])
The available structural storage capacity for active demand response is defined “as the
amount of heat that can be added to the structural mass of a dwelling, in the time-
frame of an ADR event, without jeopardizing thermal comfort”.[1]
To quantify available storage capacity and storage efficiency Reynders is based on: a
reference scenario in which the setpoint temperature is the minimum set to maintain
thermal comfort; and in the increase of the temperature setpoint during the simulation
of the ADR events[1], as shown in figure 2.
9
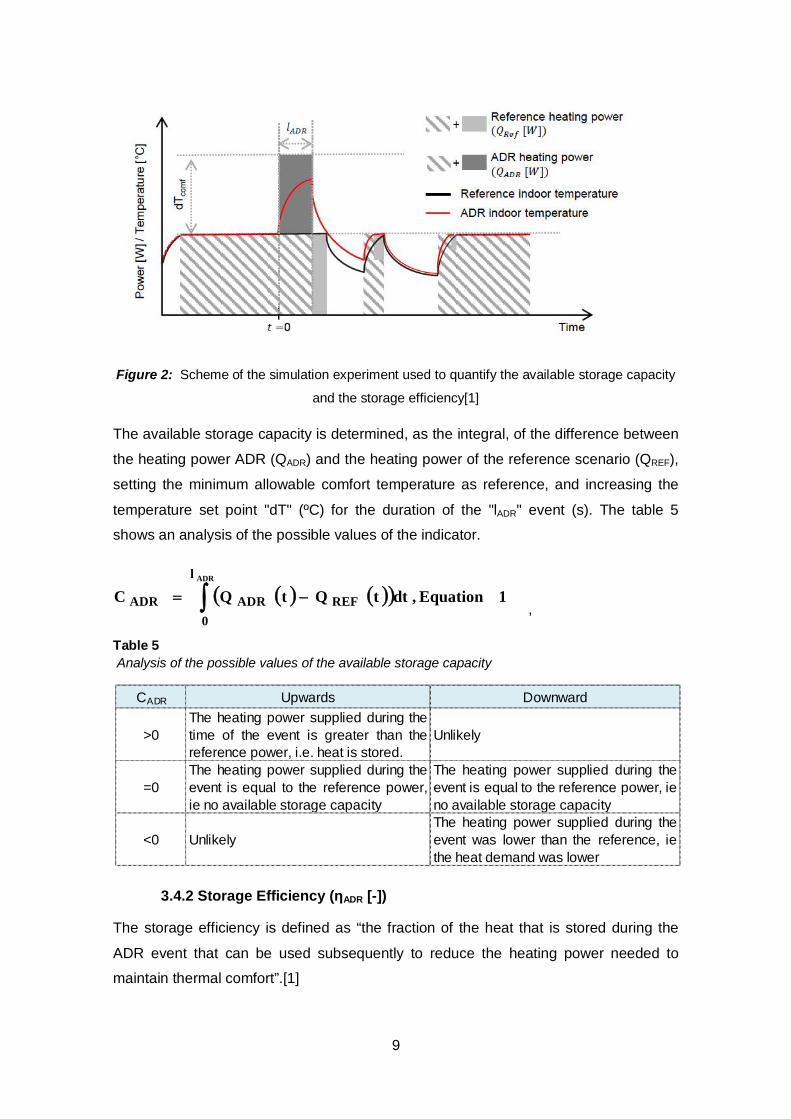
Figure 2: Scheme of the simulation experiment used to quantify the available storage capacity
and the storage efficiency[1]
The available storage capacity is determined, as the integral, of the difference between
the heating power ADR (QADR) and the heating power of the reference scenario (QREF),
setting the minimum allowable comfort temperature as reference, and increasing the
temperature set point "dT" (ºC) for the duration of the "lADR" event (s). The table 5
shows an analysis of the possible values of the indicator.
,
Table 5 Analysis of the possible values of the available storage capacity
3.4.2 Storage Efficiency (ƞADR [-])
The storage efficiency is defined as “the fraction of the heat that is stored during the
ADR event that can be used subsequently to reduce the heating power needed to
maintain thermal comfort”.[1]
CADR Upwards Downward
>0The heating power supplied during thetime of the event is greater than thereference power, i.e. heat is stored.
Unlikely
=0The heating power supplied during theevent is equal to the reference power,ie no available storage capacity
The heating power supplied during theevent is equal to the reference power, ieno available storage capacity
<0 UnlikelyThe heating power supplied during theevent was lower than the reference, iethe heat demand was lower
1Equation,dttQtQCADRl
0REFADRADR

10
Equation 2 was proposed by Reynders and was designed to evaluate only upward
events. However, in our experiment, we are performing both events, upward and
downwards. In order to obtain comparables values of efficiencies in both cases, the
Equation 3 is proposed.
The integral in the denominator is equal to the available storage capacity (CADR), shown
as the dark grey area in Figure 2. The numerator of the equation represents the
rebound effect (RE). For upward events, it corresponds the heat stored during the ADR
event that is not recovered after a long period; for downward events, RE represents the
saved energy during the ADR event that is needed after a long period.
Table 6 shows an analysis of the possible values of the indicator.
Table 6 Analysis of the possible values of the energy efficiency
nADR Upwards / Downward
>1 The heat consumption, at the projection horizon, when the ADR event is performed, is lower than the reference scenario (saving heat)
=1 The consumption of heat, in the projection horizon, when the ADR event is performed, is the same as the reference scenario.
<1 The heat consumption, at the projection horizon, when the ADR event is performed, is greater than the reference scenario.
3Equation,
dttQtQ
dttQtQ
1ADRl
0REFADR
hor
0REFADR
ADR
2Equation,
dttQtQ
dttQtQ
1ADRl
0REFADR
hor
0REFADR
ADR

11
3.4.3 Thermal Comfort index:
This index is defined as, the number of times that the air temperature of the dwelling is
outside the comfort range; according to category II of the recommended indoor
environment in (UNE-EN-15251)[22]. It is measured by the following equation and
expressed as a percentage.
hor
t
hor
tt
OUT
t*p
OUT*p
Pmin,cimax,cit
max,cimin,ct
TTTT;0OUT
TTT;1OUT
; Equation 4
POUT: Percentage outside of range
pt: occupation:
Ti: Indoor temperature
Tc,min: Minimum comfort temperature
Tc,max: Maximum comfort temperature
3.4.4 Electricity consumption
The difference in electrical consumption is determined as the integral of the difference
between the electric power of the event ADR (EADR) and the electric power of the
reference scenario (EREF), for the whole projection horizon. It is expressed in kWh.
hor
0REFADR dttEtEDEC , Equation (5)
3.4.5 Electricity cost.
The difference in electricity cost has been calculated using a variable energy price
(Voluntary Price for the Small Consumer, PVPC, for its acronym in Spanish) (€/kWh).
The PVPC are hourly values and changes according to the energy market.[23]
hor
0REFADR dt*tPVPC*tEtEEC , Equation (6)

12
4. Results and discussion
In all cases, the thermal comfort index POUT was 0%, i.e. the thermal comfort was never
jeopardized.
4.1 Cases “+1D/2H” and “-1D/2H”
A complete analysis of the cases “+1D/2H” and “-1D/2H” is developed in the following
section.
4.1.1 Upward ADR event
The results of an upward scenario are shown, where the temperature setpoint has
increase 1ºC for two hours. The event "3" (figure 3) is used as an example to explain
the results of the indicators over a 24-hour horizon. Figure 3 represents the set point of
the reference scenario (REF SET POINT) and the setpoint of the ADR event (EVENT
SET POINT); the air temperature for the reference scenario and for the ADR event
(REF TEMP, EVENT 03 TEMP respectively); and the heat power of both scenarios
(REF HEAT POWER, EVENT 03 HEAT POWER).
Figure 3: Representation of the temperature set point, the air temperature and the heating power by the reference scenario and event "03"
In the reference scenario is possible to observe how the heating power is switch on. It
is occurs all time when the setpoint temperature is higher (occupied day time), and in
few smaller intervals when the setpoint is lower (night and non-occupied). The air
temperature never is outside the comfort range.
The ADR event starts with the setpoint change from 20.5 ° C to 21.5 ° C at 03:03
hours, and maintains this value for 2 hours. If the ADR scenario is compared with the
0
5
10
15
20
25
18.018.519.019.520.020.521.021.522.022.523.0
3:03
3:48
4:33
5:18
6:03
6:48
7:33
8:18
9:03
9:48
10:3
311
:18
12:0
312
:48
13:3
314
:18
15:0
315
:48
16:3
317
:18
18:0
318
:48
19:3
320
:18
21:0
321
:48
22:3
323
:18
0:03
0:48
1:33
2:18
POTE
NCI
A kW
)
TEM
PERA
TURA
(°C)
TIEMPO (h)
EVENTO 03
REF TEMP SET POINT (°C) EVENT 03 SET POINT (°C) REF TEMP (°C)
EVENT 03 TEMP (°C) REF HEAT POWER (kW) EVENT 03 HEAT POWER (kW)
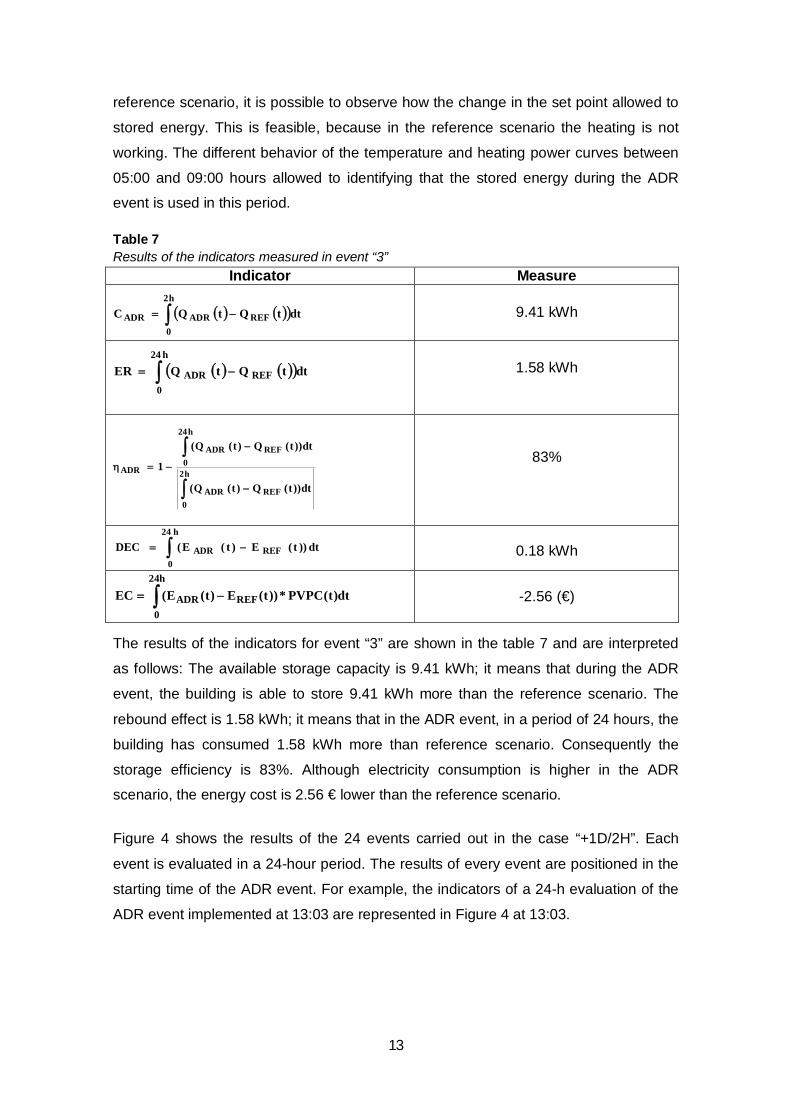
13
reference scenario, it is possible to observe how the change in the set point allowed to
stored energy. This is feasible, because in the reference scenario the heating is not
working. The different behavior of the temperature and heating power curves between
05:00 and 09:00 hours allowed to identifying that the stored energy during the ADR
event is used in this period.
Table 7 Results of the indicators measured in event “3”
Indicator Measure
9.41 kWh
1.58 kWh
83%
h24
0REFADR dt))t(E)t(E(DEC
0.18 kWh
h24
0REFADR dt)t(PVPC*))t(E)t(E(EC
-2.56 (€)
The results of the indicators for event “3” are shown in the table 7 and are interpreted
as follows: The available storage capacity is 9.41 kWh; it means that during the ADR
event, the building is able to store 9.41 kWh more than the reference scenario. The
rebound effect is 1.58 kWh; it means that in the ADR event, in a period of 24 hours, the
building has consumed 1.58 kWh more than reference scenario. Consequently the
storage efficiency is 83%. Although electricity consumption is higher in the ADR
scenario, the energy cost is 2.56 € lower than the reference scenario.
Figure 4 shows the results of the 24 events carried out in the case “+1D/2H”. Each
event is evaluated in a 24-hour period. The results of every event are positioned in the
starting time of the ADR event. For example, the indicators of a 24-h evaluation of the
ADR event implemented at 13:03 are represented in Figure 4 at 13:03.
h2
0REFADRADR dttQtQC
h2
0REFADR
h24
0REFADR
ADR
dt))t(Q)t(Q(
dt))t(Q)t(Q(
1
h24
0REFADR dttQtQER

14
Figure 4: Representation of the indicators of capacity and efficiency of storage, electricity cost and energy consumption by the 24 ADR events of the case "+ 1D / 2H"
In Figure 4 is possible to identify that the building has available storage capacity at the
night and non-occupied periods. These periods correspond to the lowest setpoint. The
ADR events performed at 06:03 and 19:03 hours do not have storage capacity, i.e. the
heating power in the events is equal to the reference. The ADR events that present a
better efficiency and greater cost savings correspond to those made between 00:03
and 05:03. The others ADR events provide equal or higher energy cost. The energy
consumption in the ADR events is equal or higher than the reference scenario. The
ADR event done at 03:03 hours show higher storage capacity (CADR = 9.41 kWh) and
cost savings (2.56 €) with an efficiency of 83%.
4.1.2 Downward ADR event
The results of a downward scenario is shown, where the temperature setpoint has
decreased 1 ºC for two hours. The event "19" (figure 5) is used as an example to
explain the results of the indicators over a 24-hour horizon.
The reference scenario is the same as described in section 4.1.1. The figure 5 shows
that the event starts at 19:03 hours with the change setpoint from 21.5 ° C to 20.5 ° C,
and maintaining this value for 2 hours. This change of setpoint allows switch off the
heating power and move the load to the next hours (21:00 to 23:00). After the 23:00
hours the behavior between both scenarios is similar.
76%
87% 85% 83% 84%88%
76%
63%
75%67%
72% 73%69% 71% 75% 73%
64%59%
94%
77% 79% 80%
0%
25%
50%
75%
100%
-4
-2
0
2
4
6
8
10
12
0:03
1:03
2:03
3:03
4:03
5:03
6:03
7:03
8:03
9:03
10:0
3
11:0
3
12:0
3
13:0
3
14:0
3
15:0
3
16:0
3
17:0
3
18:0
3
19:0
3
20:0
3
21:0
3
22:0
3
23:0
3
ƞAD
R %
ENER
GY
(kW
h) A
ND
CO
ST (
€)CADR (kWh) RE (kWh) ELECTRICITY COST ( EC (€)) DCE-24H (kWh) ƞADR %

15
Figure 5: Representation of the temperature set point, the air temperature and the heating power by the reference scenario and event "05"
Table 8 Results of the indicators measured in event “19”
Indicator Measure
-7.82 kWh
-1.62 kWh
121%
h24
0REFADR dt)EE(DEC
-0.60 kWh
h24
0REFADR dt*PVPC*)EE(EC
-5.83 (€)
The results of the indicators for event “19” are shown in the table 8 and are interpreted
as follows: The available storage capacity is -7.82 kWh; it means that during the ADR
event, the building is able to save 7.41 kWh more than the reference scenario. The
rebound effect is -1.62 kWh; it means that in the ADR event, in a period of 24 hours,
the building has consumed 1.62 kWh less than reference scenario. Consequently the
-5
0
5
10
15
20
25
30
17.518.018.519.019.520.020.521.021.522.022.5
19:0
3
20:0
3
21:0
3
22:0
3
23:0
3
0:03
1:03
2:03
3:03
4:03
5:03
6:03
7:03
8:03
9:03
10:0
3
11:0
3
12:0
3
13:0
3
14:0
3
15:0
3
16:0
3
17:0
3
18:0
3
POTE
NCI
A (K
W)
TEM
PERA
TURA
(°C)
TIEMPO (H)
EVENTO 19
REF TEMP SET POINT (°C) EVENT 19 SET POINT (°C) REF TEMP (°C)
EVENT 19 TEMP (°C) REF HEAT POWER (kW) EVENT 19 HEAT POWER (kW)
h2
0REFADRADR dt)QQ(C
h2
0REFADR
h24
0REFADR
ADR
dt)QQ(
dt)QQ(
1
h24
0REFADR dt)QQ(ER

16
storage efficiency is 121%. The electricity consumption is 0.68 kWh lowest in the ADR
event, and the energy cost is 5.83 € lower than the reference scenario.
Figure 6 shows the results of the 24 events carried out in the case “-1D/2H”. Each
event is evaluated in a 24-hour period. The results of every event are positioned in the
starting time of the ADR event.
Figure 6: Representation of the indicators of capacity storage, efficiency storage, electricity cost, and energy consumption by the 24 ADR events of the case "- 1D/2H"
In Figure 6 it is possible to identify that the building has energy flexibility during the
daily occupied hours or in the periods near them. It is feasible because the temperature
set point is higher during these events. The building doesn’t have energy flexibility if the
ADR events are performed when the temperature set point is lower. The events carried
out in the morning have the highest availability storage capacity and the highest
efficiency; however their costs are higher than reference scenario. It is because, the
load is moved to hours where the energy price is higher. The ADR events performed in
the afternoon are the ones with the highest saving costs. The energy consumption in
the ADR events is equal or lower than the reference scenario. The ADR event done at
19:03 hours has the higher storage capacity (CADR = -7.82 kWh) and cost savings (5.83
€) with an efficiency of 121%.
4.1.3 Comparison of upward and downward
Figure 7 shows the available capacity storage and efficiency storage, and figure 8
shows electricity cost for upwards and downwards events.
The hours with high storage capacity in the upward events are the ones with lower
storage capacity in the downward events, and vice versa. The downwards events have
45%
130%137%142%136%
57%
95%
119%121%123%
54%43%
0%
25%
50%
75%
100%
125%
150%
-10
-8
-6
-4
-2
0
2
4
0:03
1:03
2:03
3:03
4:03
5:03
6:03
7:03
8:03
9:03
10:0
3
11:0
3
12:0
3
13:0
3
14:0
3
15:0
3
16:0
3
17:0
3
18:0
3
19:0
3
20:0
3
21:0
3
22:0
3
23:0
3
nAD
R(%
)
ENER
GY
(kW
h) A
ND
CO
ST (
€)
CADR (kWh) RE (kWh) ELECTRICITY COST ( EC (€)) DCE-24H (kWh) nADR %

17
higher saving costs than the upwards events. The hours between 00:03 and 05:03 are
favorable for energy storage, and the hours between 17:03 and 20:03 are favorable to
reduce energy consumption.
Figure 7: Representation of the indicators of capacity storage and efficiency storage for the 24 ADR events of the cases "+1D/2H" and "- 1D/2H"
Figure 8: Representation of electricity cost for the ADR events of the cases "+1D/2H" and "-1D/2H"
4.2 Effect of temperature variation
In this section the behavior of the energy flexibility is analyzed for the setpoint variation
of 1 and 2 °C. The analyzed cases are: +1D/2H, -1D/2H, +2D/2H, and -2D/2H. The
results of these cases are shows in the figure 9 and 10.
0%10%20%30%40%50%60%70%80%90%100%110%120%130%140%150%160%
-14-12-10
-8-6-4-202468
1012141618
0:03
1:03
2:03
3:03
4:03
5:03
6:03
7:03
8:03
9:03
10:0
3
11:0
3
12:0
3
13:0
3
14:0
3
15:0
3
16:0
3
17:0
3
18:0
3
19:0
3
20:0
3
21:0
3
22:0
3
23:0
3
ƞAD
R (%
)
ENER
GY
(kW
h)
TIME (h)
CADR up CADR down nADR down nADR up
-6
-4
-2
0
2
4
6
0:03
1:03
2:03
3:03
4:03
5:03
6:03
7:03
8:03
9:03
10:0
3
11:0
3
12:0
3
13:0
3
14:0
3
15:0
3
16:0
3
17:0
3
18:0
3
19:0
3
20:0
3
21:0
3
22:0
3
23:0
3
COST
(€)
TIME (h)
COST up COST down

18
In the upward events, while the temperature increases: the storage capacity increases,
the efficiency is the same or decreases, and there are no significant changes in the
energy costs.
Figure 9: Representation of the indicators storage capacity and storage efficiency, for the cases “+1D/2H”, “-1D/2H”, “+2D/2H”, and “-2D/2H”
Figure 10: Representation of the electricity cost for the cases “+1D/2H”, “-1D/2H”, “+2D/2H”, and “-2D/2H”.
In downwards events, while temperature increases: storage capacity, efficiency, and
cost have very similar results; except at the event performed at 18:03. At this time, if
the temperature is decreased by 2 ° C, the energy flexibility and saving costs are
higher.
The option of change of the temperature setpoint in 2 ° C is the one that presents better results of energetic flexibility, for both upwards and downwards events.
0%20%40%60%80%100%120%140%160%
-12-10
-8-6-4-202468
1012
0:03
1:03
2:03
3:03
4:03
5:03
6:03
7:03
8:03
9:03
10:0
3
11:0
3
12:0
3
13:0
3
14:0
3
15:0
3
16:0
3
17:0
3
18:0
3
19:0
3
20:0
3
21:0
3
22:0
3
23:0
3
ƞAD
R (%
)
ENER
GY
(kW
h)
+1D/2H CADR +2D/2H CADR -1D/2H CADR -2D/2H CADR
+1D/2H nADR +2D/2H nADR -1D/2H nADR -2D/2H nADR
-7-6-5-4-3-2-10123456
0:03
1:03
2:03
3:03
4:03
5:03
6:03
7:03
8:03
9:03
10:0
3
11:0
3
12:0
3
13:0
3
14:0
3
15:0
3
16:0
3
17:0
3
18:0
3
19:0
3
20:0
3
21:0
3
22:0
3
23:0
3
COST
(€)
TIME (h)
+1D/2H EC +2D/2H EC -1D/2H EC -2D/2H EC
19
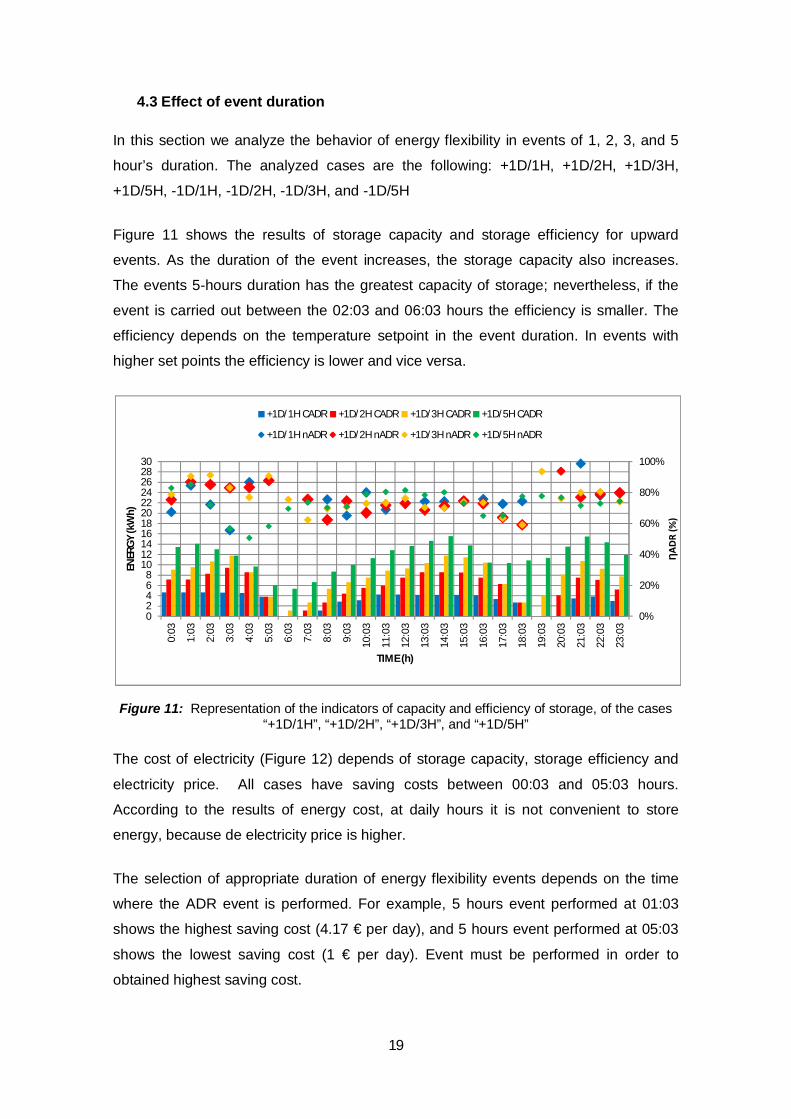
4.3 Effect of event duration
In this section we analyze the behavior of energy flexibility in events of 1, 2, 3, and 5
hour’s duration. The analyzed cases are the following: +1D/1H, +1D/2H, +1D/3H,
+1D/5H, -1D/1H, -1D/2H, -1D/3H, and -1D/5H
Figure 11 shows the results of storage capacity and storage efficiency for upward
events. As the duration of the event increases, the storage capacity also increases.
The events 5-hours duration has the greatest capacity of storage; nevertheless, if the
event is carried out between the 02:03 and 06:03 hours the efficiency is smaller. The
efficiency depends on the temperature setpoint in the event duration. In events with
higher set points the efficiency is lower and vice versa.
Figure 11: Representation of the indicators of capacity and efficiency of storage, of the cases “+1D/1H”, “+1D/2H”, “+1D/3H”, and “+1D/5H”
The cost of electricity (Figure 12) depends of storage capacity, storage efficiency and
electricity price. All cases have saving costs between 00:03 and 05:03 hours.
According to the results of energy cost, at daily hours it is not convenient to store
energy, because de electricity price is higher.
The selection of appropriate duration of energy flexibility events depends on the time
where the ADR event is performed. For example, 5 hours event performed at 01:03
shows the highest saving cost (4.17 € per day), and 5 hours event performed at 05:03
shows the lowest saving cost (1 € per day). Event must be performed in order to
obtained highest saving cost.
0%
20%
40%
60%
80%
100%
02468
1012141618202224262830
0:03
1:03
2:03
3:03
4:03
5:03
6:03
7:03
8:03
9:03
10:0
3
11:0
3
12:0
3
13:0
3
14:0
3
15:0
3
16:0
3
17:0
3
18:0
3
19:0
3
20:0
3
21:0
3
22:0
3
23:0
3
ȠAD
R (%
)
ENER
GY
(kW
h)
TIME (h)
+1D/1H CADR +1D/2H CADR +1D/3H CADR +1D/5H CADR
+1D/1H nADR +1D/2H nADR +1D/3H nADR +1D/5H nADR

20
Figure 12: Representation of electricity cost for the cases “+1D/1H”, “+1D/2H”, “+1D/3H”, and “+1D/5H”
Figure 13 shows the results of storage capacity and storage efficiency for downward
events.
Figure 13: Representation of the indicators of capacity and efficiency of storage, of the cases “-1D/1H”, “-1D/2H”, “-1D/3H”, and “-1D/5H”
As happens in upwards events, in downwards events, increasing event duration
increases storage capacity. The efficiency varies widely; it is because, the duration of
the ADR event includes zones with different temperature set points. Although the
events performed between 1:03 and 8:03 have efficiency higher than 100%, their cost
is also higher than the reference scenario; it is because, the load is shifted to hours
where the energy price is higher. Generally the longest events have the highest saving
-6
-4
-2
0
2
4
6
8
10
0:03
1:03
2:03
3:03
4:03
5:03
6:03
7:03
8:03
9:03
10:0
3
11:0
3
12:0
3
13:0
3
14:0
3
15:0
3
16:0
3
17:0
3
18:0
3
19:0
3
20:0
3
21:0
3
22:0
3
23:0
3
COST
(€)
TIME (h)
+1D/1H EC +1D/2H EC +1D/3H EC +1D/5H EC
0%20%40%60%80%100%120%140%160%
-15-12
-9-6-30369
0:03
1:03
2:03
3:03
4:03
5:03
6:03
7:03
8:03
9:03
10:0
3
11:0
3
12:0
3
13:0
3
14:0
3
15:0
3
16:0
3
17:0
3
18:0
3
19:0
3
20:0
3
21:0
3
22:0
3
23:0
3
ȠAD
R (%
)
ENER
GY
(kW
h)
TIME (h)
-1D/1H CADR -1D/2H CADR -1D/3H CADR -1D/5H CADR
-1D/1H nADR -1D/2H nADR -1D/3H nADR -1D/5H nADR

21
costs, as shown in figure 14. For example, 5 hours event performed at 19:03 shows the
highest saving cost (-7.29 € per day).
Figure 14: Representation of the electricity cost indicator for the cases “-1D/1H”, “-1D/2H”, “-1D/3H”, and “-1D/5H”
-10
-8
-6
-4
-2
0
2
4
6
0:03
1:03
2:03
3:03
4:03
5:03
6:03
7:03
8:03
9:03
10:0
3
11:0
3
12:0
3
13:0
3
14:0
3
15:0
3
16:0
3
17:0
3
18:0
3
19:0
3
20:0
3
21:0
3
22:0
3
23:0
3
COST
(€)
TIME (h)
-1D/1H EC -1D/2H EC -1D/3H EC -1D/5H EC

22
5. Conclusions
The study analyzes the behavior of the energy flexibility applied in a residential nZEB
located in a Mediterranean climate. The energy flexibility is analyzed implementing
different modulations of the setpoint temperature, so called ADR events (Active
Demand Response). The ADR events are performed in a day-night thermostat control
in different configurations: 1 or 2ºC of temperature modulation (increase or decrease),
and 1, 2, 3 and 5 hours of duration.
According the results, it is possible to identify some common patterns between all the
cases:
There is an opposite behavior of energy flexibility between upward and
downward events; i.e. if in a certain upward event the storage capacity is high;
in the same moment, the downward event will provide a lower storage capacity,
and vice versa.
In upward events performed in periods without occupation or at night time, the
storage capacity increases; it is because the event includes the lowest
temperature setpoint. On the contrary, if the event includes the highest setpoint,
the storage capacity decreases significantly. The events with greater saving
costs are those carried out between 00:03 and 05:03 where the energy price is
lower.
Downward events present the greatest energy flexibility in the occupied day
periods, where the temperature setpoint is higher. The building does not have
energy flexibility in most of the night and of non-occupied periods. The result of
storage capacity and storage efficiency are better in the ADR events performed
in the morning than the ones performed in the afternoon; however the electricity
cost is higher. This is because in the morning hours the load is moved to hours
with higher energy prices, and in the afternoon, the load is moved to lower price
hours (night).
Events with temperature variations do not present significant differences in the
energy flexibility and the storage capacity and storage efficiency have similar
behaviors in both cases. Probably, the reason is that the system needs more
than 2 hours to reflect the effect of 2ºC of modulation, in comparison with 1ºC.
Comparing the cases with different duration, in general, the longest duration
events (5 hours) are the ones with the greatest storage capacity; however not
always the longer events are the best option in terms of storage efficiency and

23
energy consumption. A balance between ADR duration, the capacity efficiency,
energy consumption and the energy cost must be found.
In +1D/2H case, the event performed at 03:03 hours has the maximum
available storage capacity (9.41 kWh) and economic savings (2.56 € per day)
In -1D/2H case, the event performed at 19:03 hours has the maximum available
storage capacity (-7.82 kWh) and economic savings (5.83 € per day)
The 5-hours event performed at 19:03 provides the maximum saving costs
(7.29 € per day).
The comfort index demonstrates that all the ADR events have provided comfort
conditions and the operative temperature of the occupied hours are inside the
comfort range.
In general, the energy flexibility events have a rebound effect and the energy
consumption is greater than the reference scenario. However, there is not a
direct relationship between the energy consumption and the energy cost,
because the energy price varies with time.
All events that offer energy flexibility do not necessary have economic saving in
the electricity cost, due to the energy price variation.
The selection of the best flexibility strategy depends on the time at which the ADR
event is took place. This type of analysis helps to increase the knowledge of energy
flexibility, in order to be able to define an appropriate strategy for shifting the heating
load. Further research is needed in this topic, as for example to analyze the behavior of
energy flexibility combining different ADR event in the same day and how to quantify
the flexibility in those cases; or to evaluate the energy flexibility in summer applying the
ADR event to the cooling system.

24
6. References
[1] G. Reynders, J. Diriken, and D. Saelens, “A generic quantification method for the
active demand response potential of structural storage in buildings,” 14th Int.
Conf. Int. Build. Perform. Simul. Assoc., no. March 2016, 2015.
[2] EOROPEAN UNION, “Consolidated versions of the Treaty on European Union
and the Treaty on the Functioning of the European Union,” vol. 59. Official
Journal of the European Union, p. 132,134, 2016.
[3] European Parliament / Council of the European Union, “Directive 2009/28/EC of
the European Parliament and of the Council of 23 april 2009 on the promotion of
the use of energy from renewable sources and amending and subsequently
repealing Directives 2001/77/EC and 2003/30/EC (Text with EEA relevance).”
Official JournaloftheEuropeanUnion, pp. 16–62, 2009.
[4] European Parliament / Council of the European Union, “Directive 2009/29/EC of
the European Parliament and of the Council of 23 april 2009 amending Directive
2003/87/EC so as to improve and extend the greenhouse gas emission
allowance trading scheme of the community (Text with EEA relevance).” Official
JournaloftheEuropeanUnion, p. 25, 2009.
[5] European Parliament / Council of the European Union, “Decision No
406/2009/EC of the European Parliament and of the Council of 23 April 2009 on
the effort of Member States to reduce their greenhouse gas emissions to meet
the Community’s greenhouse gas emission reduction commitments up to 2020.”
Official Journal of the European Union, pp. 136–148, 2012.
[6] European Commission, “COMMUNICATION FROM THE COMMISSION TO
THE EUROPEAN PARLIAMENT AND THE COUNCIL The Paris Protocol – A
blueprint for tackling global climate change beyond 2020,” European Union
Package, vol. 17. Official Journal of the European Union, Brussels, pp. 1–17,
2015.
[7] European Parliament / Council of the European Union, “Directive 2010/31/EU of
the European Parliament and of the Council of 19 May 2010 on the energy
performance of buildings (recast),” Official Journal of the European Union.
Official Journal of the European Union, pp. 13–35, 2010.
[8] European Commission., “Energy Performance of Buildings Directive (EPBD)
Compliance Study,” Energy Performance of Buildings, no. December. Brussels,

25
2015.
[9] R. D´Angiolella, M. De Groote, and M. Fabbri, “Buildings as micro energy hubs,”
REHVA J., no. May, pp. 52–55, 2016.
[10] T. Péan, J. Ortiz, and J. Salom, “Impact of Demand-Side Management on
Thermal Comfort and Energy Costs in a Residential nZEB,” Buildings, vol. 7, no.
2, p. 37, 2017.
[11] G. Reynders, T. Nuytten, and D. Saelens, “Potential of structural thermal mass
for demand-side management in dwellings,” Build. Environ., vol. 64, pp. 187–
199, 2013.
[12] S. Ø. Jensen, “IEA EBC Annex 67 Energy Flexible Buildings,” IEA EBC, 2014.
[13] R. De Coninck and L. Helsen, “Bottom-Up Quantification of the Flexibility
Potential of Buildings,” 13th Conf. Int. Build. Perform. Simul. Assoc. Chambéry,
Fr. August 26-28, pp. 3250–3258, 2013.
[14] L. A. Hurtado, J. D. Rhodes, P. H. Nguyen, I. G. Kamphuis, and M. E. Webber,
“Quantifying demand flexibility based on structural thermal storage and comfort
management of non-residential buildings: A comparison between hot and cold
climate zones,” Appl. Energy, vol. 195, pp. 1047–1054, 2017.
[15] G. Reynders, J. Diriken, and D. Saelens, “Generic characterization method for
energy flexibility : application to structural thermal storage in Belgian residential
buildings (submitted),” Appl. Energy, 2017.
[16] J. E. Braun, “Reducing Energy Costs and Peak Electrical Demand through
Optimal Control of Building Thermal Storage,” J. Chem. Inf. Model., vol. 53, p.
160, 1989.
[17] G. Reynders, “Quantifying the impact of building design on the potential of
structural strorage for active demand response in residential buildings,” KU
Leuven - Faculty of Engineering Scince, 2015.
[18] Institut Català d’Energia, “Rehabilitació energètica d’edificis, Col•lecció Quadern
Pràctic No 10.” Generalitat de Catalunya, Barcelona, 2016.
[19] ITeC, “Norma Reglamentaria de Edificación sobre Almacenamiento Térmico
Nre-At-87.” ITec, Spain, 1987.
[20] J. Ortiz, A. Fonseca i Casas, J. Salom, N. Garrido Soriano, and P. Fonseca i

26
Casas, “Cost-effective analysis for selecting energy efficiency measures for
refurbishment of residential buildings in Catalonia,” Energy Build., vol. 128, pp.
442–457, 2016.
[21] J. Ortiz, A. Fonseca, J. Salom, N. Garrido, P. Fonseca, and V. Russo, “Comfort
and economic criteria for selecting passive measures for the energy
refurbishment of residential buildings in Catalonia,” Energy Build., vol. 110, pp.
195–210, 2016.
[22] Comité técnico AEN/CTN 100 Climatización, “UNE-EN 15251, Parámetros del
ambiente interior a considerar para el diseño y la evaluación de la eficiencia
energética de edificios incluyendo la calidad del aire interior, condiciones
térmicas, iluminación y ruido.” AENOR, Madrid, España, p. 48, 2008.
[23] “RED ELÉCTRICA DE ESPAÑA / ESIOS.” [Online]. Available:
https://www.esios.ree.es/es. [Accessed: 18-Jul-2017].

Abstract.
The de-carbonization of energy and the higher penetration of renewable energies in the
energy mix lead to the search for new alternatives in the generation and distribution of
energy. One of these alternatives is the demand managed; through the energy
flexibility that residential nZEB can offer. The nZEBs are a reality in the EU, and it is
believed that in the not too distant future they will play a very important role in the
stability of the electrical system; becoming small centers of energy, capable of
generating and storing energy. In this study an analysis of the energy flexibility of a
residential nZEB was carried out, by controlling a heating load. The variables taken into
consideration for the analysis were the setpoint temperature and the event duration. In
total, 240 active demand response modulations (ADRs) were performed in 10 different
scenarios. The evaluation of the energy flexibility was done through the indicators of
available storage capacity and storage efficiency proposed by Reynders.
The comfort index demonstrates that all the ADR events have provided comfort
conditions and the operative temperature of the occupied hours are inside the comfort
range.
In upward events performed in periods without occupation or at night time, the storage
capacity increases; it is because the event includes the lowest temperature setpoint.
On the contrary, if the event includes the highest setpoint, the storage capacity
decreases significantly.
Downward events present the greatest energy flexibility in the occupied day periods,
where the temperature setpoint is higher. The building does not have energy flexibility
in most of the night and of non-occupied periods
In general, the energy flexibility events have a rebound effect and the energy
consumption is greater than the reference scenario. However, there is not a direct
relationship between the energy consumption and the energy cost, because the energy
price varies with time. All events that offer energy flexibility do not necessary have
economic saving in the electricity cost, due to the energy price variation
Resumen.
La des-carbonización de energía y la mayor penetración de las energías renovables en
el mix-energético, conlleva a buscar nuevas alternativas en la generación

almacenamiento y distribución de energía. Una de estas alternativas es la gestión de
la demanda, a través de la flexibilidad energética que pueden ofrecer los nZEB
residenciales. Los nZEBs son una realidad en la UE, y se cree que en un futuro no
muy lejano desempeñarán un rol muy importante en la estabilidad del sistema
eléctrico; convirtiéndose en pequeños centros de energía, capaces de generar y
almacenar energía. En este estudio se realizó un análisis de la flexibilidad energética
de un nZEB residencial, mediante el control de una carga de calefacción. Las variables
tomadas en consideración para el análisis fueron la temperatura de consigna y el
tiempo de duración de los eventos. En total se realizaron 240 modulaciones de
respuesta a la demanda activa (ADR por sus siglas en inglés) en 10 diferentes
escenarios. La evaluación de la flexibilidad energética se la realizó mediante los
indicadores de capacidad de almacenamiento disponible y eficiencia de
almacenamiento propuestos por Reynders.
El índice de confort demuestra que todos los eventos ADR han proporcionado
condiciones de confort; y que la temperatura operativa de las horas de ocupación está
dentro del rango de confort.
En los eventos donde el ajuste de temperatura es hacia arriba, y que se llevaron a
cabo en periodos de ocupación de noche o de no ocupación tienen mayor capacidad
de almacenamiento; esto es porque el evento se realiza con una menor consigna de
temperatura. En los eventos que incluyen una mayor consigna de temperatura la
capacidad de almacenamiento disminuye significativamente.
En los eventos donde el ajuste de temperatura es hacia abajo, presentan mayor
flexibilidad energética en periodos de ocupación de día, que corresponden a una
mayor consigna de temperatura. El edificio no ofrece flexibilidad energética en la
mayoría de los periodos de ocupación de noche y de no ocupación.
En general todos los eventos presentaron un efecto rebote y el consumo de energía
fue mayor que el escenario de referencia; sin embargo no hay una relación directa
entre el consumo de energía y el costo de la energía, debido a que el precio de la
energía está en función del tiempo. No todos los eventos que ofrecen flexibilidad
energética tienen ahorro en el costo de la electricidad, debido a la variación del precio
de la energía.