evaluation of decellularization procedures for porcine
TRANSCRIPT

Evaluation of Decellularization Procedures for Porcine Arteries
A Senior Project
presented to
the Faculty of the Biomedical Engineering Department
California Polytechnic State University, San Luis Obispo
By
Charles Clapp
April, 2012

ii
Abstract
Coronary artery disease has become the leading cause of death in the United States, with over
425,000 deaths in 2006. Stenting has evolved into the preferred preventative technique for
myocardial infarction by opening up an occluded artery, due to its low invasiveness compared to
the alternative of coronary artery bypass grafting. Bare metal stents have been improved by
coating with anti-proliferative drugs to advance their effects, but even drug eluting stents still
have a risk of restenosis, thrombus formation, and necessary revascularization. Continual
advancement in stent design necessitates faster, effective pre-clinical evaluation techniques.
Kristen Cardinal, Ph.D., developed the blood vessel mimic for in-vitro evaluation of coronary
stents. The blood vessel mimic currently uses ePTFE as a tubular scaffolding for vessel
development, but this material falls short of the mechanical properties of the native vessel.
Aubrey Smith, M.S., developed a protocol for decellularizing porcine arteries. Decellularization
is the process of removing cells from a native tissue, leaving only the extracellular matrix
scaffold. The decellularized vessels could be a potential replacement for ePTFE in the blood
vessel mimic. The present study was done to replicate the protocol developed by Ms. Smith, and
evaluate if it produces repeatable results. Methods included decellularization of porcine arteries
by perfusion with sodium dodecyl sulfate solution, and evaluation using histology as well as
uniaxial tensile testing. Results from this study were similar to those found by Ms. Smith,
indicating that the protocol does produce repeatable decellularized arteries.

iii
Table of Contents 1. Introduction ................................................................................................................................. 1
2. Methods....................................................................................................................................... 8
2.1 Vessel Acquisition ................................................................................................................ 8
2.2 Decellularization ................................................................................................................... 8
2.2.1 Detergent Solution Preparation ...................................................................................... 8
2.2.2. Vessel Preparation ........................................................................................................ 9
2.2.3 Perfusion Loop set up .................................................................................................... 9
2.2.4 Perfusion Decellularization .......................................................................................... 10
2.3 Analysis............................................................................................................................... 11
2.3.1 Tensile Testing ............................................................................................................. 12
2.3.2 Statistical Analysis ....................................................................................................... 13
2.3.3 Histology ...................................................................................................................... 13
3. Results ....................................................................................................................................... 14
3.1 Tensile Testing .................................................................................................................... 14
3.2 Histological Characterization .............................................................................................. 18
4. Discussion ................................................................................................................................. 20
4.1 Tensile Testing .................................................................................................................... 20
4.2 Histology ............................................................................................................................. 23
4.3 Previous trials...................................................................................................................... 24
4.4 Limitations .......................................................................................................................... 25
4.5 Future Work ........................................................................................................................ 26

iv
5. Conclusions ............................................................................................................................... 27
6. Bibliography…………………………………………………………………………………. 28
7. Appendix ................................................................................................................................... 32
7.1 Appendix 1: Ms. Smith’s perfusion decellularization protocol .......................................... 32
7.2 Appendix 2: Perfusion decellularization protocol used in this experiment ........................ 35
7.3 Appendix 3: Tensile testing protocol .................................................................................. 38
7.4 Appendix 4: Revised tensile testing protocol ..................................................................... 41
7.5 Appendix 5: Tensile testing data analysis macro ................................................................ 44
7.6 Appendix 6: Histology protocol.......................................................................................... 52
7.7 Appendix 7: Decellularized and control data table ............................................................. 54

v
List of Tables
1. Tensile testing data summary.…………………………………………………….……..........16
2. Tensile testing data from literature…………….…………………………….………………..23
3. Clamped and unclamped measurement data…………………………………..……………....24

vi
List of Figures
1. Normal and atherosclerotic arteries………………………………………………...………….1
2. Coronary artery bypass grafting………………………………………………………..…….....3
3. Balloon angioplasty and stenting illustration.…………………………………..………………4
4. Blood vessel mimic system……………………………………………………..………………6
5. Conical reservoir and perfusion decellularization set up………...……………………………10
6. Thickness and width measurement diagram…………………………………………………11
7. Stress-strain graphs……………………………………………………………………………15
8. Critical yield strength box plot……………………………………………………………..…17
9. Young’s modulus box plot………………………………………………………………….…17
10. Histology……………………………………………………………………………………19
11. Critical yield strength comparison to Smith’s work………………………………………...21
12. Young’s modulus comparison to Smith’s work…………………………………………….22
13. Adapter for radial tensile testing for vessel scaffolds ……………………………………….27

1
1. Introduction
Atherosclerosis is defined as a focal thickening of the inner layer of the artery wall (1). It occurs
when lipids, macrophages, smooth muscle cells (SMCs) and other debris are deposited within the
intimal layer, resulting in plaque formation (1). These deposits reduce the luminal diameter and
inhibit blood flow through the affected artery (see figure 1). Hypertension, smoking, and obesity
increase the risk of atherosclerosis (2). Coronary artery disease (CAD) occurs when
atherosclerotic plaque builds up inside the coronary arteries (1). Decreased flow through
coronary arteries causes ischemic conditions in the heart, which can lead to hypoxia and
myocardial infarction. CAD is the leading cause of death worldwide, with over 425,000 deaths in
2006 and an estimated 785,000 heart attacks per year in the US alone (2).
Figure 1: Normal and atherosclerotic artery (3)

2
Atherosclerosis increases blood pressure, and CAD specifically increases the risk of myocardial
infarction. Infarction occurs when a blockage occurs in the coronary arteries, causing ischemia
and tissue necrosis of cardiac muscle. Myocyte remodeling occurs following infarction to
maintain cardiac output and replace lost contractile function, commonly known as ventricular
hypertrophy. Continual hypertrophy causes distension of cardiac muscle tissue and apoptosis of
cardiac myocytes, progressing into the loss of contractile function and eventually heart failure (4,
5). Treatment of CAD to prevent infarction includes lifestyle changes, coronary artery bypass
grafting (CABG), angioplasty, and stenting (6).
Lifestyle changes, such as reducing caloric intake, cessation of smoking, and regular exercise can
be used as preventative measures against CAD (6). Dieting can reduce cholesterol levels up to
15%, but often more lifestyle changes are necessary to minimize risk of myocardial infarction
(7). In many cases, lifestyle changes alone are not sufficient and drugs such as statins (example:
Lipitor) may be required to have substantial effect on cholesterol management (8). In addition to
controlling cholesterol, decreasing blood pressure in those with hypertension has shown to be
promising method for the prevention of heart disease. A diastolic blood pressure reduction of
only 5mmHg can reduce risk of CAD by 21%, which could be attained using drugs such as
ACE-inhibitors or beta-blockers (9).
CABG is invasive procedure which involves open heart surgery where the blood flow for the
coronary artery is redirected by stitching a vessel graft above and below the vessel occlusion to
restore normal blood flow to the heart (see figure 2). Often, the internal mammary artery is cut
and anastomosed below the occlusion, to restore blood flow downstream of the blockage (10,
11). However, an autologous graft vessel is not always available, especially in those severely
affected by atherosclerosis, necessitating the use of other vessels such as the radial artery or

3
greater saphenous vein (10). In the case in which these vessels are unavailable or unsuitable for
use, synthetic grafts such as ePTFE and Dacron have been used for bypass (10). Synthetic
vessels have had success as large diameter bypass grafts (>6mm), but are plagued by
thrombogenicity and weak mechanical properties, making them an inferior choice for small
diameter grafting necessary in CABG (12, 13).
Figure 2: Coronary artery bypass graft surgery diagram with vein graft and internal mammary
artery graft. Grafts stitched to restored blood flow below blockage in coronary artery (11).
A less invasive surgical approach to treat CAD is angioplasty. Here a small balloon is inserted
into the affected area with a catheter and inflated to crush fatty deposits against the vessel to
reopen the lumen (14). For this treatment to be applicable, the vessel must not be significantly
occluded, to ensure the catheter can be inserted into the problem area. Significant occlusion that

4
inhibits catheter insertion necessitates a CABG treatment. Unfortunately, in a typical balloon
angioplasty there is a 40% chance of restenosis in 6 months due mostly to elastic recoil of the
artery (15). Stents are commonly implanted to minimize elastic recoil in treated vessels. Bare
metal stents are metal wire tubes, made usually of stainless steel or nitinol that are implanted
during the angioplasty to and maintain an open lumen (15). Drug eluting stents are stents coated
with anti-proliferative drugs, such as Paclitaxel, to minimize the chance of fibrosis or clotting, as
well as to maintain an open lumen (14, 15). A comparison between the balloon angioplasty and
stent implantation can be seen in figure 3. Stent development is in high demand in biomedical
engineering because drug eluting stent implantation still presents a 14% chance of
revascularization, a necessary reopening of the artery (15).
Figure 3: Balloon angioplasty (left) and stent implantation (right) to reopen the lumen of an
occluded vessel (16).

5
Research into new stent materials and designs is ongoing to improve stent performance and
minimize restenosis. Before new stent designs can be approved for clinical trials, they are
subjected to a variety of preclinical tests. This testing ensures that the device demonstrates safety
and efficacy in models before being tested in a human. This necessitates the use of animal
models, but testing with animal models is expensive, and not conducive to high-throughput
studies. In California Polytechnic State University’s Tissue Engineering Lab Dr. Kristen
Cardinal has developed a tissue engineered vascular graft for use as a “blood vessel mimic”
(BVM) for the purpose of evaluating stents and other intravascular devices. The BVM provides
an in-vitro replica of a blood vessel, which allows for testing of intravascular devices without the
use of animal models (17). Thus the BVM can study the effectiveness of intravascular devices,
such as stents, minimizing the necessity of animal models (18).
Currently vascular grafts are made with either synthetic materials such as Dacron and expanded
polytetrafluoroethylene (ePTFE) or biologic materials, such as collagen or elastin (19). The
Cardinal lab utilizes ePTFE or a biodegradable poly (lactic-co-glycolic acid) (PLGA) material
for the scaffold. These materials are created in a tubular shape, to mimic the size and geometry
of a blood vessel, then placed into a biochamber where they are seeded with human endothelial
cells to create a human cell lining or interface. The BVM system uses a peristaltic pump to
simulate flow conditions with media for cell growth, and controls humidity, pH, and temperature
to provide the best environment for cell growth and blood vessel development (Figure 4) (17).
These materials, particularly ePTFE, mimic the vessel geometry and flow dynamic qualities of
the native vessel, however they fall short of important native qualities, such as tensile strength
and burst pressure (12, 13, 19). Their low compliance may be partially responsible to high rates

6
of thrombogenicity and lack of clinical success when being used as a small diameter graft such
as in CABG.
Figure 4: Solidworks model of the BVM system (Left) and actual set up (right) (20).
An alternative approach to tissue engineered vascular grafts exists in decellularized biomaterials.
The decellularization process involves removing cells from a native material, and can be done
using detergents, enzymatic digestion, or mechanical stimulation (19, 21). Decellularized
materials retain the structural proteins found in the native extracellular matrix, and can mimic the
native environment (19, 21). Removal of cellular antigens renders the decellularized tissue nearly
non-immunogenic, which allows the usage of allogenic or xenogenic material that otherwise
could not be used because of immune response (19).
As part of the Cardinal BVM lab, Aubrey Smith, M.S., developed a protocol for decellularizing
porcine vessels to create a more physiologically relevant scaffold for use in the BVM (20). This
process of creating a decellularized artery involves a perfusion decellularization set up with
mechanical agitation, and structural evaluation via tensile testing and histology analysis. After
showing that the decellularized vessel scaffold has mechanical properties similar to a native
blood vessel, it was concluded that the scaffold may be used as an alternative to the current
ePTFE vessel. However, it was not known whether Ms. Smith’s protocol would be repeatable.

7
Therefore the purpose of this work was to replicate the developed decellularization protocol, to
evaluate if it produced repeatable decellularized arteries and correlating mechanical properties.
This was done by repeating the decellularization procedure three times with seven total vessels
and evaluating the resulting scaffold via tensile testing and histology of both native and
decellularized vessels.

8
2. Methods
2.1 Vessel Acquisition
All vessels were obtained from Creston Valley meats. Pigs ranging from 2-6 months old were
sacrificed and vessels were acquired within one hour of death, and frozen within 3-4 hours of
excision. Vessels acquired ranged in diameter from 3-6mm in diameter, and a minimum length
of 5 cm. The main source of vessels came from arteries branching from the aorta;
brachiocephalic, carotid and subclavian. Veins acquired included subclavian, axillary or femoral,
as they were acquired within proximity of the heart.
To prepare vessels for decellularization, excess connective tissue was removed using scissors or
a razor blade. Care was taken to ensure vessels were not cut or sliced because this would
compromise mechanical properties. The vessels were sutured onto a luer-lock barb to maintain
an open lumen during freezing. Vessels were frozen in a -20°C freezer until use.
2.2 Decellularization
2.2.1 Detergent Solution Preparation
A Sodium dodecyl sulfate (SDS) detergent solution was perfused through the porcine vessel for
decellularization. This solution punctures and lyses cellular membranes for removal of cellular
material. Sodium Dodecyl Sulfate, an ionic detergent was prepared at 0.075% solution in Milli-Q
water. Milli-Q water was used to replace PBS in this experiment. Each decellularized vessel
required 75mLof detergent solution. Solutions were prepared with a stock 10% SDS solution.
Equations 1 and 2 described the dilutions necessary to product a 0.075% final working solution.

9
/ 0.10% SDS = 0.5625 mL SDS/75 mL solution
The final working solution was prepared with 0.5625 mL SDS and 74.4375 mL Milli-Q water
for each vessel being decellularized.
2.2.2. Vessel Preparation
Vessels were removed from the -20° C freezer and placed into 37°C water bath. When vessels
were malleable they were taken from the water bath and placed on a small cutting board. Vessels
ranged from 7-15cm, but were sectioned into 4-5 cm sections with a razor blade or scissors,
again taking care not to slice the vessel wall. One control was taken from each vessel, and the
remaining vessel length was cut into as many 4-5cm sections experimental sections as possible.
Smaller sections (~3cm) were taken if vessels originally were only 6-7 cm in length, to ensure
one control and one experimental section was obtained.
Each section was labeled with vessel number, date, either experimental or control, and histology
or tensile testing. From the control section, 1cm was taken for histology as control and was fixed
in 10% formalin. The remaining section was used as a tensile testing control. Control sections
were cut prior to decellularization, thus they were refrozen in the -20° C freezer until tensile
testing was performed. A total of seven vessels were used for controls. A total of 9 vessels were
used for decellularization in three rounds of decellularization. Experimental sections were
decellularized by perfusion with the SDS detergent solution.
2.2.3 Perfusion Loop set up
Vessels were decellularized according to protocol established by Aubrey Smith. The full version
of the decellularization protocol can be seen in Appendix 1 (20). In Dr. Kristen Cardinal’s lab,

10
perfusion fittings for 50mL conicals have been created for use in the BVM (figure 5A). The
perfusion fittings are connected with extra tubing to create a loop.
The thicker-walled pump tubing was oriented in the peristaltic pump so the detergent solution
perfused through the decellularized vessel. The vessel was attached with luer-lock fittings to the
underside of a fitted conical cap. The cap was placed on the conical, and perfusion started. An
additional 15-25mL of solution was added to fill the depleted reservoir once the solution filled
the tubing. A picture of the complete set up is shown in figure 5B.
Figure 5: Vessel inside 50mL conical for perfusion (A), and entire perfusion decellularization
set up (B), (20).
2.2.4 Perfusion Decellularization
Vessels were placed in a conical rack and on top of a shake table for mechanical agitation during
decellularization. The shake table was set to rotate at 30rpm, as specified by the protocol.
Perfusion was started using the 3-roller peristaltic pump, which was set to 20 rpm. Prior to
starting it was noted that the perfusion was oriented correctly and there were no leaks in the
A B

11
system. Vessels were perfused for 20 hours in this system. Vessels were washed with Milli-Q
water according to protocol. A total of 9 vessels underwent decellularization. Upon completion
of decellularization 1cm of each vessel was removed and fixed in 10% formalin for histology.
2.3 Analysis
Prior to tensile testing, frozen control vessels were defrosted in 37° water bath. Once malleable,
controls and decellularized vessels were cut longitudinally with scissors. The vessel was then
inspected for cuts or slices that may have occurred in the acquisition or preparation process, and
for bifurcations. Imperfections were cut out with scissors if they existed near the center of the
vessel, and left adequate length for tensile testing. Vessel width and thickness were measured
with calipers for later use in tensile strength calculations. Width measurements were taken
perpendicular to the longitudinal axis of the vessel, in the center and at each end of the sample.
Similarly, the thickness was measured at the middle and either end of the sample with calipers
oriented perpendicular to the longitudinal axis. An average of the thickness and width
measurements was recorded. A diagram of these measurements can be seen in figure 6. Initially
vessel thickness measurements were taken by clamping calipers down on the vessel. This method
was then replaced by an unclamped method, where the vessel thickness was measured by putting
minimal pressure on the vessel.
Figure 6: Measurement diagram for thickness and width measurements. Each measurement was
taken at each end of the sample (positions 1 and 3) and the middle (position 2) and averaged.
Width
Thickness
1 2 3

12
2.3.1 Tensile Testing
Tensile testing was done using an Instron In-Spec 2200 machine equipped with a 250N load cell
to determine the strength and stiffness of the decellularized scaffold. The critical yield strength is
the force at which the material begins to undergo plastic deformation. Elastic modulus is the
characterization of the stiffness of a material, and Young’s modulus specifically is the slope of
the stress-strain curve of the material between 20-50% of the critical yield.
To begin tensile testing, force was zeroed and vessels were clamped securely in the tensile
testing machine to prevent slippage. Vessels were pulled until taut, as determined by 0.3N force
and at this point a gage length was obtained. The tensile tester then pulled the vessel
continuously at 0.1mm per second until failure. Data was acquired using a PDA and saved as a
series of time, extension, and force points in Microsoft Excel. A full-length version of the
protocol can be found in Appendix 2 (20).
The recorded load is divided by the area (thickness*width) to find the stress (Equation 3). The
strain is the percentage increase in length of the vessel from the gage length measured (Equation
4). The stress strain graph is used to find the Young’s modulus using equation 5. A Macro was
created in Visual Basic for data analysis for tensile testing (See Appendix 4) (20). The Macro
inputs the data and asks for user input of gage length, width, and thickness and outputs a global
stress-strain graph, a linear strain graph, and the critical yield strength. The linear strain graph
highlights the strain that occurs between 20-50% of the Critical yield strength. The slope of this
graph was noted as the Young’s Modulus for the vessel.

13
Equation 3:
Equation 4:
Equation 5:
2.3.2 Statistical Analysis
Critical yield strength and Young’s modulus data was organized and evaluated using statistical
methods. A two-sample t-test was completed on the critical yield and Young’s modulus data to
evaluate the decellularized vessels compared to the control.
2.3.3 Histology
Histology was used to view the vessel structure on a microscopic level. Staining the vessel
highlighted specific components, making the structure easier to view and characterize compared
to a relatively colorless un-stained structure. Fixed vessels were processed and embedded in
paraffin wax with an open lumen allowing for cross sectional slices. Sections were taken at 7 µm
and placed on a glass slide for staining. A hematoxylin and eosin (H&E) stain was done to stain
for cytoplasmic and extracellular matrix proteins (eosin) and nuclear material (hematoxylin) for
analysis of decellularization. The full staining protocol can be found in Appendix 5. Upon
completion vessels were examined under a microscope and decellularization was verified. If any
nuclear material remained the vessel was denoted “not decellularized”.

14
3. Results
3.1 Tensile Testing
Tensile testing was used to determine critical yield strength and Young’s modulus for both
control and decellularized vessels. These measurements indicate the ultimate tensile strength
before failure and the stiffness of the vessel, respectively. The tensile testing data was exported
from the data analysis program as a series of time, extension, and load data points. A macro
generated by Aubrey Smith, M.S., was used to calculate, summarize, and graph the data, to
produce values for the critical yield and young’s modulus values for each vessel (20). The macro
also produced stress strain graphs and linear stress graphs. An example of these graphs can be
seen in figure 6.

15
Figure 7: Example Stress Strain Curve (Top) and Linear Stress Curve (bottom).
Seven control vessels and nine decellularized vessels were tensile tested in a total of three
decellularization runs. One decellularized vessel was removed from the group because there
were bifurcations present, as it is a change in micro-architecture and thus the mechanical
properties. Mechanical failure of the shake table at an unknown time period in one of the runs
(containing 4 vessels) caused incomplete decellularization in two vessels. The remaining two
vessels in this decellularization run were completely decellularized and thus included in the data.

16
These two vessels were removed from the bulk data because of presence of nuclear material as
determined by histology. This left the decellularized group with a sample size of n=6 and control
group with sample size of n=7. A summary of the tensile testing data is shown in table 1. The
data for individual vessels can be found in Appendix 6.
Table 1: Tensile Testing Data Summary
The critical yield strength of control vessels was 2.37±0.95 MPa compared to 1.42±0.43 MPa for
decellularized vessels. The data indicates that the critical yield strength of native vessels was
higher than the decellularized vessels and a two-sample t-test revealed no significant difference
between the two groups at a p-level of 0.053 (Figure 7). The Young’s modulus for control and
decellularized vessels was 3.17±3.11 MPa and 2.16±1.83 MPa respectively. Additionally, no
significant difference was found between decellularized and control vessels at a p-level of 0.54,
although showing a trend of increased stiffness in control vessels (figure 8).
Critical Yield (MPa)
Critical yield standard deviation
Young’s Modulus (MPa)
Young’s Modulus standard deviation
Control 2.37 0.95 3.18 3.11 Decellularized 1.42 0.43 2.16 1.83

17
Figure 8: Critical yield strength comparison of control and decellularized vessels. No
significant difference found (p=0.053).
Figure 9: Young's modulus comparison of control and decellularized vessels. No significant
difference found (p=0.54).

18
3.2 Histological Characterization
This characterization was used to show complete decellularization of tissues, and the
reproducibility of the decellularization protocol. The vessels were viewed under white light and
closely examined for the presence of nuclear material. Figure 9A shows a native vessel
untouched by detergent solutions. The vessel establishes the native structure given by the pink
coloring and the nuclear material as seen by the purple spotting throughout the tissue. Figure 9B
and 9C show decellularized vessels, at 10X and 40X respectively. These images are absent of
purple nuclear material in the tissue. Nuclear material was absent in 7 of 9 vessels that
underwent decellularization.
The two vessels that were unable to be decellularized were the two thickest vessels used in this
study, and retained nuclear material in the outer half of the vessel diameter. These vessels were
two different sections of the same original vessel and thus were of similar thickness. It should be
noted that these vessels were part of the decellularization run where perfusion was not
maintained for the full 20 hours of the protocol due to mechanical failure of the shake table used.
Figure 9D shows a vessel that underwent the decellularization procedure, but was not fully
decellularized. Nuclear material can still be seen in the tissue with close examination.

19
Figure 10: H&E stained vessels. Control vessel with nuclear material present at 10X (A).
Decellularized vessel, nuclear material absent at 10X (B). Decellularized vessel, nuclear material
absent 40X (C).Decellularized vessel, nuclear material present 40X (D).
A B
D C

20
4. Discussion
The goal of this work was to replicate the previously established protocol for decellularization of
porcine arteries to evaluate if the methods produced repeatable decellularization results. The
protocol was used to decellularize nine porcine arteries, and these were compared against seven
control vessels. Histology was used to verify the effectiveness of the decellularization and tensile
testing was completed to evaluate mechanical properties of the vessels, specifically the critical
yield strength and Young’s modulus.
4.1 Tensile Testing
Critical yield strength is the point where deformation is no longer elastic and becomes plastic.
Tensile testing revealed no significant difference in the critical yield strength between
decellularized and control vessels. This indicates that the control vessels did not have a
significantly higher failure strength compared to decellularized vessels, and both have similar
elasticity. Literature states that a breakdown of cross-linking in the collagen or denaturing of
extracellular matrix proteins occurs during the decellularization process, and may reduce the
critical yield strength of the vessel, but this was not supported by the data (12, 22, 23). The data
indicates that there is no significant loss of critical yield strength and thus that the collagen may
retain its integrity. This is ideal for the creation of a blood vessel scaffold because it mimics the
mechanical strength of native vessels.
Elastic modulus is a measurement of the slope of the stress strain curve, and indicates the
stiffness of a material. No significant difference in Young’s modulus was found between
decellularized and control vessels indicating that the vessels have similar Young’s Modulus
values. The slight elastic modulus decrease from native to decellularized vessels could be

21
attributed to the detergent solution damaging collagen fibers, as well as the elimination of
cellular bonds in the material (22). Without cellular bonds to hold the ECM scaffold together, the
material moves more freely. The statistical similarity in decellularized and control vessels is
consistent with data found in the development of this process.
Data found by Aubrey Smith, M.S. in the development of this protocol showed a significant
difference in the critical yield strength, and no significant difference in the Young’s modulus of
control and decellularized vessels. The results found in the current work resemble those of done
by Ms. Smith in that the results are of similar magnitude, but do not possess a significant
difference in the critical yield strength that exists in Ms. Smith’s results. A comparison of the
decellularized data of this work to Ms. Smith’s can be found in figure 10 and 11.
Figure 11: Box plot comparison of the critical yield strength of decellularized vessels from
current work to previous work done by Smith (20).

22
Figure 12: Box plot comparison of the Young’s modulus of decellularized vessels from current
work to previous work done by Smith (20).
While there was a lack of significance in Young’s modulus data, the standard deviations of
tensile testing data for decellularized vessels are smaller in this work than in previous work done
by Ms. Smith. This shows that the protocol itself is repeatable, and provides consistent results. A
potential explanation for the lack of significant difference found in this work for critical yield
strength is the extra freeze/thaw cycle that the control vessels underwent prior to tensile testing.
Freeze thaw cycles can disrupt ECM proteins as well as SMC viability by forming ice crystals in
the tissues (24). By disrupting ECM proteins the critical yield strength of control vessels could
have decreased enough to inhibit significance found in the results. Other differences included the
replacement of PBS in the decellularization solution with Milli-Q water, and fixing in 10%
formalin rather than Histochoice. Milli-Q water is purified water and should not interact with the
SDS and have no effect on the outcome, but this was not analyzed during the study. 10%

23
formalin is an alternative fixative agent and its use would have no effect on the decellularization
protocol or the subsequent tensile testing analysis.
While the data found in this work can be easily compared to work done by Ms. Smith, it cannot
be directly compared to other data in the field. Because different groups use different tensile
testing methods to quantify mechanical properties, such as uniaxial and radial tensile testing, and
burst pressure analysis, it is difficult to make direct comparison. Thus, there is a need for field-
wide unification of testing methods for vessel scaffolds. Without unification, data cannot be
accurately translated between studies in the field. A summary of existing literature tensile testing
values can be found in table 2. These numbers show similarity to the numbers found in this
study, and show that with this decellularization method is producing similar results to other
methods being researched elsewhere. Unfortunately with the variation in both decellularization
and tensile testing analysis methods used in the field the data in this work cannot be directly
compared.
Table 2: Literature tensile testing data summary (22, 25)
4.2 Histology
Histology revealed that seven of nine vessels that underwent the decellularization protocol were
completely void of nuclear material. It should again be noted that during the decellularization
procedure mechanical failure of the shake table occurred for an unknown time period, causing
incomplete decellularization of two vessels. The two vessels that were incompletely
Critical Yield (MPa) Young’s Modulus (MPa) Control 2.69 2.52 Decellularized 1.78 1.77

24
decellularized were the two thickest vessels used. This indicates that decellularization
effectiveness is thickness dependent because during the failure of the shake table two vessels of
smaller thickness were decellularized and two thicker vessels were not. Literature indicates that
increased thickness presents a resistance to diffusivity through the material (22). The vessel
thickness may have played a role in the decellularization failure but this should not be attributed
to the protocol developed by Ms. Smith because of mechanical failure of the shake table.
4.3 Previous trials
Prior to completion of the full protocol two initial trials were completed, and the data was
declared null during analysis. Trial 1 consisted of a general run-through of the entire protocol.
During this trial the initial length during tensile testing was not taken, and without this the data
was rendered useless because of inability to calculate critical yield strength or Young’s Modulus.
During both the first and second trials, the thickness of the vessel was measured clamped. The
vessel thickness measurements all were very similar averaging 0.14mm, compared to the
0.70mm average thickness in later trials. This initial trial thickness was much lower than those
found by Smith (0.79mm), and because of the lack of variability in the measured thicknesses,
Trial 2 data was also rendered invalid (20).
To correct for the discrepancy in thickness measurements and limit human error, each vessel
section was measured with calipers twice, on either side of the vessel and averaged. Each
measurement was taken with little to no force applied to the vessel, to avoid clamping and
distortion of the thickness. This produced more variable thicknesses, proportional to the actual
thickness of the vessel. Recording the ratio of vessel thicknesses non-clamped/clamped
(0.70mm/0.14mm) gave a ratio of 5. Consequently, the Critical Yield Strength and Young’s
Modulus showed also an increase by factor of 7.6 (14.1 MPa/2.4 MPa) and 9.0 (19.8 MPa/2.2

25
MPa) respectively, when comparing non-clamped to clamped measurements. This change could
be attributed to the change in thickness, because as seen in equation 3, the thickness
measurement is inversely proportionate to the yield strength and critical yield strength
measurements. A summary of the measurement comparisons can be seen in table 4.
Table 3: Previous trials, clamped and unclamped thicknesses
Thickness (mm) Critical Yield (MPa) Young’s Modulus (MPa) Clamped 0.14 14.1 19.8 Unclamped 0.70 2.4 2.2 Factor Change 5.0 7.6 9.0
While the decellularization protocol did produce similar results to those done in the development
of the protocol by Ms. Smith, because of the extreme variability in results due to the discrepancy
in thickness measurement method, the protocol should be edited to include an exact methodology
for making this measurement. In addition to this, the method for acquiring starting length
currently states “pull vessel until taut” but does not include a quantifiable definition of “taut”. In
this project, a force of 0.3N was used to quantify tautness in the vessel and measure starting
length. For future work, a force measurement of 0.3 N should be included in this protocol to
quantify this measurement for repeatable results because as seen in equation 4, the start length is
proportionate to the strain, which affects both critical yield and ultimate tensile strength
measurements.
4.4 Limitations
Histology was used to ensure the complete decellularization of vessels. Unfortunately
mechanical failure of the shake table occurred in one trial, and it is unknown how long the
agitation lasted before stopping. This failure adds an unknown variable to the testing results of

26
two vessels, but standard deviations in mechanical testing were actually lower for decellularized
vessels than those found in previous studies (20). This could be attributed to different trials
undergoing roughly the same amount of agitation before failure, as well as the variability in the
thickness of the vessel, and the biologic material being variable in nature.
The two vessels that were incompletely decellularized were the two thickest vessels used in this
study. This indicated that the thicker the vessel the more difficult it is to fully penetrate with
detergent solution and achieve successful decellularization. While this most likely occurred due
to inadequate mechanical agitation, this leaves the question what is the thickness or size
limitation of the proposed decellularization protocol. Further studies should be completed to
evaluate the relationship between scaffold degradation, decellularization, and vessel thickness.
4.5 Future Work
While uniaxial tensile testing is a valuable tool for evaluating mechanical properties of vessels,
its implications are limited. It can evaluate the vessel material itself, but cutting and distorting
the vessel reduces the physiologic relevance because the stresses are different from those placed
on it either in vivo or in vitro for the blood vessel mimic. Tensile testing the vessel by pulling
radially, with an intact vessel will more accurately portray the vessel strength as a whole unit,
rather than just the material it is comprised of. Adapters for the existing tensile tester were
created by Ms. Carolyn Barry for a Master’s Thesis (Figure 12) (26). These adapters will allow
tensile testing of a vessel or vessel scaffold to be completed in both radial and longitudinal
directions in their native, tubular form.

27
Figure 13: Adapter for radial tensile testing for vessel scaffolds (26)
5. Conclusions
This study repeated the protocol developed by Aubrey Smith, M.S., for decellularizing porcine
arteries for potential use in the blood vessel mimic. Defining measurement techniques, such as
for thickness and gage length will minimize human error, and variability in results. The results
showed similarity to results found by Ms. Smith, indicating that the protocol will produce
repeatable results. Unification of decellularization protocol and evaluation techniques in the field
will allow for comparison between different groups, and further advancement in the field. The
use of radial tensile testing should be used in the future to assess the mechanical properties of the
vessel scaffold in a physiologic, tubular state.

28
6. Bibliography
1. Hansson, G.K. 2005. Inflammation, atherosclerosis, and coronary artery disease. New
England Journal of Medicine 353, 1685-1695.
2. Lloyd-Jones, D., Adams, R.J., Brown, T.M., Carnethon, M., Dai S., & De Simone G.
2010. Heart disease and stroke statistics--2010 update: a report from the American Heart
Association. Circulation 121, e46-e215.
3. Atherosclerosis. 2011, July 1. National Heart Lung and Blood Institute. Retrieved
December 20, 2011 from http://www.nhlbi.nih.gov/health/health-
topics/topics/atherosclerosis/
4. Kang, P.M., & Izumo, S. 2000. Apoptosis and heart failure: a critical review of the
literature. Circulation Research 86, 1107-1113.
5. Tomaselli, G.F., & Marban, E. 1999. Electrophysiological remodeling in hypertrophy and
heart failure. Cardiovascular Research 42, 270-283.
6. Coronary Heart Disease. 2011, May 23. Pubmed Health. Retrieved December 20, 2011
from http://www.ncbi.nlm.nih.gov/pubmedhealth/PMH0004449/
7. Ramsay, L.E., Yeo, W.W., & Jackson, P.R. 1991. Dietary reduction of serum cholesterol
concentration: Time to think again. British Medical Journal 303, 953-957.
8. Avorvastatin. 2010, July 1. Pubmed Health. Retrieved December 20, 2011 from
http://www.ncbi.nlm.nih.gov/pubmedhealth/PMH0000009/

29
9. Law, M., Wald, N., & Morris, J. 2003. Lowering blood pressure to prevent myocardial
infarction and stroke: a new preventative strategy. Health Technology Assessment 7(31).
10. Hillis, L.V., Smith, P.K., Anderson, J.L., Bittl, J.A., Bridges, C.R., Byrne, J.G., et al.
2011. 2011 ACCF/AHA Guideline for Coronary Artery Bypass Graft Surgery: A Report
of the American College of Cardiology Foundation/American Heart Association Task
Force on Practice Guidelines. Circulation 124, e652-e735.
11. Teebken, O.E., & Haverich, A. (2002). Tissue engineering of small-diameter vascular
grafts. Graft 5(1), 14-25.
12. Gui, L., Akihito, M., Chan, S.A., Breuer, C.K., & Niklason, L.E. 2009. Development of
Decellularized Human Umbilical Arteries as Small-Diameter Vascular Grafts. Tissue
Engineering 15(9), 2665-2676.
13. What is coronary artery bypass grafting? 2010, January 1. National Heart Lung and
Blood Institute. Retrieved December 20, 2011 from
http://www.nhlbi.nih.gov/health/health-topics/topics/cabg/
14. How are stents used? 2011, November 8. National Heart Lung and Blood Institute.
Retrieved December 20, 2011 from http://www.nhlbi.nih.gov/health/health-
topics/topics/stents/used.html
15. Serruys, P.W., Morice, M.C., Kappetein, A.P, Colombo, A., Holmes, D.R., Mack, M.J.,
Ståhle, E., Feldman, T.E., van den Brand, M., Bass, E.J., Van Dyck, N., Leadley, K.,
Dawkins, K.D., & Mohr, F.W. 2009. Percutaneous coronary intervention versus

30
coronary-artery bypass grafting for severe coronary artery disease. New England Journal
of Medicine 360(10), 961-972.
16. Berke, A.D. 2007. Services & Procedures. Cardiac Consultation & Interventional
Cardiology. Retrieved December 20, 2011 from
http://www.cardiology.md/procedures.htm
17. Schaner, P.J., Martin, N.D., Tulenko, T.N., Shapiro, I.M., Tarola, N.A., Leichter, R.F.,
Carabasi, R.A., & DiMuzio, P.J. 2004. Decellularized vein as a potential scaffold for
vascular tissue engineering. Vascular Surgery 40(8), 146-153.
18. Cardinal K.O., Bonnema G.T., Hofer H., Barton J.K., & Williams S.K. 2006 Tissue-
engineered vascular grafts as in vitro blood vessel mimics for the evaluation of
endothelialization of intravascular devices. Tissue Engineering 12, 3431-3438.
19. Cardinal, K.O., Williams, S.K. 2009. Assesment of the intimal response to a protein
modified stent in a tissue-engineered blood vessel mimic. Tissue Engineering 15(12):
3869-3876.
20. Smith, A.N. 2011. Characterization and implementation of a decellularized porcine vessel
as a biologic scaffold for a blood vessel mimic. California Polytechnic State University,
San Luis Obispo, CA.
21. Gilbert, T.W., Sellaro, T.L., & Badylak, S.F. 2005. Decellularization of tissues and
organs. Biomaterials, 27, 3675-3683.
22. Montoya C.V., & McFetridge P.S. 2009. Preparation of ex vivo-based biomaterials using
convective flow decellularization. Tissue Engineering 15(11), 191-200.

31
23. Fitzpatrick, J.C., Clark, P.M., & Capaldi, F.M. 2010. Effect of decellularization protocol
on the mechanical behavior of porcine descending aorta. International Journal of
Biomaterials.
24. Venkatasubramanian, R.T., Grassl, E.D., Barocas, V.H., Lafontaine, D., & Bischof, J.C.
2006. Effects of freezing and cryopreservation of the mechanical properties of Arteries.
Annals of Biomedical Engineering 34(5), 823-832.
25. Heine, J., Schmiedl, A., Cebotari, S., Karck, M., Mertsching, H., Haverich, A., &
Kallenbach, K. 2011. Tissue engineering human small-caliber autologous vessels using a
xenogenous decellularized connective tissue matrix approach: preclinical comparative
biomechanical studies. Artificial Organs 35(10), 930-940.
26. Barry, C.R. 2011. Design and development of two test fixtures to test the longitudinal and
transverse tensile properties of small diameter tubular polymers. California Polytechnic
State University, San Luis Obispo, CA.

32
7. Appendix
7.1 Appendix 1: Ms. Smith’s perfusion decellularization protocol
Purpose: To decellularize porcine vessels using a perfusion system to keep the lumen open.
Materials:
• Daigger orbital shake table (model SH 06050597)
• 10% liquid SDS
• Several Clean 50 mL conicals
• Razor blade
• PBS
• Sterile forceps
• Histochoice
• Thermo Fisher Scientific Masterflex L/S 3 roller peristaltic pump (model 7519-05)
• Male and Female luer lock barbs
Procedure:
Samples were kept in a -80°C freezer until you need to use them (no time limit).
1. Samples were defrosted in a 37°C water bath. Samples were defrosted when the entire
sample was malleable and warm. If the sample is fresh, ignore this step.
2. Mix the .075% SDS deceullarization solution. The perfusion system uses a total of 75
mL of solution. The SDS stock solution being used (Invitrogen Corporation’s catalog
number 15553-027) is a concentrated amount of 10% SDS in PBS. The following
formula will obtain the volume of SDS in the solution:

33
Equation 1:
Desired % of SDS in the final solution (decimal form) * 75mL the total volume = the volume of
a pure SDS solution
Equation 2:
The volume of pure SDS (eqn1) / 0.10 (the percent dilution of SDS) = the volume of SDS
needed to be used
Example calculation for 0.075% SDS in a 75mL of solution:
Equation1: 0.00075 * 75mL = .0 05625mL
Equation2: 0.05625mL .0/ 10 = .0 56mL of 10% SDS
For a 75mL solution, 0.56mL of the SDS solution is added to 74.4mL of PBS
Water.
3. An end male lure lock barb that screws on to the 50mL tubes prepared with tubing was
located. The male lure lock barb was required to be the right size for the vessel lumen
diameter to fit over.
4. Samples were cut using a razor blade into sections approximately 5cm in length.
5. The proper lure lock barbs were then inserted into the lumen of the vessel and sutured
tightly.
6. The barb and vessel were then screwed into place in the 50mL conical with tubing.
7. The tubing conical was placed on the peristaltic pump. The pump is set for fluid to be
pushed though the sample side of the tube.
8. The 50mL conical was filled with the 0.075% SDS solution.

34
9. The tubing was perfused to remove most of the bubbles. The sample needed to be
completely submerged in the SDS solution.
10. The pump was run at 20mL/min for 20 hours with the shake table at 30 rpm.
11. After 20 hours samples were removed from the shake table and the SDS solution was
poured down the drain.
12. The decellularized tissue was rinsed 5 times for 10 minutes with sterile PBS.
a. Using sterile forceps, the decellularized tissue was transferred to a conical with 20
mL of sterile PBS.
b. Samples were placed on the shake table for 10 minutes.
c. This process was repeated 5 times, for a total of 50 min and 5 rinse steps.
13. Decellularized tissues were transferred to a 15mL conical with 10-12mL of Histochoice
for each sample. *Note: This is a dangerous material, be sure to use gloves and eye
protection when pouring.
14. Samples were left in Histochoice overnight at room temperature allowing for fixation to
occur.
15. Fixed samples were embedded in paraffin wax blocks evaluated using hematoxylin and
eosin staining

35
7.2 Appendix 2: Perfusion decellularization protocol used in this experiment
Purpose: To decellularize porcine vessels using a perfusion system to keep the lumen open.
Materials:
• Daigger orbital shake table (model SH 06050597)
• 10% liquid SDS
• Several Clean 50 mL conicals
• Razor blade
• Milli-Q water
• 10% Formalin
• Thermo Fisher Scientific Masterflex L/S 3 roller peristaltic pump (model 7519-05)
• Male and Female luer lock barbs
Procedure:
Samples were kept in a -80°C freezer until you need to use them (no time limit).
3. Samples were defrosted in a 37°C water bath. Samples were defrosted when the entire
sample was malleable and warm. If the sample is fresh, ignore this step.
4. Mix the .075% SDS deceullarization solution. The perfusion system uses a total of 75
mL of solution. The SDS stock solution being used (Invitrogen Corporation’s catalog
number 15553-027) is a concentrated amount of 10% SDS in PBS. The following
formula will obtain the volume of SDS in the solution:
Equation 1:

36
Desired % of SDS in the final solution (decimal form) * 75mL the total volume = the volume of
a pure SDS solution
Equation 2:
The volume of pure SDS (eqn1) / 0.10 (the percent dilution of SDS) = the volume of SDS
needed to be used
Example calculation for 0.075% SDS in a 75mL of solution:
Equation1: 0.00075 * 75mL = .0 05625mL
Equation2: 0.05625mL .0/ 10 = .0 56mL of 10% SDS
For a 75mL solution, 0.56mL of the SDS solution is added to 74.4mL of PBS
Water.
16. An end male lure lock barb that screws on to the 50mL tubes prepared with tubing was
located. The male lure lock barb was required to be the right size for the vessel lumen
diameter to fit over.
17. Samples were cut using a razor blade into sections approximately 5cm in length.
18. The proper lure lock barbs were then inserted into the lumen of the vessel and sutured
tightly.
19. The barb and vessel were then screwed into place in the 50mL conical with tubing.
20. The tubing conical was placed on the peristaltic pump. The pump is set for fluid to be
pushed though the sample side of the tube.
21. The 50mL conical was filled with the 0.075% SDS solution.

37
22. The tubing was perfused to remove most of the bubbles. The sample needed to be
completely submerged in the SDS solution.
23. The pump was run at 20mL/min for 20 hours with the shake table at 30 rpm.
24. After 20 hours samples were removed from the shake table and the SDS solution was
poured down the drain.
25. The decellularized tissue was rinsed 5 times for 10 minutes with sterile PBS.
a. Using sterile forceps, the decellularized tissue was transferred to a conical with 20
mL of sterile PBS.
b. Samples were placed on the shake table for 10 minutes.
c. This process was repeated 5 times, for a total of 50 min and 5 rinse steps.
26. Decellularized tissues were transferred to a 15mL conical with 10-12mL of 10% formalin
for each sample. *Note: This is a dangerous material, be sure to use gloves and eye
protection when pouring.
27. Samples were left in 10% formalin overnight at room temperature allowing for fixation to
occur.
28. Fixed samples were embedded in paraffin wax blocks evaluated using hematoxylin and
eosin staining

38
7.3 Appendix 3: Tensile testing protocol Purpose:
To ensure all tensile tests are repeated in the same manner, in order to ensure reproducible results
Procedure:
1. Samples warm to room temp and not soaking wet.
2. Using the palm pilot tap on the “Inspect” icon
3. Prepare to load the sample:
a. Cut open the sample longitudinally
b. Measure the width of the sample (w)
c. Measure the thickness of the sample (t)
4. Load sample:
a. Place proximal end into the clamp that remains stationary.
b. Tighten the clamp on a small edge of the sample, clamp enough of the sample to
hold it in place
c. Repeat clamping process with the distal end into the movie clamp
d. Move the clamps into position, switch the machine into jog and in the direction
desired, until location is reached
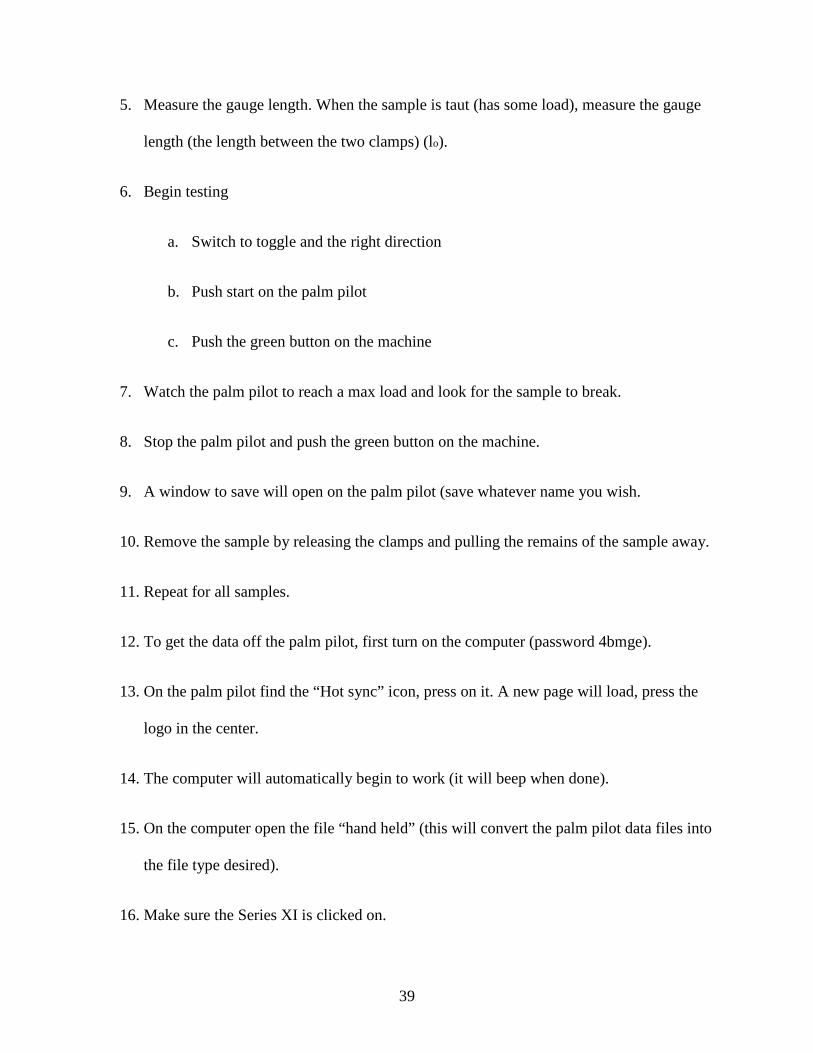
39
5. Measure the gauge length. When the sample is taut (has some load), measure the gauge
length (the length between the two clamps) (lo).
6. Begin testing
a. Switch to toggle and the right direction
b. Push start on the palm pilot
c. Push the green button on the machine
7. Watch the palm pilot to reach a max load and look for the sample to break.
8. Stop the palm pilot and push the green button on the machine.
9. A window to save will open on the palm pilot (save whatever name you wish.
10. Remove the sample by releasing the clamps and pulling the remains of the sample away.
11. Repeat for all samples.
12. To get the data off the palm pilot, first turn on the computer (password 4bmge).
13. On the palm pilot find the “Hot sync” icon, press on it. A new page will load, press the
logo in the center.
14. The computer will automatically begin to work (it will beep when done).
15. On the computer open the file “hand held” (this will convert the palm pilot data files into
the file type desired).
16. Make sure the Series XI is clicked on.

40
17. Open the file from the palm pilot.
18. Click on save as and determine a location that you want to save as. Save as a .txt file.
19. Then shut off the machine and put the palm pilot away.
20. Then use the tensile testing macro to determine the elastic modulus and the critical yield

41
7.4 Appendix 4: Revised tensile testing protocol
Purpose:
To ensure all tensile tests are repeated in the same manner, in order to ensure reproducible results
Procedure:
1. Samples warm to room temp and not soaking wet.
2. Using the palm pilot tap on the “Inspect” icon
3. Prepare to load the sample:
a. Cut open the sample longitudinally
b. Measure the width at both ends of the sample, and the center. Average these
measurements to get the width (w). Measurement should be completed applying
minimal force to the vessel to avoid distortion of vessel architecture.
c. Measure the thickness at both ends of the sample, and the center. Average these
measurements to get the thickness (t). Measurement should be completed
applying minimal force to the vessel to avoid distortion of vessel architecture.
4. Load sample:
a. Place proximal end into the clamp that remains stationary.
b. Tighten the clamp on a small edge of the sample, clamp enough of the sample to
hold it in place
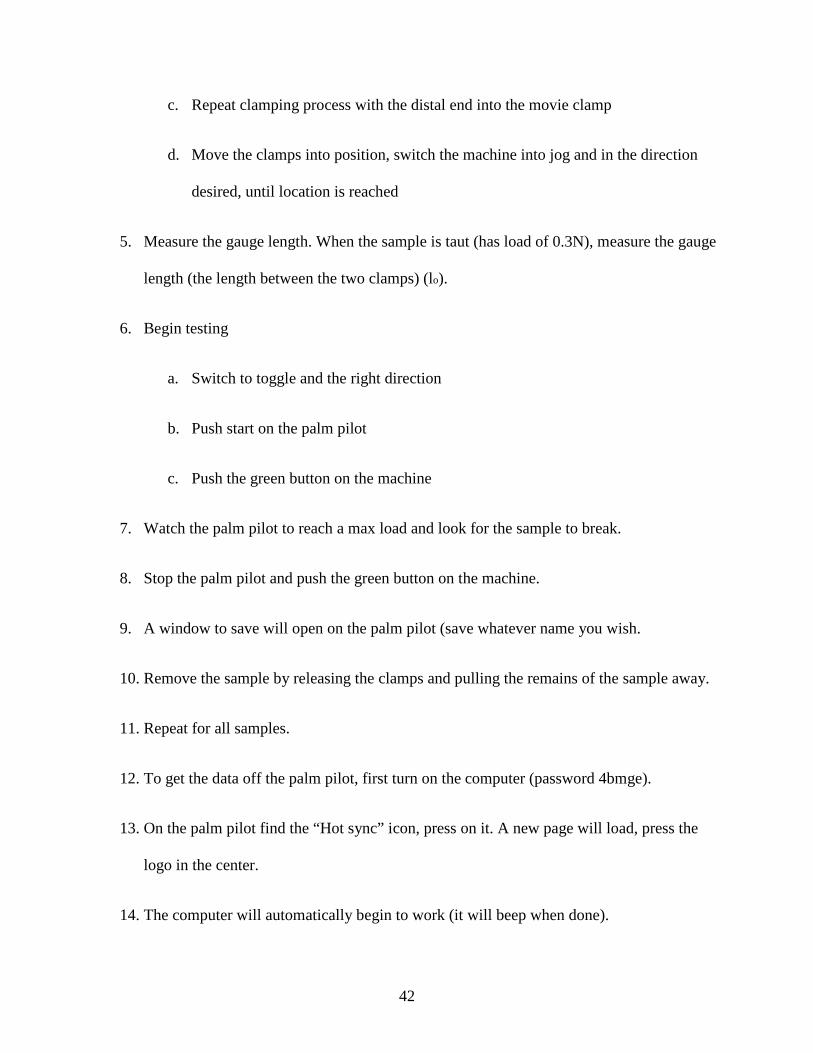
42
c. Repeat clamping process with the distal end into the movie clamp
d. Move the clamps into position, switch the machine into jog and in the direction
desired, until location is reached
5. Measure the gauge length. When the sample is taut (has load of 0.3N), measure the gauge
length (the length between the two clamps) (lo).
6. Begin testing
a. Switch to toggle and the right direction
b. Push start on the palm pilot
c. Push the green button on the machine
7. Watch the palm pilot to reach a max load and look for the sample to break.
8. Stop the palm pilot and push the green button on the machine.
9. A window to save will open on the palm pilot (save whatever name you wish.
10. Remove the sample by releasing the clamps and pulling the remains of the sample away.
11. Repeat for all samples.
12. To get the data off the palm pilot, first turn on the computer (password 4bmge).
13. On the palm pilot find the “Hot sync” icon, press on it. A new page will load, press the
logo in the center.
14. The computer will automatically begin to work (it will beep when done).

43
15. On the computer open the file “hand held” (this will convert the palm pilot data files into
the file type desired).
16. Make sure the Series XI is clicked on.
17. Open the file from the palm pilot.
18. Click on save as and determine a location that you want to save as. Save as a .txt file.
19. Then shut off the machine and put the palm pilot away.
20. Then use the tensile testing macro to determine the elastic modulus and the critical yield

44
7.5 Appendix 5: Tensile testing data analysis macro
Sub TensileTestMacro()
Dim Filename()
Close #1
k = 0
p = 0
'd = InputBox("How many tests would you like to analyze?")
Call FileDialogOpen(Filename(), d)
If d > Worksheets.Count Then
For k = Worksheets.Count To d 'you didn't type in a number'
Worksheets.Add
Next
End If
For j = 1 To d
m = 0
Max = 0
sumofx = 0
sumofy = 0
sumofxy = 0
sumofxx = 0
sumofxsquared = 0
Delta = 0

45
a = 0
b = 0
c = 0
l = 0
'Filename = InputBox("Where is the location of the data file")
'Name = InputBox("What test is this?")
Name = Right(Filename(j), 5) ' ********* takes the last 4 characters of name.
a = InputBox("What is the gauge of the sample " + Name + "?")
b = InputBox("What is the width of the sample " + Name + "?")
c = InputBox("What is the thickness of the sample " + Name + "?")
Worksheets(j).Name = Name 'you kept hitting cancel didn't you?'
Worksheets(Name).Cells(1, 1).Value = "Time, sec"
Worksheets(Name).Cells(1, 2).Value = "Extension, mm"
Worksheets(Name).Cells(1, 3).Value = "Load, N"
Worksheets(Name).Cells(1, 4).Value = "Strain"
Worksheets(Name).Cells(1, 5).Value = "Stress"
Worksheets(Name).Cells(1, 7).Value = "Linear Strain"
Worksheets(Name).Cells(1, 8).Value = "Linear Stress"
Worksheets(Name).Cells(1, 10).Value = "Critical/Yield Stress"
Worksheets(Name).Cells(1, 11).Value = "20% Yield Stress"
Worksheets(Name).Cells(1, 12).Value = "50% Yield Stress"
Worksheets(Name).Cells(1, 13).Value = "Slope"
Worksheets(Name).Cells(1, 14).Value = "y-intercept"

46
Open Filename(j) For Input As #j 'Typed the filename wrong/file doesn't exist/you've already opened it this session'
Input #j, pathfile
i = 0
Do Until EOF(j)
Input #j, tm, x, y
If i = 0 Or i = 1 Then
tmoff = tm
'Worksheets(Name).Cells(i + 1, 1).Value = x
'Worksheets(Name).Cells(i + 1, 1).Value = y
i = 1 + i
Else
If (x >= 0) And (y > 0) Then
i = i + 1
'Worksheets(Name).Cells(i - 1, 1).Value = (i - 2) 'need to delete the
Worksheets(Name).Cells(i - 1, 1).Value = tm - (tmoff)
Worksheets(Name).Cells(i - 1, 2).Value = x 'first two lines of
Worksheets(Name).Cells(i - 1, 3).Value = y 'the notepad file
Worksheets(Name).Cells(i - 1, 4).Value = x / a '(only data points
Worksheets(Name).Cells(i - 1, 5).Value = y / (b * c) 'no words) or you messed up typing a value into the size of the sample'

47
t = x / a
u = y / (b * c)
If u > Max Then
Max = u
timestop = (i - 2)
End If
Worksheets(Name).Cells(2, 10).Value = Max
e = (0.2) * Max
f = (0.5) * Max
Worksheets(Name).Cells(2, 11).Value = e
Worksheets(Name).Cells(2, 12).Value = f
End If
End If
Loop
Close #j
g = 0
r = 0
p = 1
For m = 1 To (i - 2)

48
g = g + 1
o = Worksheets(Name).Cells(g, 1).Value
h = Worksheets(Name).Cells(g, 5).Value
n = Worksheets(Name).Cells(g, 4).Value
If h >= e And h <= f And o <= timestop Then
p = p + 1
Worksheets(Name).Select
Cells(g, 4).Select
Selection.Font.Bold = True
Cells(g, 5).Select
Selection.Font.Bold = True
Worksheets(Name).Cells(p, 7).Value = n
Worksheets(Name).Cells(p, 8).Value = h
End If
Next
Worksheets(Name).Cells(8, 1).Select
Charts.Add
With ActiveChart

49
.ChartType = xlXYScatterSmoothNoMarkers
.SetSourceData Source:=Sheets(Name).Range("D:E"), PlotBy:=xlColumns
.Location Where:=xlLocationAsObject, Name:=Name
End With
With ActiveChart
.HasTitle = True
.ChartTitle.Text = "Stress-Strain Curve"
.Axes(xlCategory, xlPrimary).HasTitle = True
.Axes(xlCategory, xlPrimary).AxisTitle.Characters.Text = "Strain"
.Axes(xlValue, xlPrimary).HasTitle = True
.Axes(xlValue, xlPrimary).AxisTitle.Characters.Text = "Stress"
.HasLegend = False
End With
Worksheets(Name).Cells(16, 6).Select
q = p - 1
Charts.Add
With ActiveChart
.ChartType = xlXYScatter
.SetSourceData Source:=Sheets(Name).Range("G:H"), PlotBy:=xlColumns
.Location Where:=xlLocationAsObject, Name:=Name
End With
With ActiveChart
.HasTitle = True
.ChartTitle.Text = "Linear Stress"
.Axes(xlCategory, xlPrimary).HasTitle = True

50
.Axes(xlCategory, xlPrimary).AxisTitle.Characters.Text = "Strain"
.Axes(xlValue, xlPrimary).HasTitle = True
.Axes(xlValue, xlPrimary).AxisTitle.Characters.Text = "Stress"
.HasLegend = False
End With
ActiveChart.SeriesCollection(1).Select
ActiveChart.SeriesCollection(1).Points(q).Select
ActiveChart.SeriesCollection(1).Trendlines.Add(Type:=xlLinear, Forward:=0, _
Backward:=0, DisplayEquation:=True, DisplayRSquared:=True).Select
Next
End Sub
Sub FileDialogOpen(Filename(), n)
Dim lngCount As Long ' allow for multiple file selection (Completely Optional!)
' Open the file dialog
With Application.FileDialog(msoFileDialogOpen)
.AllowMultiSelect = True 'This code is multiple file
.Show
n = .SelectedItems.Count
ReDim Filename(n)
' Display paths of each file selected

51
For lngCount = 1 To n
Filename(lngCount) = .SelectedItems(lngCount)
Next lngCount
End With
End Sub

52
7.6 Appendix 6: Histology protocol
Purpose:
To stain paraffin embedded section with hematoxylin and eosin for collagen and nuclei.
Methods:
Blocks were sectioned at 6µm and mounted on slides. Slides were placed in a slide rack and then
placed into glass dishes. Slides were dipped in the following order for the stated duration of time.
• 3 min – xylene *Performed in fume hood*
• 3 min – xylene *Performed in fume hood*
• 3 min – xylene *Performed in fume hood*
• 2 min – 100% EtOH
• 2 min – 100% EtOH
• 2 min – 95% EtOH
• 1 min – air dry
• 4 min – Hematoxlin
• 1 min – Water Distilled
• 30 – 45 sec – Clearifier
• 1 min – Water Distilled
• 1 min – Bluing

53
• 1 min- Water Distilled
• 1 min – 95% ETOH
• 1 min 30 sec – Eosin
• 1 min - 100% EtOH
• 1 min - 100% EtOH
• 1 min - 100% EtOH
• 3 min – xylene *Performed in fume hood*
• 3 min – xylene *Performed in fume hood*
• 3 min – xylene *Performed in fume hood*
While the slide rack remained in the last xylene dish, while each slide was individually pulled
out and cover slipped using mounting glue. Slides were left to dry for 48 hours.

54
7.7 Appendix 7: Decellularized and control data table
Treatment Young’s Modulus (MPa) Critical Yield Strength Control 1.89445987 2.0315
Control 2.14055867 1.6763 Control 1.98252091 0.6774 Control 3.68082863 6.1671 Control 3.7366208 8.941 Control 1.29393675 1.4313 Control 1.87637573 1.352
Decellularized 4.7396 2.204027 Decellularized 1.1651 1.495812 Decellularized 0.4326 1.219544 Decellularized 4.8419 1.737299 Decellularized 1.054 0.913265 Decellularized 1.1877 1.103051