evaluation of communication on the differences between ... · distinguish between “hazard” and...
TRANSCRIPT

Federal Institute for Risk Assessment
Edited by E. Ulbig, R. F. Hertel, G.-F. Böl
Evaluation of Communication on the Differences between “Risk” and “Hazard” Final Report Project implementation: Peter M. Wiedemann, Holger Schütz, Albena Spangenberg (Forschungszentrum Jülich GmbH, Programme Group Man, Environment, Technology, Jülich)

Imprint BfR Wissenschaft Edited by E. Ulbig, R. F. Hertel, G.-F. Böl Evaluation of Communication on the Differences between “Risk“ and “Hazard“ Federal Institute for Risk Assessment Press Office Thielallee 88-92 14195 Berlin Berlin 2010 (BfR-Wissenschaft 02/2010) 84 pages, 21 figures, 13 tables € 5 Printing: Cover, contents and binding BfR Printing House Dahlem Translated by: Aileen Sharpe ISSN 1614-3795 ISBN 3-938163-52-6
3 BfR-Wissenschaft
Table of Contents
Preface 5
1 Introduction 6
2 Terms and definitions 7
2.1 “Hazard” 7 2.2 “Risk” 7
3 Communication on “hazard” and “risk” 9
3.1 Starting point 9 3.2 Structural differences 9 3.3 Relevant aspects of risk communication 10
4 Status of research on the understanding of “hazard” 13
4.1 Distinction between “hazard” and “risk” 13 4.2 Efficacy of hazard warnings 13
5 Status of research on the understanding of “risk” 15
5.1 Attributes of the assessment of “risk” 15 5.2 Intuitive Toxicology: Perception of the risks from chemical
substances by lay persons 15 5.3 Difficulties in understanding risk communication 18
6 Workshop discussions – summary and results 21
6.1 Challenges facing successful risk communication 21 6.2 (When) is hazard communication sufficient? 23 6.3 When is hazard communication not sufficient? 23 6.4 The BfR risk communication model 23 6.5 Recommendations for appropriate risk communication 25 6.6 Recommendations for general communication on risks 26 6.7 Suggestions for future research 26
7 Experiments on differentiation between “hazard” and “risk” 27
7.1 Methodological approach 27 7.2 Expert model on “hazard” and “risk” 27 7.3 Pre-test 29 7.4 Online experiment 32 7.4.1 Design 32 7.4.2 Material 32 7.4.3 Conduct 33 7.4.4 Results 36 7.4.5 Summary and discussion of the results 46
8 Summary and conclusions for communication 49
4 BfR-Wissenschaft
9 Recommended actions 51
10 References 53
11 Annex 61
11.1 Annex 1: Overview of the importance of the concepts “hazard” and “risk” 61
11.2 Annex 2: Information needs of consumers 67 11.3 Annex 3: Problems of risk comparisons 68 11.4 Annex 4: Screenshots of the online experiment 71
12 List of Figures 77
13 List of Tables 79
5 BfR-Wissenschaft
Preface The risk communication activities undertaken by the Federal Institute for Risk Assessment (BfR) should be seen as an ongoing, interactive process in which it makes its assessment work and results available to the public at large, science, trade and industry, political circles, non-governmental organisations and other involved or interested circles. From the scientific angle central importance is attached first of all to clarifying the basic terms which are used in the field of national and international risk communication. In the context of public authority risk communication different interpretations of the terms “hazard” and “risk” lead to misun-derstandings and misinterpretations by stakeholders of the data provided. The uncertainty this causes amongst consumers is something that the media then seizes on. The European Policy Centre, therefore, calls for the highlighting of the difference between “hazard” and “risk” in its report “Improving the Quality of Risk Management in the European Union” (2003) commissioned by the European Commission. In the risk assessment process it is not just the scale of the possible damage (hazard) or potential benefit but also the likelihood of this damage or benefit occurring in conjunction with exposure (risk) which must be identified and discussed. By means of transparency, reliability and the greatest possible openness trust can be forged amongst all the stakeholders in the risk assessment process with the help of risk communication. This report is largely based on the final report of the project “Evaluation of communication on the differences between 'risk' and 'hazard'” that was instigated and supported by BfR. One goal of the project was to determine whether there are differences in the perception, evalua-tion and handling of risks and hazards by those involved in risk assessment. Knowledge and consideration of possibly different values and standards, which are the basis for this as-sessment, make possible both things: to achieve a consensus about management options but also to note disagreement and, in this way, to supply the stakeholders of risk communica-tion with the foundations for their risk management decisions. In this report the term “hazard” is mostly linked with warnings. This interpretation does not correspond to BfR practice which provides information in the context of hazard characterisation and the hazard associated with a substance or a product and then formulates corresponding recommended actions. One central question was how the terms “risk” and “hazard” are understood and used in the scientific arena and whether people who are not risk assessment experts do not in reality distinguish between “hazard” and “risk” or whether they do perhaps have at least an intuitive idea of the difference between “hazard” and “risk”. The main subject matter of this project was the experimental examination of this question in addition to looking at the latest scientific findings on “chemical hazard communication” and on “intuitive toxicology”. For the analysis of the lay understanding of “hazard” and “risk”, an online experiment was conducted involving 477 people. From the results it is clear that the distinction made - on the basis of scientific assessment - between communication on a “hazard” and communication on a “risk” is scarcely discernible to the public at large. What is far more important is clear, comprehensi-ble and transparent communication about the risk.
Professor Dr. Dr. Andreas Hensel President of the Federal Institute for Risk Assessment

6 BfR-Wissenschaft
1 Introduction
In scientific risk assessment “hazard” and “risk” are completely different concepts. The term “hazard” is used to describe the potential of a substance or situation to cause an adverse effect1 when an organism, system or (sub) population is exposed to that substance or situa-tion. “Risk”, by contrast, means the likelihood of an adverse effect in an organism, system or a (sub) population on exposure to a substance or situation under specific conditions. Based on these definitions information about a “hazard” is different from information about a “risk” even if this difference is not always made clear. For instance in the EU White Paper “Strategy for a Future Chemicals Policy” (2001) it is stated that:
The European Commission recognises the “freedom of choice” of consumers. The in-formation should enable consumers to judge whether alternative products on the mar-ket are more advantageous in respect of their inherent properties and risks (EU 2001, 28, bold added by BfR)
How is information, therefore, to be provided? When should the emphasis be on “hazard” and when should it be on “risk”? Furthermore, what knowledge is needed in order to be able to distinguish between the two concepts? What information must be conveyed and how must it be conveyed to ensure the “risk” concept is correctly understood? These questions about communication on “hazard” and “risk” are the subject of this report which has the following structure. After some explanations of the terms “hazard” and “risk”, attention turns to the problems which arise for risk communication from the difference be-tween “hazard” and “risk”. Then the latest scientific research findings are presented on the understanding of “hazard” and “risk” and on relevant aspects of risk perception and risk communication. This is followed by the presentation of an empirical study which examines whether and how lay persons distinguish between “hazard” and “risk”. The report ends with a summary of the project findings, the conclusions derived from them and the recommended actions for the further development of risk communication.
1 WHO gives the following definition of the term “adverse effect": “change in morphology, physiology, growth, development or
lifespan of an organism which results in impairment of functional capacity or impairment of capacity to compensate for addi-tional stress or increase in susceptibility to the harmful effects of other environmental influences.”

7 BfR-Wissenschaft
2 Terms and definitions
2.1 “Hazard”
The term “hazard” refers to the inherent property of a substance (or a situation) to cause an adverse effect. In this context for example the International Programme on Chemical Safety (IPCS) defines a “hazard” as the:
Inherent property of an agent or situation having the potential to cause adverse ef-fects when an organism, system, or (sub) population is exposed to that agent. (IPCS 2004, 12)
There are a number of different definitions of “hazard” (see Annex 1: Definitions) which basi-cally say the same thing as the IPCS definition. However, it should be noted that some defini-tions of “hazard” already refer explicitly to special exposure conditions (e.g. normal use).2 This report mainly uses the term “hazard”. In the online experiment (see below page 34ff.), the colloquial counterpart “hazardousness” is used. 2.2 “Risk”
Generally speaking “risk” is deemed to be the possibility of the occurrence of a harmful event. Kaplan and Garrick have formalised the general risk concept and their definition stresses the three main elements of risk. They have defined risk (R) as a set of triplets (Kap-lan & Garrick 1981, 13):
R = {⟨si, pi, xi⟩}, i = 1,2,…,N.
Whereby si describes a scenario; pi indicates the likelihood of the scenario; xi indicates the scale of damage in this scenario. In this concept the risk is described as the sum of consequences examined along with their likelihood and scale. The specific conceptualisation of risk does, however, vary, slightly from scientific discipline to scientific discipline (see also Annex 1: Definitions). For the area of technical risks the national standard DIN VDE 31000 Part 2, for instance, defines the risk as the product of likelihood and scale of damage (quoted according to SFK 2004, 13):
The risk linked to a specific technical procedure or condition is described in a sum-mary manner by a comment on likelihood which takes into account
• the expected frequency of the occurrence of an event leading to damage and • the scale of damage to be expected if that event occurs.
In the health sector different variants of the risk concept are used depending on the scientific fields. For cancer research Williams and Paustenbach (2002, 368f.) use the following defini-tion “Risk is a unitless probability of an individual developing cancer“. The IPCS definition of risk is broader and is also used in this report:
2 This is also the thrust of an older WHO definition (1979): “The likelihood that a chemical will cause adverse health effects
under the conditions under which it is produced or used”. (WHO 1979)

8 BfR-Wissenschaft
The probability of an adverse effect in an organism, system, or (sub) population caused under specified circumstances by exposure to an agent. (IPCS 2004, 13)
This definition highlights the fact that the difference between “hazard” and “risk” lies in expo-sure. A risk exists when there is exposure to a “hazard”, in a nutshell: risk= (hazard, expo-sure).
9 BfR-Wissenschaft
3 Communication on “hazard” and “risk”
3.1 Starting point
Risk communication always involves a series of different pieces of information. Depending on the data and objective it provides information on the hazard, exposure and dose-response relationships or about the risk and standards. That is why in analytical terms a distinction can be made between hazard communication and risk communication – when in the one case only the hazard is considered and in the other the related risk is also taken into account. In practice, however, this separation doesn’t always make sense because communication on a hazard is a necessary part of risk communication. 3.2 Structural differences
Ideally speaking, hazard information is information about substance properties with the po-tential to harm. This information is intended as a warning. It is simple in that – in contrast to risk communication – it is not dependent on any understanding of probabilities or uncertain-ties, particularly when there are no longer any doubts about the fact there is a potential harm. The understanding of hazard is only of importance to the extent that it is relevant for the de-sired avoidance behaviour. This means that we must, for instance, record what certain warn-ings mean or what is meant by an R-phrase or an S-phrase. Hence the US-American Occu-pational Safety and Health Administration (OSHA) presents occupational safety and health as a goal of its Hazard Communication Standard, “The basic goal of the standard is to be sure employers and employees know about work hazards and how to protect themselves; this should help to reduce the incidence of chemical source illness and injuries.” (OSHA 1998) In other areas of daily life, too, there are numerous examples: someone who reads the warning “Smoking can damage your health” on a cigarette packet just has to understand this one sentence. Whether smoking is more dangerous than drinking alcohol is not initially rele-vant. It is also of minor importance whether smoking 20 cigarettes a day is more harmful to health than smoking 5 cigarettes a day. However anyone who wants to find out more about how much he is at threat personally from a substance or a product will be better informed when he understands the risk rather than just being familiar with the hazard. This also results directly from the definition of risk: risk=f (hazard, exposure). The mere knowledge that there is a hazard and familiarity with its char-acteristics is not sufficient for an individual to assess the threat to him. Only when we know on what scale we are exposed to the hazard is it possible to assess the risk. One could say, in a slightly exaggerated manner, that risk communication serves the pur-poses of permitting an informed, weighing up and by extension a reflected decision whereas hazard communication can have a more direct impact on behaviour, without any reflective, intermediate steps. Hence the preconditions for successful risk communication are far more complex. Quantita-tive assessments are also important when it comes to understanding risk: what exposure do I have and how critical is this exposure? And: by what factor is my risk increased? Here it is also about the scale of risk in comparison with other risks and estimation of the possible con-founding factors. By contrast, understanding hazard information is far simpler. There is merely a need to know that a substance is a contaminant (what can happen and how bad it is?).
10 BfR-Wissenschaft
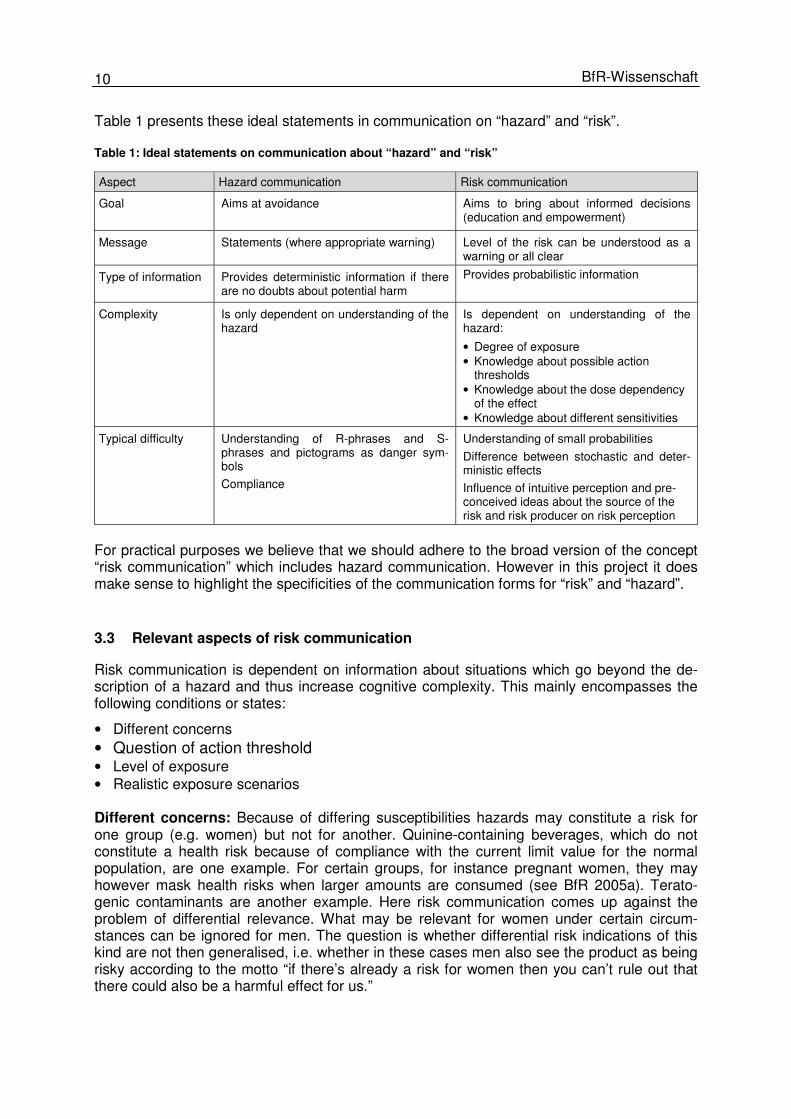
Table 1 presents these ideal statements in communication on “hazard” and “risk”. Table 1: Ideal statements on communication about “hazard” and “risk”
Aspect Hazard communication Risk communication
Goal Aims at avoidance Aims to bring about informed decisions (education and empowerment)
Message Statements (where appropriate warning) Level of the risk can be understood as a warning or all clear
Type of information
Provides deterministic information if there are no doubts about potential harm
Provides probabilistic information
Complexity Is only dependent on understanding of the hazard
Is dependent on understanding of the hazard:
• Degree of exposure • Knowledge about possible action
thresholds • Knowledge about the dose dependency
of the effect • Knowledge about different sensitivities
Typical difficulty Understanding of R-phrases and S-phrases and pictograms as danger sym-bols
Compliance
Understanding of small probabilities
Difference between stochastic and deter-ministic effects
Influence of intuitive perception and pre-conceived ideas about the source of the risk and risk producer on risk perception
For practical purposes we believe that we should adhere to the broad version of the concept “risk communication” which includes hazard communication. However in this project it does make sense to highlight the specificities of the communication forms for “risk” and “hazard”. 3.3 Relevant aspects of risk communication
Risk communication is dependent on information about situations which go beyond the de-scription of a hazard and thus increase cognitive complexity. This mainly encompasses the following conditions or states:
• Different concerns • Question of action threshold • Level of exposure • Realistic exposure scenarios Different concerns: Because of differing susceptibilities hazards may constitute a risk for one group (e.g. women) but not for another. Quinine-containing beverages, which do not constitute a health risk because of compliance with the current limit value for the normal population, are one example. For certain groups, for instance pregnant women, they may however mask health risks when larger amounts are consumed (see BfR 2005a). Terato-genic contaminants are another example. Here risk communication comes up against the problem of differential relevance. What may be relevant for women under certain circum-stances can be ignored for men. The question is whether differential risk indications of this kind are not then generalised, i.e. whether in these cases men also see the product as being risky according to the motto “if there’s already a risk for women then you can’t rule out that there could also be a harmful effect for us.”

11 BfR-Wissenschaft
Action threshold: For risk communication about substances with an action threshold3 the problem initially involves making it clear that a substance only constitutes a hazard when the action threshold has been exceeded. This means that the message must be conveyed that, even in the case of exposure to the substance, there is no risk so long as the action thresh-old is not exceeded. Now thresholds for harmful effects are nothing unusual in every day experience (for example, effect of heat). Hence one could expect that the threshold value problem is understood intuitively, too. It would have to be examined whether this is really the case. For risk communication about substances with no action threshold it is about making clear what it means when exposure only leads to health damage with a probability that is proportional to its exposure. Particularly when this probability is very small, people are likely to find this difficult to understand. In risk communication practice the problem of the action threshold mainly crops up in con-junction with explaining the meaning of limit values. Up to now there has not been sufficient empirical clarification of whether limit values are correctly understood by lay persons or whether they are deemed to be relevant for risk assessment. Level of exposure: The transition from hazard to risk communication can become a problem when the meaning of exposure for the risk is not taken into account and the threat is then estimated solely on the basis of the existence of a hazard. This can lead to fears although one’s own exposure and, by extension, the risks are unclear.4 This problem is exacerbated by the fact that exposure data for the population, which can be used as approximate values for one’s own exposure, can frequently only be determined in an inexact manner or are miss-ing altogether. Then it makes sense when assessing the risk to look at the hazard and to leave aside the aspect of the (unknown) exposure. Particularly for risk communication on substances with no action threshold, understanding of the dose- response relationship is important. Here the focus is on the problem that even the smallest exposure to carcinogenic substances can still cause cancer with a (correspondingly low) probability. Realistic exposure scenarios: Information about exposure is not trivial. The question of combined effect is a critical one. After all consumers are confronted with a hotchpotch of substances and preparations5. Hence combined effects should also be taken into account. Estimating the impact of combined effects is, however, complex and further complicated by the many possible exposure pathways. Reaching a position where one is able to make reli-able statements is a scientific challenge. Another problem is the demarcation of normal, fore-seeable conditions of use from those which are neither normal nor foreseeable. Of course one can define risk communication – from the practical angle – in such a way that it also covers the simple case of mere communication about the hazard. However this opens the door to unclear terms. If a risk is to be characterised – then information must be available about the potential harm but also about other structural associations which are required for risk characterisation. The availability of the information concerned and also the specific communication goals will determine which aspects are placed centre stage. This means that someone who knows about a risk but only communicates the hazard is not doing risk com-munication. But this also implies that risk communication must also cover risk-relevant as-pects in addition to the hazard even if this merely means drawing attention to the gaps in knowledge. Therefore it seems possible to limit the term hazard communication only to the special goal of a warning6 as described above in conjunction with Table 1.
3 Many chemical substances only have an effect from a certain dose. Above this threshold the effect – depending on the dose –
increases. For substances with a threshold-dependent hazard a limit is normally set which – based on the No Observed Effect Level (NOEL) from animal experiments and safety factors – aims to ensure that exposure does not harm health.
4 Like for instance in the case of acrylamide contamination of food. See BfR (2004); Eikmann & Herr (2002); Madle et al. (2003). 5 Here we are not considering the fact that consumers also handle products. 6 This interpretation does not, however, correspond to BfR practice which provides information about the hazard associated with
a substance, or a product within the framework of hazard characterisation and then formulates corresponding recommended actions.

13 BfR-Wissenschaft
4 Status of research on the understanding of “hazard”
4.1 Distinction between “hazard” and “risk”
In the scientific literature there are scarcely any empirical studies that address the question whether lay persons distinguish between “hazard” and risk”. In one piece of work on understanding chemical risks, Sadhra et al. (2002) examine amongst other things whether chemical workers involved in chromium processing distinguish between “hazard” and “risk”. The workers were indeed familiar with the main hazards to which they are exposed but do not distinguish between “hazard” and “risk”. Young, Brelsford and Wogalter (1990) examine the question whether lay persons are able to distinguish between hazard, risk, danger and hazardous-to-use concepts. The test persons evaluated 72 products from daily use (24 chemical substances like for instance bleach, aspi-rin or shampoo). This study examined the association between “hazard” and “risk” evalua-tions for different consumer products. The high, statistically significant correlations between “hazard” and “risk” evaluations (in the range of 0.93 up to 0.96)7 are interpreted as evidence for the fact that “hazard” and “risk” are seen as the same. This is consistent with the findings by Ley (1995). He shows that lay persons are scarcely able to correctly interpret signal words like “hazardous”, “toxic” etc. Other empirical studies address the question about which criteria play a role for distinguish-ing between dangerous and non-dangerous products for daily use (Wogalter et al. 1987a, 1999; Leonard et al. 2000). A series of studies indicate that the severity (seriousness) of the damage to health is the cen-tral factor when assessing the hazardousness of a product (e.g. Young et al. 1990; Wogalter et al. 1987a, 1999). Another important factor when evaluating whether a product is danger-ous or not, is familiarity. A well-known product is generally deemed to be less dangerous than an unknown one (Wogalter et al. 1999, Young et al. 1990, Godfrey et al. 1983). Famili-arity can, therefore, lead a consumer to believe that a product is less dangerous than it really is. A layperson assesses a product as dangerous when it comes with a warning (Wogalter et al. 1999). This means that warnings not only have the function of informing consumers about the hazard but also of reminding him about it again and again (Leonard et al. 2000). 4.2 Efficacy of hazard warnings
Today, there are numerous empirical studies but many of them have methodological short-comings. Furthermore, the random samples examined mostly come from the student popula-tion (see the criticism by von Sattler et al. 1997). One exception is Viscusi who carried out studies with consumers (Viscusi et al. 1986, 1987a) and employees in the chemical industry who come into contact in their working lives with dangerous substances (Viscusi et al. 1984, 1987b).
The available empirical studies examine different means and formats for communi-cating warnings about hazardous chemical substances (written warnings, symbols,
7 However, these correlations are based on the mean values aggregated for the study participants for the various products. This
means that the correlations no longer apply to the individual study participants. Hence the conclusion that the high correla-tions between “hazard“ and “risk” assessments are proof of the same meaning of these two concepts are so say the least questionable.
14 BfR-Wissenschaft
verbal warnings, videos, etc.) and their impact on test persons (e.g. ignore, take note of, follow). In many cases the results of the studies are not particularly surprising:8
• The warning must be placed close to the product for it to be directly linked to it (Frantz 1993, 1994; Strawbridge 1985; Wogalter et al. 1987b, 1993).
• The warning must be noticeable in order to attract the attention of the target group. For instance the interaction between signal words and signal colours on labels was examined The colour red has the highest potential of getting the test person to adopt protective be-haviour (Braun et al. 1994, 1995; Jaynes et al. 1990; Rodriguez 1991; Silver et al. 1991; Wogalter et al. 1987b; Dunlap et al. 1986). Braun et al. (1994) show that the signal word “DEADLY” printed in green leads to a lower hazard assessment than when it is printed in red.
• The warning must be informative, comprehensible, legible and may not contain any super-fluous statements (Silver et al. 1991, Wogalter et al. 1987b, Laux et al. 1989, Brelsford et al. 1994). The information content about the risk must correlate with the efficacy of the warning (Viscusi et al. 1987a).
• The warning must clearly outline the serious nature of possible harm (Wogalter et al. 1987b, 1999; Dingus et al. 1993). As the severity/seriousness of health damage is obvi-ously a clear predictor of hazard perception, it is recommended that this factor be placed centre stage of communication on chemical hazards. Furthermore, consumers should be informed about practical help when it comes to protection against possible harm (Wogalter et al. 1987a, 1999; Young et al. 1990).
• The willingness to take precautionary measures correlates with the perceived danger of a product. This is shown consistently in diverse studies (Wogalter et al. 1987a, 1999; Young et al. 1990, Friedman 1988, Silver et al. 1991; Godfrey et al. 1983, 1993, Laughery & Brelsford 1993, Donner & Brelsford 1988, Otsubo 1988, LaRue & Cohen 1987, Viscusi et al. 1984, 1986, 1987a,b).
• Social factors like the behaviour of other people in one’s own environment play an impor-tant role when deciding whether to follow a warning or not (Wogalter et al. 1989, 1998, Horst et al. 1993).
• Demographic characteristics also play a role when it comes to following warnings. For instance the study by Laughery & Brelsford (1993) shows that women and older people are more receptive to warnings.
• In stress situations people tend to follow warnings (Magurno & Wogalter 1994).
• Consumers are less willing to observe, read or follow warnings in the case of familiar products (DeJoy 1989, Otsubo 1988). If consumers, however, know that a product is dan-gerous then they exercise caution even when the product label does not contain a warn-ing (Viscusi et al. 1987a).
• The more a person knows about a risk, the more likely that person is to change their risk judgement and the more likely that person is to follow warnings (Viscusi et al. 1984). The authors believe that the shortage of impartial information about risks is the main reason why many awareness-raising campaigns fail. The warning or deterrent component alone cannot change risk perception and does not lead to warnings being followed (Viscusi et al. 1984, 1987b).
• Following a warning must not be linked with a higher outlay for the person concerned whereby outlay here refers both to financial costs and time (Dingus et al. 1993; Wogalter et al. 1987b, 1989, Viscusi et al. 1987a)
8 For more extensive information see Sattler et al. (1997).

15 BfR-Wissenschaft
5 Status of research on the understanding of “risk”
5.1 Attributes of the assessment of “risk”
With reference to risk assessment Balderjahn and Wiedemann (1999) determined the impor-tance of the different attributes for various groups (experts, lay persons, managers and public authority staff). The test persons had to assess a hypothetical environmental risk that was described along assessment criteria which were expressed in various characteristics. There were variations in health impairments, environmental damage and likelihood of damage as well as familiarity with the problem amongst the public at large and the growth in employ-ment. The results of the study show that the importance of the attributes scarcely differed at all in the various groups. The likelihood of damage is the most important decision-making criterion for all groups. Whereas in the case of the public authority staff, one third of the decisions by experts and lay persons can be attributed to this criterion, only one-quarter of decisions by managers can. The second most important attribute are the consequences for humans (ap-proximately 25%) followed by increased attention and the consequences for the environ-ment. Only for the experts are the consequences for the environment slightly more important than the expected growth in employment. The criterion of critical public debate is relatively unimportant. Only managers pay slightly more attention to this criterion. Only minor differences were established regarding the individual attributes. Only experts see cases of cancer as the least acceptable. Otherwise reproduction disorders meet with the lowest level of tolerance. Aside from these differences the preference rankings are compara-ble in the four groups. When it comes to an impact on the environment, damage to the land-scape is the most readily accepted compared with deteriorations in quality of air, drinking water and damage to plants and animals. These latter aspects are weighted differently by the groups but are still relatively close together. What is interesting is the weighting of probabili-ties of the various cases of damage. In contrast to the other groups experts are more willing to accept a likelihood of damage of 1:1.000.000. 5.2 Intuitive Toxicology: Perception of the risks from chemical substances by lay persons
In the 1990s Paul Slovic’s research group examined the intuitive understandings of toxico-logical concepts and situations and compared lay persons’ and experts’ judgements9. The group conducted a series of surveys (Kraus et al. 1992, MacGregor et al. 1999, Mertz et al. 1998, Slovic et al. 1995, 1997) in various countries using the same method (with slight modi-fications in the follow-up studies). Four sets of topics were the starting point for the studies. To this end statements were formulated which experts and lay persons were asked to as-sess. Here are the topics:
• Attitudes towards chemical substances (including statements like for instance, “chemi-cal substances have more positive effects on our health than negative ones” or “ I do eve-rything I can in order to avoid contact with chemical products and substances in my daily life.”
• Attitudes towards reducing the risks from chemical substances (e.g..: “The use of prescription medicines must always be free from risks.”)
9 The judgements of lay persons about hazardous chemical substances are described as intuitive toxicology which are set
against scientific toxicology.
16 BfR-Wissenschaft
• Trust in animal experiments and bacteriological studies (e.g..: “If a scientific study can prove that a chemical substance causes cancer in animals then we can be relatively sure that it also causes cancer in humans.”)
• Dose-response relationship (e.g.: “If someone comes into contact with a toxic chemical substance then he will probably suffer negative health consequences.”)
The studies on intuitive toxicology in the USA, Great Britain and Canada show that lay per-sons see chemical substances as more dangerous than experts (Kraus et al. 1992, Mertz et al. 1998, Slovic et al. 1995, 1997). In contrast to lay persons experts assess chemical sub-stances overall rather positively, and see the risks as being relatively low (with the exception of cigarettes and asbestos) and believe that the regulatory provisions are sufficient (Slovic et al. 1997). Lay persons are more frequently of the opinion that no expense should be spared to ensure the safety of chemical substances: far fewer toxicologists share this opinion. Lay persons show more trust in the safety of natural chemical substances compared with syn-thetic ones. They are more willing to tolerate risks in the case of prescription medicines than experts. Lay persons understand more in the case of prescription medicines that the risk depends on the dose administered. In the case of chemicals there are no such associations. Furthermore, lay persons assess prescription medicines more frequently as less toxic than pesticides. Toxicologists assume more frequently that the risk from medicines depends on the dose and agree more frequently with the statements that a cancer risk of 1 to 10,000,000 is too low in order to be a cause for concern (Kraus et al. 1992). Surprisingly fewer differences were observed between toxicologists and lay persons when it comes to trust in animal experiments and bacteriological studies. As toxicological risk as-sessments draw above all on the results of animal experiments, the assumed hypothesis was that toxicologists – compared with lay persons – will trust more in the power of these studies when it comes to hazard identification (Neil et al. 1994). This hypothesis was not con-firmed: around half of all toxicologists and lay persons believe that reactions by experimental animals to chemical substances did not necessarily point to human reactions. Furthermore, only a minority of toxicologists and lay persons believe that laboratory studies enable predic-tions to be made about the amounts of chemical substances which harm human health (Kraus et al. 1992). Another major difference between lay persons and experts is that far more lay persons be-lieve that statements could be made about the cancer risk in humans on the basis of animal experiments (Kraus et al. 1992, Slovic et al. 1995). It is clear that the assessments by lay persons of animal experiments are not consistent: first of all studies of this kind are estimated rather as being not robust when it comes to human health. In the case of cancer, however, they believe that animal studies are robust. The fear generated by this disease seems to encourage lay persons to trust in an unsuitable (in their opinion) source of evidence. Overall amongst lay persons there is slightly weaker dose-response sensitivity than amongst toxicologists (Kraus et al. 1992, Neil et al. 1994). Lay persons agree far more frequently than toxicologists with the following statements:
• Exposure to a toxic substance probably leads to adverse health effects in humans. • Exposure to a carcinogenic substance probably leads to cancer. • It is not the amount of pesticides but merely the fact of being exposed to a pesticide that
gives cause for concern. • Reducing the concentration of a potentially harmful substance in drinking water would not
reduce the risk to health when drinking this water. • There is no safe exposure level for a carcinogenic agent.

17 BfR-Wissenschaft
When it comes to weighting to dose-response relationship, demographic characteristics play a role. It is shown that older healthy individuals with a higher level of education take into ac-count the dose dependency of effects (Kraus et al. 1992). Furthermore, this understanding is clearly dependent on the content. Lay persons agree more in the case of prescription medi-cines than in the case of chemical substances with the statement that risk depends on the dose ingested. For the assessment of chemical risks the understanding of exposure is of key importance. The results of the study by MacGregor et al. (1999) show that the idea of chemical exposure and its possible health effects is inconsistent amongst lay persons. Firstly, there are very different attitudes towards the importance of exposure in general; secondly opinions are di-vided about what level of exposure can be described as “extremely low”. This shows that the term “exposure” can lead to very different ideas about the magnitude of exposure if no exact explanation is given of the respective context. When examples are given of relatively low exposure to known carcinogens, the vast majority of the test persons (more than 88%) be-lieve that the onset of cancer is unlikely. If, however, they are asked whether there is a threshold value below which no cancer is caused, opinions differ: 50.3% of the respondents share this opinion, 27.5% do not and 22.2% are unable to answer the question (MacGregor et al. 1999). Depending on the question format completely different answers are given. Fig. 1 shows for example some results that document the attitudes towards exposure and the dose-response relationship amongst lay persons. The authors point out that their findings on “intuitive toxicology” have gaps. According to them the results point to an “infection model” (Rozin et al. 1986) which is very different from how toxicologists assess chemical substances (Neil et al. 1994, Slovic et al. 1997). Fig. 1: Intuitive Toxicology – Answers by lay persons (L) and toxicologists (T)
T
L
T
L
T
L
T
L
0 20 40 60 80 100
in Kontakt kommen, ist es wahrscheinlich,
Prozent Ablehnung Zustimmung
(Source: Kraus, Malmfors & Slovic 1992, 217).
In the case of pesticides the decisive factor is not the amount but whether one comes into contact with them. In the case of a carcinogenic substance there is no concentration at which con-tact can be described as harmless. If you come into contact with a carcino-genic substance, it is likely that you will get cancer. If you come into contact with a toxic chemical, it is likely that you will become sick.
Percent Disagree
Agree
18 BfR-Wissenschaft
5.3 Difficulties in understanding risk communication
For many years the difficulties involved in communicating risks have been the subject of re-search (see also Wiedemann & Schütz 2006). It mainly focuses on the following aspects: Importance of probability statements: The importance of probability statements is not al-ways clear – particularly as the term “probability” itself is interpreted in various ways by sci-entists (e.g. Gigerenzer, Swijtink & Porter 1998; Smithson 1989). It is true that probability statements are present in everyday life – for instance in weather reports where the probabil-ity that it will rain tomorrow is given as 75%. But what does that really mean? Does it mean that it will rain in 75% of the area concerned? Or that it will rain tomorrow for 18 hours (i.e. 75% of the time)? Or that it will rain on 75% of the days on which weather conditions like tomorrows prevail (cf. Murphy et al. 1980)? There is a similar situation when a doctor tells his patient that there is a 30% probability that a medicine will have a certain side effect. What he means is that the side effect can be expected in 3 out of 10 patients who take the medicine. The patient, by contrast, may understand this quite differently – that he will suffer from side effects roughly 30% of the time during which he takes the medicine (cf. Gigerenzer 2002, 14f.). It is not always clear to which class of event probability statements refer. Problems with low probabilities: Frequently the probability of damage to health is very low. For instance in Germany the probability of dying from flu is roughly p = 10-6 or 1:1,000,000 (Health report of the Federal Government 2004).10 Many people find it difficult to interpret small probabilities in a meaningful way and to distinguish between the orders of magnitude of very small probabilities (e.g. 10-6 vs. 10-5) (Camerer & Kunreuther 1989; Magat, Viscusi & Huber 1987). This is not particularly surprising because these orders of magnitude are out-side normal human experience. Understanding of qualitative probability statements: Verbal probability details are often seen as “vague” by lay persons (cf. Budescu and Wallsten 1985; 1995, Fillenbaum, Wallsten, Cohen & Cox 1991; Wallsten, Budescu, Rapoport, Zwick & Forsyth 1986; Zimmer 1983). Furthermore, their interpretation is clearly easily influenced by the context. Contextual effects on the numerical interpretation of verbal descriptions of probability like, for instance, “a few”, “some”, “many” or of frequency like, for instance, “rare” have been observed in a series of studies (Beyth-Marom 1982; Brun & Teigen 1988; Budescu & Walsten 1985; Fillenbaum, Wallsten, Cohen & Cox 1991; Gonzales & Frenck-Mestre 1993; Hamm 1991; Teigen 1988; Weber & Hilton 1990). Verbal expressions may influence assessments in a subtle way (cf. Budescu & Wallsten 1995; Moxey & Sanford 1993; Champaud & Bassano 1987). There are for instance expres-sions which highlight the presence of an event like for instance “probable” or “possibly” and others that stress the non-presence like for instance “doubtful” (cf. Teigen & Brun 1999; 2000). Reinterpretation of quantitative probabilities: Under certain circumstances it must be born in mind that (above all quantitative) risk characterisations may be “recoded” dichotomously. Lippman-Hand and Fraser (1979) showed, for instance, that many people who were given quantitative probability details about the occurrence of a genetic defect within the framework of genetic counselling tend to translate this into “either or” categories. Similar observations can be made for technology or environmental risks. Frequently the persons concerned are not interested in the question about how large or small a probability is that they will develop health impairments but rather whether there is that possibility or not (Van der Pligt & De Boer 1991).
10 Fatalities per 100,000 inhabitants (from 1998, region, age, gender, ICD-10): J11 flu (On the internet under: http://www.gbe-
bund.de/)
19 BfR-Wissenschaft
Difficulties with the “relative risk”: Stone, Yates and Parker (1994) found that risk informa-tion when presented as relative risks (e.g. doubling of the risk) exerted more of an influence on judgement than a description of the incidence rate. This applies above all to very small probabilities. For instance extremely low incidence rates are perceived as “almost zero” whereas this is not the case when the relative risk is mentioned. In the experiments by Stone, Yates and Parker (1994) people are willing to pay more for their safety when the risk reduction is presented in a relative manner in comparison to a depiction using the frequency rate. The results by Magat, Viscusi and Huber go in the same direction (1987). Halpern, Blackman and Salzman (1989) observed that the depiction of probability as a rela-tive risk led to an increase in the risk assessment compared to a depiction of the same prob-ability with the help of the incidence of fatalities. Hapern et al. explained this difference by saying that the respondents who were familiar with the frequency or absolute number of fa-talities rate the risk differently because of knowledge about the basic rate (i.e. the basic fre-quency). Understanding of quantitative risk details: Purchase and Slovic (1999) show that the dif-ferent depiction of a risk assessment for a risk of the same numerical size leads to differing risk perception depending on whether the assessment is presented as a threshold or non-threshold assessment. In their experimental study the authors varied the depiction of risk from carcinogenic substances in food. On the one hand the cancer risk was depicted as 1 to 100,000 (non-threshold model), in another as the 100,000 fold exceeding of the correspond-ing NOAEL in animal experiments (NOAEL + safety factor). Although in this constructed ex-ample the two sets of information correspond in arithmetic terms, the depiction as a non-threshold model led to a higher risk perception – not just amongst lay persons but also amongst experts. Understanding of lack of clarity and uncertainty: Empirical studies show that discussion of uncertainties in conjunction with information about risks is often not understood by the recipients. Furthermore it leads to contrary assessments. In some cases it increases trust in the source of information but in others it is also seen as a sign of incompetence and lack of honesty (cf. Johnson & Slovic, 1995). Inconsistent findings (Bord & O´Connor 1992, McGregor et al. 1994, Kuhn 2000) are available concerning the influence of risk perception or concern. In another study on the perception and assessment of uncertainty in risk evalua-tions Johnson and Slovic (1998) observed that when confidence intervals are evaluated the upper limit was seen as the most credible estimated value. Viscusi (1997) observed a similar situation. Furthermore, the cause of uncertainty is not seen in the nature of the matter itself but is rather attributed in most cases to social factors (in particular to one’s own interests and the perceived incompetence of experts). Majority opinions are not seen as a convincing ar-gument either; the test persons mostly believed the worst case even if this was only depicted by one individual. Johnson (2003) shows in another study that the majority of respondents prefer a simple assessment (“Is it safe?”) compared to details of uncertainty which are nor-mally not understood either. When asked why experts indicate uncertainties about their risk assessments, the tests persons tended more towards negative explanations (inadequate knowledge, intention to mislead etc.). Kuhn (2000) observes that the interpretation of uncertainty details depends on preconceived ideas and the way in which the uncertainty is depicted. If, for instance, individuals are gener-ally classified as concerned about risk, then they tend to believe more a worst case estimate of the risk by a group of critics and not the more favourable assessment by a public authority. That is why they have a higher risk assessment compared with people who are less con-cerned. This group difference could not be observed when the uncertainties are expressed as a confidence interval or purely verbally i.e. when there are no details about the respective sources. To put this more simply: when people discover information about the risk assessors, they believe the ones they trust.

20 BfR-Wissenschaft
Interpretation of limit values: Johnson and Chess (2003) show that reference to compli-ance with limit values is only effective to a limited degree when it comes to calming risk fears. Whether this has to do with a lack of understanding of limit values or the procedures used to set limits or a lack of confidence in the institutes carrying out the assessments is not clear.

21 BfR-Wissenschaft
6 Workshop discussions – summary and results
Within the framework of the project two workshops were staged with experts from the Fed-eral Institute for Risk Assessment (BfR) as well as a stakeholder workshop. Furthermore, an expert meeting was held on the topic “Acidic food and dental health” with experts from dental medicine which was conducted formally as an independent project. In terms of content it is nonetheless part of this project.11 1. Internal BfR workshop on the problem of communication on “hazard” and “risk”. The workshop was held in Berlin on 15 November 2005. Discussions focussed on the com-prehensible conveying of the difference between “hazard” and “risk” as a precondition to successful risk communication with consumers, and misunderstandings resulting from confu-sion about the concepts “hazard” and “risk”. 2. Stakeholder workshop on the topic: The difference between “hazard” and “risk” – a problem for risk communication? The workshop was held on Berlin on 27 March 2006. The workshop was attended by representatives of institutions which deal with “hazard” and “risk” communication. The discussions aimed to determine whether and to what extent the distinction between “hazard” and “risk” constituted a problem for BfR risk communication and how to tackle this problem. 3. Final internal BfR workshop. The workshop was staged in Berlin on 5 April 2006. The differences between “hazard” and “risk” communication were discussed. Other topics of dis-cussion were the results of the analysis of the online BfR opinions (cf. also Chapter 7) carried out by the Research Centre Jülich, Research area humans, environment, technology (MUT), the planned experiment on the question of the distinction between “hazard” and “risk” by lay persons, and the expert models on “hazard” and “risk”. The main areas of discussion and the most important results of the workshop are presented below. This means that very different opinions and convictions of the workshop participants are represented here which may also contradict each other. 6.1 Challenges facing successful risk communication
In a first workshop four case studies from the BfR risk communication practice were used to depict some comprehension problems arising from the mixing of the terms “risk” and “haz-ard” in communication. For the case study hair dye12 no “hazard” has been identified up to now; in the public media debate, however, hair dyes are already presented as a risk. BfR has the difficult task of communicating non-validated technical knowledge in a fair and compre-hensible manner. For the case study quinine-containing beverages13 “hazard” and “risk” have been identified and information about the risk must be communicated. The challenge for BfR involves finding ways and means of reaching groups in the population for whom the quinine-containing beverages are a risk factor (e.g. pregnant women). For the case study rat poison there is a clearly identifiable hazard and a negligible low risk. The distinction between “hazard” and “risk” is relevant here in principle but not so important for communication be-cause the product is not freely available. BfR, therefore, has the difficult task of communicat-ing the fact that the product is being withdrawn from the market only because of the hazard it constitutes. The case study citric acid14 is a clearly identified hazard; whether or not it leads to a risk depends on the amount, duration and frequency of exposure. The challenge for risk
11 Cf. also UMID 2, 2007, p. 8-11, “Acidic food and dental hygiene, results of an expert workshop”. 12 Hair dyes under close scrutiny: Their regulation on the European level, BfR opinion, 14 September 2004 13 Quinine-containing beverages can be problematic for health. BfR Health Assessment No. 022/2005, 17 February 2005 14 High levels of citric acid in confectionary and beverages increase the risk of dental damage. Updated BfR Opinion No.
006/2005, 9 January 2004.

22 BfR-Wissenschaft
communication is that although the risk from acids is rather low and easily avoidable, the hazard must be discussed as the population is scarcely aware about the hazard of acids for dental health. The scientific risk assessment of a substance or product by BfR and the information for con-sumers are processed differently because of the varying level of knowledge amongst the recipients. According to the experience of BfR staff, a consumer does not always understand BfR information as he merely expects clear recommendations about the risk from a public institution. A public institution must, however, disclose the scientific evidence for its assess-ments in order to avoid any doubts about its competence and credibility. Some aspects of risk assessment are not easily comprehensible for lay persons, e.g. probable occurrence of a risk, uncertainties in the overall assessment (above all because exposure as a rule can “only” be estimated because of missing data). It is almost impossible to communicate to lay per-sons the different interpretations of study results by toxicologists. In some cases the hazard can (still) not be characterised (like the case study hair dyes). At the same time it is common knowledge that the population is exposed to it. Despite the uncertainties BfR is obliged to communicate about this because a public institution cannot wait to act until all uncertainties about a dangerous substance have been removed. The handling of uncertainties and the exact determination of the evidence level about a dangerous substance are very important aspects of BfR’s work. According to the Equipment and Product Safety Act, only manufactur-ers, importers and regional public authorities may issue warnings but not federal public au-thorities. As a public institution BfR must initially determine in its risk assessment whether a limit value has been exceeded. In contrast to Stiftung Warentest, which tests individual products - even when the dangerous substance contained therein is below the standard - BfR is not empow-ered to propose protective measures against exposures to a substance if exposure is below the standard. Furthermore, there are several standards for some substances (e.g. copper). This is an additional obstacle to communication. It is not the task of BfR to determine which standard is “the right one”. It merely has to communicate the fact that there are various stan-dards. The workshops also looked at social aspects that impede risk communication by BfR and which BfR cannot influence. One of these challenges is the widespread negative attitude towards chemicals amongst the public at large. This is expressed above all in the rejection of additives in food which are associated with a negatively viewed concept chemicals. The mass media, the main source of information for consumers, are partly responsible for the appearance and spread of these attitudes, fears and misunderstandings in conjunction with risk communication. As a rule the media are not interested in any separation between hazard and risk communication because if they were to take a comprehensive look at the risk, in many cases it would probably turn out to be too low to be worth reporting on. Negative attitudes fuelled by the media amongst the public at large are, in principle, a chal-lenge to the publishing of scientific arguments about an assessed product/substance. In these cases there are mixed messages: for instance attention is drawn to the low risk but, at the same time, it is recommended that the food named should only be consumed in modera-tion. This may lead to the impression amongst consumers that these statements contradict the media reports. Another challenge involves the fact that the guaranteeing of product safety is the responsibil-ity of manufacturers. In order to protect themselves from a situation in which use of the prod-uct has negative consequences, manufacturers frequently also warn about risks whose oc-currence is unlikely. This excessive labelling does not help consumers to realistically assess the risk to themselves. Furthermore, the excessive labelling on products means that any warnings about really dangerous products are taken less seriously.

23 BfR-Wissenschaft
6.2 (When) is hazard communication sufficient?
Many participants in the stakeholder workshop tended towards the opinion that hazard com-munication is more important than risk communication. This was based on the argument that the goal of risk communication - an informed decision - can also be achieved with hazard information. As consumers already rely on the health safety of approved products, the label-ling of a product as “dangerous” is helpful when making a purchasing decision. As a rule, consumers decide not to purchase a product because of the fact that it contains a dangerous substance (hazard information) and not because it contains so much of a dangerous sub-stance (risk information). Hence hazard information is often sufficient for a purchasing deci-sion. Frequently, a hazard becomes a risk because of incorrect use of the product. In these cases it is important to provide information about the proper handling of a product in hazard com-munication. What is particularly problematic here is the fact that consumers sometimes be-lieve that they are handling a dangerous product like, for instance, rat poison correctly but are not aware of the concrete dangers – also because they are rarely discussed in the me-dia. The participants agreed that hazard communication suffices when it can lead to the avoid-ance of exposure. Of course, consumers must have an opportunity to decide about avoiding exposure. 6.3 When is hazard communication not sufficient?
Hazard designations like “genotoxic” or “carcinogenic” do not say anything about the actual risk as they do not provide any information about actual exposure. Whether the risk in a con-crete case is very high or low cannot be determined from the hazard information. The research findings available about many substances used in foods are relatively contra-dictory. Nevertheless, scientists make dietary recommendations without discussing the un-certainties in risk assessment. Hence the workshop participants indicated that these uncer-tainties should also be pointed out. When it comes to distinguishing between “hazard” and “risk” it should be noted that some of the participants in the stakeholder workshop were initially sceptical about whether it makes sense and it us even possible to separate the two terms “hazard” and “risk”. The prevailing opinion was that communication should focus on the hazard as it was more useful as a deci-sion making aid than the risk. In the discussions, however, arguments were also advanced that when explaining many dangers, hazard information does not suffice as an aid for the correct assessment by an individual of how it affects him/her or for the choosing the right course of action. 6.4 The BfR risk communication model
The distinction between “hazard” and “risk” is always relevant for BfR communication. The decision about possible risk communication goals should be based on precise risk charac-terisation. If at all possible information should, therefore, be provided about the risk as well. Hazard information is only then sufficient when no data are available about exposure. In communication it must, however, be made clear that this is also a risk assessment. Hence in BfR’s awareness-raising activities vis-à-vis consumers, risk assessment plays a central and hazard information a secondary role.
24 BfR-Wissenschaft
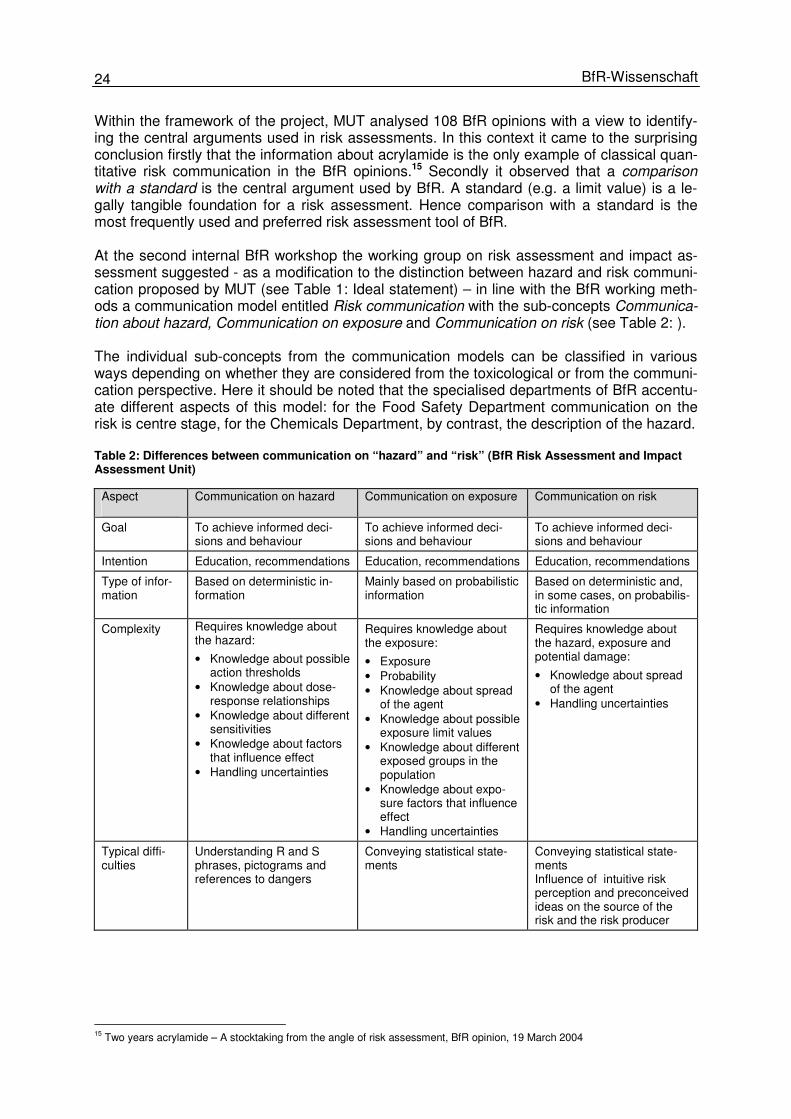
Within the framework of the project, MUT analysed 108 BfR opinions with a view to identify-ing the central arguments used in risk assessments. In this context it came to the surprising conclusion firstly that the information about acrylamide is the only example of classical quan-titative risk communication in the BfR opinions.15 Secondly it observed that a comparison with a standard is the central argument used by BfR. A standard (e.g. a limit value) is a le-gally tangible foundation for a risk assessment. Hence comparison with a standard is the most frequently used and preferred risk assessment tool of BfR. At the second internal BfR workshop the working group on risk assessment and impact as-sessment suggested - as a modification to the distinction between hazard and risk communi-cation proposed by MUT (see Table 1: Ideal statement) – in line with the BfR working meth-ods a communication model entitled Risk communication with the sub-concepts Communica-tion about hazard, Communication on exposure and Communication on risk (see Table 2: ). The individual sub-concepts from the communication models can be classified in various ways depending on whether they are considered from the toxicological or from the communi-cation perspective. Here it should be noted that the specialised departments of BfR accentu-ate different aspects of this model: for the Food Safety Department communication on the risk is centre stage, for the Chemicals Department, by contrast, the description of the hazard. Table 2: Differences between communication on “hazard” and “risk” (BfR Risk Assessment and Impact Assessment Unit)
Aspect
Communication on hazard Communication on exposure Communication on risk
Goal To achieve informed deci-sions and behaviour
To achieve informed deci-sions and behaviour
To achieve informed deci-sions and behaviour
Intention Education, recommendations Education, recommendations Education, recommendations
Type of infor-mation
Based on deterministic in-formation
Mainly based on probabilistic information
Based on deterministic and, in some cases, on probabilis-tic information
Complexity Requires knowledge about the hazard:
• Knowledge about possible action thresholds
• Knowledge about dose-response relationships
• Knowledge about different sensitivities
• Knowledge about factors that influence effect
• Handling uncertainties
Requires knowledge about the exposure:
• Exposure • Probability • Knowledge about spread
of the agent • Knowledge about possible
exposure limit values • Knowledge about different
exposed groups in the population
• Knowledge about expo-sure factors that influence effect
• Handling uncertainties
Requires knowledge about the hazard, exposure and potential damage:
• Knowledge about spread of the agent
• Handling uncertainties
Typical diffi-culties
Understanding R and S phrases, pictograms and references to dangers
Conveying statistical state-ments
Conveying statistical state-ments Influence of intuitive risk perception and preconceived ideas on the source of the risk and the risk producer
15 Two years acrylamide – A stocktaking from the angle of risk assessment, BfR opinion, 19 March 2004
25 BfR-Wissenschaft
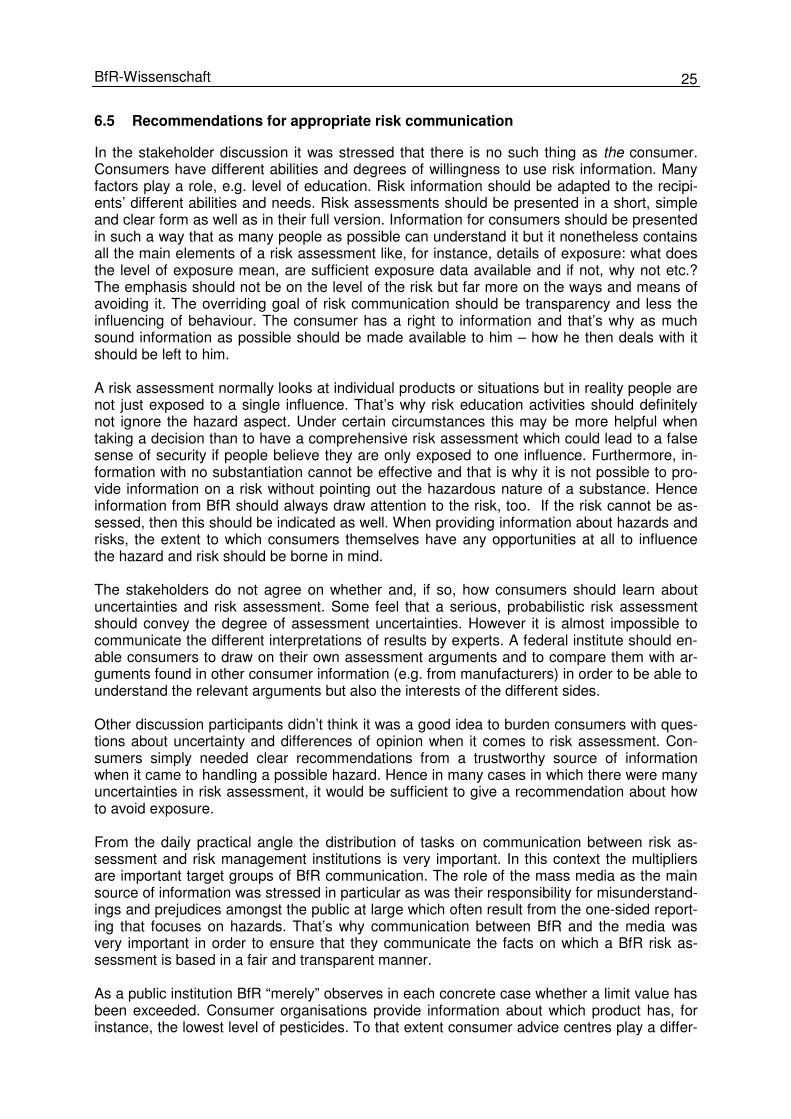
6.5 Recommendations for appropriate risk communication
In the stakeholder discussion it was stressed that there is no such thing as the consumer. Consumers have different abilities and degrees of willingness to use risk information. Many factors play a role, e.g. level of education. Risk information should be adapted to the recipi-ents’ different abilities and needs. Risk assessments should be presented in a short, simple and clear form as well as in their full version. Information for consumers should be presented in such a way that as many people as possible can understand it but it nonetheless contains all the main elements of a risk assessment like, for instance, details of exposure: what does the level of exposure mean, are sufficient exposure data available and if not, why not etc.? The emphasis should not be on the level of the risk but far more on the ways and means of avoiding it. The overriding goal of risk communication should be transparency and less the influencing of behaviour. The consumer has a right to information and that’s why as much sound information as possible should be made available to him – how he then deals with it should be left to him. A risk assessment normally looks at individual products or situations but in reality people are not just exposed to a single influence. That’s why risk education activities should definitely not ignore the hazard aspect. Under certain circumstances this may be more helpful when taking a decision than to have a comprehensive risk assessment which could lead to a false sense of security if people believe they are only exposed to one influence. Furthermore, in-formation with no substantiation cannot be effective and that is why it is not possible to pro-vide information on a risk without pointing out the hazardous nature of a substance. Hence information from BfR should always draw attention to the risk, too. If the risk cannot be as-sessed, then this should be indicated as well. When providing information about hazards and risks, the extent to which consumers themselves have any opportunities at all to influence the hazard and risk should be borne in mind. The stakeholders do not agree on whether and, if so, how consumers should learn about uncertainties and risk assessment. Some feel that a serious, probabilistic risk assessment should convey the degree of assessment uncertainties. However it is almost impossible to communicate the different interpretations of results by experts. A federal institute should en-able consumers to draw on their own assessment arguments and to compare them with ar-guments found in other consumer information (e.g. from manufacturers) in order to be able to understand the relevant arguments but also the interests of the different sides. Other discussion participants didn’t think it was a good idea to burden consumers with ques-tions about uncertainty and differences of opinion when it comes to risk assessment. Con-sumers simply needed clear recommendations from a trustworthy source of information when it came to handling a possible hazard. Hence in many cases in which there were many uncertainties in risk assessment, it would be sufficient to give a recommendation about how to avoid exposure. From the daily practical angle the distribution of tasks on communication between risk as-sessment and risk management institutions is very important. In this context the multipliers are important target groups of BfR communication. The role of the mass media as the main source of information was stressed in particular as was their responsibility for misunderstand-ings and prejudices amongst the public at large which often result from the one-sided report-ing that focuses on hazards. That’s why communication between BfR and the media was very important in order to ensure that they communicate the facts on which a BfR risk as-sessment is based in a fair and transparent manner. As a public institution BfR “merely” observes in each concrete case whether a limit value has been exceeded. Consumer organisations provide information about which product has, for instance, the lowest level of pesticides. To that extent consumer advice centres play a differ-

26 BfR-Wissenschaft
ent role as contacts for the non-informed citizen from that of BfR. Hence, consumer advice centres are also a very important target group for communication by BfR. 6.6 Recommendations for general communication on risks
The stakeholders do not believe it is realistic to build on citizens’ “risk maturity” when it comes to risk communication. The PISA study16 identified an unsettlingly high degree of “conceptual illiteracy”. An understanding of the concepts and terms is, however, the main precondition for risk information being understood. Hence educational institutions must be involved to a greater degree in the conveying of risk information. Good teacher training plays a key role here. As hazards frequently only become risks because of the incorrect use of substances or products, it makes sense to offer risk communication that emphasises the need for correct behaviour in general education and through the media (e.g. Stiftung War-entest). Finally, the multipliers of risk information and scientists must also show “risk maturity”, i.e. they must realistically estimate the reach of their risk expertise and show reticence when it comes to hasty practical recommendations. 6.7 Suggestions for future research
A proposal was made to test how the different argumentation figures, which are to be found in the BfR opinions, are taken on board by consumers and to identify the best way of pre-senting risk information in a comprehensible manner to lay persons. The development of a scientific approach to structured risk communication would be an in-teresting next step for this project, too.
16 Programme for the international assessment of pupils
27 BfR-Wissenschaft
7 Experiments on differentiation between “hazard” and “risk”
Information is provided below about an experimental study which aims to determine whether lay persons distinguish between the concepts “hazard” and “risk” and, if they do, to establish which cognitive characteristics they use to define these concepts. 7.1 Methodological approach
The goal of the experimental study is to examine whether lay persons distinguish between “hazard” and “risk”. The only study so far which has examined this question (Young, Brels-ford & Wogalter 1990) came to the conclusion that lay persons do not see any difference between these two terms as there was a high degree of correlation in their study between hazard and risk assessments (in the range of 0.93 to 0.96). Although high correlations are in principle a good indicator for the similarity of concepts, they are not suitable for the question in hand. This is because there is a logical association between the assessment of a hazard and that of a risk which renders questionable the interpretations of correlations. If a risk is estimated as large, then the hazard must be large too. A high correlation between “hazard” and “risk” assessment cannot, therefore, only be attributable to the fact that no distinction is made between “hazard” and “risk”; it can also result from the technically correct considera-tions. Hence in the study into whether lay persons distinguish between “hazard” and “risk” a differ-ent approach was selected: the method of “information tracking”. With this method an analy-sis can be undertaken of the information which people use when they have to make a judgement (e.g. give an assessment or take a decision). This approach has mainly been used up to now in studies on decision-making processes in which it was not only about establishing which decisions people take (and whether they are reconcilable with a normative decision-making model) but also about how they come to these decisions (process tracking; cf. Harte & Koele 1997; Payne 1976; Payne, Bettman & John-son 1993). Here it is assumed that the type of information search, i.e. the selection of infor-mation on offer and the information search patterns, provide insight into what information is deemed important, e.g. in respect of a decision to be made or an assessment. This assump-tion also applies to our case. If one offers different types of information, which are relevant for the assessment of a hazard and information which is relevant for the assessment of a risk, then questions about the information and the assessment of its relevance can provide insight into whether people distinguish between “hazard” and “risk”. Workshops with experts from BfR and from the field of dental health sought to identify the expert models on “hazard” and “risk”. In parallel a pre-test looked at whether the information tracking approach is, in principle, suitable in the context of “hazard” and “risk” assessments. Based on knowledge from the pre-test, the actual experiment was then carried out. 7.2 Expert model on “hazard” and “risk”
Based on the Mental Model approach17 four case studies (hair dye, quinine-containing bev-erages, rat poison and citric acid) were discussed with BfR experts (internal BfR workshop, 15 November 2005) in order to identify the relevant aspects for the distinction between “haz-ard” and “risk”. Two weeks later, on 28 November 2005, the case study citric acid was exam-ined in depth by MUT at the expert meeting “Acidic food and dental hygiene” staged on be-
17 Cf. Morgan, M.G., Fischhoff, B., Bostrom, A. & Atman, C.J. (2002): Risk communication: A mental models approach. New
York, NY, US: Cambridge University Press.
28 BfR-Wissenschaft
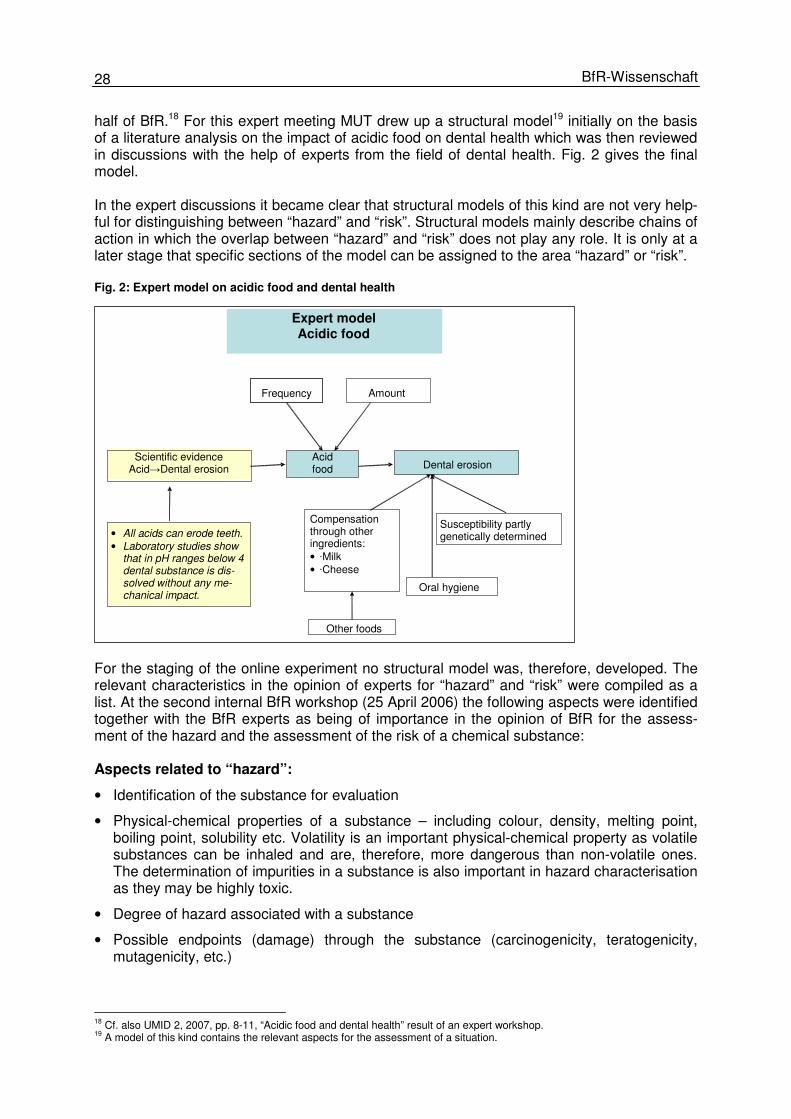
half of BfR.18 For this expert meeting MUT drew up a structural model19 initially on the basis of a literature analysis on the impact of acidic food on dental health which was then reviewed in discussions with the help of experts from the field of dental health. Fig. 2 gives the final model. In the expert discussions it became clear that structural models of this kind are not very help-ful for distinguishing between “hazard” and “risk”. Structural models mainly describe chains of action in which the overlap between “hazard” and “risk” does not play any role. It is only at a later stage that specific sections of the model can be assigned to the area “hazard” or “risk”. Fig. 2: Expert model on acidic food and dental health
For the staging of the online experiment no structural model was, therefore, developed. The relevant characteristics in the opinion of experts for “hazard” and “risk” were compiled as a list. At the second internal BfR workshop (25 April 2006) the following aspects were identified together with the BfR experts as being of importance in the opinion of BfR for the assess-ment of the hazard and the assessment of the risk of a chemical substance: Aspects related to “hazard”:
• Identification of the substance for evaluation
• Physical-chemical properties of a substance – including colour, density, melting point, boiling point, solubility etc. Volatility is an important physical-chemical property as volatile substances can be inhaled and are, therefore, more dangerous than non-volatile ones. The determination of impurities in a substance is also important in hazard characterisation as they may be highly toxic.
• Degree of hazard associated with a substance
• Possible endpoints (damage) through the substance (carcinogenicity, teratogenicity, mutagenicity, etc.)
18 Cf. also UMID 2, 2007, pp. 8-11, “Acidic food and dental health” result of an expert workshop. 19 A model of this kind contains the relevant aspects for the assessment of a situation.
Acid food
Oral hygiene
Compensation through other ingredients: • ·Milk • ·Cheese
Dental erosion
Other foods
Frequency Amount
Scientific evidence Acid→Dental erosion
Expert model Acidic food
• All acids can erode teeth. • Laboratory studies show
that in pH ranges below 4 dental substance is dis-solved without any me-chanical impact.
Susceptibility partly genetically determined
29 BfR-Wissenschaft
• Database: how reliable are the available scientific data? How many studies have been conducted? Are there studies in humans or in animals (problem of extrapolation)?
• Level from which the substance is harmful for man
• Behaviour of the substance in the body: accumulation and breakdown (aspects of toxico-dynamics and toxicokinetics)
• Classification and labelling of a substance on the basis of EU criteria
• Uncertainties in the assessment (e.g. extrapolation of animal models to humans)
Aspects related to “risk”:
• Exposure - Presence of exposure - Exposure pathways - Frequency of exposure - Length of exposure
• Level of risk • Individual susceptibility (vulnerability) • Summary risk assessment • Uncertainties in assessment (above all when estimating exposure) The aspects related to “hazard” and the aspects related to “risk” are the foundation for the selection of the information statements in the online experiment. The discussions revealed that the different examples do differ in certain ways, for instance with reference to the scientific knowledge or risk management. However there are no major differences concerning the distinction between hazard and risk. It is always about certain, constitutive characteristics of the concepts “hazard” and “risk”. For the online experiment one single case study was, therefore, selected. The staging of the experiment with four different case studies would have made it far more complicated without supplying any additional in-formation. 7.3 Pre-test
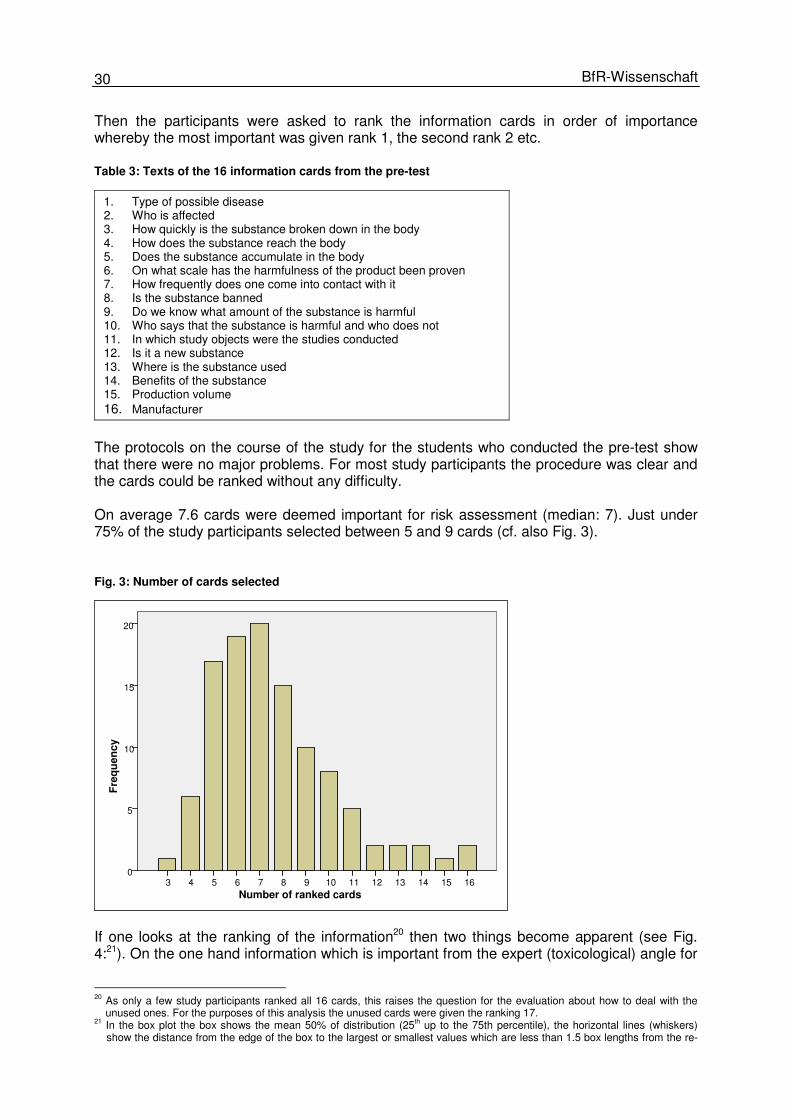
In the autumn of 2005 the viability of the information tracking approach was examined in a pre-test. The main interest focussed on whether the study participants understand the proce-dure, can implement it without any major difficulties and whether the data permits valid con-clusions about conceptual structures. The pre-test was conducted by psychology students at the University of Innsbruck. They re-cruited people from their social environment as study participants. A total of 110 people aged between 14 and 84 (mean: 32 years of age) took part in the pre-test. 52% of the participants were male, 48% female. 45% of the participants were students, 20% employees/civil ser-vants. A further 23% were active in the service sector (e.g. teaching, medicine), the remain-ing 15% were housewives, pupils, old age pensioners or self-employed. The study participants were told that it involved the risk assessment of chemical substances. They were then given 16 information cards with various aspects which are relevant or irrele-vant for risk assessment (see Table 3). They were asked which information they used to as-sess the risk of a chemical substance. The study participants were then asked first of all to select the cards which in their opinion were important. The unselected cards were laid aside.
30 BfR-Wissenschaft
Then the participants were asked to rank the information cards in order of importance whereby the most important was given rank 1, the second rank 2 etc. Table 3: Texts of the 16 information cards from the pre-test
1. Type of possible disease 2. Who is affected 3. How quickly is the substance broken down in the body 4. How does the substance reach the body 5. Does the substance accumulate in the body 6. On what scale has the harmfulness of the product been proven 7. How frequently does one come into contact with it 8. Is the substance banned 9. Do we know what amount of the substance is harmful 10. Who says that the substance is harmful and who does not 11. In which study objects were the studies conducted 12. Is it a new substance 13. Where is the substance used 14. Benefits of the substance 15. Production volume 16. Manufacturer
The protocols on the course of the study for the students who conducted the pre-test show that there were no major problems. For most study participants the procedure was clear and the cards could be ranked without any difficulty. On average 7.6 cards were deemed important for risk assessment (median: 7). Just under 75% of the study participants selected between 5 and 9 cards (cf. also Fig. 3). Fig. 3: Number of cards selected
If one looks at the ranking of the information20 then two things become apparent (see Fig. 4:21). On the one hand information which is important from the expert (toxicological) angle for
20 As only a few study participants ranked all 16 cards, this raises the question for the evaluation about how to deal with the
unused ones. For the purposes of this analysis the unused cards were given the ranking 17. 21 In the box plot the box shows the mean 50% of distribution (25th up to the 75th percentile), the horizontal lines (whiskers)
show the distance from the edge of the box to the largest or smallest values which are less than 1.5 box lengths from the re-
16 15 14 13 12 11 10 9 8 7 6 5 4 3 Number of ranked cards
20
15
10
5
0
Fre
qu
en
cy
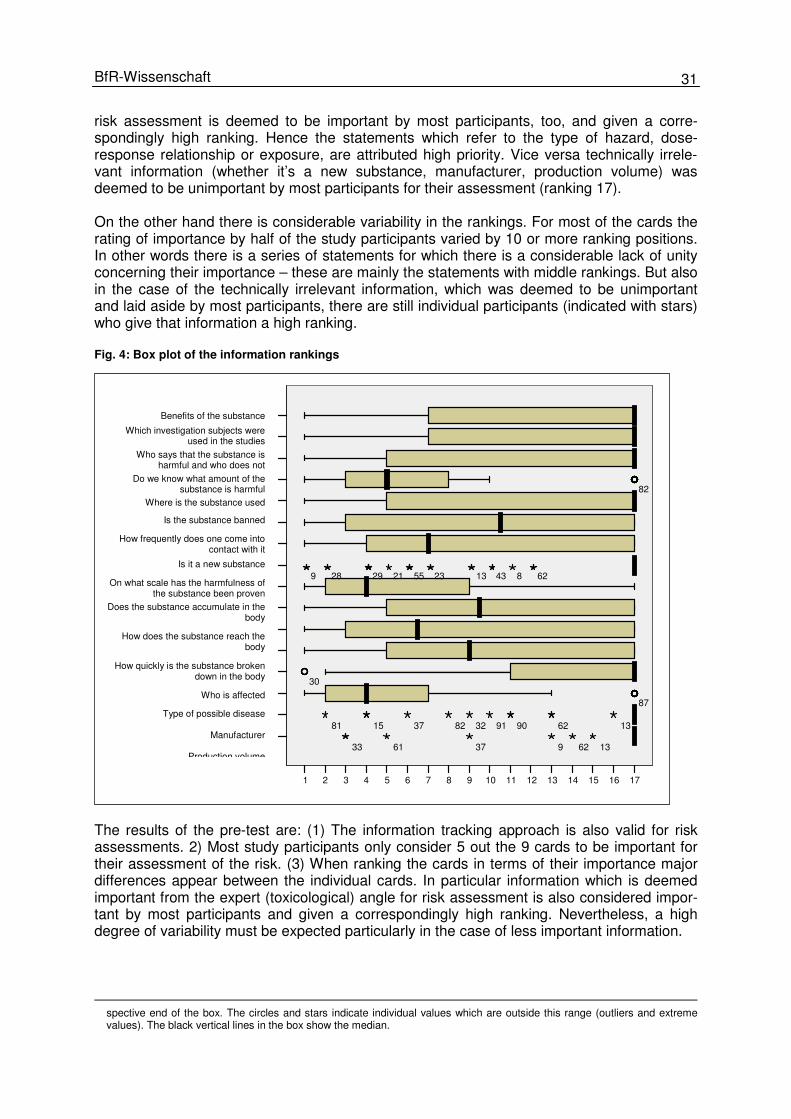
31 BfR-Wissenschaft
risk assessment is deemed to be important by most participants, too, and given a corre-spondingly high ranking. Hence the statements which refer to the type of hazard, dose-response relationship or exposure, are attributed high priority. Vice versa technically irrele-vant information (whether it’s a new substance, manufacturer, production volume) was deemed to be unimportant by most participants for their assessment (ranking 17). On the other hand there is considerable variability in the rankings. For most of the cards the rating of importance by half of the study participants varied by 10 or more ranking positions. In other words there is a series of statements for which there is a considerable lack of unity concerning their importance – these are mainly the statements with middle rankings. But also in the case of the technically irrelevant information, which was deemed to be unimportant and laid aside by most participants, there are still individual participants (indicated with stars) who give that information a high ranking. Fig. 4: Box plot of the information rankings
The results of the pre-test are: (1) The information tracking approach is also valid for risk assessments. 2) Most study participants only consider 5 out the 9 cards to be important for their assessment of the risk. (3) When ranking the cards in terms of their importance major differences appear between the individual cards. In particular information which is deemed important from the expert (toxicological) angle for risk assessment is also considered impor-tant by most participants and given a correspondingly high ranking. Nevertheless, a high degree of variability must be expected particularly in the case of less important information.
spective end of the box. The circles and stars indicate individual values which are outside this range (outliers and extreme values). The black vertical lines in the box show the median.
17 16 15 14 13 12 11 10 9 8 7 6 5 4 3 2 1
82
30
87
62 8 43 13 23 55 21 29 28 9
13 62 90 91 32 82 37 15 81
13 62 9 37 61 33
Benefits of the substance
Which investigation subjects were used in the studies
Who says that the substance is harmful and who does not
Do we know what amount of the substance is harmful
Where is the substance used
Is the substance banned
How frequently does one come into contact with it
Is it a new substance
On what scale has the harmfulness of the substance been proven
Does the substance accumulate in the body
How does the substance reach the body
How quickly is the substance broken down in the body
Who is affected
Type of possible disease
Manufacturer
Production volume

32 BfR-Wissenschaft
7.4 Online experiment
7.4.1 Design
The online experiment follows a 2x2 factorial design. The first factor has two levels and var-ies the central question. Firstly, a question is asked about the assessment of the hazard, and secondly about the assessment of the risk. The second factor varies the information condi-tions. In one case the test persons were informed about the difference between “hazard” and “risk” and could find out the nature of the difference; in the second case there was no such instruction or opportunity to obtain information. Table 4 gives the study design. Table 4: Design of the online experiment
Task
Assessment of hazard Assessment of risk
Information about the differ-ence between hazard and risk
Yes No Yes No
7.4.2 Material
Based on the aspects of “hazard” and “risk” generated in the above procedure, a list of 18 statements were generated which encompasses various information aspects:
• Statements which provide important information for the assessment of the hazard • Statements which provide important information for the assessment of the risk • Statements which provide background information and • Statements which provide information on aspects that are not relevant for the hazard or
the risk assessment. Table 5 gives the statements and the allocated categories. Table 5: List of 18 pieces of information for the online experiment
Text Category Which substance is involved? Hazard-related How hazardous is the substance? Hazard-related Do we know from what amount the substance is harmful for humans? Hazard-related Does the substance accumulate in the body? Hazard-related How quickly is the substance broken down in the body? Hazard-related Has the substance been classified in line with the EU criteria for dangerous substances?
Hazard-related
Is there a limit value? Risk-related How does one come into contact with the substance? Risk-related How long is one exposed to the substance? Risk-related To what concentration of the substance is one exposed? Risk-related Are there certain groups of people who are particularly sensitive? Risk-related What does the risk assessment show? Risk-related In which investigation subjects was the substance examined? Meta-information Is there agreement in science about the evaluation of the substance? Meta-information How much do we know about the substance? Meta-information Where is the substance produced? Irrelevant Who produces the substance? Irrelevant What is the substance still used for? Irrelevant
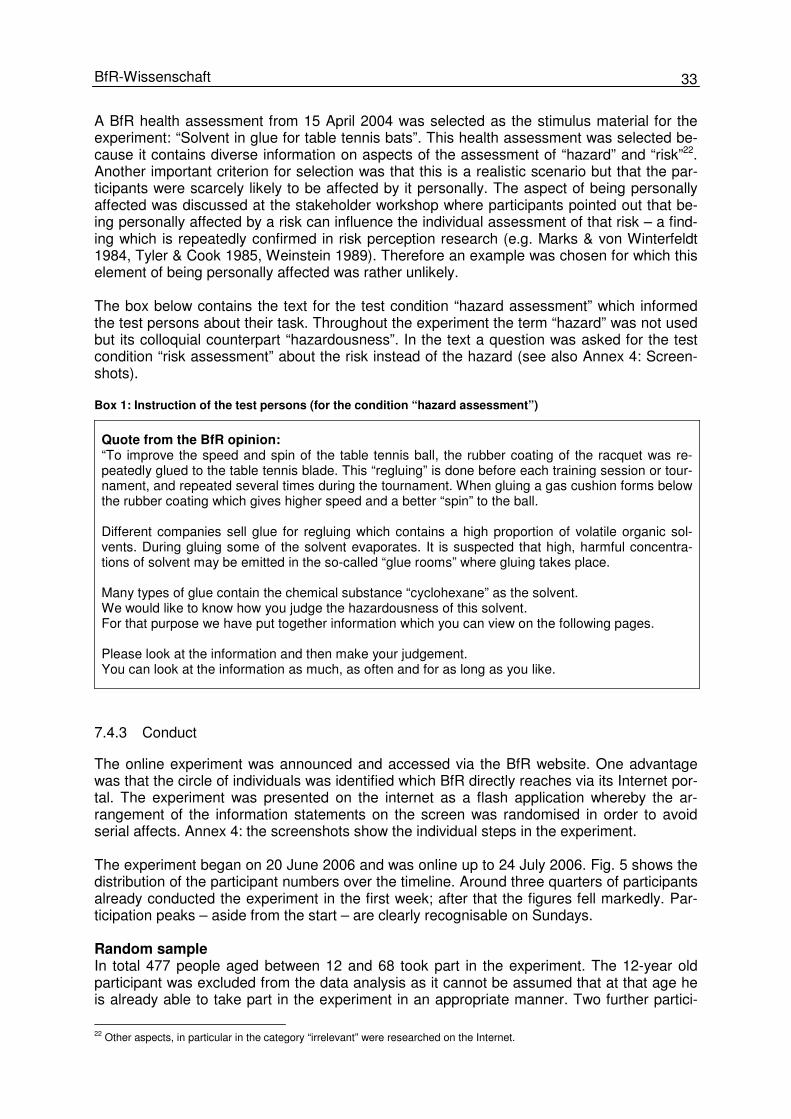
33 BfR-Wissenschaft
A BfR health assessment from 15 April 2004 was selected as the stimulus material for the experiment: “Solvent in glue for table tennis bats”. This health assessment was selected be-cause it contains diverse information on aspects of the assessment of “hazard” and “risk”22. Another important criterion for selection was that this is a realistic scenario but that the par-ticipants were scarcely likely to be affected by it personally. The aspect of being personally affected was discussed at the stakeholder workshop where participants pointed out that be-ing personally affected by a risk can influence the individual assessment of that risk – a find-ing which is repeatedly confirmed in risk perception research (e.g. Marks & von Winterfeldt 1984, Tyler & Cook 1985, Weinstein 1989). Therefore an example was chosen for which this element of being personally affected was rather unlikely. The box below contains the text for the test condition “hazard assessment” which informed the test persons about their task. Throughout the experiment the term “hazard” was not used but its colloquial counterpart “hazardousness”. In the text a question was asked for the test condition “risk assessment” about the risk instead of the hazard (see also Annex 4: Screen-shots). Box 1: Instruction of the test persons (for the condition “hazard assessment”)
Quote from the BfR opinion: “To improve the speed and spin of the table tennis ball, the rubber coating of the racquet was re-peatedly glued to the table tennis blade. This “regluing” is done before each training session or tour-nament, and repeated several times during the tournament. When gluing a gas cushion forms below the rubber coating which gives higher speed and a better “spin” to the ball. Different companies sell glue for regluing which contains a high proportion of volatile organic sol-vents. During gluing some of the solvent evaporates. It is suspected that high, harmful concentra-tions of solvent may be emitted in the so-called “glue rooms” where gluing takes place. Many types of glue contain the chemical substance “cyclohexane” as the solvent. We would like to know how you judge the hazardousness of this solvent. For that purpose we have put together information which you can view on the following pages. Please look at the information and then make your judgement. You can look at the information as much, as often and for as long as you like.
7.4.3 Conduct
The online experiment was announced and accessed via the BfR website. One advantage was that the circle of individuals was identified which BfR directly reaches via its Internet por-tal. The experiment was presented on the internet as a flash application whereby the ar-rangement of the information statements on the screen was randomised in order to avoid serial affects. Annex 4: the screenshots show the individual steps in the experiment. The experiment began on 20 June 2006 and was online up to 24 July 2006. Fig. 5 shows the distribution of the participant numbers over the timeline. Around three quarters of participants already conducted the experiment in the first week; after that the figures fell markedly. Par-ticipation peaks – aside from the start – are clearly recognisable on Sundays. Random sample In total 477 people aged between 12 and 68 took part in the experiment. The 12-year old participant was excluded from the data analysis as it cannot be assumed that at that age he is already able to take part in the experiment in an appropriate manner. Two further partici-
22 Other aspects, in particular in the category “irrelevant” were researched on the Internet.
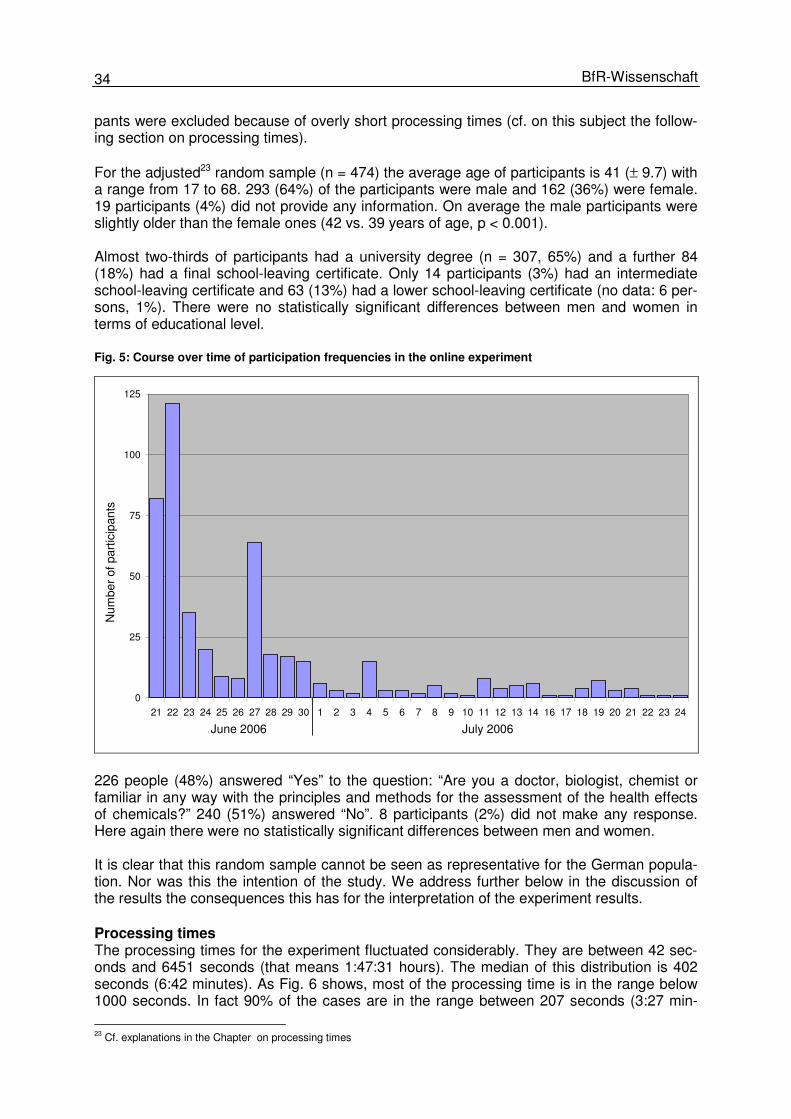
34 BfR-Wissenschaft
pants were excluded because of overly short processing times (cf. on this subject the follow-ing section on processing times). For the adjusted23 random sample (n = 474) the average age of participants is 41 (± 9.7) with a range from 17 to 68. 293 (64%) of the participants were male and 162 (36%) were female. 19 participants (4%) did not provide any information. On average the male participants were slightly older than the female ones (42 vs. 39 years of age, p < 0.001). Almost two-thirds of participants had a university degree (n = 307, 65%) and a further 84 (18%) had a final school-leaving certificate. Only 14 participants (3%) had an intermediate school-leaving certificate and 63 (13%) had a lower school-leaving certificate (no data: 6 per-sons, 1%). There were no statistically significant differences between men and women in terms of educational level. Fig. 5: Course over time of participation frequencies in the online experiment
0
25
50
75
100
125
21 22 23 24 25 26 27 28 29 30 1 2 3 4 5 6 7 8 9 10 11 12 13 14 16 17 18 19 20 21 22 23 24
Anz
ahl d
er T
eiln
ehm
er
Juni 2006 Juli 2006
226 people (48%) answered “Yes” to the question: “Are you a doctor, biologist, chemist or familiar in any way with the principles and methods for the assessment of the health effects of chemicals?” 240 (51%) answered “No”. 8 participants (2%) did not make any response. Here again there were no statistically significant differences between men and women. It is clear that this random sample cannot be seen as representative for the German popula-tion. Nor was this the intention of the study. We address further below in the discussion of the results the consequences this has for the interpretation of the experiment results. Processing times The processing times for the experiment fluctuated considerably. They are between 42 sec-onds and 6451 seconds (that means 1:47:31 hours). The median of this distribution is 402 seconds (6:42 minutes). As Fig. 6 shows, most of the processing time is in the range below 1000 seconds. In fact 90% of the cases are in the range between 207 seconds (3:27 min-
23 Cf. explanations in the Chapter on processing times
Num
ber
of p
artic
ipan
ts
June 2006 July 2006

35 BfR-Wissenschaft
utes) and 706 seconds (11:46 minutes). Some tests revealed that for one processing of the experiment when reading quickly, a minimum number of 5 statements takes at least 90 sec-onds. It is, therefore, questionable whether we can assume that the test persons who took less than 90 seconds had in fact read the information. However this only applies to three individuals whereby 2 participants (with 42 and 78 seconds) were far lower than the 90 sec-onds. These two individuals were not taken into account in the data evaluation. One partici-pant with 88 seconds was just below the 90 second limit and was not excluded. For the ad-justed random sample (n= 474) 90% of the cases are in the range between 210 (3:30 min-utes) and 707 seconds (11:47 minutes). Fig. 6: Frequency distribution of the processing time
6000500040003000200010000
Gesamtdauer (in Sek.)
250
200
150
100
50
0
Häu
fig
keit
Implementation of test conditions The allocation of the test persons to the test conditions was done in a random manner. In addition, a balancing algorithm ensured that random fluctuations did not lead to an overly uneven occupation of the test conditions. Table 6 confirms that this was successful. Table 6: Case numbers in the test conditions
Hazard Risk Total Information 117 119 236 No information 118 120 238 Total 235 239 474
However it was revealed that most test persons in the test condition in which reference was made to the difference between “hazard” and “risk” with information that could be consulted, did not read this information. Only 62 (26%) of the 236 participants in this condition clicked on to the information. Here there is no link between not looking at the information and socio-demographic characteristics like age, gender or school education. No association can be statistically confirmed either for expert status, i.e. whether a participant describes him/herself as an expert in risk assessment issues although only 22% of the experts looked at the infor-mation compared with 30% of non-experts.
Fre
quen
cy
Total duration (in seconds)

36 BfR-Wissenschaft
For roughly 75% of the people in this test condition it is, therefore, unclear whether they are informed about the difference between “hazard” and “risk”24. In the analysis the categories originally envisaged in the test plan “information-no information” are not used but the catego-ries in column 1 of Table 7 are used. Table 7: Extended categorisation of the information test condition and case numbers
Hazard assessment
Risk assessment
Total
Information looked at 30 32 62 Information not looked at 87 87 174 No information given 118 120 238 Total 235 239 474
7.4.4 Results
Number of statements looked at The mean is 14 statements and the maximum number of statements viewed is 4825. This means that some study participants looked at statements several times (which was also ex-plicitly permitted). Figure 7 shows a bimodal distribution. The median is 18 statements, i.e. half of the participants looked at all 18 statements (in some cases several times over); just under 20% of participants looked at only 5 or 6 statements. Fig. 7: Frequency distribution of the number of statements taken into account
24 This cannot be ruled out because one reason for not consulting the information could be that the test persons are familiar with
this difference. 25 As the study participants had to look at at least 5 statements, the mean could not be below 5.
Num
ber
of p
artic
ipan
ts
Total number of statements looked at
Mean= 13.92 Standard deviation= 6.052 N=474
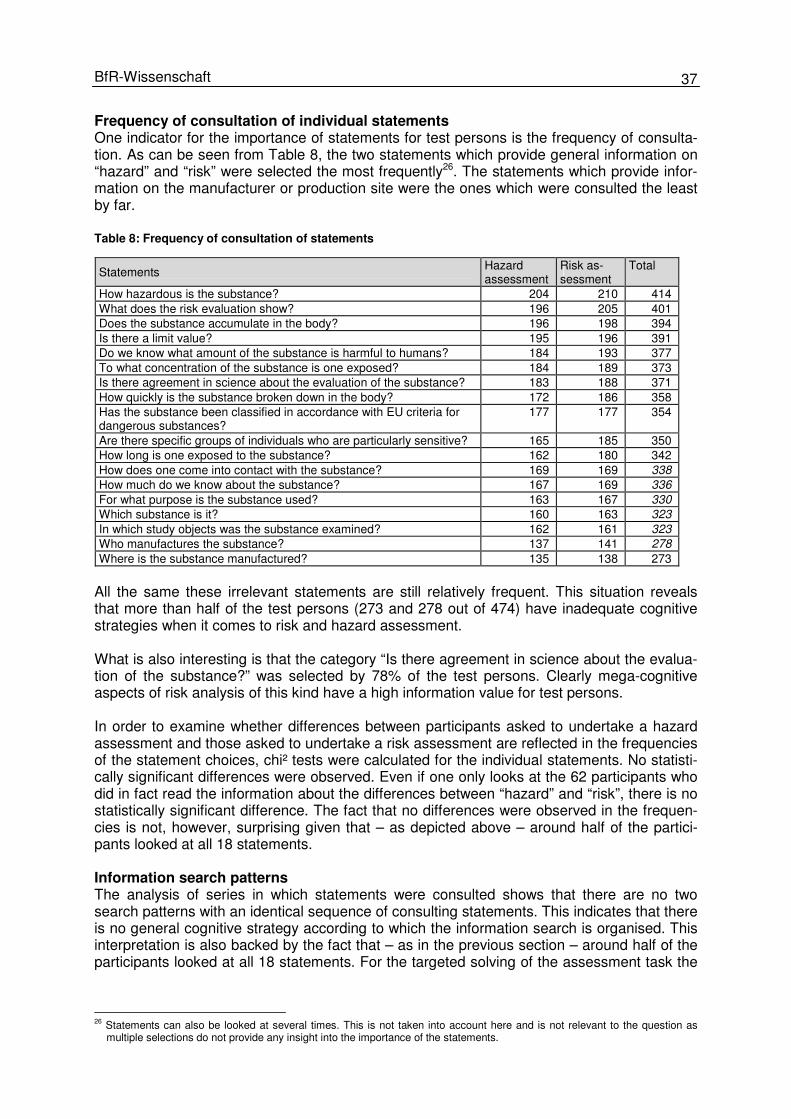
37 BfR-Wissenschaft
Frequency of consultation of individual statements One indicator for the importance of statements for test persons is the frequency of consulta-tion. As can be seen from Table 8, the two statements which provide general information on “hazard” and “risk” were selected the most frequently26. The statements which provide infor-mation on the manufacturer or production site were the ones which were consulted the least by far. Table 8: Frequency of consultation of statements
Statements Hazard assessment
Risk as-sessment
Total
How hazardous is the substance? 204 210 414 What does the risk evaluation show? 196 205 401 Does the substance accumulate in the body? 196 198 394 Is there a limit value? 195 196 391 Do we know what amount of the substance is harmful to humans? 184 193 377 To what concentration of the substance is one exposed? 184 189 373 Is there agreement in science about the evaluation of the substance? 183 188 371 How quickly is the substance broken down in the body? 172 186 358 Has the substance been classified in accordance with EU criteria for dangerous substances?
177 177 354
Are there specific groups of individuals who are particularly sensitive? 165 185 350 How long is one exposed to the substance? 162 180 342 How does one come into contact with the substance? 169 169 338 How much do we know about the substance? 167 169 336 For what purpose is the substance used? 163 167 330 Which substance is it? 160 163 323 In which study objects was the substance examined? 162 161 323 Who manufactures the substance? 137 141 278 Where is the substance manufactured? 135 138 273
All the same these irrelevant statements are still relatively frequent. This situation reveals that more than half of the test persons (273 and 278 out of 474) have inadequate cognitive strategies when it comes to risk and hazard assessment. What is also interesting is that the category “Is there agreement in science about the evalua-tion of the substance?” was selected by 78% of the test persons. Clearly mega-cognitive aspects of risk analysis of this kind have a high information value for test persons. In order to examine whether differences between participants asked to undertake a hazard assessment and those asked to undertake a risk assessment are reflected in the frequencies of the statement choices, chi² tests were calculated for the individual statements. No statisti-cally significant differences were observed. Even if one only looks at the 62 participants who did in fact read the information about the differences between “hazard” and “risk”, there is no statistically significant difference. The fact that no differences were observed in the frequen-cies is not, however, surprising given that – as depicted above – around half of the partici-pants looked at all 18 statements. Information search patterns The analysis of series in which statements were consulted shows that there are no two search patterns with an identical sequence of consulting statements. This indicates that there is no general cognitive strategy according to which the information search is organised. This interpretation is also backed by the fact that – as in the previous section – around half of the participants looked at all 18 statements. For the targeted solving of the assessment task the
26 Statements can also be looked at several times. This is not taken into account here and is not relevant to the question as
multiple selections do not provide any insight into the importance of the statements.
38 BfR-Wissenschaft
stipulated minimum number of 5 statements to be consulted would have been completely sufficient. Without a general cognitive strategy for the information search the lack of any correlations in the search patterns is not surprising. After all for 18 statements there are 18 factorial search patterns, i.e. sequences in which statements can be consulted (whereby it is assumed that each statement can only be consulted once). This leads to a high number of permutations: 18 = 6.4 x 10¹⁵. In fact the number of possible search patterns is far larger because not all 18 but also (at least) 5, 6 or 7 statements had to be looked at. In total 1.74 x 10¹⁶ search pat-terns are possible (whereby here the possibility of multiple selections of the same statements has not been taken into account)27. This heterogeneity does not change either if one only considers the first 5 statements exam-ined. Here, too, there are no two identical search patterns. As outlined above, the individual statements can be assigned to specific categories. 6 state-ments refer to aspects of relevance for the hazard assessment and 6 other to aspects of risk assessments. Three statements provide background information on the quality of knowledge about the substance and three statements concern aspects which are of no importance for the hazard or risk assessment (see Table 5). There are no clear search strategies on the category level either. One search pattern is used three times (H-H-R-R-H) and 5 search patterns are used twice but in fewer than 3% of all cases. One certainly cannot say here that the information search by participants is character-ised by a generally available search strategy. There is more correlation in the search pat-terns if one only looks at the categories for the first 5 statements consulted. Here there is a search pattern which was used 7 times (R-H-H-R-R) and four search patterns which were used 6 and 5 times. Here again 30% of all search patterns were still only used once. What is particularly worth noting when it comes to the question about the distinction between “hazard” and “risk” is that there are no search patterns which only access “hazard” or “risk” related categories. Search patterns of this kind would be logical from the technical angle: H-H-H-H-H for the hazard assessment, R-R-R-R-R for the risk assessment. As no “typical” search patterns can be found which were used by many participants, no search can be made either for differences in the search patterns in the test conditions “haz-ard” and “risk” assessment. For the further analysis of possible differences in the information search between the test conditions “hazard assessment” and “risk assessment” only minimum requirements are, therefore, imposed. Only the categories “hazard”-related statements and “risk”-related state-ments are considered – the other information categories (meta-information and irrelevant information) are not considered. What should be examined was whether in the test condition “hazard assessment” more “hazard”-related than “risk”-related statements are consulted and vice versa whether in the test condition “risk assessment” more “risk”-related than “hazard”-related statements are consulted. What should also be examined is whether information about the difference between “hazard” and “risk” plays a role. For this purpose the difference between the number of accessed “hazard”-related statements and the number of “risk”-related statements is calculated for each participant i.e. “hazard”-related statements minus risk-related statements. A positive difference value means that more “hazard-related” than “risk”-related statements were consulted; a negative difference value means that more “risk”-related than “hazard”-related statements were consulted. Theo-
27 There are exactly 17,403,456,103,205,800 possible search patterns.

39 BfR-Wissenschaft
retically this leads to a scale which ranges from -6 to +6 whereby 6 would mean that 6 “risk”-related statements and no “hazard”-related items were consulted. Vice versa +6 would mean that 6 “hazard”-related statements and no “risk”-related ones were consulted. What should be borne in mind here is that it is not necessarily possible to read from the difference value how many “hazard-related” and how many “risk”–related statements were consulted. A dif-ference value of 2 can result, for instance, from 6 “hazard”-related and 4 “risk”-related state-ments or from consultation of 3 “hazard”-related and 1 “risk”-related statement. Fig. 8 gives the frequency distribution of the difference value separately for the two test con-ditions “hazard” and “risk” assessment. Both distributions are very similar and a chi²-test for differences in frequencies, for the individual difference values, did not produce any statisti-cally significant differences (χ²=12.032; df=9; p=0.212). The greater frequency of the differ-ence value 0 can mainly be explained by the fact that – see above – roughly half of all par-ticipants looked at all 18 statements and by extension at all 6 “hazard”-related and all 6 “risk”- related statements. If one includes the second experimental factor (whether information is given about the differ-ence between “hazard” and “risk” or not and if the information provided was also consulted) in the analysis then there are no statistically differences result for the group of people who had not received the information and the people who had received but did not read it. The forms of distribution are very similar in Fig. 8. Fig. 8: Difference “hazard”-related statements minus “risk”-related statements
There is a slightly different picture in the case of the analysis of participants who did in fact read the information on the difference between “hazard” and “risk”. As can be seen from Fig. 9 the difference values are symmetrically distributed around the 0 value in the condition of “risk assessment”. In the test condition “hazard assessment” the distribution has a positive skew. This means that more “hazard”-related than “risk”-related statements were consulted. This is exactly what would be expected from the expert angle. Risk-related statements are not necessary for “hazard assessment”. By contrast, it makes sense in the condition “risk assessment” to consult “hazard”-related statements, too, because it is necessary to know the
Difference: hazard statements – risk statements
Num
ber
of p
artic
ipan
ts
Risk assessm
ent H
azard assessment

40 BfR-Wissenschaft
hazard in order to assess the risk. Fig 9 does, however, show that the quantitative differ-ences between the two test conditions are not very big. Nor can they be statistically vali-dated. It was also examined whether the difference values for the “experts” (i.e. those persons who describe themselves as being familiar with the assessment of the health effects of chemicals) differ significantly from those for the “non-experts”. This is not the case. Overall it can be said that there are scarcely any indications in the type of information search by the participants that they distinguish between “hazard” and “risk”. There are no “typical” search patterns indicating that the test persons have a general cognitive strategy on the ba-sis of which they organise their information search. Around half of all test persons consulted all information statements on offer before they undertook the “hazard” and “risk” assessment. Only for the group of individuals who had not only been informed of the difference between “hazard” and “risk” but also read about this was there a certain tendency to access above all information of relevance from the technical angle. Fig. 9: Difference “hazard”-related statements minus “risk”-related statements for ten test persons who had in fact read the information about the difference between “hazard” and “risk”
Importance of the categories meta-information and irrelevant information The results presented above already reveal that the information search by the test persons was not restricted to the two categories “hazard”-related and “risk”-related information. They also consulted statements from the categories meta-information and irrelevant information during the information search. This applies to those test persons who looked at all 18 infor-mation statements (after all approximately 50%). What is more interesting when assessing the importance attributed by the test persons to the statements from these two categories is, therefore, the question about how frequently meta-
Difference: hazard statements – risk statements
Risk assessm
ent H
azard assessment
Num
ber
of p
artic
ipan
ts
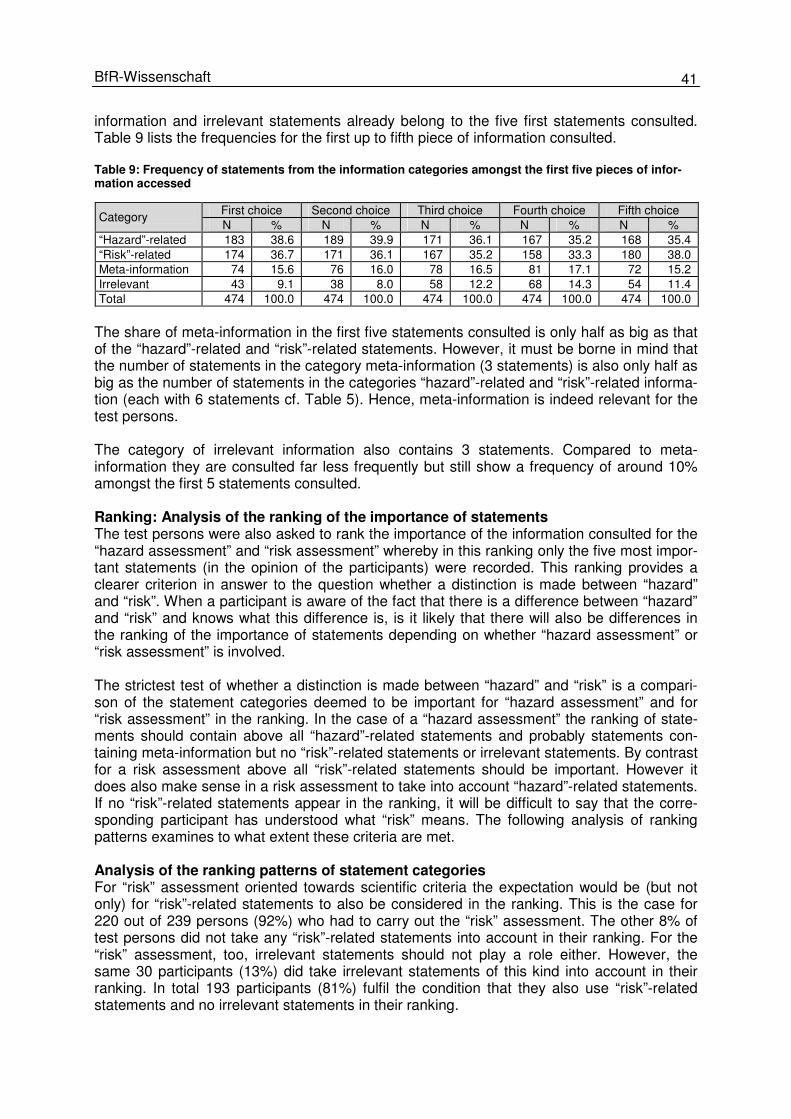
41 BfR-Wissenschaft
information and irrelevant statements already belong to the five first statements consulted. Table 9 lists the frequencies for the first up to fifth piece of information consulted. Table 9: Frequency of statements from the information categories amongst the first five pieces of infor-mation accessed
First choice Second choice Third choice Fourth choice Fifth choice Category
N % N % N % N % N % “Hazard”-related 183 38.6 189 39.9 171 36.1 167 35.2 168 35.4 “Risk”-related 174 36.7 171 36.1 167 35.2 158 33.3 180 38.0 Meta-information 74 15.6 76 16.0 78 16.5 81 17.1 72 15.2 Irrelevant 43 9.1 38 8.0 58 12.2 68 14.3 54 11.4 Total 474 100.0 474 100.0 474 100.0 474 100.0 474 100.0
The share of meta-information in the first five statements consulted is only half as big as that of the “hazard”-related and “risk”-related statements. However, it must be borne in mind that the number of statements in the category meta-information (3 statements) is also only half as big as the number of statements in the categories “hazard”-related and “risk”-related informa-tion (each with 6 statements cf. Table 5). Hence, meta-information is indeed relevant for the test persons. The category of irrelevant information also contains 3 statements. Compared to meta-information they are consulted far less frequently but still show a frequency of around 10% amongst the first 5 statements consulted. Ranking: Analysis of the ranking of the importance of statements The test persons were also asked to rank the importance of the information consulted for the “hazard assessment” and “risk assessment” whereby in this ranking only the five most impor-tant statements (in the opinion of the participants) were recorded. This ranking provides a clearer criterion in answer to the question whether a distinction is made between “hazard” and “risk”. When a participant is aware of the fact that there is a difference between “hazard” and “risk” and knows what this difference is, is it likely that there will also be differences in the ranking of the importance of statements depending on whether “hazard assessment” or “risk assessment” is involved. The strictest test of whether a distinction is made between “hazard” and “risk” is a compari-son of the statement categories deemed to be important for “hazard assessment” and for “risk assessment” in the ranking. In the case of a “hazard assessment” the ranking of state-ments should contain above all “hazard”-related statements and probably statements con-taining meta-information but no “risk”-related statements or irrelevant statements. By contrast for a risk assessment above all “risk”-related statements should be important. However it does also make sense in a risk assessment to take into account “hazard”-related statements. If no “risk”-related statements appear in the ranking, it will be difficult to say that the corre-sponding participant has understood what “risk” means. The following analysis of ranking patterns examines to what extent these criteria are met. Analysis of the ranking patterns of statement categories For “risk” assessment oriented towards scientific criteria the expectation would be (but not only) for “risk”-related statements to also be considered in the ranking. This is the case for 220 out of 239 persons (92%) who had to carry out the “risk” assessment. The other 8% of test persons did not take any “risk”-related statements into account in their ranking. For the “risk” assessment, too, irrelevant statements should not play a role either. However, the same 30 participants (13%) did take irrelevant statements of this kind into account in their ranking. In total 193 participants (81%) fulfil the condition that they also use “risk”-related statements and no irrelevant statements in their ranking.

42 BfR-Wissenschaft
For the ranking patterns of the test condition “hazard assessment” the requirements are stiffer. Here above all “hazard”-related statements and possibly statements containing meta-information but no “risk”-related statements or any irrelevant statements should be of impor-tance. The ranking which represents this expectation the most clearly is: H-H-H-H-H. This ranking pattern only occurs once in the context of the “risk assessment”. What are also per-mitted are ranking patterns which do not contain any “risk”-related statements or irrelevant statements. Out of the 235 participants who took part in the test condition “hazard assess-ment”, 13% (6%) did not take into account any “risk”-related statements in their ranking. 9 participants (4%) did not take into account any “risk”-related statements or any related statements Table 10 presents these findings which are classified by correct and false ranking patterns. The criteria for classification are described in the Table. Table 10: Classification by correct and false rankings
False rankings Correct rankings Hazard assessment Not only “hazard”-related statements
but also “risk” related and/or irrelevant statements 96%
Only “hazard”-related statements and meta-information 4%
Risk assessment No risk characteristics and/or irrele-vant information 19%
“Risk”-related and “hazard”-related statements and meta-information 81%
The majority of test persons in this test condition mixed “hazard and risk” aspects in their assessment. Against the backdrop of these results there is no point conducting further analy-sis of the rankings of the second test condition “Information about the difference between “hazard” and “risk”. Analysis of the ranking for the statement categories A less strict examination of the question whether a distinction is made between “hazard” and “risk” is the comparison of the rankings attributed to the various statement categories in the two test conditions. Instead of examining (as in the previous section), a look is merely taken whether under the condition “hazard assessment” the “hazard”-related statements are given a higher ranking than under the condition “risk assessment” and vice versa: whether under the condition “risk assessment” the “risk”-related statements are given higher rankings than under the condition “hazard assessment”. Table 11 gives the frequencies of statement cate-gories in rankings 1 to 5. It is clear that the frequencies in the individual cells in the table dif-fer but whether there are differences between “hazard” and “risk assessment” is not immedi-ately obvious. Table 11: Frequencies of statement categories in the rankings 1 to 5 for the two test conditions
“Hazard assessment” ranking “Risk assessment” ranking Statement categories 1 2 3 4 5 1 2 3 4 5 “Hazard”-related 150 115 97 104 85 135 110 89 103 89 “Risk”-related 62 95 107 95 114 81 105 124 103 96 Meta-information 23 24 28 27 24 22 23 21 27 36 Irrelevant 0 1 3 9 12 1 1 5 6 18
For the purposes of summary depiction the ranking of each statement was weighted and replaced with a ranking weight. For this weighting of rankings a reciprocal ranking weighting was used in which the weight wj is calculated for the ranking position j using the formula (cf. Schütz et al. 2006, p. 125):
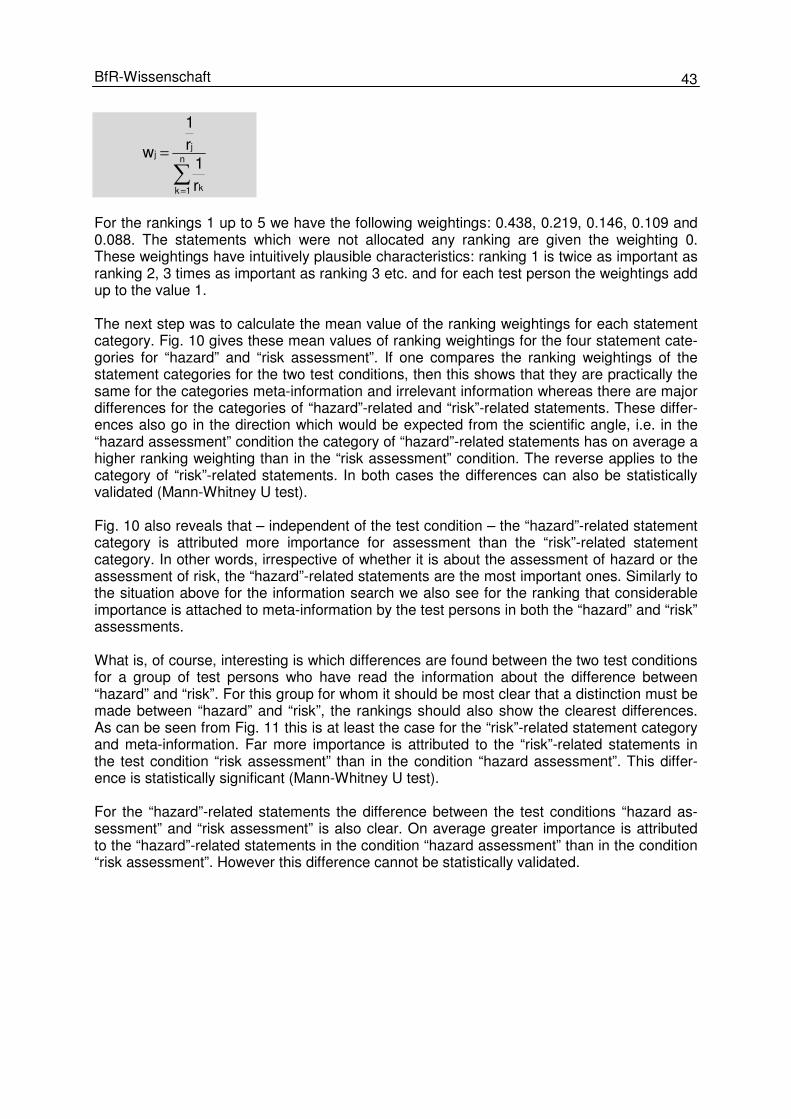
43 BfR-Wissenschaft
∑=
= n
1k k
jj
r1
r1
w
For the rankings 1 up to 5 we have the following weightings: 0.438, 0.219, 0.146, 0.109 and 0.088. The statements which were not allocated any ranking are given the weighting 0. These weightings have intuitively plausible characteristics: ranking 1 is twice as important as ranking 2, 3 times as important as ranking 3 etc. and for each test person the weightings add up to the value 1. The next step was to calculate the mean value of the ranking weightings for each statement category. Fig. 10 gives these mean values of ranking weightings for the four statement cate-gories for “hazard” and “risk assessment”. If one compares the ranking weightings of the statement categories for the two test conditions, then this shows that they are practically the same for the categories meta-information and irrelevant information whereas there are major differences for the categories of “hazard”-related and “risk”-related statements. These differ-ences also go in the direction which would be expected from the scientific angle, i.e. in the “hazard assessment” condition the category of “hazard”-related statements has on average a higher ranking weighting than in the “risk assessment” condition. The reverse applies to the category of “risk”-related statements. In both cases the differences can also be statistically validated (Mann-Whitney U test). Fig. 10 also reveals that – independent of the test condition – the “hazard”-related statement category is attributed more importance for assessment than the “risk”-related statement category. In other words, irrespective of whether it is about the assessment of hazard or the assessment of risk, the “hazard”-related statements are the most important ones. Similarly to the situation above for the information search we also see for the ranking that considerable importance is attached to meta-information by the test persons in both the “hazard” and “risk” assessments. What is, of course, interesting is which differences are found between the two test conditions for a group of test persons who have read the information about the difference between “hazard” and “risk”. For this group for whom it should be most clear that a distinction must be made between “hazard” and “risk”, the rankings should also show the clearest differences. As can be seen from Fig. 11 this is at least the case for the “risk”-related statement category and meta-information. Far more importance is attributed to the “risk”-related statements in the test condition “risk assessment” than in the condition “hazard assessment”. This differ-ence is statistically significant (Mann-Whitney U test). For the “hazard”-related statements the difference between the test conditions “hazard as-sessment” and “risk assessment” is also clear. On average greater importance is attributed to the “hazard”-related statements in the condition “hazard assessment” than in the condition “risk assessment”. However this difference cannot be statistically validated.
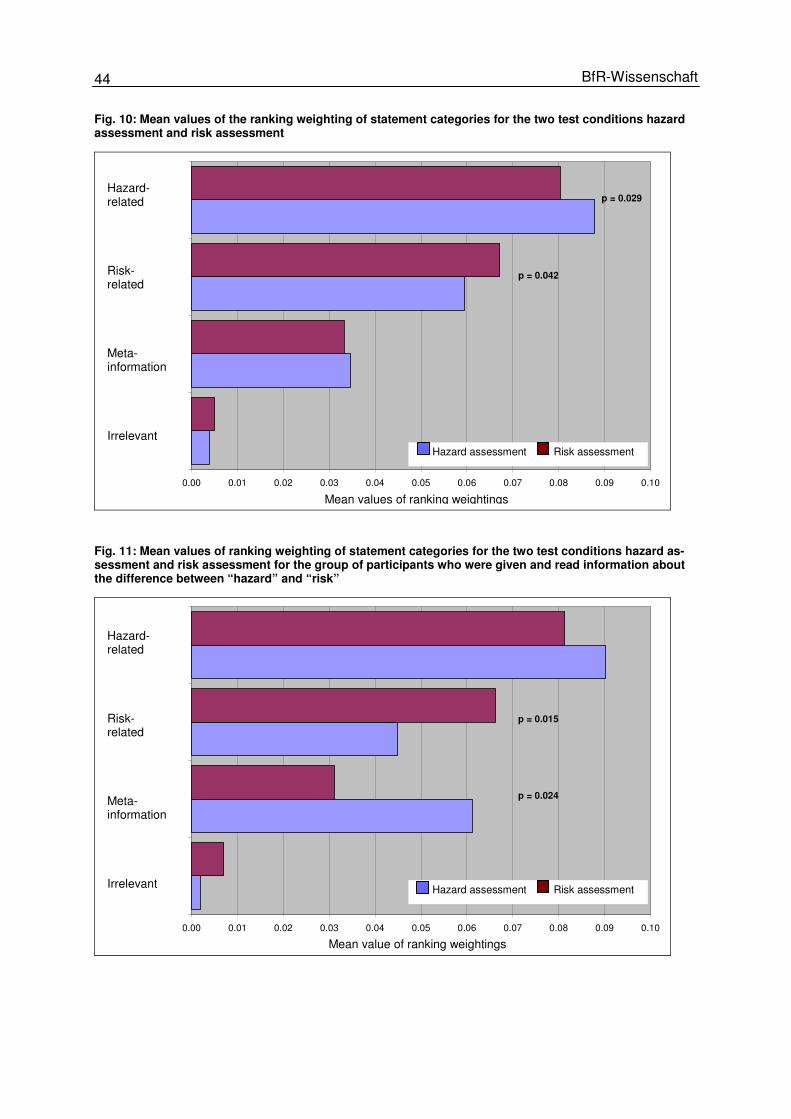
44 BfR-Wissenschaft
Fig. 10: Mean values of the ranking weighting of statement categories for the two test conditions hazard assessment and risk assessment
0.00 0.01 0.02 0.03 0.04 0.05 0.06 0.07 0.08 0.09 0.10
Irrelevant
Metainformationen
Risikobezogen
Hazardbezogen
Mittelwert der Ranggewichte
Hazardbewertung Risikobewertung
p = 0.029
p = 0.042
Fig. 11: Mean values of ranking weighting of statement categories for the two test conditions hazard as-sessment and risk assessment for the group of participants who were given and read information about the difference between “hazard” and “risk”
0.00 0.01 0.02 0.03 0.04 0.05 0.06 0.07 0.08 0.09 0.10
Irrelevant
Metainformationen
Risikobezogen
Hazardbezogen
Mittelwert der Ranggewichte
Hazardbewertung Risikobewertung
p = 0.015
p = 0.024
Hazard-related Risk- related Meta-information Irrelevant
Mean values of ranking weightings
Hazard assessment Risk assessment
Mean value of ranking weightings
Hazard assessment Risk assessment
Hazard-related Risk- related Meta-information Irrelevant

45 BfR-Wissenschaft
What is also noticeable is that the ranking weighting for the category meta-information in the “hazard assessment” condition is twice as high as in the “risk assessment” condition. This difference is also statistically significant (Mann-Whitney U test). The category of irrelevant statements is scarcely of any importance at all in both test conditions. Concerning the level of significance achieved in this sub-group, who have read the information on the difference be-tween “hazard” and “risk”, it should be noted that this group with n=62 is relatively small. This means that the differences which are larger than in the overall group, are not always signifi-cant either. In this group, too, the “hazard”-related statement category takes on greater importance than the “risk”-related statement category irrespective of a hazard or a risk was to be assessed. This means that here, too, the greatest importance is attributed to “hazard”-related state-ments. For the two other larger groups: those who received the information but did not take it into account (n=174) and those who did not receive the information (n=238), the difference be-tween the two test conditions “hazard assessment” and “risk assessment” are not statistically significant (Mann-Whitney U test). These results show that the information about the difference between “hazard” and “risk” do have a small but at least partly statistically detectable effect on the estimation of the impor-tance of “hazard”-related and “risk”-related statements for “hazard assessment” and “risk assessment”. Estimation of the level of “hazard” and “risk” The task presented in the introduction to the experiment concerning the assessment of the hazardousness and the risk of “solvents in glue for table tennis bats” mainly had the function of motivating the test persons to search for and evaluate information. It was not intended for examination of the question of whether a distinction is made between “hazard” and “risk”. As the prior analyses have shown, no distinction of this kind is made. Hence, it is to be ex-pected that the mean values for the “hazard assessment” and “risk assessment” do not differ either. In fact there is no statistically significant difference between the “hazard assessment” (x̄ = 4.13; ±1.37) and the “risk assessment” (x̄ = 3.96; ±1.40). Both evaluations are, therefore, more or less in the middle of the 7-point rating given for the scenario assessment. Men and women do not differ in their assessment (see Table 12). There is an interesting difference, however, between the assessments of “experts” and “non-experts”. In the test condition “hazard assessment” the “experts” on average reach a clear and statistically sig-nificant lower estimation than the “non-experts” (see Table 12). Also in the test condition “risk assessment” the mean value for the “experts” is lower than for the “non-experts”; the differ-ence is only marginally significant. Table 12: Mean value comparisons for “hazard assessment” and “risk assessment”
Hazard assessment Risk Assessment Female Male Female Male
Mean value 4.18 4.15 4.03 3.91 Standard deviation 1,.4 1.43 1.33 1.45 n 74 153 88 140 n.s. n.s. Experts Non-
experts Experts Non-
experts Mean value 3.81 4.45 3.79 4,.1 Standard deviation 1.32 1.35 1.48 1.31 n 114 120 112 120 p < 0,001 p = 0.088
46 BfR-Wissenschaft
The second test condition does not influence the “hazard assessments” and “risk assess-ment” of the test persons. Irrespective of whether the test persons were given no information about the difference between hazard and risk or whether they are given the information and took it into account or received it and did not take it into account, there are no statistically significant differences (see Table 13). Table 13: Comparison of mean values for the test condition “information”
Hazard assessment Risk Assessment Information consid-ered?
Not received
Yes
No
Not received
Yes
No
Mean value 4.21 4.20 4.00 4.05 3.88 3.86 Standard deviation 1.35 1.37 1.40 1.49 1.39 1.27 n 118 30 87 120 32 87
n.s. n.s.
Overall the scenario assessments by the test persons correspond to what one would expect from the expert angle: the “risk” assessments are on average lower than the “hazard as-sessments”. The only statistically significant difference is between experts and non-experts; the latter make lower estimations of the “hazard” and the “risk”. Similar differences between experts and non-experts have been found in various studies on risk perception – cf. for ex-ample the results presented above on the studies on intuitive toxicology. However, it should also be borne in mind that the expert status in this experiment is self-attributed. 7.4.5 Summary and discussion of the results
90% of test persons needed between 3.13 minutes and 11.47 minutes to carry out the ex-periment. Hence, it can be assumed that the processing of the experimental task (information search and “hazard assessment” and “risk assessment”) was undertaken in an elaborated manner. What is particularly noticeable in the information search is the high interindividual variance. There are no two search patterns with an identical sequence of statement consultation. Clearly there is no general cognitive strategy on the basis of which the information search is organised. Bearing in mind that around half of the test persons selected all 18 statements, this would seem to indicate that at least this half does not have any cognitive strategy which would permit a targeted search. From the information search there are indications that a distinction is made between “hazard” and “risk”. Only for the group of people who not only receive the information about the differ-ence between “hazard” and “risk” but also read it, is there a certain tendency to consult in-formation that is relevant from the expert angle. The ranking of the five most important statements for “hazard assessment” and “risk as-sessment” does not reveal either that the test persons distinguish between “hazard” and “risk”. This applies at least when one looks at the ranking pattern. Only 6% of test persons, who carried out a “hazard assessment” did not take into account any risk-related statements in their ranking (and only 4% did not take into account any risk-related statements or any irrelevant statements). From the scientific angle “risk”-related aspects should not play any role in a “hazard assessment”. If one loosens these requirements slightly and examines whether the test persons who had undertaken a hazard assessment at least gave a higher weighting to the “hazard”-related statements (i.e. on average assigned higher rankings) or whether the test persons who un-dertook a “risk assessment” gave a higher weighting to “risk”-related statements, then this is indeed the case. This finding can also be confirmed statistically.
47 BfR-Wissenschaft
Hence, the information about the difference between “hazard” and “risk” seems to play a role. If one distinguishes between the group of people who receive the information and also read it from those who received the information but did not read or did not receive it, then this leads to an interesting finding. Only those persons who received the information and also read it in the group who had undertaken a “risk assessment” weighted the risk-related statements clearly and statistically significantly higher than those whose task it was to do the “hazard assessment”. And the reverse applies too: the higher weighting of “hazard”-related state-ments in the test condition “hazard assessment”. However the difference cannot be statisti-cally confirmed because of the relatively small number in this group. For the two other larger groups, the differences between the two test conditions “hazard assessment” and “risk as-sessment” are not statistically significant. This result seems to justify at least moderate opti-mism that awareness-raising efforts about the differences between “hazard” and “risk” do have an effect. The analysis of the information search and ranking also reveal that the participants can dis-tinguish between information which is important for the assessment of possible health haz-ards and risks, and information which is irrelevant. Beside “hazard-related” and “risk-related” statements, meta-information is also important both in the information search and in ranking. In contrast, the irrelevant information is consulted during the information search (roughly half of participants looked at all the information) but it scarcely plays a role in ranking. Finally, attention should focus on the question about the importance of the type of experi-ment (web experiment) and the random sample characteristics for interpretation of the re-sults. As a consequence of the implementation of an online experiment on the BfR website, a selection was undertaken from several angles. Only those individuals could participate who had access to the Internet and visited the BfR website. The timeline of participation frequen-cies – roughly three quarters of the participants carried out the experiment already in the first week (see Fig. 5) - prompts the supposition that the circle of individuals who found out about the experiment regularly visit the BfR website. This group of individuals is probably interested in questions of risk assessment and how BfR deals with them. The socio-demographic de-tails supplied by the participants likewise reveal that they are not representative of the overall population. 65% of participants have a university degree and men are clearly over-represented - 64% (cf. Explanations in the Chapter “Random sample”). As the test persons were assigned randomly to the test conditions, the specifics of the ran-dom sample are initially irrelevant for the results of the experiment, i.e. they do not influence the external validity of the experiment. By contrast what is problematic is the external validity of the experiment, i.e. the results cannot be simply transferred to the overall population. The presentation of the experiment on the BfR website is the best test situation for examina-tion of the question whether people distinguish between “hazard” and “risk”. If a group of in-dividuals like visitors to the BfR website, who are clearly interested in the subject of risk as-sessment - 50% of whom are experts - and who should, therefore, be familiar with the differ-ence between “hazard” and “risk”, are unable to clearly differentiate between “hazard” and “risk”, then one can probably assume that people who have nothing to do with this topic will not distinguish between “hazard” and “risk” either.28
28 It was this very consideration which led during the design of the experiment to the selection of the BfR website as the starting
page for the experiment.

49 BfR-Wissenschaft
8 Summary and conclusions for communication
“Hazard” is the term used to describe the inherent potential of a substance or situation to cause an adverse effect. “Risk” by contrast describes the probability of an adverse effect on exposure to a substance or situation under specific conditions. The difference between “haz-ard” and “risk” is, therefore, exposure. There is a “risk” when there is exposure to a “hazard”. Consequently, risk information places information about the possible adverse effects centre stage, the occurrence or scale of which depends on the degree of exposure. The goal is to raise awareness and provide support for informed decisions by consumers. Hence risk communication goes beyond the concerns of hazard communication which provides informa-tion first and foremost about the existence of a hazard and, by extension, a warning. Despite the comprehensive literature on the topics of hazard communication, risk perception and risk communication, scarcely any research has looked at whether non-experts distin-guish between “hazard” and “risk” and what problems may result from the non-observation of the difference between “hazard” and “risk” for communication purposes. An online experiment was conducted to analyse “hazard” and “risk” in which 477 people took part. It analysed first the search for information and second ranking, i.e. listing by weighting. The information search did not produce hardly any indications that a distinction is made be-tween “hazard” and “risk”. Nor are there any strategies indicating that the study participants use a general cognitive strategy in their information search. The ranking of the 5 most impor-tant statements for “hazard assessment” and “risk assessment” do not indicate either that the study participants distinguish between “hazard” and “risk”. The results of the online experiment, therefore, seem to indicate that lay persons do not dis-tinguish between “hazard” and “risk” on a scale which would be desirable from the expert angle. Nevertheless, there are also signs that when given the relevant information people can grasp the difference. The scale on which information was sought in the experiment like-wise gives grounds for the hope that at least the group of people who use the BfR internet offering is willing to invest time in consulting the information on offer. The socio-demographic data of participants in the experiment also reveal that this group is not representative for the overall population in Germany.29
29 Studies show that people do not wish to do without information offerings even if they do not actually seek out or use each
piece of information available. It is enough for them to know that they could consult it if necessary. Cf also Annex 2: Informa-tion needs of consumers.


51 BfR-Wissenschaft
9 Recommended actions
1. Whenever possible information should be provided about the risk and not just about the hazard or other components of the risk.
2. Good risk communication is dependent on scientific risk characterisation which meets the
quality criteria transparency, clarity, consistency and substantiation. 3. Risk communication must pay attention in particular to the ease with which the contents
of the statements can be understood. 4. Communication about risks is only possible on the basis of understanding of the risks.
Hence, the important elements here are not only relational qualities like trust and credibil-ity but also the conveying of risk-related assessment and decision-making foundations which enable consumers to take informed decisions.
5. Risk communication must be done in a target group-specific manner. This means above
all that opinions intended for experts must be kept separate from information intended for lay persons. Furthermore, it is desirable to present information for lay persons in a com-pact and structured form with recognition value (“wanted poster – risk”).
6. It is recommended that the current opinions and information on risk assessment be linked
to the available background information (e.g. Risk glossary) in order to facilitate the cog-nitive processing of risk information.
7. Risk communication should use a uniform description approach in the case of qualitative-
verbal risk assessments in order to minimise the scope for interpretation and reduce mis-understandings.
8. Risk communication should discuss uncertainties in a consistent manner and use stan-
dardised formats to describe them. 9. Risk communication should use assessment aids like, for instance, risk comparisons in
order to make the scale and importance of a hazard or risk easier to understand.

53 BfR-Wissenschaft
10 References
Alhakami, A.S. & Slovic, P. (1994): A psychological study of the inverse relationship between perceived risk and perceived benefit. Risk Analysis, 14(6), 1085-1096.
Baron, J. & Spranca, M. (1997): Protected Values. Organizational Behavior and Human De-cision Processes, 70(1), 1-16.
BfR (2004): Zwei Jahre Acrylamid in Lebensmitteln - Eine Bilanz aus der Sicht der Risikobe-wertung (BfR Opinion, 19 March 2004). Berlin: Bundesinstitut für Risikobewertung. Im Inter-net unter: http://www.bfr.bund.de/cm/208/zur_aktuellen_risikobewertung_von_acrylamid.pdf [2006, 02.02].
BfR (2005a): Chininhaltige Getränke können gesundheitlich problematisch sein (BfR Health Assessment, No. 022/2005, 17 February 2005). Berlin: Federal Institute for Risk Assessment On the Internet on: http://www.bfr.bund.de/cm/208/chininhaltige%20Getraenke.pdf [2006, 02.02]. BfR (2005b): Übergang von Weichmachern aus Schraubdeckel-Dichtmassen in Lebensmit-tel. BfR Opinion No. 010/2005, 14 February 2005. Federal Institute for Risk Assessment. On the Internet on: http://www.bfr.bund.de/cm/216/uebergang_von_weichmachern_aus_schraubdeckel_dichtmassen_in_lebensmittel.pdf [2006, 4.10.].
Bord, R.J. & O'Connor, R.E. (1992): Determinants of risk perceptions of a hazardous waste site. Risk Analysis, 12, 411-416.
Braun, C.C. & Silver, N.C. (1995): Interaction of signal word and colour on warning labels: differences in perceived hazard and behavioural compliance. In: Ergonomics, 38, 2207-2220.
Braun, C.C., Sansing, L. & Silver, N.C. (1994): The interaction of signal word and color on warning labels: differences in perceived hazard. In: Proceedings of the Human Factors and Ergonomics Society 38th Annual Meeting, 831-835.
Brelsford, J.W., Wogalter, M.S. & Scoggins, J.A. (1994): Enhancing comprehension and re-tention of safety-related pictorials. In: Proceedings of the Human Factors and Ergonomics Society 38th Annual Meeting, 836-840.
Brun, W. & Teigen, K.H. (1988): Verbal probabilities: Ambiguous, context-dependent, or both? Organizational Behavior and Human Decision Processes, 41(3), 390-404.
Budescu, D.V. & Wallsten, T.S. (1995). Processing linguistic probabilities: General principles and empirical evidence. In J.R. Busemeyer & R. Hastie & D.L. Medin (Eds.), The psychology of learning and motivation: Decision making from the perspective of cognitive psychology (pp. 275-318). San Diego, CA: Academic Press.
Camerer, C.F. & Kunreuther, H. (1989): Decision processes for low probability events: Policy implications. Journal of Policy Analysis and Management, 8, 565-592.
Cohen, A.L., Schmitt, N. & Colligan, M.J. (1989): Aspects of health risk communication: ma-terial safety data sheets for informing workers of chemical hazards at work. Paper presented at the National Safety Council Annual Congress, Chicago.
Covello, V.T., Sandman, P.M. & Slovic, P. (1988): Risk communication, risk statistics, and risk comparisons: A manual for plant managers. Washington, DC: Chemical Manufacturers Association.
DeJoy, D.M. (1989): Consumer product warnings: Review and analysis of effectiveness re-search. In: Human Factors Perspectives on Warnings, 936-940.
Dingus, T.A., Wreggit, S.S. & Hathaway, J.A. (1993): Warning variables affecting personal protective equipment use. In: Safety Science, 16, 655-673.
54 BfR-Wissenschaft
Donner, K.A. & Brelsford, J.W. (1988): Cueing hazard information for consumer products. In: Proceedings of the Human Factors Society 32nd Annual Meeting, Human Factors Society, 532-535.
Dunlap, G.L., Granda, R.E. & Kustas, M.S. (1986): Observer perceptions of implied hazard: safety signal word and color words. IBM Technical Report (T 00.3428).
Eikmann, T. & Herr, C. (2002): Wie gefährlich ist die Acrylamid-Belastung der Bevölkerung tatsächlich? Umweltmed Forsch Prax, 7(6), 307-308.
EPA (2000): Risk characterization handbook. Washington, DC: United States Environmental Protection Agency. Im Internet unter: http://www.epa.gov/osp/spc/rchandbk.pdf.
EU (2001): White Paper Strategy for a future chemicals policy (Brussels, 27.2.2001, COM(2001) 88 final). Brussels: European Commission.
Finucane, M.L., Alhakami, A., Slovic, P. & Johnson, S.M. (2000): The affect heuristic in judgments of risks and benefits. Journal of Behavioral Decision Making, 13(1), 1-17.
Fischhoff, B., Slovic, P., Lichtenstein, S., Read, S. & Combs, B. (1978): How safe is safe enough? A psychometric study of attitudes toward technological risk and benefits. Policy Science, 9, 127-152.
Fiske, A.P. & Tetlock, P.E. (1997): Taboo trade-offs: Reactions to transactions that trans-gress the spheres of justice. Political Psychology, 18(2), 255-297.
Frantz, J.P. (1993): Effect of location and presentation format on user processing of and compliance with product warnings and instructions. In: Journal of Safety Research, 24, 131-154.
Frantz, J.P. (1994): Effect of location and procedural explicitness on user processing of and compliance with product warnings. In: Human Factors, 36, 532-546.
Freudenburg, W.R. & Rursch, J.A. (1994): The risks of "Putting the numbers in context": a cautionary tale. Risk Analysis, 14(6), 949-958.
Friedman, K. (1988): The effect of adding symbols to written warning labels on user behav-iour and recall. In: Human Factors, 30, 507-515.
Gigerenzer, G. & Selten, R. (Eds.). (2001). Bounded rationality: The adaptive toolbox. Cam-bridge, MA: The MIT Press.
Gigerenzer, G. (2002): Das Einmaleins der Skepsis. Über den richtigen Umgang mit Zahlen und Risiken. Berlin: Berlin Verlag.
Godfrey, S.D., Rothstein, P.R. & Laughery, K.R. (1993): Warnings: do they make a differ-ence? In: Human Factors Perspectives on Warnings. California. The Human Factors and Ergonomics Society, 67-71.
Godfrey, S.S., Allender, L., Laughery, K.R. & Smith, V.L. (1983): Warning messages: will the consumer bother to look? In: Proceedings of the Human Factors Society 27th Annual Meet-ing, Human Factors Society, 950-954.
Hadden, S.G. (1986): Read the label. Reducing risk by providing information. Boulder and London: Westview Press.
Hadden, S.G. (1991): Regulating product risks through consumer information. Journal of Social Issues, 47, 93-106.
Harding, C.M. & Eiser, J.R. (1984): Characterising the perceived risks and benefits of some health issues. Risk Analysis, 4, 131-141.
Hertel (2003): Behördliche Risikokommunikation. Bundesgesundheitsblatt - Gesundheitsfor-schung –Gesundheitsschutz, 46(7), 586-591.
55 BfR-Wissenschaft
Horst, D.P., McCarthy, G.E., Robinson, J.N., McCarthy, R.L. & Krumm-Scott, S. (1993): Safety information presentation: factors influencing the potential for behaviour. In: Human Factors Perspective on Warnings. California: The Human Factors and Ergonomics Society, 86-90.
IPCS (2004): Risk assessment terminology - Part 1 and Part 2. Geneva, Switzerland: World Health Organization.
Jaynes, L.S. & Boles, D.B. (1990): The effect of symbols on warning compliance. In: Pro-ceedings of the Human Factors Society 34th Annual Meeting. Santa Monica, CA: Human Factors Society, pp. 984-987.
Johnson, B.B. & Chess, C. (2003): How Reassuring are Risk Comparisons to Pollution Stan-dards and Emission Limits? Risk Analysis, 23(5), 999-1007.
Johnson, B.B. & Slovic, P. (1995): Presenting uncertainty in health risk assessment: initial studies of its effects on risk perception and trust. Risk Analysis, 15(4), 485-494.
Johnson, B.B. & Slovic, P. (1998): Lay views on uncertainty in environmental health risk as-sessment. Journal of Risk Research, 1(4), 261-279.
Johnson, B.B. (2002): Stability and inoculation of risk comparisons' effects under conflict: replicating and extending the "asbestos jury" study by Slovic et al. Risk Analysis, 22(4), 777-788.
Johnson, B.B. (2003a): Are Some Risk Comparisons More Effective Under Conflict? A Repli-cation and Extension of Roth et al. Risk Analysis, 23(4), 767-780.
Johnson, B.B. (2003b): Further Notes on Public Response to Uncertainty in Risks and Sci-ence. Risk Analysis, 23(4), 781-789.
Johnson, B.B. (2004): Varying Risk Comparison Elements: Effects on Public Reactions. Risk Analysis, 24(1), 103-114.
Kaas, K.-P. (1990): Marketing als Bewältigung von Informations- und Unsicherheitsproble-men im Markt. In: Die Betriebswirtschaft, 50:539-548; Kaas, K.-P. (1991): Marktinformatio-nen: Screening und Signaling unter Partnern und Rivalen. In: Zeitschrift für Betriebswirt-schaft, 51(3), 357-370.
Kaplan, S. & Garrick, B.J. (1981): On the quantitative definition of risk. Risk Analysis, 1, 11-27.
Kasperson, R.E., Jhaveri, N. & Kasperson, J.X. (2001): Stigma and the social amplification of risk. In J. Flynn & P. Slovic & H. Kunreuther (Eds.), Risk, Media and Stigma (pp. 9-27). Lon-don: Earthscan Publications.
Khanna, M., Quimio, W.R.H. & Bojilova, D. (1998): Toxics release information: A policy tool for environmental protection. Journal of Environmental Economics and Management, 36(3), 243-266.
Konar, S. & Cohen, M.A. (1997): Information as regulation: The effect of community right to know laws on toxic emissions. Journal of Environmental Economics and Management, 32(1), 109-124.
Kraus, N., Malmfors, T. & Slovic, P. (1992): Intuitive toxicology: expert and lay judgments of chemical risks. Risk Analysis, 12 (2), 215-231.
Krewski, D., Slovic, P., Bartlett, S., Flynn, J. & Mertz, C.K. (1995): Health risk perception in Canada II: Worldviews, Attitudes and Opinions. Human and Ecological Risk Assessment, 1(3), 231-248.
Kuhn, K.M. (2000): Message format and audience values: Interactive effects of uncertainty information and environmental attitudes on perceived risk. Journal of Environmental Psy-chology, 20(1), 41-51.
56 BfR-Wissenschaft
Kunreuther, H. & Slovic, P. (2002). The affect heuristic: Implications for understanding and managing risk-induced stigma. In R. Gowda & J.C. Fox (Eds.), Judgments, decisions, and public policy (pp. 303-321). New York, NY, US: Cambridge University Press.
Kuß, A. & Silberer, G. (2001): Informationsverhalten, in: Diller (Ed.): Vahlens großes Marke-tinglexikon, Munich, p. 651-655; Krober-Riel, W., Weinberg, P. (1999): Konsumentenverhal-ten, 7th edition, Munich.
LaRue, C. & Cohen, H. (1987): Factors influencing consumers` perceptions of warning: an examination of the differences between male and female consumers. In: Proceedings of the Human Factors Society 31st Annual Meeting, 610-614.
Laughery, K.R. & Brelsford, J.W. (1993): Receiver characteristics in safety communications. In: Human Factors Perspectives on Warnings. California: The Human Factors and Ergonom-ics Society, 120-124.
Laux, L., Mayer, D.L. & Thompson, N.B. (1989): Usefulness of symbols and pictorials to communicate hazard information. In: Proceedings of INTERFACE 89, 79-83.
Leonard, D.S. & Wogalter, M.S. (2000): What you don`t know can hurt you: household prod-ucts and events. In: Accident Analysis and Prevention, 32, 383-388.
Ley, P. (1995): Effectiveness of label statements for drugs and poisons, University of Syd-ney, Australian Health Ministers` Advisory Council, Australian Government Publishing Ser-vice, GPO Box 84, Canberra ACT 2601, ISBN 0644 45335 4, as quoted in the Inter-Organization Programme for the Sound Management of Chemicals Draft Report on the re-sponses to the call on chemical hazard communication, December 1996.
Lippman-Hand, A. & Fraser, F.C. (1979): Genetic counseling - the postcounseling period: I. Parents' perceptions of uncertainty. American Journal of Medical Genetics, 4, 51-71.
Madle, S., Broschinski, L., Mosbach-Schulz, O., Schöning, G. & Schulte, A. (2003): Zur aktu-ellen Risikobewertung von Acrylamid in Lebensmitteln. Bundesgesundheitsbl - Gesundheits-forsch - Gesundheitsschutz, 46(5), 405-415.
MacGregor, D.G., Slovic, P. & Malmfors, T. (1999): “How exposed is exposed enough?” Lay inferences about chemical exposure. In: Risk Analysis, 19, 649-659.
Magat, W.A., Viscusi, W.K. & Huber, J. (1987): Risk-dollar tradeoffs, risk perceptions, and consumer behavior. In W.K. Viscusi & W.A. Magat (Eds.), Learning about risk: Consumer and worker responses to hazard information (pp. 83-97). Cambridge, MA, US: Harvard Uni-versity Press.
Magurno, A.B. & Wogalter, M.S. (1994): Behavioral compliance with warnings: effects of stress and placement. In: Proceedings of the Human Factors and Ergonomics Society 38th Annual Meeting, 826-830.
Marks, G. & von Winterfeldt, D. (1984): "Not in my backyard": Influence of motivational con-cerns on judgments about risky technologies. Journal of Applied Psychology, 69, 408-415.
Mertz, C.K., Slovic, P. & Purchase, I.F.H. (1998): Judgements of chemical risks: compari-sons among senior managers, toxicologists, and the public. In: Risk Analysis, 18, 391-403.
Moxey, L.M. & Sanford, A.J. (2000): Communicating quantities: A review of psycholinguistic evidence of how expressions determine perspectives. Applied Cognitive Psychology. May Jun, 14(3), 237-255.
Neil, N., Malmfors, T. & Slovic, P. (1994): Intuitive toxicology: expert and lay judgments of chemical risks. In: Toxicologic Pathology, 22, 198-201.
Newstead, S.E. & Collis, J.M. (1987): Context and the interpretation of quantifiers of fre-quency. Ergonomics, 30(10), 1447-1462.
57 BfR-Wissenschaft
OECD (2002): OECD Guidance Document on Risk Communication for Chemical Risk Man-agement. Organisation for Economic Co-Operation and Development. On the Internet on: http://www.olis.oecd.org/olis/2002doc.nsf/LinkTo/env-jm-mono(2002)18 [2006, 4.10.].
Otsubo, S.M. (1988): A behavioural study of warning Labels for consumer products: per-ceived danger and use of pictographs. In: Proceedings of the Human Factors Society 32nd Annual Meeting, 536-540.
Peters, E.M., Burraston, B. & Mertz, C.K. (2004): An Emotion-Based Model of Risk Percep-tion and Stigma Susceptibility: Cognitive Appraisals of Emotion, Affective Reactivity, World-views, and Risk Perceptions in the Generation of Technological Stigma. Risk Analysis, 24(5), 1349-1367.
Purchase, I.F.H. & Slovic, P. (1999): Quantitative risk assessment breeds fear. Human and Ecological Risk Assessment, 5(3), 445-453.
Racicot, B.M. & Wogalter, M.S. (1995): Effects of a video warning sign and social modelling on behavioural compliance. In: Accident Analysis and Prevention, 27, 57-64.
Rajapakse, N., Silva, E. & Kortenkamp, A. (2002): Combining xenoestrogens at levels below individual no-observed-effect concentrations dramatically enhances steroid hormone action. Environmental Health Perspectives, 110(9), 917-921.
Risikokommission (2003): Abschlussbericht der Risikokommission. Salzgitter: Geschäftsstel-le der Risikokommission, Bundesamt für Strahlenschutz (On the Internet on: http://www.apug.de).
Ritov, I. & Baron, J. (1999): Protected values and omission bias. Organizational Behavior and Human Decision Processes, 79(2), 79-94.
Rodriguez, M.A. (1991): What makes a warning label salient? In: Proceedings of the Human Factors Society 35th Annual Meeting. Santa Monica, CA: Human Factors Society, 1029-1033.
Rohrmann, B. (1992): The evaluation of risk communication effectiveness. Acta Psy-chologica, 81, 169-192.
Rohrmann, B. (1998): Assessing hazard information/communication programs. Australian Psychologist, 33(2), 105-112.
Roth, E., Morgan, M.G., Fischhoff, B., Lave, L. & et al. (1990): What do we know about mak-ing risk comparisons? Risk Analysis, 10(3), 375-387.
Rozin, P., Millman, L. & Nemeroff, C. (1986): Operation of the laws of sympathetic magic in disgust and other domains. In: Journal of Personality and Social Psychology, 50, 703-712.
Sadhra, S., Petts, J., McAlpine, S., Pattison, H. & MacRae, S. (2002): Workers' understand-ing of chemical risks: electroplating case study. Occup Environ Med, 59(10), 689-695.
Sattler, B., Lippy, B. & Jordan, T.G. (1997): Hazard communication: a review of the science underpinning the art of communication for health and safety. The University of Maryland Medical School.
Schütz, H., Wiedemann, P.M., Hennings, W., Mertens, J. & Clauberg, M. (2006): Compara-tive Risk Assessment: Concepts, Problems and Applications. Weinheim: Wiley-VCH.
SFK (2004): Risikomanagement im Rahmen der Störfall-Verordnung. Störfall-Kommission. On the Internet on: http://www.sfk-taa.de/berichte_reports/berichte_sfk/sfk_gs_41.pdf [2006, 21.2.].
Silver, N.C., Leonard, D.C., Ponsi, K.A. & Wogalter, M.S. (1991): Warnings and purchase intentions for pest-control products. In: Forensic Reports, 4, 17-33.
Slovic, P., Kraus, N. & Covello, V.T. (1990): What should we know about making risk com-parisons? Risk Analysis, 10, 389-392.

58 BfR-Wissenschaft
Slovic, P., Layman, M., Kraus, N., Flynn, J., Chalmers, J. & Gesell, G. (1991): Perceived risk, stigma, and potential economic impacts of a high-level nuclear waste report. Risk Analysis, 11, 683-696.
Slovic, P., Malmfors, T., Krewski, D., Mertz, C.K., Neil, N. & Bartlett, S. (1995): Intuitive toxi-cology II: expert and lay judgments of chemical risks in Canada. In: Risk Analysis, 15, 661-675.
Slovic, P., Malmfors, T., Mertz, C.K., Neil, N. & Purchase, I.F.H. (1997): Evaluating chemical risks: results of a survey of the British Toxicology Society. In: Human & Experimental Toxico-logy, 16, 289-304.
Spangenberg, A. (2003). Risikostories und Risikobewertung - Deutschland und Bulgarien im Vergleich. Magisterarbeit, Aachen: RWTH Aachen.
SRU (1999): Umwelt und Gesundheit - Risiken richtig einschätzen (Special report, December 1999). Stuttgart: Metzler-Poeschel.
SSK (2001): Grenzwerte und Vorsorgemaßnahmen zum Schutz der Bevölkerung vor elekt-romagnetischen Feldern - Empfehlungen der Strahlenschutzkommission. Bonn: Strahlen-schutzkommission.
Stone, E.R., Yates, J.F. & Parker, A.M. (1994): Risk communication: Absolute versus relative expressions of low-probability risks. Organizational Behavior and Human Decision Proc-esses, 60(3), 387-408.
Strawbridge, J.A. (1985): The influence of position, highlighting, and imbedding on warning effectiveness. In: Proceedings of the Human Factors Society 30th Annual Meeting. Santa Monica, CA: Human Factors Society, pp.716-720.
Teigen, K.H. & Brun, W. (1999): The directionality of verbal probability expressions: Effects on decisions, predictions, and probabilistic reasoning. Organizational Behavior and Human Decision Processes, 80(2), 155-190.
Teigen, K.H. & Brun, W. (2000): Ambiguous probabilities: When does p = 0.3 reflect a possi-bility, and when does it express a doubt? Journal of Behavioral Decision Making, 13(3), 345-362.
Teigen, K.H. (1998): When the unreal is more likely than the real: Post hoc probability judg-ments and counterfactual closeness. Thinking and Reasoning, 4(2), 147-177.
Thalmann, A. (2005): Risiko Elektrosmog – Wie ist das Wissen in der Grauzone zu kommu-nizieren? Weinheim: Beltz PVU.
Tyler, T.R. & Cook, F.L. (1985): The mass media and judgments of risk: Distinguishing im-pact on personal and societal level judgments. Journal of Personality and Social Psychology, 47(4), 693-708.
Van der Pligt, J. & de Boer, J. (1991): Contaminated soil: Public reactions, policy decisions and risk communication. In R.E. Kasperson & P.J.M. Stallen (Eds.), Communicating risks to the public. International perspectives (pp. 127-144). Dordrecht: Kluwer.
Verbraucherzentrale Bundesverband e.V. (vzbv) (2004): Was Verbraucher wissen wollen. Ergebnisse einer empirischen Studie zum Informationsbedarf der Verbraucher. http://www.vzbv.de/mediapics/verbraucherinformation_studie_imug_vzbv.pdf.
Viscusi, W.K. (1997): Alarmist decision with divergent risk information. The Economic Jour-nal, 107, 1657-1670.
Viscusi, W.K. & Magat, W.A. (1987): Learning about risk: Consumer and worker responses to hazard information. Cambridge, MA, US: Harvard University Press.
Viscusi, W. K. & O’Connor, C.J. (1984): Adaptive responses to chemical labeling: are work-ers Bayesian decision makers? In: American Economic Review, Vol. 74, No. 5, pp. 942-956.
59 BfR-Wissenschaft
Viscusi, W. K., Magat, W.A. & Huber, J. (1986): Informational regulation of consumer health risks: an empirical evaluation of hazard warnings. In: Rand Journal of Economics, Vol. 17 (3), pp. 351-365.
Viscusi, W. K., Magat, W.A. & Huber, J. (1987a): The effect of risk information on precau-tionary behaviour. In: Viscusi, W. Kip & Magat, Wesley A.: Learning About Risk. Consumer and Worker Responses to Hazard Information. Cap. 4, pp. 60-82. Cambridge: Harvard Uni-versity Press.
Viscusi, W. K. & O’Connor, C.J. (1987b): Hazard warnings for workplace risks: effects on risk perceptions, wage rates, and turnover. In: Viscusi, W. Kip & Magat, Wesley A.: Learning About Risk. Consumer and Worker Responses to Hazard Information. Cap. 6, pp. 98-124. Cambridge: Harvard University Press.
Wallsten, T.S., Budescu, D.V., Rapoport, A., Zwick, R. & Forsyth, B. (1986): Measuring the vague meanings of probability terms. Journal of Experimental Psychology: General, 115(4), 348-365.
Weber, E.U. & Hilton, D.J. (1990): Contextual effects in the interpretations of probability words: Perceived base rate and severity of events. Journal of Experimental Psychology: Human Perception and Performance, 16(4), 781-789.
Weil, D., Fung, A., Graham, M. & Fagotto, E. (2006): The effectiveness of regulatory disclo-sure policies. Journal of Policy Analysis and Management, 25(1), 155-181.
Weinstein, N.D. (1989): Optimistic biases about personal risks. Science, 246, 1232-1233.
Wiedemann, P.M., Schütz, H., Spangenberg, A., Ulbig, E. & Hertel, R. (2007): Saure Le-bensmittel und Zahngesundheit, Ergebnisse eines Expertenworkshops. Umweltmedizini-scher Informationsdienst (UMID), 2, 8-11.
Wiedemann, P.M. & Clauberg, M. (2005). Risikokommunikation. In R. Fehr & H. Neus & U. Heudorf (Eds.), Gesundheit und Umwelt, Ökologische Prävention und Gesundheitsförde-rung. Bern: Hans Huber.
Wiedemann, P.M. & Schütz, H. (2002): Wer fürchtet den Mobilfunk? Gruppenspezifische Differenzen bei der Risikowahrnehmung (Arbeiten zu Risikokommunikation, Heft 84). Jülich: Forschungszentrum Jülich GmbH. Programmgruppe Mensch, Umwelt, Technik. Website: http://www.fz-juelich.de/mut/hefte/heft_84.pdf.
Wiedemann, P.M. & Schütz, H. (2006; im Erscheinen): Risikokommunikation im Überblick. In E.D. Lantermann & V. Linneweber (Eds.), Enzyklopädie der Psychologie - Umweltpsycholo-gie (Vol. 2). Göttingen: Hogrefe. Website: http://www.fz-juelich.de/mut/publikationen/ preprints/risikokommunikation _im_ueberblick%20.pdf [2006, 10.09].
Wiedemann, P.M., Clauberg, M. & Schütz, H. (2003). Understanding amplification of com-plex risk issues: The risk story model applied to the EMF case. In N. Pidgeon & R. Kasper-son & P. Slovic (Eds.), The social amplification of risk (pp. 286-301). New York: Cambridge University Press.
Williams, P.R. & Paustenbach, D.J. (2002): Risk characterization: principles and practice. J Toxicol Environ Health B Crit Rev, 5(4), 337-406.
Wogalter, M.S., Allison, S.T. & McKenna, N.A. (1989): Effects of cost and social influence on warning compliance. In: Human Factors, 31, 133-140.
Wogalter, M.S., Desaulniers, D.R. & Brelsford, J.W.Jr. (1987a): Consumer products: how are the hazards perceived? In: Proceedings of the Human Factors Society, 31st Annual Meeting. 615-619.
Wogalter, M.S., Godfrey, S.S., Fontenelle, G.A., Desaulniers, D.R., Rothstein, P.R. & Laughery, K.R. (1987b): Effectiveness of warnings. In: Human Factors, 29, 599-612.

60 BfR-Wissenschaft
Wogalter, M.S., Kalsher, M.J. & Racicot, B.M. (1993): Behavioural compliance with warnings: effects of voice, context, and location. In: Safety Science, 16, 637-654.
Wogalter, M.S., Magurno, A.B., Rashid, R. & Klein, K.W. (1998): The influence of time stress and location on behavioral warning compliance. In: Safety Science, 29, 143-158.
Wogalter, M.S., Young, S.L., Brelsford, J.W. & Barlow, T. (1999): The relative contributions of injury severity and likelihood information on hazard-risk judgments and warning compli-ance. In: Journal of Safety Research, 30, 151-162.
Young, S.L., Brelsford, J.W. & Wogalter, M.S. (1990): Judgments of hazard, risk, and dan-ger: Do they differ? In: Proceedings of the Human Factors Society 34th Annual Meeting, Santa Monica, CA: Human Factors Society, 503-507.
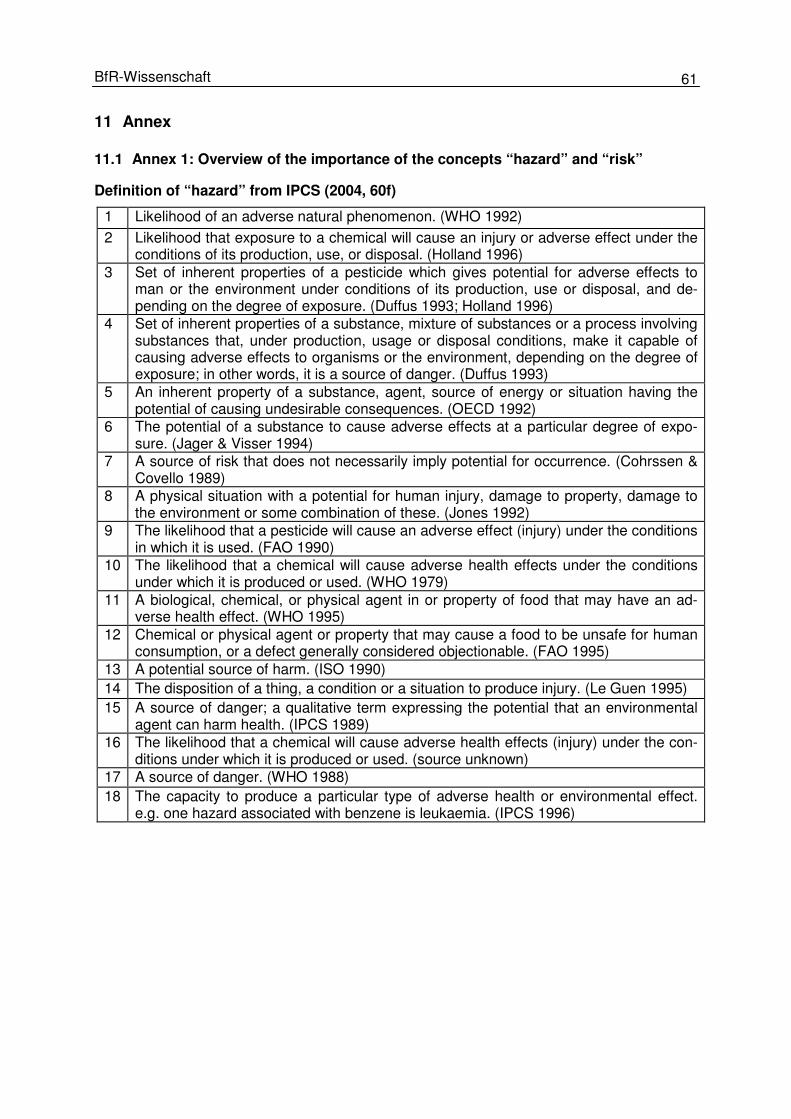
61 BfR-Wissenschaft
11 Annex
11.1 Annex 1: Overview of the importance of the concepts “hazard” and “risk”
Definition of “hazard” from IPCS (2004, 60f)
1 Likelihood of an adverse natural phenomenon. (WHO 1992)
2 Likelihood that exposure to a chemical will cause an injury or adverse effect under the conditions of its production, use, or disposal. (Holland 1996)
3 Set of inherent properties of a pesticide which gives potential for adverse effects to man or the environment under conditions of its production, use or disposal, and de-pending on the degree of exposure. (Duffus 1993; Holland 1996)
4 Set of inherent properties of a substance, mixture of substances or a process involving substances that, under production, usage or disposal conditions, make it capable of causing adverse effects to organisms or the environment, depending on the degree of exposure; in other words, it is a source of danger. (Duffus 1993)
5 An inherent property of a substance, agent, source of energy or situation having the potential of causing undesirable consequences. (OECD 1992)
6 The potential of a substance to cause adverse effects at a particular degree of expo-sure. (Jager & Visser 1994)
7 A source of risk that does not necessarily imply potential for occurrence. (Cohrssen & Covello 1989)
8 A physical situation with a potential for human injury, damage to property, damage to the environment or some combination of these. (Jones 1992)
9 The likelihood that a pesticide will cause an adverse effect (injury) under the conditions in which it is used. (FAO 1990)
10 The likelihood that a chemical will cause adverse health effects under the conditions under which it is produced or used. (WHO 1979)
11 A biological, chemical, or physical agent in or property of food that may have an ad-verse health effect. (WHO 1995)
12 Chemical or physical agent or property that may cause a food to be unsafe for human consumption, or a defect generally considered objectionable. (FAO 1995)
13 A potential source of harm. (ISO 1990) 14 The disposition of a thing, a condition or a situation to produce injury. (Le Guen 1995) 15 A source of danger; a qualitative term expressing the potential that an environmental
agent can harm health. (IPCS 1989) 16 The likelihood that a chemical will cause adverse health effects (injury) under the con-
ditions under which it is produced or used. (source unknown) 17 A source of danger. (WHO 1988) 18 The capacity to produce a particular type of adverse health or environmental effect.
e.g. one hazard associated with benzene is leukaemia. (IPCS 1996)
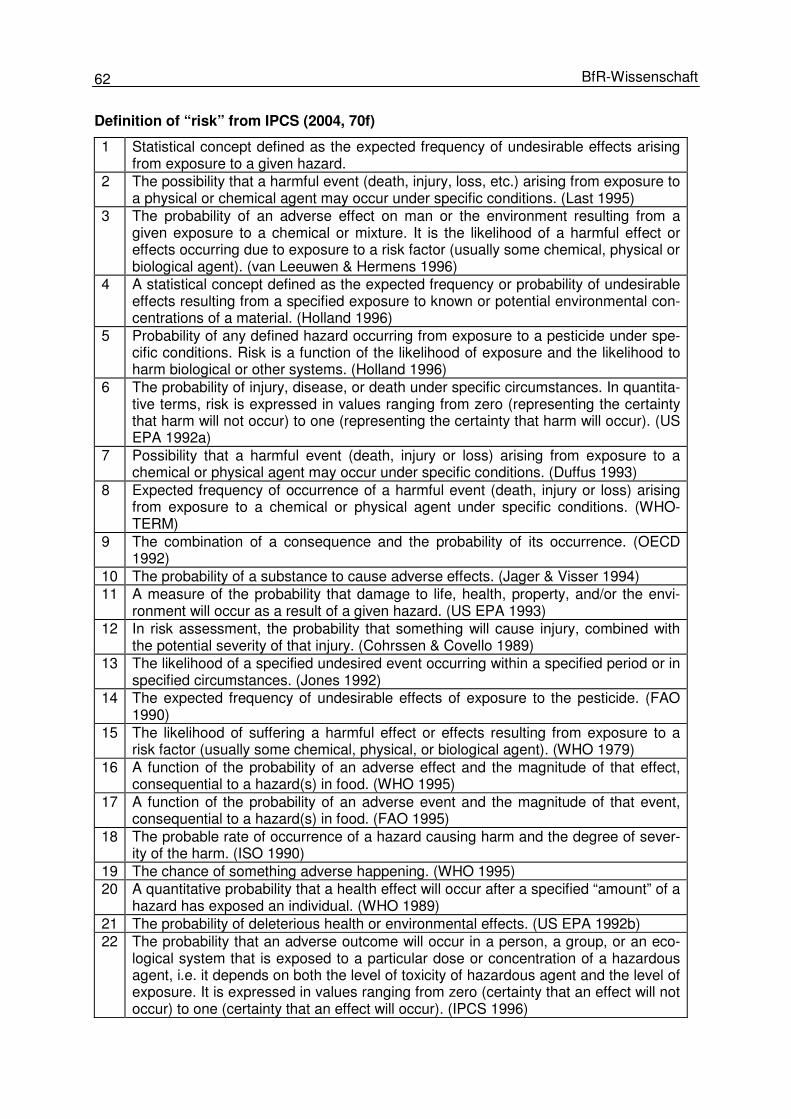
62 BfR-Wissenschaft
Definition of “risk” from IPCS (2004, 70f)
1 Statistical concept defined as the expected frequency of undesirable effects arising from exposure to a given hazard.
2 The possibility that a harmful event (death, injury, loss, etc.) arising from exposure to a physical or chemical agent may occur under specific conditions. (Last 1995)
3 The probability of an adverse effect on man or the environment resulting from a given exposure to a chemical or mixture. It is the likelihood of a harmful effect or effects occurring due to exposure to a risk factor (usually some chemical, physical or biological agent). (van Leeuwen & Hermens 1996)
4 A statistical concept defined as the expected frequency or probability of undesirable effects resulting from a specified exposure to known or potential environmental con-centrations of a material. (Holland 1996)
5 Probability of any defined hazard occurring from exposure to a pesticide under spe-cific conditions. Risk is a function of the likelihood of exposure and the likelihood to harm biological or other systems. (Holland 1996)
6 The probability of injury, disease, or death under specific circumstances. In quantita-tive terms, risk is expressed in values ranging from zero (representing the certainty that harm will not occur) to one (representing the certainty that harm will occur). (US EPA 1992a)
7 Possibility that a harmful event (death, injury or loss) arising from exposure to a chemical or physical agent may occur under specific conditions. (Duffus 1993)
8 Expected frequency of occurrence of a harmful event (death, injury or loss) arising from exposure to a chemical or physical agent under specific conditions. (WHO-TERM)
9 The combination of a consequence and the probability of its occurrence. (OECD 1992)
10 The probability of a substance to cause adverse effects. (Jager & Visser 1994) 11 A measure of the probability that damage to life, health, property, and/or the envi-
ronment will occur as a result of a given hazard. (US EPA 1993) 12 In risk assessment, the probability that something will cause injury, combined with
the potential severity of that injury. (Cohrssen & Covello 1989) 13 The likelihood of a specified undesired event occurring within a specified period or in
specified circumstances. (Jones 1992) 14 The expected frequency of undesirable effects of exposure to the pesticide. (FAO
1990) 15 The likelihood of suffering a harmful effect or effects resulting from exposure to a
risk factor (usually some chemical, physical, or biological agent). (WHO 1979) 16 A function of the probability of an adverse effect and the magnitude of that effect,
consequential to a hazard(s) in food. (WHO 1995) 17 A function of the probability of an adverse event and the magnitude of that event,
consequential to a hazard(s) in food. (FAO 1995) 18 The probable rate of occurrence of a hazard causing harm and the degree of sever-
ity of the harm. (ISO 1990) 19 The chance of something adverse happening. (WHO 1995) 20 A quantitative probability that a health effect will occur after a specified “amount” of a
hazard has exposed an individual. (WHO 1989) 21 The probability of deleterious health or environmental effects. (US EPA 1992b) 22 The probability that an adverse outcome will occur in a person, a group, or an eco-
logical system that is exposed to a particular dose or concentration of a hazardous agent, i.e. it depends on both the level of toxicity of hazardous agent and the level of exposure. It is expressed in values ranging from zero (certainty that an effect will not occur) to one (certainty that an effect will occur). (IPCS 1996)
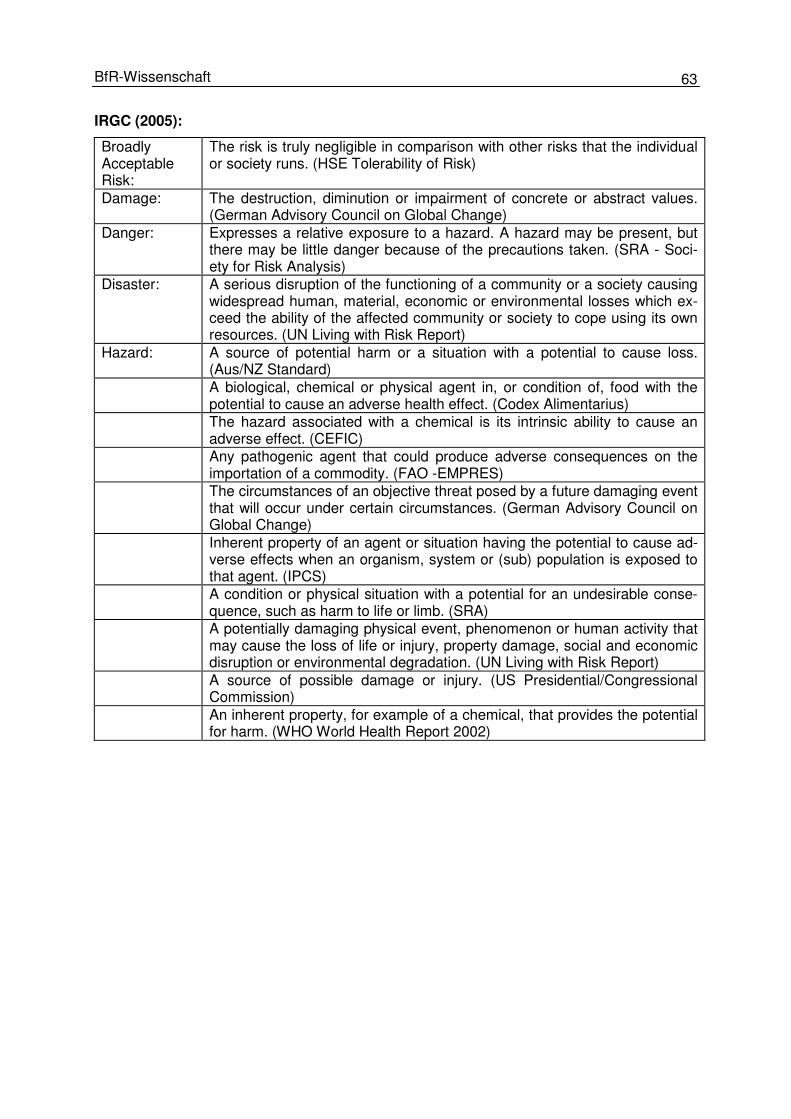
63 BfR-Wissenschaft
IRGC (2005):
Broadly Acceptable Risk:
The risk is truly negligible in comparison with other risks that the individual or society runs. (HSE Tolerability of Risk)
Damage: The destruction, diminution or impairment of concrete or abstract values. (German Advisory Council on Global Change)
Danger: Expresses a relative exposure to a hazard. A hazard may be present, but there may be little danger because of the precautions taken. (SRA - Soci-ety for Risk Analysis)
Disaster: A serious disruption of the functioning of a community or a society causing widespread human, material, economic or environmental losses which ex-ceed the ability of the affected community or society to cope using its own resources. (UN Living with Risk Report)
Hazard: A source of potential harm or a situation with a potential to cause loss. (Aus/NZ Standard)
A biological, chemical or physical agent in, or condition of, food with the potential to cause an adverse health effect. (Codex Alimentarius)
The hazard associated with a chemical is its intrinsic ability to cause an adverse effect. (CEFIC)
Any pathogenic agent that could produce adverse consequences on the importation of a commodity. (FAO -EMPRES)
The circumstances of an objective threat posed by a future damaging event that will occur under certain circumstances. (German Advisory Council on Global Change)
Inherent property of an agent or situation having the potential to cause ad-verse effects when an organism, system or (sub) population is exposed to that agent. (IPCS)
A condition or physical situation with a potential for an undesirable conse-quence, such as harm to life or limb. (SRA)
A potentially damaging physical event, phenomenon or human activity that may cause the loss of life or injury, property damage, social and economic disruption or environmental degradation. (UN Living with Risk Report)
A source of possible damage or injury. (US Presidential/Congressional Commission)
An inherent property, for example of a chemical, that provides the potential for harm. (WHO World Health Report 2002)
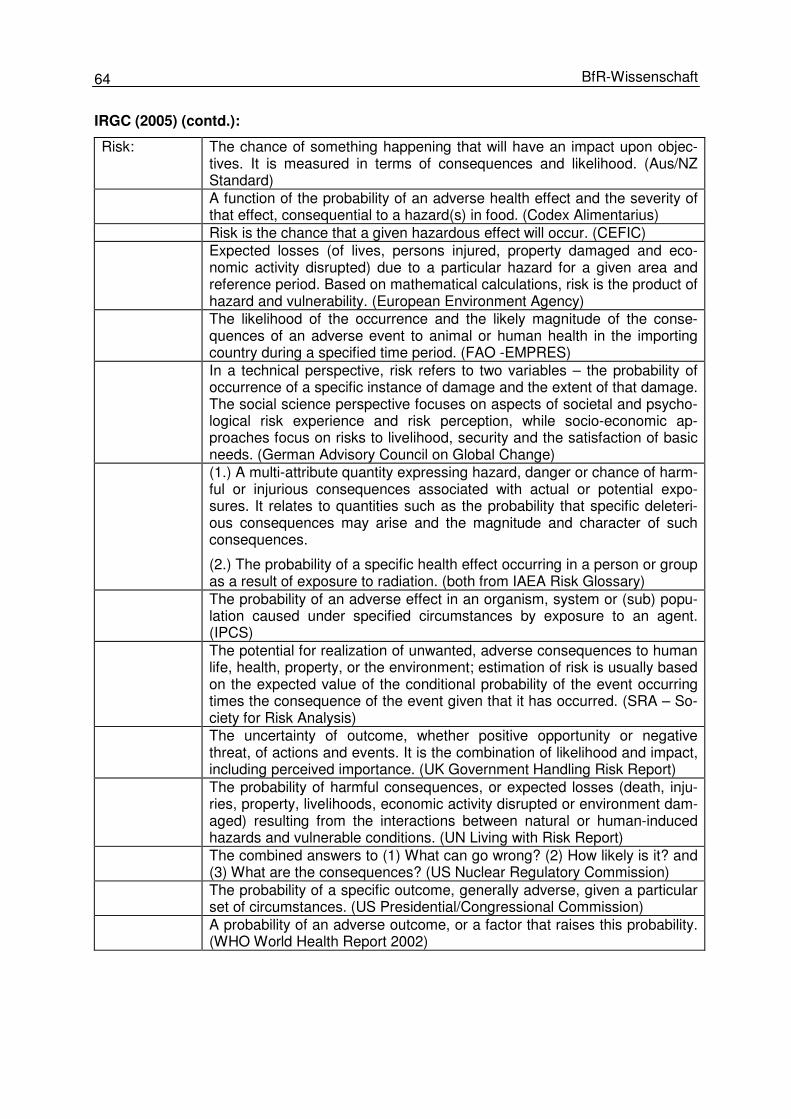
64 BfR-Wissenschaft
IRGC (2005) (contd.):
Risk:
The chance of something happening that will have an impact upon objec-tives. It is measured in terms of consequences and likelihood. (Aus/NZ Standard)
A function of the probability of an adverse health effect and the severity of that effect, consequential to a hazard(s) in food. (Codex Alimentarius)
Risk is the chance that a given hazardous effect will occur. (CEFIC) Expected losses (of lives, persons injured, property damaged and eco-
nomic activity disrupted) due to a particular hazard for a given area and reference period. Based on mathematical calculations, risk is the product of hazard and vulnerability. (European Environment Agency)
The likelihood of the occurrence and the likely magnitude of the conse-quences of an adverse event to animal or human health in the importing country during a specified time period. (FAO -EMPRES)
In a technical perspective, risk refers to two variables – the probability of occurrence of a specific instance of damage and the extent of that damage. The social science perspective focuses on aspects of societal and psycho-logical risk experience and risk perception, while socio-economic ap-proaches focus on risks to livelihood, security and the satisfaction of basic needs. (German Advisory Council on Global Change)
(1.) A multi-attribute quantity expressing hazard, danger or chance of harm-ful or injurious consequences associated with actual or potential expo-sures. It relates to quantities such as the probability that specific deleteri-ous consequences may arise and the magnitude and character of such consequences.
(2.) The probability of a specific health effect occurring in a person or group as a result of exposure to radiation. (both from IAEA Risk Glossary)
The probability of an adverse effect in an organism, system or (sub) popu-lation caused under specified circumstances by exposure to an agent. (IPCS)
The potential for realization of unwanted, adverse consequences to human life, health, property, or the environment; estimation of risk is usually based on the expected value of the conditional probability of the event occurring times the consequence of the event given that it has occurred. (SRA – So-ciety for Risk Analysis)
The uncertainty of outcome, whether positive opportunity or negative threat, of actions and events. It is the combination of likelihood and impact, including perceived importance. (UK Government Handling Risk Report)
The probability of harmful consequences, or expected losses (death, inju-ries, property, livelihoods, economic activity disrupted or environment dam-aged) resulting from the interactions between natural or human-induced hazards and vulnerable conditions. (UN Living with Risk Report)
The combined answers to (1) What can go wrong? (2) How likely is it? and (3) What are the consequences? (US Nuclear Regulatory Commission)
The probability of a specific outcome, generally adverse, given a particular set of circumstances. (US Presidential/Congressional Commission)
A probability of an adverse outcome, or a factor that raises this probability. (WHO World Health Report 2002)
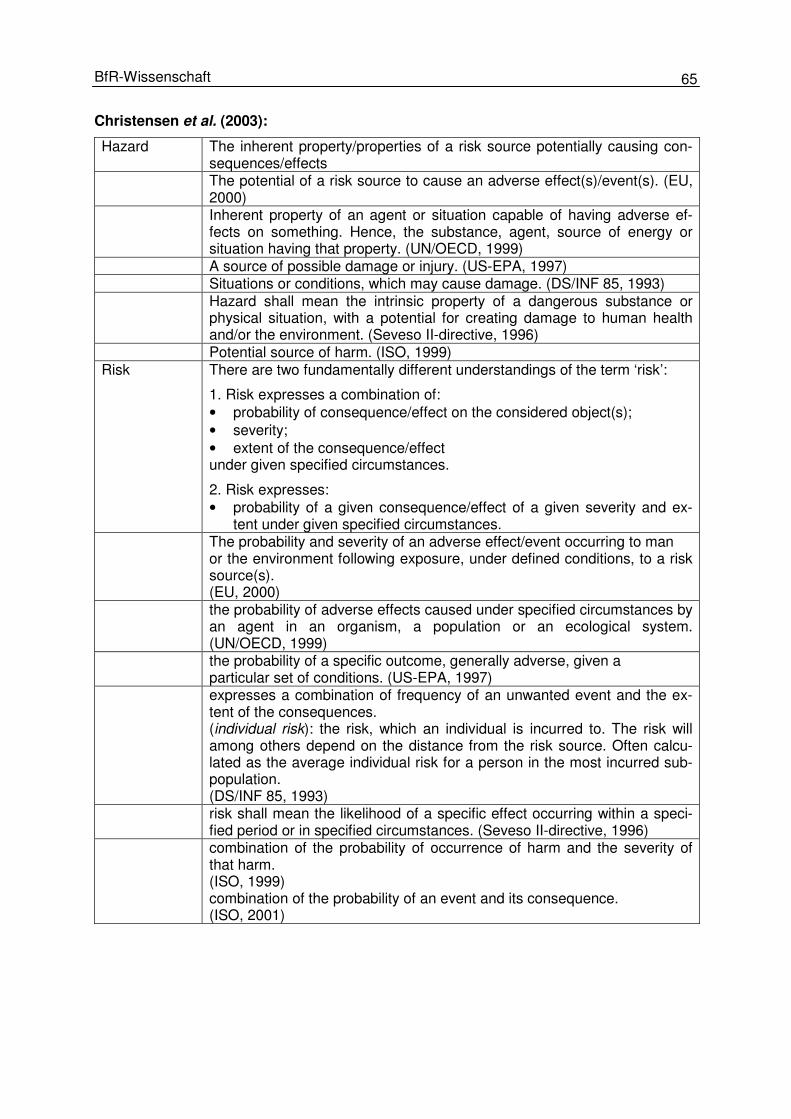
65 BfR-Wissenschaft
Christensen et al. (2003):
Hazard
The inherent property/properties of a risk source potentially causing con-sequences/effects
The potential of a risk source to cause an adverse effect(s)/event(s). (EU, 2000)
Inherent property of an agent or situation capable of having adverse ef-fects on something. Hence, the substance, agent, source of energy or situation having that property. (UN/OECD, 1999)
A source of possible damage or injury. (US-EPA, 1997) Situations or conditions, which may cause damage. (DS/INF 85, 1993) Hazard shall mean the intrinsic property of a dangerous substance or
physical situation, with a potential for creating damage to human health and/or the environment. (Seveso II-directive, 1996)
Potential source of harm. (ISO, 1999) Risk
There are two fundamentally different understandings of the term ‘risk’:
1. Risk expresses a combination of: • probability of consequence/effect on the considered object(s); • severity; • extent of the consequence/effect under given specified circumstances.
2. Risk expresses: • probability of a given consequence/effect of a given severity and ex-
tent under given specified circumstances. The probability and severity of an adverse effect/event occurring to man
or the environment following exposure, under defined conditions, to a risk source(s). (EU, 2000)
the probability of adverse effects caused under specified circumstances by an agent in an organism, a population or an ecological system. (UN/OECD, 1999)
the probability of a specific outcome, generally adverse, given a particular set of conditions. (US-EPA, 1997)
expresses a combination of frequency of an unwanted event and the ex-tent of the consequences. (individual risk): the risk, which an individual is incurred to. The risk will among others depend on the distance from the risk source. Often calcu-lated as the average individual risk for a person in the most incurred sub-population. (DS/INF 85, 1993)
risk shall mean the likelihood of a specific effect occurring within a speci-fied period or in specified circumstances. (Seveso II-directive, 1996)
combination of the probability of occurrence of harm and the severity of that harm. (ISO, 1999) combination of the probability of an event and its consequence. (ISO, 2001)
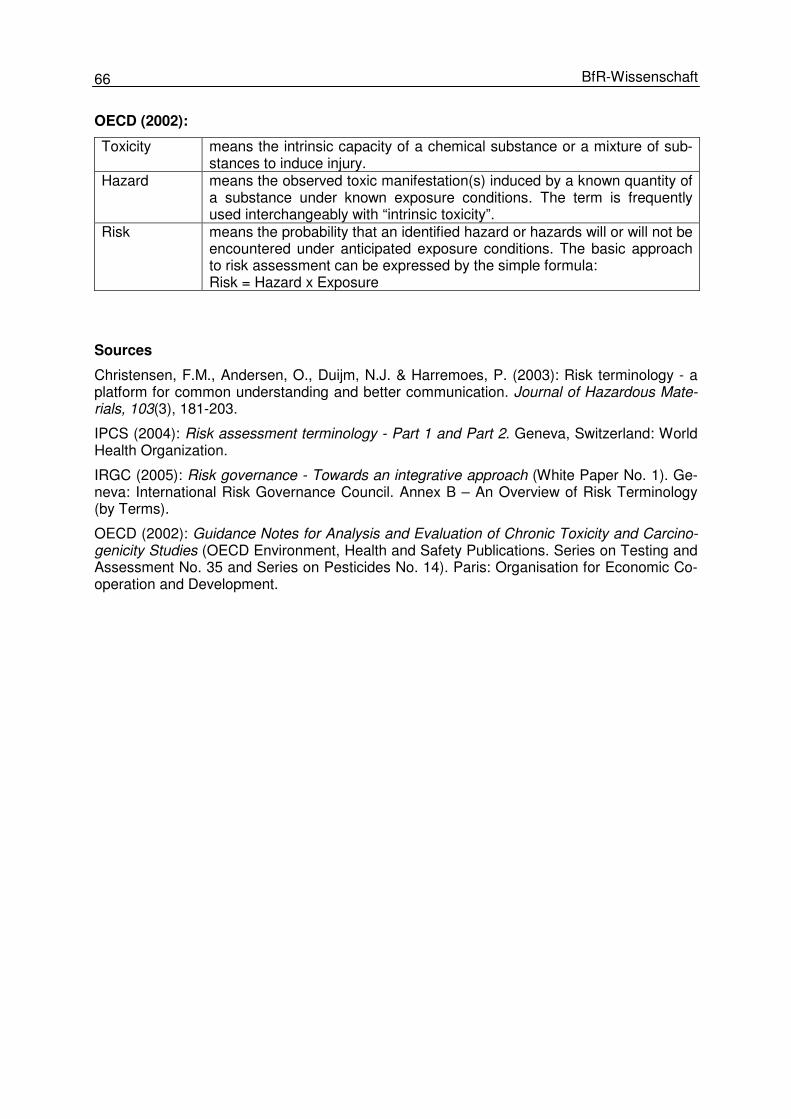
66 BfR-Wissenschaft
OECD (2002):
Toxicity
means the intrinsic capacity of a chemical substance or a mixture of sub-stances to induce injury.
Hazard
means the observed toxic manifestation(s) induced by a known quantity of a substance under known exposure conditions. The term is frequently used interchangeably with “intrinsic toxicity”.
Risk
means the probability that an identified hazard or hazards will or will not be encountered under anticipated exposure conditions. The basic approach to risk assessment can be expressed by the simple formula: Risk = Hazard x Exposure
Sources
Christensen, F.M., Andersen, O., Duijm, N.J. & Harremoes, P. (2003): Risk terminology - a platform for common understanding and better communication. Journal of Hazardous Mate-rials, 103(3), 181-203.
IPCS (2004): Risk assessment terminology - Part 1 and Part 2. Geneva, Switzerland: World Health Organization.
IRGC (2005): Risk governance - Towards an integrative approach (White Paper No. 1). Ge-neva: International Risk Governance Council. Annex B – An Overview of Risk Terminology (by Terms).
OECD (2002): Guidance Notes for Analysis and Evaluation of Chronic Toxicity and Carcino-genicity Studies (OECD Environment, Health and Safety Publications. Series on Testing and Assessment No. 35 and Series on Pesticides No. 14). Paris: Organisation for Economic Co-operation and Development.
67 BfR-Wissenschaft
11.2 Annex 2: Information needs of consumers
A survey by the Verbraucherzentrale Bundesverband e.V. (2004) looked at the information needs of consumers in Germany for instance in conjunction with food and textiles. The in-formation needs of consumers are dependent firstly on the following subjective factors:
• The experience the consumer has with the product, • How much time he has for purchasing it, • How frequently he buys it or a similar product, • The risks he links with his decision in favour of a product, • How high his expectations are concerning the quality of the chosen product (Kuß & Sil-
berer 2001, quoted according to: vzbv 2004: 6). Secondly, the information needs are determined by product characteristics Depending on how accessible they are for consumers, a distinction is made between search, experience and trust properties (Kaas 1990 quoted according to: vzbv 2004: 6). The search characteris-tics (for instance price or colour) can be directly perceived by the consumer. The experience characteristics (for instance flavour, storability or shelf life) only become “experienceable” when using the product. Mostly it costs the potential purchaser time and/or money to experi-ence the “experience properties” prior to purchase of the product. Hence other consumers who are experienced with the product are a particularly suitable source of information on experience properties. Consumers today are becoming increasingly skilled in assessing ex-perienciable product characteristics (search and experience properties). When their own competence reaches its limits, consumer advice centre and publications like “Stiftung War-entest” or “Öko-Test” provide information and assessment aids. Finally, trust characteristics are the ones which the individual consumer cannot directly verify at any point in time. Here he is dependent on information from the manufacturer. Examples for this are genetically produced or modified ingredients, health impacts, ecologically com-patible production of raw materials and compliance with social standards. The hazards and possible risks of products are, thus, mainly to be found amongst the trust properties. For consumers mandatory labelling on packaging is the most important source of information about food that is already on sale. Only few consumers make use of the advice offered in shops and on the Internet. The information which is paid the most attention is manufacturing date and fat content; the least attention is paid to ingredients and nutritional information. It is worth noting that the majority of respondents (72%) do not wish to do without any of the in-formation offerings even if they do not make use at all (or only rarely) of this information (what they mentioned most frequently were site of production and manufacturer's telephone number). Hence from the angle of the consumer there can be no talk of excessive informa-tion when it comes to the labelling of food. The study by Silver and Wogalter (1991) that examines, amongst other things, purchase in-tentions in the case of pesticides even shows that in the case of products that are deemed to be dangerous, additional information does not lead either to an unwillingness to read it or to a less pronounced willingness to purchase. Hence, it is not surprising that the satisfaction of the respondents with the information on food packaging is comparatively low. The more important the “trust characteristics” of some products, the more dissatisfied consumers are with existing information offerings. The au-thors of the vzbv study (2004) come to the conclusion that uncertainties about food are not at all remedied by the current information offerings.
68 BfR-Wissenschaft
In the case of food (and textiles) consumers want additional information about product char-acteristics that could impair their health and about those product characteristics that con-sumers are unable to assess themselves even during and after use of the product (trust characteristics). In the case of food, the respondents mention most frequently manufacturing date, allergenic substances, genetic engineering and all ingredients and raw materials. Much of the desired additional information is not product-specific and has to do with greater trans-parency about the manufacturing of products which guarantees healthier products. It is worth noting that when purchasing a product more and more attention is paid to ecological and social production qualities (compliance with social standards). The respondents wish to have the fastest possible access to the main consumer information (above all health-related information but also site of production and manufacturer's telephone number). Hence in the case of food and textiles the label or packaging are the preferred in-formation media. Alternative media for additional information are free-of-charge telephone lines and details of the manufacturers’ websites. When purchasing clothing information in the shop is another source. The acceptance of the Internet as a medium for “fetch information” is growing above all amongst the under 44-year-olds. Public institutions and agencies, by con-trast, are not seen as relevant information sources for daily consumer products. Consumers have a pressing wish for easier comparability of information about various prod-ucts. This is possible by means of important information presented in a specific, distinctive form about products like for instance the Bauer Engel or the Bio-Siegel. “By means of simple 'signalling' (“carries the Biosiegel” or “does not carrry the Biosiegel”), products can be easily distinguished by consumers […] The comprehensible and comparative (“standardised”) presentation of information for complex products with dominant trust characteristics is an essential component of successful market acceptance and market development.” (Ver-braucherzentrale Bundesverband e. V. (vzbv), 2004). 11.3 Annex 3: Problems of risk comparisons
Comparisons can render both hazards and risks easier to understand and help to convey their importance more effectively. Nonetheless there are also considerable reservations re-sulting mainly from the problems of a common yardstick, different levels of knowledge and different time distribution. The problem of the questionable common yardstick: Risks can be differentiate the by subject of protection, e.g. health risks can be distinguished from ecological and quality of life risks. A comparison of different risks is dependent on their being at least one common di-mension on the basis of which a comparison can be undertaken. Firstly, there are monetary sizes which can be recorded for instance via willingness to pay. This throws up difficult ques-tions and also touches more particularly concerning ethical yardsticks and values. The knowledge problem: The conclusion that knowledge about risks that are to be com-pared should itself be comparable is obvious. Any comparison that fails to consider the qual-ity of knowledge about risks, i.e. the estimation (un)certainties, is difficult. For instance it is almost impossible to compare the risks associated with radon and electromagnetic fields (EMF). In the case of radon we know about the hazard, the dose-response relationship is not disputed but the assumption is of a linear relationship with no threshold value. There may be a possible knowledge deficit about exposure. By contrast, in the case of high frequency EMF (at exposures below the limit values based on thermal effects) it is not clear whether the thermal effect constitutes a hazard (cf. SSK 2001). A risk comparison fails because in the case of radon an estimate can be made about how many cases of cancer are to be expected per year but this is unclear in the case of EMF. Given that electromagnetic fields are ubiqui-tous, a risk assessment is impossible as long as it is unclear whether there is a hazard.
69 BfR-Wissenschaft
The problem of distribution over time: Risks not only have different implementation chances they also have different latency periods. Years can pass between exposure and the possible emergence of the risk. Different latency periods – where all the other circumstances are similar – then require the recording of the respective damage at a same point in time. The problem of protected values: An initial comparison problem results from the aversion to the weighing up of alternatives. The works by Baron and Spranca (1997) and by Ritov and Baron (1999) who examined the influence of protected values (PV)30 are of relevance here. They understand protected values to mean absolute values which are so strong that they forbid any weighing up. Protected values of this kind are moral assessments of activities which blank out the consequences (one may not do x irrespective of how minimal the conse-quences are). This also blanks out the scale of the consequences (minor potential harm is just as bad as major potential harm). Furthermore protected values of this kind play a special role in the assessment of actively doing something (change in status quo compared with fail-ure to do anything (maintenance of status quo). This means comparisons are difficult if not impossible (Fiske & Tetlock, 1997). The problem of the implicit reference to the benefit: As a rule, risks are not assessed independently of their benefits. Experiments show a link between benefit and risk perception (e.g. Fischhoff et al. 1978; Harding & Eiser 1984; Alhakami & Slovic 1994). Here Finucane et al. (2000) have shown that risks are estimated to be lower when greater benefits are seen and vice versa. Furthermore the risk and benefit assessments, if they have to be undertaken under great time pressure, show a greater negative correlation in comparison to judgements with no time pressure. The problem of the emotional colouring of risks: Experiments show that the same risk information, when couched in different emotionally coloured contexts, leads to different risk assessments (Spangenberg 2003; Wiedemann, Clauberg & Schütz 2003). In the experi-ments the studies revealed a clear and highly significant statistical effect of the emotional context on the risk assessment of the described, objectively the same harmful event: test persons who assessed a story that triggered dismay as a rule gave higher risk estimates on average than test persons who were told a story that triggered a feeling of understanding. By means of these emotional processes, aspects of risk perception are activated that have noth-ing to do with the actual risks. The problem of stigmatisation: Stigmatisation31 of risk sources (cf. Kunreuther & Slovic, 2002) has an impact above all through association with emotionally negative images. For instance Slovic et al. (2001) found that “death”, “pollution” or “bad” in particular were linked to the concept of “nuclear waste storage facility”. Krewski et al. report (1995) a similar situation for the term “chemicals”. Peters, Burraston & Mertz (2004) took a closer look at the role of emotions in the stigmatisation of risk sources associated with ionising rays (nuclear power plants, nuclear weapons and radioactive waste from nuclear power plants). They found that the degree of stigmatisation depends above all on the negative emotions which are evoked amongst the study participants by the sources of radiation. The risk perception of these sources of radiation was also influenced to a major degree by these negative emotions; by contrast risk perception itself only had a minor impact on stigmatisation. The problem of the selective use of information: Studies by Wiedermann and Schütz (2002) on non-ionising rays clearly show that the group of concerned and unconcerned peo-
30 As a rule the experiments on protected values confront the test persons with a kind of moral dilemma. They must decide
whether a treatment can be used that will cost the lives of five people in order to save the lives of 500. 31 Kaperson et al. (2001, p.19) define stigma as "a mark placed on a person, place, technology, or product, associated with a
particular attribute that identifies it as different and deviant, flawed, or undesirable''.

70 BfR-Wissenschaft
ple all find the arguments convincing that correspond to their estimation of the risk and find those arguments to be less convincing which contradict their assessment of the risk. If one regards the two groups separately in respect of their willingness to change their risk percep-tion on the basis of new information then there are clear differences in the case of warnings. Warnings are deemed to be far more important by concerned individuals for a change in their own opinion than by unconcerned individuals. By contrast the differences between the groups in the case of the all-clear are far smaller. The concerned individuals all attributed a lower weighting to the all-clear when it comes to changes in their own risk assessment than they do to warnings. The problem of characteristic uncertainties: In the public discussions about risks, very different types of risks are taken into account. Considerable space is attributed to risks which result from exposure to contaminants. Here the uncertainty lies in the question about how probable and how severe the potential adverse health effects of an actual substance are. Another risk topic concerns the breakdown of technical plants. Here the question is whether substances that are known to be harmful may be released into the environment – in the case of breakdowns – and then have an impact. Breakdowns may also be of importance even when they are very rare and outside an individual’s direct experience if they are linked with particularly severe consequences. Finally “risks” are also discussed for which it is still not clear whether they are risks at all. Here there is uncertainty about whether the specific sub-stances or exposure situations can indeed lead at all to adverse health affects. Comparisons of these three categories of risk scarcely make any sense at all. Acceptance of risk comparisons: So far not enough empirical studies have been under-taken to determine whether risk comparisons are helpful and whether they are at all ac-cepted by the target groups. The research findings available so far point to the following con-clusions32. (1) Risk comparisons are accepted. (2) They can influence the understanding of risk. (3) They have scarcely any impact on risk perception. (4) They hardly influence risk ac-ceptance at all.
32 A comprehensive summary of the results is given in Schütz et al., 2006, Chapter 4)
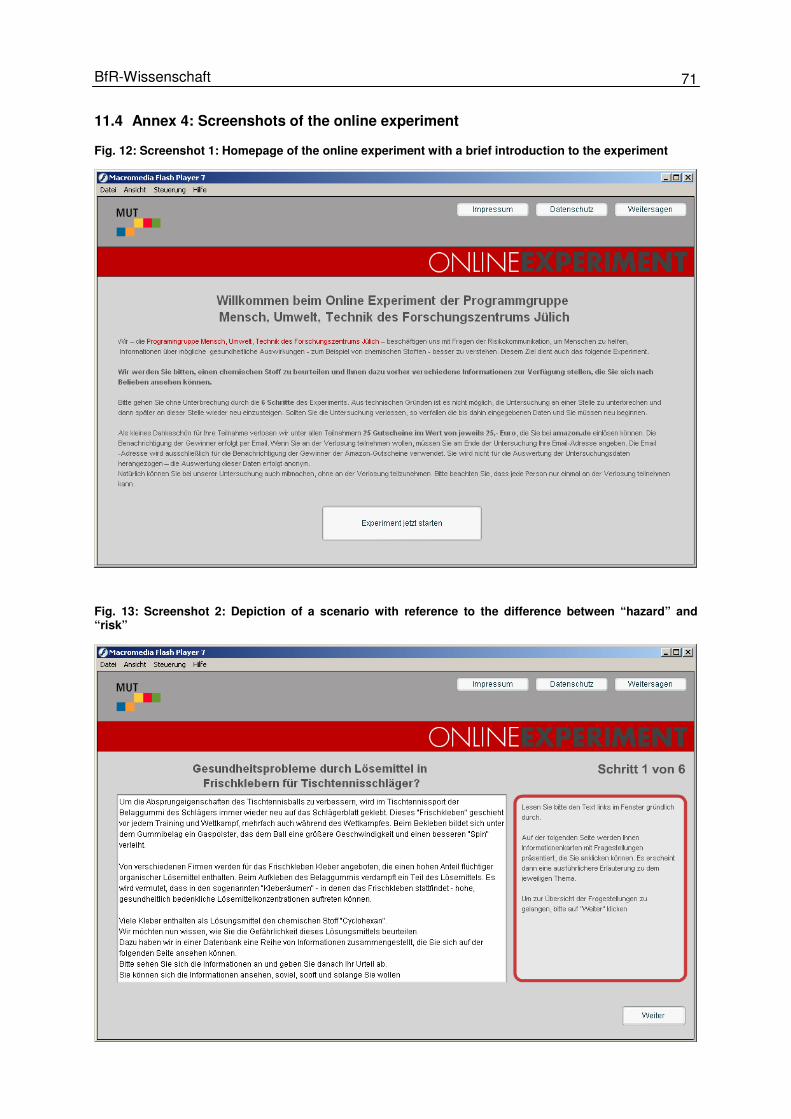
71 BfR-Wissenschaft
11.4 Annex 4: Screenshots of the online experiment
Fig. 12: Screenshot 1: Homepage of the online experiment with a brief introduction to the experiment
Fig. 13: Screenshot 2: Depiction of a scenario with reference to the difference between “hazard” and “risk”
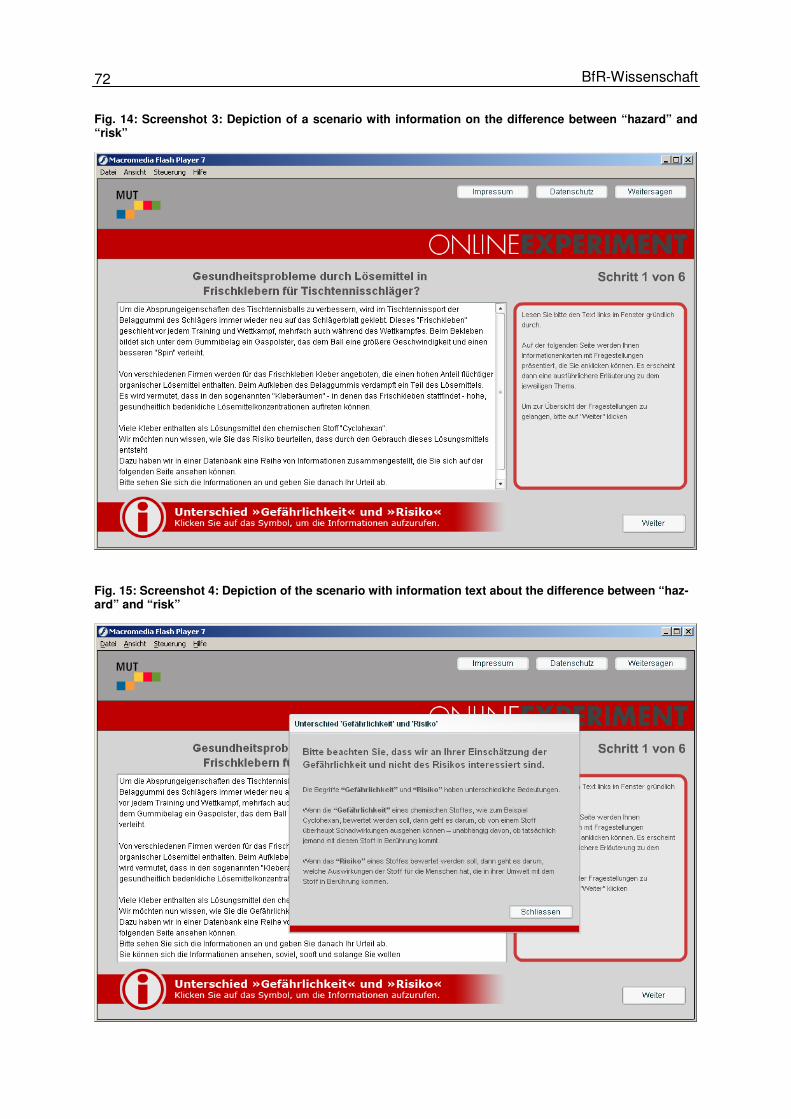
72 BfR-Wissenschaft
Fig. 14: Screenshot 3: Depiction of a scenario with information on the difference between “hazard” and “risk”
Fig. 15: Screenshot 4: Depiction of the scenario with information text about the difference between “haz-ard” and “risk”
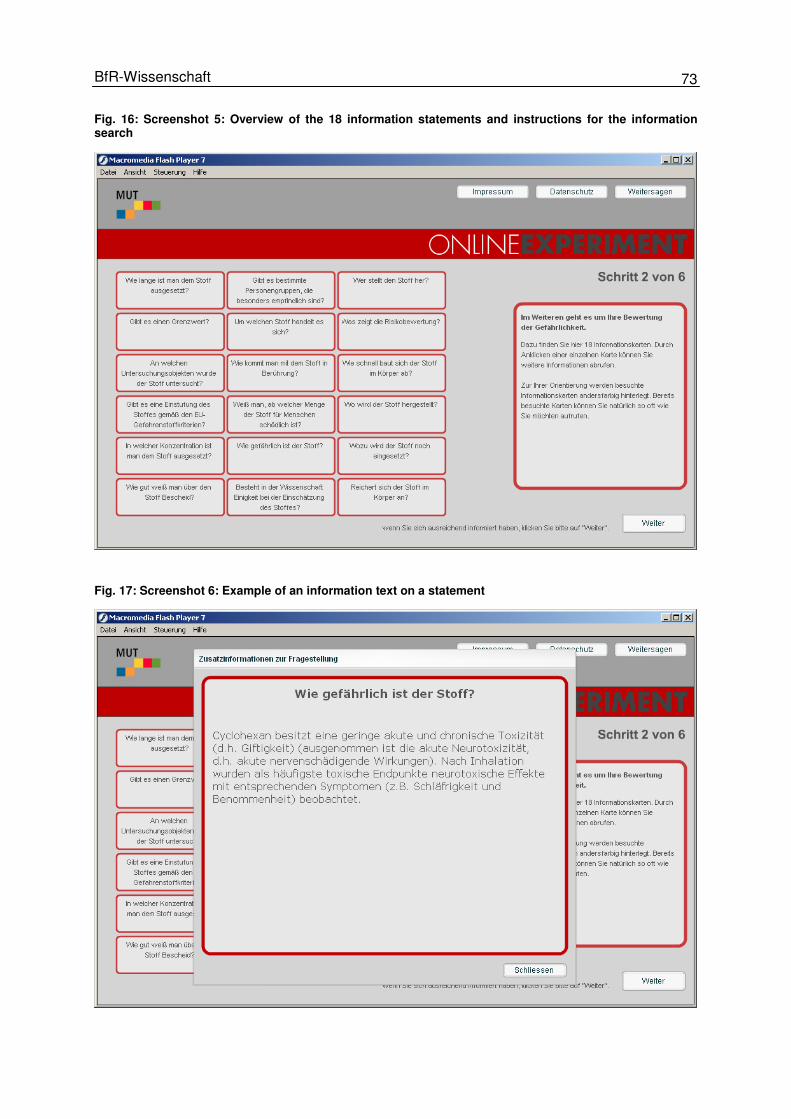
73 BfR-Wissenschaft
Fig. 16: Screenshot 5: Overview of the 18 information statements and instructions for the information search
Fig. 17: Screenshot 6: Example of an information text on a statement

74 BfR-Wissenschaft
Fig. 18: Screenshot 7: Answer scale for “hazard assessment” and “risk assessment”
Fig. 19: Screenshot 8: Ranking
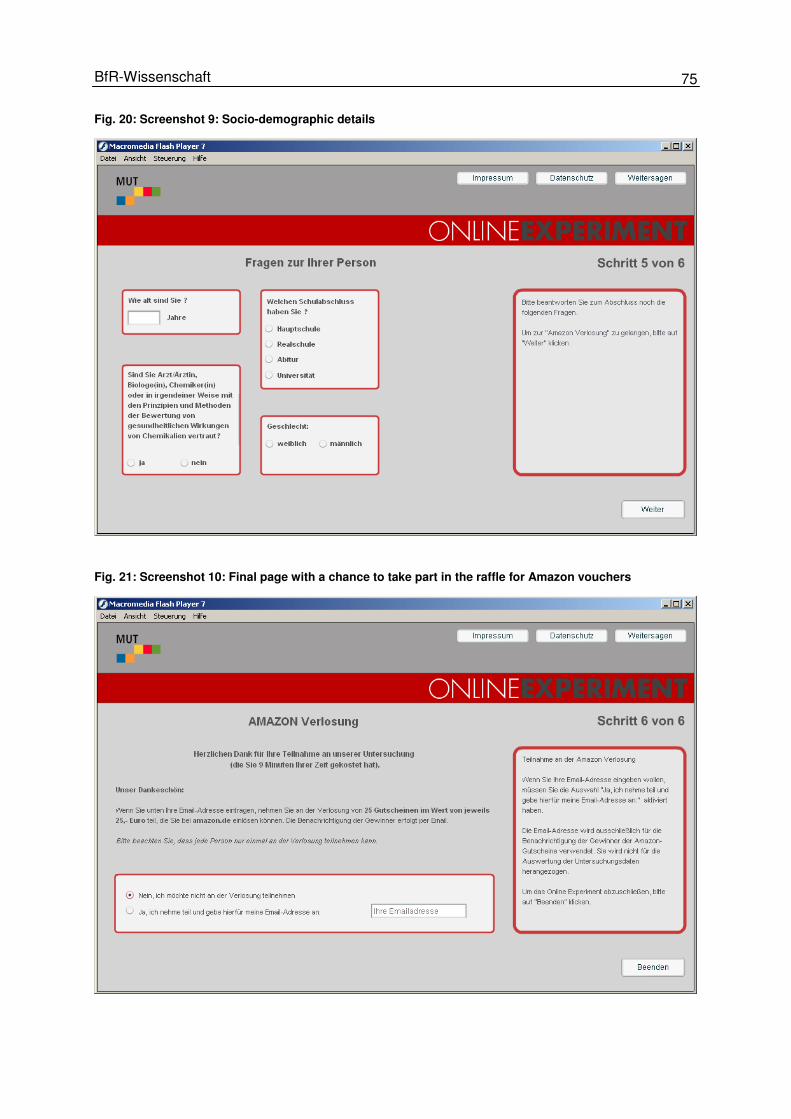
75 BfR-Wissenschaft
Fig. 20: Screenshot 9: Socio-demographic details
Fig. 21: Screenshot 10: Final page with a chance to take part in the raffle for Amazon vouchers

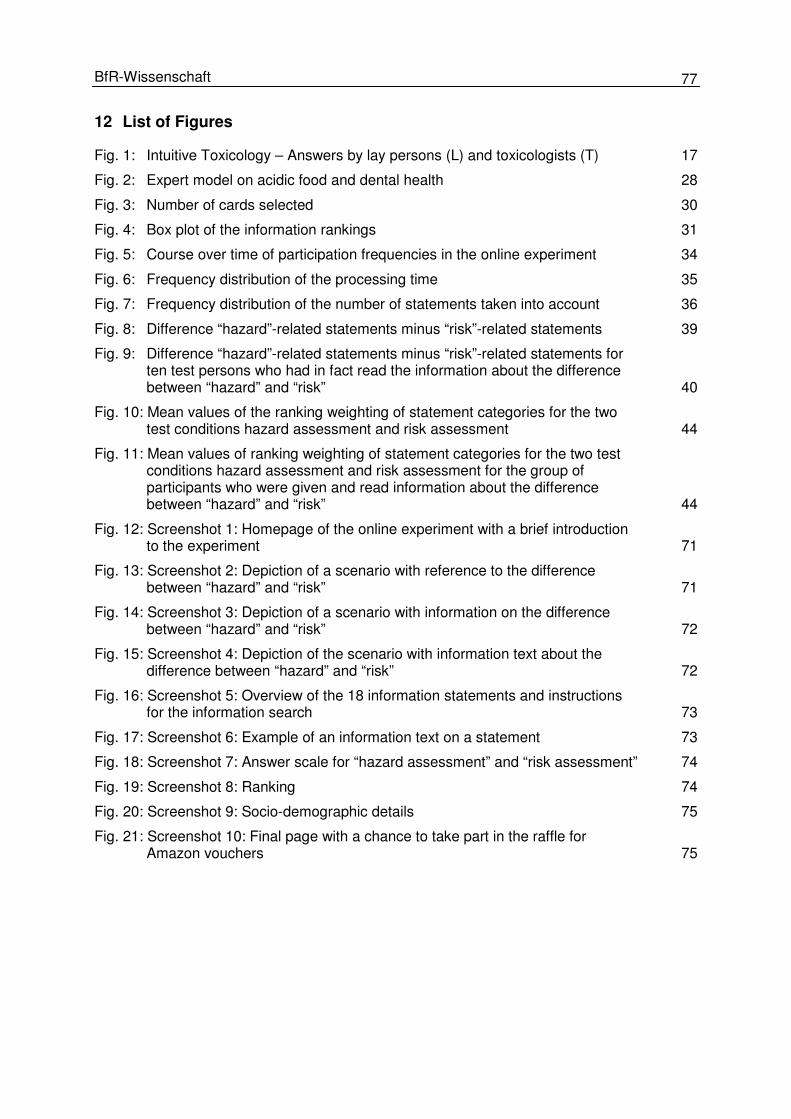
77 BfR-Wissenschaft
12 List of Figures
Fig. 1: Intuitive Toxicology – Answers by lay persons (L) and toxicologists (T) 17
Fig. 2: Expert model on acidic food and dental health 28
Fig. 3: Number of cards selected 30
Fig. 4: Box plot of the information rankings 31
Fig. 5: Course over time of participation frequencies in the online experiment 34
Fig. 6: Frequency distribution of the processing time 35
Fig. 7: Frequency distribution of the number of statements taken into account 36
Fig. 8: Difference “hazard”-related statements minus “risk”-related statements 39
Fig. 9: Difference “hazard”-related statements minus “risk”-related statements for ten test persons who had in fact read the information about the difference between “hazard” and “risk” 40
Fig. 10: Mean values of the ranking weighting of statement categories for the two test conditions hazard assessment and risk assessment 44
Fig. 11: Mean values of ranking weighting of statement categories for the two test conditions hazard assessment and risk assessment for the group of participants who were given and read information about the difference between “hazard” and “risk” 44
Fig. 12: Screenshot 1: Homepage of the online experiment with a brief introduction to the experiment 71
Fig. 13: Screenshot 2: Depiction of a scenario with reference to the difference between “hazard” and “risk” 71
Fig. 14: Screenshot 3: Depiction of a scenario with information on the difference between “hazard” and “risk” 72
Fig. 15: Screenshot 4: Depiction of the scenario with information text about the difference between “hazard” and “risk” 72
Fig. 16: Screenshot 5: Overview of the 18 information statements and instructions for the information search 73
Fig. 17: Screenshot 6: Example of an information text on a statement 73
Fig. 18: Screenshot 7: Answer scale for “hazard assessment” and “risk assessment” 74
Fig. 19: Screenshot 8: Ranking 74
Fig. 20: Screenshot 9: Socio-demographic details 75
Fig. 21: Screenshot 10: Final page with a chance to take part in the raffle for Amazon vouchers 75

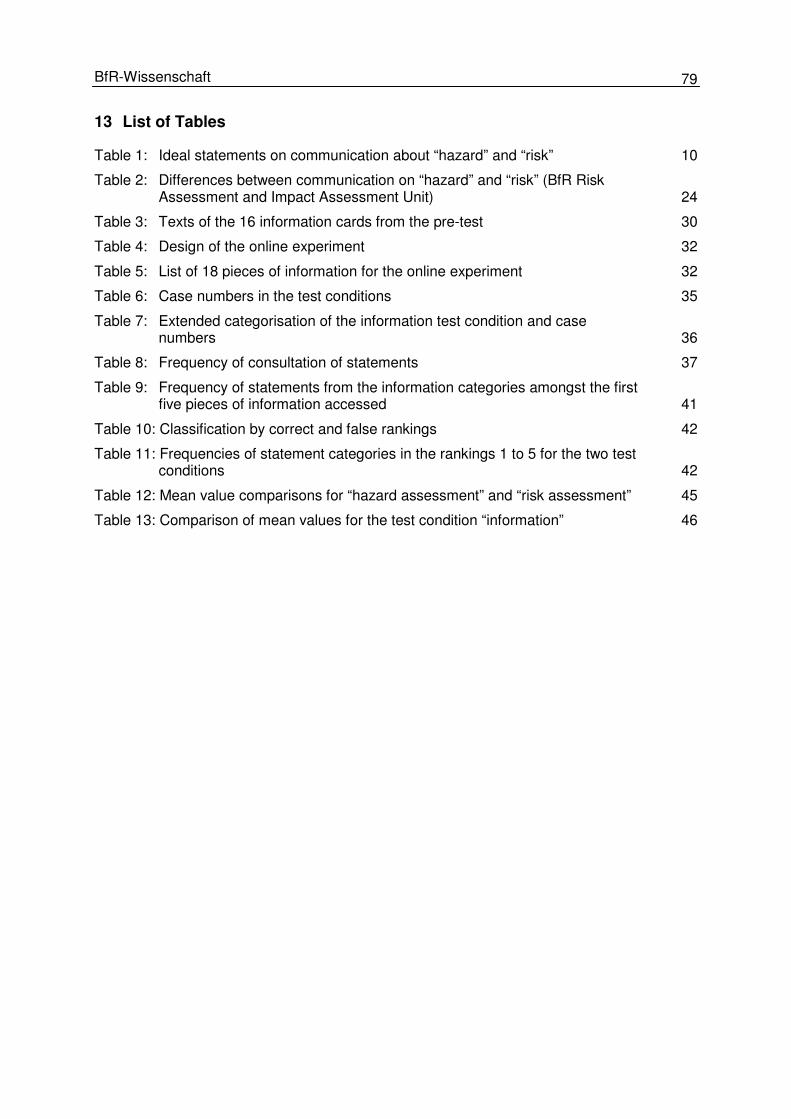
79 BfR-Wissenschaft
13 List of Tables
Table 1: Ideal statements on communication about “hazard” and “risk” 10
Table 2: Differences between communication on “hazard” and “risk” (BfR Risk Assessment and Impact Assessment Unit) 24
Table 3: Texts of the 16 information cards from the pre-test 30
Table 4: Design of the online experiment 32
Table 5: List of 18 pieces of information for the online experiment 32
Table 6: Case numbers in the test conditions 35
Table 7: Extended categorisation of the information test condition and case numbers 36
Table 8: Frequency of consultation of statements 37
Table 9: Frequency of statements from the information categories amongst the first five pieces of information accessed 41
Table 10: Classification by correct and false rankings 42
Table 11: Frequencies of statement categories in the rankings 1 to 5 for the two test conditions 42
Table 12: Mean value comparisons for “hazard assessment” and “risk assessment” 45
Table 13: Comparison of mean values for the test condition “information” 46

81 BfR-Wissenschaft
Publications in the BfR-Wissenschaft series 01/2004 Edited by L. Ellerbroek, H. Wichmann-Schauer, K. N. Mac
Methoden zur Identifizierung und Isolierung von Enterokokken und deren Resistenzbestimmung
€ 5 02/2004 Edited by M. Hartung
Epidemiologische Situation der Zoonosen in Deutschland im Jahr 2002 € 15
03/2004 Edited by A. Domke, R. Großklaus, B. Niemann, H. Przyrembel,
K. Richter, E. Schmidt, A. Weißenborn, B. Wörner, R. Ziegenhagen Verwendung von Vitaminen in Lebensmitteln – Toxikologische und ernäh-rungsphysiologische Aspekte
€ 15 04/2004 Edited by A. Domke, R. Großklaus, B. Niemann, H. Przyrembel,
K. Richter, E. Schmidt, A. Weißenborn, B. Wörner, R. Ziegenhagen Verwendung von Mineralstoffen in Lebensmitteln – Toxikologische und ernäh-rungsphysiologische Aspekte € 15
05/2004 Edited by M. Hartung
Epidemiologische Situation der Zoonosen in Deutschland im Jahr 2003 € 15
01/2005 Edited by A. Weißenborn, M. Burger, G.B.M. Mensink, C. Klemm,
W. Sichert-Hellert, M. Kersting und H. Przyrembel Folsäureversorgung der deutschen Bevölkerung – Abschlussbericht zum For-schungsvorhaben € 10
02/2005 Edited by R. F. Hertel, G. Henseler
ERiK – Entwicklung eines mehrstufigen Verfahrens der Risikokommunikation € 10
03/2005 Edited by P. Luber, E. Bartelt
Campylobacteriose durch Hähnchenfleisch Eine quantitative Risikoabschätzung € 5
04/2005 Edited by A. Domke, R. Großklaus, B. Niemann. H. Przyrembel,
K. Richter, E. Schmidt, A. Weißenborn, B. Wörner, R. Ziegenhagen Use of Vitamins in Foods Toxicological and nutritional-physiological aspects € 15
01/2006 Edited by A. Domke, R. Großklaus, B. Niemann, H. Przyrembel,
K. Richter, E. Schmidt, A. Weißenborn, B. Wörner, R. Ziegenhagen Use of Minerals in Foods Toxicological and nutritional-physiological aspects € 15
82 BfR-Wissenschaft
02/2006 Edited by A. Schulte, U. Bernauer, S. Madle, H. Mielke, U. Herbst, H.-B. Rich-ter-Reichhelm, K.-E. Appel, U. Gundert-Remy Assessment of the Carcinogenicity of Formaldehyde € 10
03/2006 Edited by W. Lingk, H. Reifenstein, D. Westphal, E. Plattner
Humanexposition bei Holzschutzmitteln – Abschlussbericht zum Forschungsvorhaben € 5
04/2006 Edited by M. Hartung
Epidemiologische Situation der Zoonosen in Deutschland im Jahr 2004 Übersicht über die Meldungen der Bundesländer € 15
05/2006 Edited by J. Zagon, G. Crnogorac, L. Kroh, M. Lahrssen-
Wiederholt, H. Broll Nachweis von gentechnisch veränderten Futtermitteln – Eine Studie zur Anwendbarkeit von Verfahren aus der Lebensmittelanalytik € 10
06/2006 Edited by A. Weißenborn, M. Burger, G.B.M. Mensink, C. Klemm,
W. Sichert-Hellert, M. Kersting, H. Przyrembel Folic acid intake of the German population – Final report on the research pro-ject € 10
01/2007 Edited by A. Epp, R. Hertel, G.-F. Böl Acrylamid in Lebensmitteln – Ändert Risikokommunikation das Verbraucher-
verhalten? € 5
02/2007 Edited by B. Niemann, C. Sommerfeld, A. Hembeck, C. Bergmann
Lebensmittel mit Pflanzensterinzusatz in der Wahrnehmung der Verbraucher Projektbericht über ein Gemeinschaftsprojekt der Verbraucherzentralen und des BfR € 5
03/2007 Edited by M. Hartung
Epidemiologische Situation der Zoonosen in Deutschland im Jahr 2005 Übersicht über die Meldungen der Bundesländer € 15
04/2007 Edited by R. F. Hertel, G. Henseler
ERiK – Development of a multi-stage risk communication process € 10
05/2007 Edited by B. Niemann, C. Sommerfeld, A. Hembeck, C. Bergmann
Plant sterol enriched foods as perceived by consumers Project report on a joint project of consumer advice centres and BfR € 5
83 BfR-Wissenschaft
01/2008 Edited by A. Epp, R. Hertel, G.-F. Böl Formen und Folgen behördlicher Risikokommunikation € 5
02/2008 Edited by T. Höfer, U. Gundert-Remy, A. Epp, G.-F. Böl
REACH: Kommunikation zum gesundheitlichen Verbraucherschutz € 10
03/2008 Edited by R. Zimmer, R. Hertel, G.-F. Böl
BfR-Verbraucherkonferenz Nanotechnologie Modellprojekt zur Erfassung der Risikowahrnehmung bei Verbrauchern € 5
04/2008 Edited by M. Hartung
Erreger von Zoonosen in Deutschland im Jahr 2006 Mitteilungen der Länder zu Lebensmitteln, Tieren, Futtermitteln und Umweltproben
€ 15 05/2008 Edited by R. Zimmer, R. Hertel, G.-F. Böl
Wahrnehmung der Nanotechnologie in der Bevölkerung Repräsentativerhebung und morphologisch-psychologische Grundlagenstudie € 10
01/2009 Edited by R. Zimmer, R. Hertel, G.-F. Böl
Public Perceptions about Nanotechnoloogy Representative survey and basic morphological-psychological study € 10
02/2009 Edited by E. Ulbig, R. F. Hertel, G.-F. Böl
Evaluierung der Kommunikation über die Unterschiede zwischen „risk“ und „hazard“ – Abschlussbericht € 5,-
03/2009 Edited by R. Zimmer, R. Hertel, G.-F. Böl BfR Consumer Conference Nanotechnology
Pilot project to identify consumer risk perception € 5,- 04/2009 Edited by R. Zimmer, R. Hertel, G.-F. Böl
BfR-Delphi-Studie zur Nanotechnologie Expertenbefragung zum Einsatz von Nanomaterialien in Lebensmitteln und Verbraucherprodukten € 10,-
05/2009 Edited by M. Hartung
Erreger von Zoonosen in Deutschland im Jahr 2007 Mitteilungen der Länder zu Lebensmitteln, Tieren, Futtermitteln und Umweltproben € 15
84 BfR-Wissenschaft
01/2010 Edited by E. Ulbig, R. F. Hertel, G.-F. Böl Kommunikation von Risiko und Gefährdungspotenzial aus Sicht verschiedener
Stakeholder € 10 The publications in the BfR-Wissenschaft series are available from: Federal Institute for Risk Assessment (BfR) Press Office Thielallee 88-92 D-14195 Berlin Fax: 030-18412 4970 E-Mail: [email protected]