evaluation of co2 treatment and the impact on watershed ... · evaluation of co 2 treatment and the...
TRANSCRIPT

KONKUK UNIVERSITY
27 July 2016
Evaluation of CO2 Treatment and the Impact on
Watershed Hydrology in SWAT Using Terra MODIS GPP
JUNG, Chung-GilPh. D. Candidate
LEE, Ji-Wan / AHN, So-RaGraduate Student / Ph. D.
KIM, Seong-JoonProfessor
Dept. of Civil and Environmental System Eng.,
Konkuk University, Seoul, South Korea
2013 International SWAT Conference, Beijing, China

Konkuk University
ContentsI. Introduction
II. Current Status
III. Flow Chart
IV. Material and Methods
Study Watershed
Input data
Model Description and Theory
V. Results and Discussion
Model Calibration and Validation
Impact on hydrologic components
VI. Results and Discussion
1 / 18

Konkuk University
3
Fossil fuel consumption has caused an increase in anthropogenic emissions of
carbon dioxide (CO2) and other greenhouse gases.
Elevated atmospheric CO2 concentration directly affects plant growth, which
inherently is tied with the hydrological cycle, through lowered rates of stomatal
conductance and increases in leaf area.
Many studies based on observations and modeling have implied increased CO2
concentrations and climate change have significant impacts on hydrological
systems. However, estimation approach of the CO2 concentration is that it is not
possible to take into account the quantification of spatial CO2 concentration within
watershed.
These potential impacts can be quantified for a specific watershed using
hydrological models.
Using Terra MODIS GPP image and Soil and Water Assessment Tool (SWAT) model,
this study is to evaluate the potential CO2 change impact on hydrologic components in a
forest dominant Seolma-cheon watershed (8,48 km2) of South Korea
Introduction
2 / 18

Konkuk University
4Current Status
3 / 18
Anmyeondo (South Korea)
Gosan (South Korea)
Ulleungdo (South Korea)
Dokdo (South Korea)
Global
Data Type Global Anmyeondo (South Korea)
2015. 03 400.83 PPM 411.03 PPM
2014 397.16 PPM 404.84 PPM
Increase ratio
(2012 ~ 2014)2.25 PPM 2.42 PPM
Measure CO2 at 4 stations by Korea Global Atmosphere Center in South Korea

Konkuk University
Flow Chart
Meteorological Data GIS Data Observed Data
Precipitation,
Temperature,
Wind Speed,
Solar Radiation,
Relative Humidity
DEM,
Land Use,
Soil type
Streamflow,
Evapotranspiration,
Soil Moisture
SWAT Model
Calibration / Validation
Adopted satellite image
data
MODIS Gross Primary
Productivity (GPP)
(2010~2012)
Create actual CO2
concentration
Calibration with flux CO2 and
quantification
Using Lloyd and Taylor
method
Simulation with CO2
estimated by MODIS GPP
Hydrological Behavior
Streamflow, Evapotranspiration,
Soil Moisture
Estimation of respiration
<Sub algorithm>
4 / 18
Konkuk University
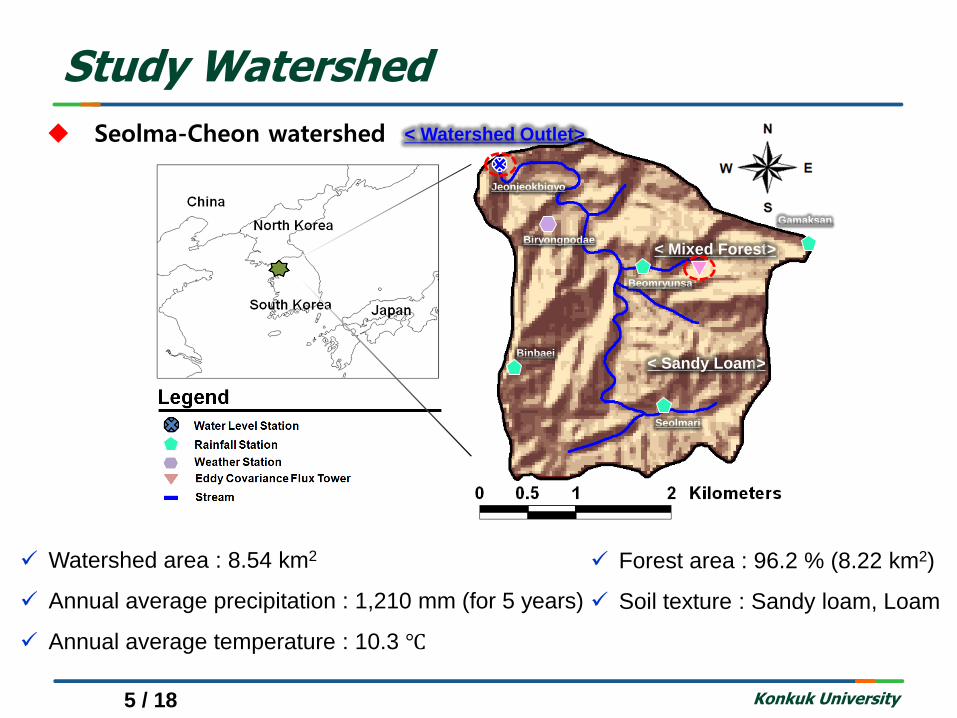
Study Watershed
Watershed area : 8.54 km2
Annual average precipitation : 1,210 mm (for 5 years)
Annual average temperature : 10.3 ℃
Seolma-Cheon watershed
Forest area : 96.2 % (8.22 km2)
Soil texture : Sandy loam, Loam
Jeonjeokbigyo
< Mixed Forest>
< Sandy Loam>
< Watershed Outlet>
Biryongpodae
Binbaei
Seolmari
Gamaksan
Beomryunsa
5 / 18

Konkuk University
Data set for SWAT model
Input and Measured Data
Data Type SourceScale /
PeriodsData Description / Properties
TerrainKorea National Geography
Institute30 m Digital Elevation Model (DEM)
SoilKorea Rural Development
Administration1/25,000
Soil classification and physical properties viz.
texture, porosity, field capacity, wilting point,
saturated conductivity, and soil depth
Land use2004 Landsat TM
Satellite Image 1/25,000 Landsat land use classification (8 classes)
Weather
Korea Institute of
Construction Technology /
WAter Management
Information System
1971-2009
Daily precipitation, minimum and maximum
temperature, mean wind speed and relative
humidity data
StreamflowKorea Institute of
Construction Technology2003-2012 Daily streamflow data at watershed outlet
Evapo-
transpiration
Korea Institute of
Construction Technology /
Yonsei Univ.
2008-2012Daily evapotranspiration data at mixed forest
area
6 / 18

Konkuk University
SWAT Input data
(b) Soil(a) DEM (c) Landuse
GIS Input Data
7 / 18
Konkuk University
SWAT Model theory
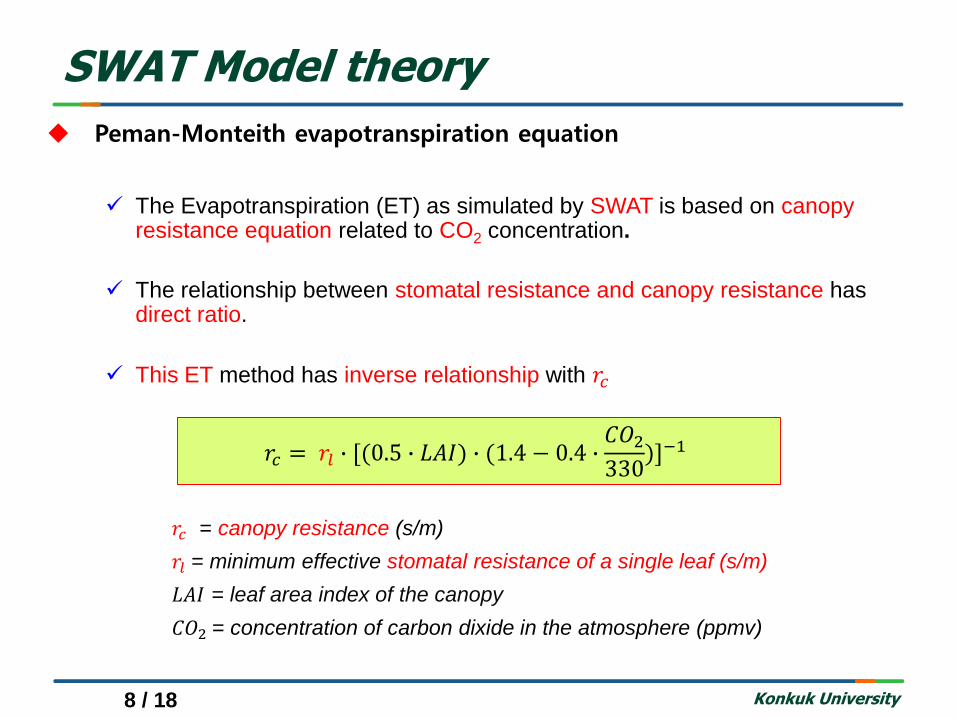
Peman-Monteith evapotranspiration equation
The Evapotranspiration (ET) as simulated by SWAT is based on canopy resistance equation related to CO2 concentration.
The relationship between stomatal resistance and canopy resistance has direct ratio.
This ET method has inverse relationship with 𝑟𝑐
8 / 18
𝑟𝑐 = canopy resistance (s/m)
𝑟𝑙 = minimum effective stomatal resistance of a single leaf (s/m)
𝐿𝐴𝐼 = leaf area index of the canopy
𝐶𝑂2 = concentration of carbon dixide in the atmosphere (ppmv)
𝑟𝑐 = 𝑟𝑙 ∙ [(0.5 ∙ 𝐿𝐴𝐼) ∙ (1.4 − 0.4 ∙𝐶𝑂2330
)]−1

Konkuk University
CO2 Estimation
CO2 flux theory
9 / 18
CO2 emission in atmosphere for respiration
CO2 absorption in atmosphere for photosynthesis

Konkuk University
CO2 flux theory
10 / 18
Gross Primary Production (GPP) is absorbed amount by photosynthesis from
animals and plants
Re is total respiration from animals and plants
Net Echo-system Exchange (NEE) means total CO2 flux on soil, and NPP (Net
Primary Production) is practically absorption CO2 by a plant community
Also, NEE is net CO2 flux for a day (day and night)
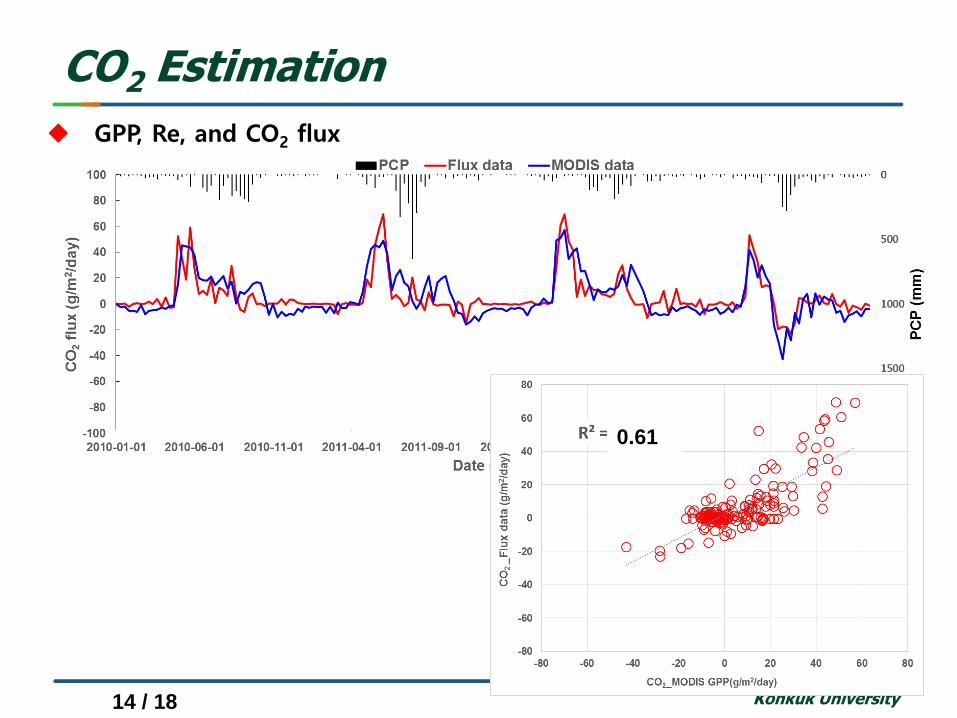
NEE is calculated by GPP and Re from following equation:
GPP (MODIS GPP) – Re (Lloyd and Taylor method) = NEE (CO2 concentration)
CO2 Estimation

Konkuk University
Lloyd and Taylor method (1994)
13 / 18
Re (ecosystem respiration) Estimation
Re = ecosystem respiration (mm)
Rref = the normalized ecosystem respiration at reference temperature (Tref = 10℃)
E0 = activation energy which is a fitted site-specific parameter (J/mol)
T0 = -46.02℃
Ta = Air temperature (mm)
𝑅𝑒 = 𝑅𝑟𝑒𝑓 ∙ 𝑒𝑥𝑝(𝐸0 ∙1
𝑇𝑟𝑒𝑓 − 𝑇0−
1
𝑇𝑎 − 𝑇0)
We use Lloyd and Taylor equation for estimation of ecosystem respiration.
The ecosystem respiration equation is shown as following equation. Especially,
the Rref and E0 are empirical coefficients using regression analysis with air
temperature.
We could analyze regression analysis about the coefficients. So, Rref and E0
resulted in 0.054 mg/m·s and 204.8 K respectively.

Konkuk University
MODIS GPP QC and Gap-filling process
11 / 18
GPP Estimation
MODIS GPP(MOD17A2)
MODIS Cloud Area
(MOD10A1)
overlayExtracted Valid
GPPExtract
valid pixel
Modified GPP
Gap-Filling

Konkuk University
Gap-filling process
12 / 18
GPP Estimation
Overlay
GPP Gap-Filling
QCCloud
Cloud
Konkuk University
GPP, Re, and CO2 flux
CO2 Estimation
0.61
14 / 18

Konkuk University
Streamflow, Evapotranspiration
Calibration and Validation
<Watershed Outlet>
<Mixed Forest>
<Sandy Loam>ET: R2= 0.59
15 / 18
Q: R2= 0.77, NSE= 0.75

Konkuk University
Quantification of actual estimated CO2 concentration
Impact on hydrologic components
CO2 flux is the incoming and returning movement of atmosphere CO2.
So, we defined that atmosphere CO2 concentration is sum of annual CO2 flux.
The unit of the estimated CO2 flux is converted as PPM unit.
16 / 18
YearActual estimated CO2 concentration
(PPM)
SWAT default 330.0
2010 351.7
2011 375.2
2012 404.9

Konkuk University
Application of estimated CO2 concentration
Impact on hydrologic components
The result of ET applied estimated CO2 concentration (351.7, 375.2, 404.9)
has difference from -2.47mm/month to 2.18mm/month (ET applied estimated
CO2 – default (330ppm) ET).
The result of water yield (WY) applied estimated CO2 concentration (351.7,
375.2, 404.9) has difference from -0.02 mm/month to 3.52 mm/month (WY
applied estimated CO2 – default (330ppm) WY).
The result of soil water content (SW) applied estimated CO2 concentration
(351.7, 375.2, 404.9) has difference from 3.5 % to 12.9 % (SW applied
estimated CO2 – default (330ppm) SW).
Because this study area is very small, the change amount of hydrological
components didn’t be shown definitely. So, we illustrate the differences
between SWAT result applied estimated CO2 and default SWAT result.
Konkuk University
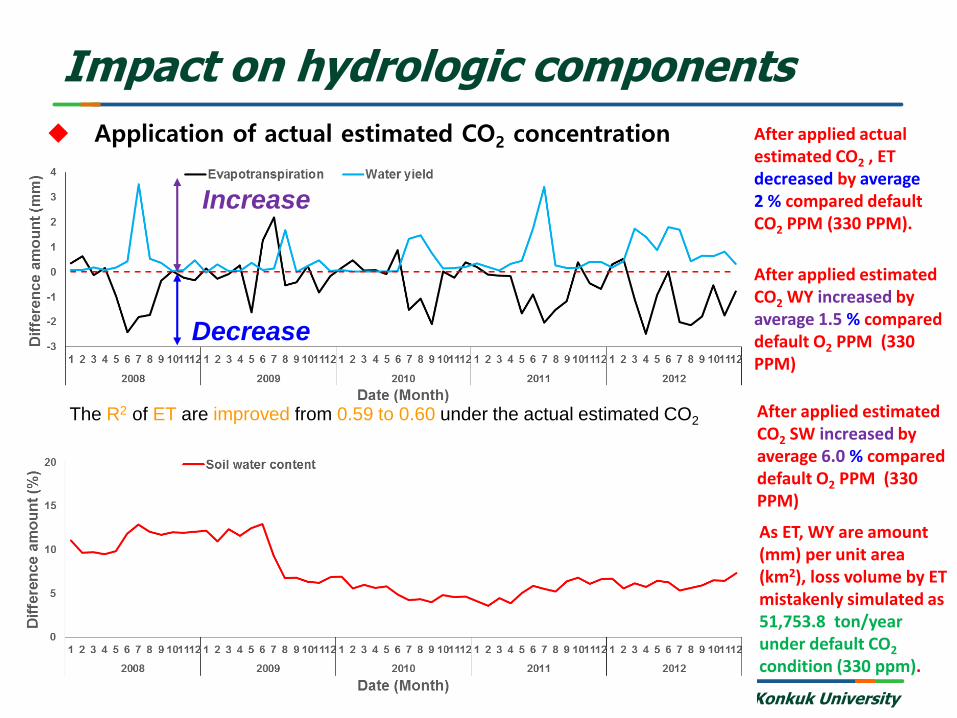
Application of actual estimated CO2 concentration
Impact on hydrologic components
17 / 18
After applied actual estimated CO2 , ET decreased by average 2 % compared default CO2 PPM (330 PPM).
Decrease
Increase
After applied estimated CO2 WY increased by average 1.5 % compared default O2 PPM (330 PPM)
After applied estimated CO2 SW increased by average 6.0 % compared default O2 PPM (330 PPM)
As ET, WY are amount (mm) per unit area (km2), loss volume by ET mistakenly simulated as 51,753.8 ton/yearunder default CO2
condition (330 ppm).
The R2 of ET are improved from 0.59 to 0.60 under the actual estimated CO2
Konkuk University
The hydrological model SWAT was applied to investigate
hydrological effects of rising CO2 concentrations in watershed.
For estimation of CO2 flux using MODIS GPP, the MODIS GPP product, 8-
day composite at 1-km spatial resolution was adopted for the spatial CO2
flux generation. The MODIS GPP data were corrected by Quality Control
(QC) flag. The MODIS CO2 flux was estimated as the sum of GPP and Re
(ecosystem respiration) by Lloyd and Taylor method (1994).
The Evapotranspiration could annually decrease about average 2 % in
contrast water yield, soil water content could annually increase about 1.5,
6 % respectively, under actual estimated CO2 concentration.
As ET, WY are amount (mm) per unit area (km2), loss volume (ton) by ET
decrease as 51,753.8 ton/year under actual CO2 concentration.
Our analyses of sensitivity of hydrological components to actual estimated
CO2 on the direction, magnitude, and spatial distribution of hydrological
responses provide needed input for consideration towards watershed
management and policies for water resource management.
Summary and Conclusion
18 / 18

Konkuk University
For further information, please contact:
JUNG, Chung-GilDoctoral candidate, Dept. of Civil & Environmental System Engineering, Konkuk University
“ Thank You “
Dept. of Civil and Environmental System Eng.,
Konkuk University, Seoul, South Korea