evaluation of city of lapeer wastewater treatment plant ... · aecom 1 1. introduction this report...
TRANSCRIPT

Evaluation of City of Lapeer Wastewater Treatment Plant (WWTP) Site Lapeer County, MI
Project number: 60570635
December 21, 2018
Project number: 60570635
AECOM
Prepared for:
Stephanie Kammer Michigan Department of Environmental Quality Water Resources Division Constitution Hall, 1st Floor, South Tower 525 West Allegan Street PO Box 30242 Lansing, Michigan 48909
Prepared by:
AECOM
3950 Sparks Drive Southeast
Grand Rapids, Michigan 49546
USA
aecom.com
Copyright © 2018 by AECOM
All rights reserved. No part of this copyrighted work may be reproduced, distributed, or transmitted in any
form or by any means without the prior written permission of AECOM.

Project number: 60570635
AECOM
Table of Contents
1. Introduction ......................................................................................................................................... 1
2. PFAS Potential Sources in POTWs .................................................................................................... 2
3. Wastewater Treatment Processes ...................................................................................................... 3
4. Biosolids Treatment and Handling ...................................................................................................... 5
4.1 Preliminary Operations ............................................................................................................. 5
4.2 Thickening ................................................................................................................................ 5
4.3 Stabilization .............................................................................................................................. 6
4.4 Conditioning .............................................................................................................................. 7
4.5 Dewatering ................................................................................................................................ 8
4.6 Disposal .................................................................................................................................. 10
5. City of Lapeer WWTP ....................................................................................................................... 12
6. Industrial Pretreatment Program ....................................................................................................... 13
6.1 MDEQ IPP PFAS Initiative ...................................................................................................... 13
7. PFAS Evaluations ............................................................................................................................. 15
7.1 Flint River ................................................................................................................................ 15
7.2 Significant Industrial Users ..................................................................................................... 15
7.3 Lapeer Plating and Plastics .................................................................................................... 16
7.4 City of Lapeer WWTP ............................................................................................................. 18
7.4.1 Scope of Work ........................................................................................................................ 18
7.4.2 Biosolids Samples .................................................................................................................. 19
7.4.3 Liquid Samples ....................................................................................................................... 19
7.4.4 Agricultural Fields ................................................................................................................... 20
8. Pathway and Receptors Evaluation .................................................................................................. 21
9. Summary and Discussion ................................................................................................................. 23
Figures
Figure 1 Site Overview
Figure 2 Biosolids Total PFAS Concentration
Figure 3 Biosolids PFOS Concentration
Figure 4 Biosolids PFOA Concentration
Figure 5 Liquid Total PFAS Concentration
Figure 6 Liquid PFOS Concentration
Figure 7 Liquid PFOA Concentration
Tables
Table 1 Aqueous and Biosolids Analytical Results Summary
Appendices
Appendix A Laboratory Analytical Reports
AECOM 1
1. Introduction
This report summarizes and reports the findings at one of the Publicly Owned Treatment Works (POTW)
facilities, the City of Lapeer Wastewater Treatment Plant (WWTP), located in Lapeer, Michigan. The
purpose of the investigation was to the summarize the sources and concentrations of Per- and
Polyfluoroalkyl Substances (PFAS) at the WWTP at different treatment stages.
The investigation activities were designed to characterize the current PFAS sources for the WWTP from
various Industrial Wastewater sources, evaluate the PFAS fate within various treatment stages of the
WWTP, and to collect data to evaluate risk to human health and the environment from the land application
of potential PFAS-impacted biosolids and treated effluent discharge to surface water. A review of existing
data was used to guide the scope of this investigation. Field investigation activities at the WWTP
included aqueous samples from various locations within the WWTP, sludge, and biosolids sampling.

AECOM 2
2. PFAS Potential Sources in POTWs
PFAS have been classified by the United States Environmental Protection Agency (USEPA) as an
emerging contaminant, that is regulated by the Michigan Department of Environmental Quality (MDEQ)
under Part 201 of the Natural Resources and Environmental Protection Act, Act 451 of 1994, as amended
and Rule 323.1057 (Rule 57) (Toxic Substances) of the Michigan Administrative Code. PFAS are a
complex family of more than 3,000 man-made fluorinated organic chemicals. PFAS are not found
naturally in the environment. Due to their unique chemical properties, PFAS have been used in many
industries and consumer products since the late 1950’s such as carpeting, waterproof clothing,
upholstery, food paper wrappings, fire-fighting foams, and metal plating. The Interstate Technology
Regulatory Council (ITRC) has identified four primary sources of PFAS: fire training, fire response sites,
industrial sites, landfills, and wastewater treatment plants/biosolids.
PFAS sources to POTWs include municipal waste as well as commercial and industrial wastewater effluents. Perfluorooctanoic acid (PFOA) and Perfluorooctane sulfonic acid (PFOS) are two of the most studied PFAS that have been detected frequently in the environment including POTWs and biosolids (ITRC, 2017). PFOA and PFOS are part of two PFAS families known as Perfluoroalkyl carboxylic acids (PFCAs) and Perfluoroalkane sulfonic acids (PFSAs), respectively. Both PFCAs and PFSAs are part of a family known as Perfluoroalkyl acids (PFAAs). PFAAs is a family of non-degradable compounds that are referred to as “terminal PFAS” or “terminal degradation products,” meaning that no further degradation products will be formed and are considered to be very persistent in the environment. Precursors are PFAS families that could partially degrade in the environment and biota, to dead-end products like PFAAs.
PFAAs are not expected to be treated during the primary and secondary treatment processes. Some
tertiary processes might partially remove PFAAs when filtration processes are present such as granular
activated carbon (GAC) or particle activated carbon (PAC). However, the dissolved PFAAs present in the
liquid portion of the sludge, when no GAC or PAC is used in any of the treatment processes, are typically
expected to bypass the POTW treatment processes. PFAAs precursors used in various industries and
consumer products are supposed to be present in the wastewater and have been documented to degrade
to PFAAs during the treatment processes. In some cases, PFAAs have been found to be present at
higher concentrations in the effluent compared to influent due to the degradation of precursors. The final
effluent PFAS concentration is important as the MDEQ has established ambient surface water
concentrations for both PFOA and PFOS.
As sludge goes through various treatment processes, the solids are degraded resulting in the increase of PFAAs in the sludge and biosolids. Also, the concentration of PFAAs increases due to the degradation of precursors. The presence of PFAAs in the biosolids is a concern to the MDEQ as some of these biosolids are land applied to agricultural lands.

AECOM 3
3. Wastewater Treatment Processes
The 1972 Amendments to the Federal Pollution Water Pollution Act, known as the Clean Water Act (CWA)
established the foundation for wastewater treatment and discharge. Domestic, commercial, and industrial
wastewaters are transported to POTWs. The wastewater from industrial sources often needs to be
pretreated to remove contaminants such as metals and other organic pollutants such as chlorinated
hydrocarbons. However, historically the PFAS were not monitored and not required to be removed prior
to discharge to the POTWs. Typical treatment processes used for wastewater are presented and
described in the table below.
Treatment Process Process Description
Primary
Screening and grit removal eliminates coarse solids that otherwise would
interfere with the mechanical equipment at the POTW. The screening and grit
are handled as solid waste and landfilled. This part of the primary treatment
sometimes is referred to as a preliminary treatment. Typically gravity
sedimentation of screened, degritted wastewater removes between 50 to 70
percent of the total suspended solids (TSS) and from 25 to 40 percent of
biological oxygen demand (BOD) prior to secondary treatment. The sludge
produced during the primary treatment usually contains 2 to 8 percent solids.
Secondary
The secondary treatment relies on biological treatment processes (e.g.,
suspended growth or fixed growth systems). Microorganisms are used to reduce
the BOD. The secondary treatment is the minimum treatment for POTWs under
the CWA. The sludge that is separated from the secondary treatment usually has
a low solids content of 0.4 to 2 percent as well as 60 to 85 percent of volatile
solids.
Tertiary
POTWs that require higher effluent quality than the secondary treatment effluent
follow the secondary treatment with a “polish” by further reducing TSS, BOD,
phosphorus, and nitrogen with tertiary treatment using filtration and chemical
precipitation processes.
Generally, higher degrees of wastewater treatment may increase the total volume of biosolids that is
generated. The higher levels of treatment can also increase the concentrations of contaminants in the
biosolids because many pollutants removed from the wastewater accumulate in the biosolids. The
accumulation of PFAS in biosolids is also expected to increase with higher levels of treatment.
All POTWs have two major flow streams for treatment of wastewater which consists of one flow process
for the wastewater (liquid) and a second flow process for the solids removed from the wastewater through
the treatment process. An example process flow is presented in the diagram below. The treatment
processes for a typical POTW is composed of primary and secondary treatment for the liquid process flow
and various processes for the solid process flow which often include a stabilization and dewatering
process. The CWA requires the minimum treatment for wastewater to be composed of primary and
secondary processes with disinfection of the final effluent. Depending on the POTW a tertiary treatment
process could also be added for improved effluent discharge. Multiple devices and designs are available
for each treatment process resulting in many configurations for the treatment of the sludge by the
POTWs. The addition of various chemicals is also done based on particular POTW design at multiple
stages.

AECOM 4
Basic wastewater treatment processes typically used by POTWS
Liquid Process Flow – The liquid portion of the wastewater is treated through all of the main treatment
processes including primary, secondary, and in some cases, tertiary processes are used for final
“polishing” step. Regardless of the treatment steps, the treated wastewater effluent goes through the final
disinfection treatment, which is typically performed by adding chlorine and allowing a specific contact time
with the effluent or ultraviolet (UV) disinfection of the effluent prior to discharge.
Solid Process Flow – The solids removed during the primary treatment by screening and gritting are
disposed to a landfill and are not processed further. Typically the sludge collected from the primary and
secondary treatment processes goes to a series of additional treatment processes to facilitate efficient
disposal. There are six (6) main treatment processes typically used in the treatment and handling of
sludge and are presented in the table below.
Preliminary
Operations
Thickening Stabilization Conditioning Dewatering Disposal
Grinding Gravity Alkaline
Stabilization
Chemical Centrifuge Landfill
Screening Flotation Anaerobic
Digestion
Thermal Belt-Filter Press Direct/Indirect
Dryer
Degritting Centrifugation Aerobic Digestion Filter Press Incineration
Blending Gravity Belt Composing Drying Beds Land Application
Storage Rotary-Drum Lagoons

AECOM 5
4. Biosolids Treatment and Handling
The treatment of wastewater during various processes results in the production of a semisolid byproduct
known as biosolids. Historically biosolids were called sewage sludge; however, biosolids is the term used
today to emphasize the beneficial nature of this nutrient-rich byproduct. Biosolids are the final result of the
solid process treatment performed on the sludge. The six (6) main treatment processes are discussed in
more detail below.
4.1 Preliminary Operations
Preliminary operations are not used by all POTWs, but in some cases grinding, screening, degritting,
blending and storage of sludge are necessary in order to provide a relatively constant and homogeneous
feed to the solid process flow. Some of these operations are sometimes used between other solid
treatment processes as well.
Gravity – Sludge grinding is performed when large and stingy materials that are in the sludge are cut or
shredded into smaller particles in order to prevent clogging or wrapping around rotating equipment.
Screening – The initial screens that are used in the primary treatment for the raw wastewater can allow
significant quantities of solids through; screening is an alternative of grinding. Screening is used to
remove nuisance material from the solids stream.
Degritting – In some POTWs where grit-removal is not used in the primary treatment prior to
sedimentation tanks, or where grit-removal facilities are not adequate to handle peak flows and peak grit
loads, it may be necessary to remove the grit before further processing is performed on the sludge.
Degritting can be used when additional thickening of the primary sludge is desired through the application
of centrifugal forces in a flowing system to achieve separation of the grit particles from the organic sludge.
Blending – Sludge may be generated during the primary, secondary, and advanced wastewater-
treatment processes. Sludge blending may be performed in order to produce a uniform mixture of
downstream operations and processes. The uniform mixing is more critical to short detention time
systems such as dewatering, heat treatment, and incineration.
Storage – Storage may be performed in order to smooth out fluctuations in the rate of solids and allow
solids to accumulate during periods when the solids handling facility is not operating (e.g., night shifts,
weekends, and periods when equipment is down). Storage is particularly important in providing a uniform
feed rate ahead of mechanical dewatering, lime stabilization, heat drying, and thermal reduction. Short-
time solids storage is sometimes used in wastewater settling or thickening tanks. Long-term solids
storage may be accomplished in stabilization processes with long detention time such as aerobic and
anaerobic digestion, or in specially designed tanks.
4.2 Thickening
The bio-solids generated from the primary, secondary, or the mixture from primary and secondary
treatments varies considerably due to the characteristics of the sludge, sludge removal and pumping
facilities, and method of operation. The thickening process is a procedure in which a portion of the liquid
fraction is removed, and the solids content of the sludge is increased. Thickening is typically
accomplished by physical processes such as gravity settling, flotation, centrifugation, gravity belt, and
rotary drum.
Gravity – Primary clarifiers are often used to thicken the sludge for further processing. The thickening
performed in the primary clarifiers is often referred to as co-settling thickening. A sludge blanket must be
first created to consolidate solids without allowing the clarified water to be pulled through. Chemicals are
sometimes added to further improve the settling efficiency depending on clarifier overflow rates. Gravity
thickening accomplished in a circular tank and similar to a sedimentation tank is one of the most often
used methods for thickening. The feed sludge is allowed to settle and compact, and the thickened sludge

AECOM 6
is withdrawn from the conical tank bottom. The thickened sludge is pumped to the digesters or
dewatering equipment, and as a result, storage must be provided for the sludge. Gravity thickeners are
most efficient on primary sludge.
Flotation – Dissolved-air is introduced into a wastewater solution and is held at elevated pressure. When
the wastewater is depressurized, the dissolved air is released, and finely divided bubbles carry the sludge
to the top, where it is removed. Flotation thickening is used most efficiently for waste sludges from
suspended-growth biological treatment processes such as the activated-sludge process or the
suspended-growth nitrification process. Other sludges such as primary sludge, aerobically digested, and
sludges containing metal salts from chemical treatment have been successfully thickened using flotation.
Centrifugation – Centrifuges can be used for both thicken and dewater sludges. Thickening using
centrifugation is typically limited only to waste-activated sludges that are produced in the secondary
treatment. Thickening by centrifugation is achieved by settling of sludge particles under the influence of
centrifugal forces. The most basic type of centrifuge used for thickening is the solid-bowl centrifuge.
Under normal conditions, the thickening can be performed without the addition of any polymers, but
polymers are sometimes used to improve efficiency. The maintenance and power costs are substantial,
and typically centrifugation is used by larger facilities treating in excess of 5 million gallons per day (MGD)
or larger, where space is limited or for sludges that are difficult to thicken by more conventional means.
Gravity-Belt – Gravity-belt thickeners have been developed from the application of belt presses for
sludge dewatering. The belt-presses used for thickening consist of a gravity belt that moves over rollers
driven by a variable–speed drive unit. The sludge is conditioned with polymer and fed into a
feed/distribution box at one end, where the sludge is distributed evenly across the width of the moving
belt. The sludge concentrates by having the liquid portion of the sludge drain through the belt as it is
carried toward the discharge end of the thickener. The sludge is ridged and furrowed by a series of plow
blades, which allows the water released from the sludge to pass through the belt. This process has been
used to thicken waste-activated sludge, anaerobically and aerobically digested sludge, as well as some
industrial sludges. Polymer addition is required for the process to be efficient and operate well.
Rotary-Drum – Rotary-drum thickening system consists of a conditioning polymer feed system and
rotating cylindrical screens. The polymer is mixed with the diluted sludge in the conditioning drum. The
conditioned sludge is further passed to rotating-screen drums, which enables for the solid sludge to
separate from the liquid part. The resulting thickened sludge is discharged at the end of the drum, while
the liquid decants drains through the screens. Some rotary-drums designs have been engineered to be
combined with belt-filter presses for a combination of sludge thickening and dewatering. Rotary-drum
thickeners are typically used in small and medium-sized POTWs for waste-activated sludge thickening.
4.3 Stabilization
Stabilization involves a number of various processes that reduce the pathogen level, odor, and volatile
solids content. Stabilization is not used by all of the POTWs but is widely used by many POTWs ranging
in size from small to very large. Stabilization is used for volume reduction, production of methane, and
improving the dewaterability of sludge. The most frequent methods of stabilization are alkaline
stabilization (typically performed with lime), anaerobic digestion, aerobic digestion, and composting. A
short description of each stabilization process is provided below.
Alkaline Stabilization – Alkaline stabilization historically has been done using quicklime (CaO) or
hydrated lime (Ca[OH]2), which is mixed with the biosolids. Other, frequently used alkaline materials
include cement kiln dust, lime kiln dust, Portland cement, and fly ash. The alkaline material is used to
make the sludge unsuitable for the survival of microorganisms and sometimes is also applied to the
biosolids after the dewatering. Quicklime is preferred because it is exothermic reaction raising the
temperature of the mixture above 50°C, which is sufficient to inactive worm eggs. Lime can also be
added to the untreated sludge in order to increase the pH to 12 or higher for about 2 hours. The high pH
ensures the sludge will not putrefy, create odors, it also inactivates the virus, bacteria, and other
microorganisms and reduces vector attraction. The advantage of alkaline stabilization is the production of
biosolids with substantially decreasing pathogens. One disadvantage is the increase of biosolids mass
due to the addition of lime. The lime is added to the biosolids prior to dewatering to be used either for the

AECOM 7
direct application of liquid sludge to land, or in order to combine the benefits of sludge conditioning and
stabilization prior to dewatering. When lime is used prior to dewatering process, typically the dewatering
is performed with a pressure-type filter press, and not centrifuge or belt-filter presses as the lime would
cause an abrasive tear and scaling problems in these treatment processes.
Anaerobic Digestion – Anaerobic digestion is one of the oldest processes used for the stabilization of
sludge. The stabilization of sludge using anaerobic digestion is typically performed biologically in a
closed tank to reduce the organic content, mass, odor, and pathogen content of biosolids. During the
digestion, anaerobic bacteria consume a portion of the organic matter, and inorganic matter (mostly
sulfate) in the absence of oxygen converts the organic solids to carbon dioxide, methane, and ammonia.
Due to the methane generation, which can be recovered and used for energy, the anaerobic digestion is
widely used primarily by large POTWs.
Aerobic Digestion – Aerobic digestion is often used to treat waste activated sludge, a mixture of waste-
activated sludge or trickling-filter sludge and primary sludge, or waste sludge from extended aeration
plants. Aerobic digestion is performed in open or closed vessels or lagoons using aerobic bacteria in the
presence of oxygen, where a portion of the organic solids are converted into carbon dioxide, water, and
nitrogen. Pathogens and odors are reduced during the aerobic digestion. Aerobic digestion is typically
used by smaller POTWs and is often performed in wastewater lagoons that are equipped with aeration
equipment. The aerobic digestion is sometimes performed at high-temperature (i.e., higher than 550C
[1310F]) since it produces biosolids with lower pathogen levels and higher solids content than
conventional aerobic digestion. Advantages for aerobic digestion, when compared to anaerobic
digestion, are: the volatile solids reduction is almost equal to that of anaerobic digestion; lower BOD
concentrations in the supernatant liquor, production of odorless, humus-like, and biologically stable end
product; lower capital cost; and the operation is relatively quick. Some of the significant disadvantages of
the aerobic process are: high power cost associated with the supplying the required oxygen; the digested
biosolids produced have poorer mechanical dewatering characteristics; and the high sensitivity of the
process to temperature, location, tank geometry, the concentration of feed solids, and type of
mixing/aeration device.
Composting – Composting is a cost-effective alternative for the stabilization of sludge. Composting is
performed by microorganisms resulting in the decomposition of organic matter in a controlled
environment. The size and porosity of the pile, as well as the moisture and oxygen levels, have to be
controlled. The biosolids are reduced to humus-like material with excellent soil conditioning properties at
a pH range of 6.5 to 8. Composting is performed by the addition of bulking agents such as wood chips,
municipal yard trimmings, bark, rice hulls, straw, or previously composted material. About 20 to 30
percent of the volatile solids are converted to carbon dioxide and water. Biosolids decomposed
aerobically for 3 to 4 weeks from active composting followed by one month of less-active composting is
referred to as curing. During the sludge decomposition, the compost heats to temperatures in the
pasteurization range of 60 to 70°C. There are three typical composting processes used such as windrow
composting, aerated static piles, and in-vessel composting.
4.4 Conditioning
Conditioning of sludge and biosolids is used to improve the efficiency of the dewatering process. The two
main conditioning types are thermal treatment and the chemical addition of inorganic chemicals, organic
polyelectrolytes, or both. The mechanical dewatering of biosolids using mechanical dewatering systems
such as centrifugation, belt-filter presses, pressure-filter presses, and vacuum filters is more efficient
when biosolids are conditioned first. The conditioning of biosolids is a significant component of the
operation and maintenance of biosolids.
Chemical – The use of chemicals for conditioning can help reduce the moisture content of the sludge
from 90 to 99 percent to 65 to 85 percent depending on the sludge characteristics. Chemical conditioning
results in the coagulation of the solids and release of the liquid portion. Inorganic chemicals used for
conditioning are ferric chloride, lime, alum, ferrous chloride, aluminum salts, and iron salts. Organic
chemical conditioning includes polyelectrolytes which can be classified by the polymer compound’s

AECOM 8
charge (i.e., anionic, nonionic, or cationic), molecular weight, and polymer form (i.e., dry, liquid/solution,
emulsions, or gel). Organic chemical conditioning can be used for all mechanical dewatering types.
Thermal – Thermal conditioning has been used in the conditioning and stabilization of sludge, but it is not
typically used in new POTWs. Thermal conditioning refers to the simultaneous application of heat and
pressure to the biosolids to enhance the dewatering efficiency without the need for conditioning using
chemicals. The application of heat lyses the cell walls of the microorganisms contained in the biosolids,
releasing bound water from the particles. The process further hydrolyzes and solubilizes hydrated
particles in the biosolids, and organic compounds in the primary sludge. The heat conditioning
coagulates the solids, breaks down the gel structure, and reduces the water affinity of the sludge soils.
The supernatant is high in BOD and may require special sidestream treatment before it is introduced back
into the wastewater treatment process.
4.5 Dewatering
Dewatering removes moisture content and is generally performed before the biosolids are dried,
incinerated, composted, or landfilled. The dewatering process reduces the biosolids volume and
increases the solids concentration. Dewatering might be undesirable for land application of biosolids by
injection into the ground or in locations where water itself is a valuable agricultural resource. The biosolids
are typically conditioned and thickened prior to the dewatering process. The conditioning of biosolids is
performed using chemicals such as lime, ferric chloride, or polymers, which are added to the biosolids in
order for the small particles to aggregate into larger masses referred to as “flocs.” The dewatering
processes can be divided into two major categories: air drying beds and mechanical systems.
A list and description of various air drying beds are presented in the table below.
Drying Bed Type Description
Conventional Conventional rectangular sand drying beds have sidewalls with sand and gravel layers,
underdrainage piping in order to carry the drained liquid away with or without provisions for
mechanical removal. They can be with or without a roof or a greenhouse-type covering.
Paved Paved rectangular drying beds have sidewalls, a center sand-drainage strip with or without
heating pipes buried in the paved section. They can also be with or without any type of roof.
Front-end loaders are easily used for cake removal, and auger mixing vehicles can be used
to speed up the drying.
Wedge-Wire Wedge-wire drying beds have been used since the 1970s where the slurry is spread onto a
horizontal and relative open drainage media which results in the formation of a thin layer of
water. Additional liquid biosolids are spread on top of the water layer, which results in the
controlled formation of cake. Polyelectrolyte flocculants are used in order to promote rapid
cake formation. Mechanical cleaning is required and is typically used by small plants.
Vacuum-Assisted Vacuum-Assisted drying beds have sidewalls and bottom slab with reinforced concrete. A
very thin layer of several millimeters thick of stabilized aggregate is used, which is
connected to a vacuum pump. A rigid multimedia filter top is applied on top of the aggregate
support. The polymer is used to enhance the dewatering process and is injected into the
biosolids in the inlet line. The filtrate drains through the multimedia filter into the space
containing the aggregate and then to a sump, from where the filtrate is sent back to the
POTW. The biosolids are left on the plates for a more extended period of time in order to
produce higher solid concentration by evaporation.
The conventional sand drying beds for dewatering biosolids is typically the most common air drying
dewatering process used and has been successfully used for over 100 years. This process if properly
designed and operated can produce a drier product than most mechanical devices. This process can
produce solid content in the biosolids as high as 45 to 90 percent. The typical design for sand drying
beds includes sand and gravel layers and a collection system for the drainage. The biosolids on the sand
beds are dewatered by drainage and evaporation. The first step is the drainage of water into the sand
and gravel layers which is removed through the underdrains, which typically takes several days. Once a

AECOM 9
sludge supernatant layer has former, decanting removes any surface water which can also be formed due
to precipitation. Any water that remains in the sludge after drainage and decanting is removed by
evaporation. This dewatering process is suitable in POTWs of all sizes. The advantages of sand drying
beds are a low capital cost for small plants, low electric power consumption, low sensitivity to biosolids
variability, low chemical consumption, and high dry cake solids contents. The disadvantages are large
land requirements, the biosolids need to be stabilized prior to the dewatering process, labor-intensive,
permitting and groundwater contamination concerns, and fuel and equipment costs for bed cleaning
systems.
Dewatering of biosolids using mechanical systems are presented below and include centrifugal, belt filter
press, pressure filter press, and vacuum filters. Large POTWs typically rely on mechanical dewatering
systems.
Centrifugal Dewatering - Centrifugal force is applied to a biosolids slurry to facilitate and accelerate the
separation of the solids and liquid fraction. The process is composed of a clarification step when solid
particles are allowed to settle out of the rounding liquid, and a compaction step where some free water is
squeezed out from the settled mass. This process can produce a solid content of 25 to 35 percent.
Centrifuges separated sludge into the dewatered cake and clarified “centrate.” The cake and centrate are
separated based on density differences between the solids and the liquid present. The centrifugal
dewatering is similar to a gravity clarifier, where the centrifugal force is 500 to 3,000 time the force of
gravity. Chemical conditioning is often used for centrifugal dewatering. Advantages include minimal
odors, little operation attention, high average cake solids, continuous feed, low average maintenance, and
high safety record. One disadvantage is that the grit can wear the solid-bowl machine.
Belt-Filter Press Dewatering – Belt-filter presses have double moving belts that are capable of
continuously dewatering the biosolids through a combination of gravity drainage and compression. This
process started to be used in the mid-1970s, mainly because it was able to dewater secondary sludge
and had lower energy requirements compared to centrifuges and vacuum-filter dewatering equipment.
The process can produce biosolids with 20 to 32 percent solids content. Chemical conditioning is
necessary and organic polymer is the most commonly used. The polymer-flocculated solids are first
introduced in a gravity drainage section, where gravity drainage occurs. The filtrate from the gravity zone
is then sent to the belt filter press and moves into the compression stage. Further dewatering occurs as
the sludge is squeezed between the two porous belts. The biosolids progress through rollers with
decreasing diameters, which increase the pressure. The final dewatered cake is removed from the belts
by scraper blades.
Plate and Frame Press Dewatering – Pressure filter presses have been used to dewater solids since
the mid-1800s, however, only since 1970 has the plate and frame press become more popular by
becoming less labor-intensive and more automated. The pressure filter press can produce biosolids with
solid content between 35 to 45 percent. The main disadvantage is the capital cost, the high quantities of
conditioning chemicals, and periodic adherence of cake to filter medium that requires manual removal.
When cake solids with solid content higher than 35 percent are needed, the pressure filter press may be
a cost-effective dewatering process. Today fewer filter presses are used compared to other dewatering
devices such as centrifuges vacuum filters, and belt presses.
Vacuum Filters Dewatering – Vacuum filters can achieve biosolids with 12 to 22 percent solids content.
Vacuum filters typically are composed of a rotating drum submerged in a vat of biosolids that apply a
vacuum from within the drum. The vacuum draws water into the drum, leaving the biosolids cake on the
outer drum filter medium. The dewatered biosolids are scraped off the filter. Many of the vacuum filters
are being replaced by centrifuges, belt filter presses, and in some cases even by pressure filter presses.
Lagoons – Drying lagoons can be used as a substitute for drying beds for the dewatering of digested
sludge. The drying lagoons are not suitable for the dewatering of untreated sludge, limed sludge, or
sludges with a high strength supernatant because of their odor. Unconditioned digested biosolids are
discharged into the lagoon in an even distribution at a depth that ranges between 2.5 to 4 feet (ft).
Evaporation is the prime mechanisms for dewatering. The biosolids are removed mechanically and have
a typical solid content of 25 to 30 percent. The cycle time for lagoons varies from several months to
several years. Typically the biosolids are pumped into the lagoon for 18 months and rest for 6 months. A

AECOM 10
minimum of two lagoons is always used in order to ensure storage during cleaning, maintenance, or
emergency conditions.
4.6 Disposal
In order to meet regulatory requirements that protect human and environmental health, facilitate handling,
and reduce disposal costs, the majority of biosolids undergo additional treatment at the POTW as
described above prior to disposal. Biosolids that are intended to be land applied or used as compost
have to meet regulatory requirements for pathogens, vector attraction reduction, and metal content.
Heat Drying and Pelletizing – Heat drying involves the application of heat to evaporate water and to
reduce the moisture content of biosolids below what is achieved by conventional dewatering methods.
Active or passive dryers are used to remove moisture from the biosolids during the heat drying process.
Sometimes solar drying is used. The heat drying process removes pathogens and eliminates a large
percentage of the moisture, which significantly reduces the volume of the biosolids. Heat-dried biosolids
from the secondary treatment do not generally have odors when stored dried, where those from the
primary treatment typically do. The advantages of heat drying include the reduced biosolids
transportation cost, pathogen reduction, and improved storage capacity. Active heat dryers are
convection, conduction, radiation, or a combination of both. Indirect dryers are designed in either a
horizontal or vertical configuration. The heat dried biosolids are sometimes formed into pellets. The
biosolids that have been processed using heat drying processes are very dry and could save significantly
on transportation costs. As a result, the heat drying and pelletizing of biosolids is typically the process of
choice for urban communities where there are significant distances to agricultural lands.
Incineration – Incineration of the sludge is the total conversion of organic solids to primarily carbon
dioxide, water, and ash. The advantages of incineration are maximum volume reduction, reduction of
pathogens and toxic compounds, and energy recovery potential. The disadvantages of incineration
include high capital and operating cost, skilled operators are required, emission to the air, and potential of
the resulting ash sometimes to be classified as hazardous depending on the characteristics. Incineration
is typically used by medium and large size POTWs that have limited disposal options. Typical dewatered
and untreated sludges are used for incineration and usually are not stabilized prior to incineration.
Landfill – Landfill disposal of biosolids is typically done at landfills that accept stabilized and unstabilized
municipal solids that are defined as a monofill or at landfills that accept only municipal solid waste. The
design and operation of a monofil are regulated by U.S. EPA under Subpart C of 40 of the Code of
Federal Regulations (CFR) Part 503, and the design and operations of a codisposal landfill are regulated
by US EPA under 40 CFR Part 258. The most common disposal of sludge is done at landfills regulated
under 40 CFR Part 503.
Land Application – Land application of biosolids is defined as the spreading of biosolids on or just below
the soil surface. Biosolids may be applied to agricultural lands, forests, large disturbed areas such as
mine reclamation sites, parks, golf courses, and dedicated land disposal sites. The land application of
biosolids is in many cases is less expensive than other disposal methods. The increased cost of
disposal, for example to a landfill, makes the land application of biosolids a good alternative for disposal.
A 1997 nationwide survey performed by USEPA recorded that 54 percent of POTWs were practicing
beneficial use of biosolids by land application.
Municipal biosolids are regulated at the federal level under 405(d) of the Clean Water Act. In 1993, Title
40 CFR, Part 503 “The Standards for the Use or Disposal of Sewage Sludge” was published. This
document lists the requirements that have to be met before the biosolids can be beneficially used. The
regulations establish two levels of quality for heavy metal concentrations known as Pollutant Ceiling
Concentrations and Pollutant Concentrations which are given in tables as cumulative pollutant loading
rate, monthly average concentration, and annual pollutant loading rates. In order for the biosolids to be
land applied they must meet pollutant Ceiling Concentrations, Pollutant Concentrations limits, and loading
rates for nitrogen. The pathogen reduction requirements for surface disposal and application for biosolids
are divided into two classes of pathogen reduction as Class A and Class B.

AECOM 11
Class A – Disposal of biosolids for the application to land, lawns, or home gardens must meet Class
A pathogen reduction. Class A biosolids have to meet fecal coliform and Salmonella sp. densities.
In addition to the density requirement, the Class A biosolids have also need to achieve a
time/temperature guidance, alkaline treatment, prior testing for enteric virus/viable helminth ova, or
biosolids have been treated by processes to reduce pathogens or equivalent processes further.
Class B – Class B pathogen requirements are the minimum level of pathogen reduction for land
application and surface disposal. When biosolids are disposed and covered daily, they do not need
to meet Class B requirements. However, biosolids that do not meet the quality of Class B cannot be
land applied. Class B biosolids pathogen requirements are met if 1) treatment by processes that
significantly reduces the pathogens, or equivalent processes are used, or 2) if at least seven
samples collected at the time of use or disposal are analyzed for fecal coliforms during each
monitoring period and meet the regulatory criteria.
Pathogen treatment processes that could significantly reduce pathogens are aerobic digestion, air drying,
anaerobic digestion, composting, lime stabilization, heat drying, thermophilic aerobic digestion, beta, and
gamma-ray irradiation.
Vector-attraction reduction requirements are needed to reduce the potential for spreading of infectious
disease agents by vectors such as flies, rodents, and birds. Treatment methods that can be used to
minimize vector-attraction are Aerobic digestion, anaerobic digestion, aerobic processes, alkaline
stabilization, and drying. The methods used for land application of biosolids can also affect vector-
attraction. These methods include injection, incorporation, daily cover, and alkaline treatment which are
described in more detail below.
Injection – Liquid biosolids are injected beneath the surface with no significant amount of solids present
on the surface after 1 hour. Class A for pathogen reduction must be injected within 8 hours after it was
discharged from the pathogen reduction process.
Incorporation – Biosolids that are land applied on the surface of the land should be incorporated into the
soil within six (6) hours of application. Class A biosolids that are land applied to the surface must be
applied within eight (8) hours after the discharge from the pathogen reduction process.
Daily Cover – Biosolids that are applied on the land surface should be covered with soil or other material
at the end of each operating day.

AECOM 12
5. City of Lapeer WWTP
The WWTP shown in Figure 1 is the current Wastewater Treatment Plant for the City of Lapeer. The
WWTP was initially constructed in 1957 and consisted of two primary clarifiers, high rate trickling filter,
two final clarifiers, and two anaerobic digesters. Modifications to the WWTP were performed in 1985 to
provide an average design capacity of 1.85 MGD. The modified plant converted the primary clarifiers to
retention/equalization basins. A new 450,000-gallon retention basin and two oxidation ditches were also
constructed. The original final clarifiers are still in use. Sand filters were added to provide tertiary
treatment. Finally, the anaerobic digesters were converted to aerobic digesters. In 1993, the average
design capacity was increased to 2.3 MGD, based on an evaluation of the WWTP.
The WWTP has been operated at an average design flow capacity of 2.3 MGD since 1993. The
wastewater enters the WWTP through a lift station consisting of four sewage screw pumps. The
wastewater is further advanced through a screen and grit facility to remove any large debris, after which
the wastewater flows to the equalization tanks and retention basin, and then passes through to one of the
two oxidation ditches. The oxidation ditch is a modified activated sludge process, which provides
thoroughly mixed long-term aeration to maintain biomass that oxidizes carbonaceous materials and
nitrifies ammonia. Solids are settled out in the final clarifiers. The suspended solids removed in the
settling tanks are either recycled to the oxidation ditches or sent to the solids handling process as waste
activated sludge. The wastewater from the secondary settling tanks is filtered through rapid sand filters
and chlorinated in the chlorine contact tank for disinfection purposes before discharge to the South
Branch of the Flint River. The Waste Activated Sludge is thickened via centrifuge before storage and land
application. Sludge drying beds are also available for on-site emergency stand-by dewatering. In 2014,
further improvements were done to the WWTP of some bypass pumping stations and the addition of
Phosphorous Selector Tanks. During normal operation the influent and return activated sludge gravity
flow into the chambers for anoxic treatment before going to the oxidation ditches. Two submersible
mixers are used to keep all of the contents in anaerobic suspension. Historical and more recent WWTP
Process Diagrams can be found in Appendix A.

AECOM 13
6. Industrial Pretreatment Program
POTWs receive industrial wastewaters from various industrial facilities in Michigan. Pollutants in
industrial wastewater may be pretreated with similar processes to those of POTWs. In order to protect
the POTWs and the environment, the Pretreatment Program requires the industrial users to use treatment
processes and management practices to reduce or eliminate the discharge of harmful pollutants to
sanitary sewers. The Pretreatment Program is one of the significant parts of the CWA National Pollutant
Discharge Elimination System (NPDES). The discharge of pollutants from industrial wastewaters to
POTWs is regulated in Michigan through the Industrial Pretreatment Program (IPP). The purpose of IPP
is to:
1. Regulate the disposal of industrial wastewater into the sanitary wastewater collection system.
2. Protect the physical structures and safety of operation and maintenance personnel of the wastewater
collection and treatment system.
3. Protect the health and safety of the public and the environment.
4. Comply with pretreatment regulations as required under Federal General Pretreatment Regulations
and Categorical Standards and local source control ordinances.
Generally, industrial users are prohibited from discharging wastewater to POTWs if the wastewater would:
1. Pass through the POTWs untreated, and/or
2. Interfere with the operation or performance of the POTWs.
Eight specific restrictions to the discharge of pollutants from industrial wastewaters to the POTWs are:
1. Pollutants that create a fire or explosion hazard in the POTWs sewer system or at the treatment
plant.
2. Pollutants that are corrosive including any discharge with a pH lower than 5.0.
3. Solid or viscous pollutants in amounts that would obstruct flow in the collection system and treatment
plant, resulting in interference with operations.
4. Any pollutant, including oxygen demanding pollutants released in a discharge at a flow rate and/or
concentration which would cause interference.
5. Heat in amounts which would inhibit biological activity in the POTW resulting in interference.
6. Pollutants which result in the presence of toxic gases, vapors, or fumes in a quantity that may cause
acute worker health and safety problems.
7. Petroleum oil, non-biodegradable cutting oil, or products of mineral oil origin in amounts that will
cause pass through or interference.
8. Trucked or hauled pollutants, except at discharge points designated by the Superintendent.
6.1 MDEQ IPP PFAS Initiative
PFAS are regulated by the MDEQ under Part 201, Environmental Remediation, and Part 31, Water
Resources Protection of the Natural Resource and Environmental Protection Act, Act 451 of 1994, as
amended and their respective administrative rules, specifically Rule 299.44-299.50 (Generic Cleanup
Criteria) and Rule 57) (Toxic Substances) of the Michigan Administrative Code. The Michigan Rule 57
values or Water Quality Standards are developed to protect humans, wildlife, and aquatic life. The
applicable (most stringent) Water Quality Standards for PFOS and PFOA are human noncancer values,
as follows:
PFOS: 12 nanograms per liter (ng/l) or parts per trillion (ppt) for surface waters that are not used for
drinking water and 11 ng/l for those used as a drinking water source

AECOM 14
PFOA: 12,000 ng/l for surface waters that are not used for drinking water and 420 ng/l for those used
as a drinking water source.
For NPDES permittees, Part I.C.1.f. requires permittees to prohibit discharges that cause their POTWs to
pass through pollutants greater than water quality standards to surface water. Part I.C.1.g. further
prohibits NPDES permittees from accepting discharges that restrict, in whole or part, with their
management of biosolids.
The MDEQ, Water Resources Division on February 2018, required all WWTPs with IPPs to evaluate
potential sources of PFAS, investigate probable sources, reduce/eliminate the sources found, and take
other actions to protect surface water quality as needed.

AECOM 15
7. PFAS Evaluations
In 2001 during a statewide PFAS investigation conducted in Michigan PFOS and PFOA were detected at
concentrations of 12.31 and 11.94 ng/L, respectively in the Flint River. In 2003 based on the science
understood at that time, it was concluded that PFAS were not a significant concern. As science and
understanding of PFAS evolved over the years, another statewide PFAS sampling was performed.
Additional evaluation of the Flint River was conducted in 2013 and 2014, and the results and discussion
are provided below.
7.1 Flint River
Preliminary surface water and fish tissue sampling performed by the MDEQ in 2013 and 2014 on the Flint
River found concentrations of PFOS above Michigan’s Part 31 Water Quality Standard and Michigan
Department of Health and Human Services (MDHHS) screening values for fish tissue. As a result, in
2015, MDHHS released an updated “Eat Safe Fish” guidance where PFOS was the driver for the fish
consumption advisory for several species on the Flint River downstream of Mott Dam. Subsequent
surface water and the fish collection were conducted in 2016 to investigate the potential sources of PFAS
to the river. The results of this 2016 investigation indicated that there was a PFAS source located
upstream of Holloway Dam. In 2017, additional monitoring was conducted upstream of Holloway Dam of
significant tributaries of the Flint River, and of the three major wastewater treatment plants which
discharge to the Flint River within the area of concern. Analysis of the City of Lapeer’s WWTP effluent
identified in May and July of 2017, the WWTP as a significant source of PFOS to the Flint River, with
effluent PFOS concentration of 415 ng/L and 2,000 ng/L, respectively.
7.2 Significant Industrial Users
The Significant Industrial Users (SIUs) that have discharge to the WWTP has changed over time. In
2000, a total of seven (7) SIUs were listed for the WWTP Biosolids Land Application Program as
MetoKote and Deco Plate metal finishers, Cambridge Industries, Lapeer Industries, Lapeer Regional
Hospital, Thumb Regional Correctional Facility, and Webco Press. The City of Lapeer WWTP has land
applied biosolids since 1997. Deco Plate was the only SIU from 2000 that is still discharging to the
WWTP today, however the name of the industrial user changed to Lapeer Plate and Plastics (LP&P).
In 2017, eight (8) SIUs were discharging to the City of Lapeer WWTP. These SIUs are listed in the table
below, along with the PFOA and PFOS results. Subsequently, LP&P was identified as contributing
significant amounts of PFOS to the City’s sewer system with a PFOS concentration of 19,000 ng/L.
PFOA and PFOS have been detected in the effluents of all of the eight (8) SIUs, but the LP&P PFOS
concentration was significantly higher than the others’ SIUs effluents.
Significant Industrial User Sampling Location PFOS (ng/L) PFOA (ng/L)
Lapeer Plating &
Plastics (LP&P) Effluent 19,000 2.3
Elite Cleanroom
Services Outfall 001 23 6.1
McLaren Lapeer
Region
McLaren North Composite
McLaren South Composite
15
5.8
< 2.0
3.2
Thumb Regional
Correctional Facility Effluent 9.1 4.2
Delta Faucet Effluent 4.9 2.5
Mold Masters Effluent 4.7 < 2.0
Albar Industries Albar North
Albar South
5.1
6.6
2.0
< 1.7

AECOM 16
Significant Industrial User Sampling Location PFOS (ng/L) PFOA (ng/L)
Area 1 & Suncrest Effluent 12 2.7
7.3 Lapeer Plating and Plastics
Lapeer Plating & Plastics is a chrome plater that produces the following products:
Emblems – Decorative automotive components that are used by Original Equipment Manufacturers to
brand vehicles.
Nameplates – Decorative automotive components that display a vehicle’s brand name. Nameplates are
usually chrome plated and placed on the rear of the vehicle.
Ornamentation – Decorative automotive components that are typically found on the hood, side panel, or
rear of the vehicle.
Body Side Moldings - Body Side Moldings are installed across the length of the vehicles. They provide
protection to the door against damage and increase the aesthetic appeal of the vehicle.
Grille & Grille Assemblies – A grille is an ornamental grating that forms a barrier or screen at the front
end of a vehicle that increases the aesthetic appeal of a vehicle. It functions to cover an opening in the
body of a vehicle to allow air to enter while protecting the radiator and engine.
Interior Decorative Trims – Chrome plated interior decorative trims used to accent many luxurious
features with decorative trim components such as door spears, center stack, cup holder, and instrument
cluster bezels.
Exterior Decorative Trims – Exterior surface decorations are used to achieve market distinction and
high consumer appeal. Available finishes that are available are bright chrome, satin ‘low-reflection’
chrome, emblem painting, and mold-In color polymers.
Headlamp & Tail Light Trims – The headlamp trim, also referred to as the headlight door, is the metal or
plastic ring or frame that holds the lens in place in the headlight housing. This customizable component is
known to increase the cosmetic look of an entire headlamp housing significantly.
PFAS are used as wetting agents in many wet-chemical processes of surface finishing, such as
electroplating. PFOS is used in the chrome plating industry because it has the very high chemical
stability to the powerful oxidizer, chromium (VI), and to sulfuric acid/chromo-sulfuric acid. In electroplating
systems, PFOS decreases the surface tension of the treatment baths, where components to be treated
are immersed and reduces the amount of process solution carried over into subsequent tanks by means
of more rapid draining. The complete removal of the process solution from the surface is a prerequisite for
the quality and uniformity of coatings. The use of PFOS in chromium electroplaters also reduces the
formation of toxic chromium (VI) aerosols by evaporation of hydrogen and oxygen on the electrodes.
PFOS is not expected to form sludge from the degradation products in the tank, which could affect the
quality of the component surfaces. While PFOS is not likely to degrade during the plating process, some
PFOS is lost due to partial grad-out into subsequent electroplating tanks and needs to be replenished.
Under extreme, aggressive chemical conditions, such as those in electroplating, conventional, bio-
degradable surfactants would rapidly degrade. PFOS has been used in hard and bright chrome
electrolytes, in chromic acid plastic etchants, in alkaline zinc and zinc alloy electrolytes, in precious metal
plating (e.g., strongly acidic gold-palladium), rhodium baths, nickel plating, and aluminum anodizing. A list
of various wetting agents that contain PFOS used in various plating processes is listed in the table below
along with the PFOS concentrations.

AECOM 17
Wetting Agent PFOS Concentration
(ng/L)
Fumetrol 140 by Atotech 43,000,000,000
Bayowet FT 248 by Lanxess 580,000,000,000
Proquel Z Fa.Kiesow 50,000,000,000
Silken Wet 302 45,000,000,000
Ankor SRK 69,000,000,000
NCR by Blasberg-Werra-Chemie 50,000,000,000
LP&P has been using wetting agents that contain PFAS such as Ankor® Wetting Agent F and more
recently since 2013 Ankor® LF19. As presented in the table above the PFOS concentration in the wetting
agents could vary between 43,000,000,000 to 580,000,000,000 ng/L. A formula of Ankor wetting agent
was found to have a concentration of 69,000,000,000 ng/L. During the plating process, only a small
amount of wetting agent is used, and the industrial wastewater effluent from the facility goes through a
series of pretreatment processes. As a result, the PFOS concentrations are expected to be significantly
lower than those in the actual concentrate. Concentrations in the LP&P effluent in 2017 varied between
110 to 34,000 ng/L.
The MDEQ has worked with LP&P to improve their treatment system in order to significantly reduce the
PFOS concentration in their effluent that discharges to the City of Lapeer WWTP. In order to better
understand the PFOS concentrations at various stages in the LP&P’s pretreatment system and determine
where improvements can be made in the removal of PFOS, samples were collected within the LP&P
facility and results are presented in the table below. The PFOS concentrations within the LP&P facility
including between various treatment processes varied between 13 to 25,000,000 ng/L. After
improvements to the treatment system were made at the LP&P facility, the concentrations varied between
non-detect to 4,300 ng/L.
Wetting Agent PFOS Concentration
(ng/L)
Etch Pit 1 1,500,000
Pre-Plate Pit 1 140,000
HI PH Compartment 18,000
E-Copper 440
Clarifier 4,400
Main Holding Tank 5,300
Polymer Storage 13
Etch Pit 2 25,000,000
Pre-Plate Pit 2 610,000
Plating Line Chrome Pit 200,000
Chromium Recovery Unit 480
Steam Line Etch 41
Effluent 13,000
Filter Press 6,100

AECOM 18
7.4 City of Lapeer WWTP
Analysis of the City of Lapeer’s WWTP effluent identified the WWTP as a significant source of PFOS to
the Flint River in May of 2017, with an effluent PFOS concentration of 415 ng/l. The MDEQ identified
LP&P as the main PFAS source to the City of Lapeer WWTP. Improvements to the treatment system
were made at the LP&P facility in order to reduce the PFOS concentration in the effluent that was directed
to the WWTP. Improvements were made by LP&P to treat effluent for PFOS resulted in the WWTP
PFOS effluent concentration decreasing from 2,000 ng/l in July 2017 to 14 ng/l in April 2018.
The City of Lapeer was authorized to land-apply biosolids from the Lapeer WWTP in accordance with a
Residuals Management Program RMP approved by the MDEQ on October 17, 2000. The biosolids were
injected below the surface to a maximum depth of 12 inches. Due to recent concerns regarding the
potential for PFAS impacted biosolids being land applied, the MDEQ requested the City of Lapeer to
analyze their biosolids for PFAS on August 24, 2017. A biosolids sample was collected from the aerobic
digester which had a 4.4 % solids content. Results indicated that PFAS was present in biosolids at
elevated concentrations. The concentration of PFOS in the sludge collected was found to be 2,100 ng/g
or ppb.
The MDEQ conducted an initial, limited investigation in December 2017 at the Site owned by the City of
Lapeer where biosolids from the City of Lapeer WWTP were land applied. The investigation included
three surface soil samples and one surface water sample. Approximately 1,423 dry tons of biosolids
were applied to this field since 1999 with the last application occurring in 2014. During that time, the Site
had repeated biosolids land applications which were generally applied to the 50 acres approved for the
application. The results of the initial MDEQ investigation indicated the highest PFAS concentration was
PFOS, with an average soil concentration of 500 ppb. In addition, PFOS levels in the pond located on the
northeast side of the field were reported at 2,000 ng/l which is above the Part 31 water quality value of 12
ppt. The presence of elevated levels of PFOS in the soils and pond water indicated the potential for
PFOS to be present in adjacent groundwater and/or surface waters.
The MDEQ also conducted a limited investigation at the City of Lapeer WWTP by collecting 2 biosolids
and 4 liquid samples for PFAS analysis. The investigation was conducted by AECOM on behalf of the
MDEQ and was performed in accordance with applicable AECOM, MDEQ, and U.S. EPA guidance
documents, including the site-specific Sampling and Analysis Plan and the Quality Assurance Project
Plan.
7.4.1 Scope of Work
Biosolids and liquid samples were collected from the WWTP to evaluate the PFAS concentrations within
the facility further. A total of two biosolids and four liquid samples were sent for laboratory analysis.
The biosolids and liquid samples were submitted to Vista Analytical Laboratories and analyzed using the
isotope dilution method for a list of 24 PFAS which included:
PFBA = Perfluorobutanoic acid
PFPeA = Perfluoropentanoic acid
PFHxA = Perfluorohexaonic acid
PFHpA = Perfluoroheptanoic acid
PFOA = Perfluorooctanoic acid
PFNA = Perfluorononanoic acid
PFDA = Perfluorodecanoic acid
PFUnDA = Perfluoroundecanoic acid
PFDoDA = perfluorododecanoic acid
PFTeDA = Perfluorotetradecanoic acid

AECOM 19
PFTrDA = Perfluorotridecanoic acid
PFBS = Perfluorobutane sulfonic acid
PFPeS = Perfluoropentane sulfonic acid
PFHxS = Perfluorohexane sulfonic acid
PFHpS = Perfluoroheptane sulfonic acid
PFOS = Perfluorooctane sulfonic acid
PFNS = Perfluorononane sulfonic acid
PFDS = Perfluorodecane sulfonic acid
4:2 FTS = 4:2 fluorotelomer sulfonate
6:2 FTS = 6:2 fluorotelomer sulfonate
8:2 FTS = 8:2 fluorotelomer suflonate
PFOSA = Perfluorooctane sulfonamide
EtFOSAA = N-Ethyl perfluorooctane sulfonamide
MeFOSAA = N-methylperfluoro-1-octane sulfonamide
The biosolids samples were also submitted to Test America Laboratories for total organic carbon analysis.
7.4.2 Biosolids Samples
Biosolids samples were collected on May 9, 2018 from the thickening and dewatering treatment
processes. A biosolids sample was collected from a centrifuge used in the thickening process and
another sample from the sand drying beds used in the dewatering process.
The PFAS data (reported as dry weight), percent solids, and total organic carbon results are summarized
in the table below and attached Table 1, Figure 2, Figure 3, and Figure 4. The
Biosolids Sample IDs
Total PFAS (ng/g)
PFOA (ng/g) PFOS (ng/g) Percent Solids (%)
Total Organic Carbon (%)
Thickening Centrifuge
217 4 161 7.8 36.0
Sand Drying Beds 2,358 Non-Detect 1,680 4.9 30.0
7.4.3 Liquid Samples
Liquid samples were collected on May 9, 2018 from four locations including the WWTP effluent, drying
beds drain, thickening centrifuge centrate and pore water. The centrate was collected from a sampling
port located on the thickening centrifuge. The pore water sample was collected in the laboratory by
centrifuging the biosolids collected from the thickening centrifuge. The PFAS data results are
summarized in the table below and attached Table 1, Figure 5, Figure 6, and Figure 7.
Liquid Sample IDs Total PFAS (ng/L) PFOA (ng/L) PFOS (ng/L)
WWTP Effluent 374 5 29
Centrate 880 14 48
Biosolids Pore water 1,656 56 182
Drying Beds Drain 8,720 92 3,180
AECOM 20
7.4.4 Agricultural Fields
Due to the elevated levels of PFAS identified in the effluent from the WWTP and concerns regarding the
potential for PFAS-impacted biosolids being land applied; the MDEQ requested the City of Lapeer WWTP
to analyze their biosolids for PFAS in addition to the effluent. The concentration of PFOS in the biosolids
was found to be 2,100 nanograms per gram (ng/g) or parts per billion (ppb). In order to evaluate the
potential impact of PFAS-contaminated biosolids in fields where they were land applied by the City of
Lapeer WWTP, the MDEQ conducted a file review and identified 38 fields used by the City of Lapeer for
land application of biosolids since 1997. The City of Lapeer WWTP land applied a total of 8,550 dry tons
of biosolids from the WWTP at 38 agricultural fields between 1999 and 2014. In order to meet the Class
B pathogen reduction and reduce vector attraction; the sludge was stabilized using aerobic digesters after
which the liquid biosolids were pumped to tanker trucks and land applied by injection below the surface to
a maximum depth of 12 inches. The stabilization process used in the past utilized anaerobic digesters
and was recently retrofitted to aerobic digesters in 1993.
The MDEQ selected four (4) of the agricultural fields, to evaluate the impacts from the biosolids land
application, in order to assess the potential PFAS impact on various environmental matrices. Soil, surface
water, and groundwater samples were collected from Sites CL01, SK01, TG01, and TG02 (AECOM
2018a, 2018b, 2018c). Sites TG01 and TG02 were group under one investigation due to their very close
proximity.
Approximately 1,423 dry tons of biosolids from the WWTP were land applied to Site CL01, owned by the
City of Lapeer, between 1999 and 2014. The highest groundwater PFAS concentration of 41,823 ppt was
detected in a perched zone approximately 6 ft below ground surface. The highest surface water PFAS
concentration of about 2,500 ppt was detected in samples from an onsite pond and swale. The highest
soil PFAS concentration of 598 ppb was detected at Site CL01. The results from Site CL01 showed that
high levels of PFAS could potentially be found in soils and leach to the surface water and groundwater at
agricultural sites where PFAS-impacted biosolids have been land applied. Elevated PFAS surface water
concentrations, especially the onsite pond, are likely related to a combination of surface runoff and
discharge of shallow, perched groundwater into the surface water body. A potential for ingestion of PFAS-
impacted fish near the Site was identified. A fish advisory for several fish species is currently in place for
the South Branch of the Flint River. The surface water concentrations did not exceed the Part 31 Final
Acute Value (FAV) and Final Chronic Value (FCV).
A total of 700 dry tons of biosolids was applied at Site SK01 between 1997 through 2007. The highest
PFAS concentrations at Site SK01 in the soils, surface water, and groundwater were 14 ppb, 2,106 ppt,
and 169 ppt, respectively. Elevated PFAS surface water concentrations, are likely related to a
combination of surface runoff and discharge of shallow groundwater into the Lake Pleasant Drain which
flows into Lake Pleasant, approximately 3,400 feet south of the Site. A potential for ingestion of PFAS-
impacted fish was identified and PFAS was subsequently detected in the tissue of largemouth bass
collected from the lake; however, Lake Pleasant is currently not under a PFAS fish advisory. In addition,
the PFAS surface water concentrations did not exceed the Part 31 FAV and FCV, and as a result
ecological impacts are not likely.
A total of 548 dry tons of biosolids were applied at Sites TG01 and TG02 between 2014 through 2017.
The highest PFAS concentrations at Sites TG01 and TG02 in the soils, surface water, and groundwater
were 22.22 ppb, 14.93 ppt, and 5.31 ppt, respectively. Low PFAS surface water concentrations are likely
related to a combination of surface runoff and discharge of shallow groundwater into the surface water
bodies. A potential for ingestion of PFAS-impacted fish near the Site was identified, but does not pose an
unacceptable risk. In addition, the PFAS surface water concentrations did not exceed the Part 31 FAV and
FCV, and as a result ecological impacts are not likely.

AECOM 21
8. Pathway and Receptors Evaluation
An exposure pathway includes five components: a source of contamination; environmental media and
transport mechanism; the point of exposure; the route of exposure; and a receptor population. A pathway
is considered potentially complete if all five components are present and one or more hazardous
substances are detected. The human health risk associated with a possibly complete exposure pathway
is acceptable if concentrations do not exceed the applicable criteria and background concentrations (Rule
299.1013(3). Ecological risks are acceptable if concentrations do not exceed water quality values or soil
screening values.
Potentially complete surface water exposure pathways associated with the Site and corresponding
Part 31 Water Quality Values or other criteria/screening values are:
Ingestion of surface water incidental to recreational activities (human cancer values and non-cancer
values for non-drinking water sources) (PFOA 12,000 ppt and PFOS 12 ppt).
Ingestion of fish (human cancer values and non-cancer values for non-drinking water sources)
PFOA 12,000 ppt and PFOS 12 ppt).
Aquatic life exposures FCV (PFOA 880,000 ppt and PFOS 140,000 ppt) and final FAV (PFOA
15,000,000 ppt and PFOS 1,600,000 ppt)).
Potentially complete biosolids exposure pathways associated with the WWTP and corresponding
Part 201 cleanup criteria (if available) are:
Direct Contact Criteria (DCC; criteria not available).
Soil protection of groundwater for drinking water (DWPC; proposed criteria PFOS 1.4 ppb and
PFOA 59 ppb).
Soil protection for the groundwater-surface water interface (GSIPC; PFOS 0.24 ppb and
PFOA 10,000 ppb).
Human exposure by consuming impacted vegetation (gardening, farming; screening levels not
available).
Potential receptors associated with surface water are:
People using the river and other impacted surface waters for recreational fishing, and
Fish and other aquatic life.
Potential receptors associated with biosolids are:
WWTP workers at the plant, and
Non-residential use of impacted biosolids areas, such as farming and commercial use.
Surface Water Evaluation
PFAS concentrations were detected in the WWTP effluent, centrate, biosolids pore water, and drying
beds drain with all four locations exceeding the Part 31 Water Quality Value for PFOS. However, no
exceedances of the Part 31 FCV and FAV values were detected. Based on the Part 31 Water Quality
Value exceedance there is the potential for exposure to PFAS from ingestion of PFAS-impacted fish due
to bioaccumulation of PFOS in fish tissue. A fish advisory for several fish species is currently in place for
the South Branch of the Flint River due to elevated PFOS concentrations in the fish.
AECOM 22
Biosolids Evaluation
On-site workers may encounter biosolids impacted with PFAS; however, no Part 201 DCC have been
established for PFOS and PFOA. All of the biosolids samples exceeded the GSIPC and the proposed
DWPC for PFOS, indicating a potential of PFOS concentrations to leach into groundwater at levels that
exceed the Part 31 Water Quality Value and Part 201 Drinking Water Criteria (PFOA and PFOS 70 ppt).
PFAS has been documented to transfer to various plants. Depending on the plant type and individual
PFAS, the accumulation of PFAS is not evenly distributed throughout the major components of the plant.
Some of the PFAS will accumulate more in the roots while others will accumulate in the leaves and fruit.
However, there is the possibility of exposure to PFAS via plant uptake through direct or indirect ingestion
of PFAS-impacted plants. Currently there are no PFAS criteria for plants; however, consumption advisory
could be developed in the future similar to those for fish.

AECOM 23
9. Summary and Discussion
PFAS were detected in both biosolids samples (Figure 2), and all four liquid samples (Figure 5). The
following criteria were exceeded:
GSIPC for PFOS in both biosolids samples,
Proposed DWPC, and
Part 31 Water Quality Value for PFOS in all liquid samples.
The PFOS liquid sample results were above the Part 31 Water Quality Value. The PFOS concentrations
varied between 28.7 to 3,180 ng/l. However, the only liquid sample that discharges to the environment is
the WWTP effluent. The other liquid samples are from various treatment processes that are not released
to the environment and recycled within the treatment processes. The PFOS concentration in the WWTP
effluent was 28.7 ng/l more than twice the Part 31 Water Quality Value of 12 ng/l. However, the results
are significantly lower than 2,000 ng/l detected in July 2017. LP&P has made modifications to its
industrial pretreatment wastewater system and has decreased the PFAS concentrations they are
discharging to the WWTP. The other SIUs that discharge to the WWTP had significantly lower
concentrations in their industrial discharges and are not expected to be a significant contributor to the
WWTP. The PFAS from the wastewater is likely to accumulate in the biosolids as it goes through various
treatment processes resulting in a decreased concentration in the liquid phase.
Only one round of sampling was conducted at the wastewater treatment plant on May 9, 2018, and no
trend analysis was able to be performed. PFAS are expected to concentrate in the wastewater solids
(sludge and biosolids) and the precurors are expected to partially degrade to dead-end PFAS such as
PFOA and PFOS. The wastewater collected further down the treatment process are expected to have
higher PFAS concentrations due to the degradation of precusors through the treatment processes. In
addition, liquids in the solids stream are expected to have higher PFAS concentrations due to contact with
the solids (sludge and biosolids) containing higher concentration of PFAS. At this time the influent of the
WWTP was not sampled, but the concentrations in the wastewater increased as the samples were
collected further downgradient in the treatment process. The highest PFAS concentration, from liquid
samples, was detected in the drain of the drying beds associated with solids handling process. The
underdrain for the drying beds collects liquid that is released from the solids placed in the drying beds or
collected from precipitation events. The effluent from the drying beds is recycled back into the secondary
treatment.
The PFAS concentration in the biosolids exceeded both the proposed DWPC and GSIPC, indicating that
there is potential for PFAS to leach from the biosolids to the groundwater or surface water that will exceed
the Part 201 Residential Drinking Water Criterion and Part 31 Water Quality Value. The concentrations
may also be high enough for transfer to various plants. As mentioned in different sections above, the
concentration of pollutants is expected to increase in the biosolids as the wastewater goes through
multiple treatment processes due to the degradation of precusors and accumulation in the sludge andbio
solids. The total PFAS concentration in the drying beds biosolids was 2,358 ppb and in the thickening
centrifuge was 217 ppb. The biosolids sample from the drying beds had lower percent solids than that of
the thickened centrifuge biosolids, probably due to precipitation. In August 2017 a sample from the
aerobic digester was collected, and the total PFAS concentration was 2,337 ppb. The concentration in
the aerobic digester would be expected to be similar to that of the thickened centrifuge biosolids. All three
of the biosolids samples collected from the WWTP were collected after the sludge has gone through the
final stabilization treatment process. The variation in the PFAS concentrations between the three
biosolids samples collected in 2017 and 2018 are most likely attributed to the variation in PFAS
concentrations in the WWTP influent over time.
A direct contact exposure risk was not identified at any of the Sites. The South Branch of the Flint River
was found to be impacted by PFAS due to the WWTP effluent but did not exceed the Part 31 Water
Quality Value for PFOS downstream of the WWTP discharge location. However, surface water samples
significantly above the Part 31 Water Quality Value for PFOS were detected at agricultural sites where
biosolids were land applied. The groundwater and soils could also be impacted at agricultural fields

AECOM 24
where biosolids were land applied. The actual PFAS concentrations detected at sites where the land
application of PFAS-impacted biosolids occurred could vary significantly depending on the frequency of
the biosolids application, PFAS concentrations in the biosolids, the percentage of the land used for
biosolids application, geochemistry, and geology of the site. Uptake of PFAS to various crops is also
possible, but an ingestion criterion for plants has not been established. Ecological screening levels are
also not available for soil or sediments at this time.

AECOM 1
Figures

52 E Oregon St
Mill St
Lyle
St
Railr
oad S
t
E Fair
St
Industrial Dr
N Saginaw St
Drawn:
Approved:
Project #:
Date: 9/28/2018
Date: 9/28/2018
LegendWaste WaterTreatment PlantRoadSurface Water
FIGURE 1LAPEER WWTPSITE OVERVIEW
LAPEER COUNTY, MIDocument Path: G:\GrandRapids\DCS\GIS\ArcMap_GeoDB_Projects\ENV\GIS_Data\GIS\Lapeer_LPP\MXDs\8.5x11\CL01_WWTP.mxd
0 90 180Feet

52Ra
ilroa
d St
Lyle
St
E Fair
St
N Saginaw St
Mill St
Industrial Dr
E Oregon St
Drying BedsBiosolids
CentrifugeBiosolids
Drawn:
Approved:
Project #:
Date: 10/5/2018
Date: 10/5/2018
Waste WaterTreatment PlantRoadSurface Water
FIGURE 2LAPEER WWTP
BIOSOLIDS TOTAL PFASCONCENTRATION
LAPEER COUNTY, MIDocument Path: G:\GrandRapids\DCS\GIS\ArcMap_GeoDB_Projects\ENV\GIS_Data\GIS\Lapeer_LPP\MXDs\8.5x11\Heatmaps\WWTP\CL01_WWTP_Biosolids_totalPFAS.mxd
Sampling ResultsTotal PFAS (ng/g or ppb)
ND>0 - 50>50 - 100>100 - 1000>1000 0 90 180
Feet

52
Lyle
St
Railr
oad S
t
E Fair
St
N Saginaw St
Industrial Dr
E Oregon StMill St
Drying BedsBiosolids
CentrifugeBiosolids
Drawn:
Approved:
Project #:
Date: 10/5/2018
Date: 10/5/2018
Waste WaterTreatment PlantRoadSurface Water
FIGURE 3LAPEER WWTP
BIOSOLIDS PFOSCONCENTRATION
LAPEER COUNTY, MIDocument Path: G:\GrandRapids\DCS\GIS\ArcMap_GeoDB_Projects\ENV\GIS_Data\GIS\Lapeer_LPP\MXDs\8.5x11\Heatmaps\WWTP\CL01_WWTP_Biosolids_PFOS.mxd
Sampling ResultsPFOS (ng/g or ppb)
ND>0 - 50>50 - 100>100 - 1000>1000 0 100 200Feet
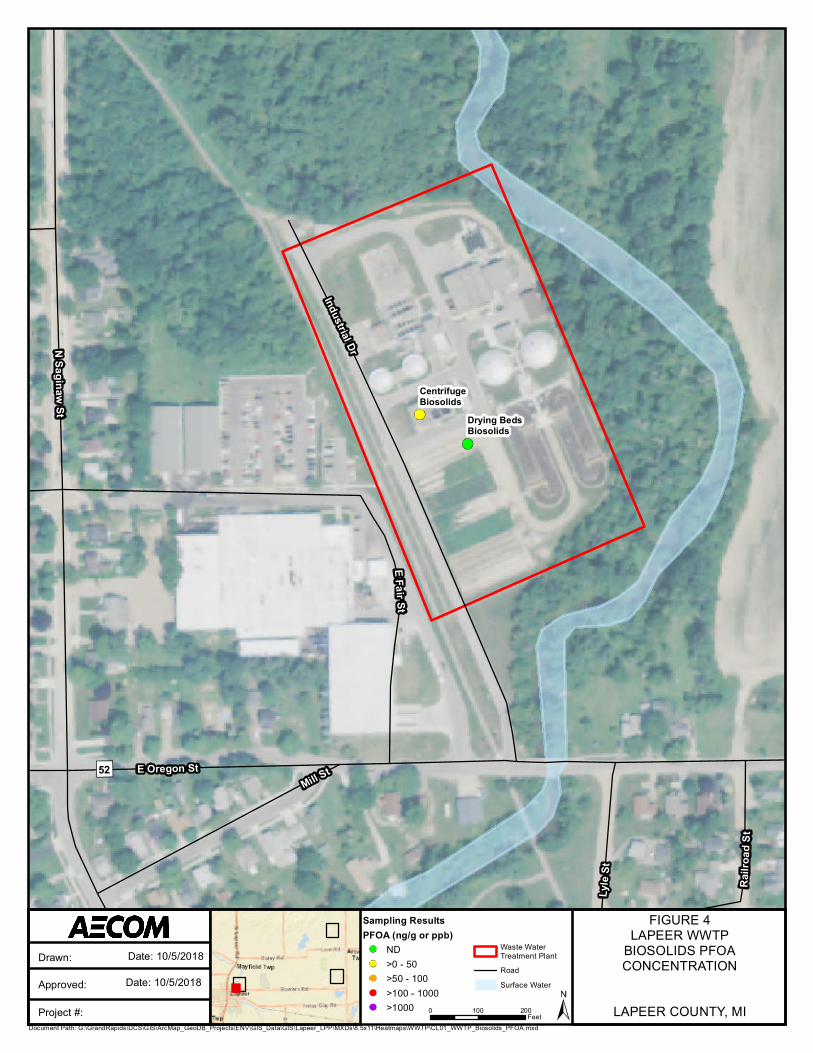
52
Lyle
St
Railr
oad S
tN Saginaw St
Industrial Dr
Mill St
E Fair St
E Oregon St
Drying BedsBiosolids
CentrifugeBiosolids
Drawn:
Approved:
Project #:
Date: 10/5/2018
Date: 10/5/2018
Waste WaterTreatment PlantRoadSurface Water
FIGURE 4LAPEER WWTP
BIOSOLIDS PFOACONCENTRATION
LAPEER COUNTY, MIDocument Path: G:\GrandRapids\DCS\GIS\ArcMap_GeoDB_Projects\ENV\GIS_Data\GIS\Lapeer_LPP\MXDs\8.5x11\Heatmaps\WWTP\CL01_WWTP_Biosolids_PFOA.mxd
Sampling ResultsPFOA (ng/g or ppb)
ND>0 - 50>50 - 100>100 - 1000>1000 0 100 200Feet

52
Lyle
St
Railr
oad S
tN Saginaw St
E Fair St
Mill St
Industrial Dr
E Oregon St
WWTP Effluent
DryingBedsDrain
Centrate
CentrifugeBiosolids
Pore Water
Drawn:
Approved:
Project #:
Date: 10/5/2018
Date: 10/5/2018
Waste WaterTreatment PlantRoadSurface Water
FIGURE 5LAPEER WWTP
LIQUID TOTAL PFASCONCENTRATION
LAPEER COUNTY, MIDocument Path: G:\GrandRapids\DCS\GIS\ArcMap_GeoDB_Projects\ENV\GIS_Data\GIS\Lapeer_LPP\MXDs\8.5x11\Heatmaps\WWTP\CL01_WWTP_Aqueous_totalPFAS.mxd
Sampling ResultsTotal PFAS (ng/L or ppt)
ND>0 - 50>50 - 100>100 - 1000>1000 0 90 180
Feet

52
Lyle
St
Railr
oad S
t
E Fair
St
Industrial Dr
E Oregon St
Mill St
N Saginaw St
WWTP Effluent
DryingBedsDrain
Centrate
CentrifugeBiosolids
Pore Water
Drawn:
Approved:
Project #:
Date: 10/5/2018
Date: 10/5/2018
Waste WaterTreatment PlantRoadSurface Water
FIGURE 6LAPEER WWTPLIQUID PFOS
CONCENTRATION
LAPEER COUNTY, MIDocument Path: G:\GrandRapids\DCS\GIS\ArcMap_GeoDB_Projects\ENV\GIS_Data\GIS\Lapeer_LPP\MXDs\8.5x11\Heatmaps\WWTP\CL01_WWTP_Aqueous_PFOS.mxd
Sampling ResultsPFOS (ng/L or ppt)
ND>0 - 12>12 - 70>70 - 1000>1000 0 90 180
Feet

52
Lyle
St
Railr
oad S
t
E Fair
St
Industrial Dr
N Saginaw StE Oregon St
Mill St
WWTP Effluent
DryingBedsDrain
Centrate
CentrifugeBiosolids
Pore Water
Drawn:
Approved:
Project #:
Date: 10/5/2018
Date: 10/5/2018
Waste WaterTreatment PlantRoadSurface Water
FIGURE 7LAPEER WWTPLIQUID PFOA
CONCENTRATION
LAPEER COUNTY, MIDocument Path: G:\GrandRapids\DCS\GIS\ArcMap_GeoDB_Projects\ENV\GIS_Data\GIS\Lapeer_LPP\MXDs\8.5x11\Heatmaps\WWTP\CL01_WWTP_Aqueous_PFOA.mxd
Sampling ResultsPFOA (ng/L or ppt)
ND>0 - 12>12 - 70>70 - 1000>1000 0 90 180
Feet

AECOM 2
Table
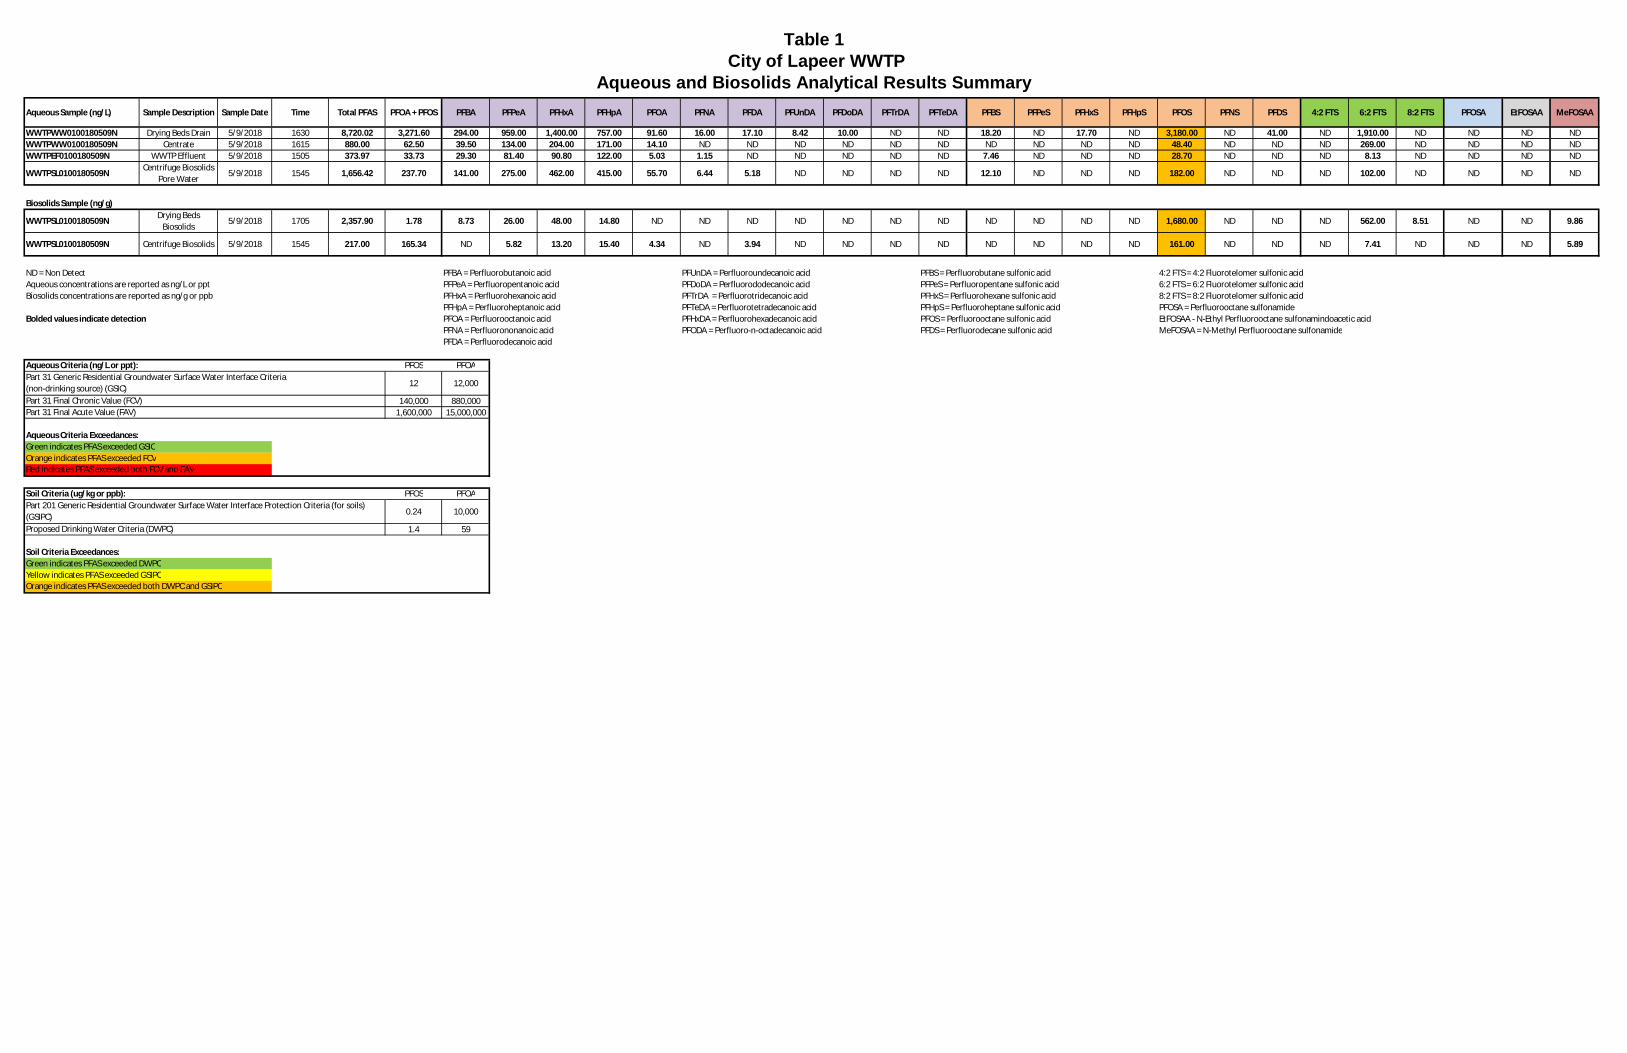
Table 1
City of Lapeer WWTP
Aqueous and Biosolids Analytical Results Summary
Aqueous Sample (ng/L) Sample Description Sample Date Time Total PFAS PFOA + PFOS PFBA PFPeA PFHxA PFHpA PFOA PFNA PFDA PFUnDA PFDoDA PFTrDA PFTeDA PFBS PFPeS PFHxS PFHpS PFOS PFNS PFDS 4:2 FTS 6:2 FTS 8:2 FTS PFOSA EtFOSAA MeFOSAA
WWTPWW0100180509N Drying Beds Drain 5/9/2018 1630 8,720.02 3,271.60 294.00 959.00 1,400.00 757.00 91.60 16.00 17.10 8.42 10.00 ND ND 18.20 ND 17.70 ND 3,180.00 ND 41.00 ND 1,910.00 ND ND ND NDWWTPWW0100180509N Centrate 5/9/2018 1615 880.00 62.50 39.50 134.00 204.00 171.00 14.10 ND ND ND ND ND ND ND ND ND ND 48.40 ND ND ND 269.00 ND ND ND NDWWTPEF0100180509N WWTP Effluent 5/9/2018 1505 373.97 33.73 29.30 81.40 90.80 122.00 5.03 1.15 ND ND ND ND ND 7.46 ND ND ND 28.70 ND ND ND 8.13 ND ND ND ND
WWTPSL0100180509NCentrifuge Biosolids
Pore Water5/9/2018 1545 1,656.42 237.70 141.00 275.00 462.00 415.00 55.70 6.44 5.18 ND ND ND ND 12.10 ND ND ND 182.00 ND ND ND 102.00 ND ND ND ND
Biosolids Sample (ng/g)
WWTPSL0100180509NDrying Beds
Biosolids5/9/2018 1705 2,357.90 1.78 8.73 26.00 48.00 14.80 ND ND ND ND ND ND ND ND ND ND ND 1,680.00 ND ND ND 562.00 8.51 ND ND 9.86
WWTPSL0100180509N Centrifuge Biosolids 5/9/2018 1545 217.00 165.34 ND 5.82 13.20 15.40 4.34 ND 3.94 ND ND ND ND ND ND ND ND 161.00 ND ND ND 7.41 ND ND ND 5.89
ND = Non Detect PFBA = Perfluorobutanoic acid PFUnDA = Perfluoroundecanoic acid PFBS = Perfluorobutane sulfonic acid 4:2 FTS = 4:2 Fluorotelomer sulfonic acidAqueous concentrations are reported as ng/L or ppt PFPeA = Perfluoropentanoic acid PFDoDA = Perfluorododecanoic acid PFPeS = Perfluoropentane sulfonic acid 6:2 FTS = 6:2 Fluorotelomer sulfonic acidBiosolids concentrations are reported as ng/g or ppb PFHxA = Perfluorohexanoic acid PFTrDA = Perfluorotridecanoic acid PFHxS = Perfluorohexane sulfonic acid 8:2 FTS = 8:2 Fluorotelomer sulfonic acid
PFHpA = Perfluoroheptanoic acid PFTeDA = Perfluorotetradecanoic acid PFHpS = Perfluoroheptane sulfonic acid PFOSA = Perfluorooctane sulfonamideBolded values indicate detection PFOA = Perfluorooctanoic acid PFHxDA = Perfluorohexadecanoic acid PFOS = Perfluorooctane sulfonic acid EtFOSAA - N-Ethyl Perfluorooctane sulfonamindoacetic acid
PFNA = Perfluorononanoic acid PFODA = Perfluoro-n-octadecanoic acid PFDS = Perfluorodecane sulfonic acid MeFOSAA = N-Methyl Perfluorooctane sulfonamidePFDA = Perfluorodecanoic acid
Aqueous Criteria (ng/L or ppt): PFOS PFOA
12 12,000
Part 31 Final Chronic Value (FCV) 140,000 880,000Part 31 Final Acute Value (FAV) 1,600,000 15,000,000
Aqueous Criteria Exceedances:Green indicates PFAS exceeded GSICOrange indicates PFAS exceeded FCVRed indicates PFAS exceeded both FCV and FAV
Soil Criteria (ug/kg or ppb): PFOS PFOA
0.24 10,000
Proposed Drinking Water Criteria (DWPC) 1.4 59
Soil Criteria Exceedances:Green indicates PFAS exceeded DWPCYellow indicates PFAS exceeded GSIPCOrange indicates PFAS exceeded both DWPC and GSIPC
Part 201 Generic Residential Groundwater Surface Water Interface Protection Criteria (for soils)(GSIPC)
Part 31 Generic Residential Groundwater Surface Water Interface Criteria(non-drinking source) (GSIC)

AECOM 3
Laboratory Analytical Reports
Appendix A

ANALYTICAL REPORTTestAmerica Laboratories, Inc.TestAmerica Edison777 New Durham RoadEdison, NJ 08817Tel: (732)549-3900
TestAmerica Job ID: 460-159618-1Client Project/Site: Lloyd Kahn Samples
For:AECOM250 Apollo DriveChelmsford, Massachusetts 01824
Attn: Mr. Robert Kennedy
Authorized for release by:7/18/2018 7:03:42 PM
Kris Brooks, Project Manager II(330)[email protected]
This report has been electronically signed and authorized by the signatory. Electronic signature isintended to be the legally binding equivalent of a traditionally handwritten signature.
Results relate only to the items tested and the sample(s) as received by the laboratory.
1
2
3
4
5
6
7
8
9
10
11
12
13
14

Table of Contents
Client: AECOMProject/Site: Lloyd Kahn Samples
TestAmerica Job ID: 460-159618-1
Page 2 of 16TestAmerica Edison
7/18/2018
Cover Page . . . . . . . . . . . . . . . . . . . . . . . . . . . . . . . . . . . . . . . . . . . . . . 1
Table of Contents . . . . . . . . . . . . . . . . . . . . . . . . . . . . . . . . . . . . . . . . . 2
Definitions/Glossary . . . . . . . . . . . . . . . . . . . . . . . . . . . . . . . . . . . . . . . 3
Case Narrative . . . . . . . . . . . . . . . . . . . . . . . . . . . . . . . . . . . . . . . . . . . 4
Detection Summary . . . . . . . . . . . . . . . . . . . . . . . . . . . . . . . . . . . . . . . . 6
Client Sample Results . . . . . . . . . . . . . . . . . . . . . . . . . . . . . . . . . . . . . . 7
QC Sample Results . . . . . . . . . . . . . . . . . . . . . . . . . . . . . . . . . . . . . . . . 8
QC Association Summary . . . . . . . . . . . . . . . . . . . . . . . . . . . . . . . . . . . 9
Lab Chronicle . . . . . . . . . . . . . . . . . . . . . . . . . . . . . . . . . . . . . . . . . . . . 10
Certification Summary . . . . . . . . . . . . . . . . . . . . . . . . . . . . . . . . . . . . . . 11
Method Summary . . . . . . . . . . . . . . . . . . . . . . . . . . . . . . . . . . . . . . . . . 12
Sample Summary . . . . . . . . . . . . . . . . . . . . . . . . . . . . . . . . . . . . . . . . . 13
Chain of Custody . . . . . . . . . . . . . . . . . . . . . . . . . . . . . . . . . . . . . . . . . . 14
Receipt Checklists . . . . . . . . . . . . . . . . . . . . . . . . . . . . . . . . . . . . . . . . . 16
1
2
3
4
5
6
7
8
9
10
11
12
13
14
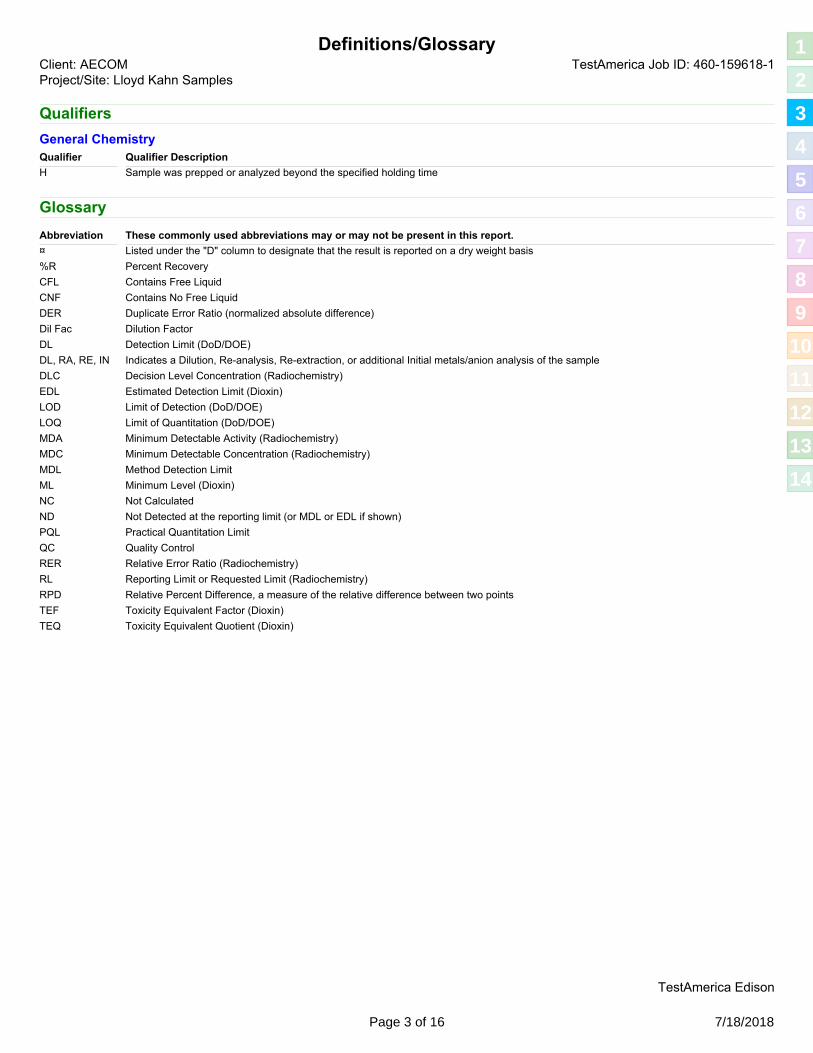
Definitions/GlossaryTestAmerica Job ID: 460-159618-1Client: AECOM
Project/Site: Lloyd Kahn Samples
Qualifiers
General Chemistry
Qualifier Description
H Sample was prepped or analyzed beyond the specified holding time
Qualifier
Glossary
These commonly used abbreviations may or may not be present in this report.
¤ Listed under the "D" column to designate that the result is reported on a dry weight basis
Abbreviation
%R Percent Recovery
CFL Contains Free Liquid
CNF Contains No Free Liquid
DER Duplicate Error Ratio (normalized absolute difference)
Dil Fac Dilution Factor
DL Detection Limit (DoD/DOE)
DL, RA, RE, IN Indicates a Dilution, Re-analysis, Re-extraction, or additional Initial metals/anion analysis of the sample
DLC Decision Level Concentration (Radiochemistry)
EDL Estimated Detection Limit (Dioxin)
LOD Limit of Detection (DoD/DOE)
LOQ Limit of Quantitation (DoD/DOE)
MDA Minimum Detectable Activity (Radiochemistry)
MDC Minimum Detectable Concentration (Radiochemistry)
MDL Method Detection Limit
ML Minimum Level (Dioxin)
NC Not Calculated
ND Not Detected at the reporting limit (or MDL or EDL if shown)
PQL Practical Quantitation Limit
QC Quality Control
RER Relative Error Ratio (Radiochemistry)
RL Reporting Limit or Requested Limit (Radiochemistry)
RPD Relative Percent Difference, a measure of the relative difference between two points
TEF Toxicity Equivalent Factor (Dioxin)
TEQ Toxicity Equivalent Quotient (Dioxin)
TestAmerica Edison
Page 3 of 16 7/18/2018
1
2
3
4
5
6
7
8
9
10
11
12
13
14
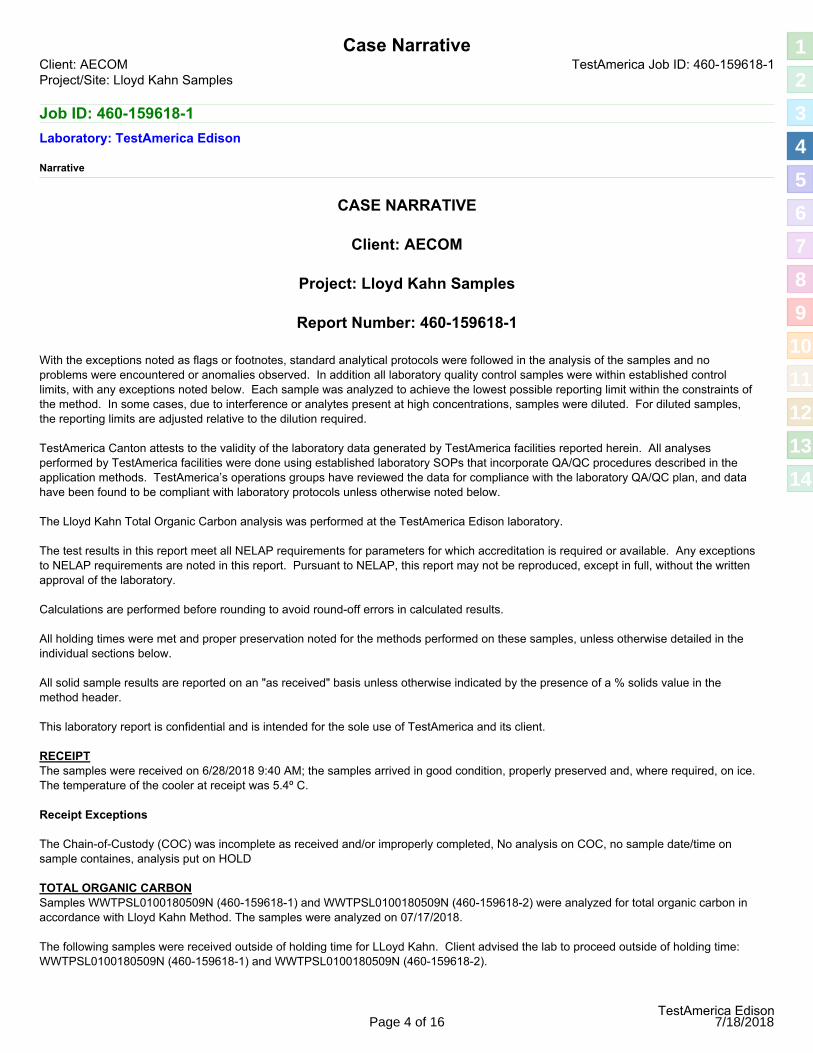
Case NarrativeClient: AECOM TestAmerica Job ID: 460-159618-1Project/Site: Lloyd Kahn Samples
Job ID: 460-159618-1
Laboratory: TestAmerica Edison
Narrative
CASE NARRATIVE
Client: AECOM
Project: Lloyd Kahn Samples
Report Number: 460-159618-1
With the exceptions noted as flags or footnotes, standard analytical protocols were followed in the analysis of the samples and no problems were encountered or anomalies observed. In addition all laboratory quality control samples were within established control limits, with any exceptions noted below. Each sample was analyzed to achieve the lowest possible reporting limit within the constraints of
the method. In some cases, due to interference or analytes present at high concentrations, samples were diluted. For diluted samples, the reporting limits are adjusted relative to the dilution required.
TestAmerica Canton attests to the validity of the laboratory data generated by TestAmerica facilities reported herein. All analyses performed by TestAmerica facilities were done using established laboratory SOPs that incorporate QA/QC procedures described in the
application methods. TestAmerica’s operations groups have reviewed the data for compliance with the laboratory QA/QC plan, and data have been found to be compliant with laboratory protocols unless otherwise noted below.
The Lloyd Kahn Total Organic Carbon analysis was performed at the TestAmerica Edison laboratory.
The test results in this report meet all NELAP requirements for parameters for which accreditation is required or available. Any exceptions to NELAP requirements are noted in this report. Pursuant to NELAP, this report may not be reproduced, except in full, without the written approval of the laboratory.
Calculations are performed before rounding to avoid round-off errors in calculated results.
All holding times were met and proper preservation noted for the methods performed on these samples, unless otherwise detailed in the individual sections below.
All solid sample results are reported on an "as received" basis unless otherwise indicated by the presence of a % solids value in the
method header.
This laboratory report is confidential and is intended for the sole use of TestAmerica and its client.
RECEIPT
The samples were received on 6/28/2018 9:40 AM; the samples arrived in good condition, properly preserved and, where required, on ice. The temperature of the cooler at receipt was 5.4º C.
Receipt Exceptions
The Chain-of-Custody (COC) was incomplete as received and/or improperly completed, No analysis on COC, no sample date/time on sample containes, analysis put on HOLD
TOTAL ORGANIC CARBONSamples WWTPSL0100180509N (460-159618-1) and WWTPSL0100180509N (460-159618-2) were analyzed for total organic carbon in
accordance with Lloyd Kahn Method. The samples were analyzed on 07/17/2018.
The following samples were received outside of holding time for LLoyd Kahn. Client advised the lab to proceed outside of holding time:
WWTPSL0100180509N (460-159618-1) and WWTPSL0100180509N (460-159618-2).
TestAmerica EdisonPage 4 of 16 7/18/2018
1
2
3
4
5
6
7
8
9
10
11
12
13
14

Case NarrativeClient: AECOM TestAmerica Job ID: 460-159618-1Project/Site: Lloyd Kahn Samples
Job ID: 460-159618-1 (Continued)
Laboratory: TestAmerica Edison (Continued)
No additional analytical or quality issues were noted, other than those described above or in the Definitions/Glossary page.
PERCENT SOLIDS
Samples WWTPSL0100180509N (460-159618-1) and WWTPSL0100180509N (460-159618-2) were analyzed for percent solids in
accordance with ASTM Method D2216-80. The samples were analyzed on 07/14/2018.
No analytical or quality issues were noted, other than those described above or in the Definitions/Glossary page.
TestAmerica EdisonPage 5 of 16 7/18/2018
1
2
3
4
5
6
7
8
9
10
11
12
13
14
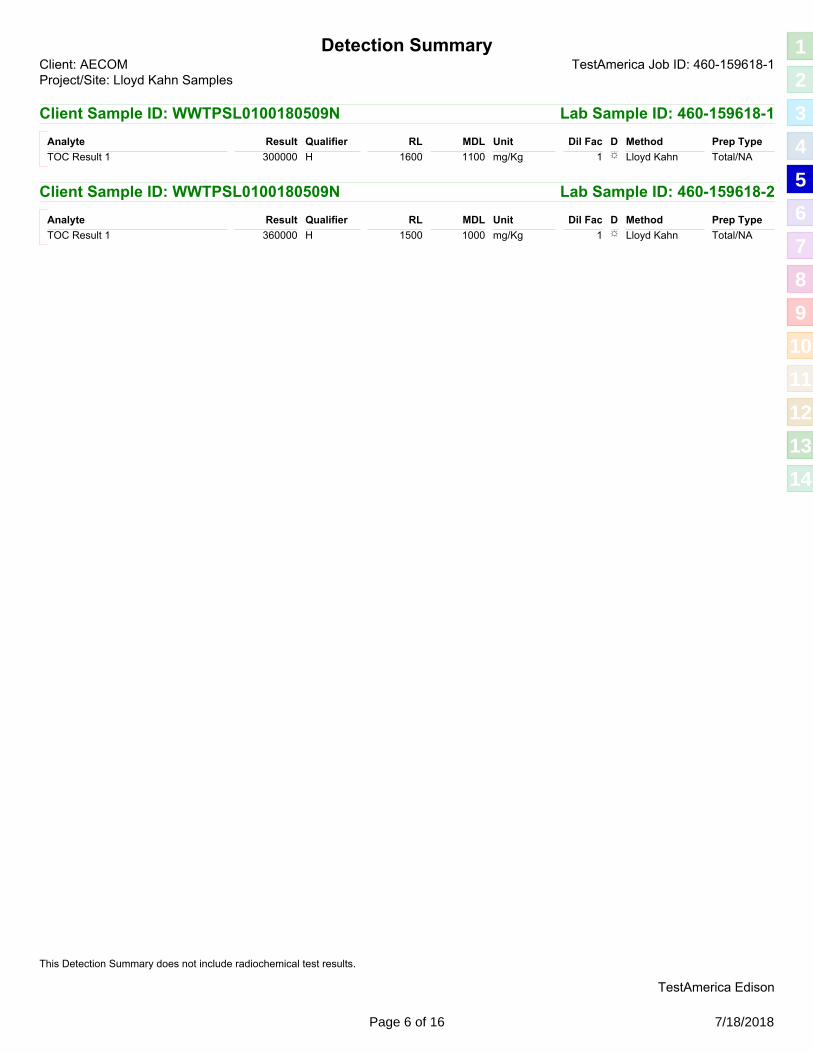
Detection SummaryTestAmerica Job ID: 460-159618-1Client: AECOM
Project/Site: Lloyd Kahn Samples
Client Sample ID: WWTPSL0100180509N Lab Sample ID: 460-159618-1
☼TOC Result 1
RL
1600 mg/Kg
MDL
1100
Analyte Result Qualifier Unit Dil Fac D Method Prep Type
Total/NA1H300000 Lloyd Kahn
Client Sample ID: WWTPSL0100180509N Lab Sample ID: 460-159618-2
☼TOC Result 1
RL
1500 mg/Kg
MDL
1000
Analyte Result Qualifier Unit Dil Fac D Method Prep Type
Total/NA1H360000 Lloyd Kahn
TestAmerica Edison
This Detection Summary does not include radiochemical test results.
Page 6 of 16 7/18/2018
1
2
3
4
5
6
7
8
9
10
11
12
13
14

Client Sample ResultsTestAmerica Job ID: 460-159618-1Client: AECOM
Project/Site: Lloyd Kahn Samples
Lab Sample ID: 460-159618-1Client Sample ID: WWTPSL0100180509NMatrix: SolidDate Collected: 05/18/18 11:35
Date Received: 06/28/18 09:40
General ChemistryRL MDL
Percent Moisture 93.8 1.0 1.0 % 07/14/18 08:19 1
Analyte Dil FacAnalyzedPreparedUnit DResult Qualifier
1.0 1.0 % 07/14/18 08:19 1Percent Solids 6.2
Lab Sample ID: 460-159618-1Client Sample ID: WWTPSL0100180509NMatrix: SolidDate Collected: 05/18/18 11:35
Percent Solids: 6.2Date Received: 06/28/18 09:40
General ChemistryRL MDL
TOC Result 1 300000 H 1600 1100 mg/Kg ☼ 07/17/18 15:26 1
Analyte Dil FacAnalyzedPreparedUnit DResult Qualifier
Lab Sample ID: 460-159618-2Client Sample ID: WWTPSL0100180509NMatrix: SolidDate Collected: 05/18/18 12:10
Date Received: 06/28/18 09:40
General ChemistryRL MDL
Percent Moisture 93.3 1.0 1.0 % 07/14/18 08:19 1
Analyte Dil FacAnalyzedPreparedUnit DResult Qualifier
1.0 1.0 % 07/14/18 08:19 1Percent Solids 6.7
Lab Sample ID: 460-159618-2Client Sample ID: WWTPSL0100180509NMatrix: SolidDate Collected: 05/18/18 12:10
Percent Solids: 6.7Date Received: 06/28/18 09:40
General ChemistryRL MDL
TOC Result 1 360000 H 1500 1000 mg/Kg ☼ 07/17/18 15:34 1
Analyte Dil FacAnalyzedPreparedUnit DResult Qualifier
TestAmerica Edison
Page 7 of 16 7/18/2018
1
2
3
4
5
6
7
8
9
10
11
12
13
14

QC Sample ResultsTestAmerica Job ID: 460-159618-1Client: AECOM
Project/Site: Lloyd Kahn Samples
Method: Lloyd Kahn - Organic Carbon, Total (TOC)
Client Sample ID: Method BlankLab Sample ID: MB 460-537280/3Matrix: Solid Prep Type: Total/NAAnalysis Batch: 537280
RL MDL
TOC Result 1 ND 100 69 mg/Kg 07/17/18 13:23 1
MB MB
Analyte Dil FacAnalyzedPreparedDUnitResult Qualifier
Client Sample ID: Lab Control SampleLab Sample ID: LCSSRM 460-537280/4Matrix: Solid Prep Type: Total/NAAnalysis Batch: 537280
TOC Result 1 5770 5910 mg/Kg 102.4 35.4 - 194.
1
Analyte
LCSSRM LCSSRM
DUnitResult Qualifier %Rec
Spike
Added
%Rec.
Limits
TestAmerica Edison
Page 8 of 16 7/18/2018
1
2
3
4
5
6
7
8
9
10
11
12
13
14

QC Association SummaryTestAmerica Job ID: 460-159618-1Client: AECOM
Project/Site: Lloyd Kahn Samples
General Chemistry
Analysis Batch: 536389
Lab Sample ID Client Sample ID Prep Type Matrix Method Prep Batch
Solid Moisture460-159618-1 WWTPSL0100180509N Total/NA
Solid Moisture460-159618-2 WWTPSL0100180509N Total/NA
Analysis Batch: 537280
Lab Sample ID Client Sample ID Prep Type Matrix Method Prep Batch
Solid Lloyd Kahn460-159618-1 WWTPSL0100180509N Total/NA
Solid Lloyd Kahn460-159618-2 WWTPSL0100180509N Total/NA
Solid Lloyd KahnMB 460-537280/3 Method Blank Total/NA
Solid Lloyd KahnLCSSRM 460-537280/4 Lab Control Sample Total/NA
TestAmerica Edison
Page 9 of 16 7/18/2018
1
2
3
4
5
6
7
8
9
10
11
12
13
14

Lab ChronicleClient: AECOM TestAmerica Job ID: 460-159618-1Project/Site: Lloyd Kahn Samples
Client Sample ID: WWTPSL0100180509N Lab Sample ID: 460-159618-1Matrix: SolidDate Collected: 05/18/18 11:35
Date Received: 06/28/18 09:40
Analysis Moisture 07/14/18 08:19 BJP1 536389 TAL EDI
Type
Batch Batch
MethodPrep Type LabAnalystRun
Prepared
or Analyzed
Batch
Number
Dilution
Factor
Total/NA
Client Sample ID: WWTPSL0100180509N Lab Sample ID: 460-159618-1Matrix: SolidDate Collected: 05/18/18 11:35
Percent Solids: 6.2Date Received: 06/28/18 09:40
Analysis Lloyd Kahn 07/17/18 15:26 JXT1 537280 TAL EDI
Type
Batch Batch
MethodPrep Type LabAnalystRun
Prepared
or Analyzed
Batch
Number
Dilution
Factor
Total/NA
Client Sample ID: WWTPSL0100180509N Lab Sample ID: 460-159618-2Matrix: SolidDate Collected: 05/18/18 12:10
Date Received: 06/28/18 09:40
Analysis Moisture 07/14/18 08:19 BJP1 536389 TAL EDI
Type
Batch Batch
MethodPrep Type LabAnalystRun
Prepared
or Analyzed
Batch
Number
Dilution
Factor
Total/NA
Client Sample ID: WWTPSL0100180509N Lab Sample ID: 460-159618-2Matrix: SolidDate Collected: 05/18/18 12:10
Percent Solids: 6.7Date Received: 06/28/18 09:40
Analysis Lloyd Kahn 07/17/18 15:34 JXT1 537280 TAL EDI
Type
Batch Batch
MethodPrep Type LabAnalystRun
Prepared
or Analyzed
Batch
Number
Dilution
Factor
Total/NA
Laboratory References:
TAL EDI = TestAmerica Edison, 777 New Durham Road, Edison, NJ 08817, TEL (732)549-3900
TestAmerica Edison
Page 10 of 16 7/18/2018
1
2
3
4
5
6
7
8
9
10
11
12
13
14

Accreditation/Certification SummaryClient: AECOM TestAmerica Job ID: 460-159618-1Project/Site: Lloyd Kahn Samples
Laboratory: TestAmerica EdisonAll accreditations/certifications held by this laboratory are listed. Not all accreditations/certifications are applicable to this report.
Authority Program EPA Region Identification Number Expiration Date
Connecticut PH-02001State Program 09-30-18
DE Haz. Subst. Cleanup Act (HSCA) State Program 3 N/A 12-31-18
New Jersey NELAP 2 12028 06-30-19
New York NELAP 2 11452 04-01-19
Pennsylvania NELAP 3 68-00522 02-28-19
Rhode Island State Program 1 LAO00132 12-30-18
USDA Federal NJCA-003-08 06-13-20
Laboratory: TestAmerica CantonAll accreditations/certifications held by this laboratory are listed. Not all accreditations/certifications are applicable to this report.
Authority Program EPA Region Identification Number Expiration Date
California 29279State Program 02-23-19
Connecticut State Program 1 PH-0590 12-31-19
Florida NELAP 4 E87225 06-30-19
Illinois NELAP 5 200004 07-31-18 *
Kansas NELAP 7 E-10336 01-31-19
Kentucky (UST) State Program 4 58 02-23-19
Kentucky (WW) State Program 4 98016 12-31-18
Minnesota NELAP 5 039-999-348 12-31-18
Minnesota (Petrofund) State Program 1 3506 07-31-18 *
Nevada State Program 9 OH-000482008A 07-31-18 *
New Jersey NELAP 2 OH001 06-30-19
New York NELAP 2 10975 03-31-19
Ohio VAP State Program 5 CL0024 09-06-19
Oregon NELAP 10 4062 02-23-19
Pennsylvania NELAP 3 68-00340 08-31-18 *
Texas NELAP 6 T104704517-17-9 08-31-18 *
USDA Federal P330-16-00404 12-28-19
Virginia NELAP 3 460175 09-14-18 *
Washington State Program 10 C971 01-12-19
West Virginia DEP State Program 3 210 12-31-18
TestAmerica Edison
* Accreditation/Certification renewal pending - accreditation/certification considered valid.
Page 11 of 16 7/18/2018
1
2
3
4
5
6
7
8
9
10
11
12
13
14

Method SummaryTestAmerica Job ID: 460-159618-1Client: AECOM
Project/Site: Lloyd Kahn Samples
Method Method Description LaboratoryProtocol
EPALloyd Kahn Organic Carbon, Total (TOC) TAL EDI
EPAMoisture Percent Moisture TAL EDI
Protocol References:
EPA = US Environmental Protection Agency
Laboratory References:
TAL EDI = TestAmerica Edison, 777 New Durham Road, Edison, NJ 08817, TEL (732)549-3900
TestAmerica Edison
Page 12 of 16 7/18/2018
1
2
3
4
5
6
7
8
9
10
11
12
13
14
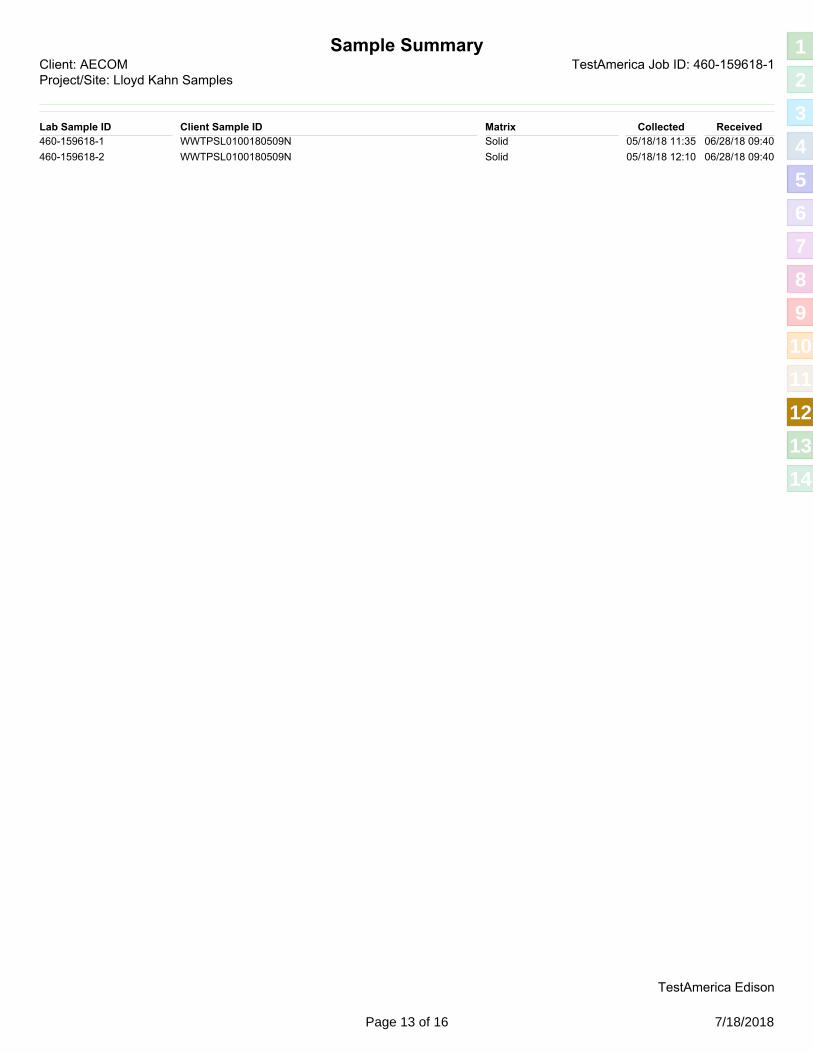
Sample SummaryTestAmerica Job ID: 460-159618-1Client: AECOM
Project/Site: Lloyd Kahn Samples
Lab Sample ID Client Sample ID ReceivedCollectedMatrix
460-159618-1 WWTPSL0100180509N Solid 05/18/18 11:35 06/28/18 09:40
460-159618-2 WWTPSL0100180509N Solid 05/18/18 12:10 06/28/18 09:40
TestAmerica Edison
Page 13 of 16 7/18/2018
1
2
3
4
5
6
7
8
9
10
11
12
13
14

Page 14 of 16 7/18/2018
1
2
3
4
5
6
7
8
9
10
11
12
13
14

Page 15 of 16 7/18/2018
1
2
3
4
5
6
7
8
9
10
11
12
13
14

Login Sample Receipt Checklist
Client: AECOM Job Number: 460-159618-1
Login Number: 159618
Question Answer Comment
Creator: Meyers, Gary
List Source: TestAmerica Edison
List Number: 1
N/ARadioactivity wasn't checked or is </= background as measured by a survey meter.
TrueThe cooler's custody seal, if present, is intact. client custody seal received
TrueSample custody seals, if present, are intact.
TrueThe cooler or samples do not appear to have been compromised or tampered with.
TrueSamples were received on ice.
TrueCooler Temperature is acceptable.
TrueCooler Temperature is recorded.
TrueCOC is present.
TrueCOC is filled out in ink and legible.
TrueCOC is filled out with all pertinent information.
TrueIs the Field Sampler's name present on COC?
TrueThere are no discrepancies between the containers received and the COC.
TrueSamples are received within Holding Time (excluding tests with immediate HTs)
TrueSample containers have legible labels.
TrueContainers are not broken or leaking.
TrueSample collection date/times are provided.
TrueAppropriate sample containers are used.
TrueSample bottles are completely filled.
TrueSample Preservation Verified.
TrueThere is sufficient vol. for all requested analyses, incl. any requested MS/MSDs
TrueContainers requiring zero headspace have no headspace or bubble is <6mm (1/4").
TrueMultiphasic samples are not present.
TrueSamples do not require splitting or compositing.
N/AResidual Chlorine Checked. No analysis requiring residual chlorine check assigned.
TestAmerica EdisonPage 16 of 16 7/18/2018
1
2
3
4
5
6
7
8
9
10
11
12
13
14

Enclosed are the results for the sample set received at Vista Analytical Laboratory on May 12, 2018. This sample
set was analyzed on a standard turn-around time, under your Project Name 'Lapeer'.
Vista Analytical Laboratory is committed to serving you effectively. If you require additional information,
please contact me at 916-673-1520 or by email at [email protected].
Thank you for choosing Vista as part of your analytical support team.
Sincerely,
Martha Maier
Laboratory Director
June 27, 2018
Vista Work Order No. 1800935
Merit Laboratories, Inc.
2680 East Lansing Drive
East Lansing, MI 48823
Dear Ms. Murshak,
Ms. Maya Murshak
Vista Analytical Laboratory certifies that the report herein meets all the requirements set forth by NELAP for those applicable test
methods. Results relate only to the samples as received by the laboratory. This report should not be reproduced except in full without
the written approval of Vista.
Vista Analytical Laboratory 1104 Windfield Way El Dorado Hills, CA 95762 ph: 916-673-1520 fx: 916-673-0106 www.vista-analytical.com
Work Order 1800935 Page 1 of 35
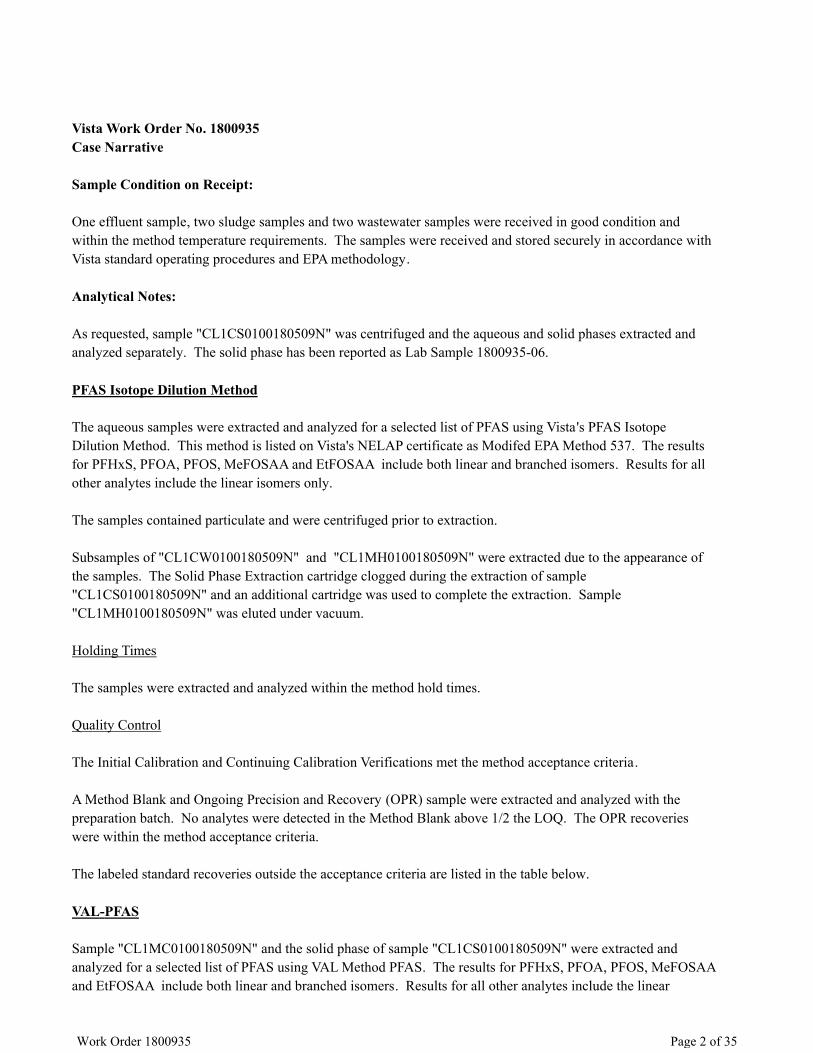
Vista Work Order No. 1800935
Case Narrative
Sample Condition on Receipt:
One effluent sample, two sludge samples and two wastewater samples were received in good condition and
within the method temperature requirements. The samples were received and stored securely in accordance with
Vista standard operating procedures and EPA methodology.
Analytical Notes:
As requested, sample "CL1CS0100180509N" was centrifuged and the aqueous and solid phases extracted and
analyzed separately. The solid phase has been reported as Lab Sample 1800935-06.
PFAS Isotope Dilution Method
The aqueous samples were extracted and analyzed for a selected list of PFAS using Vista's PFAS Isotope
Dilution Method. This method is listed on Vista's NELAP certificate as Modifed EPA Method 537. The results
for PFHxS, PFOA, PFOS, MeFOSAA and EtFOSAA include both linear and branched isomers. Results for all
other analytes include the linear isomers only.
The samples contained particulate and were centrifuged prior to extraction.
Subsamples of "CL1CW0100180509N" and "CL1MH0100180509N" were extracted due to the appearance of
the samples. The Solid Phase Extraction cartridge clogged during the extraction of sample
"CL1CS0100180509N" and an additional cartridge was used to complete the extraction. Sample
"CL1MH0100180509N" was eluted under vacuum.
Holding Times
The samples were extracted and analyzed within the method hold times.
Quality Control
The Initial Calibration and Continuing Calibration Verifications met the method acceptance criteria.
A Method Blank and Ongoing Precision and Recovery (OPR) sample were extracted and analyzed with the
preparation batch. No analytes were detected in the Method Blank above 1/2 the LOQ. The OPR recoveries
were within the method acceptance criteria.
The labeled standard recoveries outside the acceptance criteria are listed in the table below.
VAL-PFAS
Sample "CL1MC0100180509N" and the solid phase of sample "CL1CS0100180509N" were extracted and
analyzed for a selected list of PFAS using VAL Method PFAS. The results for PFHxS, PFOA, PFOS, MeFOSAA
and EtFOSAA include both linear and branched isomers. Results for all other analytes include the linear
Work Order 1800935 Page 2 of 35

isomers only.
Sample "CL1MC0100180509N" built up pressure during storage and immediately expanded upon removing the
lid. The sample was transferred to a large pan and homogenized prior to removing an aliquot for extraction.
Holding Times
The samples were extracted and analyzed within the hold times.
Quality Control
The Initial Calibration and Continuing Calibration Verifications met the method acceptance criteria.
A Method Blank and Ongoing Precision and Recovery (OPR) sample were extracted and analyzed with each
preparation batch. In prep batch B8F0074, a concentration of 1.99 ng/g of 6:2 FTS was detected in the Method
Blank. No other analytes were detected in the Method Blank above 1/2 of the LOQ concentrations. The
recoveries of 6:2 FTS and MeFOSAA were 134% and 69.5% in the OPR. A concentration of 562 ng/g of 6:2
FTS was detected in the sample, which is greater than 10X the level detected in the Method Blank; the
background concentration did not signifcantly affect the sample results. The recoveries of all other analytes
within the method acceptance criteria. The sample was extracted twice, with similar results.
A Method Blank and Ongoing Precision and Recovery (OPR) sample were extracted and analyzed with
preparation batch B8F0153. No analytes were detected in the Method Blank above 1/2 the LOQ. The recoveries
of PFHpS and 8:2 FTS were greater than 130% in the OPR. These analytes were not detected in the samples.
The recoveries of all other analytes were within the method acceptance criteria.
The labeled standard recoveries outside the acceptance criteria are listed in the table below.
QC Anomalies
LabNumber SampleName Analysis Analyte Flag %Rec
1800935-01 WWTPEF0100180509N PFAS Isotope Dilution Method 13C2-PFTeDA H 49.1
1800935-02 WWTPSL0100180509N PFAS Isotope Dilution Method 13C2-PFTeDA H 35.4
1800935-04 WWTPWW0100180509N PFAS Isotope Dilution Method 13C2-PFTeDA H 27.5
1800935-05 WWTPSL0100180509N VAL - PFAS 13C2-PFTeDA H 40.8
1800935-06 WWTPSL0100180509N VAL - PFAS d3-MeFOSAA H 39.2
1800935-06 WWTPSL0100180509N VAL - PFAS d5-EtFOSAA H 43.4
B8E0190-BLK1 B8E0190-BLK1 PFAS Isotope Dilution Method 13C8-PFOSA H 40.1
B8E0190-BS1 B8E0190-BS1 PFAS Isotope Dilution Method 13C8-PFOSA H 42.0
B8F0074-BLK1 B8F0074-BLK1 VAL - PFAS 13C8-PFOSA H 37.3
B8F0074-BS1 B8F0074-BS1 VAL - PFAS 13C8-PFOSA H 35.8
B8F0153-BLK1 B8F0153-BLK1 VAL - PFAS 13C8-PFOSA H 45.7
B8F0153-BS1 B8F0153-BS1 VAL - PFAS 13C8-PFOSA H 46.2
H = Recovery was outside laboratory acceptance criteria.
Work Order 1800935 Page 3 of 35

TABLE OF CONTENTS
Case Narrative................................................................................................ 1
Table of Contents........................................................................................... 4
Sample Inventory........................................................................................... 5
Analytical Results.......................................................................................... 6
Qualifiers........................................................................................................ 31
Certifications.................................................................................................. 32
Sample Receipt.............................................................................................. 33
Work Order 1800935 Page 4 of 35
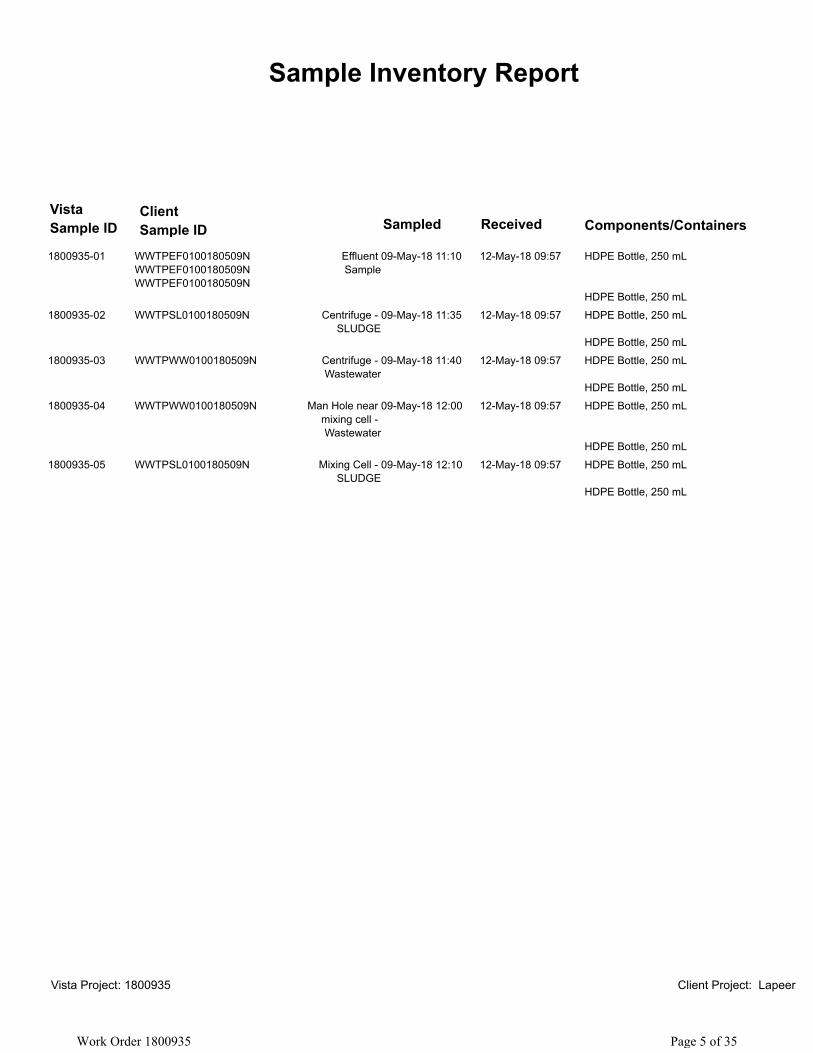
Client
Sample ID
Sample Inventory Report
Vista
Sample ID Sampled Received Components/Containers
1800935-01 WWTPEF0100180509N
WWTPEF0100180509N
WWTPEF0100180509N
09-May-18 11:10 12-May-18 09:57 HDPE Bottle, 250 mLEffluent
Sample
HDPE Bottle, 250 mL
1800935-02 WWTPSL0100180509N 09-May-18 11:35 12-May-18 09:57 HDPE Bottle, 250 mLCentrifuge -
SLUDGE
HDPE Bottle, 250 mL
1800935-03 WWTPWW0100180509N 09-May-18 11:40 12-May-18 09:57 HDPE Bottle, 250 mLCentrifuge -
Wastewater
HDPE Bottle, 250 mL
1800935-04 WWTPWW0100180509N 09-May-18 12:00 12-May-18 09:57 HDPE Bottle, 250 mLMan Hole near
mixing cell -
Wastewater
HDPE Bottle, 250 mL
1800935-05 WWTPSL0100180509N 09-May-18 12:10 12-May-18 09:57 HDPE Bottle, 250 mLMixing Cell -
SLUDGE
HDPE Bottle, 250 mL
Vista Project: 1800935 Client Project: Lapeer
Work Order 1800935 Page 5 of 35

ANALYTICAL RESULTS
Work Order 1800935 Page 6 of 35
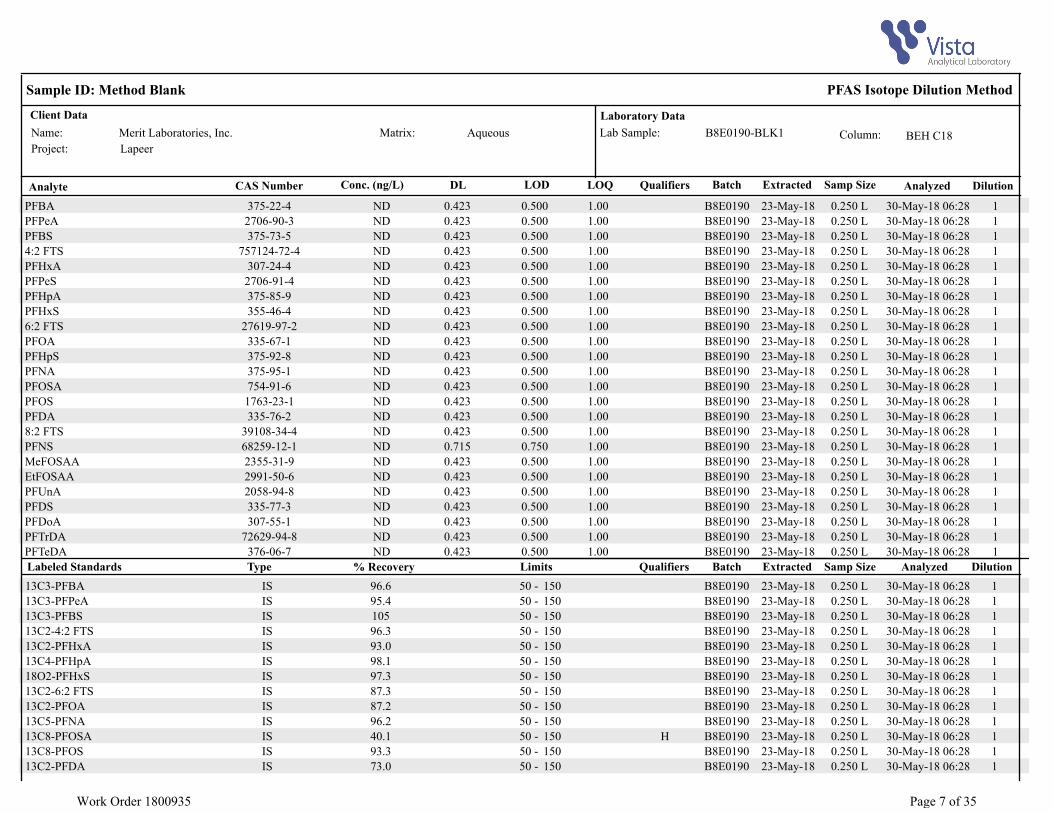
Name:
Project:
Client Data
Lapeer
Sample ID: Method Blank
Matrix:
Laboratory Data
Lab Sample: B8E0190-BLK1
PFAS Isotope Dilution Method
Merit Laboratories, Inc. Column: BEH C18Aqueous
Analyte Conc. (ng/L) Qualifiers Analyzed DilutionLOD LOQDL Batch Extracted Samp SizeCAS Number
PFBA 0.423ND 10.500 1.00 30-May-18 06:28B8E0190 0.250 L23-May-18375-22-4
PFPeA 0.423ND 10.500 1.00 30-May-18 06:28B8E0190 0.250 L23-May-182706-90-3
PFBS 0.423ND 10.500 1.00 30-May-18 06:28B8E0190 0.250 L23-May-18375-73-5
4:2 FTS 0.423ND 10.500 1.00 30-May-18 06:28B8E0190 0.250 L23-May-18757124-72-4
PFHxA 0.423ND 10.500 1.00 30-May-18 06:28B8E0190 0.250 L23-May-18307-24-4
PFPeS 0.423ND 10.500 1.00 30-May-18 06:28B8E0190 0.250 L23-May-182706-91-4
PFHpA 0.423ND 10.500 1.00 30-May-18 06:28B8E0190 0.250 L23-May-18375-85-9
PFHxS 0.423ND 10.500 1.00 30-May-18 06:28B8E0190 0.250 L23-May-18355-46-4
6:2 FTS 0.423ND 10.500 1.00 30-May-18 06:28B8E0190 0.250 L23-May-1827619-97-2
PFOA 0.423ND 10.500 1.00 30-May-18 06:28B8E0190 0.250 L23-May-18335-67-1
PFHpS 0.423ND 10.500 1.00 30-May-18 06:28B8E0190 0.250 L23-May-18375-92-8
PFNA 0.423ND 10.500 1.00 30-May-18 06:28B8E0190 0.250 L23-May-18375-95-1
PFOSA 0.423ND 10.500 1.00 30-May-18 06:28B8E0190 0.250 L23-May-18754-91-6
PFOS 0.423ND 10.500 1.00 30-May-18 06:28B8E0190 0.250 L23-May-181763-23-1
PFDA 0.423ND 10.500 1.00 30-May-18 06:28B8E0190 0.250 L23-May-18335-76-2
8:2 FTS 0.423ND 10.500 1.00 30-May-18 06:28B8E0190 0.250 L23-May-1839108-34-4
PFNS 0.715ND 10.750 1.00 30-May-18 06:28B8E0190 0.250 L23-May-1868259-12-1
MeFOSAA 0.423ND 10.500 1.00 30-May-18 06:28B8E0190 0.250 L23-May-182355-31-9
EtFOSAA 0.423ND 10.500 1.00 30-May-18 06:28B8E0190 0.250 L23-May-182991-50-6
PFUnA 0.423ND 10.500 1.00 30-May-18 06:28B8E0190 0.250 L23-May-182058-94-8
PFDS 0.423ND 10.500 1.00 30-May-18 06:28B8E0190 0.250 L23-May-18335-77-3
PFDoA 0.423ND 10.500 1.00 30-May-18 06:28B8E0190 0.250 L23-May-18307-55-1
PFTrDA 0.423ND 10.500 1.00 30-May-18 06:28B8E0190 0.250 L23-May-1872629-94-8
PFTeDA 0.423ND 10.500 1.00 30-May-18 06:28B8E0190 0.250 L23-May-18376-06-7
Labeled Standards % Recovery Limits Qualifiers Analyzed DilutionType Batch Extracted Samp Size
IS - 13C3-PFBA 96.6 50 150 130-May-18 06:28B8E0190 23-May-18 0.250 L
IS - 13C3-PFPeA 95.4 50 150 130-May-18 06:28B8E0190 23-May-18 0.250 L
IS - 13C3-PFBS 105 50 150 130-May-18 06:28B8E0190 23-May-18 0.250 L
IS - 13C2-4:2 FTS 96.3 50 150 130-May-18 06:28B8E0190 23-May-18 0.250 L
IS - 13C2-PFHxA 93.0 50 150 130-May-18 06:28B8E0190 23-May-18 0.250 L
IS - 13C4-PFHpA 98.1 50 150 130-May-18 06:28B8E0190 23-May-18 0.250 L
IS - 18O2-PFHxS 97.3 50 150 130-May-18 06:28B8E0190 23-May-18 0.250 L
IS - 13C2-6:2 FTS 87.3 50 150 130-May-18 06:28B8E0190 23-May-18 0.250 L
IS - 13C2-PFOA 87.2 50 150 130-May-18 06:28B8E0190 23-May-18 0.250 L
IS - 13C5-PFNA 96.2 50 150 130-May-18 06:28B8E0190 23-May-18 0.250 L
IS - 13C8-PFOSA 40.1 50 150 H 130-May-18 06:28B8E0190 23-May-18 0.250 L
IS - 13C8-PFOS 93.3 50 150 130-May-18 06:28B8E0190 23-May-18 0.250 L
IS - 13C2-PFDA 73.0 50 150 130-May-18 06:28B8E0190 23-May-18 0.250 L
Work Order 1800935 Page 7 of 35

Name:
Project:
Client Data
Lapeer
Sample ID: Method Blank
Matrix:
Laboratory Data
Lab Sample: B8E0190-BLK1
PFAS Isotope Dilution Method
Merit Laboratories, Inc. Column: BEH C18Aqueous
Labeled Standards % Recovery Limits Qualifiers Analyzed DilutionType Batch Extracted Samp Size
IS - 13C2-8:2 FTS 84.2 50 150 130-May-18 06:28B8E0190 23-May-18 0.250 L
IS - d3-MeFOSAA 68.7 50 150 130-May-18 06:28B8E0190 23-May-18 0.250 L
IS - d5-EtFOSAA 65.8 50 150 130-May-18 06:28B8E0190 23-May-18 0.250 L
IS - 13C2-PFUnA 67.6 50 150 130-May-18 06:28B8E0190 23-May-18 0.250 L
IS - 13C2-PFDoA 53.5 50 150 130-May-18 06:28B8E0190 23-May-18 0.250 L
IS - 13C2-PFTeDA 60.1 50 150 130-May-18 06:28B8E0190 23-May-18 0.250 LResults reported to the DL. DL - Detection Limit When reported, PFHxS, PFOA, PFOS, MeFOSAA and EtFOSAA include both
linear and branched isomers. Only the linear isomer is reported for all other
analytes.
LOD - Limit of Detection
LOQ - Limit of quantitation
Work Order 1800935 Page 8 of 35
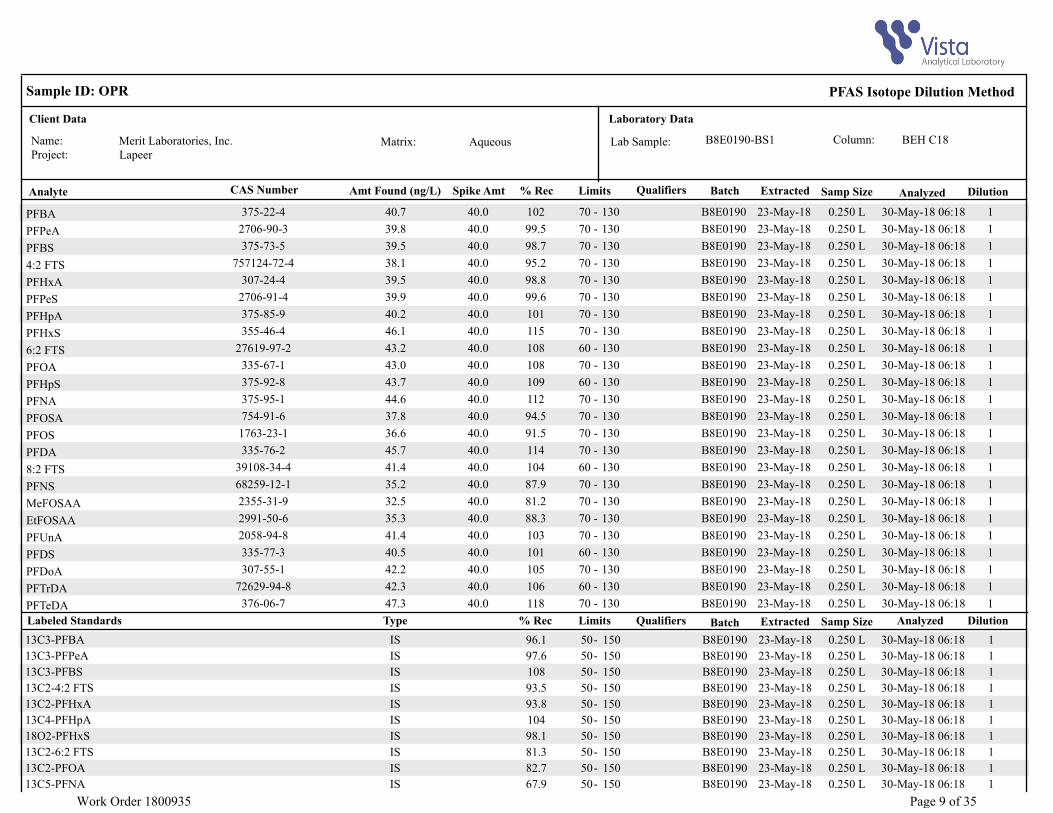
Name:Project:
Client Data
Lapeer
Sample ID: OPR
Matrix:
Laboratory Data
Lab Sample: B8E0190-BS1
PFAS Isotope Dilution Method
Merit Laboratories, Inc. Column: BEH C18Aqueous
Analyte Amt Found (ng/L) Qualifiers Analyzed DilutionSpike Amt % Rec Limits Samp SizeExtractedBatchCAS Number
PFBA 40.7 130-May-18 06:1840.0 102 - 70 130 0.250 L23-May-18B8E0190375-22-4
PFPeA 39.8 130-May-18 06:1840.0 99.5 - 70 130 0.250 L23-May-18B8E01902706-90-3
PFBS 39.5 130-May-18 06:1840.0 98.7 - 70 130 0.250 L23-May-18B8E0190375-73-5
4:2 FTS 38.1 130-May-18 06:1840.0 95.2 - 70 130 0.250 L23-May-18B8E0190757124-72-4
PFHxA 39.5 130-May-18 06:1840.0 98.8 - 70 130 0.250 L23-May-18B8E0190307-24-4
PFPeS 39.9 130-May-18 06:1840.0 99.6 - 70 130 0.250 L23-May-18B8E01902706-91-4
PFHpA 40.2 130-May-18 06:1840.0 101 - 70 130 0.250 L23-May-18B8E0190375-85-9
PFHxS 46.1 130-May-18 06:1840.0 115 - 70 130 0.250 L23-May-18B8E0190355-46-4
6:2 FTS 43.2 130-May-18 06:1840.0 108 - 60 130 0.250 L23-May-18B8E019027619-97-2
PFOA 43.0 130-May-18 06:1840.0 108 - 70 130 0.250 L23-May-18B8E0190335-67-1
PFHpS 43.7 130-May-18 06:1840.0 109 - 60 130 0.250 L23-May-18B8E0190375-92-8
PFNA 44.6 130-May-18 06:1840.0 112 - 70 130 0.250 L23-May-18B8E0190375-95-1
PFOSA 37.8 130-May-18 06:1840.0 94.5 - 70 130 0.250 L23-May-18B8E0190754-91-6
PFOS 36.6 130-May-18 06:1840.0 91.5 - 70 130 0.250 L23-May-18B8E01901763-23-1
PFDA 45.7 130-May-18 06:1840.0 114 - 70 130 0.250 L23-May-18B8E0190335-76-2
8:2 FTS 41.4 130-May-18 06:1840.0 104 - 60 130 0.250 L23-May-18B8E019039108-34-4
PFNS 35.2 130-May-18 06:1840.0 87.9 - 70 130 0.250 L23-May-18B8E019068259-12-1
MeFOSAA 32.5 130-May-18 06:1840.0 81.2 - 70 130 0.250 L23-May-18B8E01902355-31-9
EtFOSAA 35.3 130-May-18 06:1840.0 88.3 - 70 130 0.250 L23-May-18B8E01902991-50-6
PFUnA 41.4 130-May-18 06:1840.0 103 - 70 130 0.250 L23-May-18B8E01902058-94-8
PFDS 40.5 130-May-18 06:1840.0 101 - 60 130 0.250 L23-May-18B8E0190335-77-3
PFDoA 42.2 130-May-18 06:1840.0 105 - 70 130 0.250 L23-May-18B8E0190307-55-1
PFTrDA 42.3 130-May-18 06:1840.0 106 - 60 130 0.250 L23-May-18B8E019072629-94-8
PFTeDA 47.3 130-May-18 06:1840.0 118 - 70 130 0.250 L23-May-18B8E0190376-06-7
Labeled Standards % Rec Limits Qualifiers Analyzed DilutionType Samp SizeExtractedBatch
IS - 13C3-PFBA 96.1 50 150 130-May-18 06:180.250 L23-May-18B8E0190
IS - 13C3-PFPeA 97.6 50 150 130-May-18 06:180.250 L23-May-18B8E0190
IS - 13C3-PFBS 108 50 150 130-May-18 06:180.250 L23-May-18B8E0190
IS - 13C2-4:2 FTS 93.5 50 150 130-May-18 06:180.250 L23-May-18B8E0190
IS - 13C2-PFHxA 93.8 50 150 130-May-18 06:180.250 L23-May-18B8E0190
IS - 13C4-PFHpA 104 50 150 130-May-18 06:180.250 L23-May-18B8E0190
IS - 18O2-PFHxS 98.1 50 150 130-May-18 06:180.250 L23-May-18B8E0190
IS - 13C2-6:2 FTS 81.3 50 150 130-May-18 06:180.250 L23-May-18B8E0190
IS - 13C2-PFOA 82.7 50 150 130-May-18 06:180.250 L23-May-18B8E0190
IS - 13C5-PFNA 67.9 50 150 130-May-18 06:180.250 L23-May-18B8E0190
Work Order 1800935 Page 9 of 35

Name:Project:
Client Data
Lapeer
Sample ID: OPR
Matrix:
Laboratory Data
Lab Sample: B8E0190-BS1
PFAS Isotope Dilution Method
Merit Laboratories, Inc. Column: BEH C18Aqueous
Labeled Standards % Rec Limits Qualifiers Analyzed DilutionType Samp SizeExtractedBatch
IS - 13C8-PFOSA 42.0 50 150 H 130-May-18 06:180.250 L23-May-18B8E0190
IS - 13C8-PFOS 99.0 50 150 130-May-18 06:180.250 L23-May-18B8E0190
IS - 13C2-PFDA 78.3 50 150 130-May-18 06:180.250 L23-May-18B8E0190
IS - 13C2-8:2 FTS 84.9 50 150 130-May-18 06:180.250 L23-May-18B8E0190
IS - d3-MeFOSAA 80.1 50 150 130-May-18 06:180.250 L23-May-18B8E0190
IS - d5-EtFOSAA 79.0 50 150 130-May-18 06:180.250 L23-May-18B8E0190
IS - 13C2-PFUnA 79.7 50 150 130-May-18 06:180.250 L23-May-18B8E0190
IS - 13C2-PFDoA 73.4 50 150 130-May-18 06:180.250 L23-May-18B8E0190
IS - 13C2-PFTeDA 67.7 50 150 130-May-18 06:180.250 L23-May-18B8E0190
Work Order 1800935 Page 10 of 35

Name:
Project: Date Collected:
Client Data
Lapeer
Sample ID: WWTPEF0100180509N
Matrix:
Laboratory Data
Lab Sample: 1800935-01
PFAS Isotope Dilution Method
Merit Laboratories, Inc. Column: BEH C18Effluent
09-May-18 15:05 Date Received: 12-May-18 09:57
Location: WWTP-EFF
Analyte Conc. (ng/L) Qualifiers Analyzed DilutionLOD LOQDL Batch Extracted Samp SizeCAS Number
PFBA 1.3229.3 11.93 3.86 30-May-18 06:39B8E0190 0.259 L23-May-18375-22-4
PFPeA 1.3281.4 11.93 3.86 30-May-18 06:39B8E0190 0.259 L23-May-182706-90-3
PFBS 1.327.46 11.93 3.86 30-May-18 06:39B8E0190 0.259 L23-May-18375-73-5
4:2 FTS 1.32ND 11.93 3.86 30-May-18 06:39B8E0190 0.259 L23-May-18757124-72-4
PFHxA 1.3290.8 11.93 3.86 30-May-18 06:39B8E0190 0.259 L23-May-18307-24-4
PFPeS 1.32ND 11.93 3.86 30-May-18 06:39B8E0190 0.259 L23-May-182706-91-4
PFHpA 1.32122 11.93 3.86 30-May-18 06:39B8E0190 0.259 L23-May-18375-85-9
PFHxS 1.321.32 J 11.93 3.86 30-May-18 06:39B8E0190 0.259 L23-May-18355-46-4
6:2 FTS 1.328.13 11.93 3.86 30-May-18 06:39B8E0190 0.259 L23-May-1827619-97-2
PFOA 1.325.03 11.93 3.86 30-May-18 06:39B8E0190 0.259 L23-May-18335-67-1
PFHpS 1.32ND 11.93 3.86 30-May-18 06:39B8E0190 0.259 L23-May-18375-92-8
PFNA 1.32ND 11.93 3.86 30-May-18 06:39B8E0190 0.259 L23-May-18375-95-1
PFOSA 1.32ND 11.93 3.86 30-May-18 06:39B8E0190 0.259 L23-May-18754-91-6
PFOS 1.3228.7 11.93 3.86 30-May-18 06:39B8E0190 0.259 L23-May-181763-23-1
PFDA 1.32ND 11.93 3.86 30-May-18 06:39B8E0190 0.259 L23-May-18335-76-2
8:2 FTS 1.32ND 11.93 3.86 30-May-18 06:39B8E0190 0.259 L23-May-1839108-34-4
PFNS 1.32ND 11.93 3.86 30-May-18 06:39B8E0190 0.259 L23-May-1868259-12-1
MeFOSAA 1.32ND 11.93 3.86 30-May-18 06:39B8E0190 0.259 L23-May-182355-31-9
EtFOSAA 1.32ND 11.93 3.86 30-May-18 06:39B8E0190 0.259 L23-May-182991-50-6
PFUnA 1.32ND 11.93 3.86 30-May-18 06:39B8E0190 0.259 L23-May-182058-94-8
PFDS 1.32ND 11.93 3.86 30-May-18 06:39B8E0190 0.259 L23-May-18335-77-3
PFDoA 1.32ND 11.93 3.86 30-May-18 06:39B8E0190 0.259 L23-May-18307-55-1
PFTrDA 1.32ND 11.93 3.86 30-May-18 06:39B8E0190 0.259 L23-May-1872629-94-8
PFTeDA 1.32ND 11.93 3.86 30-May-18 06:39B8E0190 0.259 L23-May-18376-06-7
Labeled Standards % Recovery Limits Qualifiers Analyzed DilutionType Batch Extracted Samp Size
IS - 13C3-PFBA 102 50 150 130-May-18 06:39B8E0190 23-May-18 0.259 L
IS - 13C3-PFPeA 101 50 150 130-May-18 06:39B8E0190 23-May-18 0.259 L
IS - 13C3-PFBS 119 50 150 130-May-18 06:39B8E0190 23-May-18 0.259 L
IS - 13C2-4:2 FTS 95.4 50 150 130-May-18 06:39B8E0190 23-May-18 0.259 L
IS - 13C2-PFHxA 98.1 50 150 130-May-18 06:39B8E0190 23-May-18 0.259 L
IS - 13C4-PFHpA 114 50 150 130-May-18 06:39B8E0190 23-May-18 0.259 L
IS - 18O2-PFHxS 96.6 50 150 130-May-18 06:39B8E0190 23-May-18 0.259 L
IS - 13C2-6:2 FTS 81.6 50 150 130-May-18 06:39B8E0190 23-May-18 0.259 L
IS - 13C2-PFOA 92.9 50 150 130-May-18 06:39B8E0190 23-May-18 0.259 L
IS - 13C5-PFNA 87.7 50 150 130-May-18 06:39B8E0190 23-May-18 0.259 L
IS - 13C8-PFOSA 54.0 50 150 130-May-18 06:39B8E0190 23-May-18 0.259 L
IS - 13C8-PFOS 112 50 150 130-May-18 06:39B8E0190 23-May-18 0.259 L
IS - 13C2-PFDA 89.0 50 150 130-May-18 06:39B8E0190 23-May-18 0.259 L
Work Order 1800935 Page 11 of 35

Name:
Project: Date Collected:
Client Data
Lapeer
Sample ID: WWTPEF0100180509N
Matrix:
Laboratory Data
Lab Sample: 1800935-01
PFAS Isotope Dilution Method
Merit Laboratories, Inc. Column: BEH C18Effluent
09-May-18 15:05 Date Received: 12-May-18 09:57
Location: WWTP-EFF
Labeled Standards % Recovery Limits Qualifiers Analyzed DilutionType Batch Extracted Samp Size
IS - 13C2-8:2 FTS 95.0 50 150 130-May-18 06:39B8E0190 23-May-18 0.259 L
IS - d3-MeFOSAA 82.9 50 150 130-May-18 06:39B8E0190 23-May-18 0.259 L
IS - d5-EtFOSAA 92.8 50 150 130-May-18 06:39B8E0190 23-May-18 0.259 L
IS - 13C2-PFUnA 69.1 50 150 130-May-18 06:39B8E0190 23-May-18 0.259 L
IS - 13C2-PFDoA 72.5 50 150 130-May-18 06:39B8E0190 23-May-18 0.259 L
IS - 13C2-PFTeDA 49.1 50 150 H 130-May-18 06:39B8E0190 23-May-18 0.259 LResults reported to the DL. DL - Detection Limit When reported, PFHxS, PFOA, PFOS, MeFOSAA and EtFOSAA include both
linear and branched isomers. Only the linear isomer is reported for all other
analytes.
LOD - Limit of Detection
LOQ - Limit of quantitation
Work Order 1800935 Page 12 of 35

Name:
Project: Date Collected:
Client Data
Lapeer
Sample ID: WWTPSL0100180509N
Matrix:
Laboratory Data
Lab Sample: 1800935-02
PFAS Isotope Dilution Method
Merit Laboratories, Inc. Column: BEH C18Sludge
09-May-18 15:45 Date Received: 12-May-18 09:57
Location: WWTP-Centrifuge
Analyte Conc. (ng/L) Qualifiers Analyzed DilutionLOD LOQDL Batch Extracted Samp SizeCAS Number
PFBA 9.39141 113.7 27.4 30-May-18 06:49B8E0190 0.0365 L23-May-18375-22-4
PFPeA 9.39275 113.7 27.4 30-May-18 06:49B8E0190 0.0365 L23-May-182706-90-3
PFBS 9.3912.1 J 113.7 27.4 30-May-18 06:49B8E0190 0.0365 L23-May-18375-73-5
4:2 FTS 9.39ND 113.7 27.4 30-May-18 06:49B8E0190 0.0365 L23-May-18757124-72-4
PFHxA 9.39462 113.7 27.4 30-May-18 06:49B8E0190 0.0365 L23-May-18307-24-4
PFPeS 9.39ND 113.7 27.4 30-May-18 06:49B8E0190 0.0365 L23-May-182706-91-4
PFHpA 9.39415 113.7 27.4 30-May-18 06:49B8E0190 0.0365 L23-May-18375-85-9
PFHxS 9.39ND 113.7 27.4 30-May-18 06:49B8E0190 0.0365 L23-May-18355-46-4
6:2 FTS 9.39102 113.7 27.4 30-May-18 06:49B8E0190 0.0365 L23-May-1827619-97-2
PFOA 9.3955.7 113.7 27.4 30-May-18 06:49B8E0190 0.0365 L23-May-18335-67-1
PFHpS 9.39ND 113.7 27.4 30-May-18 06:49B8E0190 0.0365 L23-May-18375-92-8
PFNA 9.39ND 113.7 27.4 30-May-18 06:49B8E0190 0.0365 L23-May-18375-95-1
PFOSA 9.39ND 113.7 27.4 30-May-18 06:49B8E0190 0.0365 L23-May-18754-91-6
PFOS 9.39182 113.7 27.4 30-May-18 06:49B8E0190 0.0365 L23-May-181763-23-1
PFDA 9.39ND 113.7 27.4 30-May-18 06:49B8E0190 0.0365 L23-May-18335-76-2
8:2 FTS 9.39ND 113.7 27.4 30-May-18 06:49B8E0190 0.0365 L23-May-1839108-34-4
PFNS 9.39ND 113.7 27.4 30-May-18 06:49B8E0190 0.0365 L23-May-1868259-12-1
MeFOSAA 9.39ND 113.7 27.4 30-May-18 06:49B8E0190 0.0365 L23-May-182355-31-9
EtFOSAA 9.39ND 113.7 27.4 30-May-18 06:49B8E0190 0.0365 L23-May-182991-50-6
PFUnA 9.39ND 113.7 27.4 30-May-18 06:49B8E0190 0.0365 L23-May-182058-94-8
PFDS 9.39ND 113.7 27.4 30-May-18 06:49B8E0190 0.0365 L23-May-18335-77-3
PFDoA 9.39ND 113.7 27.4 30-May-18 06:49B8E0190 0.0365 L23-May-18307-55-1
PFTrDA 9.39ND 113.7 27.4 30-May-18 06:49B8E0190 0.0365 L23-May-1872629-94-8
PFTeDA 9.39ND 113.7 27.4 30-May-18 06:49B8E0190 0.0365 L23-May-18376-06-7
Labeled Standards % Recovery Limits Qualifiers Analyzed DilutionType Batch Extracted Samp Size
IS - 13C3-PFBA 99.3 50 150 130-May-18 06:49B8E0190 23-May-18 0.0365 L
IS - 13C3-PFPeA 96.3 50 150 130-May-18 06:49B8E0190 23-May-18 0.0365 L
IS - 13C3-PFBS 104 50 150 130-May-18 06:49B8E0190 23-May-18 0.0365 L
IS - 13C2-4:2 FTS 95.1 50 150 130-May-18 06:49B8E0190 23-May-18 0.0365 L
IS - 13C2-PFHxA 91.5 50 150 130-May-18 06:49B8E0190 23-May-18 0.0365 L
IS - 13C4-PFHpA 101 50 150 130-May-18 06:49B8E0190 23-May-18 0.0365 L
IS - 18O2-PFHxS 89.9 50 150 130-May-18 06:49B8E0190 23-May-18 0.0365 L
IS - 13C2-6:2 FTS 90.4 50 150 130-May-18 06:49B8E0190 23-May-18 0.0365 L
IS - 13C2-PFOA 82.4 50 150 130-May-18 06:49B8E0190 23-May-18 0.0365 L
IS - 13C5-PFNA 81.5 50 150 130-May-18 06:49B8E0190 23-May-18 0.0365 L
IS - 13C8-PFOSA 58.9 50 150 130-May-18 06:49B8E0190 23-May-18 0.0365 L
IS - 13C8-PFOS 75.6 50 150 130-May-18 06:49B8E0190 23-May-18 0.0365 L
IS - 13C2-PFDA 70.0 50 150 130-May-18 06:49B8E0190 23-May-18 0.0365 L
Work Order 1800935 Page 13 of 35

Name:
Project: Date Collected:
Client Data
Lapeer
Sample ID: WWTPSL0100180509N
Matrix:
Laboratory Data
Lab Sample: 1800935-02
PFAS Isotope Dilution Method
Merit Laboratories, Inc. Column: BEH C18Sludge
09-May-18 15:45 Date Received: 12-May-18 09:57
Location: WWTP-Centrifuge
Labeled Standards % Recovery Limits Qualifiers Analyzed DilutionType Batch Extracted Samp Size
IS - 13C2-8:2 FTS 78.6 50 150 130-May-18 06:49B8E0190 23-May-18 0.0365 L
IS - d3-MeFOSAA 60.0 50 150 130-May-18 06:49B8E0190 23-May-18 0.0365 L
IS - d5-EtFOSAA 67.7 50 150 130-May-18 06:49B8E0190 23-May-18 0.0365 L
IS - 13C2-PFUnA 70.2 50 150 130-May-18 06:49B8E0190 23-May-18 0.0365 L
IS - 13C2-PFDoA 54.5 50 150 130-May-18 06:49B8E0190 23-May-18 0.0365 L
IS - 13C2-PFTeDA 35.4 50 150 H 130-May-18 06:49B8E0190 23-May-18 0.0365 LResults reported to the DL. DL - Detection Limit When reported, PFHxS, PFOA, PFOS, MeFOSAA and EtFOSAA include both
linear and branched isomers. Only the linear isomer is reported for all other
analytes.
LOD - Limit of Detection
LOQ - Limit of quantitation
Work Order 1800935 Page 14 of 35

Name:
Project: Date Collected:
Client Data
Lapeer
Sample ID: WWTPWW0100180509N
Matrix:
Laboratory Data
Lab Sample: 1800935-03
PFAS Isotope Dilution Method
Merit Laboratories, Inc. Column: BEH C18Wastewater
09-May-18 16:15 Date Received: 12-May-18 09:57
Location: WWTP-Centrifuge
Analyte Conc. (ng/L) Qualifiers Analyzed DilutionLOD LOQDL Batch Extracted Samp SizeCAS Number
PFBA 17.039.5 J 124.9 49.8 30-May-18 07:00B8E0190 0.0201 L23-May-18375-22-4
PFPeA 17.0134 124.9 49.8 30-May-18 07:00B8E0190 0.0201 L23-May-182706-90-3
PFBS 17.0ND 124.9 49.8 30-May-18 07:00B8E0190 0.0201 L23-May-18375-73-5
4:2 FTS 17.0ND 124.9 49.8 30-May-18 07:00B8E0190 0.0201 L23-May-18757124-72-4
PFHxA 17.0204 124.9 49.8 30-May-18 07:00B8E0190 0.0201 L23-May-18307-24-4
PFPeS 17.0ND 124.9 49.8 30-May-18 07:00B8E0190 0.0201 L23-May-182706-91-4
PFHpA 17.0171 124.9 49.8 30-May-18 07:00B8E0190 0.0201 L23-May-18375-85-9
PFHxS 17.0ND 124.9 49.8 30-May-18 07:00B8E0190 0.0201 L23-May-18355-46-4
6:2 FTS 17.0269 124.9 49.8 30-May-18 07:00B8E0190 0.0201 L23-May-1827619-97-2
PFOA 17.0ND 124.9 49.8 30-May-18 07:00B8E0190 0.0201 L23-May-18335-67-1
PFHpS 17.0ND 124.9 49.8 30-May-18 07:00B8E0190 0.0201 L23-May-18375-92-8
PFNA 17.0ND 124.9 49.8 30-May-18 07:00B8E0190 0.0201 L23-May-18375-95-1
PFOSA 17.0ND 124.9 49.8 30-May-18 07:00B8E0190 0.0201 L23-May-18754-91-6
PFOS 17.048.4 J 124.9 49.8 30-May-18 07:00B8E0190 0.0201 L23-May-181763-23-1
PFDA 17.0ND 124.9 49.8 30-May-18 07:00B8E0190 0.0201 L23-May-18335-76-2
8:2 FTS 17.0ND 124.9 49.8 30-May-18 07:00B8E0190 0.0201 L23-May-1839108-34-4
PFNS 17.0ND 124.9 49.8 30-May-18 07:00B8E0190 0.0201 L23-May-1868259-12-1
MeFOSAA 17.0ND 124.9 49.8 30-May-18 07:00B8E0190 0.0201 L23-May-182355-31-9
EtFOSAA 17.0ND 124.9 49.8 30-May-18 07:00B8E0190 0.0201 L23-May-182991-50-6
PFUnA 17.0ND 124.9 49.8 30-May-18 07:00B8E0190 0.0201 L23-May-182058-94-8
PFDS 17.0ND 124.9 49.8 30-May-18 07:00B8E0190 0.0201 L23-May-18335-77-3
PFDoA 17.0ND 124.9 49.8 30-May-18 07:00B8E0190 0.0201 L23-May-18307-55-1
PFTrDA 17.0ND 124.9 49.8 30-May-18 07:00B8E0190 0.0201 L23-May-1872629-94-8
PFTeDA 17.0ND 124.9 49.8 30-May-18 07:00B8E0190 0.0201 L23-May-18376-06-7
Labeled Standards % Recovery Limits Qualifiers Analyzed DilutionType Batch Extracted Samp Size
IS - 13C3-PFBA 93.2 50 150 130-May-18 07:00B8E0190 23-May-18 0.0201 L
IS - 13C3-PFPeA 92.1 50 150 130-May-18 07:00B8E0190 23-May-18 0.0201 L
IS - 13C3-PFBS 106 50 150 130-May-18 07:00B8E0190 23-May-18 0.0201 L
IS - 13C2-4:2 FTS 84.9 50 150 130-May-18 07:00B8E0190 23-May-18 0.0201 L
IS - 13C2-PFHxA 92.5 50 150 130-May-18 07:00B8E0190 23-May-18 0.0201 L
IS - 13C4-PFHpA 87.0 50 150 130-May-18 07:00B8E0190 23-May-18 0.0201 L
IS - 18O2-PFHxS 98.0 50 150 130-May-18 07:00B8E0190 23-May-18 0.0201 L
IS - 13C2-6:2 FTS 86.1 50 150 130-May-18 07:00B8E0190 23-May-18 0.0201 L
IS - 13C2-PFOA 66.5 50 150 130-May-18 07:00B8E0190 23-May-18 0.0201 L
IS - 13C5-PFNA 66.8 50 150 130-May-18 07:00B8E0190 23-May-18 0.0201 L
IS - 13C8-PFOSA 57.2 50 150 130-May-18 07:00B8E0190 23-May-18 0.0201 L
IS - 13C8-PFOS 80.3 50 150 130-May-18 07:00B8E0190 23-May-18 0.0201 L
IS - 13C2-PFDA 87.9 50 150 130-May-18 07:00B8E0190 23-May-18 0.0201 L
Work Order 1800935 Page 15 of 35
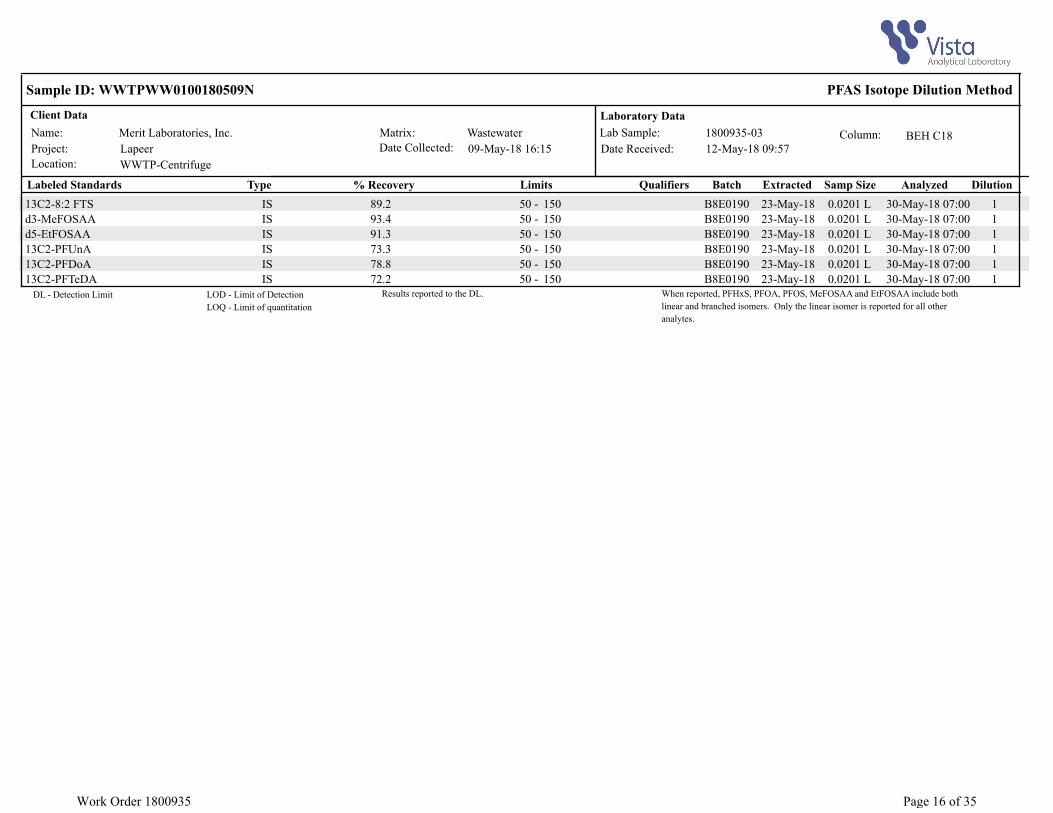
Name:
Project: Date Collected:
Client Data
Lapeer
Sample ID: WWTPWW0100180509N
Matrix:
Laboratory Data
Lab Sample: 1800935-03
PFAS Isotope Dilution Method
Merit Laboratories, Inc. Column: BEH C18Wastewater
09-May-18 16:15 Date Received: 12-May-18 09:57
Location: WWTP-Centrifuge
Labeled Standards % Recovery Limits Qualifiers Analyzed DilutionType Batch Extracted Samp Size
IS - 13C2-8:2 FTS 89.2 50 150 130-May-18 07:00B8E0190 23-May-18 0.0201 L
IS - d3-MeFOSAA 93.4 50 150 130-May-18 07:00B8E0190 23-May-18 0.0201 L
IS - d5-EtFOSAA 91.3 50 150 130-May-18 07:00B8E0190 23-May-18 0.0201 L
IS - 13C2-PFUnA 73.3 50 150 130-May-18 07:00B8E0190 23-May-18 0.0201 L
IS - 13C2-PFDoA 78.8 50 150 130-May-18 07:00B8E0190 23-May-18 0.0201 L
IS - 13C2-PFTeDA 72.2 50 150 130-May-18 07:00B8E0190 23-May-18 0.0201 LResults reported to the DL. DL - Detection Limit When reported, PFHxS, PFOA, PFOS, MeFOSAA and EtFOSAA include both
linear and branched isomers. Only the linear isomer is reported for all other
analytes.
LOD - Limit of Detection
LOQ - Limit of quantitation
Work Order 1800935 Page 16 of 35
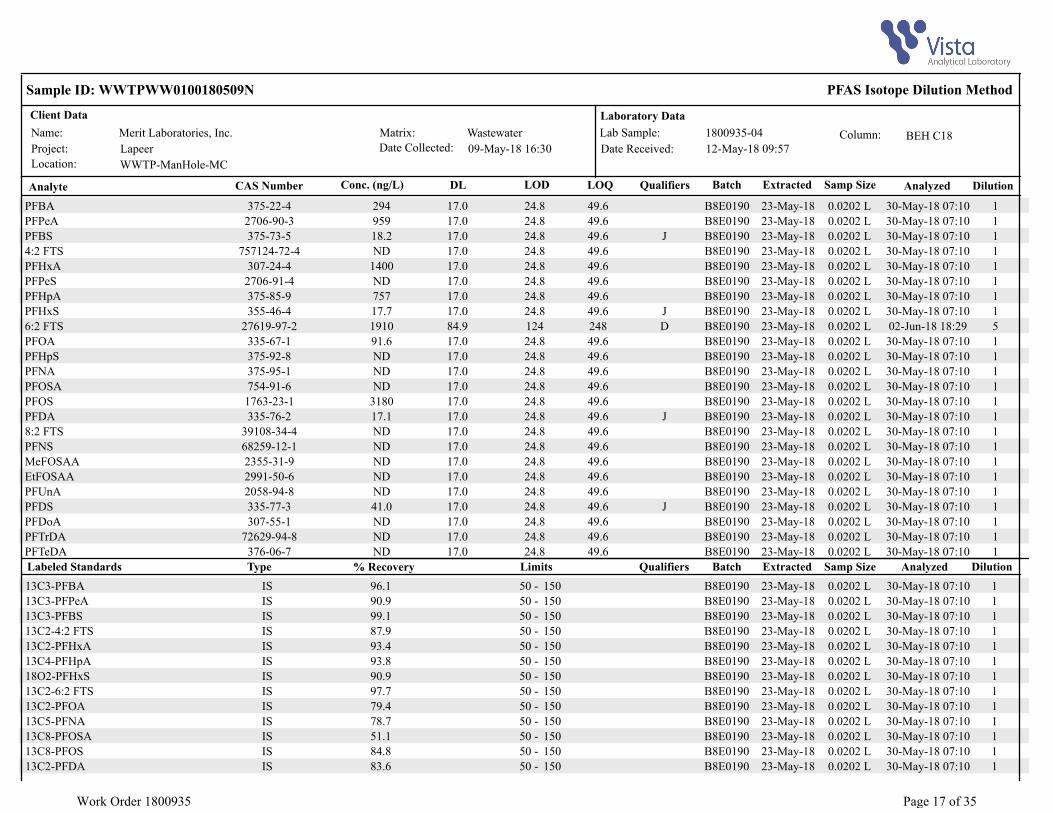
Name:
Project: Date Collected:
Client Data
Lapeer
Sample ID: WWTPWW0100180509N
Matrix:
Laboratory Data
Lab Sample: 1800935-04
PFAS Isotope Dilution Method
Merit Laboratories, Inc. Column: BEH C18Wastewater
09-May-18 16:30 Date Received: 12-May-18 09:57
Location: WWTP-ManHole-MC
Analyte Conc. (ng/L) Qualifiers Analyzed DilutionLOD LOQDL Batch Extracted Samp SizeCAS Number
PFBA 17.0294 124.8 49.6 30-May-18 07:10B8E0190 0.0202 L23-May-18375-22-4
PFPeA 17.0959 124.8 49.6 30-May-18 07:10B8E0190 0.0202 L23-May-182706-90-3
PFBS 17.018.2 J 124.8 49.6 30-May-18 07:10B8E0190 0.0202 L23-May-18375-73-5
4:2 FTS 17.0ND 124.8 49.6 30-May-18 07:10B8E0190 0.0202 L23-May-18757124-72-4
PFHxA 17.01400 124.8 49.6 30-May-18 07:10B8E0190 0.0202 L23-May-18307-24-4
PFPeS 17.0ND 124.8 49.6 30-May-18 07:10B8E0190 0.0202 L23-May-182706-91-4
PFHpA 17.0757 124.8 49.6 30-May-18 07:10B8E0190 0.0202 L23-May-18375-85-9
PFHxS 17.017.7 J 124.8 49.6 30-May-18 07:10B8E0190 0.0202 L23-May-18355-46-4
6:2 FTS 84.91910 D 5124 248 02-Jun-18 18:29B8E0190 0.0202 L23-May-1827619-97-2
PFOA 17.091.6 124.8 49.6 30-May-18 07:10B8E0190 0.0202 L23-May-18335-67-1
PFHpS 17.0ND 124.8 49.6 30-May-18 07:10B8E0190 0.0202 L23-May-18375-92-8
PFNA 17.0ND 124.8 49.6 30-May-18 07:10B8E0190 0.0202 L23-May-18375-95-1
PFOSA 17.0ND 124.8 49.6 30-May-18 07:10B8E0190 0.0202 L23-May-18754-91-6
PFOS 17.03180 124.8 49.6 30-May-18 07:10B8E0190 0.0202 L23-May-181763-23-1
PFDA 17.017.1 J 124.8 49.6 30-May-18 07:10B8E0190 0.0202 L23-May-18335-76-2
8:2 FTS 17.0ND 124.8 49.6 30-May-18 07:10B8E0190 0.0202 L23-May-1839108-34-4
PFNS 17.0ND 124.8 49.6 30-May-18 07:10B8E0190 0.0202 L23-May-1868259-12-1
MeFOSAA 17.0ND 124.8 49.6 30-May-18 07:10B8E0190 0.0202 L23-May-182355-31-9
EtFOSAA 17.0ND 124.8 49.6 30-May-18 07:10B8E0190 0.0202 L23-May-182991-50-6
PFUnA 17.0ND 124.8 49.6 30-May-18 07:10B8E0190 0.0202 L23-May-182058-94-8
PFDS 17.041.0 J 124.8 49.6 30-May-18 07:10B8E0190 0.0202 L23-May-18335-77-3
PFDoA 17.0ND 124.8 49.6 30-May-18 07:10B8E0190 0.0202 L23-May-18307-55-1
PFTrDA 17.0ND 124.8 49.6 30-May-18 07:10B8E0190 0.0202 L23-May-1872629-94-8
PFTeDA 17.0ND 124.8 49.6 30-May-18 07:10B8E0190 0.0202 L23-May-18376-06-7
Labeled Standards % Recovery Limits Qualifiers Analyzed DilutionType Batch Extracted Samp Size
IS - 13C3-PFBA 96.1 50 150 130-May-18 07:10B8E0190 23-May-18 0.0202 L
IS - 13C3-PFPeA 90.9 50 150 130-May-18 07:10B8E0190 23-May-18 0.0202 L
IS - 13C3-PFBS 99.1 50 150 130-May-18 07:10B8E0190 23-May-18 0.0202 L
IS - 13C2-4:2 FTS 87.9 50 150 130-May-18 07:10B8E0190 23-May-18 0.0202 L
IS - 13C2-PFHxA 93.4 50 150 130-May-18 07:10B8E0190 23-May-18 0.0202 L
IS - 13C4-PFHpA 93.8 50 150 130-May-18 07:10B8E0190 23-May-18 0.0202 L
IS - 18O2-PFHxS 90.9 50 150 130-May-18 07:10B8E0190 23-May-18 0.0202 L
IS - 13C2-6:2 FTS 97.7 50 150 130-May-18 07:10B8E0190 23-May-18 0.0202 L
IS - 13C2-PFOA 79.4 50 150 130-May-18 07:10B8E0190 23-May-18 0.0202 L
IS - 13C5-PFNA 78.7 50 150 130-May-18 07:10B8E0190 23-May-18 0.0202 L
IS - 13C8-PFOSA 51.1 50 150 130-May-18 07:10B8E0190 23-May-18 0.0202 L
IS - 13C8-PFOS 84.8 50 150 130-May-18 07:10B8E0190 23-May-18 0.0202 L
IS - 13C2-PFDA 83.6 50 150 130-May-18 07:10B8E0190 23-May-18 0.0202 L
Work Order 1800935 Page 17 of 35

Name:
Project: Date Collected:
Client Data
Lapeer
Sample ID: WWTPWW0100180509N
Matrix:
Laboratory Data
Lab Sample: 1800935-04
PFAS Isotope Dilution Method
Merit Laboratories, Inc. Column: BEH C18Wastewater
09-May-18 16:30 Date Received: 12-May-18 09:57
Location: WWTP-ManHole-MC
Labeled Standards % Recovery Limits Qualifiers Analyzed DilutionType Batch Extracted Samp Size
IS - 13C2-8:2 FTS 80.4 50 150 130-May-18 07:10B8E0190 23-May-18 0.0202 L
IS - d3-MeFOSAA 70.5 50 150 130-May-18 07:10B8E0190 23-May-18 0.0202 L
IS - d5-EtFOSAA 62.8 50 150 130-May-18 07:10B8E0190 23-May-18 0.0202 L
IS - 13C2-PFUnA 59.4 50 150 130-May-18 07:10B8E0190 23-May-18 0.0202 L
IS - 13C2-PFDoA 56.0 50 150 130-May-18 07:10B8E0190 23-May-18 0.0202 L
IS - 13C2-PFTeDA 27.5 50 150 H 130-May-18 07:10B8E0190 23-May-18 0.0202 LResults reported to the DL. DL - Detection Limit When reported, PFHxS, PFOA, PFOS, MeFOSAA and EtFOSAA include both
linear and branched isomers. Only the linear isomer is reported for all other
analytes.
LOD - Limit of Detection
LOQ - Limit of quantitation
Work Order 1800935 Page 18 of 35
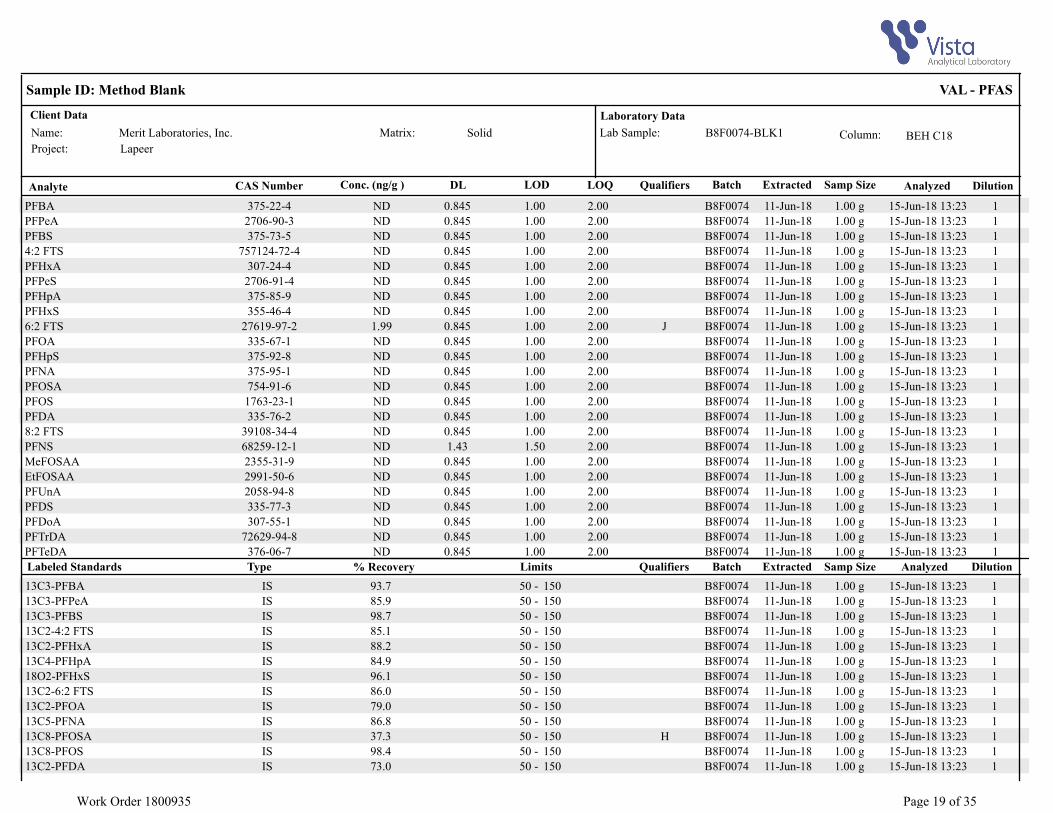
Name:
Project:
Client Data
Lapeer
Sample ID: Method Blank
Matrix:
Laboratory Data
Lab Sample: B8F0074-BLK1
VAL - PFAS
Merit Laboratories, Inc. Column: BEH C18Solid
Analyte Conc. (ng/g ) Qualifiers Analyzed DilutionLOD LOQDL Batch Extracted Samp SizeCAS Number
PFBA 0.845ND 11.00 2.00 15-Jun-18 13:23B8F0074 1.00 g11-Jun-18375-22-4
PFPeA 0.845ND 11.00 2.00 15-Jun-18 13:23B8F0074 1.00 g11-Jun-182706-90-3
PFBS 0.845ND 11.00 2.00 15-Jun-18 13:23B8F0074 1.00 g11-Jun-18375-73-5
4:2 FTS 0.845ND 11.00 2.00 15-Jun-18 13:23B8F0074 1.00 g11-Jun-18757124-72-4
PFHxA 0.845ND 11.00 2.00 15-Jun-18 13:23B8F0074 1.00 g11-Jun-18307-24-4
PFPeS 0.845ND 11.00 2.00 15-Jun-18 13:23B8F0074 1.00 g11-Jun-182706-91-4
PFHpA 0.845ND 11.00 2.00 15-Jun-18 13:23B8F0074 1.00 g11-Jun-18375-85-9
PFHxS 0.845ND 11.00 2.00 15-Jun-18 13:23B8F0074 1.00 g11-Jun-18355-46-4
6:2 FTS 0.8451.99 J 11.00 2.00 15-Jun-18 13:23B8F0074 1.00 g11-Jun-1827619-97-2
PFOA 0.845ND 11.00 2.00 15-Jun-18 13:23B8F0074 1.00 g11-Jun-18335-67-1
PFHpS 0.845ND 11.00 2.00 15-Jun-18 13:23B8F0074 1.00 g11-Jun-18375-92-8
PFNA 0.845ND 11.00 2.00 15-Jun-18 13:23B8F0074 1.00 g11-Jun-18375-95-1
PFOSA 0.845ND 11.00 2.00 15-Jun-18 13:23B8F0074 1.00 g11-Jun-18754-91-6
PFOS 0.845ND 11.00 2.00 15-Jun-18 13:23B8F0074 1.00 g11-Jun-181763-23-1
PFDA 0.845ND 11.00 2.00 15-Jun-18 13:23B8F0074 1.00 g11-Jun-18335-76-2
8:2 FTS 0.845ND 11.00 2.00 15-Jun-18 13:23B8F0074 1.00 g11-Jun-1839108-34-4
PFNS 1.43ND 11.50 2.00 15-Jun-18 13:23B8F0074 1.00 g11-Jun-1868259-12-1
MeFOSAA 0.845ND 11.00 2.00 15-Jun-18 13:23B8F0074 1.00 g11-Jun-182355-31-9
EtFOSAA 0.845ND 11.00 2.00 15-Jun-18 13:23B8F0074 1.00 g11-Jun-182991-50-6
PFUnA 0.845ND 11.00 2.00 15-Jun-18 13:23B8F0074 1.00 g11-Jun-182058-94-8
PFDS 0.845ND 11.00 2.00 15-Jun-18 13:23B8F0074 1.00 g11-Jun-18335-77-3
PFDoA 0.845ND 11.00 2.00 15-Jun-18 13:23B8F0074 1.00 g11-Jun-18307-55-1
PFTrDA 0.845ND 11.00 2.00 15-Jun-18 13:23B8F0074 1.00 g11-Jun-1872629-94-8
PFTeDA 0.845ND 11.00 2.00 15-Jun-18 13:23B8F0074 1.00 g11-Jun-18376-06-7
Labeled Standards % Recovery Limits Qualifiers Analyzed DilutionType Batch Extracted Samp Size
IS - 13C3-PFBA 93.7 50 150 115-Jun-18 13:23B8F0074 11-Jun-18 1.00 g
IS - 13C3-PFPeA 85.9 50 150 115-Jun-18 13:23B8F0074 11-Jun-18 1.00 g
IS - 13C3-PFBS 98.7 50 150 115-Jun-18 13:23B8F0074 11-Jun-18 1.00 g
IS - 13C2-4:2 FTS 85.1 50 150 115-Jun-18 13:23B8F0074 11-Jun-18 1.00 g
IS - 13C2-PFHxA 88.2 50 150 115-Jun-18 13:23B8F0074 11-Jun-18 1.00 g
IS - 13C4-PFHpA 84.9 50 150 115-Jun-18 13:23B8F0074 11-Jun-18 1.00 g
IS - 18O2-PFHxS 96.1 50 150 115-Jun-18 13:23B8F0074 11-Jun-18 1.00 g
IS - 13C2-6:2 FTS 86.0 50 150 115-Jun-18 13:23B8F0074 11-Jun-18 1.00 g
IS - 13C2-PFOA 79.0 50 150 115-Jun-18 13:23B8F0074 11-Jun-18 1.00 g
IS - 13C5-PFNA 86.8 50 150 115-Jun-18 13:23B8F0074 11-Jun-18 1.00 g
IS - 13C8-PFOSA 37.3 50 150 H 115-Jun-18 13:23B8F0074 11-Jun-18 1.00 g
IS - 13C8-PFOS 98.4 50 150 115-Jun-18 13:23B8F0074 11-Jun-18 1.00 g
IS - 13C2-PFDA 73.0 50 150 115-Jun-18 13:23B8F0074 11-Jun-18 1.00 g
Work Order 1800935 Page 19 of 35

Name:
Project:
Client Data
Lapeer
Sample ID: Method Blank
Matrix:
Laboratory Data
Lab Sample: B8F0074-BLK1
VAL - PFAS
Merit Laboratories, Inc. Column: BEH C18Solid
Labeled Standards % Recovery Limits Qualifiers Analyzed DilutionType Batch Extracted Samp Size
IS - 13C2-8:2 FTS 90.6 50 150 115-Jun-18 13:23B8F0074 11-Jun-18 1.00 g
IS - d3-MeFOSAA 83.8 50 150 115-Jun-18 13:23B8F0074 11-Jun-18 1.00 g
IS - d5-EtFOSAA 79.9 50 150 115-Jun-18 13:23B8F0074 11-Jun-18 1.00 g
IS - 13C2-PFUnA 81.7 50 150 115-Jun-18 13:23B8F0074 11-Jun-18 1.00 g
IS - 13C2-PFDoA 72.1 50 150 115-Jun-18 13:23B8F0074 11-Jun-18 1.00 g
IS - 13C2-PFTeDA 75.4 50 150 115-Jun-18 13:23B8F0074 11-Jun-18 1.00 gThe results are reported in dry weight.
The sample size is reported in wet weight.
Results reported to the DL.
DL - Detection Limit When reported, PFHxS, PFOA, PFOS, MeFOSAA and EtFOSAA include both
linear and branched isomers. Only the linear isomer is reported for all other
analytes.
LOD - Limit of Detection
LOQ - Limit of quantitation
Work Order 1800935 Page 20 of 35

Name:Project:
Client Data
Lapeer
Sample ID: OPR
Matrix:
Laboratory Data
Lab Sample: B8F0074-BS1
VAL - PFAS
Merit Laboratories, Inc. Column: BEH C18Solid
Analyte Amt Found (ng/g ) Qualifiers Analyzed DilutionSpike Amt % Rec Limits Samp SizeExtractedBatchCAS Number
PFBA 8.61 115-Jun-18 13:1310.0 86.1 - 70 130 1.00 g11-Jun-18B8F0074375-22-4
PFPeA 8.90 115-Jun-18 13:1310.0 89.0 - 70 130 1.00 g11-Jun-18B8F00742706-90-3
PFBS 8.84 115-Jun-18 13:1310.0 88.4 - 70 130 1.00 g11-Jun-18B8F0074375-73-5
4:2 FTS 8.77 115-Jun-18 13:1310.0 87.7 - 60 130 1.00 g11-Jun-18B8F0074757124-72-4
PFHxA 9.29 115-Jun-18 13:1310.0 92.9 - 70 130 1.00 g11-Jun-18B8F0074307-24-4
PFPeS 9.64 115-Jun-18 13:1310.0 96.4 - 70 130 1.00 g11-Jun-18B8F00742706-91-4
PFHpA 8.86 115-Jun-18 13:1310.0 88.6 - 70 130 1.00 g11-Jun-18B8F0074375-85-9
PFHxS 8.72 115-Jun-18 13:1310.0 87.2 - 70 130 1.00 g11-Jun-18B8F0074355-46-4
6:2 FTS 13.4 B, H 115-Jun-18 13:1310.0 134 - 60 130 1.00 g11-Jun-18B8F007427619-97-2
PFOA 10.2 115-Jun-18 13:1310.0 102 - 70 130 1.00 g11-Jun-18B8F0074335-67-1
PFHpS 9.49 115-Jun-18 13:1310.0 94.9 - 60 130 1.00 g11-Jun-18B8F0074375-92-8
PFNA 8.13 115-Jun-18 13:1310.0 81.3 - 70 130 1.00 g11-Jun-18B8F0074375-95-1
PFOSA 8.61 115-Jun-18 13:1310.0 86.1 - 70 130 1.00 g11-Jun-18B8F0074754-91-6
PFOS 7.48 115-Jun-18 13:1310.0 74.8 - 70 130 1.00 g11-Jun-18B8F00741763-23-1
PFDA 9.13 115-Jun-18 13:1310.0 91.3 - 70 130 1.00 g11-Jun-18B8F0074335-76-2
8:2 FTS 9.29 115-Jun-18 13:1310.0 92.9 - 60 130 1.00 g11-Jun-18B8F007439108-34-4
PFNS 7.73 115-Jun-18 13:1310.0 77.3 - 70 130 1.00 g11-Jun-18B8F007468259-12-1
MeFOSAA 6.95 H 115-Jun-18 13:1310.0 69.5 - 70 130 1.00 g11-Jun-18B8F00742355-31-9
EtFOSAA 9.82 115-Jun-18 13:1310.0 98.2 - 70 130 1.00 g11-Jun-18B8F00742991-50-6
PFUnA 8.81 115-Jun-18 13:1310.0 88.1 - 70 130 1.00 g11-Jun-18B8F00742058-94-8
PFDS 9.12 115-Jun-18 13:1310.0 91.2 - 60 130 1.00 g11-Jun-18B8F0074335-77-3
PFDoA 8.63 115-Jun-18 13:1310.0 86.3 - 70 130 1.00 g11-Jun-18B8F0074307-55-1
PFTrDA 9.51 115-Jun-18 13:1310.0 95.1 - 60 130 1.00 g11-Jun-18B8F007472629-94-8
PFTeDA 8.28 115-Jun-18 13:1310.0 82.8 - 70 130 1.00 g11-Jun-18B8F0074376-06-7
Labeled Standards % Rec Limits Qualifiers Analyzed DilutionType Samp SizeExtractedBatch
IS - 13C3-PFBA 100 50 150 115-Jun-18 13:131.00 g11-Jun-18B8F0074
IS - 13C3-PFPeA 96.2 50 150 115-Jun-18 13:131.00 g11-Jun-18B8F0074
IS - 13C3-PFBS 106 50 150 115-Jun-18 13:131.00 g11-Jun-18B8F0074
IS - 13C2-4:2 FTS 106 50 150 115-Jun-18 13:131.00 g11-Jun-18B8F0074
IS - 13C2-PFHxA 97.8 50 150 115-Jun-18 13:131.00 g11-Jun-18B8F0074
IS - 13C4-PFHpA 95.5 50 150 115-Jun-18 13:131.00 g11-Jun-18B8F0074
IS - 18O2-PFHxS 100 50 150 115-Jun-18 13:131.00 g11-Jun-18B8F0074
IS - 13C2-6:2 FTS 92.6 50 150 115-Jun-18 13:131.00 g11-Jun-18B8F0074
IS - 13C2-PFOA 87.7 50 150 115-Jun-18 13:131.00 g11-Jun-18B8F0074
IS - 13C5-PFNA 80.1 50 150 115-Jun-18 13:131.00 g11-Jun-18B8F0074
Work Order 1800935 Page 21 of 35

Name:Project:
Client Data
Lapeer
Sample ID: OPR
Matrix:
Laboratory Data
Lab Sample: B8F0074-BS1
VAL - PFAS
Merit Laboratories, Inc. Column: BEH C18Solid
Labeled Standards % Rec Limits Qualifiers Analyzed DilutionType Samp SizeExtractedBatch
IS - 13C8-PFOSA 35.8 50 150 H 115-Jun-18 13:131.00 g11-Jun-18B8F0074
IS - 13C8-PFOS 102 50 150 115-Jun-18 13:131.00 g11-Jun-18B8F0074
IS - 13C2-PFDA 83.0 50 150 115-Jun-18 13:131.00 g11-Jun-18B8F0074
IS - 13C2-8:2 FTS 108 50 150 115-Jun-18 13:131.00 g11-Jun-18B8F0074
IS - d3-MeFOSAA 72.3 50 150 115-Jun-18 13:131.00 g11-Jun-18B8F0074
IS - d5-EtFOSAA 61.8 50 150 115-Jun-18 13:131.00 g11-Jun-18B8F0074
IS - 13C2-PFUnA 76.8 50 150 115-Jun-18 13:131.00 g11-Jun-18B8F0074
IS - 13C2-PFDoA 76.7 50 150 115-Jun-18 13:131.00 g11-Jun-18B8F0074
IS - 13C2-PFTeDA 79.1 50 150 115-Jun-18 13:131.00 g11-Jun-18B8F0074
Work Order 1800935 Page 22 of 35
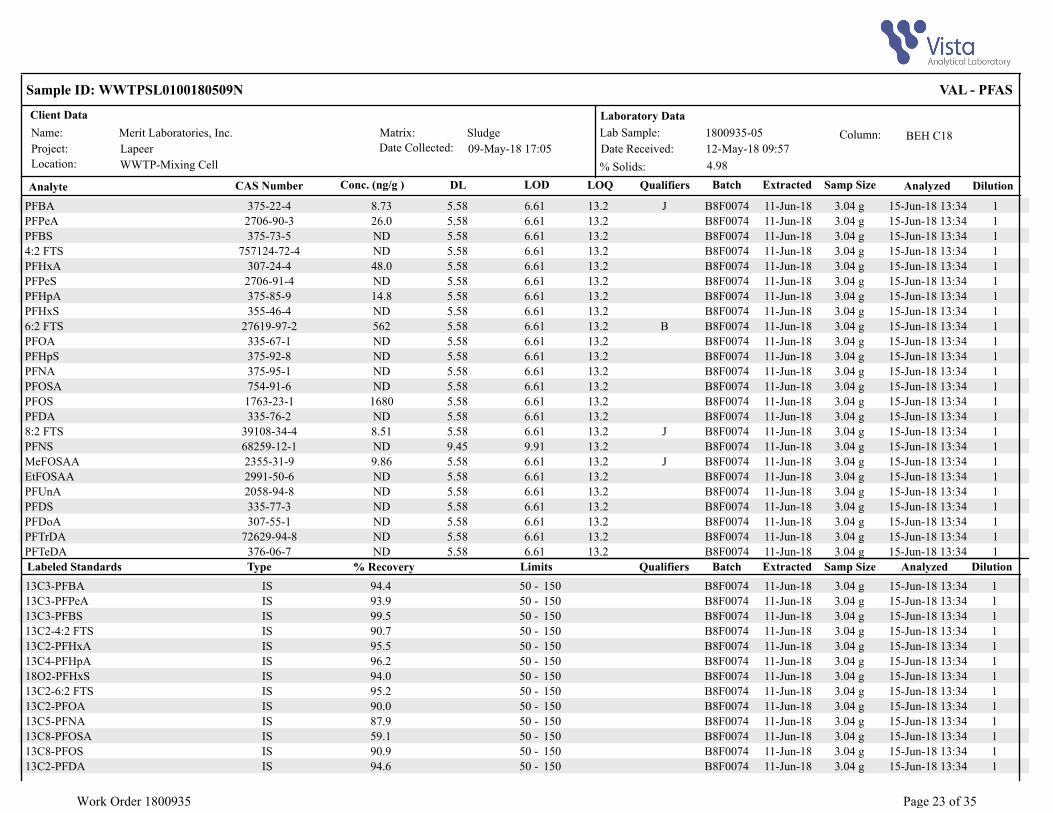
Name:
Project: Date Collected:
Client Data
Lapeer
Sample ID: WWTPSL0100180509N
Matrix:
Laboratory Data
Lab Sample: 1800935-05
VAL - PFAS
% Solids:
Merit Laboratories, Inc.
4.98
Column: BEH C18Sludge
09-May-18 17:05 Date Received: 12-May-18 09:57
Location: WWTP-Mixing Cell
Analyte Conc. (ng/g ) Qualifiers Analyzed DilutionLOD LOQDL Batch Extracted Samp SizeCAS Number
PFBA 5.588.73 J 16.61 13.2 15-Jun-18 13:34B8F0074 3.04 g11-Jun-18375-22-4
PFPeA 5.5826.0 16.61 13.2 15-Jun-18 13:34B8F0074 3.04 g11-Jun-182706-90-3
PFBS 5.58ND 16.61 13.2 15-Jun-18 13:34B8F0074 3.04 g11-Jun-18375-73-5
4:2 FTS 5.58ND 16.61 13.2 15-Jun-18 13:34B8F0074 3.04 g11-Jun-18757124-72-4
PFHxA 5.5848.0 16.61 13.2 15-Jun-18 13:34B8F0074 3.04 g11-Jun-18307-24-4
PFPeS 5.58ND 16.61 13.2 15-Jun-18 13:34B8F0074 3.04 g11-Jun-182706-91-4
PFHpA 5.5814.8 16.61 13.2 15-Jun-18 13:34B8F0074 3.04 g11-Jun-18375-85-9
PFHxS 5.58ND 16.61 13.2 15-Jun-18 13:34B8F0074 3.04 g11-Jun-18355-46-4
6:2 FTS 5.58562 B 16.61 13.2 15-Jun-18 13:34B8F0074 3.04 g11-Jun-1827619-97-2
PFOA 5.58ND 16.61 13.2 15-Jun-18 13:34B8F0074 3.04 g11-Jun-18335-67-1
PFHpS 5.58ND 16.61 13.2 15-Jun-18 13:34B8F0074 3.04 g11-Jun-18375-92-8
PFNA 5.58ND 16.61 13.2 15-Jun-18 13:34B8F0074 3.04 g11-Jun-18375-95-1
PFOSA 5.58ND 16.61 13.2 15-Jun-18 13:34B8F0074 3.04 g11-Jun-18754-91-6
PFOS 5.581680 16.61 13.2 15-Jun-18 13:34B8F0074 3.04 g11-Jun-181763-23-1
PFDA 5.58ND 16.61 13.2 15-Jun-18 13:34B8F0074 3.04 g11-Jun-18335-76-2
8:2 FTS 5.588.51 J 16.61 13.2 15-Jun-18 13:34B8F0074 3.04 g11-Jun-1839108-34-4
PFNS 9.45ND 19.91 13.2 15-Jun-18 13:34B8F0074 3.04 g11-Jun-1868259-12-1
MeFOSAA 5.589.86 J 16.61 13.2 15-Jun-18 13:34B8F0074 3.04 g11-Jun-182355-31-9
EtFOSAA 5.58ND 16.61 13.2 15-Jun-18 13:34B8F0074 3.04 g11-Jun-182991-50-6
PFUnA 5.58ND 16.61 13.2 15-Jun-18 13:34B8F0074 3.04 g11-Jun-182058-94-8
PFDS 5.58ND 16.61 13.2 15-Jun-18 13:34B8F0074 3.04 g11-Jun-18335-77-3
PFDoA 5.58ND 16.61 13.2 15-Jun-18 13:34B8F0074 3.04 g11-Jun-18307-55-1
PFTrDA 5.58ND 16.61 13.2 15-Jun-18 13:34B8F0074 3.04 g11-Jun-1872629-94-8
PFTeDA 5.58ND 16.61 13.2 15-Jun-18 13:34B8F0074 3.04 g11-Jun-18376-06-7
Labeled Standards % Recovery Limits Qualifiers Analyzed DilutionType Batch Extracted Samp Size
IS - 13C3-PFBA 94.4 50 150 115-Jun-18 13:34B8F0074 11-Jun-18 3.04 g
IS - 13C3-PFPeA 93.9 50 150 115-Jun-18 13:34B8F0074 11-Jun-18 3.04 g
IS - 13C3-PFBS 99.5 50 150 115-Jun-18 13:34B8F0074 11-Jun-18 3.04 g
IS - 13C2-4:2 FTS 90.7 50 150 115-Jun-18 13:34B8F0074 11-Jun-18 3.04 g
IS - 13C2-PFHxA 95.5 50 150 115-Jun-18 13:34B8F0074 11-Jun-18 3.04 g
IS - 13C4-PFHpA 96.2 50 150 115-Jun-18 13:34B8F0074 11-Jun-18 3.04 g
IS - 18O2-PFHxS 94.0 50 150 115-Jun-18 13:34B8F0074 11-Jun-18 3.04 g
IS - 13C2-6:2 FTS 95.2 50 150 115-Jun-18 13:34B8F0074 11-Jun-18 3.04 g
IS - 13C2-PFOA 90.0 50 150 115-Jun-18 13:34B8F0074 11-Jun-18 3.04 g
IS - 13C5-PFNA 87.9 50 150 115-Jun-18 13:34B8F0074 11-Jun-18 3.04 g
IS - 13C8-PFOSA 59.1 50 150 115-Jun-18 13:34B8F0074 11-Jun-18 3.04 g
IS - 13C8-PFOS 90.9 50 150 115-Jun-18 13:34B8F0074 11-Jun-18 3.04 g
IS - 13C2-PFDA 94.6 50 150 115-Jun-18 13:34B8F0074 11-Jun-18 3.04 g
Work Order 1800935 Page 23 of 35
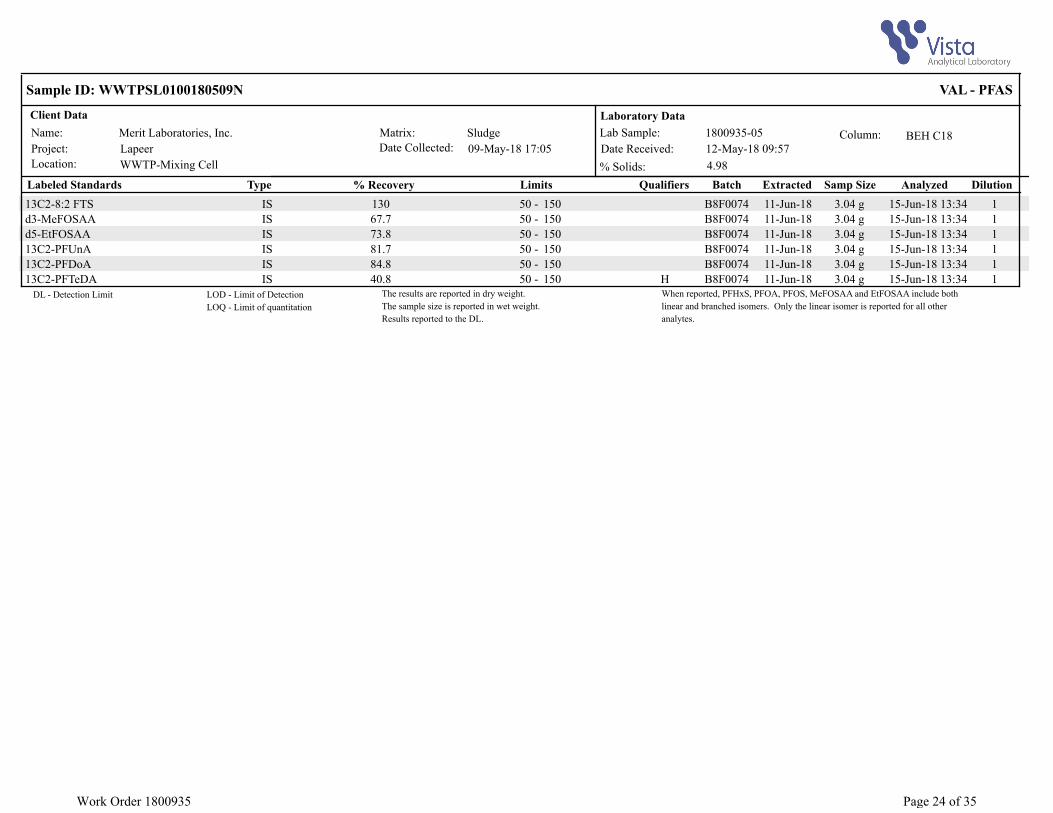
Name:
Project: Date Collected:
Client Data
Lapeer
Sample ID: WWTPSL0100180509N
Matrix:
Laboratory Data
Lab Sample: 1800935-05
VAL - PFAS
% Solids:
Merit Laboratories, Inc.
4.98
Column: BEH C18Sludge
09-May-18 17:05 Date Received: 12-May-18 09:57
Location: WWTP-Mixing Cell
Labeled Standards % Recovery Limits Qualifiers Analyzed DilutionType Batch Extracted Samp Size
IS - 13C2-8:2 FTS 130 50 150 115-Jun-18 13:34B8F0074 11-Jun-18 3.04 g
IS - d3-MeFOSAA 67.7 50 150 115-Jun-18 13:34B8F0074 11-Jun-18 3.04 g
IS - d5-EtFOSAA 73.8 50 150 115-Jun-18 13:34B8F0074 11-Jun-18 3.04 g
IS - 13C2-PFUnA 81.7 50 150 115-Jun-18 13:34B8F0074 11-Jun-18 3.04 g
IS - 13C2-PFDoA 84.8 50 150 115-Jun-18 13:34B8F0074 11-Jun-18 3.04 g
IS - 13C2-PFTeDA 40.8 50 150 H 115-Jun-18 13:34B8F0074 11-Jun-18 3.04 gThe results are reported in dry weight.
The sample size is reported in wet weight.
Results reported to the DL.
DL - Detection Limit When reported, PFHxS, PFOA, PFOS, MeFOSAA and EtFOSAA include both
linear and branched isomers. Only the linear isomer is reported for all other
analytes.
LOD - Limit of Detection
LOQ - Limit of quantitation
Work Order 1800935 Page 24 of 35

Name:
Project:
Client Data
Lapeer
Sample ID: Blank
Matrix:
Laboratory Data
Lab Sample: B8F0153-BLK1
VAL - PFAS
Merit Laboratories, Inc. Column: BEH C18Solid
Analyte Conc. (ng/g ) Qualifiers Analyzed DilutionLOD LOQDL Batch Extracted Samp SizeCAS Number
PFBA 0.845ND 11.00 2.00 23-Jun-18 07:28B8F0153 1.00 g20-Jun-18375-22-4
PFPeA 0.845ND 11.00 2.00 23-Jun-18 07:28B8F0153 1.00 g20-Jun-182706-90-3
PFBS 0.845ND 11.00 2.00 23-Jun-18 07:28B8F0153 1.00 g20-Jun-18375-73-5
4:2 FTS 0.845ND 11.00 2.00 23-Jun-18 07:28B8F0153 1.00 g20-Jun-18757124-72-4
PFHxA 0.845ND 11.00 2.00 23-Jun-18 07:28B8F0153 1.00 g20-Jun-18307-24-4
PFPeS 0.845ND 11.00 2.00 23-Jun-18 07:28B8F0153 1.00 g20-Jun-182706-91-4
PFHpA 0.845ND 11.00 2.00 23-Jun-18 07:28B8F0153 1.00 g20-Jun-18375-85-9
PFHxS 0.845ND 11.00 2.00 23-Jun-18 07:28B8F0153 1.00 g20-Jun-18355-46-4
6:2 FTS 0.845ND 11.00 2.00 23-Jun-18 07:28B8F0153 1.00 g20-Jun-1827619-97-2
PFOA 0.845ND 11.00 2.00 23-Jun-18 07:28B8F0153 1.00 g20-Jun-18335-67-1
PFHpS 0.845ND 11.00 2.00 23-Jun-18 07:28B8F0153 1.00 g20-Jun-18375-92-8
PFNA 0.845ND 11.00 2.00 23-Jun-18 07:28B8F0153 1.00 g20-Jun-18375-95-1
PFOSA 0.845ND 11.00 2.00 23-Jun-18 07:28B8F0153 1.00 g20-Jun-18754-91-6
PFOS 0.845ND 11.00 2.00 23-Jun-18 07:28B8F0153 1.00 g20-Jun-181763-23-1
PFDA 0.845ND 11.00 2.00 23-Jun-18 07:28B8F0153 1.00 g20-Jun-18335-76-2
8:2 FTS 0.845ND 11.00 2.00 23-Jun-18 07:28B8F0153 1.00 g20-Jun-1839108-34-4
PFNS 1.43ND 11.50 2.00 23-Jun-18 07:28B8F0153 1.00 g20-Jun-1868259-12-1
MeFOSAA 0.845ND 11.00 2.00 23-Jun-18 07:28B8F0153 1.00 g20-Jun-182355-31-9
EtFOSAA 0.845ND 11.00 2.00 23-Jun-18 07:28B8F0153 1.00 g20-Jun-182991-50-6
PFUnA 0.845ND 11.00 2.00 23-Jun-18 07:28B8F0153 1.00 g20-Jun-182058-94-8
PFDS 0.845ND 11.00 2.00 23-Jun-18 07:28B8F0153 1.00 g20-Jun-18335-77-3
PFDoA 0.845ND 11.00 2.00 23-Jun-18 07:28B8F0153 1.00 g20-Jun-18307-55-1
PFTrDA 0.845ND 11.00 2.00 23-Jun-18 07:28B8F0153 1.00 g20-Jun-1872629-94-8
PFTeDA 0.845ND 11.00 2.00 23-Jun-18 07:28B8F0153 1.00 g20-Jun-18376-06-7
Labeled Standards % Recovery Limits Qualifiers Analyzed DilutionType Batch Extracted Samp Size
IS - 13C3-PFBA 93.2 50 150 123-Jun-18 07:28B8F0153 20-Jun-18 1.00 g
IS - 13C3-PFPeA 91.3 50 150 123-Jun-18 07:28B8F0153 20-Jun-18 1.00 g
IS - 13C3-PFBS 103 50 150 123-Jun-18 07:28B8F0153 20-Jun-18 1.00 g
IS - 13C2-4:2 FTS 86.0 50 150 123-Jun-18 07:28B8F0153 20-Jun-18 1.00 g
IS - 13C2-PFHxA 85.7 50 150 123-Jun-18 07:28B8F0153 20-Jun-18 1.00 g
IS - 13C4-PFHpA 86.9 50 150 123-Jun-18 07:28B8F0153 20-Jun-18 1.00 g
IS - 18O2-PFHxS 92.9 50 150 123-Jun-18 07:28B8F0153 20-Jun-18 1.00 g
IS - 13C2-6:2 FTS 82.5 50 150 123-Jun-18 07:28B8F0153 20-Jun-18 1.00 g
IS - 13C2-PFOA 75.6 50 150 123-Jun-18 07:28B8F0153 20-Jun-18 1.00 g
IS - 13C5-PFNA 78.7 50 150 123-Jun-18 07:28B8F0153 20-Jun-18 1.00 g
IS - 13C8-PFOSA 45.7 50 150 H 123-Jun-18 07:28B8F0153 20-Jun-18 1.00 g
IS - 13C8-PFOS 104 50 150 123-Jun-18 07:28B8F0153 20-Jun-18 1.00 g
IS - 13C2-PFDA 56.2 50 150 123-Jun-18 07:28B8F0153 20-Jun-18 1.00 g
Work Order 1800935 Page 25 of 35

Name:
Project:
Client Data
Lapeer
Sample ID: Blank
Matrix:
Laboratory Data
Lab Sample: B8F0153-BLK1
VAL - PFAS
Merit Laboratories, Inc. Column: BEH C18Solid
Labeled Standards % Recovery Limits Qualifiers Analyzed DilutionType Batch Extracted Samp Size
IS - 13C2-8:2 FTS 76.5 50 150 123-Jun-18 07:28B8F0153 20-Jun-18 1.00 g
IS - d3-MeFOSAA 86.6 50 150 123-Jun-18 07:28B8F0153 20-Jun-18 1.00 g
IS - d5-EtFOSAA 90.5 50 150 123-Jun-18 07:28B8F0153 20-Jun-18 1.00 g
IS - 13C2-PFUnA 63.7 50 150 123-Jun-18 07:28B8F0153 20-Jun-18 1.00 g
IS - 13C2-PFDoA 64.3 50 150 123-Jun-18 07:28B8F0153 20-Jun-18 1.00 g
IS - 13C2-PFTeDA 61.9 50 150 123-Jun-18 07:28B8F0153 20-Jun-18 1.00 gThe results are reported in dry weight.
The sample size is reported in wet weight.
Results reported to the DL.
DL - Detection Limit When reported, PFHxS, PFOA, PFOS, MeFOSAA and EtFOSAA include both
linear and branched isomers. Only the linear isomer is reported for all other
analytes.
LOD - Limit of Detection
LOQ - Limit of quantitation
Work Order 1800935 Page 26 of 35

Name:Project:
Client Data
Lapeer
Sample ID: LCS
Matrix:
Laboratory Data
Lab Sample: B8F0153-BS1
VAL - PFAS
Merit Laboratories, Inc. Column: BEH C18Solid
Analyte Amt Found (ng/g ) Qualifiers Analyzed DilutionSpike Amt % Rec Limits Samp SizeExtractedBatchCAS Number
PFBA 11.1 125-Jun-18 18:3110.0 111 - 70 130 1.00 g20-Jun-18B8F0153375-22-4
PFPeA 11.3 125-Jun-18 18:3110.0 113 - 70 130 1.00 g20-Jun-18B8F01532706-90-3
PFBS 11.8 125-Jun-18 18:3110.0 118 - 70 130 1.00 g20-Jun-18B8F0153375-73-5
4:2 FTS 11.0 125-Jun-18 18:3110.0 110 - 60 130 1.00 g20-Jun-18B8F0153757124-72-4
PFHxA 11.7 125-Jun-18 18:3110.0 117 - 70 130 1.00 g20-Jun-18B8F0153307-24-4
PFPeS 12.3 125-Jun-18 18:3110.0 123 - 70 130 1.00 g20-Jun-18B8F01532706-91-4
PFHpA 11.3 125-Jun-18 18:3110.0 113 - 70 130 1.00 g20-Jun-18B8F0153375-85-9
PFHxS 12.2 125-Jun-18 18:3110.0 122 - 70 130 1.00 g20-Jun-18B8F0153355-46-4
6:2 FTS 11.8 123-Jun-18 07:1810.0 118 - 60 130 1.00 g20-Jun-18B8F015327619-97-2
PFOA 12.8 125-Jun-18 18:3110.0 128 - 70 130 1.00 g20-Jun-18B8F0153335-67-1
PFHpS 13.7 H 125-Jun-18 18:3110.0 137 - 60 130 1.00 g20-Jun-18B8F0153375-92-8
PFNA 10.4 125-Jun-18 18:3110.0 104 - 70 130 1.00 g20-Jun-18B8F0153375-95-1
PFOSA 10.0 125-Jun-18 18:3110.0 100 - 70 130 1.00 g20-Jun-18B8F0153754-91-6
PFOS 10.7 125-Jun-18 18:3110.0 107 - 70 130 1.00 g20-Jun-18B8F01531763-23-1
PFDA 7.56 123-Jun-18 07:1810.0 75.6 - 70 130 1.00 g20-Jun-18B8F0153335-76-2
8:2 FTS 15.1 H 125-Jun-18 18:3110.0 151 - 60 130 1.00 g20-Jun-18B8F015339108-34-4
PFNS 10.7 125-Jun-18 18:3110.0 107 - 70 130 1.00 g20-Jun-18B8F015368259-12-1
MeFOSAA 10.4 125-Jun-18 18:3110.0 104 - 70 130 1.00 g20-Jun-18B8F01532355-31-9
EtFOSAA 8.60 125-Jun-18 18:3110.0 86.0 - 70 130 1.00 g20-Jun-18B8F01532991-50-6
PFUnA 11.0 125-Jun-18 18:3110.0 110 - 70 130 1.00 g20-Jun-18B8F01532058-94-8
PFDS 11.3 125-Jun-18 18:3110.0 113 - 60 130 1.00 g20-Jun-18B8F0153335-77-3
PFDoA 11.1 125-Jun-18 18:3110.0 111 - 70 130 1.00 g20-Jun-18B8F0153307-55-1
PFTrDA 9.67 125-Jun-18 18:3110.0 96.7 - 60 130 1.00 g20-Jun-18B8F015372629-94-8
PFTeDA 12.1 125-Jun-18 18:3110.0 121 - 70 130 1.00 g20-Jun-18B8F0153376-06-7
Labeled Standards % Rec Limits Qualifiers Analyzed DilutionType Samp SizeExtractedBatch
IS - 13C3-PFBA 88.0 50 150 125-Jun-18 18:311.00 g20-Jun-18B8F0153
IS - 13C3-PFPeA 84.8 50 150 125-Jun-18 18:311.00 g20-Jun-18B8F0153
IS - 13C3-PFBS 97.0 50 150 125-Jun-18 18:311.00 g20-Jun-18B8F0153
IS - 13C2-4:2 FTS 92.5 50 150 125-Jun-18 18:311.00 g20-Jun-18B8F0153
IS - 13C2-PFHxA 77.7 50 150 125-Jun-18 18:311.00 g20-Jun-18B8F0153
IS - 13C4-PFHpA 80.5 50 150 125-Jun-18 18:311.00 g20-Jun-18B8F0153
IS - 18O2-PFHxS 79.1 50 150 125-Jun-18 18:311.00 g20-Jun-18B8F0153
IS - 13C2-6:2 FTS 74.9 50 150 123-Jun-18 07:181.00 g20-Jun-18B8F0153
IS - 13C2-PFOA 67.7 50 150 125-Jun-18 18:311.00 g20-Jun-18B8F0153
IS - 13C5-PFNA 74.8 50 150 125-Jun-18 18:311.00 g20-Jun-18B8F0153
Work Order 1800935 Page 27 of 35
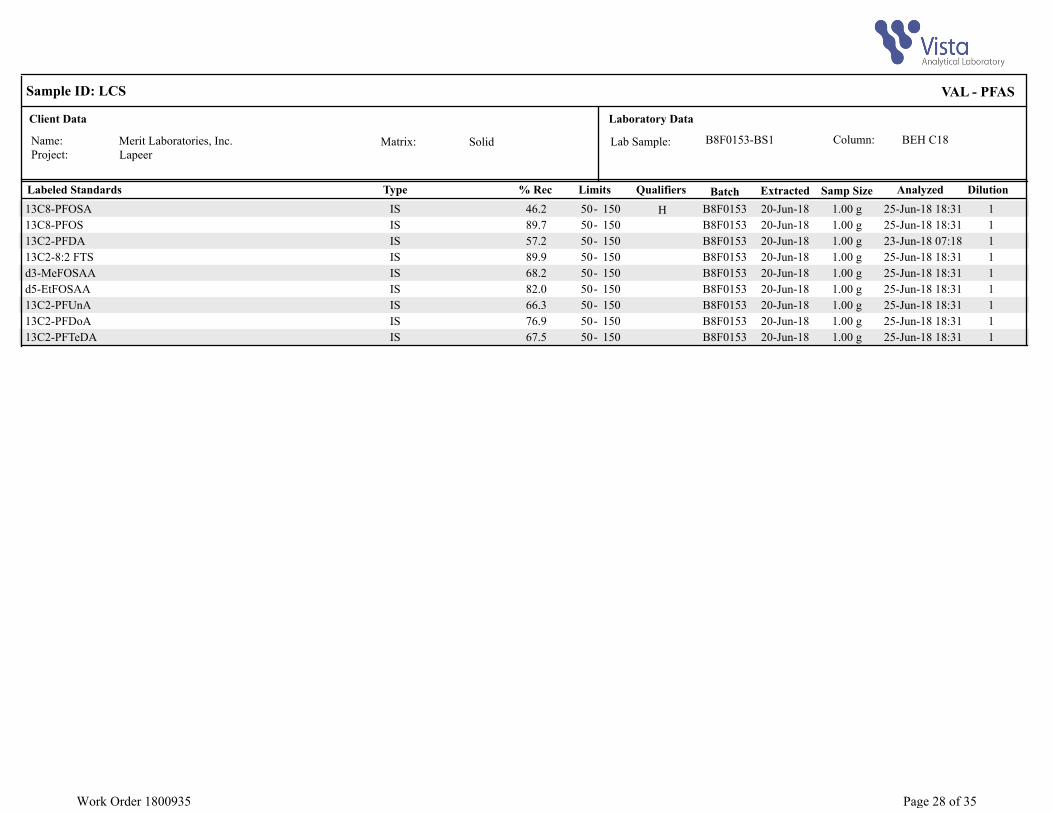
Name:Project:
Client Data
Lapeer
Sample ID: LCS
Matrix:
Laboratory Data
Lab Sample: B8F0153-BS1
VAL - PFAS
Merit Laboratories, Inc. Column: BEH C18Solid
Labeled Standards % Rec Limits Qualifiers Analyzed DilutionType Samp SizeExtractedBatch
IS - 13C8-PFOSA 46.2 50 150 H 125-Jun-18 18:311.00 g20-Jun-18B8F0153
IS - 13C8-PFOS 89.7 50 150 125-Jun-18 18:311.00 g20-Jun-18B8F0153
IS - 13C2-PFDA 57.2 50 150 123-Jun-18 07:181.00 g20-Jun-18B8F0153
IS - 13C2-8:2 FTS 89.9 50 150 125-Jun-18 18:311.00 g20-Jun-18B8F0153
IS - d3-MeFOSAA 68.2 50 150 125-Jun-18 18:311.00 g20-Jun-18B8F0153
IS - d5-EtFOSAA 82.0 50 150 125-Jun-18 18:311.00 g20-Jun-18B8F0153
IS - 13C2-PFUnA 66.3 50 150 125-Jun-18 18:311.00 g20-Jun-18B8F0153
IS - 13C2-PFDoA 76.9 50 150 125-Jun-18 18:311.00 g20-Jun-18B8F0153
IS - 13C2-PFTeDA 67.5 50 150 125-Jun-18 18:311.00 g20-Jun-18B8F0153
Work Order 1800935 Page 28 of 35

Name:
Project: Date Collected:
Client Data
Lapeer
Sample ID: WWTPSL0100180509N
Matrix:
Laboratory Data
Lab Sample: 1800935-06
VAL - PFAS
% Solids:
Merit Laboratories, Inc.
7.78
Column: BEH C18Solid
09-May-18 15:45 Date Received: 12-May-18 09:57
Location: WWTP-Centrifuge
Analyte Conc. (ng/g ) Qualifiers Analyzed DilutionLOD LOQDL Batch Extracted Samp SizeCAS Number
PFBA 3.51ND 14.16 8.32 25-Jun-18 18:41B8F0153 3.09 g20-Jun-18375-22-4
PFPeA 3.515.82 J 14.16 8.32 25-Jun-18 18:41B8F0153 3.09 g20-Jun-182706-90-3
PFBS 3.51ND 14.16 8.32 25-Jun-18 18:41B8F0153 3.09 g20-Jun-18375-73-5
4:2 FTS 3.51ND 14.16 8.32 25-Jun-18 18:41B8F0153 3.09 g20-Jun-18757124-72-4
PFHxA 3.5113.2 14.16 8.32 25-Jun-18 18:41B8F0153 3.09 g20-Jun-18307-24-4
PFPeS 3.51ND 14.16 8.32 25-Jun-18 18:41B8F0153 3.09 g20-Jun-182706-91-4
PFHpA 3.5115.4 14.16 8.32 25-Jun-18 18:41B8F0153 3.09 g20-Jun-18375-85-9
PFHxS 3.51ND 14.16 8.32 25-Jun-18 18:41B8F0153 3.09 g20-Jun-18355-46-4
6:2 FTS 3.517.41 J 14.16 8.32 23-Jun-18 07:49B8F0153 3.09 g20-Jun-1827619-97-2
PFOA 3.514.34 J 14.16 8.32 25-Jun-18 18:41B8F0153 3.09 g20-Jun-18335-67-1
PFHpS 3.51ND 14.16 8.32 25-Jun-18 18:41B8F0153 3.09 g20-Jun-18375-92-8
PFNA 3.51ND 14.16 8.32 25-Jun-18 18:41B8F0153 3.09 g20-Jun-18375-95-1
PFOSA 3.51ND 14.16 8.32 25-Jun-18 18:41B8F0153 3.09 g20-Jun-18754-91-6
PFOS 3.51161 14.16 8.32 25-Jun-18 18:41B8F0153 3.09 g20-Jun-181763-23-1
PFDA 3.513.94 J 14.16 8.32 23-Jun-18 07:49B8F0153 3.09 g20-Jun-18335-76-2
8:2 FTS 3.51ND 14.16 8.32 25-Jun-18 18:41B8F0153 3.09 g20-Jun-1839108-34-4
PFNS 5.95ND 16.24 8.32 25-Jun-18 18:41B8F0153 3.09 g20-Jun-1868259-12-1
MeFOSAA 3.515.89 J 14.16 8.32 25-Jun-18 18:41B8F0153 3.09 g20-Jun-182355-31-9
EtFOSAA 3.51ND 14.16 8.32 25-Jun-18 18:41B8F0153 3.09 g20-Jun-182991-50-6
PFUnA 3.51ND 14.16 8.32 25-Jun-18 18:41B8F0153 3.09 g20-Jun-182058-94-8
PFDS 3.51ND 14.16 8.32 25-Jun-18 18:41B8F0153 3.09 g20-Jun-18335-77-3
PFDoA 3.51ND 14.16 8.32 25-Jun-18 18:41B8F0153 3.09 g20-Jun-18307-55-1
PFTrDA 3.51ND 14.16 8.32 25-Jun-18 18:41B8F0153 3.09 g20-Jun-1872629-94-8
PFTeDA 3.51ND 14.16 8.32 25-Jun-18 18:41B8F0153 3.09 g20-Jun-18376-06-7
Labeled Standards % Recovery Limits Qualifiers Analyzed DilutionType Batch Extracted Samp Size
IS - 13C3-PFBA 87.9 50 150 125-Jun-18 18:41B8F0153 20-Jun-18 3.09 g
IS - 13C3-PFPeA 83.5 50 150 125-Jun-18 18:41B8F0153 20-Jun-18 3.09 g
IS - 13C3-PFBS 91.7 50 150 125-Jun-18 18:41B8F0153 20-Jun-18 3.09 g
IS - 13C2-4:2 FTS 80.6 50 150 125-Jun-18 18:41B8F0153 20-Jun-18 3.09 g
IS - 13C2-PFHxA 80.5 50 150 125-Jun-18 18:41B8F0153 20-Jun-18 3.09 g
IS - 13C4-PFHpA 90.1 50 150 125-Jun-18 18:41B8F0153 20-Jun-18 3.09 g
IS - 18O2-PFHxS 84.5 50 150 125-Jun-18 18:41B8F0153 20-Jun-18 3.09 g
IS - 13C2-6:2 FTS 85.3 50 150 123-Jun-18 07:49B8F0153 20-Jun-18 3.09 g
IS - 13C2-PFOA 82.4 50 150 125-Jun-18 18:41B8F0153 20-Jun-18 3.09 g
IS - 13C5-PFNA 87.7 50 150 125-Jun-18 18:41B8F0153 20-Jun-18 3.09 g
IS - 13C8-PFOSA 55.0 50 150 125-Jun-18 18:41B8F0153 20-Jun-18 3.09 g
IS - 13C8-PFOS 85.2 50 150 125-Jun-18 18:41B8F0153 20-Jun-18 3.09 g
IS - 13C2-PFDA 70.7 50 150 123-Jun-18 07:49B8F0153 20-Jun-18 3.09 g
Work Order 1800935 Page 29 of 35

Name:
Project: Date Collected:
Client Data
Lapeer
Sample ID: WWTPSL0100180509N
Matrix:
Laboratory Data
Lab Sample: 1800935-06
VAL - PFAS
% Solids:
Merit Laboratories, Inc.
7.78
Column: BEH C18Solid
09-May-18 15:45 Date Received: 12-May-18 09:57
Location: WWTP-Centrifuge
Labeled Standards % Recovery Limits Qualifiers Analyzed DilutionType Batch Extracted Samp Size
IS - 13C2-8:2 FTS 104 50 150 125-Jun-18 18:41B8F0153 20-Jun-18 3.09 g
IS - d3-MeFOSAA 39.2 50 150 H 125-Jun-18 18:41B8F0153 20-Jun-18 3.09 g
IS - d5-EtFOSAA 43.4 50 150 H 125-Jun-18 18:41B8F0153 20-Jun-18 3.09 g
IS - 13C2-PFUnA 73.1 50 150 125-Jun-18 18:41B8F0153 20-Jun-18 3.09 g
IS - 13C2-PFDoA 79.2 50 150 125-Jun-18 18:41B8F0153 20-Jun-18 3.09 g
IS - 13C2-PFTeDA 55.4 50 150 125-Jun-18 18:41B8F0153 20-Jun-18 3.09 gThe results are reported in dry weight.
The sample size is reported in wet weight.
Results reported to the DL.
DL - Detection Limit When reported, PFHxS, PFOA, PFOS, MeFOSAA and EtFOSAA include both
linear and branched isomers. Only the linear isomer is reported for all other
analytes.
LOD - Limit of Detection
LOQ - Limit of quantitation
Work Order 1800935 Page 30 of 35
DATA QUALIFIERS & ABBREVIATIONS B This compound was also detected in the method blank Conc. Concentration D Dilution DL Detection limit E The associated compound concentration exceeded the calibration range of
the instrument H Recovery and/or RPD was outside laboratory acceptance limits I Chemical Interference J The amount detected is below the Reporting Limit/LOQ LOD Limits of Detection LOQ Limits of Quantitation M Estimated Maximum Possible Concentration (CA Region 2 projects only) NA Not applicable ND Not Detected Q Ion ratio outside of 70-130% of Standard Ratio. (DOD PFAS projects only) TEQ Toxic Equivalency U Not Detected (specific projects only) * See Cover Letter Unless otherwise noted, solid sample results are reported in dry weight. Tissue samples are reported in wet weight.
Work Order 1800935 Page 31 of 35

CERTIFICATIONS
Accrediting Authority Certificate Number Alaska Department of Environmental Conservation 17-013
Arkansas Department of Environmental Quality 17-015-0
California Department of Health – ELAP 2892
DoD ELAP - A2LA Accredited - ISO/IEC 17025:2005 3091.01
Florida Department of Health E87777-18
Hawaii Department of Health N/A
Louisiana Department of Environmental Quality 01977
Maine Department of Health 2016026
Minnesota Department of Health 1322288
New Hampshire Environmental Accreditation Program 207717
New Jersey Department of Environmental Protection CA003
New York Department of Health 11411
Oregon Laboratory Accreditation Program 4042-008
Pennsylvania Department of Environmental Protection 014
Texas Commission on Environmental Quality T104704189-17-8
Virginia Department of General Services 9077
Washington Department of Ecology C584
Wisconsin Department of Natural Resources 998036160
Current certificates and lists of licensed parameters are located in the Quality Assurance office and are available upon request.
Work Order 1800935 Page 32 of 35

Work Order 1800935 Page 33 of 35

Work Order 1800935 Page 34 of 35

Work Order 1800935 Page 35 of 35