evaluation of china’s energy-saving and emission-reduction
TRANSCRIPT
Energy Policy, Volume 39, Issue 4, April 2011, Pages 2165-2178
1
Assessment of China’s Energy-Saving and Emission-Reduction Accomplishments and Opportunities During the 11th Five Year Plan
Lynn Price, Mark D. Levine, Nan Zhou, David Fridley, Nathaniel Aden, Hongyou Lu,
Michael McNeil, Nina Zheng, Yining Qina and Ping Yowargana
b
a
China Energy Group, Energy Analysis Department, Environmental Energy Technologies
Division, Lawrence Berkeley National Laboratory, 1 Cyclotron Road, MS 90R4000,
Berkeley, CA 94720, United States b
Azure International, Suite H, Floor 6, Oriental Kenzo, 48 Dongzhimenwai Dajie, Dong
Cheng District, Beijing, 100027, China
Abstract
From 1980 to 2002, China experienced a 5% average annual reduction in energy
consumption per unit of gross domestic product (GDP). With a dramatic reversal of this
historic relationship, energy intensity increased 5% per year during 2002-2005. China‘s 11th
Five Year Plan (FYP) set a target of reducing energy intensity by 20% by 2010. This paper
assesses selected policies and programs that China has instituted to fulfill the national goal,
finding that China made substantial progress and many of the energy-efficiency programs
appear to be on track to meet – or in some cases exceed – their energy-saving targets. Most of
the Ten Key Projects, the Top-1000 Program, and the Small Plant Closure Program will meet
or surpass the 11th FYP savings goals. China‘s appliance standards and labeling program has
become very robust. China has greatly enhanced its enforcement of new building energy
standards but energy-efficiency programs for buildings retrofits, as well as the goal of
adjusting China‘s economic structure, are failing. It is important to maintain and strengthen
the existing energy-saving policies and programs that are successful while revising programs
or adding new policy mechanisms to improve the programs that are not on track to achieve
the stated goals.
Keywords: China, energy intensity, energy efficiency programs
Energy Policy, Volume 39, Issue 4, April 2011, Pages 2165-2178
2
1. Introduction
From 1980 to 2002, China experienced a 5% average annual reduction in energy
consumption per unit of gross domestic product (GDP). Government policies and programs
implemented during this period focused on strict oversight of industrial energy use, financial
incentives for energy-efficiency investments, provision of information and other energy-
efficiency services through over 200 energy conservation service centers spread throughout
China, energy-efficiency education and training, and research, development, and
demonstration programs (Sinton et al., 1998; Sinton et al., 1999; Sinton and Fridley, 2000;
Wang et al., 1995). Since energy demand grew less than half as fast as GDP, the need for
investment in energy supply was reduced and capital could be used for other investments that
supported important social goals.
With a dramatic reversal of the historic relationship between energy use and GDP growth,
energy use per unit of GDP increased an average of 5% per year during the period 2002-2005
(NBS, various years).1 Senior members of the government called on China to reduce energy
intensity by 20% in five years in order to regain the relationship between energy and GDP
growth experienced during the 1980s and 1990s. China‘s 11th Five Year Plan (FYP), which
covers the period 2006-2010, required all government divisions at different levels to ensure
the achievement of this binding energy conservation target and established specific energy-
efficiency targets for electricity generation, selected industrial processes, appliances, and
transport.
This paper2
provides an assessment of selected policies and programs that China has
instituted in its quest to fulfill the national goal of a 20% reduction in energy intensity by
2010.3 It begins with an overall assessment of the energy use and energy savings achieved
through 2008. Next, the relative contributions of activity increases and energy intensity
improvements are assessed. Specific policies are then evaluated in terms of energy savings
and accomplishment of stated policy goals. Where applicable, Chinese policies and programs
1Based on NBS official GDP and energy values prior to the 2009 revision.
2 This paper is based upon a larger report (Levine et al., 2010) available here:
http://china.lbl.gov/sites/china.lbl.gov/files/LBNL_3385E.Ace_Study_Report_FINAL.pdf. This work was
supported by the China Sustainable Energy Program of the Energy Foundation through the U.S. Department of
Energy under Contract No. DE-AC02-05CH11231. We also greatly appreciate the guidance that has been
provided by Hu Min of CSEP, Qi Ye (formerly of CSEP), as well as He Jiankun and Zhang Xiliang and their
colleagues at Tsinghua University. We also thank Martin Joerss, August Wu, Jian Sun, Haimeng Zhang, and
Sabine Wu of McKinsey & Company for their thoughtful discussions during preparation of this report. The
report could not have been written without the information provided to us through numerous interviews which
are referenced throughout the report. We greatly appreciate the time the interviewees spent with us to provide
background information on China‘s various energy-efficiency policies and programs. We greatly appreciate the
reviewer comments that were provided on the larger report by Qi Ye, Distinguished Professor of Environmental
Policy and Management, School of Public Policy and Management, Tsinghua University; Li Minghui, Post
Ph.D. Assistant Researcher, Institute of Energy, Environment and Economy, Tsinghua University; Jennifer
Morgan, Director, Climate and Energy Program, World Resources Institute; Deborah Seligsohn, Principal
Advisor, China Climate and Energy Program, World Resources Institute; Robert Taylor formerly of the World
Bank and now an independent consultant; and Bo Shen formerly of Natural Resources Defense Council and
now a member of LBNL‘s China Energy Group. Finally, we would like to thank our colleagues and visiting
researchers in the China Energy Group at LBNL for their thoughtful review and comments, especially Tian
Zhiyu of China‘s Energy Research Institute, Ke Jing of Shandong University, and Stephanie Ohshita, Associate
Professor in the Department of Environmental Science at the University of San Francisco who is currently on
sabbatical working with the China Energy Group at LBNL. 3 It is noted that the goal was originally announced as ―20% more or less‖ (20%左右).
Energy Policy, Volume 39, Issue 4, April 2011, Pages 2165-2178
3
are compared to similar programs found in other countries. Finally, recommendations
regarding possible improvements to the current policies and programs are provided and
additional recommendations are made for possible energy-saving activities in the 12th
FYP.
2. Methodology
This evaluation began with an assessment of the overall energy savings attributed to the 11th
FYP during 2006-2008. A baseline was developed as well as estimates of savings from
individual policies and programs. Next, annual energy savings were decomposed to
understand the relative contributions of structural change and energy efficiency. Finally,
individual programs or policies were evaluated to assess their overall energy savings and to
determine whether they are meeting their stated goals.
To assess the impact of energy-saving policies and programs that were implemented during
the 11th
FYP period, it is necessary to estimate the level of energy consumption that would
have occurred in China without these efforts. This so-called ―counterfactual baseline‖ can
only be estimated since it describes a situation that did not happen – in this case, energy use if
China had not adopted its 20% intensity reduction target. The analysis estimated the
difference in actual energy use and the energy use of a case in which the 2005 energy
intensity (energy use/unit of GDP) is assumed to remain constant in 2006, 2007, and 2008.
This 2005 intensity baseline was then compared to both energy savings as reported by official
announcements and evaluations and to program- or policy-specific evaluations undertaken as
part of this study to determine the savings attributable to the 11th
FYP programs versus the
savings that would have occurred in the absence of these programs. Energy savings4 and CO2
emissions reductions5 from programs and policies are reported both as year-to-year annual
savings and as annual cumulative incremental savings. Annual cumulative incremental
savings are defined as the savings from the previous year added to the savings of the current
year.6
4 Energy use and energy savings are reported in Chinese units of standard coal equivalent (sce); values are
typically expressed as metric tons of coal equivalent (tce) and million metric tons of coal equivalent (Mtce). One
tce equals 29.27 gigajoules (GJs) and 27.78 million British thermal units (MBtus). Energy use and energy
savings are reported in both final (site) and primary (source) values that reflect electricity conversion
efficiencies as well as transmission and distribution losses. To convert electricity to a final (site) coal equivalent
value, the conversion factor of 0.1229 kilogram coal equivalent (kgce)/kilowatt hour (kWh) is used. To convert
electricity to a primary (source) coal equivalent value, the conversion factor of 0.404 kgce/kWh is used.
Transmission and distribution (T&D) losses for China‘s power grid are 7.55% (Kahrl and Roland-Holst, 2006),
while average net generation efficiency of fossil fuel-fired power plants in 2009 is 35.20% (NBS, 2008). The
national average efficiency of thermal power generation including the T&D loss is 32.55%. Therefore, the
actual conversion coefficient from final to primary electricity is 3.07, which would result in lower primary
electricity values than those calculated using 0.404 kgce/kWh. 5 CO2 emissions are expressed in kilotonnes of CO2. The conversion factors used for calculating CO2 emissions
from energy consumption are taken from the 2006 Intergovernmental Panel on Climate Change Guidelines for
National Greenhouse Gas Inventories (IPCC, 2006). The emission factor for grid electricity is assumed to be
0.85305 kg CO2/kWh (NBS, 2007). 6 For example, the savings of 20 Mtce in 2006 from a hypothetical program are added to the savings of 40 Mtce
realized in 2007, for an annual cumulative incremental savings of 60 Mtce in 2007 since the 20 Mtce saved in
2006 are still not being consumed (or emitted) in 2007. In 2008, the annual cumulative incremental savings are
40 Mtce saved in 2008 added to the 40 Mtce saved in 2007 and the 20 Mtce saved in 2006 for a total annual
cumulative incremental savings of 100 Mtce. It can be argued that the cumulative program savings in 2008 are
20 Mtce for 2006 added to 60 Mtce for 2007 and 100 Mtce for 2008, but this method of adding the savings is
not adopted for this analysis.
Energy Policy, Volume 39, Issue 4, April 2011, Pages 2165-2178
4
The policy evaluation in this paper is conducted in three steps. First, the policy or program is
described, the stated goals are explained, and reported results to date are identified. Second, a
quantitative evaluation is made in which a baseline for the specific policy or program is
developed and energy savings are calculated from the baseline. Third, a qualitative evaluation
is undertaken in which the current level of progress is compared to the stated policy or
program goals, including an evaluation of whether the program components were carried out
successfully and whether the program savings are in line with stated goals. If applicable, the
policy or program implementation is then compared to international ―best practice‖ to
determine whether specific elements were undertaken in a manner consistent with programs
found in other countries.
3. Assessment of Energy Use and Energy Savings During the 2006-2008 Period
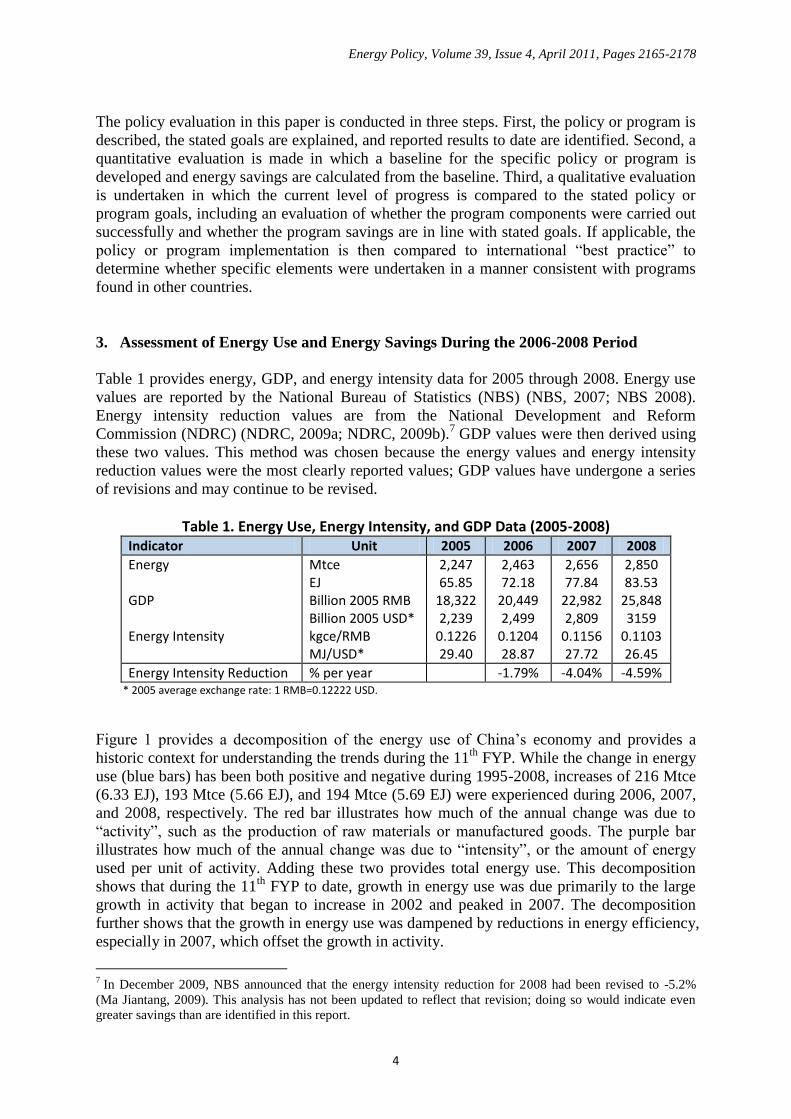
Table 1 provides energy, GDP, and energy intensity data for 2005 through 2008. Energy use
values are reported by the National Bureau of Statistics (NBS) (NBS, 2007; NBS 2008).
Energy intensity reduction values are from the National Development and Reform
Commission (NDRC) (NDRC, 2009a; NDRC, 2009b).7 GDP values were then derived using
these two values. This method was chosen because the energy values and energy intensity
reduction values were the most clearly reported values; GDP values have undergone a series
of revisions and may continue to be revised.
Table 1. Energy Use, Energy Intensity, and GDP Data (2005-2008) Indicator Unit 2005 2006 2007 2008
Energy GDP Energy Intensity
Mtce EJ Billion 2005 RMB Billion 2005 USD* kgce/RMB MJ/USD*
2,247 65.85
18,322 2,239
0.1226 29.40
2,463 72.18
20,449 2,499
0.1204 28.87
2,656 77.84
22,982 2,809
0.1156 27.72
2,850 83.53
25,848 3159
0.1103 26.45
Energy Intensity Reduction % per year -1.79% -4.04% -4.59% * 2005 average exchange rate: 1 RMB=0.12222 USD.
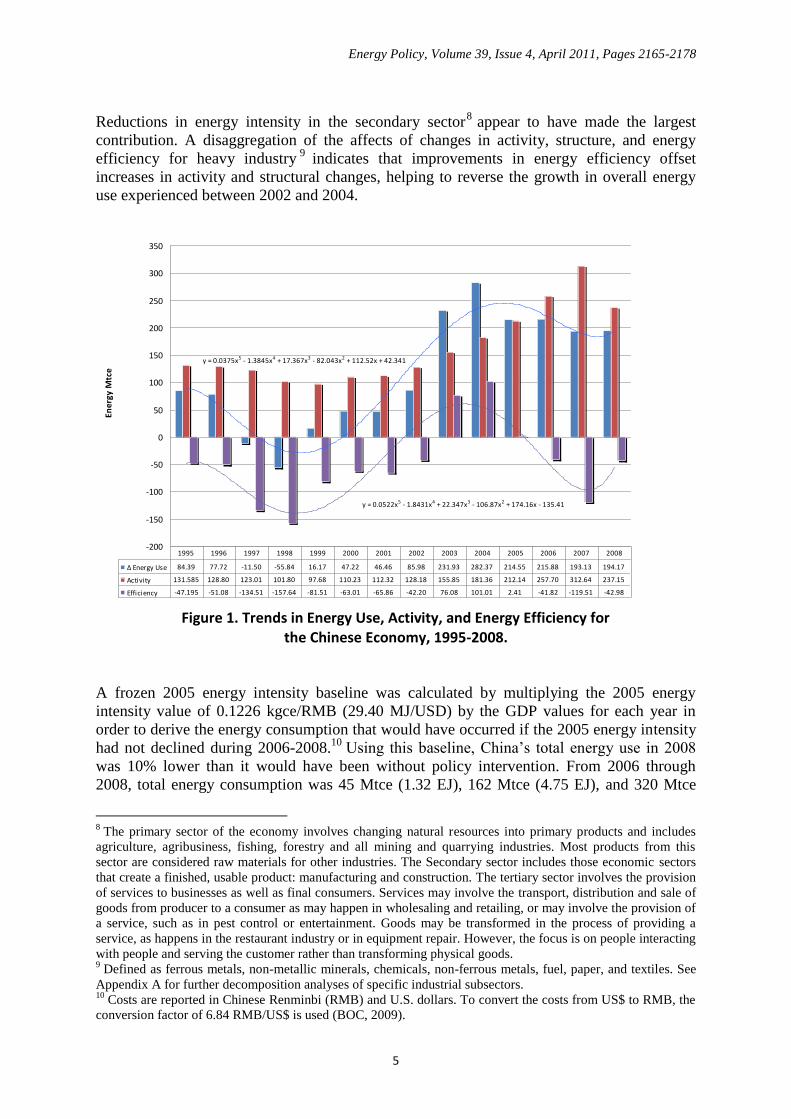
Figure 1 provides a decomposition of the energy use of China‘s economy and provides a
historic context for understanding the trends during the 11th
FYP. While the change in energy
use (blue bars) has been both positive and negative during 1995-2008, increases of 216 Mtce
(6.33 EJ), 193 Mtce (5.66 EJ), and 194 Mtce (5.69 EJ) were experienced during 2006, 2007,
and 2008, respectively. The red bar illustrates how much of the annual change was due to
―activity‖, such as the production of raw materials or manufactured goods. The purple bar
illustrates how much of the annual change was due to ―intensity‖, or the amount of energy
used per unit of activity. Adding these two provides total energy use. This decomposition
shows that during the 11th
FYP to date, growth in energy use was due primarily to the large
growth in activity that began to increase in 2002 and peaked in 2007. The decomposition
further shows that the growth in energy use was dampened by reductions in energy efficiency,
especially in 2007, which offset the growth in activity.
7 In December 2009, NBS announced that the energy intensity reduction for 2008 had been revised to -5.2%
(Ma Jiantang, 2009). This analysis has not been updated to reflect that revision; doing so would indicate even
greater savings than are identified in this report.
Energy Policy, Volume 39, Issue 4, April 2011, Pages 2165-2178
5
Reductions in energy intensity in the secondary sector8 appear to have made the largest
contribution. A disaggregation of the affects of changes in activity, structure, and energy
efficiency for heavy industry9
indicates that improvements in energy efficiency offset
increases in activity and structural changes, helping to reverse the growth in overall energy
use experienced between 2002 and 2004.
Figure 1. Trends in Energy Use, Activity, and Energy Efficiency for
the Chinese Economy, 1995-2008.
A frozen 2005 energy intensity baseline was calculated by multiplying the 2005 energy
intensity value of 0.1226 kgce/RMB (29.40 MJ/USD) by the GDP values for each year in
order to derive the energy consumption that would have occurred if the 2005 energy intensity
had not declined during 2006-2008.10
Using this baseline, China‘s total energy use in 2008
was 10% lower than it would have been without policy intervention. From 2006 through
2008, total energy consumption was 45 Mtce (1.32 EJ), 162 Mtce (4.75 EJ), and 320 Mtce
8 The primary sector of the economy involves changing natural resources into primary products and includes
agriculture, agribusiness, fishing, forestry and all mining and quarrying industries. Most products from this
sector are considered raw materials for other industries. The Secondary sector includes those economic sectors
that create a finished, usable product: manufacturing and construction. The tertiary sector involves the provision
of services to businesses as well as final consumers. Services may involve the transport, distribution and sale of
goods from producer to a consumer as may happen in wholesaling and retailing, or may involve the provision of
a service, such as in pest control or entertainment. Goods may be transformed in the process of providing a
service, as happens in the restaurant industry or in equipment repair. However, the focus is on people interacting
with people and serving the customer rather than transforming physical goods. 9 Defined as ferrous metals, non-metallic minerals, chemicals, non-ferrous metals, fuel, paper, and textiles. See
Appendix A for further decomposition analyses of specific industrial subsectors. 10
Costs are reported in Chinese Renminbi (RMB) and U.S. dollars. To convert the costs from US$ to RMB, the
conversion factor of 6.84 RMB/US$ is used (BOC, 2009).
y = 0.0375x5 - 1.3845x4 + 17.367x3 - 82.043x2 + 112.52x + 42.341
y = 0.0522x5 - 1.8431x4 + 22.347x3 - 106.87x2 + 174.16x - 135.41
-200
-150
-100
-50
0
50
100
150
200
250
300
350
Ener
gy M
tce
∆ Energy Use 84.39 77.72 -11.50 -55.84 16.17 47.22 46.46 85.98 231.93 282.37 214.55 215.88 193.13 194.17
Activity 131.585 128.80 123.01 101.80 97.68 110.23 112.32 128.18 155.85 181.36 212.14 257.70 312.64 237.15
Efficiency -47.195 -51.08 -134.51 -157.64 -81.51 -63.01 -65.86 -42.20 76.08 101.01 2.41 -41.82 -119.51 -42.98
1995 1996 1997 1998 1999 2000 2001 2002 2003 2004 2005 2006 2007 2008
Energy Policy, Volume 39, Issue 4, April 2011, Pages 2165-2178
6
(9.38 EJ) less than it would have been if energy intensity of GDP had remained constant. The
cumulative effect of these efficiency improvements has been 527 Mtce (15.45 EJ) less energy
use than would have been required at the 2005 energy intensity level.
This paper provides a detailed assessment of selected Central government-level energy-
saving policies or programs that have been carried out during the 11th
FYP. The programs
reviewed are: Ten Key Projects, Buildings Energy Efficiency, Top-1000 Energy-Consuming
Enterprises Program, Structural Adjustment/Small Plant Closures, and Appliance Standards
and Energy-Efficiency Labels.11
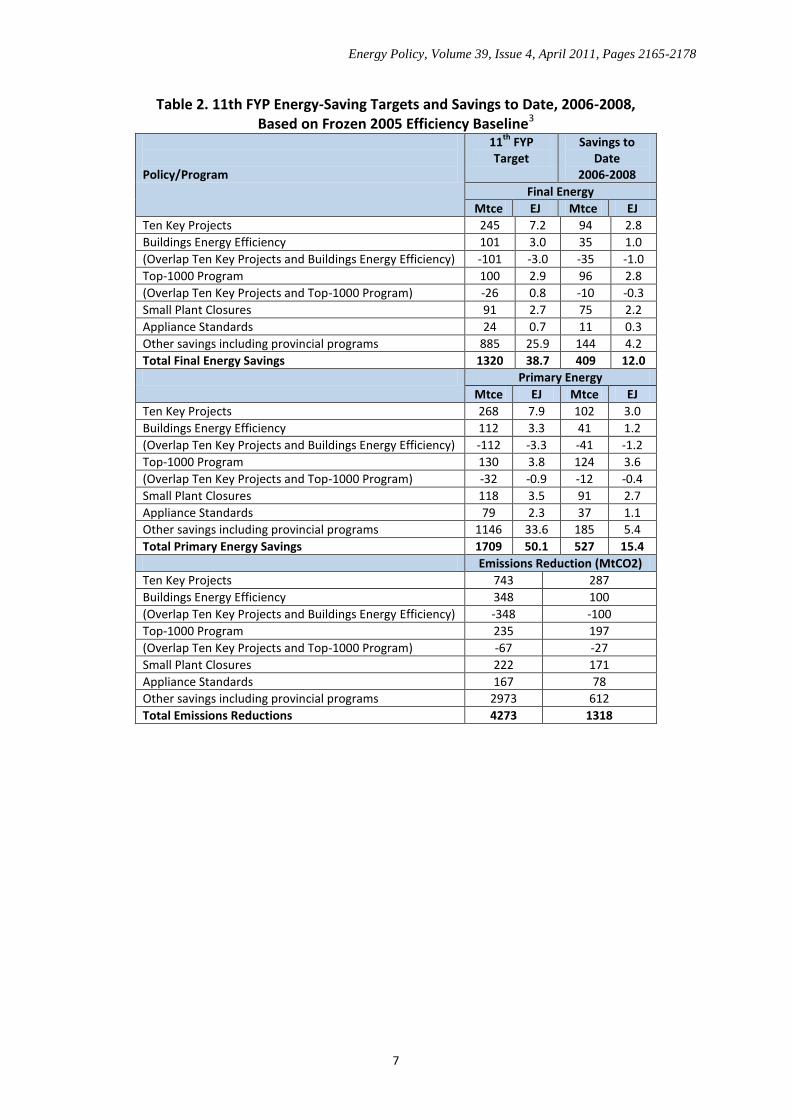
Table 2 provides information on the 11th
FYP targets for the Central government-level energy-saving policies or programs assessed, along with estimates
of the energy savings realized during the 2006-2008 period from these programs. The
selected policies or programs represent the main Central government-level efforts to save
energy in the buildings and industrial sectors; not all energy-saving policies or programs are
covered due to lack of publicly-available information or data, because they began late within
the 11th
FYP period and there are no results to report, or because they focus on sectors of the
economy not covered by this report, such as transportation.
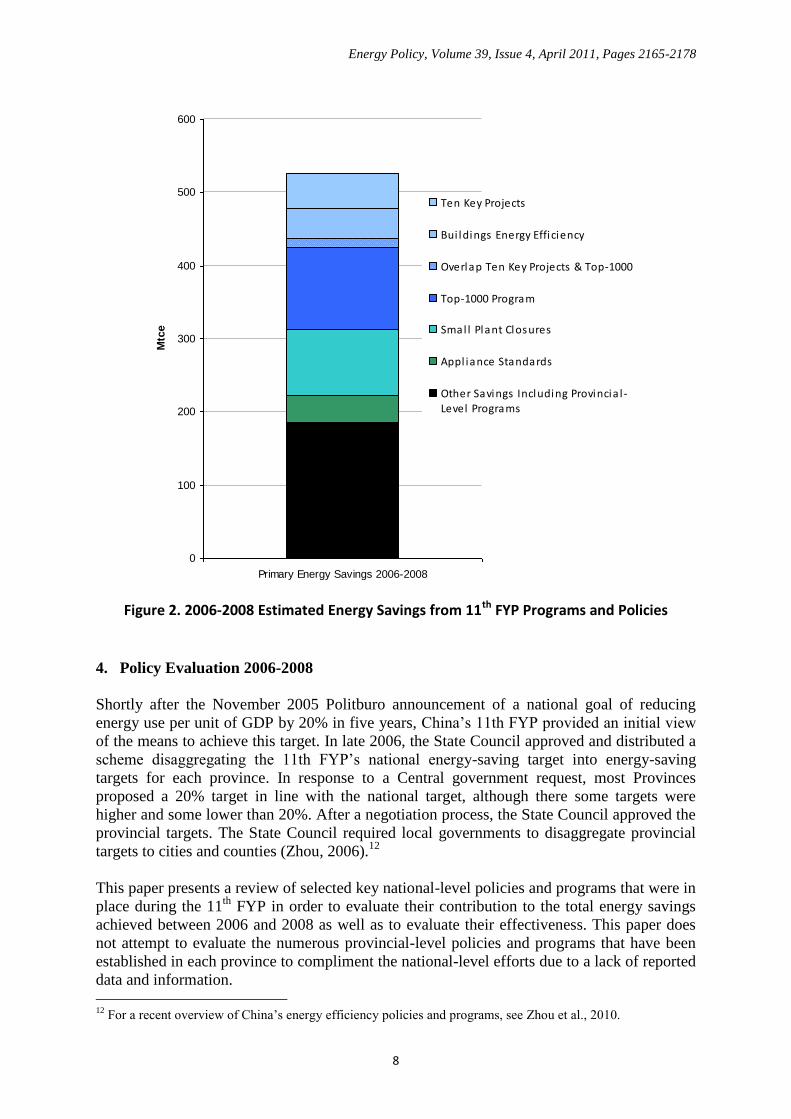
This analysis found that the Ten Key Projects have saved a total of 102 Mtce (2.99 EJ) in
primary energy during 2006-2008. Within the Ten Key Projects, buildings energy efficiency
efforts are estimated to have saved 41 Mtce (1.20 EJ). The Top-1000 Program is estimated to
have saved 124 Mtce (3.63 EJ) during this period. Since the Ten Key Projects includes three
project types that have been adopted by Top-1000 enterprises, the potential overlap between
the Ten Key Projects and Top-1000 Program was estimated to be 12 Mtce (0.35 EJ). This
analysis further found that the small plant closures have resulted in savings of 129 Mtce (3.78
EJ) and that the appliance standards have saved 37 Mtce (1.08 EJ) during 2006-2008. It is
assumed that the remainder of the savings is the result of a variety of other efforts, including
provincial-level energy-savings programs that are not evaluated in this paper due to lack of
reported data and information (see Figure 2).
11
In addition to these programs at the Central government level, there are numerous activities at the provincial
level that are not assessed in this report.
Energy Policy, Volume 39, Issue 4, April 2011, Pages 2165-2178
7
Table 2. 11th FYP Energy-Saving Targets and Savings to Date, 2006-2008, Based on Frozen 2005 Efficiency Baseline3
Policy/Program
11th
FYP Target
Savings to Date
2006-2008
Final Energy
Mtce EJ Mtce EJ
Ten Key Projects 245 7.2 94 2.8
Buildings Energy Efficiency 101 3.0 35 1.0
(Overlap Ten Key Projects and Buildings Energy Efficiency) -101 -3.0 -35 -1.0
Top-1000 Program 100 2.9 96 2.8
(Overlap Ten Key Projects and Top-1000 Program) -26 0.8 -10 -0.3
Small Plant Closures 91 2.7 75 2.2
Appliance Standards 24 0.7 11 0.3
Other savings including provincial programs 885 25.9 144 4.2
Total Final Energy Savings 1320 38.7 409 12.0
Primary Energy
Mtce EJ Mtce EJ
Ten Key Projects 268 7.9 102 3.0
Buildings Energy Efficiency 112 3.3 41 1.2
(Overlap Ten Key Projects and Buildings Energy Efficiency) -112 -3.3 -41 -1.2
Top-1000 Program 130 3.8 124 3.6
(Overlap Ten Key Projects and Top-1000 Program) -32 -0.9 -12 -0.4
Small Plant Closures 118 3.5 91 2.7
Appliance Standards 79 2.3 37 1.1
Other savings including provincial programs 1146 33.6 185 5.4
Total Primary Energy Savings 1709 50.1 527 15.4
Emissions Reduction (MtCO2)
Ten Key Projects 743 287
Buildings Energy Efficiency 348 100
(Overlap Ten Key Projects and Buildings Energy Efficiency) -348 -100
Top-1000 Program 235 197
(Overlap Ten Key Projects and Top-1000 Program) -67 -27
Small Plant Closures 222 171
Appliance Standards 167 78
Other savings including provincial programs 2973 612
Total Emissions Reductions 4273 1318
Energy Policy, Volume 39, Issue 4, April 2011, Pages 2165-2178
8
Figure 2. 2006-2008 Estimated Energy Savings from 11th FYP Programs and Policies
4. Policy Evaluation 2006-2008
Shortly after the November 2005 Politburo announcement of a national goal of reducing
energy use per unit of GDP by 20% in five years, China‘s 11th FYP provided an initial view
of the means to achieve this target. In late 2006, the State Council approved and distributed a
scheme disaggregating the 11th FYP‘s national energy-saving target into energy-saving
targets for each province. In response to a Central government request, most Provinces
proposed a 20% target in line with the national target, although there some targets were
higher and some lower than 20%. After a negotiation process, the State Council approved the
provincial targets. The State Council required local governments to disaggregate provincial
targets to cities and counties (Zhou, 2006).12
This paper presents a review of selected key national-level policies and programs that were in
place during the 11th
FYP in order to evaluate their contribution to the total energy savings
achieved between 2006 and 2008 as well as to evaluate their effectiveness. This paper does
not attempt to evaluate the numerous provincial-level policies and programs that have been
established in each province to compliment the national-level efforts due to a lack of reported
data and information.
12
For a recent overview of China‘s energy efficiency policies and programs, see Zhou et al., 2010.
0
100
200
300
400
500
600
Primary Energy Savings 2006-2008
Mtc
e
Ten Key Projects
Bui ldings Energy Efficiency
Overlap Ten Key Projects & Top-1000
Top-1000 Program
Smal l Plant Closures
Appl iance Standards
Other Savings Including Provincia l -Level Programs
Energy Policy, Volume 39, Issue 4, April 2011, Pages 2165-2178
9
4.1. Ten Key Projects
The Ten Key Energy Conservation Projects (―Ten Key Projects‖) aim to increase energy
efficiency through adjusting and optimizing the economic structure, promoting energy-
efficient technologies, establishing a strict management system, and implementing effective
incentive mechanisms. The Ten Key Projects focus on coal-fired industrial boiler (kiln)
retrofits, district cogeneration projects, waste heat and pressure utilization projects, petroleum
conservation and substitution projects, motors energy efficiency projects, energy system
optimization projects, building energy conservation projects, green lighting projects,
government agency energy conservation projects, and energy saving monitoring and testing
and technology service system building projects. The overall target is to save about 250 Mtce
(7.33 EJ) (excluding oil substitution) by the end of the 11th FYP. In addition, the energy
intensities of major products in key industries are expected to reach or approach the advanced
international level achieved at the beginning of 21st century (NDRC, 2006).
In 2007, total government investment for the Ten Key Projects was about 5.58 billion RMB
(735 million USD)13
. Of this, 800 million RMB (10.5 million USD) was allocated to support
136 sub-projects in waste heat and waste pressure utilization, energy system optimization,
and building energy conservation with an estimated energy saving of 5.2 Mtce (0.15 EJ).
Another 4.78 billion RMB (632 million RMB) was allocated to reward, instead of subsidize,
enterprises that achieved their energy-saving goals (NDRC, 2008). In the first three years of
the 11th FYP, total investment from the central budget and central fiscal funding to support
Ten Key Projects was around 15 billion RMB (1.98 million RMB) (Xu Kexin, 2009). The
savings of Ten Key Projects from 2006-2008 is estimated at around 150 Mtce (4.40 EJ) (Lv
Wenbin, 2009; Cai Zhihua, 2009).
This analysis estimated that if the Ten Key Projects are on track to achieve the 2010 goals,
they would have achieved a total primary energy savings of 102 Mtce (2.99 EJ) during the
2006-2008 period.14
Since it has been reported that the total program has saved 150 Mtce
(4.40 EJ) to date (Lv Wenbin, 2009; Cai Zhihua, 2009), it appears that the program is on
track to meet or surpass the 11th
FYP goal.15
Evaluation of the Ten Key Projects is difficult due to lack of information regarding the
activities and savings undertaken for each of the projects. Some of the savings from industrial
sector projects, such as renovation of coal-fired industrial boilers, waste heat and waste
pressure utilization, and motor system energy efficiency, are most likely also counted in the
savings attributed to the Top-1000 enterprises.16
In addition, targets were not defined or
tracked for the energy system optimization, government procurement, or energy conservation
monitoring and evaluation system projects, making evaluation of these programs impossible.
There are many specific goals outlined within the Ten Key Projects (e.g. to increase the
efficiency of coal-fired industrial boilers by 5%; to install 40 GW of new CHP units, to
increase motor system energy efficiency by 2%, etc.), but it is not obvious how such goals are
tracked or evaluated.
13
2007 average exchange rate 1 RMB = 0.13167 USD. 14
See full LBNL report for details of how the calculations were made. 15
It has been stated that the goal for the Ten Key Projects is an energy savings of 250 Mtce. However, adding
the individual targets results in overall program primary energy savings of 268 Mtce. It is not possible to explain
the discrepancy given the information at hand. 16
Note that the buildings sector energy efficiency measures included in the Ten Key Projects as well as the Top-
1000 Program are discussed in more detail in subsequent sections of this report.
Energy Policy, Volume 39, Issue 4, April 2011, Pages 2165-2178
10
International ―best practice‖ regarding the development and implementation of energy-
efficiency programs involves a multi-step process. Once the program policy objective is
determined, then how those objectives will be met by different programs must be established.
Once the list of programs is identified, then the individual programs must be designed and
implemented. Program monitoring and evaluation, which should be included as a key
program design element, will provide feedback regarding the progress in accomplishment of
the policy objective, the relative success of the various programs implemented to achieve the
policy objective, and the effectiveness of the specific program being evaluated. It appears that
the Ten Key Projects did not follow international best practice in terms of program design,
given the weaknesses in the program described above.
4.2. Buildings Energy Efficiency
Building energy consumption accounts for 25% of total primary energy use in China (Zhou et
al., 2007).17
Total floor area was approximately 58 billion square meters (m2) in 2007.
18 Two
billion m2
of building space have been added each year during the past several years
(TUBERC, 2009). This represents a significant fraction of the construction in the world;
some estimates are as high a 50% of global construction (Xinhua, 2007).
Under the 20% energy intensity reduction target of the 11th
FYP, the energy-saving target for
the building sector is 100 Mtce (2.93 EJ) in primary energy (Wu Y., 2009). The targets
disaggregated by policy are: 63% from strengthening enforcement of building energy
standards, 16% from retrofit of existing buildings and reform of heat supply systems, 11
through energy management systems in large commercial buildings, and 11% from
renewable energy. In addition, the Green Lights program (covered under the Ten Key
Projects) program has a goal of saving 29 TWh. All of these policies are under the
jurisdiction of a centralized Ministry of Housing and Urban-Rural Development (MOHURD)
under the State Council.
The Civil Building Energy Conservation Ordinance was released in 2008 (MOC/MOHURD,
2008). The bill includes regulations in six areas: building energy management systems,
energy efficiency rating systems, energy consumption statistics, energy-saving retrofits,
construction practices, and licensing of new buildings (Wu, 2009). For new buildings, the law
requires full implementation of the standard and tightens it in some regions to 65% reduction
in design heating energy compared to buildings without insulation. For existing buildings, it
requires government buildings (and large public buildings) to take the lead in energy retrofits.
It also promotes the use of renewable energy by encouraging local jurisdictions to support
such applications.
Building standards cover all new construction in urban areas in China. In 2006, just 60% of
new buildings in large urban areas met the energy-saving standard during the design stage
and only 38% at the construction stage. In southern China, the percentages were just 10%
and 8%, respectively (Wu, 2009). Since 2007, MOHURD has put into place a systematic
enforcement program. Inspection and random checking have been widely instituted. Based
17
The building energy consumption data has been adjusted based on the data on energy use that are not
available from official Chinese sources. For details, refer to Zhou and Lin (2008). 18
Official Chinese data for the area of buildings excludes all rural buildings. As a result, almost all analysts
(including Chinese analysts) greatly underestimate this area. We include an estimate of rural building area in our
numbers.
Energy Policy, Volume 39, Issue 4, April 2011, Pages 2165-2178
11
on these efforts, more recent survey results show very much higher implementation rates: in
2008, 98% at the design phase and 81% at construction phase (Qiu, 2009).19
Analyzing
available data modeling building turnover and energy use with and without tighter standards
and/or stronger enforcement, it is estimated that cumulative savings between 2006 and 2008
were 36 Mtce (1.1 EJ) and will reach 90 Mtce (2.6 EJ) by 2010.
For retrofit of existing buildings and reform of heat supply systems, the target for the 11th
FYP is to achieve 20% reduction in heating energy use through metering of heat supply and
pricing reform (14 Mtce, or 0.4 EJ) and through retrofitting 150 million m2 floor area to
realize 50% heating intensity reduction (2 Mtce, or 0.06 EJ) by the end of 2010 (Wu, 2009).
Only 21 million m2 of building area have completed the heat metering reform, accounting for
less than 1% of the targeted floor area. The poor performance in heating supply reform can be
explained by difficulties at the provincial level of developing and implementing policies on
heat metering and associated charges for heat. The retrofit program is meeting the targets for
floor area, but the energy-savings target is not being realized by a considerable margin. The
total estimated primary energy saving in 2008 is only 0.27 Mtce (0.008 EJ), accounting for
merely 14% of the overall target. The greatest barrier to achieving these targets is economic.
Incentives of 50 RMB/m2 (7.2 USD/m
2)20
are provided for retrofits in China‘s severe cold
zone and 45 RMB/ m2 (6.5 USD/m
2) in the cold zone (MOF, 2008). However, a large
percentage of the retrofitted households only installed a heat meter rather than implementing
retrofit measures, because the incentive provided is insufficient to induce the purchase of
energy-efficiency measures (at a typical cost of 300 RMB/m2
or 43 USD/m2).
There are no official data or publications that report savings from the energy management
programs to date. Our estimates of savings from unofficial data on the floor space and energy
intensities of these building types indicate that the target is a reasonable one. Given the
administrative systems in place, the government plans to establish a quota on energy use in
these buildings, substantial incentives from the government, and cost-effectiveness of energy
management systems (in most cases without the subsidy), it is very likely that these targets
will be met or exceeded.
The government has provided a fund to support solar energy demonstration projects. This
fund is for solar technologies that provide heat and electricity. In March 2009, the Ministry of
Finance and MOHURD made available a subsidy specifically targeting the use of
photovoltaics on buildings. The subsidy is 20 RMB/watt peak (Wp) (2.9 USD/Wp)21
, which
will cover nearly half of the investment. Because of the high costs of solar electricity, it is not
likely that the demonstration projects will lead to large-scale commercialization of these
technologies by 2010. Only a small fraction of the 11 Mtce (0.3 EJ) target for renewables is
likely to be met.
In 2008, MOHURD established its building energy-efficiency labeling system with the
purpose of increasing public awareness of building energy consumption and inducing the
building industry to building more efficient buildings. The labeling system will also provide a
quantitative basis for energy-saving assessments that are used in the implementing incentive
policies. Currently, the system is in a pilot stage, with small numbers of demonstration
buildings scattered through China. China has an interesting – and by most criteria – advanced
19
These numbers are derived from surveys carried out under the auspices of MOHURD. However, there is no
explanation of what ―compliance‖ means (e.g., checking of boxes, casual inspection, careful inspection). 20
2008 average rate 1 RMB = 0.14415 USD. 21
2009 average rate 1 RMB = 0.14661 USD.
Energy Policy, Volume 39, Issue 4, April 2011, Pages 2165-2178
12
system for rating energy-efficient new buildings. This system has been demonstrated for a
small number of buildings to date, but its use is expected to grow rapidly as new, ―green‖
buildings are constructed.
The overall energy-saving target set for buildings is ambitious. China has implemented
serious policies and measures to support the target, and some appear to have achieved
significant results, such as the building codes enforcement. Overall, China‘s efforts to reduce
the growth of energy in buildings are much stronger and more significant than that of any
other developing country.
There are, however, major deficiencies. China has no system for systematically gathering
data about energy use in buildings. As a result, it is impossible to know how effective the
policies are in their implementation. Only estimates can be made. There is a need for China to
establish a systematic methodology for gathering baseline data, assessing energy-saving
potentials, measuring energy use, and using this information for establishing targets and
measuring the progress in meeting them. The standards themselves are uncertain in their
impact because behavioral factors often result in buildings using much less energy than is
stipulated in the standards.
Benchmarking is a common way to evaluate a building‘s energy performance. Benchmarking
of energy use provides means to compare a building to other buildings or to national average
or best practice. Such information is of value to many parties: policy makers, building owners,
renters (who pay for energy use), prospective purchasers of buildings, and builders.
Overall, implementation of energy-efficiency standards for new buildings in large urban areas
is on track to meet or exceed the target. Because standards amount to more than 60% of the
overall target for buildings (of 100 Mtce, or 2.93 EJ), they will likely make possible the
overall attainment of the 2010 goal. However, it is not possible to know if this is the case
because of the absence of a system in China to gather and evaluate statistical data on building
characteristics and energy use. Surveys indicate that enforcement of the standards has
improved greatly in the past three years; however, it is not possible to know how much, if any,
heating and cooling energy is saved by the standards. The codes do not apply to rural areas.
4.3. Top-1000 Energy-Consuming Enterprises Program22
One of the key initiatives for realizing China‘s 20% energy intensity reduction goal is the
Top-1000 Energy-Consuming Enterprises program (Top-1000 program) which set energy-
saving targets for China‘s 1000 highest energy-consuming enterprises (defined as those
enterprises from nine industrial sectors that consume 180,000 tce (0.005 EJ) or higher
annually). The Top-1000 program was launched by NDRC, NBS, and other government
agencies in April 2006 (NDRC, 2006c).
The Top-1000 program includes large-scale enterprises in nine major energy-consuming
industries. The goals of the Top-1000 program are to significantly improve the Top-1000
enterprises‘ energy efficiency; reduce unit energy consumption to national advanced level for
all major products; have some enterprises attain either international advanced level or
national leading level; and achieve energy savings of 100 Mtce (2.93 EJ) in the 11th
FYP
period.
22
Some of the material in this section is excerpted from Price et al., 2008a and Price et al., 2009.
Energy Policy, Volume 39, Issue 4, April 2011, Pages 2165-2178
13
The Top-1000 enterprises are expected to establish an energy conservation organization,
formulate energy efficiency goals, establish an energy utilization reporting system, conduct
energy audits, conduct training, formulate an energy conservation plan, adopt energy
conservation incentives, and invest in energy efficiency improvement options. The
enterprises are required to report their energy consumption by fuel quarterly to NBS (NDRC,
2006c).
The national government established the goals of the program and published a list of the Top-
1000 enterprises. The local energy-saving authorities were directed to implement the Top-
1000 program, including the tracking, supervision, and management of the energy-saving
activities of the enterprises. The local authorities were directed to oversee the enterprises in
their energy management, energy auditing, and energy reporting requirements, to improve
their monitoring of the enterprises through audits and sampling, to promote the use of new
mechanisms such as target-setting agreements, encourage enterprises to meet energy saving
targets, and to attain international advanced levels ahead of schedule (NDRC, 2006c).
In September 2007, NDRC and NBS reported that the Top-1000 enterprises had realized
energy savings of 20 Mtce (0.59 EJ) in 2006. In 2008, NDRC reported that the Top-1000
Program enterprises saved 38.17 Mtce (1.1 EJ) in 2007 (Liu Jingru et al., 2009), that the
enterprises invested over 50 billion RMB (6.6 billion USD) in technology innovation, and
implemented over 8,000 energy-saving projects in 2007 (Zhao, 2008). In November 2009,
NDRC announced that the Top-1000 program had reached its target energy savings of 100
Mtce (2.93 EJ) (NDRC, 2009c). 23
Energy use of the Top-1000 Program enterprises only grew at a rate of 6.7% per year
between 2004 and 2006.24
Assuming this rate continues, final energy consumption of the
Top-1000 Program enterprises would grow from 733 Mtce (21.5 EJ) in 2005 to 1016 Mtce
(29.8 EJ) in 2010 under a baseline, business-as-usual scenario.25
Given the baseline scenario,
meeting the program goal means that the Top-1000 enterprises would consume 916 Mtce
(26.8 EJ) (final energy) in 2010. Top-1000 program 2006 energy-related CO2 emissions are
estimated to be 2,43226
MtCO2 based on the fuel share data provided in the 2007 evaluation
report (NDRC and NBS, 2007). Based on the energy consumption projection, the baseline
CO2 emissions for the Top-1000 Program enterprises are projected to grow from 1723
MtCO2 in 2005 to 2388 MtCO2 in 2010. If the program goal is met, energy-related emissions
for the Top-1000 enterprises would be 2153 MtCO2, a cumulative savings of 235 MtCO2.
Due to limited data availability, it is difficult to assess how much of these reported savings
are due to the activities and policies associated with the Top-1000 program and how much
would have occurred in the absence of the program.
The Top-1000 program was based on experience gained over three years through a pilot
program with two steel mills in Shandong Province that relied heavily on European
experiences with voluntary agreement programs (Price, et al., 2005a). The Top-1000 program
23
This announcement was not accompanied by any type of detailed report and thus cannot be evaluated at this
time. 24
Calculated based on 2004 and 2005 actual energy use and 2006 actual energy use plus reported savings. Note
that there were 1008 enterprises in the program in 2004. By 2006, 19 enterprises were added and 29 enterprises
dropped out of the program, resulting in a total of 998 enterprises. 25
Unlike the other programs reviewed in this report, energy use for the Top-1000 program is reported using a
site (final) electricity conversion factor, not a source (primary) value. 26
Using the site (final) electricity conversion factor, this value is 2,432 MtCO2. However, for this report
electricity was converted using the source (primary) value.
Energy Policy, Volume 39, Issue 4, April 2011, Pages 2165-2178
14
was designed quickly in 2006 in support of China‘s 20% energy/GDP reduction goals. As
such, some elements of the program have been designed or implemented differently than in
similar programs in other countries.27
Target-setting typically begins with an assessment of the energy efficiency or GHG
mitigation potential of each industrial facility. In the Top-1000 program, targets were set by
NDRC for each enterprise in order to support the provincial-level targets and to reach the
overall program savings target of 100 Mtce (2.93 EJ). The targets were not based on detailed
assessments of energy-savings potential of each enterprise or each industrial sector. This
approach was taken due to time constraints. The resulting target of 100 Mtce (2.93 EJ) may
not be very ambitious given the energy-intensity of these industries. More detailed
assessments may have identified higher potential energy savings and possibly a more
ambitious goal could have been set for the Top-1000 program.
Energy auditing involves collecting data on all of the major energy-consuming processes
and equipment in a plant as well as documenting specific technologies used in the production
process and identifying opportunities for energy-efficiency improvement. In 2007, the Top-
1000 enterprises undertook energy audits and developed energy action plans outlining how
they expect to meet their energy-saving targets. A number of the Top-1000 enterprises found
this task difficult due to the lack of qualified auditing personnel and needed to hire outside
experts for assistance (Lu, 2006). The audits were often not very detailed, incomplete, did not
analyze the data, or contained useless information (Ma, 2008).
Internationally, programs similar to the Top-1000 program also typically establish a
harmonized set of supporting programs for participating enterprises. Policies typically
include financial incentives, technical assistance, rewards and publicity for enterprises that
reach targets, and sometimes penalties for failure to reach targets (Price et al., 2005).
Supporting policies and programs for the Top-1000 program were not established prior to the
announcement of the program (NDRC, 2006c) although a number of supporting policies have
been established over the three years since the Top-1000 program commenced.
Information dissemination of energy-efficiency guidebooks, databases, software tools, and
industry- or technology-specific energy-efficiency reports is an important component of
energy efficiency programs in many countries (Galitsky et al., 2004). The Top-1000 program
currently has not developed a systematic means for gathering or disseminating energy-
efficiency information sources to the participating enterprises. 28
It is extremely important to establish effective monitoring guidelines that provide an
overview of reporting requirements, how the project‘s savings will be documented, and what
level of accuracy is desired at the beginning of an energy-efficiency or target-setting program.
Ideally, monitoring also includes verification by an independent third party that will validate
the information (Schiller, 2007). In China, NBS is in charge of collecting data from the
enterprises for the Top-1000 program; reporting is directly to NBS online via a website.
Capacity building is needed related to the on-line reporting system, for development of an
27
Some of this discussion is based on material presented in McKane et al., 2007 and Price et al., 2008b. 28
The Top-1000 program did develop materials for a 2-day workshop that was held for the Top-1000
enterprises in five cities throughout China in October 2006. The presentations from that workshop are posted on
the NDRC website: http://hzs.ndrc.gov.cn/jnxd/t20061108_92567.htm The Top-1000 web page on NDRC‘s
website, however, simply provides short news articles reporting on related notices, meetings, and Provincial
activities.
Energy Policy, Volume 39, Issue 4, April 2011, Pages 2165-2178
15
indicator system, for development of standards for boundary setting, and for data analysis.
There is currently little transparency in the data reporting for the Top-1000 Program. To date,
there has only been one officially-released summary report on the progress of the program
(NDRC and NBS, 2007). There is no third party review or verification of the reported results
at the enterprise, sector, provincial, or national level.
Overall, the Top-1000 Enterprises Program appears to be successful. The government has
recently reported that the program has already met its cumulative final energy-saving target
of 100 Mtce (2.93 EJ). The use of energy-saving agreements signed by high-level
representatives from government and the enterprises has been very effective for stimulating
action in the Top-1000 program. With the list of Top-1000 enterprises made public and
promotion of government officials contingent on meeting targets, substantial attention and
resources were directed to the program. Some provinces extended the program to a wider
scope of enterprises.
Due to rapid implementation, program targets were established without detailed assessments.
The program goal represents only 15% of total required energy savings in the 11th FYP, yet
the Top-1000 enterprises represent the highest energy consumption in the economy. A more
ambitious goal likely could have been set based on assessment of potential savings in
industrial sub-sectors.
4.4. Structural Optimization/Small Plant Closures
The 11th
FYP calls for ―a more rational structure of industries, products, and industrial
organization‖ and an increase in the ratio of service sector value-added to total GDP of 3%.
Despite this goal, the share of industrial sector energy use grew from 69% of total energy use
in 2000 to 72% in 2007 (NBS, various years). In addition, the share of GDP attributed to the
secondary sector of the economy29
increased from 45.9% in 2000 to 48.6% in 2007 (NBS,
2007).
Overall, industrial concentration in China is relatively low. Due to market demand and high
prices of energy-intensive products, existing manufacturers continue producing from smaller
facilities. Major Chinese energy-consuming industries are also less active in mergers and
acquisitions For example, in 2006, steel production from the top ten largest iron and steel
enterprises in China represented 34.35% of the total production, which was a decrease from
that of 2005 (35.38%). In 2007, the top 10 steel enterprises accounted for 36.8% of total
crude steel production (Shan and Wang, 2007). At the end of 2007, there were 5,028 cement
enterprises with a total clinker production of 956.3 Mt. The four largest cement enterprises
produced 11.9% of China‘s total clinker production, while the top ten companies produced
19.43%, and the top 60 companies produced 32% (CCA, 2008).
In 2007, China‘s State Council announced a Comprehensive Working Plan of Energy
Conservation and Emission Reduction to accelerate the closing of small plants and outdated
29
The primary sector of the economy involves changing natural resources into primary products and includes
agriculture, agribusiness, fishing, forestry and all mining and quarrying industries. Most products from this
sector are considered raw materials for other industries. The Secondary sector includes those economic sectors
that create a finished, usable product: manufacturing and construction. The tertiary sector involves the provision
of services to businesses as well as final consumers. Services may involve the transport, distribution and sale of
goods from producer to a consumer as may happen in wholesaling and retailing, or may involve the provision of
a service, such as in pest control or entertainment.
Energy Policy, Volume 39, Issue 4, April 2011, Pages 2165-2178
16
capacity in 14 high energy-consumption industries: electric power, iron-making, steel-making,
electrolytic aluminium, ferroalloy, calcium carbide, coking, cement, coal, plate glass, pulp
and paper, alcohol, monosodium glutamate, and citric acid (State Council, 2007). The policy
estimates that the closures will save 118 Mtce (3.46 EJ) and reduce 2.4 Mt of sulfur dioxide
(SO2) by 2010. 30
The amount of capacity that has been closed by the end of 2008 has only been reported for 10
of the 14 sub-sectors (NDRC, 2009a; NDRC, 2009b). In order to determine whether the small
plant closures that occurred during the 2006-2008 period were driven by policy guidance or
would have happened anyway under normal market conditions where smaller, inefficient
facilities are phased out due to higher operating costs or other reasons, data on historical plant
closures of the electric power sector were evaluated to see if the rate of closure increased
during the 11th
FYP.
China started to close small coal-fired power plants during 9th
FYP. Closed capacity peaked
in 1999 with 3,360 MW and capacity closures continued through 2002. However, closure of
small and inefficient power plants stopped completely in 2003-2004, due to power supply
shortages experience in China at that time. Phasing-out small coal-fired plants resumed by
the last year of 10th
FYP in 2005 and began to ramp up quickly in the 11th
FYP, with an
annual average growth rate of closure capacity of 115% from 2005 to 2008. Contrary to the
progress in 9th
FYP and early years of 10th
FYP, with an average closed capacity rate of -4%,
China reversed course and the aggregate closed capacity from 2006-2008 was 34,210 MW.
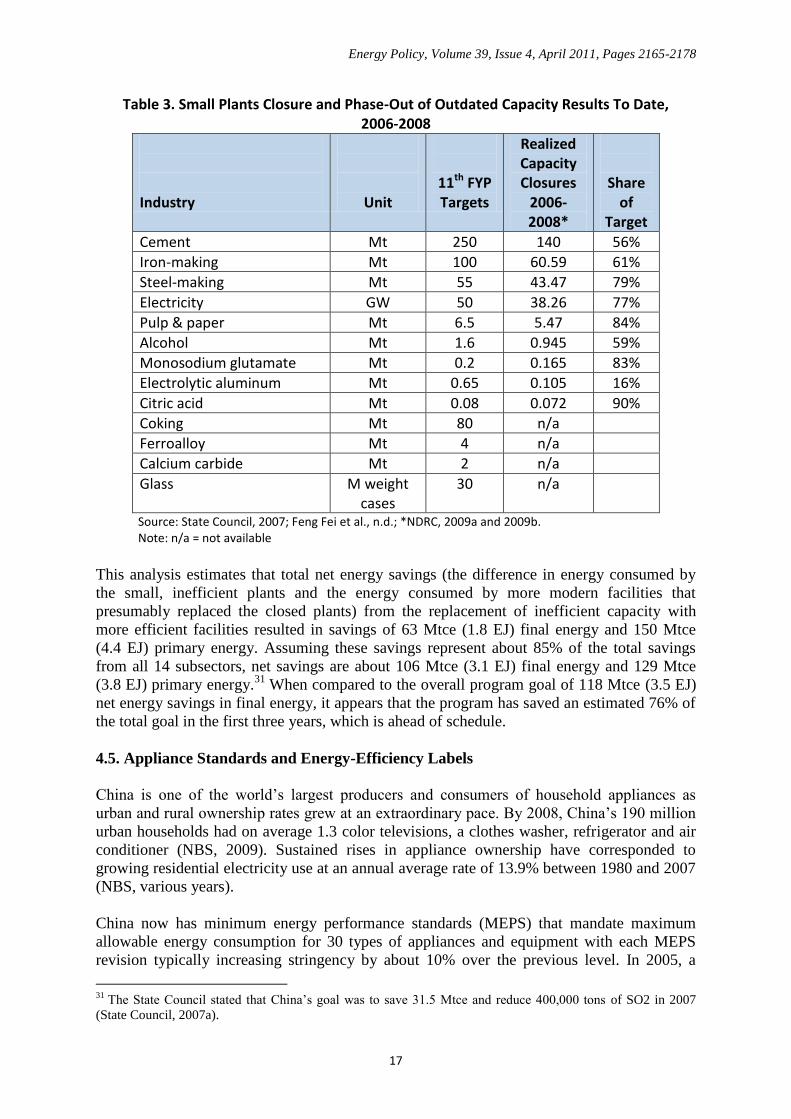
Capacity closures to date have been reported for ten sectors (see Table 3). To be on track,
closures should be at 60% of the target by the end of 2008. Seven of the ten sectors have
reached or surpassed that target, with four sectors significantly ahead of the target. Two other
sectors (cement and alcohol) are nearly at the 60% target, while one sector (electrolytic
aluminium) is significantly below the target, realizing only 16% of the scheduled capacity
closures by the end of 2008. Overall, for the reported sectors, it appears that this program is
on or ahead of schedule to meet the 2010 capacity closure targets.
30
In 2010, the government expanded this program by increasing the targets for sectors that were found to have
more potential (e.g. the 2010 target for the cement industry closures was increased from 50 Mt to 89.83 Mt in
production capacity) and expanding from 13 sectors to 18 sectors by adding copper smelting, zinc smelting, lead
smelting, leather manufacturing, textile printing and dyeing, and the chemical fiber industry (MIIT, 2010).
Energy Policy, Volume 39, Issue 4, April 2011, Pages 2165-2178
17
Table 3. Small Plants Closure and Phase-Out of Outdated Capacity Results To Date, 2006-2008
Industry
Unit
11th FYP Targets
Realized Capacity Closures
2006-2008*
Share of
Target
Cement Mt 250 140 56%
Iron-making Mt 100 60.59 61%
Steel-making Mt 55 43.47 79%
Electricity GW 50 38.26 77%
Pulp & paper Mt 6.5 5.47 84%
Alcohol Mt 1.6 0.945 59%
Monosodium glutamate Mt 0.2 0.165 83%
Electrolytic aluminum Mt 0.65 0.105 16%
Citric acid Mt 0.08 0.072 90%
Coking Mt 80 n/a
Ferroalloy Mt 4 n/a
Calcium carbide Mt 2 n/a
Glass M weight cases
30 n/a
Source: State Council, 2007; Feng Fei et al., n.d.; *NDRC, 2009a and 2009b. Note: n/a = not available
This analysis estimates that total net energy savings (the difference in energy consumed by
the small, inefficient plants and the energy consumed by more modern facilities that
presumably replaced the closed plants) from the replacement of inefficient capacity with
more efficient facilities resulted in savings of 63 Mtce (1.8 EJ) final energy and 150 Mtce
(4.4 EJ) primary energy. Assuming these savings represent about 85% of the total savings
from all 14 subsectors, net savings are about 106 Mtce (3.1 EJ) final energy and 129 Mtce
(3.8 EJ) primary energy.31
When compared to the overall program goal of 118 Mtce (3.5 EJ)
net energy savings in final energy, it appears that the program has saved an estimated 76% of
the total goal in the first three years, which is ahead of schedule.
4.5. Appliance Standards and Energy-Efficiency Labels
China is one of the world‘s largest producers and consumers of household appliances as
urban and rural ownership rates grew at an extraordinary pace. By 2008, China‘s 190 million
urban households had on average 1.3 color televisions, a clothes washer, refrigerator and air
conditioner (NBS, 2009). Sustained rises in appliance ownership have corresponded to
growing residential electricity use at an annual average rate of 13.9% between 1980 and 2007
(NBS, various years).
China now has minimum energy performance standards (MEPS) that mandate maximum
allowable energy consumption for 30 types of appliances and equipment with each MEPS
revision typically increasing stringency by about 10% over the previous level. In 2005, a
31
The State Council stated that China‘s goal was to save 31.5 Mtce and reduce 400,000 tons of SO2 in 2007
(State Council, 2007a).
Energy Policy, Volume 39, Issue 4, April 2011, Pages 2165-2178
18
mandatory categorical energy information label known as the China Energy Label (CEL) was
established to promote consumer awareness and market transformation and currently cover
13 appliances. The CEL includes either three or five categories of efficiency, ranked from 1
(highest) to 3 or 5 (MEPS), and a product‘s rating is based on self-reported energy
consumption data from manufacturers. In December 2007, China launched a ―Home
Appliance Going to the Countryside‖ pilot program that has since been expanded nationwide
to cover ten product categories. This program provides a 13% rebate to rural residents who
purchase selected brands of efficient appliances (Class 1 and/or Class 2 in the CEL) from
qualifying retailers and is primarily funded by the central government (Xinhua, 2009a).
While news sources have reported rural purchases of more than 16 million units of home
appliances since December 2007, the lack of detailed market and sales data precludes in-
depth analysis of the rebate‘s impact on rural market transformation (Xinhua, 2009).
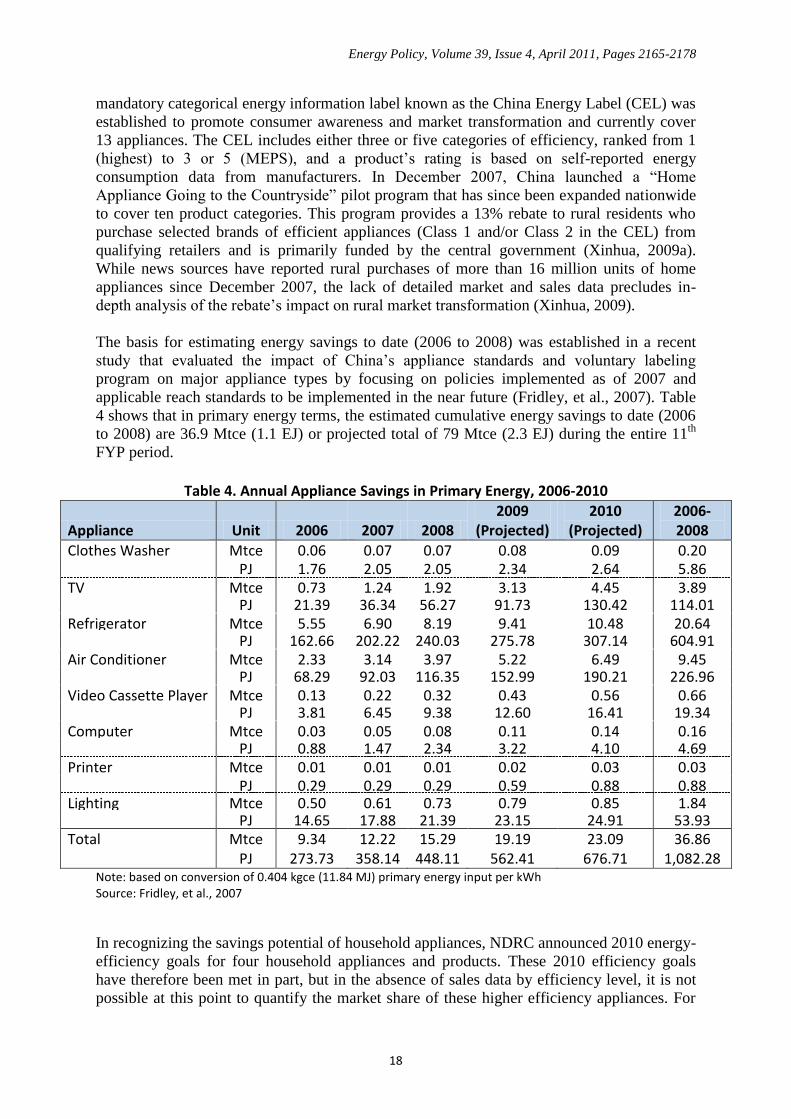
The basis for estimating energy savings to date (2006 to 2008) was established in a recent
study that evaluated the impact of China‘s appliance standards and voluntary labeling
program on major appliance types by focusing on policies implemented as of 2007 and
applicable reach standards to be implemented in the near future (Fridley, et al., 2007). Table
4 shows that in primary energy terms, the estimated cumulative energy savings to date (2006
to 2008) are 36.9 Mtce (1.1 EJ) or projected total of 79 Mtce (2.3 EJ) during the entire 11th
FYP period.
Table 4. Annual Appliance Savings in Primary Energy, 2006-2010
Appliance Unit 2006 2007 2008 2009
(Projected) 2010
(Projected) 2006-2008
Clothes Washer Mtce 0.06 0.07 0.07 0.08 0.09 0.20 PJ 1.76 2.05 2.05 2.34 2.64 5.86 TV Mtce 0.73 1.24 1.92 3.13 4.45 3.89 PJ 21.39 36.34 56.27 91.73 130.42 114.01 Refrigerator Mtce 5.55 6.90 8.19 9.41 10.48 20.64 PJ 162.66 202.22 240.03 275.78 307.14 604.91 Air Conditioner Mtce 2.33 3.14 3.97 5.22 6.49 9.45 PJ 68.29 92.03 116.35 152.99 190.21 226.96 Video Cassette Player Mtce 0.13 0.22 0.32 0.43 0.56 0.66 PJ 3.81 6.45 9.38 12.60 16.41 19.34 Computer Mtce 0.03 0.05 0.08 0.11 0.14 0.16 PJ 0.88 1.47 2.34 3.22 4.10 4.69 Printer Mtce 0.01 0.01 0.01 0.02 0.03 0.03 PJ 0.29 0.29 0.29 0.59 0.88 0.88 Lighting Mtce 0.50 0.61 0.73 0.79 0.85 1.84 PJ 14.65 17.88 21.39 23.15 24.91 53.93 Total
Mtce PJ
9.34 273.73
12.22 358.14
15.29 448.11
19.19 562.41
23.09 676.71
36.86 1,082.28
Note: based on conversion of 0.404 kgce (11.84 MJ) primary energy input per kWh Source: Fridley, et al., 2007
In recognizing the savings potential of household appliances, NDRC announced 2010 energy-
efficiency goals for four household appliances and products. These 2010 efficiency goals
have therefore been met in part, but in the absence of sales data by efficiency level, it is not
possible at this point to quantify the market share of these higher efficiency appliances. For
Energy Policy, Volume 39, Issue 4, April 2011, Pages 2165-2178
19
room air conditioners, refrigerators and household gas water heaters, new standards for the
most efficient classes have met the 2010 efficiency goals. Household gas cookers, however,
remain less efficient than the 2010 target of 60-65%, with the 2008 standard specifying a
minimum thermal efficiency of only 55%.
Recently, the central government has increased efforts to improve enforcement and
monitoring mechanisms for appliance energy-efficiency standards. Begun in 2006, check-
testing targeting refrigerators, room air conditioners and washers from retailers in the major
cities of Guangzhou, Beijing and Hefei found mixed levels of compliance among cities and
model types. A second round undertaken in 2007 found improved compliance with no great
regional variation. These past two years of check-testing have revealed that consistent testing
and monitoring are critical to identifying enforcement weaknesses and improving compliance
with appliance efficiency standards. To date, check testing has involved less than 1% of
product models on the market, and the goal is to achieve regular check testing for 20% of
product models. The goal is ambitious, as China‘s appliance sector remains largely
unconsolidated, with over 250 companies producing over 3000 models of clothes washers
alone. Enforcement thus remains a key issue in the success of China‘s standards and labeling
program as financial, administrative and infrastructure support for the program can be
strengthened. The absence of up-to-date impact evaluations of standards and labeling efforts
and shortage of sales data by efficiency classes in China‘s rapidly evolving appliance market
are other crucial areas of weakness.
Best practice in implementation of standards and labeling includes clear program mandate,
defined methodological approach and sufficient funding and trained personnel for
implementation, monitoring and compliance (Waide, n.d.). A leading example of this is the
U.S. Energy Star voluntary labeling program, which has maintained stringent labeling criteria
by consistently revising its residential and office product specifications to typically only
qualify the top 20-25% most efficient products on the market (Karney, 2007). Moreover,
Energy Star has undertaken a novel approach to accelerate market transformation by creating
linkages to stakeholders across sectors where subsequent rebates and outreach campaigns
have helped influence consumer decision-making. Although China cooperated with Energy
Star in the implementation of its own voluntary energy-efficiency label, an increasing number
of products subject to voluntary labeling specifications have been subsumed within the
mandatory standards program. This in turn decides the timeline of specification development
and revision and reduces the flexibility of voluntary label revisions to reflect product
efficiency changes in China‘s evolving market.
Best practice program evaluations to identify weaknesses in program design and
implementation and to help measure the program‘s overall impact can include both process
and impact evaluations (Vine, et al., 2001). International best practice examples include EU‘s
comprehensive evaluation of its energy labeling program two years after the program
implementation in 1992 and the U.S. Energy Star‘s evaluation studies. While China has made
clear progress in launching compliance check-testing and recent round-robin testing,
monitoring and verification of product performance relative to MEPS and energy labels are
inadequate as even the check-testing sample sizes were too small and shortage of resources
and funding in monitoring and evaluation efforts remain. Besides small staff size of only six
full-time staff members, the recently established China Energy Label Center also does not
have a regular budget to support auditing or verification testing programs (Zhou et al., 2008).
Energy Policy, Volume 39, Issue 4, April 2011, Pages 2165-2178
20
5. Findings and Recommendations
5.1. Overall Findings
China made substantial progress toward its goal of achieving 20% energy intensity reduction
from 2006 to 2010. It seems likely that the target will be met or nearly met. It is noted that
the goal was originally announced as ―20% more or less‖ (―20%左右‖). Considering that
energy use per unit of GDP had increased between 2002 and 2006, the achievements of the
20% intensity reduction program are substantial. The success in meeting the 20% intensity
target through to date is due to increases in energy efficiency or conservation; these increases
have been sufficient to overcome the lack of success in achieving structural change.
Evaluating individual energy-savings programs and policies to determine the magnitude of
their contributions has been difficult due to lack of data. In most cases, the results are based
on calculated savings from known details of the programs (appliance standards), surveys
(enforcement of building codes), or statements by government officials indicating the
magnitude of savings without documentary sources. In spite of the limitations of these
approaches, the results documented in this report should be viewed as meaningful albeit
imprecise; the overall achievements in pursuing the energy intensity goal argue that these
programs have been successful.
This assessment found that many of the energy-efficiency programs implemented during the
11th FYP in support of China‘s 20% energy/GDP reduction goal appear to be on track to
meet – or in some cases even exceed – their energy-saving targets. Based on information
gathered through interviews, reports, and websites, it appears that most of the Ten Key
Projects, the Top-1000 Program, and the Small Plant Closure Program are on track to meet or
surpass the 11th FYP savings goals. China‘s appliance standards and labeling program, which
was established prior to the 11th FYP, has become very robust during the 11th FYP period, as
illustrated by the development of new or revised standards that have met three out of four of
the Medium to Long-term Energy Conservation Plan’s 2010 energy-efficiency targets. China
has greatly enhanced enforcement of new building energy standards with calculated impacts
that are on track to meet the goals. However, energy-efficiency programs for buildings
retrofits, as well as the goal of adjusting China‘s economic structure to reduce the share of
energy consumed by industry, do not appear to be on track to meet the stated goals.
It was difficult to adequately assess the progress of the energy-efficiency programs
implemented in support of the 11th FYP in detail due to lack of publicly-available systematic
reporting and monitoring of these programs. In addition, the information that is available is
often reported in units that are not clearly defined (e.g. whether electricity is accounted for at
the site, 0.1229 kgce/kWh (3.6 MJ/kWh), or source, 0.404 kgce/kWh (11.8 MJ/kWh), value),
programmatic targets are not clearly delineated as to whether they represent annual or
cumulative savings goals through 2010, and conflicting and difficult to interpret information
is provided through interviews, reports, and websites. Further, the overall 20% energy/GDP
target is a relative target (ratio of energy to economic output), while most of the targets for
the individual programs are absolute targets (e.g. savings of 100 Mtce (2.93 EJ) by 2010 for
the Top-1000 program), making it difficult to relate the individual programs to the overall
energy intensity goal.
Energy Policy, Volume 39, Issue 4, April 2011, Pages 2165-2178
21
5.2. Recommendations
Maintain existing policies and programs that are successful
It is important to maintain and strengthen the successful existing energy-saving policies and
programs established under the 11th
FYP, including setting an overall energy-savings goal.
Significant effort was invested in gathering and analyzing data, training personnel to track
and manage energy use, developing implementation guidelines, and creating financial
incentives for energy saving. These efforts can yield further benefits and should be continued,
rather than moving to new policies and programs in the 12th
FYP.
Add explicit mechanisms to promote structural change
In the 11th
FYP, the main mechanism for promoting structural change was phasing out
obsolete production capacity which proved to be insufficient to achieve the desired increase
in the economic share of the service sector, or a decrease in the economic share of industry.
Additional mechanisms are needed to address structural change in a stronger and more
explicit manner. Mechanisms could include further energy pricing reform, control of market
access, and further change in tax policies on energy-intensive products and industries. For
example, tiered energy pricing—whereby rates are higher for more consumption—would
encourage consumers to use less. Decoupling utility revenues from electricity sales can
encourage utilities to promote efficiency rather than consumption. Restricting permits, or
increasing taxes, for energy-intensive industries can promote a shift in economic structure
toward less intensive enterprises.
Continue to build the National Energy Conservation Center to facilitate information
dissemination and training
Implementation of multiple policies and programs will benefit from the full establishment of
the National Energy Conservation Center which can serve as a central contact point for
sharing information on energy-saving technologies, operations and management practices,
case studies of successful programs, and international best practices. The Center can also
provide training, guidance documents, and software tools with standardized methodologies to
provincial energy conservation and energy supervision centers.
Strengthen the capacity of provincial energy conservation centers
The capacity of China‘s provincial energy conservation centers should be strengthened
through training and addition of staff with technical capabilities. Enhanced coordination
through a national center, including the use of standardized auditing and benchmarking
protocols, would create consistency across the provincial centers. Even as market-based
technical services companies develop (e.g., ESCOs), governmental energy conservation
centers should strengthen technical expertise to monitor and verify energy improvements at
the enterprises in their jurisdiction.
Build capacity to systematically collect and analyze data focused on end-use energy
consumption
A key feature of successful energy-saving programs is the implementation of a systematic
data collection and reporting system for end-use energy consumption. Such a system enables
government and businesses to analyze energy use patterns and identify savings opportunities.
Examples from the U.S. include the Commercial Building Energy Consumption Survey
(CBECS), the Residential Energy Consumption Survey (RECS), and the Manufacturing
Energy Consumption Survey (MECS). Such capacity could be built at organizations such as
Energy Policy, Volume 39, Issue 4, April 2011, Pages 2165-2178
22
the Energy Research Institute, the National Energy Conservation Center, or the National
Bureau of Statistics.
Continue with 20% Energy Intensity Target
The 20% energy intensity target provided strong motivation for action and it is recommended
that China set another target for energy intensity reduction for the 12th
FYP. There are
compelling reasons to believe that the level of 20% is reasonable. For the 12th
FYP, the
apparatus of government in promoting energy-savings policies and programs is already in
place, and further gains could be expected. It may be necessary to separate the structural
change goal from the energy intensity goal and address the structural change issue using
different mechanisms.
Allocate target more scientifically, including a bottom-up analysis of energy saving potential
For the 12th
FYP, there is opportunity for scientific analysis to better inform the allocation of
the energy intensity target across provinces and sectors. In particular, a bottom-up analysis
considering the energy and economic situation in each province or sector would help to
determine realistic energy-saving potentials and provide a better basis for target allocation.
Methodologies and experience with allocation of absolute energy and carbon targets from the
Netherlands, UK, and elsewhere can be utilized, with modification for China‘s energy
intensity target.
Add a target for Carbon Intensity
Given the government‘s recent international announcements regarding climate change, it is
reasonable to also have a target for reduction of carbon intensity (CO2 emissions per unit of
GDP). In general, it should be easier to achieve a given carbon intensity reduction than to
achieve the comparable energy intensity reduction. Everything that contributes to energy
efficiency counts toward the carbon intensity target, while low carbon energy sources are
only credited to the carbon intensity target.
Create a consistent and transparent system for gathering and analyzing data on energy
intensity
Improvements are needed to make data reporting consistent across enterprises and provinces,
and to clearly establish the methodologies for analyzing the data and assessing the
performance of programs that reduce energy intensity.
Increase the level of public reporting regarding energy-saving policies and programs
At present, it is difficult to obtain necessary data to monitor and verify the progress of
energy-saving programs and policies. Public sharing of data would increase attention to
energy-saving programs, encourage consistency in data reporting, and encourage enterprises
and government offices to achieve their goals.
Standardize the metrics for targets and reporting
The 12th
FYP should have more standardization in establishing targets, reporting energy data,
and quantifying progress toward targets. It is recommended that energy savings be reported in
primary energy units, accounting for the generation, transmission, and distribution losses
from electricity production. The relationships between the overall energy intensity target and
individual program target metrics should be made explicit. To avoid confusion, targets for
each energy-saving program should indicate both annual savings and cumulative savings
goals during the FYP period.
Energy Policy, Volume 39, Issue 4, April 2011, Pages 2165-2178
23
Establish systematic annual data reporting on greenhouse gas emissions
In support of the carbon intensity target (CO2/GDP) announced by President Hu Jintao in
September 2009, a systematic means of gathering annual data on greenhouse gas emissions is
needed. Initially, reporting could focus on CO2, and later be expanded to other greenhouse
gases. Reporting by provinces and individual enterprises would augment China‘s national
greenhouse gas inventory and energy data reporting.
Improve the design phase for energy-saving projects
The need for improvement in the design phase was observed across the projects. Improved
program design involves clearly setting program objectives, schedules, and targets;
identifying target energy consumers; specify energy-efficiency measures and other
mechanisms to be utilized; development of an implementation strategy, including key
milestones; development of funding mechanisms or incentives; dissemination of information
to program participants; establishment of a monitoring plan, including project indicators and
monitoring procedures; and establishment of an evaluation plan.
Revise the approach to existing building energy retrofits in cold climates, treating building
envelope, control systems, and heat supply together
More attention should be paid to building retrofit projects and heat supply reform. The
existing program consisting primarily of incentives for retrofits fails to address institutional
reform (specifically the problems due to the division of responsibility between the heat
supply companies and buildings bureaus); the pace of energy pricing reform is too slow; and
there is inadequate scientific consideration of the best and most cost-effective measures to
achieve more efficient heating supply, building energy retrofits, and building energy control
systems simultaneously. Such an integrated program needs to be established to serve as the
basis for implementation during the 12th
FYP.
Expand the enforcement of building energy standards that have been effective in large urban
areas to the rest of the nation, improve building energy labels and provide incentives for
“green building”
Continued attention to enforcement of new building energy-efficiency standards and the
measurement of actual energy use are needed to ensure that efficient designs lead to real
energy savings in operation. Energy-efficiency policies need to be implemented in smaller
cities and rural areas. Further incentives are needed to encourage ―green buildings‖ with
advanced energy-efficiency features. In addition, there is a need to develop better
characterization of building energy through life-cycle analysis, to identify and limit the use of
energy-intensive building materials.
Continue to emphasize energy management of large-scale public and governmental buildings
Large-scale public buildings use 10-20 times more than residential buildings. A robust
system should be established to include performing in-depth energy audits of existing
buildings, gathering data on energy performance (preferably before and after retrofit for
existing buildings), monitoring the effects of occupant choice in the operation of buildings,
public reporting on the energy use of buildings, expansion of the use of building energy
labels, and extension of the program to medium-sized buildings in large and medium-sized
cities.
Enhance policy design and effectiveness through expanded surveys, monitoring and
establishing meaningful baselines of building energy consumption/efficiency
Energy Policy, Volume 39, Issue 4, April 2011, Pages 2165-2178
24
Building energy consumption data and data reporting methodologies should be standardized
and made more transparent for better evaluation of policy progress. Surveys on building
characteristics and energy consumption patterns that are representative of national building
stock should be conducted on a regular basis. A scientific baseline needs to be developed to
reflect the energy-efficiency improvement in buildings and the increasing demand for more
comfort and delivered energy services. Benchmarking protocols could be developed to
monitor building energy consumption and allow better comparison among buildings.
Continue and expand the Top-1000 Program
It is recommended that the Top-1000 Program be continued during the 12th FYP, extended to
include additional large, energy-intensive enterprises, and strengthened to be more effective.
Targets should be determined based on energy-saving potential of enterprise or sector
Target-setting in China should be based on an assessment of the actual potential of either the
Top-1000 enterprises individually, or the key sectors included in the Top-1000 program. Best
practice internationally is to set energy-saving targets based on an understanding of what the
enterprise or the sector can actually achieve. In the Netherlands, UK, and Japan, studies of
the energy-saving potential of industrial sub-sectors informed both the government and the
enterprises.
Energy auditing capabilities need to be improved
Standardized methodologies, auditing tools, training for energy auditors, and reports that
provide detailed recommendations are key elements of a high-quality auditing program.
Energy auditing standards, guidebooks, tools, and training should be developed and
disseminated to enterprises, sector associations, universities, energy conservation centers, and
other entities involved in energy auditing in China. There is a need for the government to
establish a single clearinghouse to maintain and update the standards, guidebooks, tools, and
training material.
Benchmarking could be simplified so that it can be used by more industries
During the 11th
FYP, a number of pilot projects involving industrial energy benchmarking
tools were carried out. Some benchmarking tools require users to input detailed information
on industry-specific process; simplified tools that require less data would lead to greater use.
Wider availability of benchmarking tools would help more enterprises track their energy use,
understand their competitiveness in terms of energy efficiency, and find energy-saving
opportunities.
Reporting and evaluation needs to be strengthened
A notable weakness in the Top-1000 program and other industrial programs is the lack of
public reporting and third party verification of energy use and savings. Because an online
reporting system has been established, it would be relatively easy to make more of the data
accessible in an aggregated or anonymous manner to protect confidential plant-level.
Verification by organizations other than the enterprises or supervising government offices is
needed to ensure that savings are real and that 12th
FYP goals can be achieved.
Dissemination of information on energy-saving opportunities and experiences is needed
Information dissemination is an important component of industrial energy-efficiency
programs across countries. The further development of the National Energy Conservation
Center could help to compile technical information sources such as energy-efficiency
guidebooks, databases, software tools, and industry- or technology-specific energy-efficiency
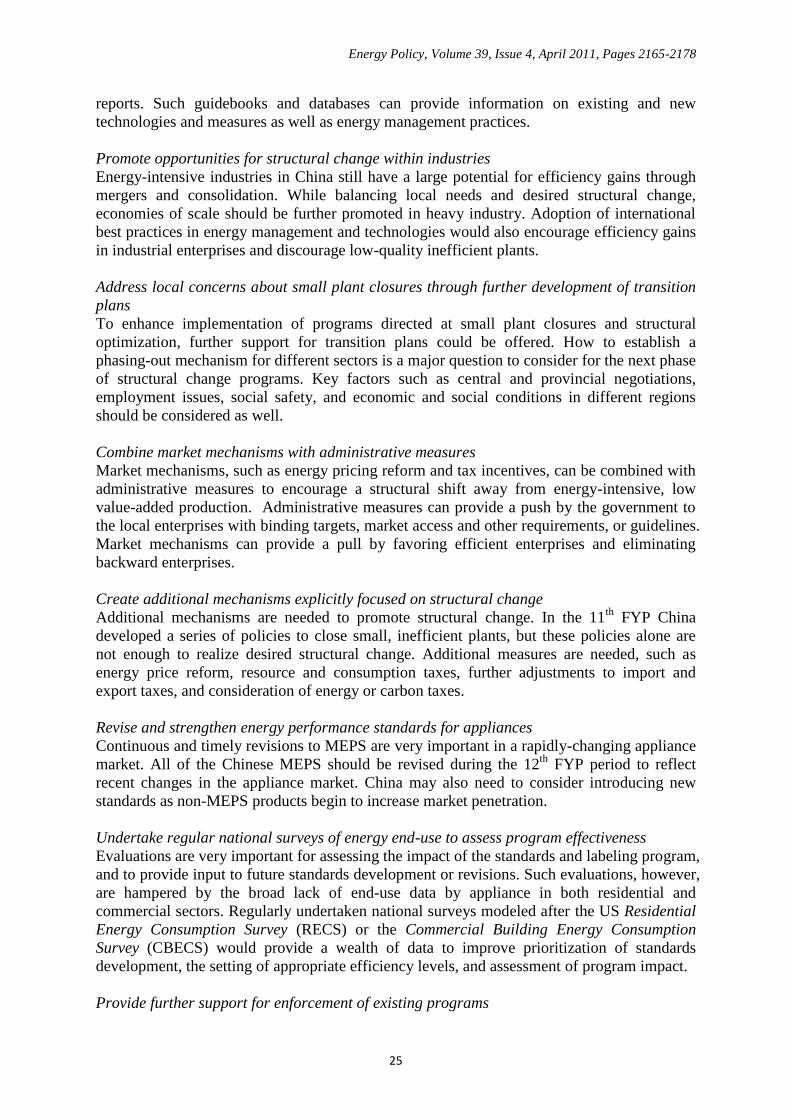
Energy Policy, Volume 39, Issue 4, April 2011, Pages 2165-2178
25
reports. Such guidebooks and databases can provide information on existing and new
technologies and measures as well as energy management practices.
Promote opportunities for structural change within industries
Energy-intensive industries in China still have a large potential for efficiency gains through
mergers and consolidation. While balancing local needs and desired structural change,
economies of scale should be further promoted in heavy industry. Adoption of international
best practices in energy management and technologies would also encourage efficiency gains
in industrial enterprises and discourage low-quality inefficient plants.
Address local concerns about small plant closures through further development of transition
plans
To enhance implementation of programs directed at small plant closures and structural
optimization, further support for transition plans could be offered. How to establish a
phasing-out mechanism for different sectors is a major question to consider for the next phase
of structural change programs. Key factors such as central and provincial negotiations,
employment issues, social safety, and economic and social conditions in different regions
should be considered as well.
Combine market mechanisms with administrative measures
Market mechanisms, such as energy pricing reform and tax incentives, can be combined with
administrative measures to encourage a structural shift away from energy-intensive, low
value-added production. Administrative measures can provide a push by the government to
the local enterprises with binding targets, market access and other requirements, or guidelines.
Market mechanisms can provide a pull by favoring efficient enterprises and eliminating
backward enterprises.
Create additional mechanisms explicitly focused on structural change
Additional mechanisms are needed to promote structural change. In the 11th
FYP China
developed a series of policies to close small, inefficient plants, but these policies alone are
not enough to realize desired structural change. Additional measures are needed, such as
energy price reform, resource and consumption taxes, further adjustments to import and
export taxes, and consideration of energy or carbon taxes.
Revise and strengthen energy performance standards for appliances
Continuous and timely revisions to MEPS are very important in a rapidly-changing appliance
market. All of the Chinese MEPS should be revised during the 12th
FYP period to reflect
recent changes in the appliance market. China may also need to consider introducing new
standards as non-MEPS products begin to increase market penetration.
Undertake regular national surveys of energy end-use to assess program effectiveness
Evaluations are very important for assessing the impact of the standards and labeling program,
and to provide input to future standards development or revisions. Such evaluations, however,
are hampered by the broad lack of end-use data by appliance in both residential and
commercial sectors. Regularly undertaken national surveys modeled after the US Residential
Energy Consumption Survey (RECS) or the Commercial Building Energy Consumption
Survey (CBECS) would provide a wealth of data to improve prioritization of standards
development, the setting of appropriate efficiency levels, and assessment of program impact.
Provide further support for enforcement of existing programs
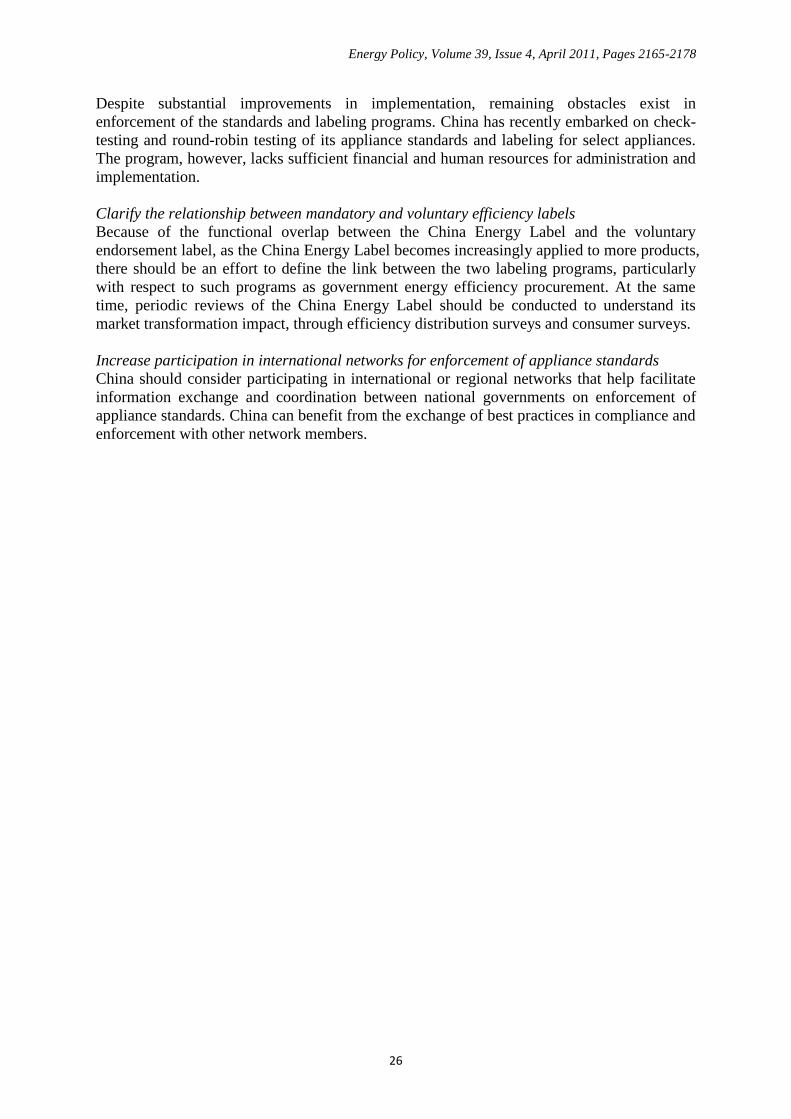
Energy Policy, Volume 39, Issue 4, April 2011, Pages 2165-2178
26
Despite substantial improvements in implementation, remaining obstacles exist in
enforcement of the standards and labeling programs. China has recently embarked on check-
testing and round-robin testing of its appliance standards and labeling for select appliances.
The program, however, lacks sufficient financial and human resources for administration and
implementation.
Clarify the relationship between mandatory and voluntary efficiency labels
Because of the functional overlap between the China Energy Label and the voluntary
endorsement label, as the China Energy Label becomes increasingly applied to more products,
there should be an effort to define the link between the two labeling programs, particularly
with respect to such programs as government energy efficiency procurement. At the same
time, periodic reviews of the China Energy Label should be conducted to understand its
market transformation impact, through efficiency distribution surveys and consumer surveys.
Increase participation in international networks for enforcement of appliance standards
China should consider participating in international or regional networks that help facilitate
information exchange and coordination between national governments on enforcement of
appliance standards. China can benefit from the exchange of best practices in compliance and
enforcement with other network members.
Energy Policy, Volume 39, Issue 4, April 2011, Pages 2165-2178
27
6. References
Bank of China (BOC), 2009. http://www.boc.cn/sourcedb/lswhpj/index2 .htm
Cai Zhihua, 2009. Interview with Cai Zhihua, Energy Saving Department, Department
of Resource Conservation and Environmental Protection, NDRC, May 6, 2009.
China Cement Association (CCA), 2008. China Cement Almanac 2007. Beijing: CCA.
Feng Fei, Wang Jinzhao, Li Minzhi, Wang Qingyi, Wang Xuejun, He Kebin, n.d.
Midterm Evaluation of Implementation of the Work of Energy Conservation and
Emission Reduction during the Eleventh Five-Year Plan and Policy Directions
under New Situation.
Fridley D., Aden N., Zhou N., and Lin J. 2007. Impacts of China’s Current Appliance
Standards and Labeling Program to 2020. LBNL-62802. Berkeley, CA: Lawrence
Berkeley National Laboratory. http://china.lbl.gov/sites/china.lbl.gov/files/LBNL-
62802.pdf
Galitsky, C., Price, L., and Worrell, E., 2004. Energy Efficiency Programs and Policies
in the Industrial Sector in Industrialized Countries. Berkeley, CA: Lawrence
Berkeley National Laboratory (LBNL-54068).
Intergovernmental Panel on Climate Change (IPCC), 2006. IPCC Guidelines for
National Greenhouse Gas Inventories; Reference Manual (Volume 2. Energy).
http://www.ipcc-nggip.iges.or.jp/public/2006gl/vol2.html
Kahrl, F. and Roland-Holst, D., 2006. China’s Carbon Challenge: Insights from the
Electric Power Sector.
http://are.berkeley.edu/~dwrh/CERES_Web/Docs/CCC_110106.pdf
Karney, R., 2007. Remarks at EnergyStar Criteria for Refrigerator Revision Meeting.
June 4, 2007, U.S. Department of Energy.
Levine, M.D., Price, L., Zhou, N., Fridley, D., Aden, N., Lu, H., McNeil, M., Zheng,
N., Qin, Y., Yowargana, P., 2010. Assessment of China’s Energy-Saving and
Emission-Reduction Accomplishments and Opportunities During the 11th Five-Year
Plan. Berkeley, CA: Lawrence Berkeley National Laboratory (LBNL-3385E).
http://china.lbl.gov/sites/china.lbl.gov/files/LBNL_3385E.Ace_Study_Report_FINAL.p
df
Liu Jingru, Yu Cong, and Liu Zhiping, 2009. ―Energy Conservation Moves Forward
Steadily with Significant Achievements – A Review of 30 Years of Open Door
Reform,‖ Energy of China, Vol. 31, No. 2, February 2009, pp. 17-22.
Lv Wenbin, 2009. Personal communication with Lv Wenbin, NDRC, May 24, 2009.
Ma Hailin, 2008. Presentation by Ma Hailin, Dalian University of Technology, at the
Energy Foundation‘s Industrial Energy Efficiency Planning Meeting, 10 July 2008,
Yantai, China.
Energy Policy, Volume 39, Issue 4, April 2011, Pages 2165-2178
28
Ma Jiantang, Director of NBS, 2009. Energy consumption per unit of GDP in 2008
dropped 5.2% from last year. Dec 25, 2009.
http://www1.www.gov.cn/wszb/zhibo359/content_1496381.htm
McKane, A., Price, L., and de la Rue du Can, S., 2007. Policies for Promoting
Industrial Energy Efficiency in Developing Countries and Transition Economies.
Geneva: United Nations Industrial Development Organization.
http://ies.lbl.gov/iespubs/63134.pdf
Ministry of Construction (MOC)/Ministry of Housing and Urban-Rural Development
(MOHURD), 2008. The Notice on Implementation of the Civil Building Energy
Conservation Ordinance.
http://www.cin.gov.cn/ZCFG/jswj/jskj/200812/t20081211_183179.htm
Ministry of Finance (MOF), 2008. The Notice on the Management Methods of the
Award Fund for Heat Supply Reform and Energy Efficiency Retrofit in Existing
Building in Northern Heating Zone,
http://jjs.mof.gov.cn/zhengwuxinxi/zhengcefagui/200805/t20080523_34063.html
Ministry of Industry and Information Technology (MIIT), 2010. Phasing Out Backward
Capacities for 11th
FYP. May.
http://www.miit.gov.cn/n11293472/n11293832/n13095885/13232432.html
National Bureau of Statistics (NBS), various years. China Statistical Yearbooks. Beijing:
NBS.
National Bureau of Statistics, 2007. China Statistical Yearbook. Beijing: NBS.
National Bureau of Statistics, 2008. China Statistical Yearbook. Beijing: NBS.
National Bureau of Statistics, 2009. China Statistical Yearbook. Beijing: NBS.
National Development and Reform Commission (NRDC), 2006. Implementation
Suggestions of Ten Key Energy-Conservation Projects during the Eleventh Five-
Year Plan, NDRC Department of Resource Conservation and Environmental
Protection Document #: [2006]1457.
National Development and Reform Commission (NDRC), 2008. The Progress of Ten
Key Energy-Conservation Projects. March 28, 2008.
http://zhs.ndrc.gov.cn/2007gmjj2008gmjj/2007gmjj/t20080328_201192.htm
National Development and Reform Commission (NDRC), 2009a. "Overcome
Difficulties with Full Efforts and Contribute to Climate Change Mitigation -- An
interview with Xie Zhenhua, Vice-Chairman of National Development and Reform
Committee", June 26, 2009. http://www.ndrc.gov.cn/xwfb/t20090626_288055.htm
National Development and Reform Commission (NDRC), 2009b. ―National and
Provincial Development and Reform Commissions Held a Meeting on Resources
Conservation and Environmental Protection in Xi‘an, March 31, 2009.‖
http://hzs.ndrc.gov.cn/newgzdt/t20090331_270198.htm
Energy Policy, Volume 39, Issue 4, April 2011, Pages 2165-2178
29
National Development and Reform Commission (NDRC), 2009c. Announcement of
Assessment and Evaluation Results of Top-1000 Enterprises Energy Conservation
Program, 2009 (千家企业节能目标评价考核结果的公告,2009 年第 18 号) Nov
16, 2009.
http://www.sdpc.gov.cn/zcfb/zcfbgg/2009gg/t20091124_315017.htm,
http://zfxxgk.ndrc.gov.cn/PublicItemView.aspx?ItemID={6dccc4b4-dbd6-4449-
a6bc-d23a7cc519c9}
National Development and Reform Commission and National Bureau of Statistics,
2007. Report on the State of the Energy Use of the Top-1000 Enterprises (Year
2007).
Price, L., Galitsky, C., Sinton, J., Worrell, E., Graus, W., 2005. Tax and Fiscal Policies
for Promotion of Industrial Energy Efficiency: A Survey of International
Experience. Berkeley, CA: Lawrence Berkeley National Laboratory (LBNL-58128).
Price, L., Wang, X., Jiang, Y., 2008a. China’s Top-1000 Energy-Consuming Enterprise
Program: Reducing Energy Consumption of the 1000 Largest Industrial Enterprises
in China. Berkeley, CA: Lawrence Berkeley National Laboratory (LBNL-519E).
Price, L., Galitsky, C., Kramer, K.J., and McKane, A., 2008b. International Experience
with Key Program Elements of Industrial Energy Efficiency or Greenhouse Gas
Emissions Reduction Target-Setting Programs. Berkeley, CA: Lawrence Berkeley
National Laboratory (LBNL-63807), http://ies.lbl.gov/iespubs/LBNL-63807.pdf.
See also associated website that provides links to most of the reports reference in
this document: http://industrial-energy.lbl.gov/resources
Price, L., Xuejun Wang, Jiang Yun, 2010. "The Challenge of Reducing Energy
Consumption of the Top-1000 Largest Industrial Enterprises in China", Energy
Policy, Vol. 38 Issue 11.
Qiu Baoxing, 2009. ―From Special Inspection to Fiscal Subsidy-- Annual Perspective of
Architectural Energy-Saving in China.‖
http://www.chinagb.net/news/fugle/20090330/46797.shtml
Schiller, S. 2007. National Action Plan for Energy Efficiency: Model Energy-Efficiency
Program Impact Evaluation Guide.
http://www.epa.gov/solar/documents/evaluation_guide.pdf
Shan Shanghua and Wang Xiaoming, 2007. ―Why it is so Difficult to Adjust the
Industrial Structure of Steel Industry in China?‖ China Steel, Vol. 5, pp. 9-11.
Sinton J., Levine M.D., and Wang Q., 1998, ―Energy Efficiency in China:
Accomplishments and Challenges,‖ Energy Policy 26 (11):813-829
Sinton J., Levine M.D., Fridley D., Yang F., and Lin J., 1999. Status Report on Energy
Efficiency Policy and Programs in China. LBNL-44605. Berkeley, CA: Lawrence
Berkeley National Laboratory.
Energy Policy, Volume 39, Issue 4, April 2011, Pages 2165-2178
30
Sinton, J. and Fridley, D., 2000. Status Report on Energy Efficiency Policy and
Programs in China: Recent and Related Developments. Berkeley, CA: Lawrence
Berkeley National Laboratory.
State Council, 2007. State Council Document [2007] 15. Comprehensive Working Plan
of Energy Conservation and Emission Reduction. May 23, 2007.
Tsinghua University Building Energy Efficiency Research Centre (TUBERC), 2009.
2009 Annual report on China Building Energy Efficiency, Beijing: China Building
Industry Publishing Company.
Vine, E., du Pont, P. and P. Waide, 2001. ―Evaluating the impact of appliance
efficiency labeling programs and standards: process, impact and market
transformation evaluations.‖ Energy 26: 1041-1059.
Waide, P., n.d. International Best Practice for Equipment Minimum Energy
Performance Standards (MEPS) and Labelling Programmes.
http://www.resourcesaver.com/file/toolmanager/O105UF987.pdf
Wang Q., Sinton J., and Levine, M.D., 1995. China's Energy Conservation Policies and
Their Implementation, 1980 to the Present, and Beyond. Berkeley, CA: Lawrence
Berkeley National Laboratory.
Wu Yong, 2009. Personal communication with Wu Yong, MOHURD, May 8, 2009.
Xinhua, 2007. ‗‗Half of the New Global Construction Built in China,‘‘
http://news.xinhuanet.com/newscenter/2007-08/23/content_6593780.htmS.
Xinhua, 2009. ―Subsidized rural home appliance sales top US$4.1 bln.‖ July 31, 2009.
http://www.china.org.cn/business/2009-07/31/content_18242361.htm
Xu Kexin, 2009. ―Deputy Department Head of Resource Conservation and
Environmental Protection of National Development and Reform Commission He
Bingguang said Ten Key Energy-Conservation Projects Need an Investment of 400
Billion RMB in the Next Two Years,‖ Reported by First Financial Daily, April 17,
2009. http://energy.people.com.cn/GB/9146125.html
Zhao, T., 2008. ―High-energy-consuming firms save 38.17m tons of coal,‖ China Daily.
2008-09-04.
Zhou, D., 2006. ―Allocation of the National Energy Intensity Target to the Provinces
and Sectors: Policy Recommendations‖ presentation at the Energy Foundation
Forum on Implementing China’s 2010 20-Percent Energy Efficiency Target, 9
November 2006.
Zhou N., McNeil M., Fridley D., Lin J., Price L., Rue du Can, S., Sathaye J., and
Levine M., 2007. Energy Use in China: Sectoral Trends and Future Outlook,
Lawrence Berkeley National Laboratory, LBNL- 61904.
Energy Policy, Volume 39, Issue 4, April 2011, Pages 2165-2178
31
Zhou N., Zheng N., and Fridley D., 2008. Check-Testing of Manufacturer Self Reported
Labeling Data & Compliance with MEPS. LBNL-247E. Berkeley, CA: Lawrence
Berkeley National Laboratory.
Zhou N. and Lin J., 2008. ―The Reality and Future Scenarios of Commercial Building
Energy Consumption in China,‖ Energy& Buildings.
Zhou, N., Levine, M.D., and Price, L., 2010. ―Overview of Current Energy-Efficiency
Policies in China,‖ Energy Policy, Vol. 38, Issue 11.