evaluation of cell concentration profiles and mixing in ... · pdf fileevaluation of cell...
TRANSCRIPT

Evaluat ion of Cell Concentra t ion Prof i les and Mixing in Unag i ta ted Wine Fermentors
S O P H O C L E S V L A S S I D E S ~ and DAVID E. B L O C K ~*
Because no external source of agitation is normally applied to wine fermentations, gradients of total insoluble solids and yeast cell concentration naturally exist as a function of depth in the fermentor. In order to understand how these gradients may affect the fermentation kinetics, it is necessary to be able to measure them in a systematic and accurate way. For two 1200-L fermentations of different white grape juices, we measured the total insoluble solids (yeast and grape solids) concentration at 1-foot intervals over the depth of the tank during the entire course of the fermentation using an immersible solids concentration probe. This probe measures optical density and gives a linear response with cell concentrations up to approximately 5 g dry cells/L and an increasing, but nonlinear, response at concentrations up to 100 g/L. With this approach, we found that the yeast concentration was below detectable limits in the bulk juice within 17 hours after inoculation, and that all solids were concentrated in the sediment layer. Subsequent cell growth began from the bottom of the fermentor and rose during the course of the fermentation, becoming uniform only as cell growth ceased and carbon dioxide production increased. Small-scale experiments have helped to elucidate this behavior, includ- ing the influence of yeast-solids interaction, incomplete yeast hydration, and potential nutrient gradients present in fermentors. The solids concentration probe may be useful in evaluating cell growth in industrial fermentations and in developing strategies for more rapid initiation of cell growth.
KEY WORDS: yeast cell concentration, total soluble solids, fermentation kinetics
Wine fermentat ions are typically performed in tanks without external agitation. While carbon dioxide evolution provides fairly thorough mixing during the period of high sugar utilization, the initial and final stages of the wine fermentation are not well mixed. This poor mixing has the potential to result in concentration gradients of cells and grape solids that may have an effect on overall fermentation kinetics. While mixing has been studied extensively in agitated fermentation systems, the effects of not providing external agitation to wine fermentations has not been fully studied.
In unst i rred beer fermentations, Garcia et al. have reported gradients in cell concentration that persist well into the fermentation [5,6]. They found tha t the mixing observed was well correlated with the power generated by carbon dioxide evolution at the 9.5-L scale, with cell gradients dissipating as rapid sugar utilization com- menced [6]. In general, the gradients observed in this case were formed as a result of inoculation at a fixed point in the fermentation without subsequent mixing.
For wine fermentations, these gradients have not been studied directly or on a large scale. However, the presence of grape solids in initial juices has the potential to cause gradients in both cells and nutrients, which
1Department of Viticulture and Enology, University of California, One Shields Avenue, Davis, CA 95616-8749.
*Corresponding author [Fax: (530) 752-0382; e-mail: <[email protected]>].
Acknowledgements: The authors would like to thank Wedgewood Technology Incorporated of San Carlos, CA, for the kind donation of the Model 110 probe, as well as technical information and assistance. We would also like to acknowledge the technical assistance of Mr. E. Farinias, Mr. P. Green, and Dr. K. Block. In addition, the authors would like to acknowledge useful discussions with Dr. R. Boulton. S. Vlassides was a recipient of a Fullbright Scholarship during this work. Other funding for this project was through University of California laboratory initiation funds. This work was presented in part at the Annual Meeting of the American Society for Enology and Viticulture in July, 1997, in San Diego, CA.
Manuscript submitted for publication 12 February 1999; revised 13 September 1999.
Copyright © 2000 by the American Society for Enology and Viticulture. All rights reserved.
73
ult imately may affect fermentation kinetics. The role of insoluble solids in wine fermentations has been studied extensively in small-scale experiments. It has been ob- served by several research'groups that having less than 2% solids reduces the overall f e rmen ta t i on ra te [7,9,10,11]. These data seem to indicate a link between more solids and higher nutr ient levels that would pro- mote more rapid fermentation. However, these experi- ments were on bench-scale fermentations and did not examine spatial gradients in the nutr ients present. Guell and Boulton have investigated the interaction between solids and yeast concentrations and their ef- fects on fermentation kinetics [8]. They reported that the presence of non-grape solids had little st imulatory or negative effect on fermentation kinetics except for a slight benefit of a 500 mg/L bentonite addition. How- ever, adding external mixing to these fermentations reduced the fermentation time significantly in all cases studied, regardless of the type of solid used, perhaps by prohibiting cell sedimentation prior to the initiation of cell growth. Flocculation and subsequent settling is an- other potential cause of cell concentration gradients. However, studies in this area have not associated this behavior with early stages of fermentation [3], but later stages where more cells are present [1].
In this paper, we measure gradients of cell concen- tration in pilot-scale wine fermentors (approx. 1200 L working volume) using an immersible solids concentra- tion probe. Causes for the rapid yeast settling that ini- t iates these gradients are also explored. Namely, we investigate the interaction of grape solids with yeast in settling, the effects of incomplete yeast hydration prior to inoculation, and the role of nutr ient gradients in the formation of cell concentration gradients during the initial stages of fermentation. The effect of the cell con- centration gradients on fermentation kinetics will be
A m . J. E n o l . V i t i c . , V o l . 51, No . 1, 2000
~ 74 m VLASSIDES and BLOCK
discussed, as will the potential use of the solids concen- tration probe as a tool for early detection of problem fermentations.
Materials and Methods Strains, juice, and fermentations: For all stud-
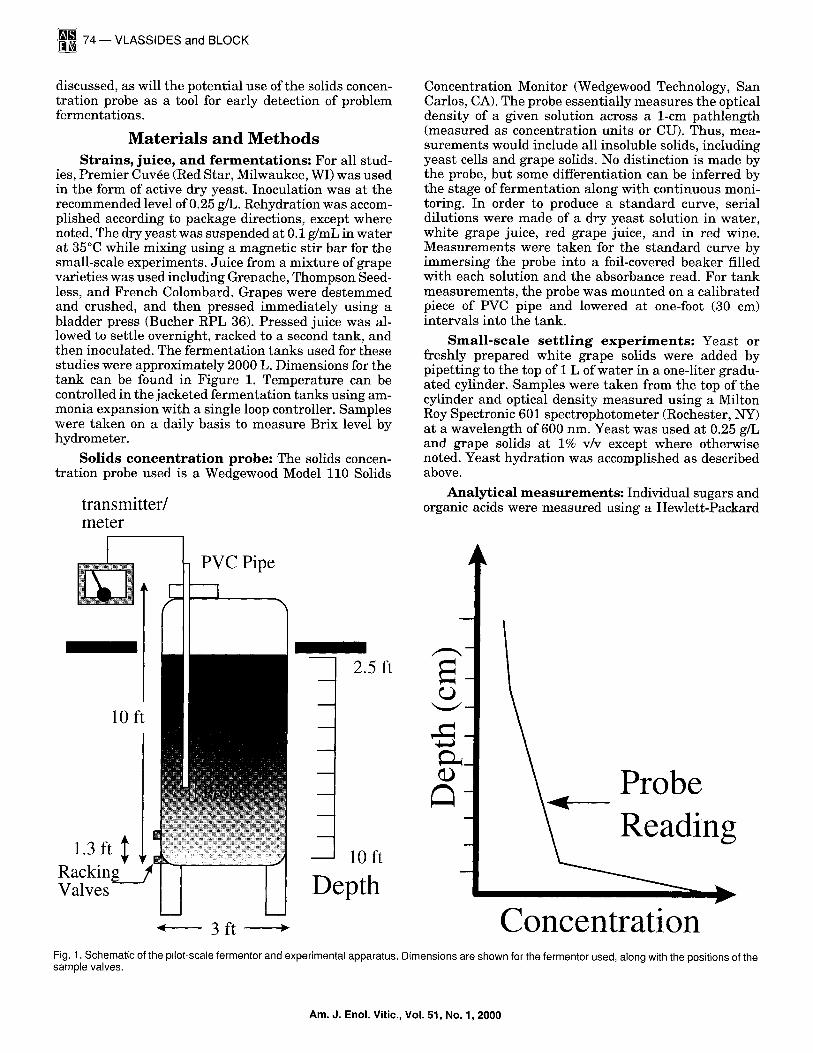
ies, Premier Cuv6e (Red Star, Milwaukee, WI) was used in the form of active dry yeast. Inoculation was at the recommended level of 0.25 g/L. Rehydration was accom- plished according to package directions, except where noted. The dry yeast was suspended at 0.1 g/mL in water at 35°C while mixing using a magnetic stir bar for the small-scale experiments. Juice from a mixture of grape varieties was used including Grenache, Thompson Seed- less, and French Colombard. Grapes were destemmed and crushed, and then pressed immediately using a bladder press (Bucher RPL 36). Pressed juice was al- lowed to settle overnight, racked to a second tank, and then inoculated. The fermentation tanks used for these studies were approximately 2000 L. Dimensions for the tank can be found in Figure 1. Temperature can be controlled in the jacketed fermentation tanks using am- monia expansion with a single loop controller. Samples were taken on a daily basis to measure Brix level by hydrometer.
Solids concentration probe: The solids concen- trat ion probe used is a Wedgewood Model 110 Solids
transmitter/ meter
Concentration Monitor (Wedgewood Technology, San Carlos, CA). The probe essentially measures the optical density of a given solution across a 1-cm pathlength (measured as concentration units or CU). Thus, mea- surements would include all insoluble solids, including yeast cells and grape solids. No distinction is made by the probe, but some differentiation can be inferred by the stage of fermentat ion along with continuous moni- toring. In order to produce a s tandard curve, serial dilutions were made of a dry yeast solution in water, white grape juice, red grape juice, and in red wine. Measurements were taken for the s tandard curve by immersing the probe into a foil-covered beaker filled with each solution and the absorbance read. For tank measurements , the probe was mounted on a calibrated piece of PVC pipe and lowered at one-foot (30 cm) intervals into the tank.
Small-scale sett l ing experiments: Yeast or freshly prepared white grape solids were added by pipetting to the top of I L of water in a one-liter gradu- ated cylinder. Samples were taken from the top of the cylinder and optical density measured using a Milton Roy Spectronic 601 spectrophotometer (Rochester, NY) at a wavelength of 600 nm. Yeast was used at 0.25 g/L and grape solids at 1% v/v except where otherwise noted. Yeast hydration was accomplished as described above.
Analytical measurements: Individual sugars and organic acids were measured using a Hewlett-Packard
A
PVC Pipe
lOft
1.3ft R a c k i n g , Valves
i '~ ~ ] 0 ft
2.5 ft
Depth
E
,+..a
P r o b e
R e a d i n g
' ' ' ' C " -- 3 ft o n c e n t r a t l o n Fig. 1. Schematic of the pilot-scale fermentor and experimental apparatus. Dimensions are shown for the fermentor used, along with the positions of the sample valves.
Am. J. Enol. Vitic., Vol. 51, No. 1, 2000
CELL CONCENTRATION PROFILES m 75
1.2
1.0
8
0 w 0
0.2
~ J I .O"
O.Ov 0
f f l
~ 0.8 r -
c -
o . m
0.6 C"
(1) O c -
O 0.4 (O
F , , , , i
20 40 60 80 100 Yeast Concentration ( g / L )
J
i J
J J
J 120 , . . ~
J O j t t
J J
J J
J J
• Data Regression
] ] I I I
1 2 3 4 5
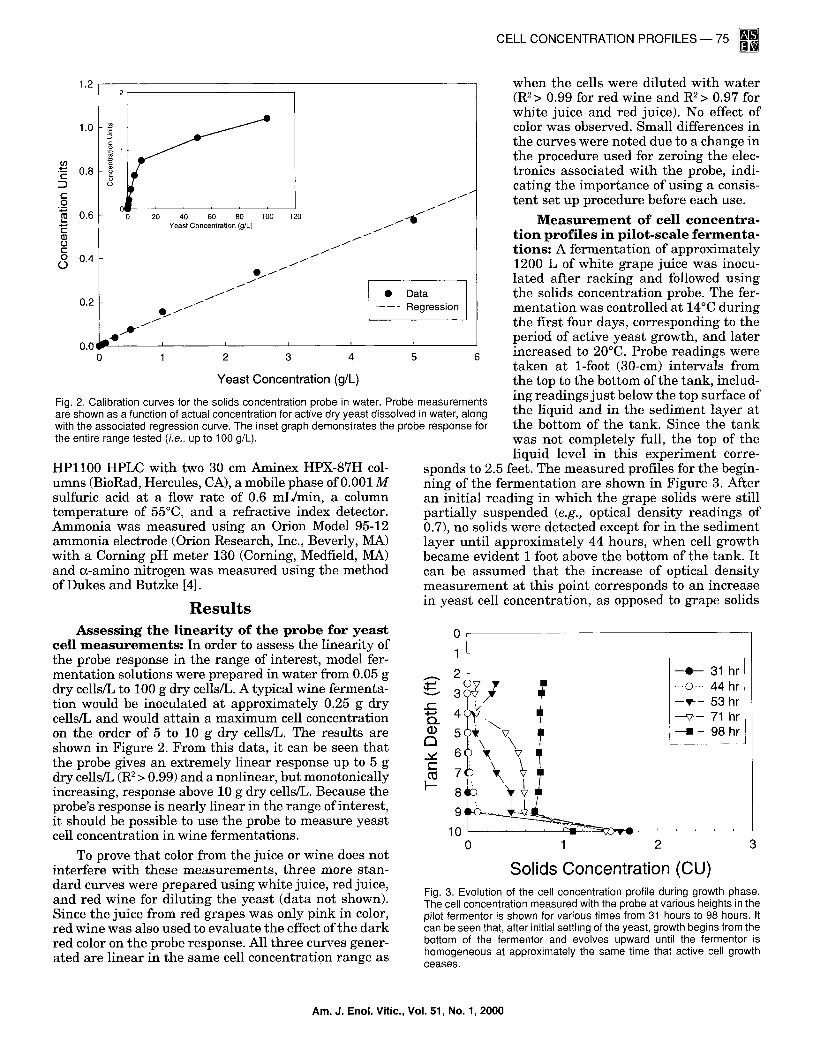
when the cells were diluted with water (R2> 0.99 for red wine and R2> 0.97 for white juice and red juice). No effect of color was observed. Small differences in the curves were noted due to a change in the procedure used for zeroing the elec- tronics associated with the probe, indi- cating the importance of using a consis- tent set up procedure before each use.
M e a s u r e m e n t of cel l concentra - t ion prof i les in p i lo t - sca le f ermenta- t ions: A fermentation of approximately 1200 L of white grape juice was inocu- lated after racking and followed using the solids concentration probe. The fer- mentation was controlled at 14°C during the first four days, corresponding to the period of active yeast growth, and later
6 increased to 20°C. Probe readings were taken at 1-foot (30-cm) intervals from the top to the bottom of the tank, includ- ing readings just below the top surface of the liquid and in the sediment layer at the bottom of the tank. Since the tank was not completely full, the top of the liquid level in this experiment corre-
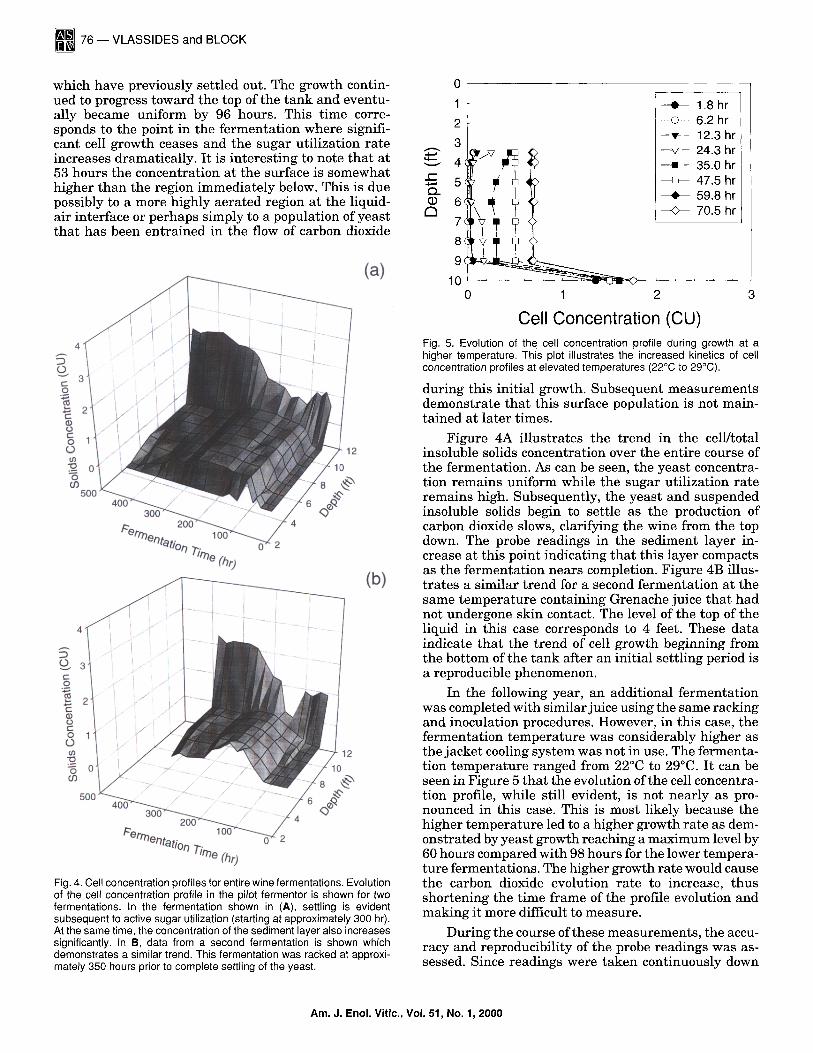
sponds to 2.5 feet. The measured profiles for the begin- ning of the fermentation are shown in Figure 3. After an initial reading in which the grape solids were still partially suspended (e.g., optical density readings of 0.7), no solids were detected except for in the sediment layer until approximately 44 hours, when cell growth became evident 1 foot above the bottom of the tank. It can be assumed that the increase of optical density measurement at this point corresponds to an increase in yeast cell concentration, as opposed to grape solids
Yeast Concentrat ion (g/L)
Fig. 2. Calibration curves for the solids concentration probe in water. Probe measurements are shown as a function of actual concentration for active dry yeast dissolved in water, along with the associated regression curve. The inset graph demonstrates the probe response for the entire range tested (i.e., up to 100 g/L).
H P l l 0 0 HPLC with two 30 cm Aminex HPX-87H col- umns (BioRad, Hercules, CA), a mobile phase of 0.001 M sulfuric acid at a flow rate of 0.6 mL/min, a column temperature of 55°C, and a refractive index detector. Ammonia was measured using an Orion Model 95-12 ammonia electrode (Orion Research, Inc., Beverly, MA) with a Corning pH meter 130 (Corning, Medfield, MA) and a-amino nitrogen was measured using the method of Dukes and Butzke [4].
Results Asses s ing the l inear i ty of the probe for yeas t
cell m e a s u r e m e n t s : In order to assess the linearity of the probe response in the range of interest, model fer- mentation solutions were prepared in water from 0.05 g dry cells/L to 100 g dry cells/L. A typical wine fermenta- tion would be inoculated at approximately 0.25 g dry cells/L and would attain a maximum cell concentration on the order of 5 to 10 g dry cells/L. The results are shown in Figure 2. From this data, it can be seen that the probe gives an extremely linear response up to 5 g dry cells/L (R2> 0.99) and a nonlinear, but monotonically increasing, response above 10 g dry cells/L. Because the probe's response is nearly linear in the range of interest, it should be possible to use the probe to measure yeast cell concentration in wine fermentations.
To prove that color from the juice or wine does not interfere with these measurements, three more stan- dard curves were prepared using white juice, red juice, and red wine for diluting the yeast (data not shown). Since the juice from red grapes was only pink in color, red wine was also used to evaluate the effect of the dark red color on the probe response. All three curves gener- ated are linear in the same cell concentration range as
0
1
2
3 z ' 3 1 h r
---o--- 4 4 h r - T - - 53 hr - - ~ - - 7 1 h r
- 98 hr
- t t.l,.-- V
c- 4
CL d~ 5 d3
._~ 6 c-
F-- 8
10 = . . . . . . 0 1 2 3
Solids Concentration (CU) Fig. 3. Evolution of the cell concentration profile during growth phase. The cell concentration measured with the probe at various heights in the pilot fermentor is shown for various times from 31 hours to 98 hours. It can be seen that, after initial settling of the yeast, growth begins from the bottom of the fermentor and evolves upward until the fermentor is homogeneous at approximately the same time that active cell growth ceases.
Am. J. Enol. Vitic., Vol. 51, No. 1, 2000
~76 - VLASSIDES and BLOCK
which have previously settled out. The growth contin- ued to progress toward the top of the tank and eventu- ally became uniform by 96 hours. This time corre- sponds to the point in the fermentat ion where signifi- cant cell growth ceases and the sugar utilization rate increases dramatically. It is interest ing to note that at 53 hours the concentration at the surface is somewhat higher than the region immediately below. This is due possibly to a more highly aerated region at the liquid- air interface or perhaps simply to a population of yeast that has been entrained in the flow of carbon dioxide
(a)
4 ,~
3 O
1,.. • ,.-, 2 (D O
o 1 o
CD
0
12
_- lO 0 O3
ii.i..? ::~::- ........................... i?...:. ,....... 400 .... <~0 Q~'¢"
rime (h r)
~ 4
g , t ; i .................. ..................... m t llml ........
...... i / r / .......
3 0 0 " ~ _ . . • ;/" 4
100 0"" 2 Fermentation Time (hr)
(b)
Fig. 4. Cell concentration profiles for entire wine fermentations. Evolution of the cell concentration profile in the pilot fermentor is shown for two fermentations. In the fermentation shown in (A), settling is evident subsequent to active sugar utilization (starting at approximately 300 hr). At the same time, the concentration of the sediment layer also increases significantly. In B, data from a second fermentation is shown which demonstrates a similar trend. This fermentation was racked at approxi- mately 350 hours prior to complete settling of the yeast.
1 ~ 1.8 hr 2 ---o--- 6.2 hr 3 --T-- 12.3 hr
~-- ~ --~-- 24.3 hr 4 ~ ~ , ~ ---m- 35.0hr 5 ~ j ~ 4[~> --[:>- 47.5hr
/ / / I I -4 ) - - 59.8 hr C3 ~" 6 \ ~ ~ ~> - ¢ - - 70.5hr
7cPv T 7 - - - - - # 9c
10 0 1 2 3
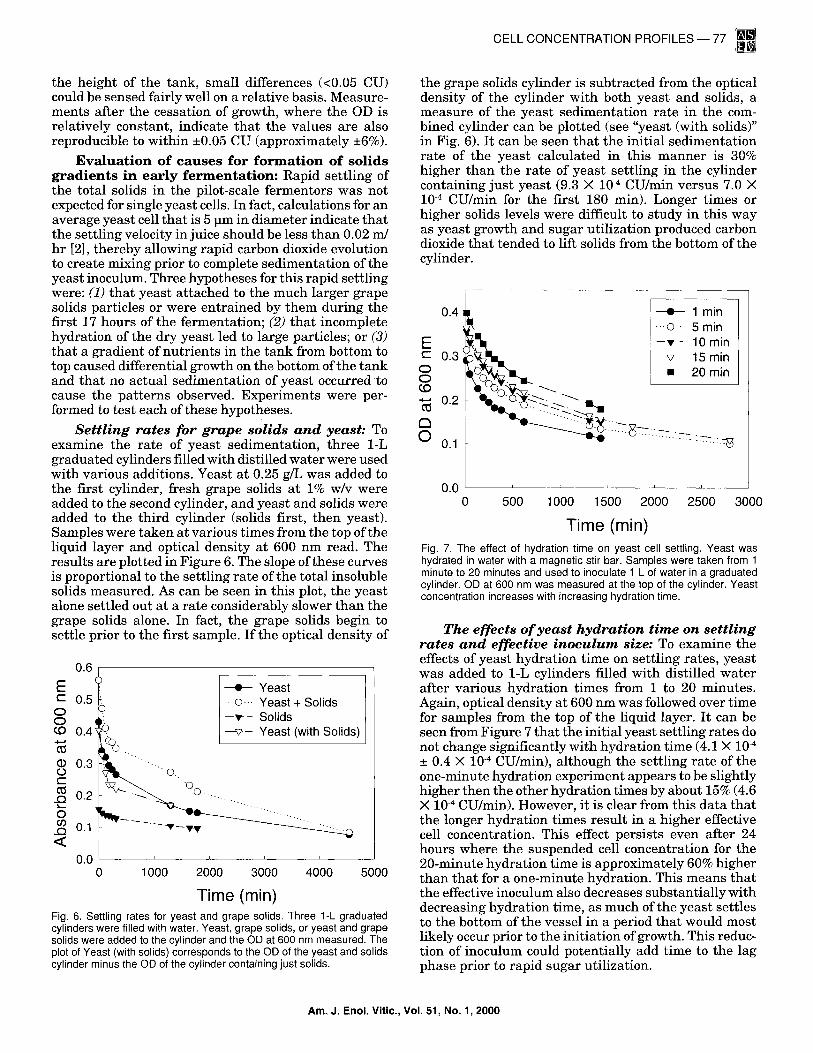
Cell Concentration (CU) Fig. 5. Evolution of the cell concentration profile during growth at a higher temperature. This plot illustrates the increased kinetics of cell concentration profiles at elevated temperatures (22°C to 29°C).
during this initial growth. Subsequent measurements demonstrate tha t this surface population is not main- tained at later times.
Figure 4A illustrates the trend in the cell/total insoluble solids concentration over the entire course of the fermentation. As can be seen, the yeast concentra- tion remains uniform while the sugar utilization rate remains high. Subsequently, the yeast and suspended
insoluble solids begin to settle as the production of carbon dioxide slows, clarifying the wine from the top down. The probe readings in the sediment layer in- crease at this point indicating that this layer compacts as the fermentat ion nears completion. Figure 4B illus- t rates a similar t rend for a second fermentat ion at the same tempera ture containing Grenache juice that had not undergone skin contact. The level of the top of the liquid in this case corresponds to 4 feet. These data indicate that the trend of cell growth beginning from the bottom of the tank after an initial settling period is a reproducible phenomenon.
In the following year, an additional fermentation was completed with similar juice using the same racking and inoculation procedures. However, in this case, the fermentation tempera ture was considerably higher as the jacket cooling system was not in use. The fermenta- tion tempera ture ranged from 22°C to 29°C. It can be seen in Figure 5 that the evolution of the cell concentra- tion profile, while still evident, is not nearly as pro- nounced in this case. This is most likely because the higher tempera ture led to a higher growth rate as dem- onstrated by yeast growth reaching a maximum level by 60 hours compared with 98 hours for the lower tempera- ture fermentations. The higher growth rate would cause the carbon dioxide evolution rate to increase, thus shortening the time frame of the profile evolution and making it more difficult to measure.
During the course of these measurements , the accu- racy and reproducibility of the probe readings was as- sessed. Since readings were taken continuously down
Am. J. Enol. Vitic., Vol. 51, No. 1, 2000
CELL CONCENTRATION PROFILES m 77
the height of the tank, small differences (<0.05 CU) could be sensed fairly well on a relative basis. Measure- ments after the cessation of growth, where the OD is relatively constant, indicate that the values are also reproducible to within +0.05 CU (approximately _+6%).
E v a l u a t i o n of c a u s e s for f o r m a t i o n of so l ids g r a d i e n t s in ear ly f e r m e n t a t i o n : Rapid settling of the total solids in the pilot-scale fermentors was not expected for single yeast cells. In fact, calculations for an average yeast cell tha t is 5 pm in diameter indicate that the settling velocity in juice should be less than 0.02 m/ hr [2], thereby allowing rapid carbon dioxide evolution to create mixing prior to complete sedimentation of the yeast inoculum. Three hypotheses for this rapid settling were: (1) tha t yeast at tached to the much larger grape solids particles or were entrained by them during the first 17 hours of the fermentation; (2) tha t incomplete hydration of the dry yeast led to large particles; or (3) tha t a gradient of nutr ients in the tank from bottom to top caused differential growth on the bottom of the tank and that no actual sedimentation of yeast occurred to cause the pat terns observed. Experiments were per- formed to test each of these hypotheses.
Set t l ing rates for grape solids and yeast: To examine the rate of yeast sedimentation, three 1-L graduated cylinders filled with distilled water were used with various additions. Yeast at 0.25 g/L was added to the first cylinder, fresh grape solids at 1% w/v were added to the second cylinder, and yeast and solids were added to the third cylinder (solids first, then yeast). Samples were taken at various times from the top of the liquid layer and optical density at 600 nm read. The results are plotted in Figure 6. The slope of these curves is proportional to the settling rate of the total insoluble solids measured. As can be seen in this plot, the yeast alone settled out at a rate considerably slower than the grape solids alone. In fact, the grape solids begin to settle prior to the first sample. If the optical density of
0.6
E E 0.5 C:) O £O O.4
(1) 0.3 o c
.Q 0.2
O 0.1
<
0.0
"--.........,.....
Yeast • --o--- Yeast + Sol ids - -T- - Solids ----~-- Yeast (with Solids)
"'--......
i i i i
0 1000 2000 3000 4000 5000
Time (min) Fig. 6. Settling rates for yeast and grape solids. Three 1-L graduated cylinders were filled with water. Yeast, grape solids, or yeast and grape solids were added to the cylinder and the OD at 600 nm measured. The plot of Yeast (with solids) corresponds to the OD of the yeast and solids cylinder minus the OD of the cylinder containing just solids.
the grape solids cylinder is subtracted from the optical density of the cylinder with both yeast and solids, a measure of the yeast sedimentation rate in the com- bined cylinder can be plotted (see "yeast (with solids)" in Fig. 6). It can be seen tha t the initial sedimentation rate of the yeast calculated in this manner is 30% higher than the rate of yeast settling in the cylinder containing just yeast (9.3 X 10 .4 CU/min versus 7.0 X 10 .4 CU/min for the first 180 min). Longer times or higher solids levels were difficult to study in this way as yeast growth and sugar utilization produced carbon dioxide tha t tended to lift solids from the bottom of the cylinder.
0.4
E E 0.3 O O £O -,.-' 0.2
a
O o.1
1 min o 5 min - v - - 10 min - - -~ - 15 min
- 20 min
. . . . . . . . . . . . . " - - - : " ' ~ : :- -~6
. 0 i i i i . i
0 500 1000 1500 2000 2500 3000
Time (rain) Fig. 7. The effect of hydration time on yeast cell settling. Yeast was hydrated in water with a magnetic stir bar. Samples were taken from 1 minute to 20 minutes and used to inoculate 1 L of water in a graduated cylinder. OD at 600 nm was measured at the top of the cylinder. Yeast concentration increases with increasing hydration time.
The effects o f yeas t hydra t ion t ime on set t l ing rates and effective inoculum size: To examine the effects of yeast hydration time on settling rates, yeast was added to 1-L cylinders filled with distilled water after various hydration times from 1 to 20 minutes. Again, optical density at 600 nm was followed over time for samples from the top of the liquid layer. It can be seen from Figure 7 that the initial yeast settling rates do not change significantly with hydration time (4.1 X 10 .4
_+ 0.4 X 10 .4 CU/min), although the settling rate of the one-minute hydration experiment appears to be slightly higher then the other hydration times by about 15% (4.6 X 10 .4 CU/min). However, it is clear from this data that the longer hydration times result in a higher effective cell concentration. This effect persists even after 24 hours where the suspended cell concentration for the 20-minute hydrat ion time is approximately 60% higher than tha t for a one-minute hydration. This means tha t the effective inoculum also decreases substantially with decreasing hydrat ion time, as much of the yeast settles to the bottom of the vessel in a period tha t would most likely occur prior to the initiation of growth. This reduc- tion of inoculum could potentially add time to the lag phase prior to rapid sugar utilization.
Am. J. Enol. Vitic., Vol. 51, No. 1, 2000

~78 - VLASSIDES and BLOCK
r- Top O . i
. m or) O
13_ Top Rack
c
Bottom Rack
I a m m o n i a
a m i n o n i t rogen tar tar ic ac id
I g l u c o s e I f r uc tose
m . I
J
t i i i i i i
0.0 0.2 0.4 0.6 0.8 1.0 1.2 1.4 1.6
Relative Concentration
Fig. 8. Nutrient concentration gradients in a settled tank. Juice was settled in the tank described in Fig. 1 after racking. Samples were taken from the top of the liquid level, the top sample/rack valve, and the bottom sample/rack valve. Ammonia, amino nitrogen, tartaric acid, glucose, and fructose were measured relative to the concentration at the top of the tank.
Evaluation of nutrient gradients: In order to evaluate the hypothesis that the observed gradients in cell concentration were due to gradients in nutrients, the fermentors used above were filled with racked juice. Samples were taken at three depths in the tank prior to inoculation and analyzed for glucose, fructose, alpha- amino nitrogen, ammonia, and tartaric acid. Concentra- tions of these analytes were fairly typical of juice from white grapes harvested at approximately 25°Brix. The concentrations at the top of the liquid level for glucose, fructose, a-amino nitrogen, ammonia, and tartaric acid were 125 g/L, 125 g/L, 140 rag/L, 33.6 mg/L, and 3.1 g/L, respectively. As can be seen in Figure 8, no major differ- ences were detected in the concentration of any of the nutr ients measured, though this would likely change rapidly during the observed gradient growth. The larg- est differences noted were in the nitrogen concentra- tions, where a 10% higher concentration of ammonia was found on the bottom of the tank relative to the top. This result was confirmed using settled juice in a 1-L graduated cylinder (data not shown).
U s i n g the sol ids c o n c e n t r a t i o n probe to mea- sure cel l growth: While not the only factor, cell growth is a good indicator of the ability of a wine fer- mentation to go to completion. The higher the maxi- mum viable cell concentration, the less likely the fer- mentation will become sluggish or stuck [12]. To evalu- ate the ability of the probe to monitor total cell concen- tration in the pilot fermentor, the optical density pro- files were averaged spatially. These average cell concen- tration profiles are plotted in Figure 9A, along with the Brix curve for the same fermentation. In addition, the optical density measured at nine feet (270 cm) is also plotted. This corresponds to the optical density at ap- proximately one foot above the sediment layer. It can be seen from this data that both the mean optical density and the optical density at nine feet represent suspended cell concentration well. When compared to the plot of sugar utilization rate in Figure 9B, both curves demon-
1.0
O~ 0.84
~'~ 0.6
co 0.4
0.2
0.0
0.4 rr" c..-
.0 "C" 0.3
-5 N
:~ ~ 0.2
l:~ 0.1 o3
C o n c e n t r a t i o n at 9 ft
- - © - - M e a n C o n c e n t r a t i o n (a)
O - ' ©
(b)
30
¢.
/'1 i i ] t
\
k h. I \ / \
0.0 . . . . 0 100 200 300 400 500
Time (hr)
25
20 I~
15"" O O orj
10 w
5 ×
Fig. 9. Measurement of cell growth in a pilot-scale fermentor during fermentation. The optical density measured by the solids concentration probe at 9 feet (1 ft from the bottom) is plotted in A, along with the OD reading averaged over the entire height of the liquid. The Brix curve is plotted for reference. B gives the associated sugar utilization curve calculated using a center-difference approximation of the slope at points along the Brix curve.
strate that cell growth is nearly complete by the time rapid sugar utilization begins and that cell settling oc- curs as the sugar utilization rate, and therefore, carbon dioxide evolution rate, subsides. While the probe does not differentiate between viable and nonviable cells, the maximum number of total cells measured by the probe at the end of initial cell growth will still be a good indicator of the ensuing sugar utilization rate. This is because viability at this point in the fermentation is usually greater than 85% [12].
D i s c u s s i o n
It is clear from the data obtained during these stud- ies that gradients in cell concentration will occur in unagitated wine fermentations under certain condi- tions, even above the 1000-L scale. As discussed below, the formation of these gradients can likely be controlled by processing, but may be a negative contributing factor in the observed fermentation kinetics. In addition, the solids concentration probe used for these studies may prove to be a useful industrial tool for the monitoring and early diagnosis of potential problem fermentations.
During the course of the fermentations monitored with the solids concentration probe, gradients in cell concentration were formed. In all cases, the total in- soluble solids, and therefore yeast concentration, dropped below detectable levels early in the fermenta-
Am. J. Enol. Vitic., Vol. 51, No. 1, 2000

CELL CONCENTRATION PROFILES- 79
tion (as early as 6 hr after inoculation), and then began to increase s tar t ing from the bottom of the tank. The fermentations did not reach spatial homogeneity until after the commencement of rapid sugar utilization, es- sentially after the completion of the initial cell growth. While, initially, the juice used was likely to be fully and uniformly oxygenated from the juice preparation, a re- gion of higher cell density was observed at the liquid/air interface well after the initiation of cell growth at the bottom of the tank. This could have been caused by subsequent oxygen transfer at the interface that al- lowed for more cell growth. Another possible explana- tion of this observation is tha t cells or solids from the lower part of the tank became entrained in the carbon dioxide evolving from cell growth and, therefore, accu- mulated at the top of the liquid. The data collected are consistent with either one of these hypotheses, though it is not clear why this phenomenon would be t ransient (as in Fig. 3) or not observed in some cases (as in Fig. 4B). Clearly, this behavior was not as reproducible as the bottom initiated growth in our studies, but merits fur- ther examination as it would certainly have the poten- tial to affect fermentation kinetics and gradient evolu- tion when present.
In our experience, the yeast used in these experi- ments, Premier Cuv~e, does not have a tendency to flocculate during fermentation. However, if flocculent yeast had been used for these experiments, we would expect the gradient formation observed here to be ac- centuated, as flocculation would create cell aggregates that should have a higher sedimentation rate in most cases.
It is interesting that these gradients can potentially form on the pilot-scale, as this would not be predicted from the settling velocity of single yeast cells alone. This type of gradient has been thought to be one of the issues in scale-up between small-scale research fermentations (<20 L) and larger production-scale as the cells would have less distance to settle in the smaller containers. The potential of cell gradients to form at a larger scale (approx. 1200 L) indicates that this may not be the only difference between scales, and that precautions must be taken in experimental design to avoid gradients even at the larger scale. The speed at which cell concentration gradients form and at which homogeneity is achieved in wine fermentations is clearly a function of fermentation temperature. Our experiments indicate that gradients are more likely to be sustained for longer periods of time at lower temperatures , as would typically be used for white wine fermentations (i.e., 14°C to 20°C). However, the length of time that the gradients persist is essen- tially equal to the amount of time for cell growth.
For this study, we explored three potential causes of these cell gradients: (1) the presence of grape solids; (2) incomplete hydration of the active dry yeast; and (3) gradients in the essential nutr ients for cell growth. From the data, it seems that the first two potential causes are likely to have the most influence on gradient formation. The small-scale experiments with grape sol- ids and yeast indicate that yeast settling is accelerated
significantly (approx. 30%) by the presence of grape solids. The mechanism for this acceleration could be a simple ent ra inment of the yeast as the larger solids particles settle toward the bottom of the vessel or per- haps a more specific a t tachment of the yeast cells to the grape solids. It is impossible to differentiate between these two mechanisms with the present data.
From the experiment examining various hydration times, it is clear that incomplete hydration of the active dry yeast results in the presence of larger particles that settle rapidly, leaving a lower concentration of sus- pended yeast. Not only is this a factor in the initial settling of the yeast, but our experiments indicate tha t the difference in suspended yeast cell concentration per- sists long enough to effect the kinetics of cell growth. For example, by hydrat ing the yeast for five minutes instead of 20 minutes, the effective inoculum is reduced by almost 25%. This means that the cells must grow for an additional time in order to reach their final cell mass. This could potentially add hours onto the fermentation and give a higher probability for naturally-occurring yeasts that may not be desirable to a winemaker to proliferate in the juice. It is interest ing to note that the data indicate that hydration of individual particles of dry yeast in water must proceed rapidly once the process begins, since the yeast seems to be present only in large particles that settle out immediately and small particles (presumably single cells or very small aggregates) that settle at approximately the same rate. For both of these experiments, water was used in lieu of a higher density juice in order to minimize the chance of initiating a fermentation. While the use of water may have accentu- ated the observations made here by increasing the den- sity differential between the solid particles and liquid, the trends observed should be general for liquids of various densities, as long as the liquid has a density less than that of the solids used for the experiments.
It does not appear that significant nutr ient gradi- ents are formed in the newly racked juice. Nitrogen levels (ammonia and a-amino nitrogen) from the top to the bottom of the tank varied by less than 10%. While we have found the maximum cell concentration to be a function of nitrogen concentration in independent ex- periments, we have not observed the length of lag phase in growth to be a function of nitrogen concentration [12]. Therefore, it is likely that this small difference in nitrogen concentration is not responsible for the cell concentration gradients formed. There is the possibility that gradients of some other nutr ient not measured may be a cause of the uneven initial cell growth. We would not expect, however, tha t both of these fermentations made with blends of different grapes would have similar deficiencies.
From these results, it follows that care should be taken in an industrial setting to allow some additional settling time after racking prior to inoculation with yeast. In practice, though, the lack of mixing after inocu- lating a fermentat ion from the top of tank could, in itself, lead to gradients reverse to those observed in these studies. More importantly, yeast should be fully
Am. J. Enol. Vitic., Vol. 51, No. 1, 2000
~8 0 m VLASSIDES and BLOCK
hydrated using agitation prior to inoculation in order to ensure the most rapid initiation of cell growth of the inoculated organism.
During the course of these studies, it became evi- dent that the solids concentration probe could be a useful practical tool for white wine process manage- ment. By simply lowering the probe into a tank periodi- cally after inoculation, it should be possible to follow the cell growth, thereby getting some indication that the fermentation has, indeed, begun, as well as an indica- tion of the likelihood of successful completion of the fermentation. Since the measurements are rapid, it should be possible to use one probe for multiple tanks. The probe may also be a useful tool for evaluating the progress of barrel fermentations, both at the beginning to assure that all fermentations have begun and as a measure of fermentation completion as the cells begin to settle out. Since the probe could be inserted directly into each barrel, it could potentially be used as a more rapid screening method in lieu of repeated sampling with subsequent hydrometer readings. Lastly, the probe could be used to evaluate when tanks of settling pressed juice are ready to be racked. In this case, the probe could be positioned at the level of the racking arm. When the optical density fell below a preset value, racking could begin.
C o n c l u s i o n s These studies indicate that gradients in cell concen-
tration do occur in pilot-scale wine fermentations under certain conditions. The formation of these gradients seems to be heightened by incomplete settling of grape solids prior to yeast inoculation and by incomplete hy- dration of the active dry yeast prior to use. Increased temperature lessens the formation of distinct gradients by increasing the kinetics of cell growth. The probe used
for these studies can be used as a tool for rapid assess- ment of cell growth and fermentation progression in the wine industry.
L i t e r a t u r e C i t ed 1. Arikan, O., and M. Ozilgen. Settling kinetics of champagne yeast.
Enzyme Microb. Technol. 14:762-766 (1992).
2. Boulton, R. B., V. L. Singleton, et aL Principles and Practices of Winemaking. Chapman & Hall, New York (1996).
3. Bowen, W. R., and T. J. Ventham. Aspects of yeast flocculation. Size distribution and zeta-potential. J. Inst. Brew. 100:167-172 (1994).
4. Dukes, B., and C. E. Butzke. Rapid determination of primary amino acids in grape juice using an o-phthaldialdehyde/N-acetyI-L-cysteine spectrophotometric assay. Am. J. Enol. Vitic. 49:125-134 (1998).
5. Garcia, A. I., L. A. Garcia, and M. Diaz. Mixing in unstirred batch fermenters. Chemical Eng. J. 51 :B57-B61 (1993).
6. Garcia, A. I., S. S. Pandiella, et al. Mechanism for mixing and homogenization in beer fermentation. Bioprocess Eng. 10:179-184 (1994).
7. Groat, M., and C. S. Ough. Effects of insoluble solids added to clarified musts on fermentation rate, wine composition, and wine quality. Am. J. Enol. Vitic. 29:112-119 (1978).
8. Guell, C., and R. Boulton. The influence of suspended solids and stirring on the rate of small-scale fermentations. Presented at the Annual Meeting of the American Society for Enology and Viticulture, Sacra- mento, CA (1993).
9. Houtman, A. C., and C. S. du Plessis. Nutritional deficiencies of clarified white grape juices and their correction in relation to fermenta- tion. S. Afr. J. Enol. Vitic. 7(1):39-46 (1986).
10. Ough, C. S., and M. L. Groat. Particle nature, yeast strain, and temperature interactions on the fermentation rates of grape juice. Appl. Environ. Microbiol. 35(5):881-885 (1978).
11. Tromp, A. The effect of yeast strain, grape solids, nitrogen, and temperature on fermentation rate and wine quality. S. Afr. J. Enol. Vitic. 5(1):1-6 (1984).
12. Vlassides, S., J. Rocha, et aL Prediction of sluggish and stuck wine fermentations based on initial nitrogen concentration. Presented at the Annual Meeting of the American Society for Enology and Viticulture, Sacramento, CA (1998).
Am. J. Enol. Vitic., Vol. 51, No. 1, 2000