evaluation of an electric bike pilot project at three employment campuses in portland, oregon
TRANSCRIPT
EVALUATION OF AN E-BIKE PILOT PROJECT AT THREE
KAISER PERMANENTE EMPLOYMENT CAMPUSES
Nick KobelTREC at Portland State University (former)
John MacArthurTREC at Portland State University
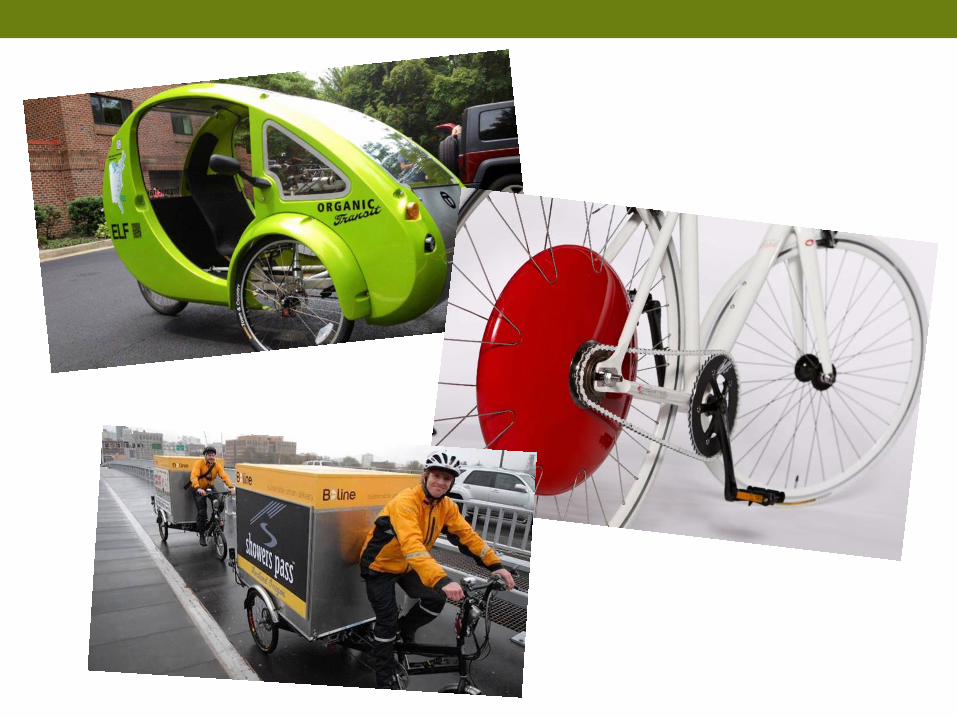
WHAT IS AN E-BIKE?
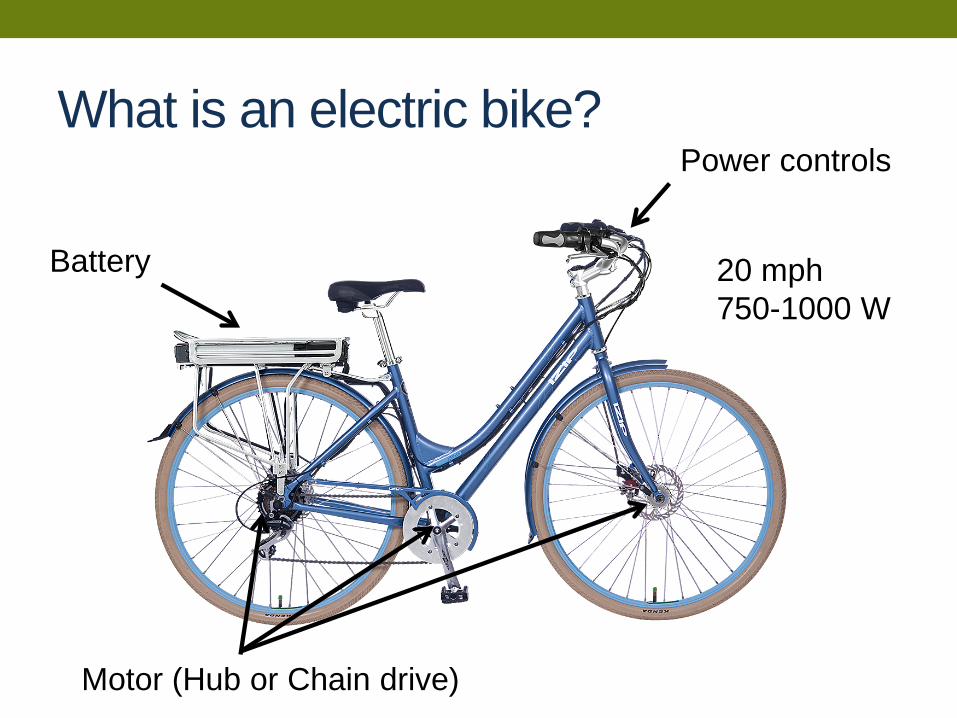
What is an electric bike?
Battery
Motor (Hub or Chain drive)
Power controls
20 mph750-1000 W
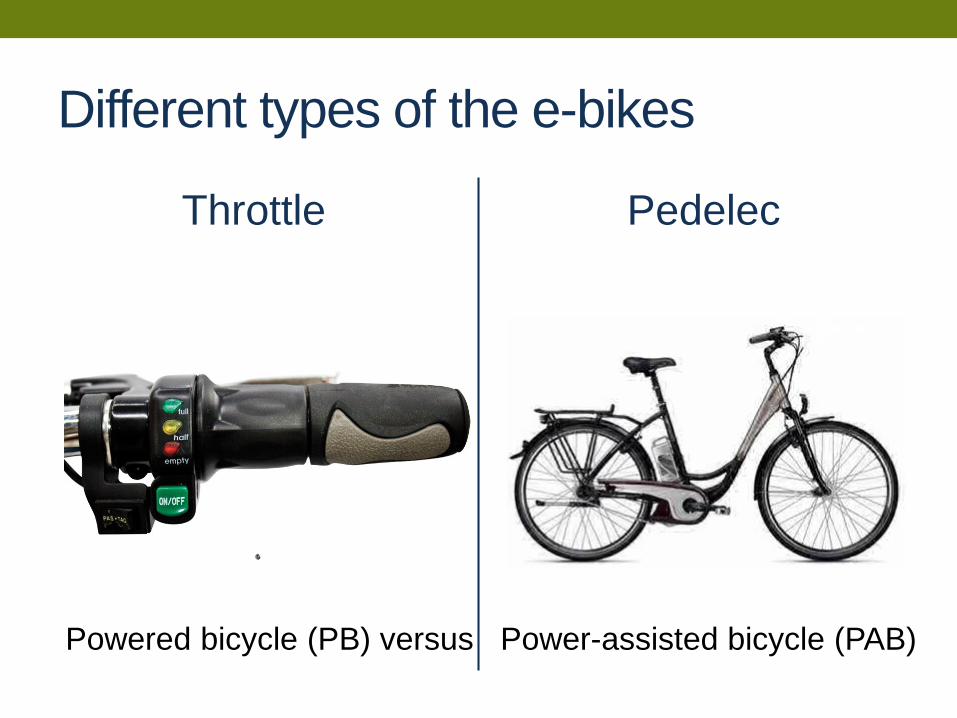
Different types of the e-bikes
Throttle Pedelec
Powered bicycle (PB) versus Power-assisted bicycle (PAB)
Market for E-bikes
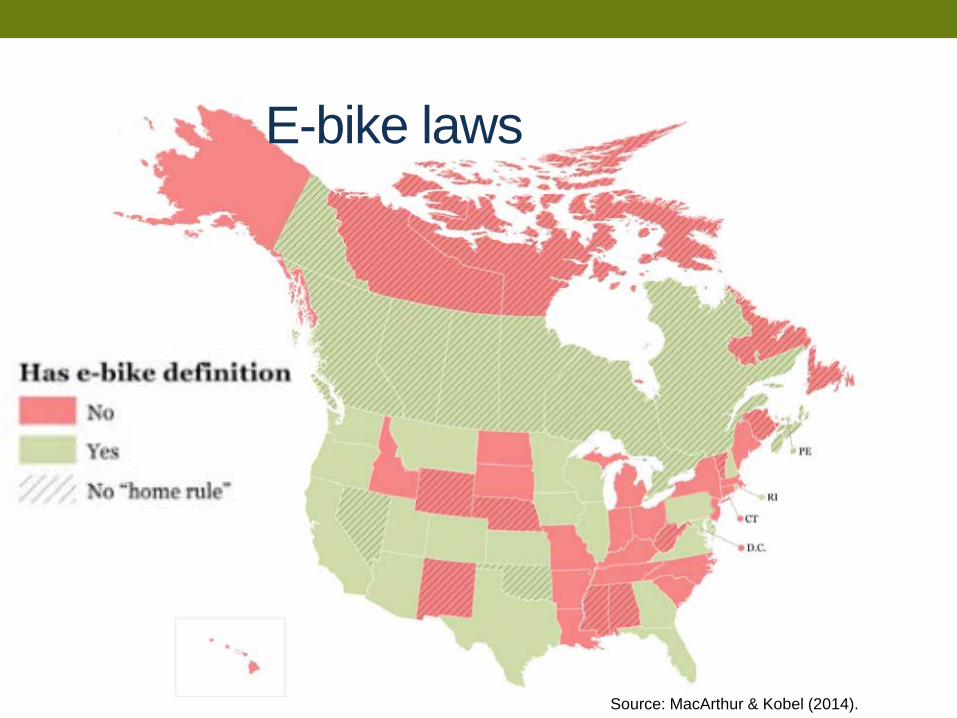
Source: MacArthur & Kobel (2014).
E-bike laws
WHY DO E-BIKES MATTER?
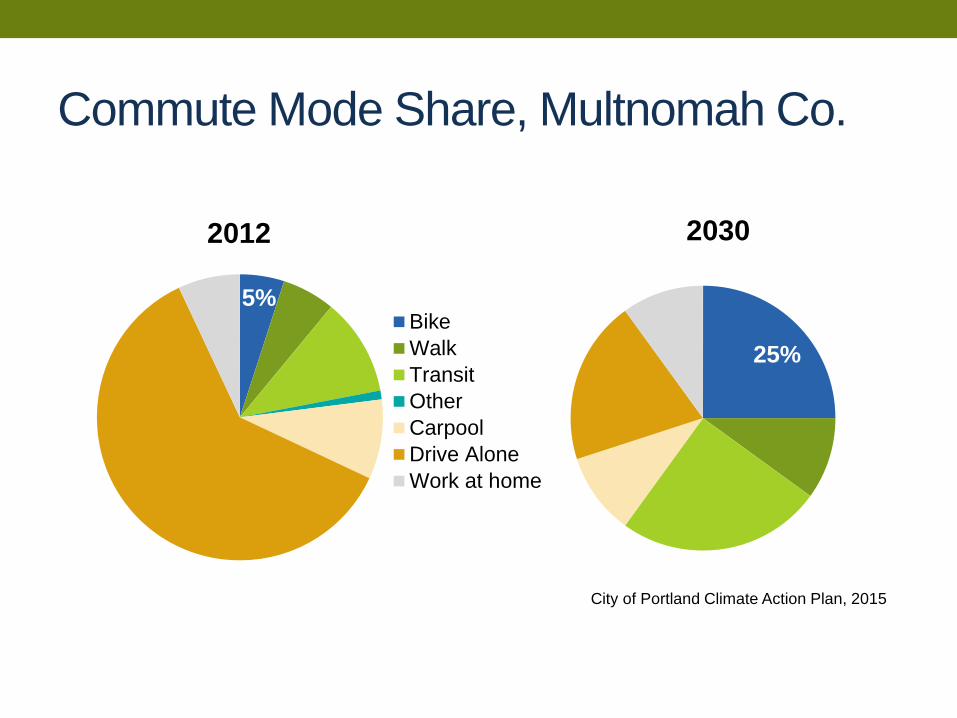
Commute Mode Share, Multnomah Co.
5%
2012
BikeWalkTransitOtherCarpoolDrive AloneWork at home
25%
2030
City of Portland Climate Action Plan, 2015
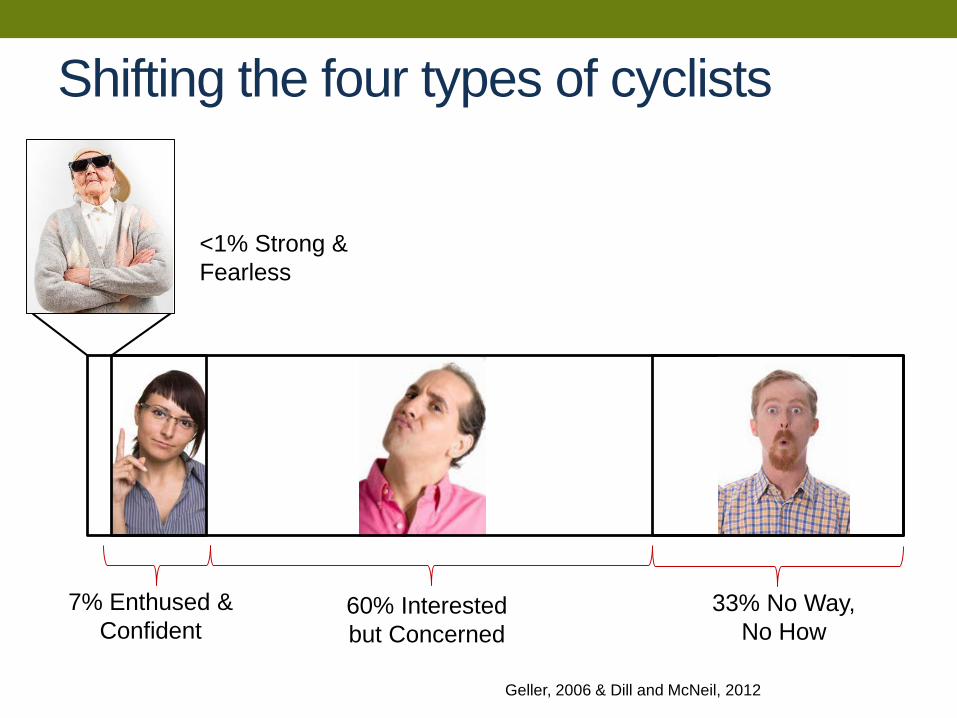
Shifting the four types of cyclists
60% Interested but Concerned
33% No Way, No How
7% Enthused &Confident
Geller, 2006 & Dill and McNeil, 2012
<1% Strong & Fearless
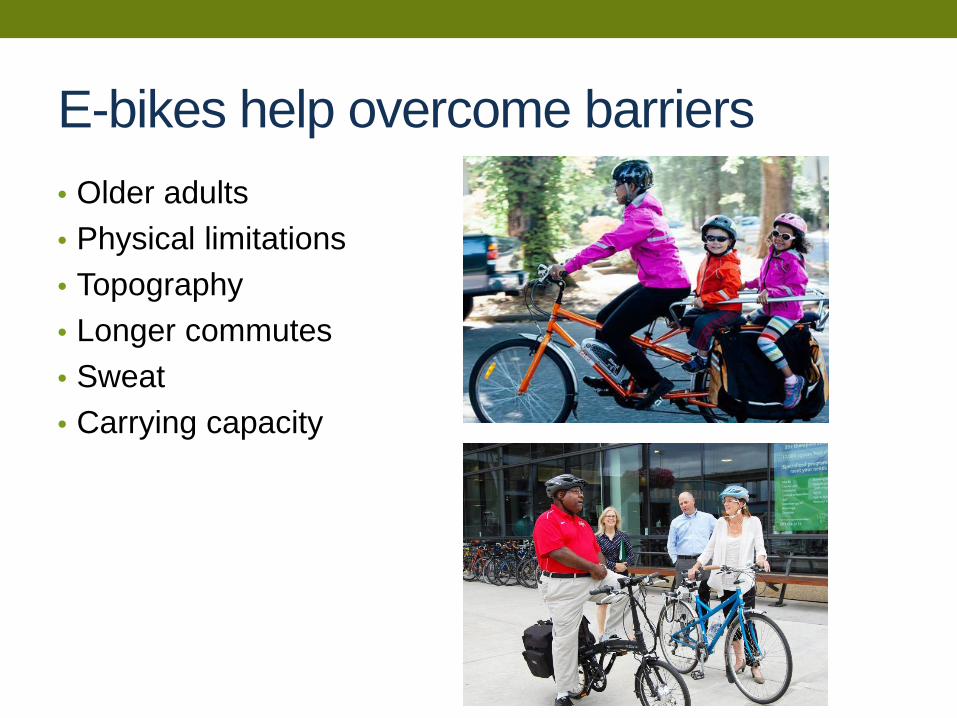
E-bikes help overcome barriers• Older adults• Physical limitations• Topography• Longer commutes• Sweat• Carrying capacity
KAISER PERMANENTE E-BIKE PILOT PROJECT
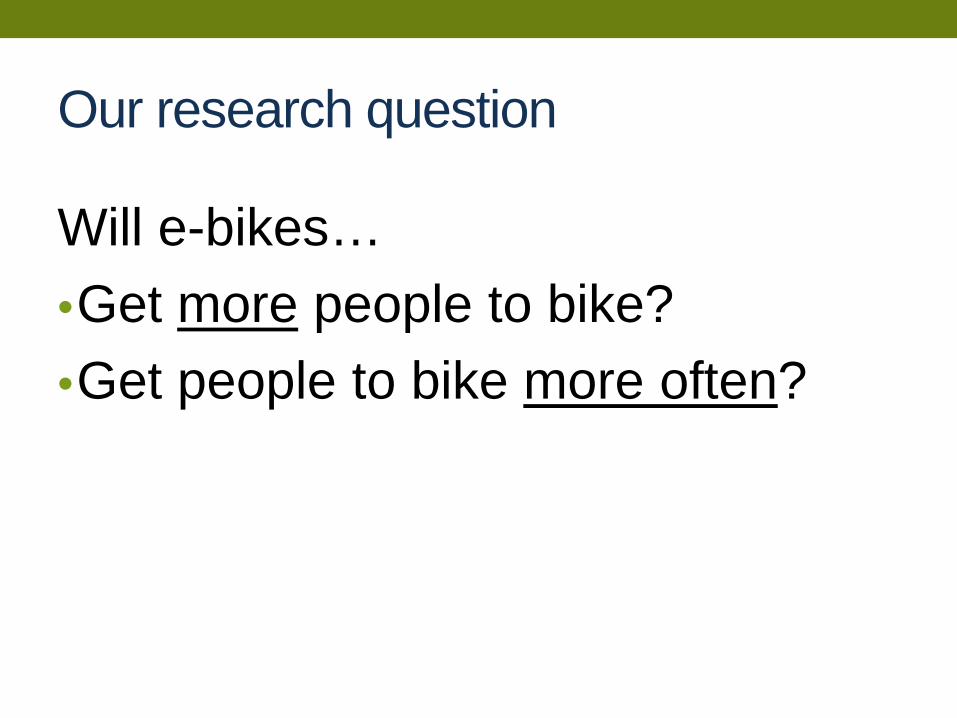
Our research question
Will e-bikes…•Get more people to bike?•Get people to bike more often?
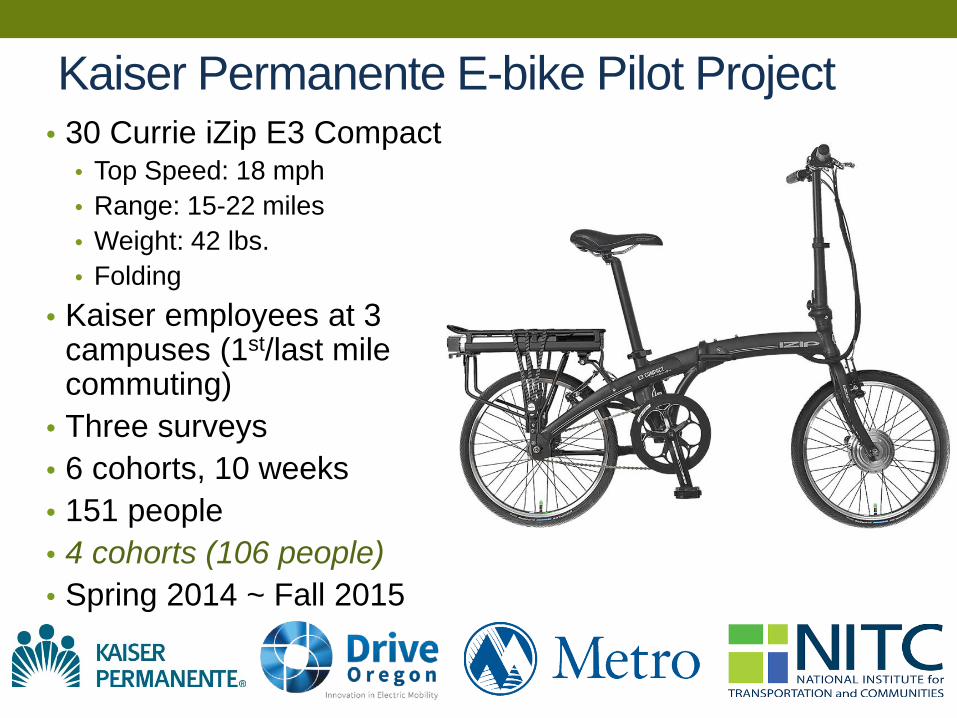
Kaiser Permanente E-bike Pilot Project• 30 Currie iZip E3 Compact
• Top Speed: 18 mph• Range: 15-22 miles• Weight: 42 lbs.• Folding
• Kaiser employees at 3 campuses (1st/last mile commuting)
• Three surveys• 6 cohorts, 10 weeks• 151 people• 4 cohorts (106 people)• Spring 2014 ~ Fall 2015
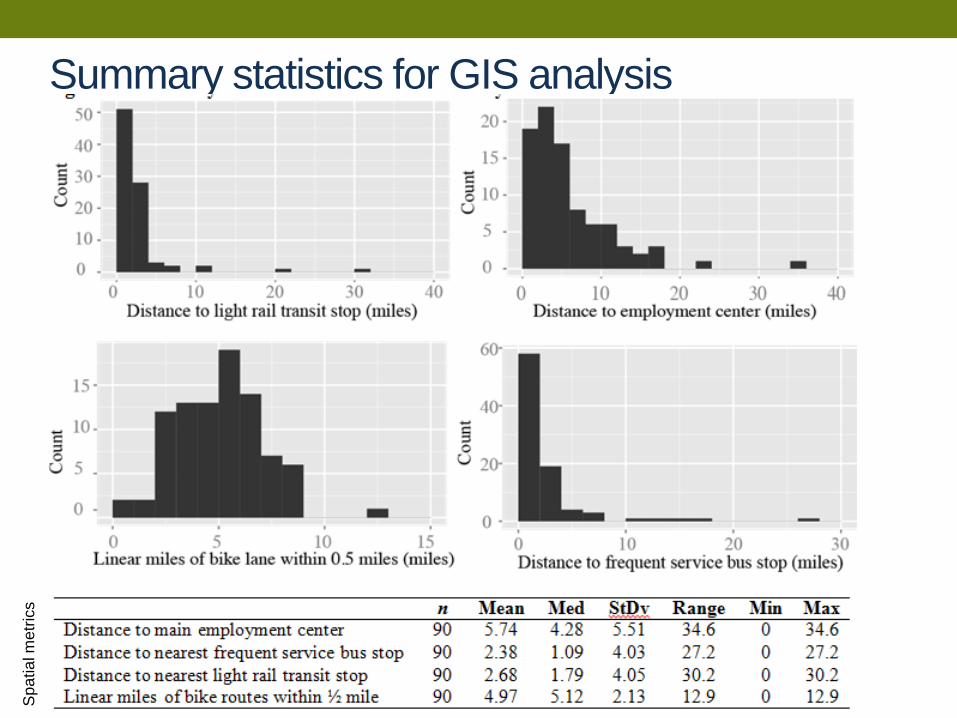
Summary statistics for GIS analysisS
patia
l met
rics
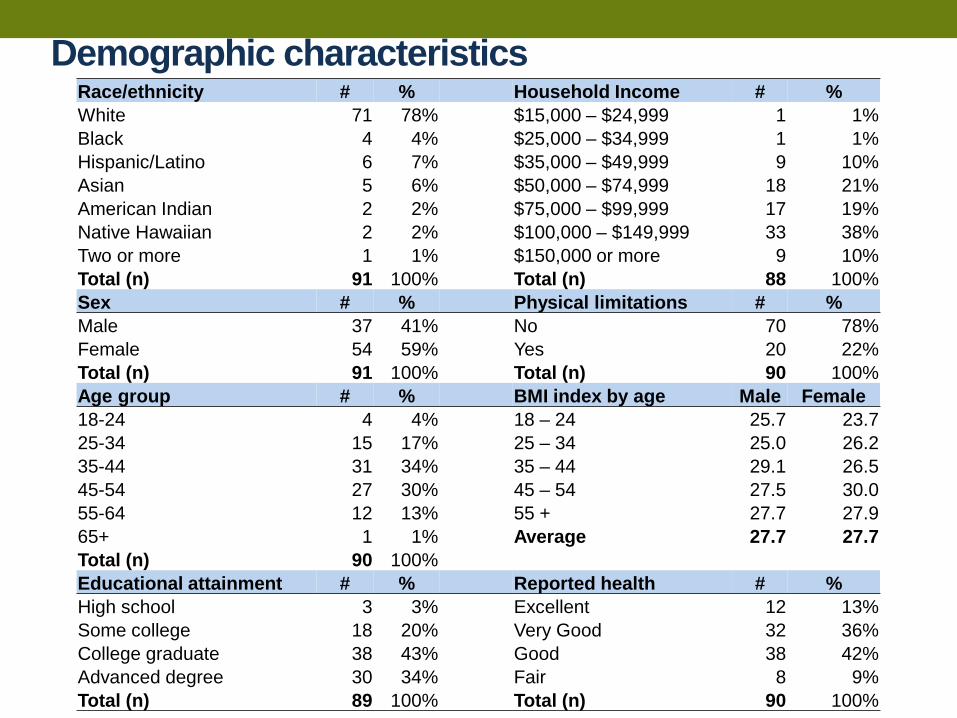
Demographic characteristicsRace/ethnicity # % Household Income # %White 71 78% $15,000 – $24,999 1 1%Black 4 4% $25,000 – $34,999 1 1%Hispanic/Latino 6 7% $35,000 – $49,999 9 10%Asian 5 6% $50,000 – $74,999 18 21%American Indian 2 2% $75,000 – $99,999 17 19%Native Hawaiian 2 2% $100,000 – $149,999 33 38%Two or more 1 1% $150,000 or more 9 10%Total (n) 91 100% Total (n) 88 100%Sex # % Physical limitations # %Male 37 41% No 70 78%Female 54 59% Yes 20 22%Total (n) 91 100% Total (n) 90 100%Age group # % BMI index by age Male Female18-24 4 4% 18 – 24 25.7 23.725-34 15 17% 25 – 34 25.0 26.235-44 31 34% 35 – 44 29.1 26.545-54 27 30% 45 – 54 27.5 30.055-64 12 13% 55 + 27.7 27.965+ 1 1% Average 27.7 27.7Total (n) 90 100%Educational attainment # % Reported health # %High school 3 3% Excellent 12 13%Some college 18 20% Very Good 32 36%College graduate 38 43% Good 38 42%Advanced degree 30 34% Fair 8 9%Total (n) 89 100% Total (n) 90 100%
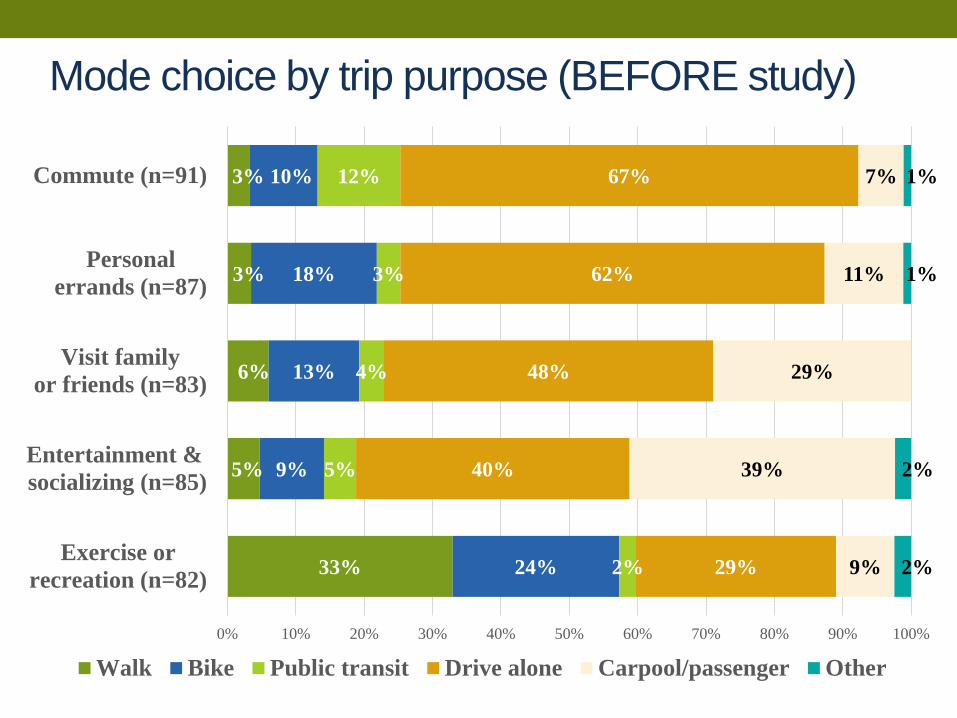
Mode choice by trip purpose (BEFORE study)
33%
5%
6%
3%
3%
24%
9%
13%
18%
10%
2%
5%
4%
3%
12%
29%
40%
48%
62%
67%
9%
39%
29%
11%
7%
2%
2%
1%
1%
0% 10% 20% 30% 40% 50% 60% 70% 80% 90% 100%
Exercise orrecreation (n=82)
Entertainment & socializing (n=85)
Visit familyor friends (n=83)
Personalerrands (n=87)
Commute (n=91)
Walk Bike Public transit Drive alone Carpool/passenger Other
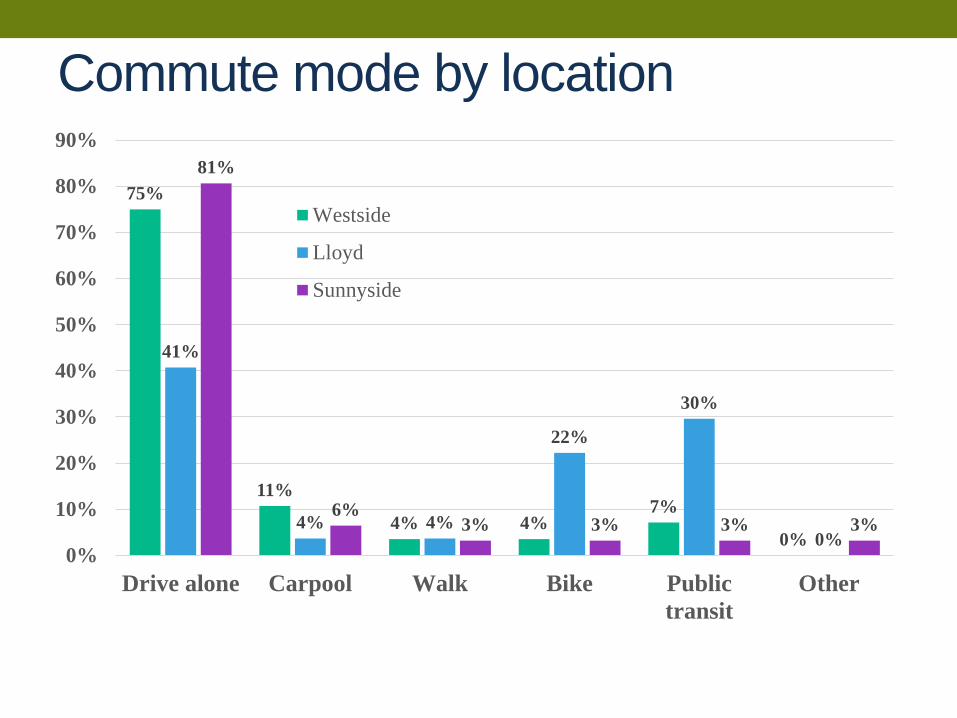
Commute mode by location
75%
11%
4% 4%7%
0%
41%
4% 4%
22%
30%
0%
81%
6%3% 3% 3% 3%
0%
10%
20%
30%
40%
50%
60%
70%
80%
90%
Drive alone Carpool Walk Bike Publictransit
Other
Westside
Lloyd
Sunnyside
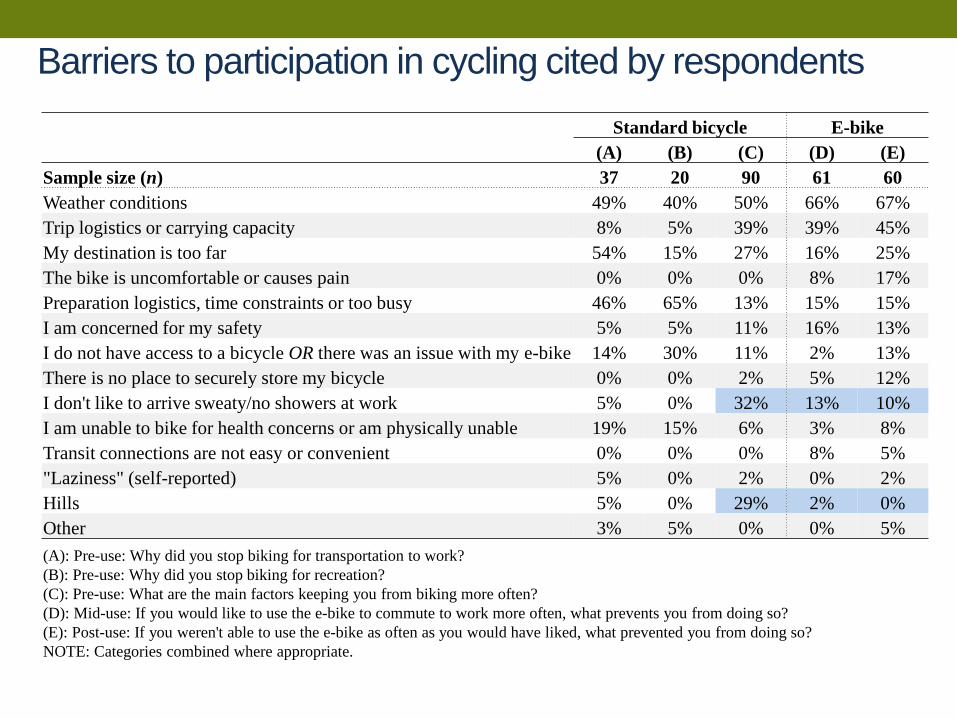
Standard bicycle E-bike(A) (B) (C) (D) (E)
Sample size (n) 37 20 90 61 60 Weather conditions 49% 40% 50% 66% 67%Trip logistics or carrying capacity 8% 5% 39% 39% 45%My destination is too far 54% 15% 27% 16% 25%The bike is uncomfortable or causes pain 0% 0% 0% 8% 17%Preparation logistics, time constraints or too busy 46% 65% 13% 15% 15%I am concerned for my safety 5% 5% 11% 16% 13%I do not have access to a bicycle OR there was an issue with my e-bike 14% 30% 11% 2% 13%There is no place to securely store my bicycle 0% 0% 2% 5% 12%I don't like to arrive sweaty/no showers at work 5% 0% 32% 13% 10%I am unable to bike for health concerns or am physically unable 19% 15% 6% 3% 8%Transit connections are not easy or convenient 0% 0% 0% 8% 5%"Laziness" (self-reported) 5% 0% 2% 0% 2%Hills 5% 0% 29% 2% 0%Other 3% 5% 0% 0% 5%(A): Pre-use: Why did you stop biking for transportation to work?(B): Pre-use: Why did you stop biking for recreation?(C): Pre-use: What are the main factors keeping you from biking more often?(D): Mid-use: If you would like to use the e-bike to commute to work more often, what prevents you from doing so?(E): Post-use: If you weren't able to use the e-bike as often as you would have liked, what prevented you from doing so?NOTE: Categories combined where appropriate.
Barriers to participation in cycling cited by respondents
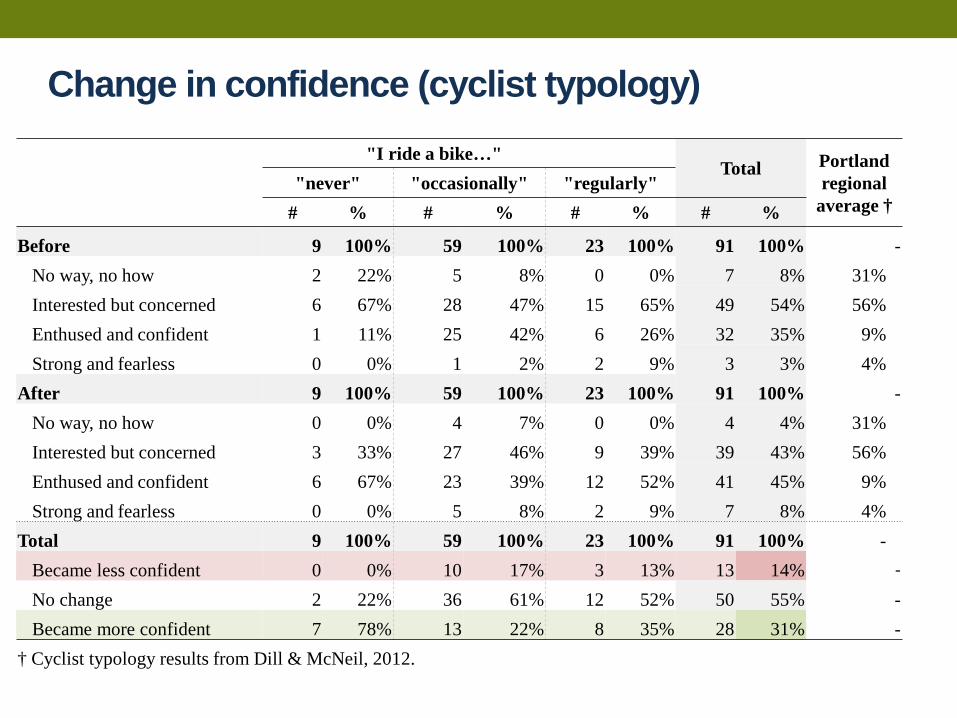
"I ride a bike…"Total Portland
regional average †
"never" "occasionally" "regularly"# % # % # % # %
Before 9 100% 59 100% 23 100% 91 100% -No way, no how 2 22% 5 8% 0 0% 7 8% 31%Interested but concerned 6 67% 28 47% 15 65% 49 54% 56%Enthused and confident 1 11% 25 42% 6 26% 32 35% 9%Strong and fearless 0 0% 1 2% 2 9% 3 3% 4%
After 9 100% 59 100% 23 100% 91 100% -No way, no how 0 0% 4 7% 0 0% 4 4% 31%Interested but concerned 3 33% 27 46% 9 39% 39 43% 56%Enthused and confident 6 67% 23 39% 12 52% 41 45% 9%Strong and fearless 0 0% 5 8% 2 9% 7 8% 4%
Total 9 100% 59 100% 23 100% 91 100% -Became less confident 0 0% 10 17% 3 13% 13 14% -
No change 2 22% 36 61% 12 52% 50 55% -Became more confident 7 78% 13 22% 8 35% 28 31% -
† Cyclist typology results from Dill & McNeil, 2012.
Change in confidence (cyclist typology)
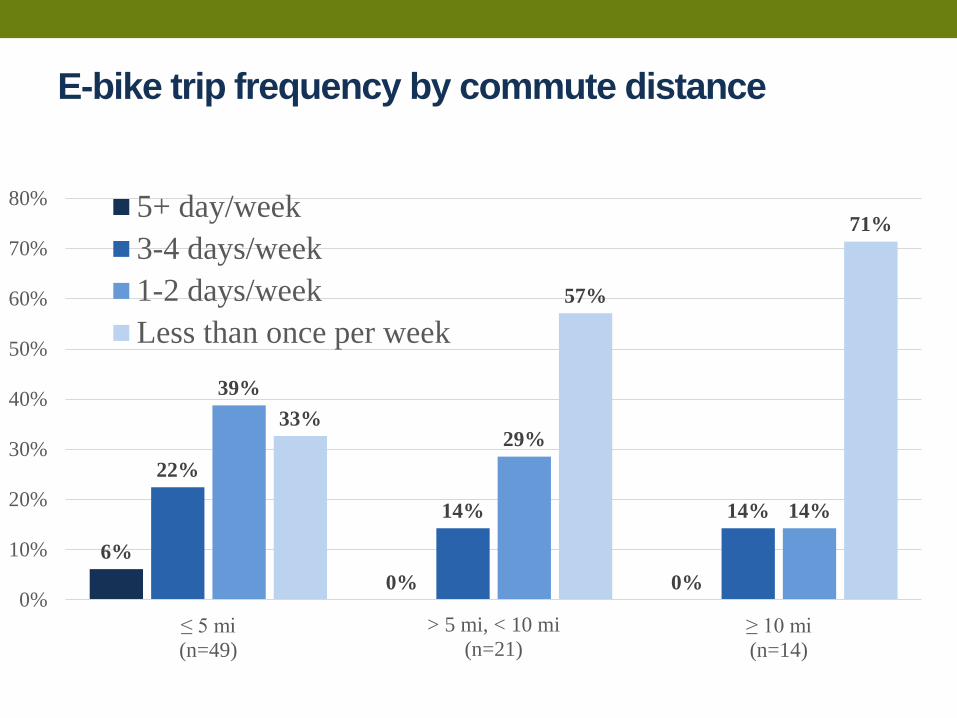
E-bike trip frequency by commute distance
6%0% 0%
22%
14% 14%
39%
29%
14%
33%
57%
71%
0%
10%
20%
30%
40%
50%
60%
70%
80%
≤ 5 mi(n=49)
> 5 mi, < 10 mi(n=21)
≥ 10 mi(n=14)
5+ day/week3-4 days/week1-2 days/weekLess than once per week
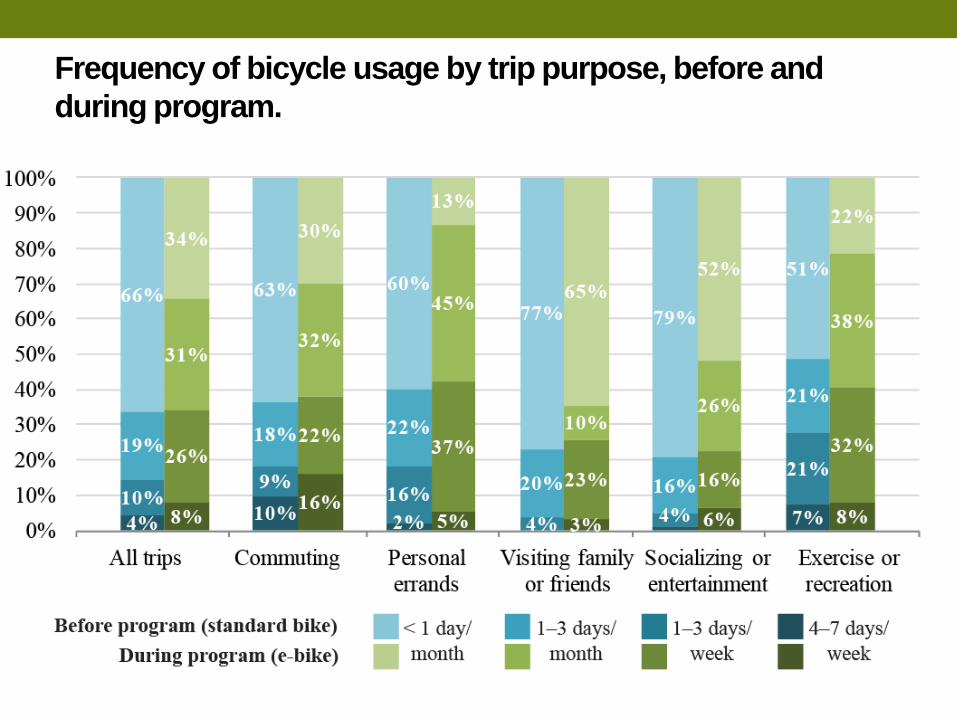
Frequency of bicycle usage by trip purpose, before and during program.
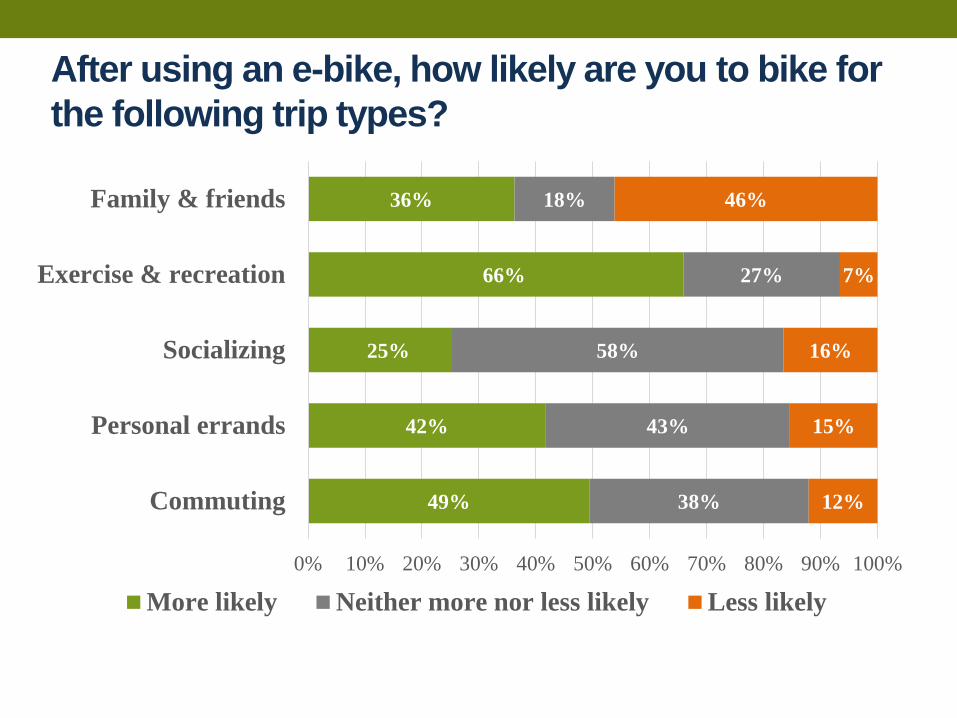
After using an e-bike, how likely are you to bike for the following trip types?
49%
42%
25%
66%
36%
38%
43%
58%
27%
18%
12%
15%
16%
7%
46%
0% 10% 20% 30% 40% 50% 60% 70% 80% 90% 100%
Commuting
Personal errands
Socializing
Exercise & recreation
Family & friends
More likely Neither more nor less likely Less likely
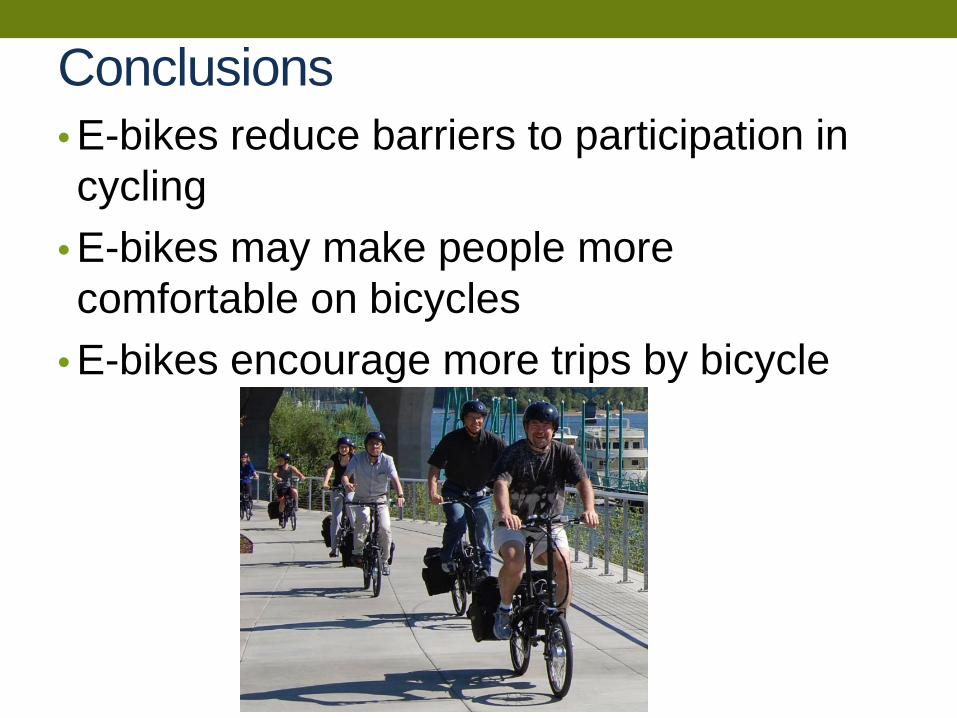
Conclusions• E-bikes reduce barriers to participation in cycling
• E-bikes may make people more comfortable on bicycles
• E-bikes encourage more trips by bicycle

Contact InformationNick Kobel• [email protected]• 503-823-9906
John MacArthur• [email protected]• 503-725-2866• trec.pdx.edu
For more information & reports: ebike.research.pdx.edu