evaluation of aldot ditch check practices using large ... · evaluation of aldot ditch check...
TRANSCRIPT

Research Report No. 4 Project Number: 930-826R
Evaluation of ALDOT Ditch Check Practices using Large-Scale Testing Techniques
Large-scale Channel Testing (ASTM D 7208 – modified)
Evaluation of Silt Fence Ditch Checks
over Poorly Graded Sand
August 2014
Submitted to: Alabama Department of Transportation
1409 Coliseum Boulevard Montgomery, Alabama 36110
Submitted by: Dr. Wesley C. Zech Dr. Xing Fang, P.E.
Dr. Wesley N. Donald

Highway Research Center Samuel Ginn College of Engineering
i
DISCLAIMERS
The contents of this report reflect the views of the authors who are responsible for the facts and accuracy of the data presented herein. The contents do not necessarily reflect the official views or policies of the Alabama Department of Transportation or the Auburn University Highway Research Center. This report does not constitute a standard, specification, or regulation. Comments contained in this report related to specific testing equipment and materials should not be considered an endorsement of any commercial product or service; no such endorsement is intended or implied.
NOT INTENDED FOR CONSTRUCTION, BIDDING, OR PERMIT PURPOSES Dr. Wesley C. Zech
& Dr. Xing Fang, P.E.
Research Supervisors
Dr. Wesley N. Donald Post-Doctoral Fellow
ACKNOWLEDGEMENTS
This project was sponsored by the Alabama Department of Transportation (ALDOT). Material contained herein was obtained in connection with a research project “Evaluation of ALDOT Ditch Check Practices using Large-Scale Testing Techniques,” ALDOT Project 930-826R, conducted by the Auburn University Highway Research Center. The funding, cooperation, and assistance of many individuals from each of these organizations are gratefully acknowledged. The findings, opinions, and conclusions expressed in this report are those of the authors and do not necessarily reflect the view of the sponsor.
EXECUTIVE SUMMARY
Ditch checks are used to impound stormwater runoff in channelized flow areas on construction sites. The primary purpose of ditch checks is to control erosion in earthen runoff conveyances by decreasing velocity and therefore erosive shear stresses. This occurs by creating the longest impoundment area possible by causing supercritical flow to transform into subcritical flow that results in greater depths and decreased velocity. Creating large impoundments generates forces that can compromise the structural integrity of the ditch check. This is of particular concern for silt fence ditch checks, which are the tallest ditch checks used by ALDOT. The standard ALDOT silt fence ditch checks installation tested uses a “V” pattern typically used by many state highway agencies (SHAs). The “V” pattern reinforces the installation and helps maintain the structural integrity of the installation. Variations of this installation were tested to determine the impoundment capabilities, the longevity capabilities, sediment retention, and installation protocol improvements. This testing exhibited a new pinning installation that omits trenching the silt fence into the channel bottom as a viable option for installing the silt fence. The addition of a weir, which the Tennessee Department of Transportation uses, as a silt fence installation alternative is also an option that can allow ALDOT to vary the height of the weir to fit the channel geometry and flow depth capabilities while also reducing the impoundment pressure placed upon the ditch check. A longevity test using sediment-laden water performed on a silt fence installation using the pinning installation and a weir retained approximately 90% of total solids during 6 additional tests performed.

Highway Research Center Samuel Ginn College of Engineering
ii
Table of Contents
1 INTRODUCTION ............................................................................................................................................................. 1
2 BACKGROUND ................................................................................................................................................................. 1
3 TESTING METHODOLOGY .......................................................................................................................................... 2
3.1 Test Channel ........................................................................................................................................................... 2
3.1.1 Preparation of the Test Channel ........................................................................................................... 3
3.2 Test Flows ............................................................................................................................................................... 3
3.3 Installation Evaluation Regime ...................................................................................................................... 3
3.3.1 Materials for Installations ....................................................................................................................... 3
3.3.2 Silt Fence Ditch Check Installation Tests .......................................................................................... 4
3.4 Data Collected ........................................................................................................................................................ 5
4 RESULTS AND DISCUSSION ....................................................................................................................................... 6
5 CONCLUSIONS ............................................................................................................................................................... 13
6 RECOMMENDATIONS FOR IMPLEMENTATION ............................................................................................. 13
7 REFERENCES ................................................................................................................................................................. 14
8 APPENDIX A: GUIDANCE TABLES FOR DETERMINING LENGTH OF SILT FENCE ........................... 15
List of Figures
Figure 1: Silt Fence Structural Failures. ......................................................................................................................... 2
Figure 2: Ditch Check Test Channel Dimensions and Configuration. ................................................................. 2
Figure 3: Silt Fence Ditch Check Installation Configurations. ............................................................................... 5
Figure 4: Erosion Pattern of Standard ALDOT Silt Fence Installation. .................................................................. 6
Figure 5: Downstream Modifications for V-Installation Silt Fence and Erosion Patterns. ............................... 7
Figure 6: TDOT Enhanced Silt Fence Installation (TDOT 2012). ........................................................................... 8
Figure 7: TDOT Enhanced Silt Fence Ditch Check Test. ........................................................................................... 9
Figure 8: Pinned Silt Fence Installation Test. ................................................................................................................ 10
Figure 9: Comparison of Hydraulic Performance of Full Height vs Weir Installation. ............................. 11
Figure 10: Sediment-Laden Silt Fence Longevity Test. ............................................................................................ 12
Figure 11: Erosion and Deposition Patterns of Silt Fence Longevity Test. ......................................................... 13
Figure 12: Recommended Silt Fence Ditch Check Detailed Drawings. ............................................................ 14
Figure 13: Variation of Silt Fence Angle and Required Length of Silt Fence. ................................................ 15
List of Tables
Table 1: Min. Silt Fence Lengths (Lmin) to Contain Impounded Water for Various Channel Depths. .. 17
1
1 INTRODUCTION Controlling erosion and sediment transport on construction sites has been deemed a top priority for environmental agencies such as the US Environmental Protection Agency (EPA) and the Alabama Department of Environmental Management (ADEM). Optimizing erosion and sediment control practices on construction sites has been the focus of this research study for the Alabama Department of Transportation (ALDOT). The use of ditch checks has been widely used on ALDOT construction sites and a need arose for determining the optimal practice and installation procedures for each ditch check.
Ditch checks are obstructions placed in the paths of channelized flows that impound water. This water impoundment creates subcritical, low velocity pools that reduce channel shear stress imposed on the bottom of an earthen channel and channel erosion. As these pools increase, impoundment forces placed upon these structures also increase. Therefore, these practices must be able to withstand these forces without loss of structural integrity in order to maximize performance. If a silt fence installation was to fail at full pool, the resulting hydraulic bore would most likely cause subsequent failures of ditch checks downstream, potentially making them ineffective.
2 BACKGROUND Silt fences are typically used as perimeter controls for construction sites. These are barriers installed down gradient of disturbed areas and are typically meant to intercept sheet flow. A properly functioning silt fence when used as a sheet flow interceptor is installed at the same grade across the gradient so that flow is evenly distributed across the width of the silt fence. The silt fence is trenched-in either by (1) digging a 6 in. by 6 in. (15 by 15 cm) trench and compacting soil on top of the trenched-in fabric or (2) using a silt fence installation machine that slices the ground open, pushes the fabric into the ground, and pushes the slice back together. If undercutting is prevented by properly installing the silt fence, then flow will impound up gradient.
As sediment deposits on silt fence, flow-through is restricted and the water level increases. This scenario could become problematic if a portion of the silt fence is installed down gradient of the rest of the fence, creating a low point and therefore a point of concentration. Often when a point of concentration occurs, the flow overtops at the low point once the fence reaches its volumetric capacity, creating a scour area on the down gradient side. Downstream scour combined with hydrostatic and hydrodynamic forces can cause the fence to fail and be pushed over, which releases impounded water and sediment deposited on the upstream side of the fence. Even though typical silt fence perimeter installations tend to have structural integrity problems when flows are concentrated to one point, silt fence can be used in drainage channels as a ditch check, exposing the barrier to the greatest flow concentrations created on the construction site. Silt fence ditch checks can also be pushed over in the same manner as silt fence perimeter controls used as flow interceptors if improperly installed and flow is concentrated to one point along the fence as shown in Figure 1.
Due to this failure concern, the structural integrity of silt fence ditch checks should be evaluated. Improving overall structural integrity and minimizing failure possibilities of silt fence installations should reduce the maintenance requirements and increase the longevity of the practice.

2
(a) perimeter control (b) ditch check under channelized flow
Figure 1: Silt Fence Structural Failures.
3 TESTING METHODOLOGY All tests conducted as part of this research were performed at the Auburn University Erosion and Sediment Control Facility (AU‐ESCTF) located at the National Center for Asphalt Technology (NCAT) in Opelika, AL.
The standard test method referenced for the development of the testing methodology used in this study was ASTM D 7208‐06: Standard Test Method for Determination of Temporary Ditch Check Performance in Protecting Earthen Channels from Stormwater‐Induced Erosion (2).
3.1 Test Channel
The AU‐ESCTF has a test channel dedicated to performance testing of ditch checks in channelized flow applications and is shown in Figure 2(a) and (b).
(a) Elevation View
(b) Cross-Sectional View
Figure 2: Ditch Check Test Channel Dimensions and Configuration.
Metal Section
Earthen Section
Concrete Section
..
...
.
CS1CS2
CS3CS4
CS5CS6 CS7 CS8
Ditch Check
3 ft3 ft
3 ft3 ft
3 ft3 ft
CL
5%
1 2 3 4 5 6 7 8 9
1 ft 1 ft 1 ft 1 ft1 ft 1 ft1 ft 1 ft
13
4 ft4.5 ft
1.5 ft

3
The ditch check testing channel has a trapezoidal cross-section with a top width of 13 ft (4 m) and a bottom width of 4 ft (1.2m) with 3H:1V side slopes. The depth of the channel is 1.5 ft (0.5 m) and is 39.5 ft (12 m) long. The channel is divided into a galvanized steel plated section 24.5 ft (7.5 m) long and an earthen section 15 ft (4.6 m) long. The longitudinal slope of the channel is 5%. The earthen section allowed for field quality installations and performance observations of the ditch checks. The metal lined portioned allowed the ditch checks to be tested regardless of channel performance.
3.1.1 Preparation of the Test Channel
Before each test, the 15 ft (4.6 m) earthen section is tilled using a rear tine tiller, hand raked, hand tamped, and then mechanically compacted using an upright rammer hammer with a compaction plate of 14 x 11.5 in. (36 x 29 cm), a blow count of 600 blows/minute and a compaction force of 2,700 lbs (1,225 kg). The soil within the earthen section was classified as a poorly graded sand using the USCS Soil Classification System. The maximum density of 123.8 lbs/ft3 (19.44 kN/m3) was determined by the method described in ASTM D698-07, Standard Test Methods for Laboratory Compaction Characteristics of Soil Using Standard Effort (3). In-place density samples were taken with a density drive hammer and thin walled Shelby tubes to verify that at least 95% of standard Proctor density was achieved.
3.2 Test Flows
The test for silt fence ditch check installation evaluation for this study used low flow test flow of 0.56 cfs (16 L/s) of clean water for a duration of 30 minutes. Prior to testing, eight level string lines were stretched across the channel at 8 cross-sectional (CS) locations (Figure 2(a): CS-1 to CS-8), six upstream and two downstream of the ditch check. The measurement points were spaced 1 ft (0.3 m) apart along each string line. These string lines were used to determine erosion and deposition at each point, and water depth and velocity measurements at points 4, 5 and 6 shown in Figure 2(b) during each test.
3.3 Installation Evaluation Regime
A series of low flow, large‐scale ditch check experiments were performed to evaluate each installation configuration. These were done to comparatively analyze the three different silt fence ditch check installation configurations. For each installation configuration, three replicate tests were performed to determine the average performance of the practices and ensure the installations were performing adequately.
3.3.1 Materials for Installations
The following is a list of materials used for the various silt fence installation configurations: silt fence fabric: 3.5 oz. (100 g), nonwoven filter fabric (FF), 45 in. (114 cm) wide. The fabric is
attached to wire backing with c-ring staples. The fabric is trenched in a 6 by 6 in. (15 by 15 cm) trench or stapled to the channel bottom on top of a FF underlay using two rows of sod pins, staggered and spaced 10 in. apart (25.4 cm),
FF underlay: 8 oz. (226 g), nonwoven FF, 12.5 ft (3.8 m) long that extends the length of both of the V sides of the 45 degree ditch check installation. Each section is 3 ft (1 m) wide and extends 1 ft (0.3 m) upstream of the silt fence and 2 ft (0.6 m) downstream of the silt fence when the pinned silt fence installation is used. The underlay is pinned to the channel bottom with sod pins spaced 10 in. (25.4 cm) on center,
sod pins: 11 gauge metal, 6 in. (15 cm) long by 1 in. (2.5 cm) diameter round top pins, used to secure the filter fence and the filter fabric underlay to the channel bottom,
wire mesh backing: 14 gauge steel wire mesh with a minimum 6 in. by 6 in. (15 by 15 cm) vertical and horizontal spacing of the wire mesh,

4
c-ring staples: 11/16 in. (1.7 cm), 16 gauge, galvanized steel. The c-ring staples are used to attach the filter fabric to the top wire of the wire backing,
studded t-post: 5 ft (1.5 m) studded steel t-post, driven into the ground 24 in. (60 cm) spaced 3 ft (1 m) apart on center,
wire ties: 6.5 in (16.5 cm), 11 gauge, aluminum fence tie wires. These wire ties are used to secure the wire backing to the t-posts,
hay bale: 3 ft (1 m) long bound straw bale with a weight of approximately 35 lbs (16 kg), modified no. 4 coarse aggregate: consist of graded aggregate ranging from 4 in. to ¾ in. (10 to 2
cm) with not more than 10 % greater than 4 in. (10 cm), at least 20% to 55% 1 in. (2.5 cm) and no more than 15% smaller than ¾ in.( 2 cm), and
ALDOT Class I riprap: graded stones ranging from 10 to 100 lbs (4.5 to 45 kg) with not more than 10% having a weight over 100 pounds (45 kg) and at least 50% having a weight over 50 lbs (23 kg) and not over 10% having a weight under 10 lbs (4.5kg) (4).
3.3.2 Silt Fence Ditch Check Installation Tests
The channel was prepared to experimental specifications for all tests performed on the five different silt fence ditch check installation configurations so direct comparisons could be made between each configuration. The following five silt fence installation configurations[Fig. 3 (a)–(e)] were tested:
(1) Standard ALDOT V Installation [Fig. 3(a)]: center post placed in the channel centerline, posts are spaced 2.5 ft (76 cm) on center in a V pattern. Fabric and wire backing is trenched in a 6 in. by 6 in. (15 by 15 cm) trench. Overall fence height is 32 in. (81.3 cm)
(2) Standard ALDOT V Installation w/Hay Bale Dissipater [Fig. 3(b)]: installed in the same manner as the Standard ALDOT V installation, however hay bales were placed downstream, abutted to the fence in an attempt to dissipate energy and reduce downstream scour next to the fence.
(3) Standard ALDOT V Installation w/Modified No. 4 Stone Dissipater [Fig. 3(c)]: installed in the same manner as the Standard ALDOT V Installation, however modified no. 4 stone is placed downstream, in an attempt to dissipate energy and reduce downstream scour next to the fence.
(4) TDOT Enhanced Silt Fence Check Installation [Fig. 3(d)]: installed in the same manner as the Standard ALDOT V Installation, however an 18 in. (45.7 cm) tall weir is cut into the fabric that extends across the width of the channel bottom. Directly downstream of the weir, a 2 ft (60.9 cm) wide 8 oz. (226 g) FF splash apron over the length of the weir is installed and covered with ALDOT Class I riprap to dissipate energy of the water overtopping the weir.
(5) Enhanced ALDOT Pinned Installation [Fig. 3(e)]: the Standard ALDOT V Installation w/Pinning is installed, however a weir is cut into the fabric in the same manner as the TDOT Enhanced Silt Fence Installation.
(a) std. ALDOT V installation (b) std. ALDOT V install. w/hay bale dissipater
5
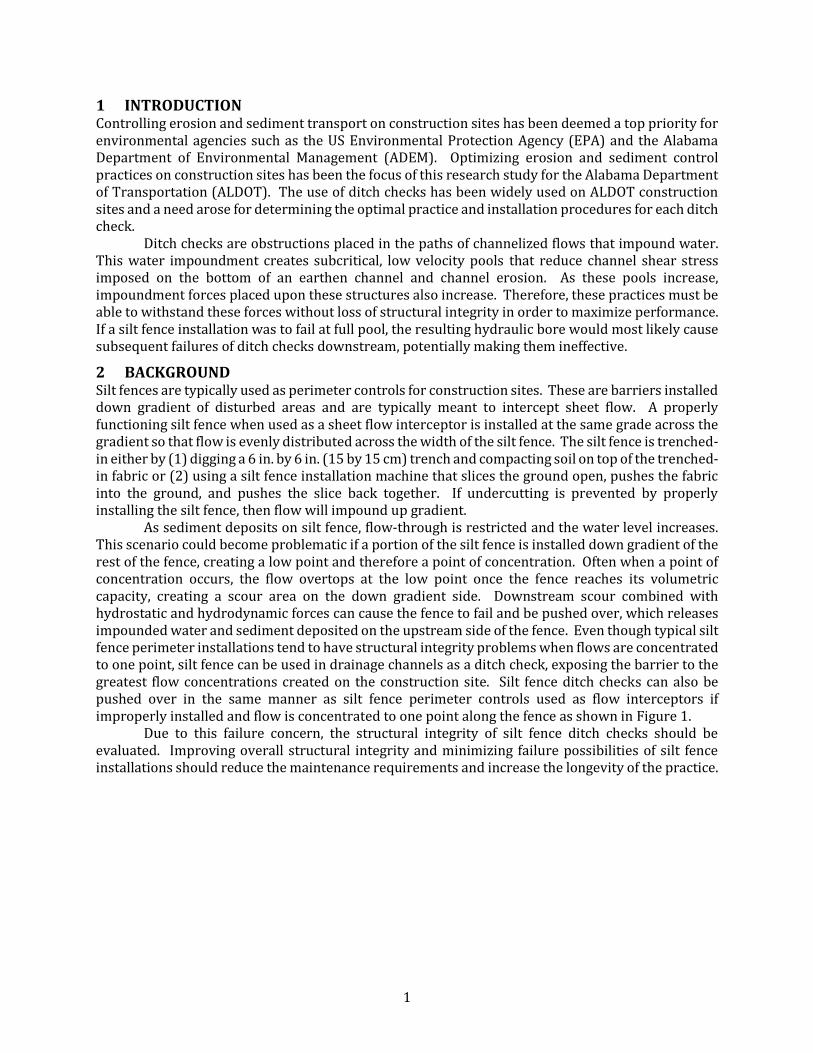
(c) std. ALDOT V install. w/mod. #4 dissipater (d) TDOT enhanced install. w/rip rap dissipater
(e) enhanced ALDOT pinned installation
Figure 3: Silt Fence Ditch Check Installation Configurations.
3.4 Data Collected
Once steady-state flow conditions were achieved, water depth and velocity measurements were taken at cross-sectional measurements points, 4, 5, and 6 cross sections CS1 – CS8 shown in Figure 2(a) and (b). Measurements at these points were averaged to determine the average water depth and average velocity for each cross section. The distance from the upstream face of the ditch check to the hydraulic jump was also recorded once steady-state conditions were achieved to determine subcritical flow length created by the installation’s ability to impound water.
Using the collected data, the slope of the energy grade line (EGL) for the water profile was plotted as specified by ASTM D 7208-06. The EGL is defined by equation 1 (2).
EGL = WSE + v2/2g [EQ. 1]
where, EGL = energy grade line (ft, m) WSE = water surface elevation (ft, m) v = average water velocity (ft/sec, m/s) g = gravitational constant (32.2 ft/sec2, 9.8 m/s2)
The potential energy and resulting hydrostatic and hydrodynamic pressure built up by the
subcritical flow must be resisted by the installation before it is returned to kinetic energy as the impounded water goes under, through and/or over the ditch check. The EGL is affected by the impoundment capabilities of each practice. The silt fence installations directly affected the

6
impoundment capabilities of the structure when mimicking the TDOT enhanced silt fence ditch check. The TDOT enhanced silt fence ditch check installation uses a weir to reduce impoundment pressures placed upon the structure. This allows flows to freely overtop the practice and results in a modification of the EGL, which will be discussed in section 4.
4 RESULTS AND DISCUSSION The following section is a summary of the results and comparisons that were made from the silt fence ditch check experiments. Due to the height of the silt fence ditch check, impoundment lengths will not be reported because when tested using the full height of the silt fence, the impoundment overtopped the channel banks and impounded water the entire length of the test channel. Had the channel been longer, a longer impoundment length would have been measured. Therefore, this report will focus on erosion and deposition, impoundment depths, and EGL.
Since structural failure is the major concern for the silt fence ditch check, evaluation of the “V” installation required investigation. This installation was tested to determine possible structural failure modes. Silt fence installations typically degrade over time as water passes through or over the filter fabric and creates scour points directly downstream. These scour points can erode around the middle t-post reducing the structural integrity of the installation and cause the fence to eventually fail by falling over. These scour patterns became evident after testing the standard ALDOT installation under low flow conditions of 0.56 cfs (16 L/s). This is shown in Figure 4.
(a) pre-test (b) post-test
(c) downstream erosion pattern
Figure 4: Erosion Pattern of Standard ALDOT Silt Fence Installation.
7
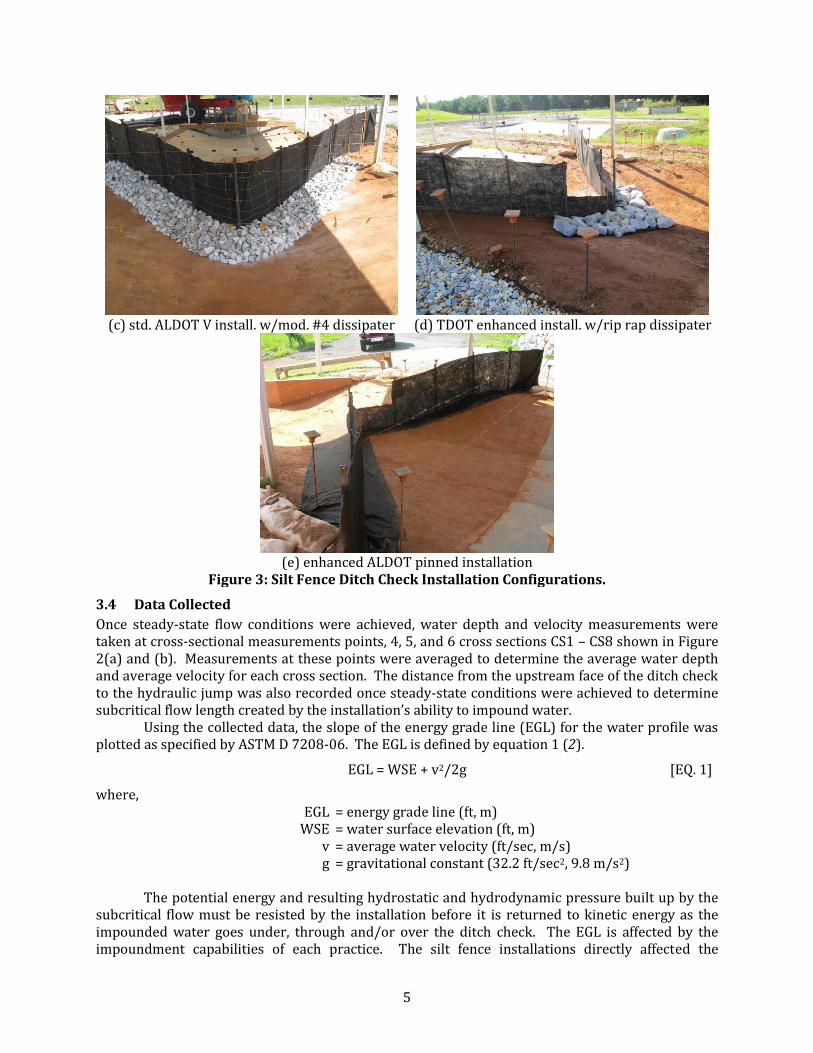
Figure 4(c) shows that up to 0.1 ft (3 cm) of erosion occurred directly downstream of the ditch check after one, 30 minute test at 0.56 cfs (16 L/s). Due to this, an installation modification directed towards reducing this downstream scour was tested. The proposed modifications included using rock or hay bales positioned directly downstream of the silt fence, to be used as flow dissipation and channel protection. These modifications are shown in Figure 5.
(a) hay bale dissipater pretest (b) modified no. 4 dissipater pretest
(c) hay bale dissipater posttest (d) modified no. 4 stone dissipater post test
(e) hay bale dissipater erosion pattern (f) modified no. 4 erosion pattern
Figure 5: Downstream Modifications for V-Installation Silt Fence and Erosion Patterns.
The inclusion of downstream dissipation measures (i.e., hay bales, modified no. 4 stone) did not improve the erosion patterns for the channel. However, the modified no. 4 stone dissipater did

8
manage to move the erosion away from the downstream side of the fence as shown in Figure 5. Once beyond the dissipaters, the flow is able to resume supercritical flow velocities causing downstream erosion. Erosion occurred beneath the hay bales, but the rock reduced the erosion directly downstream of the fence. It should be noted that using a rock dissipation method may not be cost effective and would create a need to remove the rock once construction is complete, thereby increasing the overall cost of the practice.
The Tennessee Department of Transportation (TDOT) enhanced silt fence ditch check installation was also evaluated. This installation uses a weir cut horizontally across the fabric the width of the channel bottom. This weir is approximately 18 in. high and uses a splash pad downstream of the weir. This splash pad is comprised of a geotextile fabric and riprap. This installation detail is shown in Figure 6.
(a) plan view (b) elevation and cross-sectional views
Figure 6: TDOT Enhanced Silt Fence Installation (TDOT 2012).
The purpose of this installation is to minimize the amount of impoundment upstream of the silt fence in an attempt to reduce the hydrostatic and hydrodynamic pressure placed on the device. This method reduces the amount of silt fence that needs to be installed outside of the channel, if the depth of the ditch is less than the height of the fence. This installation is shown in Figure 7.
The weir allowed flow to impound the entire length of the channel, creating 30 ft (10 m) of subcritical flow. This is the optimum condition for earthen channels whereas flow is impounded the maximum impoundment length and the ditch check is not subjected to adverse conditions created by a much larger impoundment. Testing this method showed that a splash pad was an effective means of controlling scour directly downstream of the ditch check. This is evident in Figure 7(d).
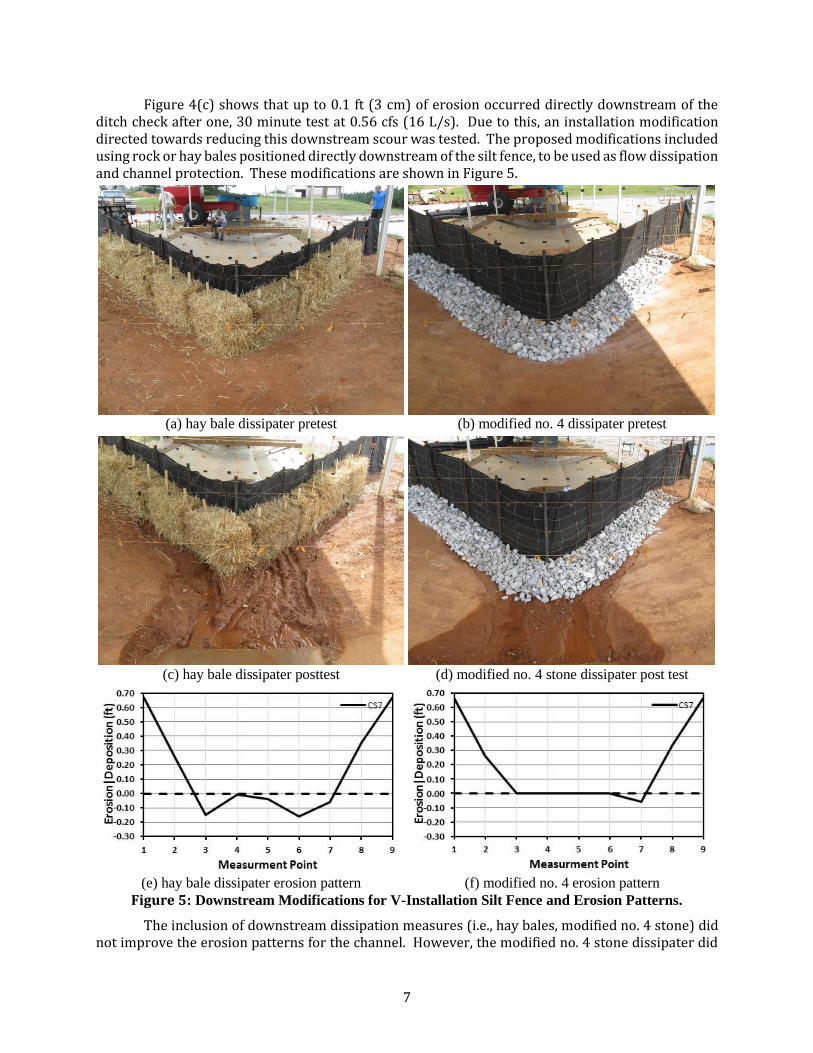
Integration of a downstream splash pad appeared to be the optimum choice. However, proper implementation of this enhancement was crucial to the success of the practice. Installing the splash pad after the silt fence is installed could create gaps between the splash pad and the fence. These gaps could allow water to undercut the splash pad. The ideal scenario is to install the underlay first, then the silt fence on top, however, this creates issues with trenching the fence into the channel. Therefore, a new installation was developed that includes an underlay, which extends 2 ft (0.6 m) downstream and 1 ft (0.3 m) upstream and does not involve trenching the fence into the channel. Instead, the extra fabric is pinned to the channel bottom upstream of the ditch check as shown in Figure 8(a).

9
(a) pre-test (b) 18 in. weir
(c) post-test (d) effect of underlay
Figure 7: TDOT Enhanced Silt Fence Ditch Check Test.
The downstream splash pad provided protection immediately downstream of the ditch check
however, downstream erosion is still a concern for this and all ditch check practices. Figure 8(d)
demonstrates how properly spacing the ditch check would create a subcritical pool directly downstream of
each ditch check that results in less channel scour from supercritical flow.
The use of a weir to minimize impoundment pressure on the silt fence installation appears to be an
ideal scenario. As shown in Figure 9, the impoundment of the full height ditch check is much greater than
the weir ditch check. The full height ditch check requires the silt fence to be run up gradient of the channel
far enough so that flow cannot bypass the silt fence. This increases the installation materials for the ditch
check and also exposes the top of the banks to flow as water passes through the silt fence material that is
out of the channel further exposing more areas to erosive runoff. The weir installation decreases the
impoundment height and can be adjusted to ensure that the height of the center of ditch check is lower than
the full depth of the channel. This will prevent the need for running silt fence out of the channel and up the
sides, possibly disturbing more areas.
10
(a) FF underlay and pinning of fence (b) resulting impoundment pool
(c) resulting downstream erosion (d) demonstration of downstream subcritical pool
Figure 8: Pinned Silt Fence Installation Test.
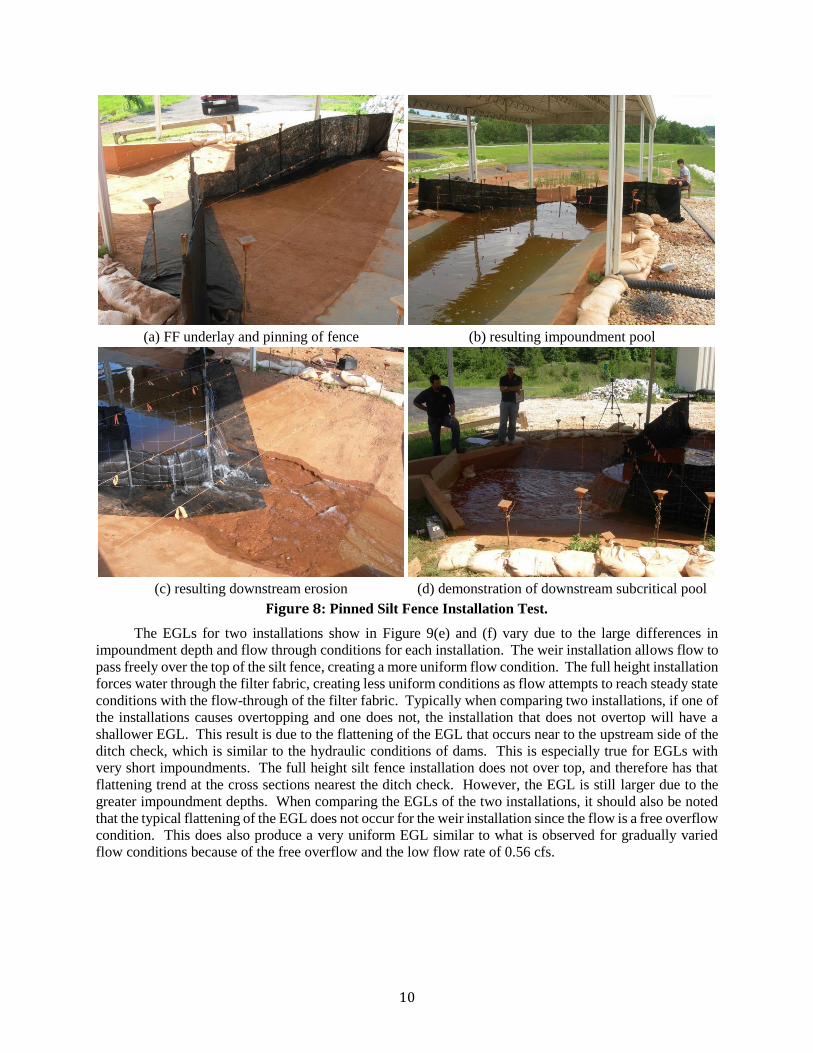
The EGLs for two installations show in Figure 9(e) and (f) vary due to the large differences in
impoundment depth and flow through conditions for each installation. The weir installation allows flow to
pass freely over the top of the silt fence, creating a more uniform flow condition. The full height installation
forces water through the filter fabric, creating less uniform conditions as flow attempts to reach steady state
conditions with the flow-through of the filter fabric. Typically when comparing two installations, if one of
the installations causes overtopping and one does not, the installation that does not overtop will have a
shallower EGL. This result is due to the flattening of the EGL that occurs near to the upstream side of the
ditch check, which is similar to the hydraulic conditions of dams. This is especially true for EGLs with
very short impoundments. The full height silt fence installation does not over top, and therefore has that
flattening trend at the cross sections nearest the ditch check. However, the EGL is still larger due to the
greater impoundment depths. When comparing the EGLs of the two installations, it should also be noted
that the typical flattening of the EGL does not occur for the weir installation since the flow is a free overflow
condition. This does also produce a very uniform EGL similar to what is observed for gradually varied
flow conditions because of the free overflow and the low flow rate of 0.56 cfs.

11
(a) full height silt fence ditch check impoundment (b) silt fence ditch check w/ weir impoundment
(c) strain on t-posts from full impoundment pressure (d) over flow of weir
(e) EGL of full height silt fence (f) EGL of silt fence ditch check w/ weir
Figure 9: Comparison of Hydraulic Performance of Full Height vs Weir Installation.
The pinned installation appeared to enable impoundment to occur without undercutting the practice,
which is also prevented by the trenched silt fence. However, it was uncertain if the pinned practice would
be able to maintain this impoundment capability over a longer period of time. If repeated storm events
eventually caused undercutting, the ditch check could be rendered useless over time. Therefore a longevity
test was performed to determine the effectiveness of the ditch check over time. Six tests were performed
over a two month period on the same pinned silt fence installation. During the entirety of this longevity

12
test, 41.9 ft3 (1.2 m3) of sediment was added to the test flow to further mimic field-like conditions. This
test is shown in Figure 10.
(a) introduction of sediment-laden water (b) ditch check impoundment
(c) sediment retention after first three tests (d) sediment retention after one week w/out testing
(e) large particles deposited at channel head (f) sediment deposition post longevity test
Figure 10: Sediment-Laden Silt Fence Longevity Test.
A robotic total station was used to survey the pre-test and post-test elevations of the channel to
determine sediment retention and downstream scour after the longevity test was completed. The survey
concluded that approximately 38.2 ft3 (1.1 m3) of sediment was retained upstream of the ditch check
resulting in 91.2% sediment retention. However, 6.2 ft3 (0.18 m3) of sediment loss occurred due to erosion
measured downstream as shown in Figure 11.

13
Figure 11: Erosion and Deposition Patterns of Silt Fence Longevity Test.
Figure 11 shows the deposition pattern upstream of the silt fence installation and erosion patterns
caused by the downstream flow. The greatest concentration of sediment deposition occurred just
downstream of the sediment and water introduction trough as denoted by the dark orange area.
Approximately 0.4 ft (12 cm) thick layer of sediment was deposited. This sediment consisted of the larger
sandy particles that fell out of suspension quickly due to a low velocity condition caused by the
impoundment. Sediment deposition decreased closer to the ditch check. This is due to the larger sediment
depositing upstream and smaller particles depositing further downstream as more time is required for the
smaller particles to settle out. The sediment not retained by the silt fence most likely requires longer
impoundment times or flocculation to settle out of suspension.
5 CONCLUSIONS When silt fence is used as a ditch check, massive impoundments will be created due to the
height of the silt fence when compared to other, shorter ditch check practices. The strain created by the large impoundment accompanied with downstream scour can cause structural failure of the ditch check. If structural failure occurs during a full impoundment condition, the resulting mass release of impounded water could cause additional practice failures downstream, especially if the downstream practices are also experiencing structural strain. Therefore, creating a silt fence ditch check installation that minimizes these conditions is important. The inclusion of a weir creates a more manageable impoundment area for the silt fence installation to endure.
Including a splash pad downstream also helps with downstream scour issues that could also cause structural failure. Finally, pinning the silt fence to the channel rather than trenching it allows an underlay to be installed that extends upstream and downstream of the ditch check, further armoring the ditch check and channel interface. It should be noted that the channel should have a smooth area for the underlay and silt fence to be installed. Rocky and bumpy channels could create issues for the underlay to maintain full ground contact. If full ground contact does not occur, undermining could occur decreasing the performance of the silt fence ditch check.
6 RECOMMENDATIONS FOR IMPLEMENTATION As a result of this testing effort, the research team’s recommendation is to incorporate the
weir option for the silt fence installation as well as include the pinning option when feasible shown in Figure 12. The weir height can be adjusted based upon the maximum channel depth to minimize the flow over the channel bank. The recommended minimum and maximum weir heights are 15 in. and 20 in., respectively, in order for a silt fence ditch check to be as effective as other ditch checks
14
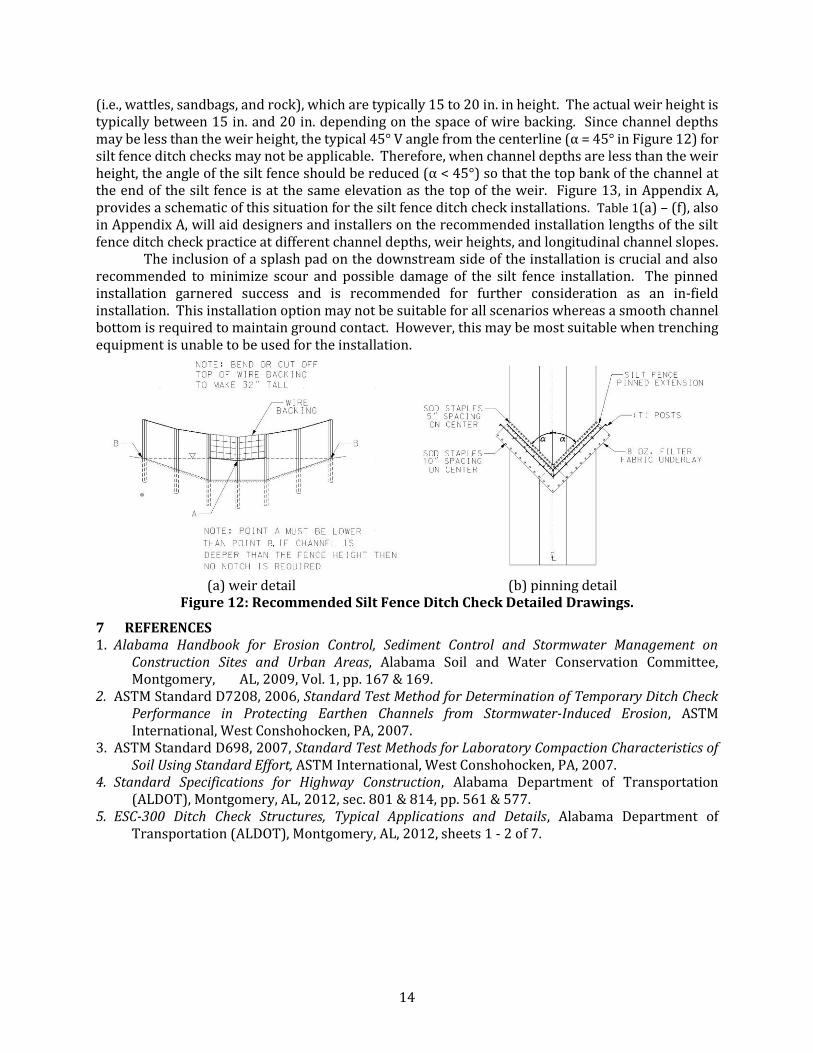
(i.e., wattles, sandbags, and rock), which are typically 15 to 20 in. in height. The actual weir height is typically between 15 in. and 20 in. depending on the space of wire backing. Since channel depths may be less than the weir height, the typical 45° V angle from the centerline (α = 45° in Figure 12) for silt fence ditch checks may not be applicable. Therefore, when channel depths are less than the weir height, the angle of the silt fence should be reduced (α < 45°) so that the top bank of the channel at the end of the silt fence is at the same elevation as the top of the weir. Figure 13, in Appendix A, provides a schematic of this situation for the silt fence ditch check installations. Table 1(a) – (f), also in Appendix A, will aid designers and installers on the recommended installation lengths of the silt fence ditch check practice at different channel depths, weir heights, and longitudinal channel slopes.
The inclusion of a splash pad on the downstream side of the installation is crucial and also recommended to minimize scour and possible damage of the silt fence installation. The pinned installation garnered success and is recommended for further consideration as an in-field installation. This installation option may not be suitable for all scenarios whereas a smooth channel bottom is required to maintain ground contact. However, this may be most suitable when trenching equipment is unable to be used for the installation.
(a) weir detail (b) pinning detail Figure 12: Recommended Silt Fence Ditch Check Detailed Drawings.
7 REFERENCES 1. Alabama Handbook for Erosion Control, Sediment Control and Stormwater Management on
Construction Sites and Urban Areas, Alabama Soil and Water Conservation Committee, Montgomery, AL, 2009, Vol. 1, pp. 167 & 169.
2. ASTM Standard D7208, 2006, Standard Test Method for Determination of Temporary Ditch Check Performance in Protecting Earthen Channels from Stormwater‐Induced Erosion, ASTM International, West Conshohocken, PA, 2007.
3. ASTM Standard D698, 2007, Standard Test Methods for Laboratory Compaction Characteristics of Soil Using Standard Effort, ASTM International, West Conshohocken, PA, 2007.
4. Standard Specifications for Highway Construction, Alabama Department of Transportation (ALDOT), Montgomery, AL, 2012, sec. 801 & 814, pp. 561 & 577.
5. ESC‐300 Ditch Check Structures, Typical Applications and Details, Alabama Department of Transportation (ALDOT), Montgomery, AL, 2012, sheets 1 - 2 of 7.

15
8 APPENDIX A: GUIDANCE TABLES FOR DETERMINING LENGTH OF SILT FENCE To keep impounded flow from overtopping the channel banks when the depth of the channel is less than the height of the weir, the silt fence should be installed so that the end of the fence (point B in Figure 13) is at an elevation greater than or equal to the height of the weir (H). To assure this condition is satisfied, the silt fence must be extended longitudinally upstream with a required length (L) as shown in Figure 13. The angle of the silt fence installation can vary accordingly using the required length for a specific weir height while preventing a ditch bank overtopping condition.
(a) location and elevation of weir vs. channel depth
(b) examples of varying silt fence V angle required to satisfy depth and weir height
Figure 13: Variation of Silt Fence Angle and Required Length of Silt Fence.
Table 1 below provides selection charts to determine the minimum silt fence lengths (Lmin) for various channel depths and longitudinal slopes, in order to satisfy a range of weir height requirements. These silt fence lengths will ensure that the silt fence ditch check is installed properly to maximize impoundments while preventing water from flowing over the channel banks and around the ditch check.
The channel depth, desired weir height, and longitudinal slope will be required to determine the necessary Lmin using Table 1 to keep flow within the channel boundaries. L is measured as shown in Figure 13(b). A factor of safety is recommended to ensure that flows are maintained within the channel boundary considering wind-generated waves and water surface fluctuations in the channel. Equation 2 can be used to determine required silt fence length (L) using Lmin from Table 1 and a factor of safety of W/2 where W is the top width of the channel.
L = Lmin + W/2 [EQ. 2]
where,

16
L = longitudinal length upstream of V silt fence must be extended with a factor of safety (ft, m) Lmin = minimum length determined from Table 1 required based upon geometry to maintain flows within channel (ft, m) W = top width of channel (ft, m)
Equation 2 will also ensure that the maximum angle of the silt fence “V” is 90 degrees. The following two examples illustrate how Table 1(a) – (f) is used.
Example 1 demonstrates how to determine L if the channel depth is smaller than the weir height.
Channel depth = 0.5 ft (6 in.) Longitudinal slope = 0.05 ft/ft Desired weir height, H = 16 in. Top width of channel, W = 13 ft From Table 1(b) for Channel Depth = 0.5 ft: Lmin = 16.7 ft.
Using Equation 2: L = 16.7 + (13/2) = 23.2 ft The calculated longitudinal length (L) of 23.2 ft provides a longitudinal factor of safety of 6.5 ft to ensure the impoundment stays within the limits of the channel and is contained by the silt fence ditch check. Example 2 demonstrates how to determine L if the channel depth is equal to or greater than the weir height. Example 2: Channel depth = 1.25 ft (15 in.) Longitudinal slope = 0.03 ft/ft Desired weir height, H = 15 in. Top width of channel, W = 13 ft From Table 1(e) for Channel Depth = 1.25 ft: Lmin = 0 ft. Therefore, using Equation 2: L = 0 + (13/2) = 6.5 ft. L = 6.5 ft will result in a V of 90 degrees, the maximum angle for the V in a silt fence ditch check installation.

17
Table 1: Min. Silt Fence Lengths (Lmin) to Contain Impounded Water for Various Channel Depths.
(a) Channel Depth = 0.25 ft (3 in.)
Weir Height (in.) Longitudinal Channel Slope (ft/ft)
0.01 0.02 0.03 0.04 0.05 0.06 0.07 0.08 0.09 0.1
15 100.0 50.0 33.3 25.0 20.0 16.7 14.3 12.5 11.2 10.0 16 108.3 54.2 36.1 27.1 21.7 18.1 15.5 13.6 12.1 10.9 17 116.7 58.3 38.9 29.2 23.4 19.5 16.7 14.6 13.0 11.7 18 125.0 62.5 41.7 31.3 25.0 20.9 17.9 15.7 13.9 12.6 19 133.3 66.7 44.5 33.4 26.7 22.3 19.1 16.7 14.9 13.4 20 141.7 70.8 47.2 35.4 28.4 23.7 20.3 17.8 15.8 14.2
Minimum length (Lmin) required to contain impounded water in channel (ft)
(b) Channel Depth = 0.5 ft (6 in.)
Weir Height (in.) Longitudinal Channel Slope (ft/ft)
0.01 0.02 0.03 0.04 0.05 0.06 0.07 0.08 0.09 0.1
15 75.0 37.5 25.0 18.8 15.0 12.5 10.7 9.4 8.4 7.5 16 83.3 41.7 27.8 20.8 16.7 13.9 11.9 10.4 9.3 8.4 17 91.7 45.8 30.6 22.9 18.4 15.3 13.1 11.5 10.2 9.2 18 100.0 50.0 33.3 25.0 20.0 16.7 14.3 12.5 11.2 10.0 19 108.3 54.2 36.1 27.1 21.7 18.1 15.5 13.6 12.1 10.9 20 116.7 58.3 38.9 29.2 23.4 19.5 16.7 14.6 13.0 11.7
Minimum length (Lmin) required to contain impounded water in channel (ft)
(c) Channel Depth = 0.75 ft (9 in.)
Weir Height (in.) Longitudinal Channel Slope (ft/ft)
0.01 0.02 0.03 0.04 0.05 0.06 0.07 0.08 0.09 0.1
15 50.0 25.0 16.7 12.5 10.0 8.3 7.2 6.3 5.6 5.0 16 58.3 29.2 19.5 14.6 11.7 9.7 8.4 7.3 6.5 5.9 17 66.7 33.3 22.2 16.7 13.3 11.1 9.5 8.4 7.4 6.7 18 75.0 37.5 25.0 18.8 15.0 12.5 10.7 9.4 8.4 7.5 19 83.3 41.7 27.8 20.8 16.7 13.9 11.9 10.4 9.3 8.4 20 91.7 45.8 30.6 22.9 18.4 15.3 13.1 11.5 10.2 9.2
Minimum length (Lmin) required to contain impounded water in channel (ft)
(d) Channel Depth = 1.0 ft (12 in.)
Weir Height (in.) Longitudinal Channel Slope (ft/ft)
0.01 0.02 0.03 0.04 0.05 0.06 0.07 0.08 0.09 0.1
15 25.0 12.5 8.3 6.3 5.0 4.2 3.6 3.1 2.8 2.5 16 33.3 16.7 11.1 8.3 6.7 5.6 4.8 4.2 3.7 3.3 17 41.7 20.8 13.9 10.4 8.3 7.0 6.0 5.2 4.6 4.2 18 50.0 25.0 16.7 12.5 10.0 8.3 7.2 6.3 5.6 5.0 19 58.3 29.2 19.5 14.6 11.7 9.7 8.4 7.3 6.5 5.9 20 66.7 33.3 22.2 16.7 13.3 11.1 9.5 8.4 7.4 6.7
Minimum length (Lmin) required to contain impounded water in channel (ft)
(e) Channel Depth = 1.25 ft (15 in.)
Weir Height (in.) Longitudinal Channel Slope (ft/ft)
0.01 0.02 0.03 0.04 0.05 0.06 0.07 0.08 0.09 0.1
15 0 0 0 0 0 0 0 0 0 0 16 8.3 4.2 2.8 2.1 1.7 1.4 1.2 1.0 0.9 0.8 17 16.7 8.3 5.6 4.2 3.3 2.8 2.4 2.1 1.9 1.7 18 25.0 12.5 8.3 6.3 5.0 4.2 3.6 3.1 2.8 2.5 19 33.3 16.7 11.1 8.3 6.7 5.6 4.8 4.2 3.7 3.3 20 41.7 20.8 13.9 10.4 8.3 7.0 6.0 5.2 4.6 4.2
Minimum length (Lmin) required to contain impounded water in channel (ft)
(f) Channel Depth = 1.5 ft (18 in.)
Weir Height (in.) Longitudinal Channel Slope (ft/ft)
0.01 0.02 0.03 0.04 0.05 0.06 0.07 0.08 0.09 0.1
15 0 0 0 0 0 0 0 0 0 0 16 0 0 0 0 0 0 0 0 0 0 17 0 0 0 0 0 0 0 0 0 0 18 0 0 0 0 0 0 0 0 0 0 19 8.3 4.2 2.8 2.1 1.7 1.4 1.2 1.0 0.9 0.8 20 16.7 8.3 5.6 4.2 3.3 2.8 2.4 2.1 1.9 1.7
Minimum length (Lmin) required to contain impounded water in channel (ft)
Note: If Lmin = 0, the resultant angle of the silt fence V=90°. If the Lmin > 0 the resultant angle of the silt fence V is less than 90°