evaluation of accelerated shelf life testing of uht milklibrary.au.dk/fileadmin/ · evaluation of...
TRANSCRIPT

Anne Vuholm Sunds Student No. 20113104
Master thesis 2016 Molecular Nutrition and Food Technology - Aarhus University
Evaluation of accelerated shelf life testing of UHT milk Master of Science thesis - 60 ECTS

Title: Evaluation of accelerated shelf life testing of UHT milk
Project period: 3th
August 2015 to 1st July 2016
Defence: 8th
July
Written by: Anne Vuholm Sunds
Student number: 20113104
Education: MSc in Molecular Nutrition and Food Technology
Internal supervisor:
Lotte Bach Larsen, Professor
Department of Food Science, Faculty of Science and Technology
External supervisor:
Valentin Maximilian Rauh, Research Scientist
Arla Strategic Innovation Centre, Ingredients and Milk Science
Project location:
Aarhus University Arla Strategic Innovation Centre
Department of Food Science Ingredients and Milk Science
Blichers Allé 20 Rørdrumvej 2
8830 Tjele 8220 Brabrand
Denmark Denmark
Number of pages: 85

Preface and acknowledgements
This master thesis project is a result of 11 months of work at Arla Strategic Innovation Centre and
the Faculty of Science and Technology, Department of Food Science at Aarhus University, in the
period from August 2015 to July 2016.
My greatest thank goes to my university supervisor Lotte Bach Larsen and my supervisor at Arla
Valentin Maximilian Rauh. Lotte, thank you for your great support and scientific guidance, I am
very glad to have had you as my supervisor. Valentin, thank you for the opportunity to work with
you and your colleagues at Arla, it has been a pleasure and thank you for your great guidance and
proofreading of manuscripts.
I also owe a huge thank to the laboratory technicians at Arla for the help with equipment and data
analysis. Mona Slyngborg and Betina Mikkelsen I appreciate all your help with the functionality
analyses, and for your support. Jan Breinholt Carlsen and Lene Buhelt Johansen, thank you very
much for your help with GC-MS and HPLC. Thank you to Gitte Hald Kristiansen and Ida Sørensen
for your assistance with the quantification of furosine.
Thanks to my fellow master student Lina Berg for great discussions, support and motivational pep
talks, and thank you to my family and friends for their encouragement and support.
Aarhus University, Department of Food Science, July 2016
Anne Vuholm Sunds
Abstract
Development of UHT dairy products requires time consuming and resource intensive shelf life
tests. Thus, a valid accelerated shelf life test would be of high value in the development of new
products. This thesis provides a quantification of chemical and physical changes in commercial
UHT milk stored at different temperatures, with the aim of establishing a valid setup to accelerate
shelf life development. The temperatures selected were; 10 °C, 20 °C, 30 °C, 40 °C and 50 °C as
well as three temperature cycles. The skimmed and full fat UHT milk samples were analysed during
a storage period of 24 weeks. This included chemical analyses of the three phases of the Maillard
reaction (MR) as well as the lipid oxidation. The initial stage of the MR was analysed by a
quantification of furosine using high performance liquid chromatography (HPLC). The intermediate
stage of the MR was analysed by fluorescence spectroscopy and gas chromatography-mass
spectroscopy (GC-MS). Finally, the late stage of the MR was analysed with colour measurements.
An evaluation of physical destabilization was conducted with focus on gravitational separation, in
form of creaming and sedimentation. Physical changes were analysed using; optical stability
analyzers, evaluation of protein and fat distribution in; top, middle and bottom fractions, as well as
analysis of fat globule size distribution.
Exposure to elevated temperatures accelerated both chemical and physical changes over the storage
period. The chemical changes revealed data possible to describe with kinetic models. Formation of
furosine followed a first order reaction kinetic, whereas fluorescence and colour changes followed a
zero order reaction kinetic. Additionally, all three stages of the MR fitted into the Arrhenius
equation. Following corresponding Q10 values were obtained; for the initial MR of 1.5 to 2.3, for
the intermediate MR of 3.9 to 10.9 and for the late MR of 2.8 to 6.
The acceleration of physical changes varied between the applied methods, where different rates of
creaming and sedimentation were observed. No changes in fat globule size distribution were found,
which may indicate that other parameters are affecting the creaming rate, possibly by viscosity and
density changes. Development of the three temperature cycles varied between chemical and
physical parameters analysed. This was illustrating that it is only slightly possible to delay the MR
once it has started, even when exposed to lower storage temperatures. On the other hand, physical
parameters followed the average temperature. For future accelerated shelf life tests, a prediction of
shelf life seems to be possible within the temperature range of 20 °C to 30 °C. These findings are
based on the Arrhenius plots obtained in the present study.

Sammendrag
Udviklingen af UHT mejeri produkter, resulterer i tids- og ressourcekrævende holdbarhedstests.
Derfor vil en valid accelereret holdbarhedstest, være af stor værdi i udviklingen af nye produkter.
Denne specialeafhandling vil give en kvantificering af kemiske og fysiske ændringer i kommerciel
skummet og sød UHT mælk, oplagret ved forskellige temperaturer. Formålet med studiet er at
etablere en gyldig opsætning for acceleration af de processer der har indflydelse på holdbarheden.
De udvalgte temperaturer var; 10 °C, 20 °C, 30 °C, 40 °C og 50 °C så vel som tre temperaturcykler.
UHT mælkeprøverne blev analyseret gennem oplagringsperioden på 24 uger. Dette inkluderede
kemiske analyser af de tre stadier af Maillard reaktionen (MR) samt af lipidoxidationen. Det
indledende stadie af MR´en blev analyseret ved en kvantificering af furosin, ved brug af højtydende
væskekromatografi (HPLC). Det intermediære stadie af MR´en blev analyseret ved fluorescens
spektroskopi og gaskromatografi-massespektrometri (GC-MS) og det sidste stadie af MR´en blev
analyseret ved farvemåling. En evaluering af fysisk destabilisering blev udført med fokus på
tyngdeseparation, i form af dannelse af fløde på overfladen og sedimentation af protein. Fysiske
ændringer blev analyseret ved optiske stabilitetsanalyser, evaluering af protein- og fedtfordeling i
top, midte og bund, samt analyse af fordelingen af fedtkuglestørrelser.
Både kemiske og fysiske ændringer i mælken accelererede over oplagringsperioden ved udsættelse
for forhøjede temperaturer. Det var muligt at beskrive data fra de kemiske analyser med kinetiske
modeller. Dannelse af furosin fulgte en første ordens reaktionskinetik, mens fluorescens- og
farveændringerne fulgte en nulte ordens reaktionskinetik. Desuden passede alle tre stadier af MR´en
ind i Arrhenius ligningen. Følgende korresponderende Q10 værdier blev fundet: 1,5 til 2,3 for den
indledende MR, 3,9 til 10,9 for den intermediære MR og 2,8 til 6 for den sene MR.
Accelerationen af fysiske ændringer varierede mellem de benyttede metoder, hvor forskellige rater
af flødedannelse og sedimentation blev observeret. Der blev ikke observeret nogen ændringer i
fordelingen af fedtkuglestørrelse, hvilket kan indikere at andre parametre har indflydelse på den
observerede flødedannelse, muligvis på grund af ændringer i viskositet og densitet. Udviklingen af
de tre temperaturcykler varierede mellem de kemiske og fysiske parametre der blev analyseret.
Dette illustrerer at det kun delvist er muligt at forsinke MR´en når først den er startet, selv ved
udsættelse for lavere oplagringstemperaturer. De fysiske parametre fulgte derimod gennemsnits-
temperaturen. En forudsigelse af holdbarheden synes at være mulig mellem 20 °C og 30 °C, for
accelererede holdbarhedstests i fremtiden. Disse resultater er baseret på Arrhenius graferne fra de
kemiske analyser.

Abbreviations
AGE: Advanced glycation end-products
CN: Casein
DAD: Diode array detector
DHS: Dynamic headspace sampling
DTE: Dithioerythritol
DLVO: Deyaguin-Landau-Verwey-Overbeek
ESL: Extended shelf-life
FT-IR: Fourier transform infrared spectroscopy
GC-MS: Gas chromatography–mass spectrometry
HMF: Hydroxymethylfurfural
LA-transformation: Lobry de Bruyn-van Ekenstein-transformation
LC-MS: Liquid chromatography–mass spectrometry
MR: Maillard reaction
MRP: Maillard reaction product
MFG: Milk fat globule
MFGM: Milk fat globule membrane
PCA: Principal component analysis
RP-HPLC: Reversed phase-high pressure liquid chromatography
SIM: Selected ion monitoring
SLS: Static light scattering
SPME: Solid phase micro-extraction
TAG: Triacylglyceride
TIC: Total ion current
UHT: Ultra high temperature
α-La: α-Lactalbumin
β-Lg: β-Lactoglobulin

Table of content
1. Aim and hypothesis……………………………………………………………………………… 1
2. Outline of the thesis………………………………………………………………………………2
3. Introduction……………………………………………………………………………………… 4
3.1 Milk…………………………………………………………………………………………………….. 4
3.1.1 Carbohydrates………………………………………………………………………………………………... 4
3.1.2 Proteins……………………………………………………………………………………………………….. 5
3.1.2.1 Analysis of protein composition by HPLC……………………………………………………………… 7
3.1.3 Lipids………………………………………………………………………………………………………….. 8
3.2 UHT milk………………………………………………………………………………………………. 8
3.3 Changes induced by UHT treatment…………………………………………………………………. 11
3.4 Enzymatic hydrolysis………………………………………………………………………………… 13
3.5 Chemical changes in UHT milk during storage………………………………………………………. 14
3.5.1 Maillard reaction…………………………………………………………………………………………… 15
3.5.2 Lipid oxidation……………………………………………………………………………………………… 19
3.6 Physical changes in UHT milk during storage……………………………………………………….. 21
4. Material and methods…………………………………………………………………………. 25
4.1 Milk samples and treatments…………………………………………………………………………. 25
4.2 Analysis of chemical changes………………………………………………………………………… 25
4.2.1 Peptide analysis by HPLC………………………………………………………………………………… 26
4.2.2 Initial Maillard reactions…………………………………………………………………………………. 26
4.2.3 Intermediate Maillard reactions and lipid oxidation………………………………………………….. 27
4.2.4 Late Maillard reactions……………………………………………………………………………………. 28
4.2.5 Protein composition………………………………………………………………………………………... 28
4.3 Analysis of physical changes…………………………………………………………………………. 29
4.3.1 Physical destabilization…………………………………………………………………………………… 29
4.3.2 Protein and fat content……………………………………………………………………………………. 31
4.3.3 Fat globule size distribution………………………………………………………………………………. 31
4.4 Data analysis………………………………………………………………………………………….. 32
5. Results…………………………………………………………………………………………... 33
5.1 Chemical changes…………………………………………………………………………………….. 33
5.1.1 Enzymatic hydrolysis………………………………………………………………………………………. 33

5.1.2 Initial Maillard reactions…………………………………………………………………………………. 34
5.1.3 Intermediate Maillard reactions and lipid oxidation………………………………………………….. 38
5.1.4 Late Maillard reactions…………………………………………………………………………………… 46
5.1.5 Protein composition………………………………………………………………………………………... 49
5.2 Physical changes……………………………………………………………………………………… 50
5.2.1 Physical destabilization…………………………………………………………………………………… 51
5.2.2 Protein and fat content…………………………………………………………………………………….. 53
5.2.3 Fat globule size distribution……………………………………………………………………………… 55
5.3 Principal component analysis…………………………………………………………………………. 56
6. Discussion………………………………………………………………………………………. 57
6.1 Chemical changes…………………………………………………………………………………….. 57
6.2 Physical changes……………………………………………………………………………………… 67
6.3 Comparison of accelerated parameters……………………………………………………………….. 70
7. Conclusion……………………………………………………………………………………… 71
8. Perspectives…………………………………………………………………………………….. 73
9. List of references………………………………………………………………………………. 74
10. Appendix……………………………………………………………………………………… 84
Page 1 of 85
1. Aim and hypothesis
Consumers demand high quality dairy products with good sensory attributes and commercial
sterility throughout shelf life. To guarantee these properties heat treatment is almost always applied
to dairy products today (Chavan et al., 2011; Lewis and Deeth, 2008). The main aim of heat
treatment is to inactivate undesired factors of the raw milk, such as pathogenic and spoilage
microorganisms and enzymes. On the other hand it is desired to preserve functional, nutritional and
organoleptic properties, by prevention of undesired heat induced chemical changes (Lewis and
Deeth, 2008; Singh and Waungana, 2001). In this perspective the choice of heat treatment is a
balance between preferences. Different heat treatments are applied to commercial milk products,
mainly high temperature short time (HTST) pasteurization (72 ºC, 15 sec), extended shelf-life
(ESL) (130-145, <1 sec) and ultra-high temperature (UHT) (135-150 ºC, 1-10 sec) (Walstra et al.,
2006). The market for milk treated at UHT is growing worldwide, today these products are found in
most countries, especially in Asia, Europe and South America (Bimbo et al., 2016; Jansson, 2014a).
In addition to prolonged shelf life, UHT processing is beneficial due to low energy costs and
elimination of cooling conditions during distribution and storage (Chavan et al., 2011). The
reported shelf life of UHT dairy products stored at ambient temperatures is between 6-9 months
(Bimbo et al., 2016; Richards et al., 2014). During processing and storage the UHT milk is
subjected to considerable chemical and physical changes, affecting the consumer acceptability and
hence the shelf life of the product. Possible undesirable effects include loss of nutrients, browning,
emulsion instability, age gelation and formation of off-flavours. Flavour changes are a major shelf
life limiting factor in UHT milk, mainly due to the Maillard reaction (MR), but possibly also lipid
oxidation or hydrolysis depending on the UHT treatment (Richards et al., 2014). The MR can be
affected by several factors including temperature, time, pH, water activity, type of sugar etc. (Oliver
et al., 2006). Physical destabilization is another major factor, which can result in creaming of fat
and/or sedimentation of protein (Calvo and de la Hoz, 1992; Chavan et al., 2011).
Food manufacturing today meets high expectations in the development of new products within short
time (Hough et al., 2006). The long shelf life of UHT dairy products result in very expensive and
time consuming shelf life tests in the development of new products. From this perspective
accelerated shelf life tests are highly valuable, with a significant reduction of time from product
development to market (Richards et al., 2014). An accelerated shelf life test can be performed by
Page 2 of 85
exposing the product to storage conditions with an accelerating effect on physical, chemical or
microbial changes. The accelerating factors depend on the specific product and the normal storage
conditions. Often changes in temperature, humidity or water activity are applied to accelerate shelf
life (Hough et al., 2006; Richards et al., 2014). Exposing the product to such a controlled
environment makes it possible to increase the deterioration rate and hence predict the shelf life
(Richards et al, 2014). Previous studies have attempted to accelerate the shelf life of milk, but
mainly with a focus on sensory attributes (Hough et al., 2006), proteolysis (Button et al., 2011) or
single components from the Maillard reaction (Richards et al., 2014). A valuable tool in the
development of UHT milk would therefore be a valid shelf life test accelerating both chemical and
physical changes, to give a more complete estimate of the predicted shelf life.
Hence the aim of this study is:
To give a quantification of physico-chemical changes depending on storage conditions, and
hereby to establish a valid setup to accelerate shelf life development.
The hypothesis of this study is that:
It is possible to establish a system for accelerated shelf life testing of UHT milk by
exposure to elevated storage temperatures including temperature cycles.
Such an accelerated shelf life test can be used in prediction of shelf life from
characterisation of chemical and physical changes.
A valid accelerated shelf life test for prediction of shelf life of UHT milk is possible.
To test these hypotheses, conventional skimmed and full fat indirect UHT milk were exposed to
five different storage temperatures and three temperature cycles, over a period of 24 weeks.
2. Outline of the thesis
This master thesis gives a presentation of the results obtained in relation to existing knowledge
within the field. To test the hypothesis two commercial UHT milk products were subjected to
different storage temperatures, in order to accelerate the shelf life development over a period of
24 weeks. The selected milk types were skimmed and full fat commercial UHT milk products, from
Arla Foods produced in Pronsfeld, Germany. The accelerating factors used were elevated storage
temperatures, temperature cycling and centrifugation with the use of Lumifuge. Storage
temperatures selected for the study were 10 °C, 20 °C, 30 °C, 40 °C and 50 °C, representing slightly
Page 3 of 85
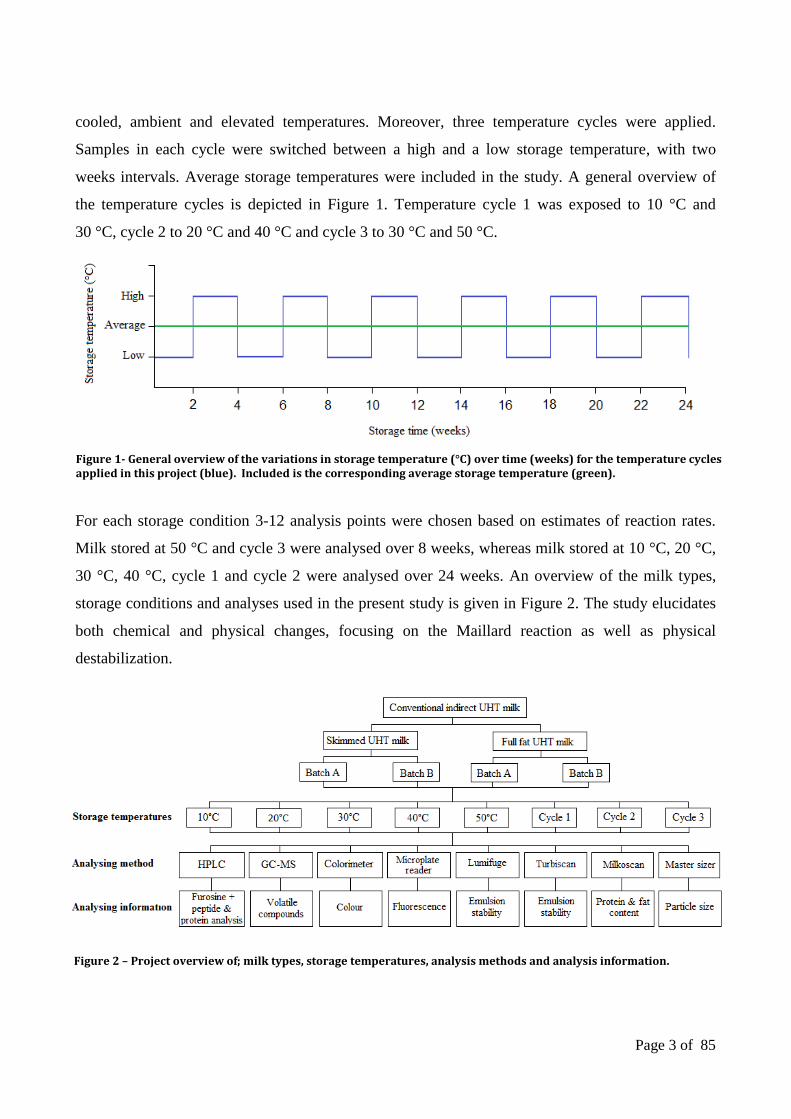
cooled, ambient and elevated temperatures. Moreover, three temperature cycles were applied.
Samples in each cycle were switched between a high and a low storage temperature, with two
weeks intervals. Average storage temperatures were included in the study. A general overview of
the temperature cycles is depicted in Figure 1. Temperature cycle 1 was exposed to 10 °C and
30 °C, cycle 2 to 20 °C and 40 °C and cycle 3 to 30 °C and 50 °C.
For each storage condition 3-12 analysis points were chosen based on estimates of reaction rates.
Milk stored at 50 °C and cycle 3 were analysed over 8 weeks, whereas milk stored at 10 °C, 20 °C,
30 °C, 40 °C, cycle 1 and cycle 2 were analysed over 24 weeks. An overview of the milk types,
storage conditions and analyses used in the present study is given in Figure 2. The study elucidates
both chemical and physical changes, focusing on the Maillard reaction as well as physical
destabilization.
Figure 2 – Project overview of; milk types, storage temperatures, analysis methods and analysis information.
Figure 1- General overview of the variations in storage temperature (°C) over time (weeks) for the temperature cycles applied in this project (blue). Included is the corresponding average storage temperature (green).

Page 4 of 85
3. Introduction
3.1 Milk
Mammalian milk is a biological fluid secreted from the mammary glands. The main type of milk for
human consumption is bovine milk, but also milk from sheep, goat and buffalo are consumed
(Walstra et al., 2006). In the present thesis the term milk refers to bovine milk. It contains 87.1%
water, but nevertheless has a very high nutritional value (Walstra et al., 2006; Fox and Kelly, 2012).
With these properties milk is the primary natural source of nutrition for neonates and has become a
central part of the human diet, in form of several dairy products. From a molecular perspective milk
is a complex physico-chemical system (Nieuwenhuijse and Van Boekel, 2003). The continuous
phase of milk is not a true aqueous solution but rather a suspension of aggregates. This includes
colloidal proteins, emulsified lipids, globular proteins, as well as dissolved lactose, vitamins and
minerals (Walstra et al., 2006; Fox and Kelly, 2012). In addition milk contains bioactive peptides,
enzymes, oligosaccharides and immunoglobulins (Walstra et al., 2006; Jansson, 2014a). The
approximate composition of the main constituents in bovine milk are; 3.5% protein, 4.0% fat, 4.8%
lactose and 0.7% minerals, but the quantity varies with breed, genetic variations, lactation state,
feed composition, health, climate and season (Heck et al., 2009). In the following milk
carbohydrates, proteins and lipids will be reviewed.
3.1.1 Carbohydrates
The predominant carbohydrate of milk is lactose, which is a disaccharide composed of the
monosaccharides D-glucose and D-galactose linked by a β-1.4-glycosidic bond (Fox, 2009; Walstra
et al., 2006). Lactose is unique to milk and has been found in the milk of most mammalian species;
in addition to lactose milk contains trace amounts of glucose and galactose, but no polysaccharides
(Walstra et al., 2006). The concentration of lactose in bovine milk is found to be approximately
4.8%, with the highest content of lactose in the early stages of lactation. Lactose serves two main
functions in milk; it is an important energy source for the neonate and is responsible for about 50%
of the osmotic pressure between blood and milk (Fox, 2009; Jansson, 2014a). The monosaccharides
of lactose can exist in three different steric structures; two cyclic pyranose forms (α and β anomer)
and an open-chain form. The O-C1 bond of the cyclic glucose moiety can break and form the open-
chain form while creating an aldehyde group, as shown in Figure 3.

Page 5 of 85
Since it contains a free or potentially free carbonyl group (an aldehyde group), lactose is a reducing
carbohydrate (Fox, 2009; Walstra et al., 2006). The conversion of the two cyclic anomers is called a
mutarotation and occurs via the open-chain form. The least preferable and unstable form is the
acyclic open-chain form containing the reducing aldehyde group. In fresh milk less than 0.1% of
lactose is in this form, but at high temperatures and pH the open-chain form is favoured, leading to
an enhanced reactivity of the sugar (Brands et al., 2002; Walstra et al., 2006; Jansson, 2014a).
3.1.2 Proteins
The content of protein in bovine milk varies between 2.3-4.4%, mainly due to variations in breed
and genetics (Walstra et al., 2006; Farrell et al., 2004). Since 1830 it has been known that milk
contains two major protein groups; caseins and whey proteins. The caseins are representing 80% of
the total milk protein, and are hence the major protein component of bovine milk. The caseins are
divided into four individual types; αS1-casein (αS1-CN), αS2-casein (αS2-CN), β-casein (β-CN) and κ-
casein (κ-CN), distributed in the proportions; 40%, 10%, 35% and 15%, respectively (Dalgleish and
Corredig, 2012; Fox, 2003).
Caseins are hydrophobic and negatively charged proteins, containing many proline groups and few
cysteine groups. These characteristics lead to little secondary and tertiary structure of the casein
molecules and hence to a flexible structure of the primary chain (Dalgleish and Corredig, 2012).
This flexible and open structure makes the caseins very heat stable. The high surface
hydrophobicity of caseins, results in expanded association within and between caseins (Dalgleish,
2011; Walstra et al., 2006). Approximately 95% of the caseins are aggregated in clusters, held
together by hydrogen bonds, electrostatic interactions and hydrophobic interactions. These clusters
are called casein micelles, compromising approximately 94% protein. The remaining 6% are
referred to as colloidal calcium phosphate, mainly consisting of calcium and phosphate, but also
minor amounts of magnesium, citrate and other trace metals (Gaucheron, 2005; Dalgleish and
Figure 3 – Mutarotation of glucose, T = temperature (Jansson, 2014a).

Page 6 of 85
Corredig, 2012; Walstra et al., 2006). Caseins belong to the group of phosphoproteins, containing
phosphoric acid attached to hydroxyl groups of serine and threonine in the amino acid backbone.
These negatively charged phosphate groups are able to bind organic Ca2+
(Walstra et al., 2006). The
colloidal calcium phosphate is mainly associated to αS1-CN, αS2-CN and β-CN, which are
responsible for structure and partly the stability of the casein micelle (Gaucheron, 2005). The
structure of the casein micelle has been described by several models in literature, but none of these
are completely verified today. Two models mainly referred to are the nanocluster model by Holt
and Horne (1996) and the sub-micelle model presented by Farrell et al (2006) (Dalgleish, 2010;
Dalgleish and Corredig, 2012). The nanocluster model describes caseins as thread-like monomers,
with calcium phosphate nanoclusters mainly bound to the phosphoserines (Farrell Jr. et al., 2006),
whereas the sub-micelle model describes caseins collected in sub-micelles linked by calcium
phosphate (Dalgleish, 2010; Gaucheron, 2005). The casein composition of the micelles is
commonly known (Walstra et al., 2006). The core consists mainly of the hydrophobic and calcium
sensitive β-CN and the outer layer consists predominantly of the more hydrophilic and calcium
insensitive κ-CN, whereas α-CN is found throughout the structure (Walstra et al., 2006). The
surface layer of κ-CN provides steric and electrostatic repulsion and hence stabilises the casein
micelles from aggregation. Steric and electrostatic repulsion is due to the polar C-terminal of the κ-
CN forming a hairy layer, which is negatively charged (Dalgleish and Corredig, 2012). Casein
micelles vary in size with an average diameter of 150-200 nm and the size is highly determined by
the amount of κ-CN available to cover the micelle surface (Dalgleish and Corredig, 2012; Fox and
Kelly, 2012). In contrast to the whey proteins, the caseins are insoluble at pH 4.6, this property
makes it possible to precipitate caseins and enables the production of dairy products like fermented
milk products, caseinates and acid-catalysed cheeses (Fox 2003; Fox and Kelly, 2012).
The whey protein fraction represents the remaining 20% of the total protein content of bovine milk.
These proteins have a high degree of secondary and tertiary structures, making them less heat stable
compared to the caseins. The globular structures are maintained by disulfide bonds, hydrophobic
interactions, Van der Waal´s interactions, hydrogen bonds and ion-pair interactions (Singh and
Havea, 2003; Wijayanti et al., 2014; Walstra et al., 2006). The whey proteins comprise four main
proteins; β-lactoglobulin (β-Lg) (40%), α-lactalbumin (α-La) (20%), immunoglobulins (10%) and
blood serum albumin (10%). The remaining 10% consists of enzymes and proteins in the membrane
of milk fat globules (Farrell et al., 2004; Fox and Kelly, 2012). The native composition of whey

Page 7 of 85
proteins is characterized by a high amount of cysteine groups and many hydrophilic residues on the
surface. This makes the whey proteins highly soluble in milk, even over a broad range of pH values
(Dissanayake and Vasiljevic, 2009). β-Lg contains 162 amino acids including five cysteine
residues, four of these form disulfide bridges and one is a free residue (Cys121). In the native form
of β-Lg the free thiol group is located in a hydrophobic pocket and is hence not prone to interaction
with other proteins (Kontopidis et al., 2004).
3.1.2.1 Analysis of protein composition by HPLC
The protein composition in milk can be analysed in several ways. Common applied techniques are:
Liquid chromatography (LC), electrophoretic techniques, isoelectric focusing and mass
spectrometry (Bonfatti et al., 2008). In particular, high performance liquid chromatography (HPLC)
provides a rapid and accurate analysis of peptides and proteins from a variety of synthetic or
biological sources with a high resolution (Aguilar, 2004). Proteins can be separated based on
characteristics like hydrophobicity, solubility, charge, size and affinity to specific chemical groups
(Berg et al., 2006). Reversed-phase high-performance liquid chromatography (RP-HPLC) separates
components on the basis of hydrophobicity (Aguilar, 2004). This technique applies a non-polar
stationary phase and a more polar mobile phase. The stationary phase is often a silica-based
membrane with hydrophobic ligands attached, mainly C4-, C8- or C18-alkyl groups. A long carbon
chain results in a high hydrophobicity. The separation of molecules hence depends on their affinity
of binding to the hydrophobic carbon chain attached to the stationary phase (Aguilar, 2004; Berg et
al., 2006). The composition of the mobile phase can either be constant (isocratic condition) or vary
(gradient condition) through the elution. When a gradient elution is applied, the amount of polar
organic solution (e.g. acetonitrile) is often increased in concentration over time. This leads to a
gradual detachment of the hydrophobic peptides and proteins from the stationary phase, followed
by elution and detection. Hence the fastest eluting proteins contain the highest amount of polar
residues (Berg et al., 2006; Bordin et al., 2001). Main factors influencing the elution are pore size of
the stationary phase and length of the carbon chains attached (Wang et al., 2009). Increases in
column temperature usually decrease viscosity of the solution resulting in a faster flow and hence
decreased retention times (Aguilar, 2004). Detection of separated compounds is often with use of a
UV-detector, where peptide bonds are detected at a wavelength of 214 nm and aromatic residues
are 280 nm (Bonfatti et al., 2008). On the resulting chromatogram, peak areas reflect the intensity
of peptide bonds (at 214 nm) detected at a given retention time (Berg et al., 2006).
Page 8 of 85
3.1.3 Lipids
The lipid fraction of bovine milk is mainly composed of apolar triacylglycerides (TAG) comprising
approximately 98%. In addition 1% is polar phospholipids and the remaining includes
monoglycerides, diglycerides, cholesterol and cholesterol esters (Fox and Kelly, 2012; Walstra et
al., 2006). Nearly all milk fat is concentrated in milk fat globules (MFG), with an average diameter
of 4.5 µm in raw milk, but varying from 0.1-20 µm. The globules are surrounded by an emulsifying
membrane, referred to as the milk fat globule membrane (MFGM) (Walstra et al., 2006). Milk is
therefore an emulsion of fat globules dispersed in the aqueous phase as an oil-in-water emulsion
(Walstra et al., 2006). The TAG´s are found in the hydrophobic core of the MFG, while polar lipids
and membrane-specific proteins are a part of the outer MFGM, serving as emulsifiers. The polar
lipids contained in the MFGM are mainly phospholipids and sphingolipids (Dewettinck et al.,
2008). These membrane-specific proteins and lipids stabilize the emulsion with their amphipathic
structure, containing both a hydrophobic and a hydrophilic part. Other important factors affecting
the stability of emulsions are density differences between the continuous and the dispersed phase as
well as size of the dispersed particles (Fox and Kelly, 2012). In addition to emulsifying properties,
the MFGM provides protection against enzymatic degradation (Dewettinck et al., 2008). The
TAG´s are composed of three fatty acids attached to a glycerol base. The compositional range is
wide and the properties of the milk fat are highly determined by the fatty acid composition (Walstra
et al., 2006). The fatty acids can either be saturated, primarily straight hydrocarbon chains, or
unsaturated containing 1-4 double bonds. In bovine milk approximately 65% of the fatty acids are
saturated and 35% are unsaturated (Samková et al., 2012). If the MFGM is disrupted, unsaturated
fatty acids will be highly prone to thermal and enzymatic degradation (Dewettinck et al., 2008;
Hawke, 1966). The chemical oxidation of lipids is of major focus, since this can be contributing to
nutritional losses, off-flavour and odor in dairy products (Nursten, 2005; Zamora and Hidalgo,
2005). Lipid oxidation will be further reviewed in section 3.5.2.
3.2 UHT milk
Thermal processing is an essential step in the manufacture of all dairy products. The main aim of
such treatment is to limit bacterial load, enzyme activity and increase the keeping quality of the
product (Walstra et al., 2006). The effect and efficiency of the heat treatment is dependent on the
pre-treatment conditions, heating method applied and time-temperature range. Production of heat
treated milk products can vary a lot, covering the spectrum from pasteurization to in-container
sterilization (Sakkas et al., 2014).

Page 9 of 85
The manufacturing of UHT treated milk includes a thermal processing of 135-150 ºC for 1-10 sec
followed by aseptic packaging (Lewis and Deeth, 2008). This heat treatment results in a
commercially sterile product, which is shelf stable for 6-9 months at room temperature (Bimbo et
al., 2016). Disadvantages related to heat treatment of UHT products are that the nutritional and
organoleptic quality decreases, due to thermal degradation and oxidation of lipids, denaturation of
proteins and reactions between proteins and sugars in the MR (Nursten, 2005). In this perspective
the time and temperature combination should be carefully optimized, depending on the desired
approach with least undesirable chemical changes (Sakkas et al., 2014). For determination of this
optimal time-temperature region for processing of UHT milk, biological and chemical indices have
been developed. A commercially sterile UHT product
has a biological effect of B* >1 and a chemical effect of
C* < 1, as demonstrated in Figure 4. If this area is
reached thermophilic bacterial spores will be reduced
with a 9 decimal and a chemical effect equal to boiling
the product for 1 min, in milk this is correlated with a
3% reduction of thiamine (Lewis and Deeth, 2008;
Kessler, 2002). As shown in Figure 4, the inactivation of
microorganisms is mainly dependent on the heat load
applied, whereas the chemical changes are mainly
dependent on holding time, on this basis it can be
favorable to increase the temperature and decrease the
holding time of a heat treatment (Kessler, 2002).
The processing of UHT milk can be either direct or indirect. In the direct heating system milk is
mixed directly with superheated steam under pressure. After a short holding time the water is
removed from the milk again with the use of vacuum cooling (Kessler, 2002). The indirect heating
system transfers heat to the milk with the use of a medium separating the milk and a heating fluid
mainly steam or hot water. The temperature difference between the milk and hot water facilitates
the heat transfer. Indirect heating can be achieved with the use of a tubular heat exchanger or a plate
heat exchanger, the latter is mainly used (Lewis and Deeth, 2008; Kessler, 2002). The choice of
processing system affects the time-temperature profile of the treatment, as shown in Figure 5.
Figure 4 – Biological (B*) and chemical (C*) effect of the UHT processing area (Kessler, 2002).

Page 10 of 85
The direct heating system results in high heating and cooling rates compared to the indirect heating
system, which gives a continuous heating and cooling within a longer time period. Minimal
chemical changes are applied to the direct compared to the indirect UHT milk due to the very fast
heating and cooling. This is reflected in lower levels of heat markers in direct UHT milk (Perkins
and Elliott 2005; Datta et al., 2002). Another effect of the reduced heat load of direct UHT milk is
often a higher enzyme activity leading to a higher degree of hydrolysis and age gelation (Lewis and
Deeth, 2008; Datta et al., 2002).
Homogenisation is always applied in combination with UHT treatment. In indirect heating systems
the homogenisation procedure can be applied before or after the heat treatment, while it is always
applied after in the direct heating systems, to avoid protein-protein and fat globule-protein
aggregation (Kessler, 2002). Homogenisation of UHT milk has a significant effect on the storage
stability. The technique delays fat separation by disrupting the MFG´s, resulting in a smaller droplet
size and hence an increased total MFG surface. Milk proteins, mainly caseins and β-LG, are
adsorbed on the MFGM. This incorporation of proteins prevents agglomeration by steric and
electrostatic repulsion (Raikos, 2010). Moreover, the incorporation increases the density of MFG´s,
which contributes to a delay of the creaming rate (Lu et al., 2013).
Figure 5 – Heating profiles of A) direct and B) indirect UHT treatment (Rauh, 2014a).

Page 11 of 85
3.3 Changes induced by UHT treatment
It is commonly known that commercial UHT treatment of milk induces a number of physico-
chemical changes (Singh and Waungana, 2001). Milk behaves as a complex reaction system when
exposed to heat, resulting in reversible as well as irreversible changes (Datta et al., 2001). Milk heat
treated at UHT is exposed to temperatures between 135-150 ºC, hence leading to several
irreversible changes. A great part of these heat-induced reactions involve lactose. One of them is the
degradation of lactose into galactose and degradation products of glucose, which often includes
organic acids, referred to as sugar fragmentation (Walstra et al., 2006). In addition lactose may
isomerize into other sugars, leading to the formation of lactulose or epilactose, where the glucose
moiety is converted to fructose or mannose respectively (Singh and Waungana, 2001; Fox and
Kelly, 2012). Lactulose is often used as an indicator of the severity of heat treatments, since it is not
affected before or after the UHT treatment (Chavan et al., 2011). Reducing sugars are also likely to
react with amino groups in the MR when heated, leading to browning, off-flavour formation as well
as a reduced nutritional value (Nursten, 2005; Fox and Kelly, 2012). The MR will be discussed in
detail in section 3.5.1.
At high temperatures milk proteins can be subject to structural changes including denaturation,
unfolding, rearrangement of disulfide bonds, aggregation and lactosylation (Datta et al., 2002).
Caseins are very heat stable since the random coiling of their primary chain is hard to destroy
compared to secondary and tertiary structures (Fox, 2003). Dephosphorylation and hydrolysis of
caseins have been documented to occur in milk during UHT treatment, but only to a limited degree
(Nieuwenhuijse and Van Boekel, 2003). Upon heat treatment soluble calcium and phosphate is
converted into the colloidal stage, and colloidal calcium phosphate is increasingly associated with
the casein micelles. Moreover, κ-CN is partially dissociated leading to a reduced size of the casein
micelles (Dalgleish and Corredig, 2012; Singh and Waungana, 2001). On this basis, casein micelles
are not the major factor contributing to heat-induced instability of proteins in milk. Whey proteins,
on the other hand, are highly temperature dependent due to their globular structure. Above 60 °C
significant denaturation of whey proteins occur (Singh and Waungana, 2001). The denaturation is
either reversible corresponding to a partial unfolding, or irreversible corresponding to aggregations
with other proteins mainly through sulfhydryl (-SH)/disulfide (S-S) interactions (Wijayanti et al.,
2014). The whey proteins have different sensitivity to heat treatment, the order has been
documented to be immunoglobulins > bovine serum albumin > β-Lg > α-La (Singh and Waungana,

Page 12 of 85
2001). The denaturation of β-Lg includes an unfolding of the globular structure exposing
hydrophobic residues and the free thiol group of Cys121 (Nieuwenhuijse and Van Boekel, 2003). In
addition heating leads to denaturation of cysteine disulfide bonds and an increased reactivity of
thiol groups (Datta et al., 2001). At neutral pH the sulphydryl groups of cysteine are ionized and
hence highly reactive. These groups can react intermolecular with other sulphydryl containing
molecules, often κ-caseins on the micelle surface, proteins in the MFGM or other β-Lg (Singh and
Waungana, 2001; Walstra et al., 2006). Such interactions between β-lactoglobulin and κ-caseins
lead to the formation of the so called β-lactoglobulin-κ-casein-complex (βκ-complex). The pH of
milk at heat treatment influences the extent of whey protein association to the casein micelle. At pH
between 6.5-6.7 the βκ-complex remains attached to the casein micelle, whereas at pH above 6.9
the complex dissociates from the micelle (Oldfield et al., 2000). Cross-linking within or between
peptide chains prevent refolding to the native structure, therefore these proteins remain denatured
(Walstra et al., 2006). Generally this leads to changes in the biological properties and may lead to
insoluble precipitates. Such cross-linking of peptide chains may continue during storage,
consequently these changes have been of interest to the dairy industry for many years (Datta et al.,
2002).
Several of the above mentioned processes will possibly decrease the pH of milk (Walstra et al.,
2006). Lactose undergoes reactions with formation of organic acids, to mention is the MR and
direct degradation of lactose with formation of galactose and degradation products, including
various organic acids (Walstra et al., 2006). Casein micelles can undergo dephosphorylation and
hydrolysis at severe heat treatment (Al-Saadi and Deeth, 2008). In addition, colloidal calcium
phosphate equilibrium can be affected leading to association of dissolved calcium and phosphate to
the casein micelle with release of protons. The reaction proceeds (Walstra et al., 2006):
𝐶𝑎2+ + 𝐻2𝑃𝑂4− → 𝐶𝑎𝐻𝑃𝑂4 + 𝐻+ (1)
This reaction is considered reversible at heat treatments below 100 °C (Gaucheron et al., 2011;
Dalgleish and Corredig, 2012).
Page 13 of 85
3.4 Enzymatic hydrolysis
Former research has shown that bitter off-flavour and physical instability of UHT milk can be
initiated by hydrolysis, due to milk indigenous enzymes and/or exogenous enzymes (Chavan et al.,
2011; Kilara and Panyam, 2003). Exogenous enzymes in UHT milk are formed by psychrotrophic
bacteria, which are capable of growing in the raw milk at temperatures ≤7 ºC. These
microorganisms produce heat stable extracellular enzymes, mainly proteases and lipases, which
continue to degrade milk constituents even after most UHT treatments (Nielsen, 2002). UHT milk
produced from raw milk with a high microbial count will hence be more susceptible to enzymatic
hydrolysis compared to milk with a low microbial count (Chavan et al., 2011). These proteases
differ in specificity, resulting in many different cleavage sites (Nielsen, 2002). They attack all
casein types and are able to hydrolyse hydrophobic domains, which are associated to the bitter
flavour formation (Lemieux and Simard, 1992). The heat stability of proteinases produced by
psychrotrophic bacteria has been found to be higher than the heat stability for indigenous enzymes
(Nieuwenhuijse and Van Boekel, 2003). Raw milk contains two indigenous proteinase systems; the
plasmin and the cathepsin system. The plasmin system is the major native proteinase system in
milk, with a sufficiently high heat stability to survive most UHT processes (Nieuwenhuijse and Van
Boekel, 2003). Plasmin is a serine proteinase mainly present as the inactive plasminogen, regulated
by activators and inhibitors. Plasmin, plasminogen and plasminogen activators are commonly
considered heat stable and the inhibitors heat labile (Ismail and Nielsen, 2010). Plasmin is mainly
present in the casein micelle and the MFGM (Nielsen, 2002). Flavour and colour of UHT milk can
indirectly be affected by enzymatic proteolysis, since an increased number of free amino terminals
will be available for the MR, leading to Strecker degradation products and melanoidins (Rauh,
2014a). Correlations between enzymatic proteolysis and bitter taste were first observed by Murray
and Baker in 1952 (Kilara and Panyam, 2003). Formation of bitter taste from peptides depends
highly on the amino acid composition and the properties of these amino acids. Hydrophobic
properties have been correlated with bitter taste intensity, but also aromatic properties, ammonium
groups and configuration of the α-carbon (Lemieux and Simard, 1992; Gomez et al., 1997). Bitter
peptides originate mainly from αS1-CN and β-CN, since these proteins have a high average
hydrophobicity (Kilara and Panyam, 2003). The most bitter amino acids include phenylalanine and
tryptophan, both with aromatic side chains (Lemieux and Simard, 1992), and the hydrophobic
amino acids; proline, leucine, isoleucine, methionine and valine (Jansson, 2014a). Hydrolysis of
lipids results in formation of short-chain fatty acids, which have a strong aroma and often rancid

Page 14 of 85
flavour (Singh et al., 2009). Hydrolytic activity is more pronounced in direct treated UHT milk
compared to indirect treated UHT milk, due to the lower heat load achieved by fast heating and
cooling rates (McKellar et al., 1984). This thesis evaluates indirect treated UHT milk hence enzyme
activity is expected to be minimal and insignificant to the results. The degree of hydrolysis will be
evaluated with peptide analysis.
3.5 Chemical changes in UHT milk during storage
Several chemical reactions affect the quality of UHT milk during storage, resulting in changes in
flavour, aroma, colour and/or viscosity. Colour changes in food systems can in general be a result of
two main mechanisms; enzymatic and non-enzymatic browning reactions. Division of these two
reaction mechanisms can in some cases be difficult, but in heat treated food only non-enzymatic
browning occur. The non-enzymatic browning can either be due to caramelisation or the MR
(Nursten, 2005; Van Boekel, 2006). Caramelisation of sugar leads to some of the same products as
the MR, but caramelisation proceeds at higher temperatures and at a slower rate. In the MR, amino
acids play an important role in the catalysis of the reaction resulting in higher amounts of reactive
intermediate products (Van Boekel, 2006; Nursten, 2005; Walstra et al., 2006). Flavour and odor
changes in UHT milk can again be due to the MR, but also hydrolysis and oxidation of proteins and
lipids can result in these changes (Nursten, 2005).
The effect of storage temperature on the rate of chemical reactions is commonly evaluated using the
Arrhenius equation. This equation describes the correlation between the velocity constant and the
absolute temperature (Martins et al., 2001; Kessler, 2002):
𝑘 = 𝐴 ∗ 𝑒−𝐸𝑎𝑅𝑇 (2)
Where k is the velocity constant, Ea is the activation energy (J/mol), R the universal gas constant
(8.314 J/mol K), T the absolute temperature (K) and A is the pre-exponential factor (Kessler, 2002).
This relation can be depicted in a so called Arrhenius plot with use of the natural logarithm. From
the slope of this plot it is possible to calculate the activation energy of a reaction. Another way to
express the correlation between the rate of chemical reactions and the absolute temperature is
referred to as Q10. This value denotes the increase in reaction rate when the temperature is raised
10 °C (Walstra et al., 2006), defined by:
𝑄10 =𝑘(𝑇+10)
𝑘(𝑇) (3)
Where k is the rate constant and T is the absolute temperature.

Page 15 of 85
3.5.1 Maillard reaction
The MR is a complex cascade of reactions between a reducing sugar and an amino group, first
observed by the French chemist Louis-Camille Maillard in 1912. This reaction proceeds mainly
during processing at elevated temperatures or during long time of storage (Nursten, 2005). A wide
range of reaction products are formed, but the products are not yet fully characterized (Jansson et
al., 2014b). The MR is highly relevant since it is a major challenge in food chemistry due to the
formation of compounds that are related to heat-induced changes in aroma, flavour and colour
(Martins et al., 2001). The resulting changes can be desirable or undesirable depending on the
product. In UHT milk consumer acceptance and shelf life is decreased with these changes. In
addition, the MR can have an effect on digestibility, nutritive value and can produce components
with harmful (mutagenic, allergenic) as well as favorable (antioxidative, antimicrobial) properties
(Van Boekel, 2006; Siciliano et al., 2013). The loss of nutritive value of milk is mainly due to
lactosylation of proteins, which result in less available lysine for metabolic processes. The
lactosylation decreases digestibility of the protein by diminished access of proteases, such as trypsin
and carboxypeptidase (Metha and Deeth, 2016; Van Boekel, 1998). The protein lactosylation can
also have an effect on functionality properties, such as solubility and thermal stability (Wang and
Ismail, 2012). In 1953 Hodge subdivided the MR into three stages; an initial, intermediate and late
stage. This three-part classification is still accepted today and will be described in the following
(Nursten, 2005).
Initial Maillard reactions
The indigenous reducing sugar in milk is lactose, which contains a carbonyl compound in the open-
chain conformation. The reducing sugar reacts with an amine, in milk mainly the ε-amino group of
lysine residues on casein micelles (Nursten, 2005). In milk the amount of free amino acids is
relatively low and most α-amino groups are tied up in peptide bonds. Hence mainly the N-terminal
α-amino group and nitrogen or sulfur containing side-chains of amino acids on proteins are
available for the Maillard reaction (Van Boekel, 2006). In addition to the ε-amino group of lysine
other amino acid side chains can react in the MR. To mention is the indolyl-group of tryptophan
and the guanidino-group of arginine, but these are not as reactive as lysine (Hedegaard and
Skibsted, 2010; O´Brien, 2009). Lysine residues in the caseins are found to be more reactive than
those of serum proteins, while the most reactive casein is the κ-casein (Van Boekel, 1998). In
general, the type of flavour compounds formed in the MR depends on the nature of the reactants,
such as type of sugar and amino acid, while the kinetics of the reactions are influenced by

Page 16 of 85
parameters such as temperature, time and pH (Van Boekel, 2006). The reaction rate increases with
high pH, temperature and duration of the thermal process. Under these conditions the reactivity
between protein and sugar are increased, since the unprotonated form of the amino group and the
open-chain form of the sugar are favored (Martins et al., 2001; Jansson, 2014a).
The initial stages of the Maillard reaction consists of a sugar-amine condensation and an Amadori
rearrangement as depicted in Figure 6. The first reaction is a nucleophilic attack of the nitrogen
atom in the amino group on the electrophilic carbon of the carbonyl group in a reducing sugar. This
reaction is followed by a condensation reaction forming an unstable Shiff base, which is rapidly
rearranged to the Amadori product, in milk ε-lactulosyllysine. The carboxyl group of the amino acid
is an important factor in the catalysis of the Amadori rearrangement (O´Brien, 2009; Van Boekel,
1998).
Figure 6 – The reaction between lactose and a lysine residue with formation of the Amadori product ε-lactulosyllysine. Gal=Galactose, Prot=Protein (Siciliano et al, 2013).
The Amadori product can be quantified directly by LC-MS following complete enzymatic
hydrolysis of the lactosylated proteins, but this approach is difficult and time consuming (Henle et
al., 1991). In addition indirect methods for evaluation of the early stage of the MR have been
applied in previous studies. A common method is quantification of the artificial amino acid furosine
in acid hydrolysed milk, as shown in Figure 7 (Metha and Deeth, 2016). Furosine is not found
naturally in milk and has hence shown to provide a good estimation of the extent of the early stage
of the MR (Serrano et al., 2002; Guerra-Hernandez et al., 2002). It is not possible to get a direct
measure of the protein lactosylation based on a quantification of furosine, since the conversion of
furosine from Amadori product is incomplete (Delgado et al., 1992), approximately 30-40 % of the
Amadori product is converted into furosine (Van Boekel, 1998).

Page 17 of 85
Intermediate Maillard reactions
In the intermediate stage of the MR, the Amadori product is degraded into several fission products
as shown in Figure 8. The Amadori product is in equilibrium with 1,2-eneaminol and 2,3-
eneaminol, which take part in the formation of various reactive carbonyl compounds (Van Boekel,
1998; Nursten, 2005). The breakdown pathway of the Amadori product is highly dependent on the
pH in the system. At acidic pH the main breakdown route is the 1,2-enolisation pathway by
formation of the reactive intermediate 3-deoxyosone. This pathway can lead to the formation of
furfural (when pentose sugars are involved) and hydroxymethylfurfural (HMF) (when hexose
sugars are involved) (Martins et al., 2001; O´Brien, 2009). At neutral or alkaline conditions the
Amadori product is mainly degraded via the 2,3-enolisation pathway with formation of 1-
deoxyosone and 4-deoxyosone respectively. The pH of fresh UHT milk is about 6.6, hence the 2,3-
enolisation pathway is favored (Nursten, 2005; Martins et al., 2001). The deoxyosones are degraded
to reductones (e.g. formic acid and acetic acid) and a variety of fission products such as
pyruvaldehyde, diacetyl, acetol and galactose.
Figure 8 – Advanced maillard reaction: The two major pathways for breakdown of the Amadori product (Nursten, 2005).
Figure 7 - Furosine formation by acid hydrolysis (Metha and Deeth, 2016).

Page 18 of 85
These highly reactive fission products are also referred to as advanced glycation end products
(AGE) (Van Boekel, 1998; Nursten, 2005; Martins et al.., 2001). Most AGE products contain
aromatic residues and conjugated double bonds, which makes them able to absorb and emit light
(Van Boekel, 1998; Lakowicz, 1999). Several studies have previously utilized these fluorescence
properties for evaluation of intermediate and late Maillard reaction products (MRP) (Matiacevich
and Buera, 2006; Birlouez-Aragon et al., 1998). The deoxyosones and fission products containing
carbonyl groups can react with α-amino acids in the so called Strecker degradation. The Strecker
degradation compounds are formed via a decarboxylating transamination, with a release of water
and CO2 and a transfer of ammonia to other compounds in the system. This reaction results in
formation of Strecker aldehydes and α-dicarbonyls (Figure 9) (Nursten, 2005). Strecker aldehydes
previously found in UHT milk are among others 2-methylbutanal and benzaldehyde (Jansson et al.,
2014b). The contributing amino acid will affect the type of Strecker aldehydes and secondary
reaction products formed. Strecker degradation compounds have shown to influence aroma and
flavour formation of milk, but can also take part in further reactions (Van Boekel, 2006; Jansson et
al., 2014b; Nursten, 2005).
Figure 9 – Formation of Strecker degradation products (Jansson, 2014a).
Late Maillard reactions
In the final stage of the MR, brown-colored polymers are formed, known as melanoidins. These
high-molecular weight compounds are formed by all kinds of fragmentation, dehydration,
cyclization and polymerization reactions from reactive compounds formed in the intermediate stage
(Metha and Deeth, 2016; Van Boekel, 2006; Van Boekel, 1998). The reactants are often Strecker
degradation products, fission products or dehydroreductones, as shown in Figure 10 (Martins et al.,
2001; Nursten, 2005). The Strecker degradation products can take part in formation of melanoidins
in two ways. The first way is an aldol condensation of the Strecker aldehydes resulting in nitrogen-
free polymers and the second way is a reaction with amino compounds via aldimines (Nursten,
2005). The final stage of the MR is not well characterized from a chemical point of view. Chemical

Page 19 of 85
structures of melanoidins are complex and until now only limited parts of melanoidin structures
have been clarified (Martins et al., 2001).
Figure 10 – Overview of volatile compounds identified in this study. Products in green are identified with SPME-GC-MS, in blue with HPLC and orange with analysis of fluorescence and colour changes.
3.5.2 Lipid oxidation
In addition to the MR, oxidation of lipids is also important, contributing to nutritional losses and
off-flavour formation in UHT milk during storage (Nursten, 2005; Zamora and Hidalgo, 2005). The
oxidation products can have an effect on the dairy product, but they can also interact with non-lipid
components and be a part of the MR (O´Brien, 2009; Zamora and Hidalgo, 2005). Formation of
oxidized flavour has in former studies been found to originate from an imbalance of pro-oxidants
and antioxidants (Gutierrez, 2015). Lipids are susceptible to oxidation in the presence of catalysts
or initiators such as heat (Vazquez-Landaverde et al., 2005), light, transition metals (Gutierrez,
2015), enzymes and microorganisms (Shahidi and Zhong, 2010; Jansson, 2014a). Oxidation of
lipids can hence be accelerated at higher temperatures (Shahidi and Zhong, 2010). Unsaturated fatty
acids are the major reactants in lipid oxidation, since it is the double bonds that are prone to
oxidation. Lipid oxidation reactions can occur by complex processes such as autoxidation, photo-
oxidation, thermal or enzymatic oxidation, of which autoxidation is the most common (Shahidi and
Zhong, 2010). Autoxidation is a spontaneous free radical chain mechanism, separated in three
stages; initiation, propagation and termination (Shahidi and Zhong, 2010). In the first part of the

Page 20 of 85
reaction a hydrogen atom is abstracted from the lipid in the presence of one of the initiators
resulting in a free radical. The radical reacts with oxygen generating primary oxidation products
such as lipid hydroperoxides, which are unstable and will easily attack new lipid molecules leading
to an auto-catalytic propagation process (Shahidi and Zhong, 2010; Jansson, 2014a). This
intermediate stage is repeated until no hydrogen atom is present for reaction or by reaction with an
antioxidant. Antioxidants are able to delay or prevent oxidation by hydrogen or electron transfer
through various pathways (Laguerre et al., 2007). The unstable lipid hydroperoxides can degrade to
a variety of secondary oxidation products including aldehydes, ketones, hydrocarbons, alcohols and
organic acids (Marsili, 1999; Shahidi and Zhong, 2010). Secondary oxidation products are
important contributors to the off-flavour formation, due to very low sensory threshold values
(Gutierrez, 2015). Both the MR and lipid oxidation are very complex cascades of reactions, and are
in addition found to be interrelated (Zamora and Hidalgo, 2005). The two reaction cascades have
common intermediates and can both result in polymerization reactions. Carbonyl-containing
secondary oxidation products are able to react with amino-containing molecules and be important
participants in the MR (O´Brien, 2009; Zamora and Hidalgo, 2005). Thus, oxidation reactions of
lipids are dynamic and often overlapping or correlating with other reactions, hence making accurate
kinetic studies of lipid oxidation or MR very complicated (O´Brien, 2009; Shahidi and Zhong,
2010; Zamora and Hidalgo, 2005).
Volatile products from lipid oxidation and intermediate MRs will in this study be relatively
quantified by solid phase micro extraction-gas chromatography-mass spectroscopy (SPME-GC-
MS). Characterization of volatiles with the use of GC-MS has been applied in many food systems,
including in UHT milk (Vazquez-Landaverde et al., 2006; Valero et al., 2001; Contarini et al.,
1997). Analysis of volatile compounds using SPME-GC-MS includes extraction, separation and
identification, as depicted in Figure 11. SPME is a solvent-free extraction of volatile compounds
using a flow of carrier gas (e.g. helium). This extraction technique uses a fiber coated with a highly
absorbant polymeric film. During extraction two equilibriums are reached; first an equilibrium
between the sample and the head space and secondly an equilibrium between head space and the
contact fibre (Barrious et al., 2013). For optimization of the extraction factors such as sample
volume, temperature, flow and time are important to consider, since they can have a major effect on
the amount of volatile components adsorbed by the SPME fibre (Vazquez- Landaverde et al., 2005;
Jansson, 2014a). The inert gas collects and transports the volatiles to the GC-MS system (Jansson,

Page 21 of 85
2014a). In the column, compounds are separated according to volatility (Johns et al., 2005). The
separated compounds are hereafter identified, often with use of a mass spectrometry detector
(Jansson, 2014a).
3.6 Physical changes in UHT milk during storage
Milk is a dispersion containing colloidal particles in a wide range of sizes; from 10 nm to 100 µm
(Walstra et al., 2006). These colloids are mainly fat globules and casein micelles. Fat globules are
lyophobic colloids, which in principle are unstable in liquid solvents. These contain a true phase
where surfactants are able to adsorb and improve stability. Casein micelles are on the other hand
lyophilic colloids, which in principle are stable due to high attractive forces to the solvent
(Rousseau, 2002; Walstra et al., 2006). Lyophobic and lyophilic colloids are subject to different
instabilities in milk during storage. Undesired physical changes associated with UHT milk during
storage includes; creaming of fat, sedimentation of protein and in some cases age gelation (Chavan
et al., 2011; Datta and Deeth, 2001). This part of the study will focus on destabilizations resulting in
creaming of fat and sedimentation of protein. Stability of an emulsion depends highly on the ability
to resist changes in colloidal properties over a time period. Two different stabilities are
distinguished in this context; thermodynamic stability and kinetic stability. The thermodynamic
stability determines if a process will occur, and the kinetic stability determines the rate at which the
process will occur (Huppertz and Kelly, 2006). Milk as an emulsion is a thermodynamic unstable
system and will be subject to various physical instabilities. These instabilities include fat droplet
aggregation and gravitational separation leading to more or less inhomogeneous products with
altered properties (Walstra et al., 2006; Huppertz and Kelly, 2006). In food emulsions these
instabilities will all take place to some extent and will be able to influence each other (Walstra et
Figure 11 – The SPME-GC-MS method; including SPME headspace sampling, gas chromatograph and mass spectrometer. Modified from Jansson (2014a) and Sigmaaldrich.com (2016).

Page 22 of 85
al., 2006). Droplet aggregation is a result of colloidal interactions, leading to contact between
droplets for longer time than random collision by Brownian motion. Physical instabilities due to
droplet aggregation can be in the form of flocculation and coalescence, as shown in Figure 12
(Rousseau, 2002). Flocculation is the aggregation of particles due to weak attractive forces. These
interactions are often described by the Deyaguin-Landau-Verwey-Overbeek (DLVO) theory,
considering the balance between attractive forces by Van der Walls and electrostatic repulsions as a
function of interparticle distance (Rousseau, 2002). During flocculation droplets remain as
individual entities opposite to coalescence. Coalescence is the process where two fat globules
merge by rupture of a thin film consisting of the continuous phase. This interaction is often
irreversible, whereas flocculation is a reversible interaction (Huppertz and Kelly, 2006).
Gravitational separation of emulsions occurs due to density differences between the two phases
influenced by gravity. The process of fat globules moving upward in milk is referred to as
creaming, mainly due to the low density of fat globules compared to milk plasma (Rousseau, 2002).
The velocity of creaming is not affected by colloidal interactions like flocculation and coalescence,
but by gravitational forces, density differences, globule size and the continuous phase viscosity. For
spherical particles the velocity can be obtained by Stockes equation (4) (McClements, 2007;
Huppertz and Kelly, 2006; Walstra et al., 2006).
𝑉 =𝑎∗(𝜌𝑐−𝜌𝑝)∗𝑑2
18∗𝜂𝑐 (4)
Where V is the particle migration velocity (m* s-1
), 𝜌c is the continuous phase density (kg*m-3
), 𝜌p
is the particle density (kg*m-3
), a is the acceleration due to gravitational or centrifugal force and 𝜂c
is the viscosity (m*s-1
) of the continuous phase.
Figure 12 – Instabilities commonly seen in food emulsions: Creaming, sedimentation, flocculation and coalescence, modified from McClements (2007).
Page 23 of 85
To calculate creaming velocity correctly, requirements must be met. Of particular importance is
that; the globules must be homogeneous spherical particles, other particles present must be smaller
than the globules and Brownian motion must be smaller than the rate of the globules (Huppertz and
Kelly, 2006; Walstra et al., 2006). But the equation has previously shown to predict useful trends
even under conditions that do not meet the requirements (Walstra et al., 2006). Creaming is
enhanced by flocculation or coalescence of the fat globules, since these larger clusters or globules
rise faster than individual fat globules (Rousseau, 2002). The density of milk fat has shown to be
influenced by the proportions of liquid and solid fat, liquid fat with a lower density than solid fat
(Bandari and Singh, 2011). The solubility of fat is affected by temperature and the TAG´s present.
Milk contains over 400 different TAG´s hence their melting point range is wide, going from -40 °C
to 40 °C (Wright and Marangoni, 2006). In addition, the continuous phase viscosity of milk will be
influenced by temperature changes (Rousseau, 2002). Xu et al. (1998) studied the effect of
increased storage temperature on oil-in-water emulsions. In this study a rise in temperature from 5
°C to 22 °C decreased the bulk viscosity leading to emulsion destabilization.
The rate at which an emulsion destabilizes depends on several factors; product composition,
processing and storage conditions (McClements, 2007; Rousseau, 2002). In the awareness of these
factors, processes like; homogenisation, control of temperature and addition of emulsifying agents
or thickeners are often applied. Homogenisation is a key technology to enhance storage stability of
conventional dairy products, disrupting the fat globules and hence increasing the number of small
globules (Lu et al., 2013). Plasma proteins are rapidly adsorbed at the surface of the newly formed
fat globules, due to their amphiphilic properties. These proteins prevent flocculation and
coalescence by steric repulsion, electrostatic repulsion and a reduction in surface tension (Raikos,
2010). Since the surface area of homogenised fat globules is highly covered by plasma proteins,
globules behave more or less like casein micelles. Hence changes causing casein micelles to
aggregate will also lead to fat aggregation, e.g. renneting, souring, heating at high temperatures etc.
(Walstra et al., 2006). Another way to enhance stability of emulsions is by the use of emulsifying
agents or thickeners (Rousseau, 2002). Emulsifying agents will be adsorbed in the MFGM like
natural surfactants, preventing agglomeration of the globules (Lu et al., 2013).
Changes in proteins during storage of UHT milk include; proteolysis, protein-protein interactions,
sulphydryl compound formation, and protein-lactose interactions (Datta et al., 2002). These changes

Page 24 of 85
can possibly result in two types of instability; sedimentation and gelation. A number of mechanisms
are behind these instabilities, but these are not well defined (Dalgleish, 1992; Datta et al., 2002).
The sedimentation of proteinaceous material is a result of external forces, commonly gravitational
or centrifugal. The sedimentation rate is affected by particle size and density, and can like the
creaming rate be described by Stockes law (4) (McClements, 2007). The denaturation and
unfolding of whey proteins during UHT treatment, lead to exposure of previously hidden
hydrophobic groups and sulphydryl groups (Raikos, 2010). Unfolded whey proteins are capable of
interacting with themselves, micelles or serum κ-CN and αS2-CN with formation of complexes
from 30 to 100 nm (Dalgleish and Corredig, 2012). In addition calcium phosphate can associate to
the casein micelle. These processes, affecting the micelle weight, are considered to increase the
sedimentation rate. Furthermore, cross-linking of proteins may lead to aggregates and insoluble
precipitates, which can contribute to sedimentation (Dalgleish and Corredig, 2012; Datta et al,
2002; Al-Saadi and Deeth, 2015). Gelation on the other hand is described by an increase in
viscosity during storage, often referred to as age gelation (Datta et al., 2002). The gel consists of a
three-dimensional protein network, which can contain both caseins and whey proteins. Formation of
the protein matrix are not well described in literature, but have been suggested to be initiated by
release of the βκ-complex. (Datta et al., 2001). The age gelation resulting from the βκ-complex is
often referred to as a two-step process. In the first step, the βκ-complex dissociates from the casein
micelle. This dissociation can either be enzymatically induced by plasmin or bacterial proteinases,
or as a result of physico-chemical changes. In the second step the βκ-complex cross-links and
aggregates into a three dimensional protein matrix forming the gel (Datta et al., 2001). The extent of
these changes depends on several parameters, but a major parameter is the type of UHT treatment.
More sedimentation and gelation is in general found in direct UHT milk (Datta et al., 2002).
Physical destabilization is commonly evaluated using analytical techniques, such as; light
scattering, spectroscopy and microscopy (Mengual et al., 1999). In this thesis, creaming and
sedimentation are analysed by use of Lumifuge and Turbiscan, both based on light scattering
technologies. Lumifuge is an optical stability analyzer, which accelerates physical destabilization
by centrifugal forces (Ng et al., 2013). Near infrared light illuminates the sample cell while the
system measures transmission continuously during the centrifugation process. Measured
transmission as a function of the local position yields the corresponding transmission profile (Ng et
al., 2013). Turbiscan is another example of an optical stability analyzer. This instrument uses a near
Page 25 of 85
infrared light source and two detectors; a transmission and backscattering detector. The
backscattering technique enables measurements of concentrated and opaque dispersions (Mengual
et al., 1999). Turbiscan is not able to accelerate physical destabilization, instead exposure to
specific conditions and regular analysis is needed for an accelerated shelf life test (Mengual et al.,
1999).
4. Material and methods
4.1 Milk samples and treatments
Milk used in the trials originated from two batches (A and B) of skimmed and full fat commercial
UHT milk, obtained from Arla Foods Pronsfeld Dairy (Pronsfeld, Germany). The composition
provided by the manufacturer was; 0.3% fat, 5.0% carbohydrates and 3.5% protein in the skimmed
milk and 3.5% fat, 4.8% carbohydrates and 3.3% protein in the full fat milk. The milk was pre-heat
treated at 90 °C for 120 sec, and indirectly UHT treated using a tubular heat exchanger at 140 °C for
6 sec. A single stage homogenization took place upstream at 200/0 bar.
The two milk products were subjected to different storage temperatures, in order to accelerate the
shelf life development over a period of 24 weeks. Storage temperatures selected for the study were
10 °C, 20 °C, 30 °C, 40 °C and 50 °C. Furthermore, three temperature cycles were applied, which
were switched between two temperatures with two weeks intervals. Temperature cycle 1 were
exposed to 10 °C and 30 °C, cycle 2 to 20 °C and 40 °C and cycle 3 to 30 °C and 50 °C (Figure 1).
Milk stored at 50 °C and cycle 3 were analysed over a period of 8 weeks, whereas milk stored for
10 °C to 40 °C including cycle 1 and 2 were analysed over a period of 24 weeks.
4.2 Analysis of chemical changes
The initial MR was indirect measured with a quantification of furosine by reverse phase-high
performance liquid chromatography (RP-HPLC), with diode array detector (DAD). Solid phase
micro extraction-gas chromatography-mass spectrometry (SPME-GC-MS) was used to detect and
relatively quantify volatile compounds; intermediate MRP´s and products from lipid oxidation.
Fluorescence spectroscopy was used to measure both intermediate and late MR´s by the use of a
multi-mode microplate reader. Development of late MR´s was measured as changes in colour.
Additionally, HPLC was used to analyse the protein composition of the samples, and peptide
formation as an indirect measure of enzyme activity.

Page 26 of 85
4.2.1 Peptide analysis by HPLC
Peptide analysis by the use of HPLC allows a detection and identification of pH 4.6 soluble
peptides and native whey proteins. In this thesis the method was used to demonstrate the absence of
enzyme activity in the UHT milk. Full fat and skimmed UHT milk from week 0 and week 24
(stored at 30 °C) were analysed. The method for peptide analysis was based on Rauh et al. (2014c).
The pH-meter 766 Calimatic (Knick GmbH, Germany) was calibrated with buffer solution pH 7
and 10 from VWR Chemicals, and pH was measured in the milk samples prior to pH adjustment.
Milk samples of 20 mL were adjusted to pH 4.7 with 1 M HCl, stirred and adjusted to a final pH of
4.5. The samples were subsequently stirred for at least 15 min to ensure a constant pH. The pH
adjusted milk samples were centrifuged at 17090 x g for 10 min at 4 °C, and 1.5 mL was frozen for
later use. Prior to HPLC analysis the samples were centrifuged at 11.000 x g for 10 min at 4 °C to
separate fat particles and eventually precipitated casein micelles from the supernatant.
Approximately 1 mL of the clear supernatant was transferred to HPLC vials and 20 µL were
injected into the HPLC system. The column used to separate peptides and whey proteins was
AdvanceBio Peptide Map (Agilent Technologies, 250 mm * 2.1 mm, 2.7 µm), with a temperature
of 45 °C. Two buffers were used for a gradient elution. Buffer A contained Milli-Q water with 0.1%
TFA and buffer B contained acetonitrile with 0.5% TFA. A linear gradient was applied using 100%
of buffer A from 3 min, 100%-45% of buffer A at 45 min with a flow rate of 0.3 mL/min. Detection
of the peptides was conducted with a UV-detector, at a wavelength of 214 nm. Measurements were
performed in duplicates.
4.2.2 Initial Maillard reactions
Furosine formation in the milk samples was measured after acid hydrolysis by RP-HPLC-DAD.
The method was based on Jansson et al. (2014c) and Rauh et al. (2014b). 3 mL of 10 M HCl was
added to 1 mL milk in screw-cap tubes and bubbled with nitrogen for 2 min to avoid oxidation. The
milk was hydrolysed in presence of HCl for 18 hours at 110 ºC. The hydrolysate was cooled and
filtered through a 0.45 µm Whatman filter paper (Black Ribbon 589/1, Schleicher & Schuell
MicroScience GmbH, Germany). The filtered hydrolysate was diluted 5 times with 3 M HCl and
transferred to Whatman Mini-UniPrep filter HPLC vials. 10 µL of this was injected into the HPLC
system. Furosine was analysed by RP-HPLC with isocratic elution, using 0.06 M sodium acetate
buffer with a flow rate of 1 mL/min from 0-4 min, and 0.5 mL/min from 4-15 min.

Page 27 of 85
Compounds were separated with a Supelco Supercosil LC-8 column (Sigma-Aldrich Inc., 250 mm
* 4.6 mm, 5 µm) with a temperature of 40 °C. Detection was conducted with a DAD-detector
(Sigma-Aldrich Inc.), where furosine was detected at a wavelength of 280 nm. An external standard
was used to quantify the amount of furosine in the UHT milk samples. Stock solutions of pure
furosine standard (99.4%) were prepared and calibration curves were made. This was done by
plotting the furosine standard concentrations as a function of the peak area obtained from the HPLC
analysis.
4.2.3 Intermediate Maillard reactions and lipid oxidation
Fluorescence spectroscopy can be used to detect intermediate and late MRP´s. Fluorophores are
generally aromatic and highly conjugated compounds, able to absorb and emit light. These
compounds include; proteins, pigments, colored substances and flavoring compounds (Van Boekel,
1998; Lakowicz, 1999). Fluorescence intensity was in this study measured at an excitation
wavelength of 360 nm, and emission wavelengths of 380-480 nm. For this approach a Multi-mode
microplate reader (SynergyTM
Mx, BioTek) was used, with the software GEN 5 2.0. Fluorescence
was measured in the milk fraction soluble at pH 4.5, to avoid potential interference from proteins
and fat resulting in quenching and due to the turbidity of milk. The pH-meter 766 Calimatic (Knick
GmbH, Germany) was calibrated with buffer solution pH 7 and 10 from VWR Chemicals. Milk
samples of 20 mL were pH adjusted to 4.5 with 1 M HCl. The milk samples were centrifuged at
4 C for 10 min at 17090 x g to separate precipitated caseins and denatured whey proteins from the
supernatant. The supernatant was diluted with Milli-Q water in the ratio of 1:1 and 200 L of each
diluted sample was transferred to a microtiter plate. Water was added to the last well of each row as
control. Measurements were performed in biological and analytical duplicates.
Additionally, analysis of low molecular weight products, including intermediate MRP´s and lipid
oxidation products, was conducted by SPME-GC-MS. The volatile products were extracted with the
use of SPME (PAL CTC-Analytics), separated by GC and detected by MS. Prior to the analysis the
milk samples were frozen at -20 ºC. 5 mL of milk was injected with the internal standard 5-methyl-
2-hexanone, to enable a relative quantification. This internal standard was chosen on basis of its
structural similarities to the volatile compounds of interest, and in addition on its absence in milk
naturally. Helium was used as carrier gas with 1 mL/min. The compounds were injected into a gas
chromatograph (Agilent Technologies, 6890A) with an inlet temperature of 250 ºC. The separation

Page 28 of 85
was conducted with an Agilent GC column (HP-FFAP 19091F-433, 30.0 m * 0.25 mm, film
thickness = 0.25 µm) at a temperature of 40 ºC for 2 min, to 200 ºC with a rate of 5 ºC/min.
Identification of the separated volatiles were achieved with a 5973 quadrupole mass spectrometer
(Agilent Technologies). A MS database (NIST MS search 2.0) was used to compare the measured
retention times and mass spectral data with reference spectra. Further identification was conducted
in selected ion monitoring (SIM) mode, where selected ions were used to identify the compounds of
interest. This analysis mode eliminates noise from impurities, and may be preferable when the
compounds of interest are present in low concentrations (Jansson, 2014a).
4.2.4 Late Maillard reactions
Late Maillard reactions lead to the formation of brown coloured
polymers called melanoidins. Formation of these products can be
evaluated by measurement of colour changes (Al-Saadi and
Deeth, 2008). Colour measurements were conducted with the
use of a Chroma-Meter (CR-400, Konica Minolta) using the
software; CR-400 Utility Software (CR-S4w, Ver. 1.10). The
instrument was calibrated with a white Minolta standard plate,
before colour of the milk samples were measured. Colour
parameters were expressed according to the CIELAB system,
with illuminant D65 and a visual angle of 0°. The colour space
components are L* (Black: L* = 0 and white: L* = 100), a* (red-green: negative a* = greenness
and positive a* = redness) and b* (yellow-blue: negative b* = blueness and positive b* =
yellowness) (McGuire, 1992), as depicted in Figure 13. Measurements were performed with two
biological duplicates and two analysis duplicates. Each analysis duplicate was a mean of five
determinations at ambient temperatures. The colour values were determined as means of all
replicates.
4.2.5 Protein composition
Protein composition of the milk samples was analysed using HPLC. This method can be used for
identification and quantification of caseins and whey proteins, and allows an evaluation of the
lactosylation of proteins (Bordin et al., 2001). For this analysis 200 L milk was frozen at -20 °C
until further use. Prior to analysis milk proteins were dissociated by 6 M urea, 0.1 M trisodium
Figure 13 – CIELAB colour model with the three colour space components (dba.med.sc.edu, 2000)

Page 29 of 85
citrate and reduced by 0.5 M dithioerythritol (DTE). Urea causes an extraction of hydrophobic
bonds and DTE reduces disulfide bonds (S-S). Moreover, sodium citrate functions as a chelating
agent dissolving the casein micelle by ion exchange. Without calcium the micelles will dissociate
(De Jong et al., 1993). From the reduction buffer, of urea and citrate, 1000 µL was added to 200 µL
milk samples followed by 20 µL 0.5 M DTE. After mixing with reduction buffer the samples were
incubated at 30 C for 60 min while shaking to reduce cross-linking, non-covalent bonds and
disulfide bonds. Afterwards the samples were centrifuged at 11.000 x g at 5C for 10 min. A
volume of 5 L supernatant was injected into the HPLC system and separated by a Biosuite column
C18 (PA-B 250 mm x 2.1 mm, pore size of 300 Å and particle size of 3.5 µm) (Waters, USA).
Compounds were separated with a gradient elution using two buffer solutions, and a column
temperature of 40 C. Buffer A contained 0.05% triflouroacetic acid (TFA) in Milli-Q water, and
buffer B contained 0.1% TFA in acetonitrile. A linear gradient of buffer B were applied, from
33.2% to 44.3% (2.8-16.0 min) with a flow of 0.35 mL/min. A UV-detection of 214 nm was used,
since this is the wavelength that is absorbed by peptide bonds. Measurements were performed in
duplicates and the method was based on Bordin et al. (2001) and Bonfatti et al. (2008).
4.3 Analysis of physical changes
Creaming and sedimentation were evaluated during the storage period using; optical stability
analyzers, evaluation of protein and fat distribution in top, middle and bottom fractions and fat
globule size distribution.
4.3.1 Physical destabilization
Analysis of instability due to creaming and sedimentation has been optically characterized with the
use of Lumifuge (L.U.M GmbH, Germany) and Turbiscan (Turbiscan 2000, Sweden). Lumifuge is
an optical stability analyser, which simulates destabilisation processes due to gravitational forces
and hence accelerates shelf life development. This technique applies near infrared light radiated to
the sample during centrifugation and measures transmission from top to bottom of the sample cell
(Ng et al., 2013). Prior to analysis, the milk samples were gently homogenized by shaking from side
to side, whereafter 400 L milk was transferred to Lumifuge sample cells. The samples were
centrifuged at 2300 x g for 43 min at room temperature and transmission was measured at a
wavelength of 865 nm. Transmission was measured for 255 cycles with duration of 10 sec.
Measurements were performed in biological and analytical duplicates.

Page 30 of 85
Transmission profiles were analysed with the Lumifuge software SEPView. The transmission
profiles correspond to the measured transmission in % as a function of the local position on the
centrifuge tube in mm. From the transmission profiles it is possible to calculate an instability index,
within the range 0 to 1, depending on the instability of the dispersion. The instability index is based
on the following equation:
Instability index = (𝒆𝒏𝒅 𝒕𝒓𝒂𝒏𝒔𝒎𝒊𝒔𝒔𝒊𝒐𝒏−𝒔𝒕𝒂𝒓𝒕 𝒕𝒓𝒂𝒏𝒔𝒎𝒊𝒔𝒔𝒊𝒐𝒏)−(𝒆𝒏𝒅 𝒕𝒓𝒂𝒏𝒔𝒎𝒊𝒔𝒔𝒊𝒐𝒏−𝒄𝒖𝒓𝒓𝒆𝒏𝒕 𝒕𝒓𝒂𝒏𝒔𝒎𝒊𝒔𝒔𝒊𝒐𝒏)
(𝒆𝒏𝒅 𝒕𝒓𝒂𝒏𝒔𝒎𝒊𝒔𝒔𝒊𝒐𝒏−𝒔𝒕𝒂𝒓𝒕 𝒕𝒓𝒂𝒏𝒔𝒎𝒊𝒔𝒔𝒊𝒐𝒏) (9)
Where the start transmission is the first measured transmission, the current transmission is defined
to be the transmission after 2000 sec of centrifugation and the end transmission is the transmission
after 43 min of centrifugation. The values included in the equation are transmission measured at a
defined position on the sample cell. In skimmed milk a clarification of the top fraction was
observed, hence the position in skimmed milk was defined to be 5 mm from the meniscus and down
in the sample. In full fat milk slight clarification was observed in the bottom fraction, hence the
measured position was defined to be 5 mm above the bottom of the sample cell. Examples of the
transmission profiles provided by Lumifuge and the position defined for the current transmission
are illustrated in Appendix 1.
Another way to analyse stability of an emulsion is with Turbiscan. The Turbiscan technique is
based on multiple light scattering measurements. It uses emission of pulsed near infrared light
(wavelength of 850 nm) and detection by the use of transmission and backscattering photodiodes
(Mengual et al, 1999). Light backscattered by the milk sample was measured at an angle of 135°
every 40 µm at the entire length of the sample. Prior to analysis cylindrical glass measurement cells
were sterilized by autoclavation at 120 C for 20 min. 5 mL of milk was transferred into each cell in
a microbiological safety cabinet. The samples were stored at 10 C, 20 C, 30 C and 40 C
including the three temperature cycles and measured continuously during a period of 24 weeks. The
measurements were performed with two biological replicates and three analytical replicates.
Backscattering profiles were analysed with the TurbiSoft 2000 software, corresponding to the
measured backscattering in % as a function of the local position on the sample cell in mm.
Creaming was defined as the maximum backscattering in full fat milk, sedimentation as the

Page 31 of 85
Figure 14 – Schematic illustration of the separation process with use of negative pressure.
maximum backscattering in skimmed milk and clarification as the backscattering at the local
position of 25 mm from the bottom of the sample cell (Appendix 2).
4.3.2 Protein and fat content
Protein and fat content in the milk samples were determined by
Milkoscan FT1 (Foss, Denmark), which is based on Fourier
transform infrared (FT-IR) spectroscopy. In infrared spectro-
scopy, infrared radiation is passed through the sample. Some of
the infrared radiation is absorbed, resulting in vibrations of
chemical bonds, and the rest is transmitted through the sample
and detected. To convert raw data into an infrared spectrum a
mathematical procedure, referred to as a Fourier transform, is
needed. The resulting spectrum represents the molecular
absorption and transmission, creating a molecular fingerprint of
the sample. Milkoscan is able to recognize and compare spectra
from previous measurements. The milk was measured at room
temperature in three fractions; top, middle and bottom. The milk was transferred from the bottom of
the carton by the use of vacuum through a glass tube, as demonstrated in Figure 14. Measurements
were performed on full fat milk in biological and analytical duplicates.
4.3.3 Fat globule size distribution
The particle size distribution was determined by static light scattering (SLS) using Mastersizer 3000
(Malvern Instrument Ltd., Malvern, UK). The principle of this laser diffraction measurement is that
particles are passed through a focused laser beam. These particles scatter light at angles inversely
proportional to their size. Angular variation in intensity of the scattered light is then measured by a
series of photosensitive detectors. The scattering intensity versus angle is the primary source of
information used to calculate the particle size (Michalski et al., 2001; Malvern Instrument Ltd,
2015). Prior to analysis the milk samples were gently homogenized by shaking from side to side.
The milk samples were diluted in distilled, degassed water and added to the instrument under
agitation at 1000 rpm, until a laser obscuration of approximately 5% was reached. The procedure
was performed with and without urea buffer to dissociate proteins from the fat globules
(Gaucheron, 2005). Milk proteins were dissociated by 6 M urea and 0.1 M trisodium citrate (De
Jong et al, 1993). 9 mL urea buffer was added to 1 mL milk and analysed after 1 hour. Calculation

Page 32 of 85
of particle size was performed by the Mastersizer 3000 software (version 3.4) using the Mie theory,
which assumes spherical particles and requires refractive indices (milk fat: 1.46, water: 1.33)
(Mickalski et al., 2001). The absorption index used for milk fat was 0.1 (Malvern Instruments,
1997). Milk samples were measured at room temperature and performed in biological and analytical
duplicates. From a volume weighted particle size distribution, the percentiles; Dv10, Dv50 and
Dv90 were calculated. These parameters describe the maximum particle diameter for a given
percentage of the sample volume. Hence it is possible to detect changes in the main, as well as the
extreme particle sizes.
4.4 Data analysis
Means and standard deviations were calculated for all data. A one-way analysis of variance
(ANOVA) was applied to investigate significant effects of UHT milk stored over time at different
temperatures (10-50 °C). Statistical significance was defined at P≤0.05, with a 0.95% confidence
interval. In addition linear regression models were applied to test for linear correlations. These
statistical tests were carried out with Microsoft Excel 2010. Multivariate data analysis in the form
of Principal component analysis (PCA) was carried out with use of the Simca software (version
14.0, Umetrics AB, Umeå, Sweden). To investigate grouping of the samples all quantified
parameters were included from the chemical analyses as well as parameters of protein and fat
distribution and instability index.
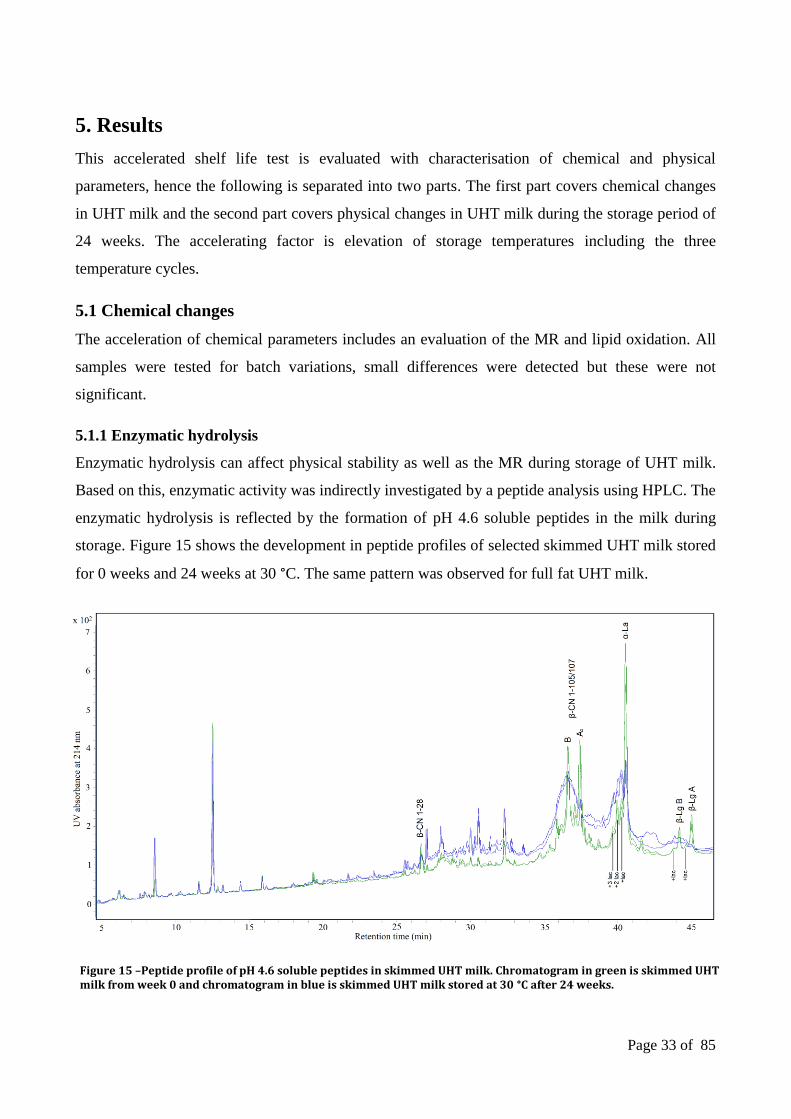
Page 33 of 85
5. Results
This accelerated shelf life test is evaluated with characterisation of chemical and physical
parameters, hence the following is separated into two parts. The first part covers chemical changes
in UHT milk and the second part covers physical changes in UHT milk during the storage period of
24 weeks. The accelerating factor is elevation of storage temperatures including the three
temperature cycles.
5.1 Chemical changes
The acceleration of chemical parameters includes an evaluation of the MR and lipid oxidation. All
samples were tested for batch variations, small differences were detected but these were not
significant.
5.1.1 Enzymatic hydrolysis
Enzymatic hydrolysis can affect physical stability as well as the MR during storage of UHT milk.
Based on this, enzymatic activity was indirectly investigated by a peptide analysis using HPLC. The
enzymatic hydrolysis is reflected by the formation of pH 4.6 soluble peptides in the milk during
storage. Figure 15 shows the development in peptide profiles of selected skimmed UHT milk stored
for 0 weeks and 24 weeks at 30 °C. The same pattern was observed for full fat UHT milk.
Figure 15 –Peptide profile of pH 4.6 soluble peptides in skimmed UHT milk. Chromatogram in green is skimmed UHT milk from week 0 and chromatogram in blue is skimmed UHT milk stored at 30 °C after 24 weeks.

Page 34 of 85
Storage time (weeks)
0 5 10 15 20 25
mg f
uro
sin
e /
10
0 g
pro
tein
0
100
200
300
400
500
600
700
800
10 oC
20 oC
30 oC
40 oC
50 oC
Cycle 1
Cycle 2
Cycle 3
Retention time (min)
0 2 4 6 8 10 12 14
Absorb
ance (
mA
U)
-20
0
20
40
60
80
100
120
140
160
Fu
rosin
e (
7.0
33
)
Overall the total peak area of pH 4.6 soluble peptides increased. The total peak area (AU) from the
peptide profiles were in week 0 found to be 0.46 *105 and 0.57 *10
5 for full fat and skimmed milk
respectively, whereas the peak area in week 24 were found to be 0.95 *105 and 0.94 *10
5 for full fat
and skimmed milk. Increases in the peak area were mainly observed between 25 to 45 min, which is
probably due to lactosylations. Peaks between 36 and 38 min are plasmin degradation products of
β-CN, based on similar chromatographic patterns from previous studies (Rauh et al., 2014c). These
peaks were observed to broaden with time and temperature. pH 4.6 soluble peptides eluted between
10 and 20 min approximately, have previously been identified as small hydrophobic peptides,
mainly formed in presence of hydrolytic enzymes (Rauh et al., 2014c). In this region no remarkable
increases were seen.
5.1.2 Initial Maillard reactions
Detection of furosine in acid hydrolysed milk was measured using RP-HPLC-DAD, to give an
indirect quantification of the initial MRP, lactulosyllysine. Furosine was detected at 280 nm with a
retention time of approximately 7 min, as shown in Figure 16. Retention times of standard furosine
fractions coincided with retention times of the eluted peaks. The formation of furosine was analysed
in full fat and skimmed UHT milk, stored at temperatures of 10 °C, 20 °C, 30 °C, 40 °C, and 50 °C
including the three temperature cycles, over periods of 8 weeks (50 °C and cycle 3) and 24 weeks
(10-40 °C, cycle 1 and 2). Figure 17 illustrates the effect of storage temperature on the formation of
furosine over time.
Figure 17 – Furosine concentration in skimmed UHT milk during storage at temperatures between 10 °C and 50 °C, including temperature cycles. Error bars indicate standard deviation, n=2.
Figure 16 – HPLC chromatogram of furosine detected at 280 nm.

Page 35 of 85
For simplification only skimmed milk is included in Figure 17, since the formation of furosine in
full fat milk followed the same pattern and no significant differences were detected. The data
included is based on mean values from biological duplicates. The formation of furosine was
significantly increasing in skimmed as well as full fat UHT milk stored at 20 °C and above, affected
by storage time and temperature.
The concentration of furosine (mg furosine/100g protein) after 8 weeks was highest in milk stored
at 50 °C, followed by 40 °C, 30 °C, 20 °C and 10 °C, indicating a strong temperature dependence of
the reaction. In temperature cycle 1, stored at 10 °C and 30 °C, concentrations of furosine were
significantly higher than in samples stored at 20 °C. The same tendency was seen for cycle 2, stored
at 20 °C and 40 °C, which showed higher concentrations than at 30 °C, and cycle 3 stored at 30 °C
and 50 °C, showed higher concentrations than milk stored at 40 °C.
The furosine concentration after 24 weeks at 20 °C was 338mg furosine/100g protein, which is
corresponding to the concentration at 30 °C after 8 weeks, and 40 °C after 3 weeks of storage. After
the period of 24 weeks the furosine content was approximately 1.5 times higher in milk stored at
30 °C than in milk stored at the ambient temperature of 20 °C, and approximately 2.2 times higher
in milk stored at 40 °C than in milk stored at 20 °C. The formation of furosine does not seem to be
linearly correlated with storage time, since it levels off with time. On this background the formation
seems to fit well to a first order reaction kinetic, indicating that the furosine formation can be
kinetically described. The common first order reaction kinetic for product formation follows the
equation:
𝐶𝑡 = 𝐶𝑚𝑎𝑥(1 − 𝑒−𝑘𝑡) + 𝑐 (5)
Where Ct is the concentration at a time t, Cmax is the maximum concentration, k is the rate constant,
and c is the concentration at the beginning of the reaction. A first order kinetic resulted in k, Cmax
and R2
values presented in table 1. Both k and Cmax were found to increase with temperature. An
elevation of the storage temperature from 20 °C to 50 °C increased k 7.2 times in skimmed and 6.7
times in full fat milk, whereas Cmax increased 2.2 times in skimmed and 1.9 times in full fat milk. R2
values were above 0.9 for all plots.

Page 36 of 85
Table 1 – Kinetic parameters for first order formation of furosine in skimmed and full fat UHT milk stored at temperatures between 10 °C and 50 °C, including temperature cycles.
The effect of storage temperature on the velocity of chemical reactions can be evaluated with use of
the Arrhenius equation (Martins et al., 2001). This correlation between the rate constant and the
absolute temperature can be depicted in an Arrhenius plot, based on the natural logarithm of the
Arrhenius equation:
ln(𝑘) = ln(𝐴) −𝐸𝑎
𝑅∗
1
𝑇 (6)
Where k is the rate constant, Ea is the activation energy (J/mol), R the universal gas constant (8.314
J/mol K), T the absolute temperature (K) and A is the pre-exponential factor (Kessler, 2002). The
Arrhenius plot in Figure 18 depicts the natural logarithm of the rate constants, from formation of
furosine, as a function of the inverse temperature. This plot illustrates a linear correlation between
changes in reaction rate and storage temperature. R2 from these linear regressions were 0.993 and
0.989, for skimmed and full fat milk respectively. This correlation can be supported by Q10 values,
corresponding to the changes in rate for each 10 °C elevation in storage temperature. Q10 can be
calculated from equation 3. In this analysis Q10 for all steps were in the range of 1.5 and 2.3. From
Milk type Storge temperature
k Cmax R2
Skimmed 10 °C 0,016 40 0,921
Full fat 10 °C 0,026 39 0,994
Skimmed 20 °C 0,045 202 0,994
Full fat 20 °C 0,049 229 0,970
Skimmed 30 °C 0,093 245 0,992
Full fat 30 °C 0,090 309 0,985
Skimmed 40 °C 0,144 415 0,933
Full fat 40 °C 0,143 398 0,997
Skimmed 50 °C 0,330 457 0,997
Full fat 50 °C 0,329 446 0,992
Skimmed Cycle 1 0,180 170 0,998
Full fat Cycle 1 0,209 210 0,946
Skimmed Cycle 2 0,150 350 0,998
Full fat Cycle 2 0,140 315 0,990
Skimmed Cycle 3 0,181 530 0,995
Full fat Cycle 3 0,180 630 0,999

Page 37 of 85
Figure 19 – pH values in skimmed UHT milk during storage at temperatures between 10 °C and 50 °C, including temperature cycles. Error bars indicate standard deviation, n=2.
the slope of the Arrhenius plot it is possible to calculate the activation energy. The activation
energies were found to be 51 kJ/mol and 46.7 kJ/mol for skimmed and full fat milk respectively.
Figure 18 – Effect of storage temperature (10 °C to 50 °C) on the rate constants for furosine formation, in skimmed and full fat UHT milk. Linear regressions are included.
Changes in pH were measured in full fat and skimmed UHT milk, stored at different temperatures.
Figure 19 demonstrates the development of pH in skimmed UHT milk, with data representing mean
values of biological duplicates.
Storage time (weeks)
0 5 10 15 20 25
pH
0,0
6,3
6,4
6,5
6,6
6,7
10 o C
20 o C
30 o C
40 o C
50 o C
Cycle 1
Cycle 2
Cycle 3
1/T (10-3
* K-1
)
0,0030 0,0031 0,0032 0,0033 0,0034 0,0035 0,0036
ln k
(k in s
-1)
-4,5
-4,0
-3,5
-3,0
-2,5
-2,0
-1,5
-1,0
-0,5
Skimmed milk
Full fat milk

Page 38 of 85
The pH value decreased with time and temperature in skimmed milk as well as in full fat milk. At
the beginning of the study pH in the milk samples were 6.7 for skimmed milk and 6.65 for full fat
milk. During storage the pH of all samples decreased significantly, though changes in milk stored at
10 °C were minimal. The final pH of skimmed UHT milk stored at 10 °C, 20 °C, 30 °C and 40 °C
for 24 weeks were 6.67, 6.62, 6.58, and 6.36 respectively. Only milk stored at 40 °C and 50 °C
follows a linear regression with R2 above 0.9.
5.1.3 Intermediate Maillard reactions and lipid oxidation
Formation of fluorescent compounds were analysed in the serum phase of skimmed and full fat
UHT milk, using a Multi-mode microplate reader at excitations of 360 nm. Increases in
fluorescence intensities can possibly be an indication of fluorescent intermediate and late MRPs
(Birlouez-Aragon et al., 2002; Bosch et al., 2007). Figure 20 shows fluorescence intensities
detected in the serum phase of skimmed UHT milk during storage at different temperatures. Data
presented in the figure corresponds to mean max values of fluorescence intensities, based on
biological and analytical duplicates.
The formation of fluorescent compounds was observed to increase with the same pattern in
skimmed and full fat UHT milk, but with significantly higher intensities in skimmed compared to
full fat milk (p<0.05). Overall this formation seems to follow a linear relation, though a short lag
Figure 20 – Fluorescence intensity (ex 360 nm) in skimmed UHT milk during storage at temperatures between 10 °C and 50 °C, including temperature cycles. Linear regression lines and error bars are included, which indicate standard deviation, n=4.
Storage time (weeks)
0 5 10 15 20 25
Flu
ore
scen
ce in
ten
sity (
ex 3
60 n
m)
0
20000
30000
40000
50000
10 oC
20 oC
30 oC
40 oC
50 oC
Cycle 1
Cycle 2
Cycle 3

Page 39 of 85
phase was observed in milk stored at 50 °C and cycle 3, during the first weeks of storage. The linear
relation indicates that the formation of fluorescent compounds follows a zero order reaction kinetic.
The zero order rate constants (k) for the formation were calculated using following equation:
𝐶𝑡 = 𝑘𝑡 + 𝐶0 (7)
Where C0 is the fluorescence intensities at time 0 (beginning of storage), Ct is the fluorescence
intensities after t (storage time in minutes) at a given storage temperature and k is the rate constant.
Kinetic parameters based on a linear regression model are presented in table 2. The p-values
indicates a significant increase in fluorescence intensities with time and temperatures from 30 °C to
50 °C (p<0.05). After 24 weeks the intensity in skimmed UHT milk stored at 40 °C were 2 times
higher than the intensity measured at ambient temperatures (20 °C). Fluorescent compounds formed
in milk exposed to temperature cycle 1 revealed rate constants higher than at 20°C, temperature
cycle 2 revealed rate constants higher than at 30 °C and temperature cycle 3 higher than at 40 °C
(table 2).
Table 2 - Linear regression parameters from changes in fluorescence intensity in skimmed and full fat UHT milk, during storage at temperatures between 10 °C and 50 °C, including temperature cycles.
Milk type Storge temperature
Fluorescence intensity ( ex 360 nm)
k R2 P-value 95% conf.
Skimmed 10 °C 8,52 0,132 0.637 ±66.62
Full fat 10 °C 29,85 0,979 0.100 ±13.14
Skimmed 20 °C 11,73 0,059 0.629 ±58.81
Full fat 20 °C -5,42 0,003 0.903 ±109.45
Skimmed 30 °C 128,16 0,681 0.022 ±100.82
Full fat 30 °C 70,47 0,567 0.050 ±70.77
Skimmed 40 °C 872,09 0,966 0.000 ±109.11
Full fat 40 °C 817,49 0,934 0.000 ±144.39
Skimmed 50 °C 3474,96 0,951 0.000 ±705.10
Full fat 50 °C 2953,95 0,920 0.000 ±779.95
Skimmed Cycle 1 16,38 0,028 0.832 ±292.73
Full fat Cycle 1 63,77 0,333 0.422 ±274.25
Skimmed Cycle 2 301,90 0,982 0.001 ±73.31
Full fat Cycle 2 189,29 0,841 0.028 ±151.18
Skimmed Cycle 3 1413,21 0,973 0.105 ±3010.25
Full fat Cycle 3 1064,75 0,981 0.088 ±1893.13

Page 40 of 85
Storage temperature ( oC)
0 10 20 30 40 50 60
k (
flu
ore
sce
nce
in
ten
sity /
we
ek)
0
1000
2000
3000
4000
Skimmed milk
Full fat milk
1/T (10-3
* K-1
)
0,0030 0,0031 0,0032 0,0033 0,0034 0,0035 0,0036 0,0037
ln k
(k in
s-1
)
1
2
3
4
5
6
7
8
9
Skimmed milk
Full fat milk
Figure 21 is based on the rate constants presented in table 2, plotted as a function of the storage
temperature. The figure indicates that the rate at which fluorescent compounds are formed increases
for every 10 °C. Q10 values calculated from equation 3 were in skimmed milk; 1.3, 10.9, 6.8 and 3.9
for each 10 °C rise in temperature. In full fat milk the following Q10 values were found; 0.2, 13,
11.6, and 3.6. This effect of storage temperature on the rate can also be illustrated with use of the
Arrhenius equation, as depicted in Figure 22. The plot is based on the natural logarithm of the
Arrhenius equation (6) and illustrates a correlation between the rate and the storage temperature
from 20 °C to 50 °C. The rates corresponding to UHT milk stored at 10 °C do not seem to fit into
the Arrhenius plot (furthest to the right in Figure 22). This may indicate that reactions occurring at
20 °C and above are not present at 10 °C. Data from milk stored at 10 °C is therefore not included
in the linear regressions from Figure 22. The linear correlations are supported by R2 values for the
regression lines, which is 0.992 for skimmed milk and 0.986 for full fat milk. From the slope of
such an Arrhenius plot it is possible to calculate the activation energy, but since the fluorescence
intensity reflects several reactions it can be hard to draw conclusions about activation energies.
Figure 21 – Velocity constants (k) from development in fluorescence intensity as a function of storage temperature (10 °C to 50 °C) in skimmed and full fat UHT milk.
Figure 22 - Effect of storage temperature on the rate constants for formation of fluorescent compounds, in skimmed and full fat UHT milk. Linear regressions include data from 20 °C to 50 °C.

Page 41 of 85
Detection of specific intermediate MRP´s was conducted with the use of GC-MS. Due to technical
problems with the GC-MS coupled to dynamic head space (DHS) there was only time for a single
determination using SPME. Hence no standard deviations are included in the following results.
Both methods are sensitive and reproducible, but their specificity for volatiles differs. DHS has
shown to provide a higher quantity and number of different volatile compounds, mainly due to a
larger surface area of the adsorbent trap (Barrious et al., 2013; Jansson, 2014a). Compounds related
to lipid oxidation and the intermediate stage of the MR were analysed in total ion current (TIC)
chromatogram mode. For identification, measured retention times and mass spectral data were
compared with reference spectra in an MS database (NIST MS search 2.0) and following analysed
in selected ion monitoring (SIM) mode. SIM enhances the sensitivity and accuracy of quantitative
results by selection of specific mass-to-charge ratios for identification of particular compounds
(Jansson, 2014a). All concentrations measured with GC-MS are in this study based on peak areas
relative to the internal standard 5-methyl-2-hexanone. Table 3 gives an overview of the volatile
compounds detected in this study including retention times and ions selected for identification and
relative quantification in SIM mode. Volatiles detected in this study are; furfural, 2-furanmethanol,
2-ethylfulan, 2-heptanone, 2-nonanone and 2-undecanone.
Table 3 – Volatile compounds detected by SPME-GC-MS, retention times and ions used in SIM mode.
Volatile compounds Retention time (min) m/z
Furfural 14.1 96/95
2-furanmethanol 18.7 98/81
2-ethylfuran 2.7 81/96
2-heptanone 6.7 58/114
2-nonanone 11.9 58/142
2-undecanone 17 58/170

Page 42 of 85
Storage time (weeks)
0 5 10 15 20 25
Re
lative
in
ten
sity (
AU
)
0,000
0,005
0,010
0,015
0,020
0,025
0,030
40 oC
50 oC
Storage time (weeks)
0 5 10 15 20 25
Re
lative
in
ten
sity (
AU
)
0,0
0,2
0,4
0,6
0,8
1,0
1,2
30 oC
40 oC
50 oC
Figure 23 and 24 shows the formation of the two volatile compounds furfural and 2-furanmethanol.
The development of these products was measured in full fat UHT milk during storage at different
temperatures. Figure 23 depicts the relative concentration of furfural, which can be formed in the 3-
deoxyosone pathway of the MR, favoured by acidic pH. This compound was only detected in milk
stored at 40 °C and 50 °C. In Figure 24 the relative formation of 2-furanmethanol is shown, which
may also be a product from the 3-deoxyosone pathway (Van Boekel, 1998). This compound was
detected in milk stored at 30 °C, 40 °C and 50 °C.
The relative concentrations of furfural and 2-furanmethanol were both increasing significantly with
time and temperature at 40 °C and 50 °C. After storage at 40 °C for 24 weeks the relative
concentration of furfural was 0.017 AU, corresponding to the relative concentration after storage at
50 °C for 6 weeks. The relative concentration of 2-furanmethanol after storage at 40 °C for
24 weeks were 0.755 AU, corresponding to the concentration at 50 °C after 6-7 weeks. Hence an
elevation of the temperature from 40 °C to 50 °C seems to speed up both processes approximately
4 times.
Figure 23 – GC-MS analysis of furfural in full fat UHT milk during storage at 40 and 50 °C.
Figure 24 – GC-MS analysis of 2-furanmethanol in full fat UHT milk during storage at 30, 40 and 50 °C.

Page 43 of 85
Figure 25 – GC-MS analysis of a) 2-ethylfuran b) 2-heptanone c) 2-nonanone and d) 2-undecanone in full fat UHT milk during storage at 10 °C, 20 °C, 30 °C, 40 °C and 50 °C. Linear regression lines are included.
Storage time (weeks)
0 5 10 15 20 25
Rela
tive inte
nsity (
AU
)
0,0
0,2
0,4
0,6
0,8
1,0
10 oC
20 oC
30 oC
40 oC
50 oC
d)
Storage time (weeks)
0 5 10 15 20 25
Re
lative
in
ten
sity (
AU
)
0,0
0,5
1,0
1,5
2,0
2,5
3,0
3,5
4,0
c)
Storage time (weeks)
0 5 10 15 20 25
Re
lative
in
ten
sity (
AU
)
0,000
0,005
0,010
0,015
0,020
0,025
0,030
a)
Storage time (weeks)
0 5 10 15 20 25
Re
lative inte
nsity (
AU
)
0
2
4
6
8
10
10 oC
20 oC
30 oC
40 oC
50 oC
b)
In addition to furfural and 2-furanmethanol four other volatile compounds were looked for with
SPME-GC-MS and analysed in SIM mode. Figure 24 a) reveals the relative formation of 2-
ethylfuran and Figure 24 b), c) and d) reveal the relative formation of three ketones; 2-heptanone, 2-
nonanone and 2-undecanone respectively. These compounds have been analysed in full fat UHT
milk during storage at temperatures between 10 °C and 50 °C. 2-ethylfuran has been found to
originate from specific Strecker degradation products, lipid oxidation and degradation of
carbohydrates (Limacher et al., 2008; Jansson, 2014a), as shown in Figure 10.

Page 44 of 85
After 24 weeks of storage the 2-ethylfuran content was approximately 3.8 times higher in milk
stored at 30 °C than in milk stored at the ambient temperature of 20 °C, and approximately 7.2 times
higher in milk stored at 40 °C than in milk stored at 20 °C. 2-heptanone, 2-nonanone and 2-
undecanone are ketones formed by lipid oxidation or thermal degradation (Jansson, 2014a). 2-
ethylfuran follows a pattern similar to that of the ketones as shown in Figure 25. Formation of these
four volatile compounds seems to correlate linearly with storage time and has been fitted into a
linear model. From table 3 it can be seen that the relative intensities of the compounds were
significantly correlated with the storage time in UHT milk stored between 30 °C and 50 °C
(p<0.05).
The rate constants for 2-heptanone, 2-nonanone and 2-undecanone are negative at 10 °C, reflecting
uncertainties at these low concentrations (table 4). In addition the rate constants increased with
temperature, indicating that these reactions are temperature dependent. This has been further
investigated with use of the Arrhenius equation (6). Figure 26 reveals an Arrhenius plot illustrating
the temperature dependence of the reaction rates from formation of 2-ethylfuran, 2-heptanone, 2-
nonanone and 2-undecanone.
Table 4 - Linear regression parameters of 2-ethylfuran, 2-heptanone, 2-nonanone and 2-undecanone, during storage at 10 °C to 50 °C.
Storge temp.
2-ethylfuran 2-heptanone
k R2 P-value 95% conf.
k R2 P-value 95% conf.
10 °C 2.4*10-6 0.006 0.921 ±9*10-5 -0.0009 0.051 0.772 ±0.011
20 °C 4.4*10-5 0.561 0.052 ±4*10-5 0.0132 0.786 0.007 ±0.007
30 °C 0.0004 0.934 0.0003 ±0.0004 0.071 0.938 0.0003 ±0.020
40 °C 0.0008 0.940 1.8*10-7 ±0.0001 0.213 0.959 2.7*10-8 ±0.030
50 °C 0.002 0.916 4.9*10-5 ±0.0006 0.775 0.921 4*10-5 ±0.202
Storge temp.
2-nonanone 2-undecanone
k R2 P-value 95% conf.
k R2 P-value 95% conf.
10 °C -0.002 0.846 0.080 ±0.003 -0.001 0.836 0.085 ±0.001
20 °C 0.003 0.267 0.234 ±0.005 0.0002 0.016 0.781 ±0.001
30 °C 0.029 0.923 0.0005 ±0.009 0.005 0.869 0.002 ±0.002
40 °C 0.104 0.951 7*10-8 ±0.016 0.023 0.939 2*10-7 ±0.004
50 °C 0.375 0.952 7*10-6 ±0.075 0.086 0.954 6*10-6 ±0.016
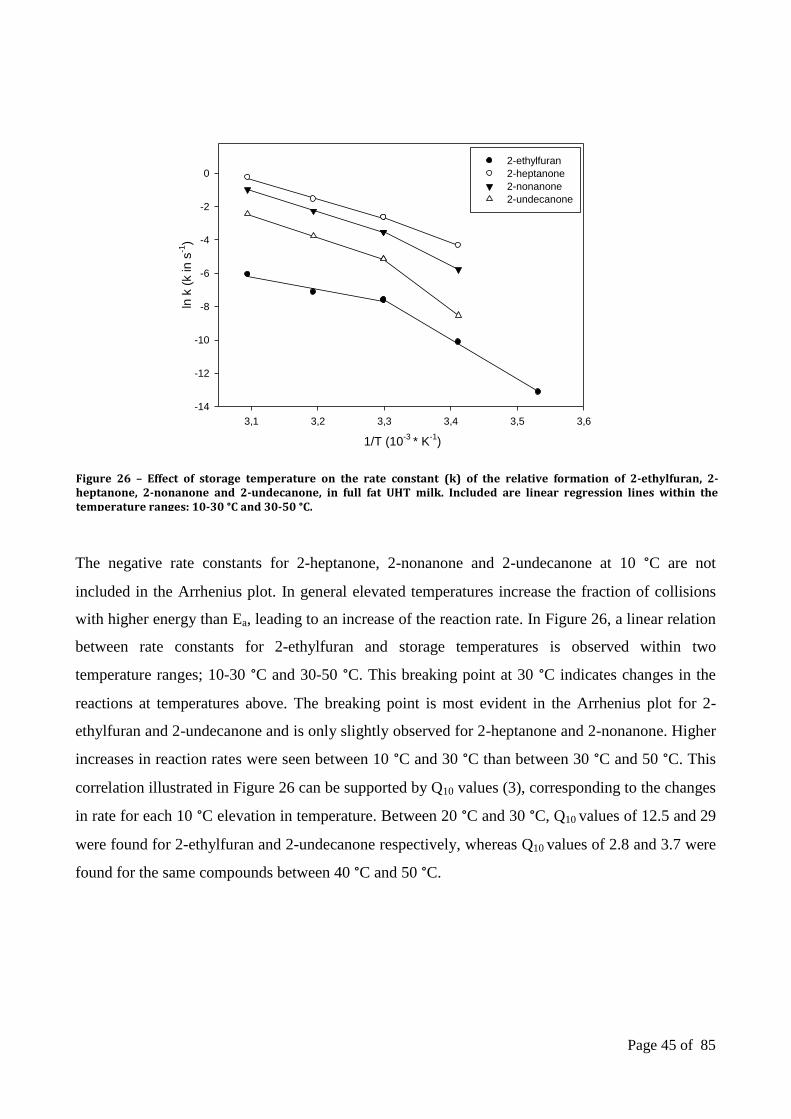
Page 45 of 85
The negative rate constants for 2-heptanone, 2-nonanone and 2-undecanone at 10 °C are not
included in the Arrhenius plot. In general elevated temperatures increase the fraction of collisions
with higher energy than Ea, leading to an increase of the reaction rate. In Figure 26, a linear relation
between rate constants for 2-ethylfuran and storage temperatures is observed within two
temperature ranges; 10-30 °C and 30-50 °C. This breaking point at 30 °C indicates changes in the
reactions at temperatures above. The breaking point is most evident in the Arrhenius plot for 2-
ethylfuran and 2-undecanone and is only slightly observed for 2-heptanone and 2-nonanone. Higher
increases in reaction rates were seen between 10 °C and 30 °C than between 30 °C and 50 °C. This
correlation illustrated in Figure 26 can be supported by Q10 values (3), corresponding to the changes
in rate for each 10 °C elevation in temperature. Between 20 °C and 30 °C, Q10 values of 12.5 and 29
were found for 2-ethylfuran and 2-undecanone respectively, whereas Q10 values of 2.8 and 3.7 were
found for the same compounds between 40 °C and 50 °C.
Figure 26 – Effect of storage temperature on the rate constant (k) of the relative formation of 2-ethylfuran, 2-heptanone, 2-nonanone and 2-undecanone, in full fat UHT milk. Included are linear regression lines within the temperature ranges: 10-30 °C and 30-50 °C.
1/T (10-3
* K-1
)
3,1 3,2 3,3 3,4 3,5 3,6
ln k
(k in
s-1
)
-14
-12
-10
-8
-6
-4
-2
0
2-ethylfuran
2-heptanone
2-nonanone
2-undecanone

Page 46 of 85
Storage time (weeks)
0 5 10 15 20 25
b*
0
2
4
6
8
10
12
14
16
10 oC
20 oC
30 oC
40 oC
50 oC
Cycle 1
Cycle 2
Cycle 3
c)
Storage time (weeks)
0 5 10 15 20 25
L*
0
70
71
72
73
74
75
76
77
78
79
a)
Storage time (weeks)
0 5 10 15 20 25
a*
-5
-4
-3
-2
-1
0
b)
5.1.4 Late Maillard reactions
Late Maillard reaction products were analysed by evaluation of colour changes measured with a
Chroma-Meter. Brown colour development can give an indication of the formation of melanoidins
formed in the MR. These changes were analysed in skimmed and full fat UHT milk during storage
at different temperatures. Figure 27 illustrates the changes in skimmed UHT milk, where each value
reported is a mean of biological and analytical duplicates. Changes in the colour space component
L* are depicted in Figure 27 a) indicating the changes in lightness with time and temperature, b)
depicts changes in a* (negative a* = greenness and positive a* = redness) and c) depicts changes in
b* (negative b* = blueness and positive b* = yellowness). Colour of full fat and skimmed UHT
milk changed with the same pattern over time, but with different offset. The offset in full fat milk of
L*, a* and b* were found to 81, -2.6 and 4.6 respectively.
Figure 27 - Colour changes (L*, a*, b*) (a, b, c) in skimmed UHT milk during storage at temperatures between 10 °C and 50 °C, including temperature cycles. Linear regression lines and error bars are included, indicating standard deviation, n=4.

Page 47 of 85
In skimmed milk the detected offset values were lower for all three colour space components, found
to be 76.6, -4.4 and 2.8 as shown in Figure 27. Changes in L*, a* and b* values were observed to
correlate linearly with the storage time. Linear regression parameters are presented in table 4. This
linear correlation indicates that the formation of brown coloured polymers follows a zero order
reaction kinetic. The zero order rate constants (k) for the development of colour space components
a* and b* were determined on basis of equation 7. Due to the decreasing development of L*, the
following equation has been applied for calculation of k.
𝐶𝑡 = −𝑘𝑡 + 𝐶0 (8)
As shown in table 5, the L* values were significantly decreasing with time in milk stored at 20 °C
to 50 °C, indicating a darkening. At the same time a* and b* values were significantly increasing in
milk stored at 30 °C to 50 °C (p<0.05), resulting in more red and yellow colours. Skimmed UHT
milk stored at 20 °C for 24 weeks revealed a L* value of 75.6, similar to the value detected in milk
stored at 30 °C for 20 weeks and 40 °C for 6 weeks.
Table 5 – Linear regression parameters from L*, a* and b* changes in skimmed and full fat UHT milk at temperatures between 10 °C and 50 °C, including temperature cycles.
Milk type Storge temp.
L* a* b*
k R2 P-
value 95% conf.
k R2 P-
value 95% conf.
k R2 P-
value 95% conf.
Skimmed 10 °C 0.0626 0.707 0.158 ±0.120 -0.009 0.747 0.135 ±0.015 -0.018 0.847 0.079 ±0.023
Full fat 10 °C 0.0159 0.728 0.146 ±0.029 0.002 0.154 0.608 ±0.014 0.0055 0.681 0.174 ±0.011
Skimmed 20 °C 0.0432 0.926 0.0005 ±0.014 0.0003 0.019 0.770 ±0.003 0.0026 0.089 0.537 ±0.010
Full fat 20 °C 0.0130 0.604 0.039 ±0.012 0.0033 0.189 0.513 ±0.012 0.0170 0.406 0.123 ±0.023
Skimmed 30 °C 0.0770 0,921 0.0006 ±0.026 0.0226 0.912 0.0008 ±0.008 0.0802 0.967 0.000 ±0.016
Full fat 30 °C 0.0414 0.991 0.000 ±0.004 0.0330 0.919 0.0006 ±0.011 0.0498 0.872 0.002 ±0.021
Skimmed 40 °C 0.2670 0.979 0.000 ±0.025 0.0918 0.965 0.000 ±0.011 0.4289 0.997 0.000 ±0.016
Full fat 40 °C 0.1458 0.9956 0.000 ±0.006 0.0945 0.977 0.000 ±0.009 0.3037 0.989 0.000 ±0.015
Skimmed 50 °C 0.8230 0.972 0.000
±0.124 0.3461 0.975 0.000 ±0.049 1.4507 0.736 0.000 ±0.126
Full fat 50 °C 0.5360 0.9909 0.000 ±0.046 0.3382 0.982 0.000 ±0.040 1.0783 0.989 0.000 ±0.102
Skimmed Cycle 1 0.0830 0.889 0.061 ±0.093 0.0041 0.111 0.666 ±0.035 0.0156 0.736 0.142 ±0.028
Full fat Cycle 1 0.0189 0.278 0.472 ±0.090 0.0189 0.898 0.666 ±0.035 0.0071 0.373 0.389 ±0.028
Skimmed Cycle 2 0.1720 0.956 0.003 ±0.068 0.0363 0.798 0.040 ±0.033 0.1646 0.987 0.0006 ±0.034
Full fat Cycle 2 0.0948 0.979 0.001 ±0.025 0.0539 0.924 0.009 ±0.028 0.1350 0.987 0.0007 ±0.030
Skimmed Cycle 3 0.4640 0.981 0.087 ±0.811 0.2325 0.996 0.039 ±0.018 0.7593 0.999 0.016 ±0.247
Full fat Cycle 3 0.3890 0.986 0.071 ±0.589 0.2415 0.987 0.071 ±0.346 0.5306 0.981 0.088 ±0.944
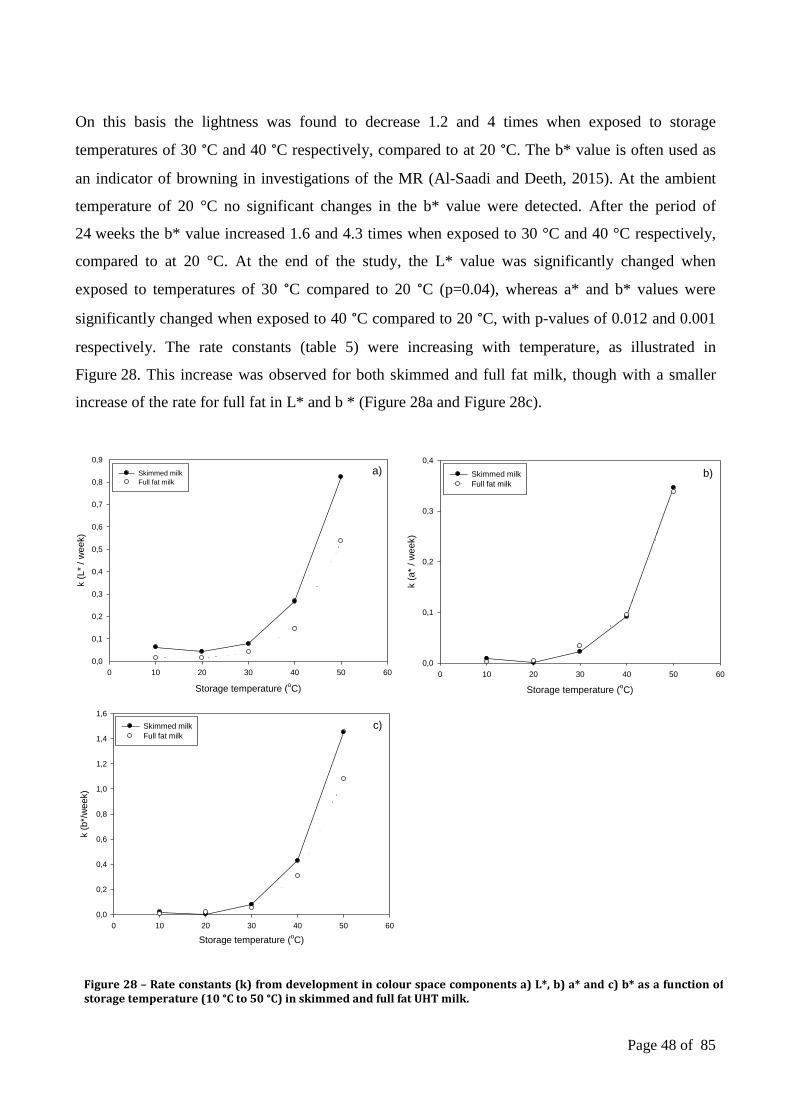
Page 48 of 85
Storage temperature (oC)
0 10 20 30 40 50 60
k (
b*/
week)
0,0
0,2
0,4
0,6
0,8
1,0
1,2
1,4
1,6
Skimmed milk
Full fat milk
c)
Storage temperature (oC)
0 10 20 30 40 50 60
k (
L*
/ w
ee
k)
0,0
0,1
0,2
0,3
0,4
0,5
0,6
0,7
0,8
0,9
Skimmed milk
Full fat milk
a)
Storage temperature (oC)
0 10 20 30 40 50 60
k (
a*
/ w
ee
k)
0,0
0,1
0,2
0,3
0,4
Skimmed milk
Full fat milk
b)
On this basis the lightness was found to decrease 1.2 and 4 times when exposed to storage
temperatures of 30 °C and 40 °C respectively, compared to at 20 °C. The b* value is often used as
an indicator of browning in investigations of the MR (Al-Saadi and Deeth, 2015). At the ambient
temperature of 20 °C no significant changes in the b* value were detected. After the period of
24 weeks the b* value increased 1.6 and 4.3 times when exposed to 30 °C and 40 °C respectively,
compared to at 20 °C. At the end of the study, the L* value was significantly changed when
exposed to temperatures of 30 °C compared to 20 °C (p=0.04), whereas a* and b* values were
significantly changed when exposed to 40 °C compared to 20 °C, with p-values of 0.012 and 0.001
respectively. The rate constants (table 5) were increasing with temperature, as illustrated in
Figure 28. This increase was observed for both skimmed and full fat milk, though with a smaller
increase of the rate for full fat in L* and b * (Figure 28a and Figure 28c).
Figure 28 – Rate constants (k) from development in colour space components a) L*, b) a* and c) b* as a function of storage temperature (10 °C to 50 °C) in skimmed and full fat UHT milk.
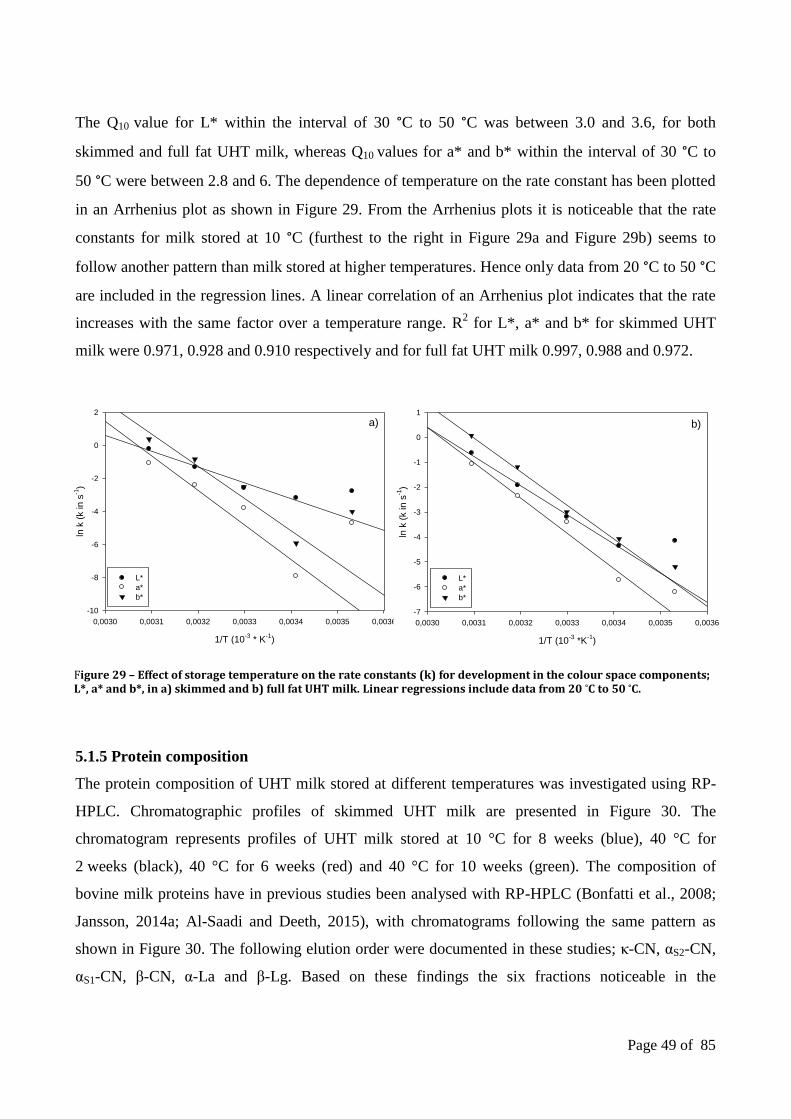
Page 49 of 85
1/T (10-3
* K-1
)
0,0030 0,0031 0,0032 0,0033 0,0034 0,0035 0,0036
ln k
(k in
s-1
)
-10
-8
-6
-4
-2
0
2
L*
a*
b*
a)
1/T (10-3
*K-1
)
0,0030 0,0031 0,0032 0,0033 0,0034 0,0035 0,0036
ln k
(k in
s-1
)
-7
-6
-5
-4
-3
-2
-1
0
1
L*
a*
b*
b)
The Q10 value for L* within the interval of 30 °C to 50 °C was between 3.0 and 3.6, for both
skimmed and full fat UHT milk, whereas Q10 values for a* and b* within the interval of 30 °C to
50 °C were between 2.8 and 6. The dependence of temperature on the rate constant has been plotted
in an Arrhenius plot as shown in Figure 29. From the Arrhenius plots it is noticeable that the rate
constants for milk stored at 10 °C (furthest to the right in Figure 29a and Figure 29b) seems to
follow another pattern than milk stored at higher temperatures. Hence only data from 20 °C to 50 °C
are included in the regression lines. A linear correlation of an Arrhenius plot indicates that the rate
increases with the same factor over a temperature range. R2 for L*, a* and b* for skimmed UHT
milk were 0.971, 0.928 and 0.910 respectively and for full fat UHT milk 0.997, 0.988 and 0.972.
5.1.5 Protein composition
The protein composition of UHT milk stored at different temperatures was investigated using RP-
HPLC. Chromatographic profiles of skimmed UHT milk are presented in Figure 30. The
chromatogram represents profiles of UHT milk stored at 10 °C for 8 weeks (blue), 40 °C for
2 weeks (black), 40 °C for 6 weeks (red) and 40 °C for 10 weeks (green). The composition of
bovine milk proteins have in previous studies been analysed with RP-HPLC (Bonfatti et al., 2008;
Jansson, 2014a; Al-Saadi and Deeth, 2015), with chromatograms following the same pattern as
shown in Figure 30. The following elution order were documented in these studies; κ-CN, αS2-CN,
αS1-CN, β-CN, α-La and β-Lg. Based on these findings the six fractions noticeable in the
Figure 29 – Effect of storage temperature on the rate constants (k) for development in the colour space components; L*, a* and b*, in a) skimmed and b) full fat UHT milk. Linear regressions include data from 20 °C to 50 °C.

Page 50 of 85
chromatogram of milk stored at 10 °C for 8 weeks were identified. Only small differences were
observed between the chromatograms corresponding to milk stored at 10 °C for 8 weeks (blue) and
40 °C for 2 weeks (black). More evident changes of the chromatograms were observed in milk
stored at 40 °C for 6 weeks (red) and 40 °C for 10 weeks (green). These changes were seen as
broader peaks and in some cases overlapping. It was considered to analyze protein lactosylations on
basis of mass spectral data, which can be determined by a mass shift of +324 Da. The high degree
of modifications made this approach difficult due the overlapping peaks. Therefore it was decided
not to do further analyses on protein composition. From the chromatographic profiles presented in
Figure 30 it is shown that particularly the fractions of κ-CN and αS1-CN are modified with time and
temperature. These findings from analysis of protein composition indicate extensive changes in the
proteins during storage of UHT milk at elevated storage temperatures.
Figure 30 – Protein composition in selected milk samples (Blue: 10 °C week 8, black: 40 °C week 2, red: 40 °C week 6, green: 40 °C week 10).
5.2 Physical changes
To investigate acceleration of physical destabilization processes in full fat and skimmed UHT milk,
different analytical techniques have been applied. Creaming of fat and sedimentation of proteins
have been the major focus in this part of the study and will be evaluated with use of optical stability
analyzers, particle size measurement and evaluation of protein and fat content in three fractions;
top, middle and bottom.

Page 51 of 85
5.2.1 Physical destabilization
Optical centrifugation was applied for the investigation of creaming of fat and sedimentation of
proteinaceous material. The optical stability analyzer, Lumifuge, accelerates physical
destabilization by centrifugal forces and measures transmission of light in the full length of the
sample cell (Ng et al., 2013). The transmission profiles correspond to the measured transmission
in % as a function of the local position on the centrifuge tube in mm. From the transmission profiles
an instability index has been calculated based on equation 9. This index is within the range 0 to 1,
depending on the instability of the dispersion.
Figure 31 reveals the instability index based on transmission measured in a) skimmed and b) full fat
UHT milk during storage at the temperatures; 10 °C, 20 °C, 30 °C, 40 °C and 50 °C including the
three temperature cycles. Data are based on mean values from biological and analytical duplicates.
Figure 31a illustrates instability of skimmed milk over time reflecting sedimentation, and Figure
31b illustrates instability of full fat milk over time reflecting creaming. Differences of instability
index over time are statistically significant (p<0.05) for all skimmed milk and full fat milk, except
from cycle 1 for full fat (p=0.27). The instability of skimmed milk seems mainly to increase within
the first 10 weeks of storage. An instability index of 0.57 was observed in skimmed UHT milk
stored at 20 °C for 24 weeks, corresponding to instabilities at 30 °C for 8 weeks and 40 °C for 2
weeks approximately.
Storage time (weeks)
0 5 10 15 20 25
Insta
bili
ty in
de
x
0,00
0,50
0,52
0,54
0,56
0,58
0,60
0,62
a)
Storage time (weeks)
0 5 10 15 20 25
Insta
bili
ty ind
ex
0,00
0,03
0,04
0,05
0,06
10 oC
20 oC
30 oC
40 oC
50 oC
Cycle 1
Cycle 2
Cycle 3
b)
Figure 31 – Instability index in a) skimmed UHT milk and b) full fat UHT milk during storage at temperatures between 10 °C and 50 °C, including temperature cycles. Error bars indicate standard deviation, n=4.
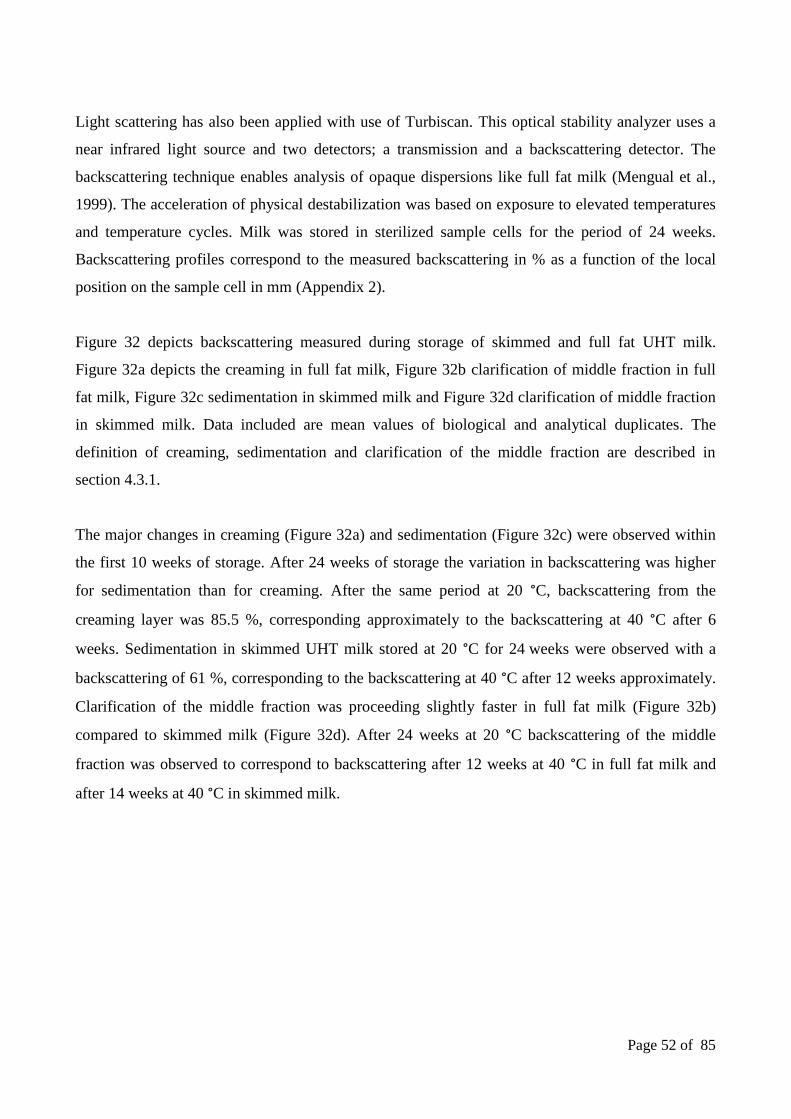
Page 52 of 85
Light scattering has also been applied with use of Turbiscan. This optical stability analyzer uses a
near infrared light source and two detectors; a transmission and a backscattering detector. The
backscattering technique enables analysis of opaque dispersions like full fat milk (Mengual et al.,
1999). The acceleration of physical destabilization was based on exposure to elevated temperatures
and temperature cycles. Milk was stored in sterilized sample cells for the period of 24 weeks.
Backscattering profiles correspond to the measured backscattering in % as a function of the local
position on the sample cell in mm (Appendix 2).
Figure 32 depicts backscattering measured during storage of skimmed and full fat UHT milk.
Figure 32a depicts the creaming in full fat milk, Figure 32b clarification of middle fraction in full
fat milk, Figure 32c sedimentation in skimmed milk and Figure 32d clarification of middle fraction
in skimmed milk. Data included are mean values of biological and analytical duplicates. The
definition of creaming, sedimentation and clarification of the middle fraction are described in
section 4.3.1.
The major changes in creaming (Figure 32a) and sedimentation (Figure 32c) were observed within
the first 10 weeks of storage. After 24 weeks of storage the variation in backscattering was higher
for sedimentation than for creaming. After the same period at 20 °C, backscattering from the
creaming layer was 85.5 %, corresponding approximately to the backscattering at 40 °C after 6
weeks. Sedimentation in skimmed UHT milk stored at 20 °C for 24 weeks were observed with a
backscattering of 61 %, corresponding to the backscattering at 40 °C after 12 weeks approximately.
Clarification of the middle fraction was proceeding slightly faster in full fat milk (Figure 32b)
compared to skimmed milk (Figure 32d). After 24 weeks at 20 °C backscattering of the middle
fraction was observed to correspond to backscattering after 12 weeks at 40 °C in full fat milk and
after 14 weeks at 40 °C in skimmed milk.
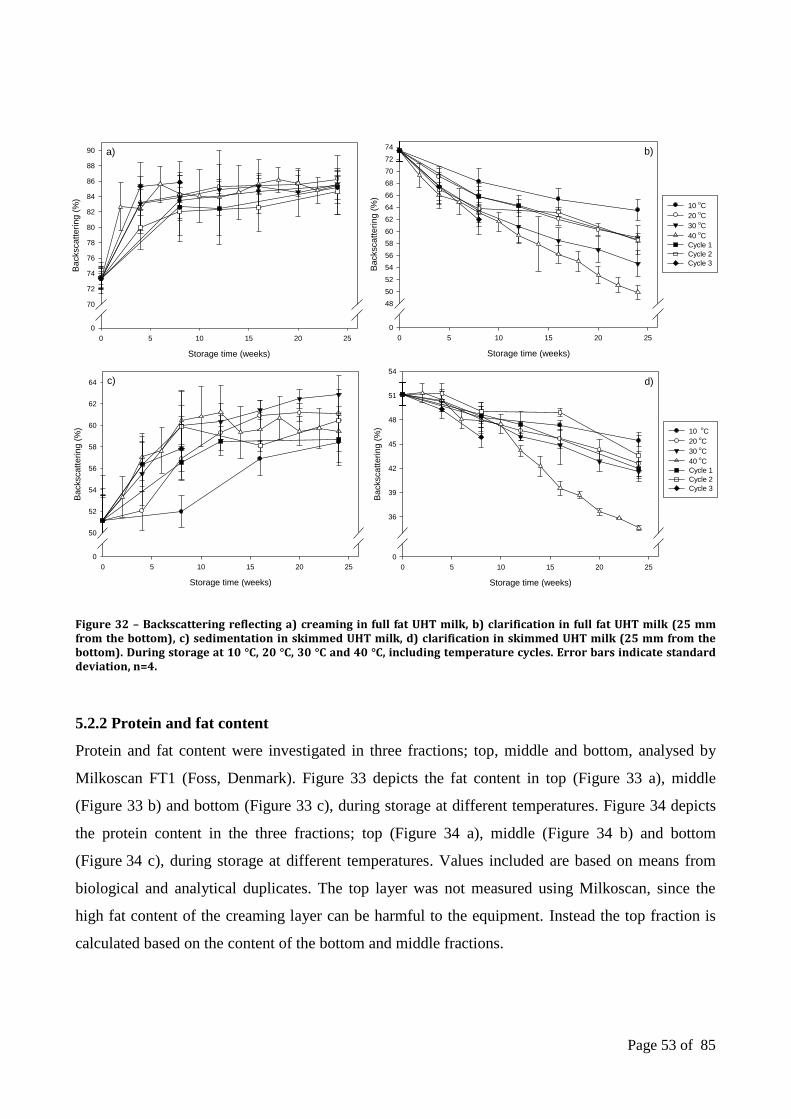
Page 53 of 85
Storage time (weeks)
0 5 10 15 20 25
Backscatt
ering (
%)
0
36
39
42
45
48
51
54
10 oC
20 oC
30 oC
40 oC
Cycle 1
Cycle 2
Cycle 3
d)
Storage time (weeks)
0 5 10 15 20 25
Ba
cksca
tte
rin
g (
%)
0
50
52
54
56
58
60
62
64 c)
Storage time (weeks)
0 5 10 15 20 25
Ba
cksca
tte
rin
g (
%)
0
70
72
74
76
78
80
82
84
86
88
90 a)
Storage time (weeks)
0 5 10 15 20 25
Ba
cksca
tte
rin
g (
%)
0
48
50
52
54
56
58
60
62
64
66
68
70
72
74
10 oC
20 oC
30 oC
40 oC
Cycle 1
Cycle 2
Cycle 3
b)
Figure 32 – Backscattering reflecting a) creaming in full fat UHT milk, b) clarification in full fat UHT milk (25 mm from the bottom), c) sedimentation in skimmed UHT milk, d) clarification in skimmed UHT milk (25 mm from the bottom). During storage at 10 °C, 20 °C, 30 °C and 40 °C, including temperature cycles. Error bars indicate standard deviation, n=4.
5.2.2 Protein and fat content
Protein and fat content were investigated in three fractions; top, middle and bottom, analysed by
Milkoscan FT1 (Foss, Denmark). Figure 33 depicts the fat content in top (Figure 33 a), middle
(Figure 33 b) and bottom (Figure 33 c), during storage at different temperatures. Figure 34 depicts
the protein content in the three fractions; top (Figure 34 a), middle (Figure 34 b) and bottom
(Figure 34 c), during storage at different temperatures. Values included are based on means from
biological and analytical duplicates. The top layer was not measured using Milkoscan, since the
high fat content of the creaming layer can be harmful to the equipment. Instead the top fraction is
calculated based on the content of the bottom and middle fractions.

Page 54 of 85
Storage time (weeks)
0 2 4 6 8 10 12 14 16 18 20 22 24 26
%
0
1
2
3
4
5
6
7
8
%
0
1
2
3
4
5
6
7
8
a)
%
0
1
2
3
4
5
6
7
8
b)
c)
a)
%
0,0
2,6
2,8
3,0
3,2
3,4
3,6
3,8
b)
%
0,0
2,6
2,8
3,0
3,2
3,4
3,6
3,8
c)
Storage time (weeks)
0 2 4 6 8 10 12 14 16 18 20 22 24 26
%
0,0
2,6
2,8
3,0
3,2
3,4
3,6
3,8
10 oC
20 oC
30 oC
40 oC
50 oC
Cycle 1
Cycle 2
Cycle 3
All changes in fat content over the time period were significant (p<0.05), whereas only the protein
content at 40 °C in top and bottom were significantly changing over time. Creaming of fat in the top
fraction was observed to proceed approximately twice as fast when stored at 40 °C compared to at
20 °C (Figure 33a). Similarly, the sedimentation process of proteins was proceeding approximately
twice as fast when stored at 40 °C compared to at 20 °C (Figure 34c). Temperature cycle 1,
Figure 33 – Fat content (%) in full fat UHT milk during storage at temperatures between 10 °C and 50 °C, including temperature cycles, in a) top, b) middle and c) bottom fractions. Error bars indicate standard deviation, n=4.
Figure 34 – Protein content (%) in full fat UHT milk during storage at temperatures between 10 °C and 50 °C, including temperature cycles, in a) top, b) middle and c) bottom fractions. Error bars indicate standard deviation, n=4.

Page 55 of 85
Storage time (weeks)
0 5 10 15 20 25
Dv (
10
)
0,42
0,43
0,44
0,45
0,46
0,47
0,48
a)
Storage time (weeks)
0 5 10 15 20 25
Dv (
50)
0,60
0,62
0,64
0,66
0,68
0,70
b)
Storage time (weeks)
0 5 10 15 20 25
Dv (
90
)
0,90
0,95
1,00
1,05
1,10
1,15
c)
fluctuating between 10 °C and 30 °C, was found to follow the same pattern as 20 °C for both fat and
protein distribution. The same was observed for cycle 2 following the same pattern as at 30 °C and
cycle 3 following the same pattern as at 40 °C.
5.2.3 Fat globule size distribution
The fat globule size distribution was analysed with use of static light scattering. Both skimmed and
full fat UHT milk were analysed during storage at different temperatures. The samples were
dissolved in a buffer consisting of urea and citrate, to avoid protein attached to the globules.
Figure 35 depicts the fat globule size distribution of Dv10 (Figure 35a), Dv50 (Figure 35b) and
Dv90 (Figure 35c). Included in these plots are UHT milk samples from all storage temperatures.
Only slight changes with time and temperature were observed, but all changes were insignificant
(p>0.05). To illustrate this insignificance; p-values of 0.946 and 0.999 were observed for Dv50 in
full fat and skimmed milk respectively, stored at 50 °C.
Figure 35 – Fat globule size distribution of a) Dv10, b) Dv50 and c) Dv90 over the storage period. Included are full fat UHT milk samples from storage at all temperatures; 10 °C, 20 °C, 30 °C, 40 °C and 50 °C, including temperature cycle 1, 2 and 3. Straight line indicates the average and dotted lines indicate standard deviation for all data.

Page 56 of 85
5.3 Principal component analysis
Multivariate data analysis in the form of principal component analysis (PCA) was applied to
provide a holistic characterization of all data obtained. Included in Figure 36 are all quantified
parameters from the chemical analyses as well as parameters of protein and fat distribution and
instability index. The loading scatter plot illustrates grouping of the data analysed. The upper left
part characterized by increasing chemical parameters, the bottom left part characterized by
increasing physical parameters, the bottom right part characterized by decreasing chemical
parameters and the upper right part characterized by decreasing physical parameters. These finding
indicate that even though the same overall pattern is documented for chemical and physical
parameters, they do not seem to be markedly correlated. In addition instability index and protein
content in middle fraction do not seem to correlate with findings from other analyses.
Figure 36 – Loading scatter plot from PCA, including all parameters from chemical analyses as well as parameters of protein and fat distribution and instability index. Bottom pr = protein content in bottom fraction, Bottom fa = fat content in bottom fraction, Middle pr = protein content in middle fraction, Middle fa = fat content in middle fraction, Top prote = protein content in top fraction, Top fat = fat content in top fraction, instability = instability index.

Page 57 of 85
6. Discussion
In this study, commercial skimmed and full fat UHT milk were exposed to five different storage
temperatures and three temperature cycles, to investigate chemical and physical changes over time.
This included analysis of the three phases of the Maillard reaction as well as the lipid oxidation. An
evaluation of physical destabilization was conducted with focus on the gravitational separation, in
form of creaming and sedimentation. Additionally, a peptide analysis was included to investigate
enzyme activity, which may affect chemical and physical changes. Finally, kinetic parameters and
trends of formation were obtained for discussion and prediction of shelf life, with the aim of
establishing a valid setup to accelerate shelf life development.
6.1 Chemical changes
A peptide analysis of pH 4.6 soluble peptides has been conducted, since peptides formed from
enzymatic hydrolysis will increase the amount of free amino groups in the milk. This will enhance
the MR, and contribute to physical destabilization mainly in the form of gelation. The peptide
analysis based on HPLC, resulted in total peak areas of 0.57 *105 (AU) at weeks 0 and 0.94 *10
5 at
week 24 for skimmed UHT milk stored at 30 °C. The increases in total peak area seemed mainly to
be caused by modifications of peptides formed prior to heat treatment. No noticeable increases were
observed in fractions eluted between approximately 10 and 20 min. These fractions have previously
been identified to small peptides formed in presence of hydrolytic enzymes (Rauh, 2014a). The
observations illustrate that no remarkable enzyme activity is present in the indirect UHT milk
applied. Hence enzyme activity is not expected to influence the following results. These findings
are consistent with previous studies comparing direct and indirect UHT milk (Datta et al., 2002).
Commonly a higher enzyme activity is found in direct UHT milk, due to the reduced heat load
applied for processing of direct UHT milk compared to indirect UHT milk (Lewis and Deeth, 2008;
Datta et al., 2002).
The initial stage of the MR is of major importance to nutritional quality, since lactosylation of
proteins result in less available lysine for metabolic processes. On this background the Amadori
product is often used as indicator for the reduction of nutritional value, and is of importance in an
accelerated shelf life study (Metha and Deeth, 2015). Direct quantification of the Amadori products
is possible with LC-MS after enzymatic hydrolysis of the lactosylated proteins. This is, however, a
difficult and time-consuming analysis (Henle et al., 1991). An alternative approach is an indirect

Page 58 of 85
quantification of the Amadori product. Two commonly applied methods for this indirect
quantification is to measure furosine or hydroxymethylfurfural (HMF). Formation of HMF is
induced by boiling in oxalic acid, while furosine formation is induced by acid hydrolysis. Both
methods have the disadvantage that the conversion from Amadori product is incomplete (Van
Boekel, 2001). Approximately 30-40 % of the Amadori product is converted into furosine and only
10 % is converted into HMF (Van Boekel, 1998). In contrast to furosine, HMF is naturally formed
in the MR, which can be a challenge since the difference between free HMF (formed in the MR)
and total HMF (formed by oxalic acid) is minor (Van Boekel, 1998).
Based on these considerations, the initial MRP was indirectly measured by a quantification of
furosine using RP-HPLC-DAD. The HPLC chromatogram depicted on Figure 16 shows that other
compounds elute in the same time range as furosine. These compounds are probably also
derivatives from the Amadori product, but since furosine has shown to provide a good estimation of
the early stage of the MR in previous studies, furosine was chosen for the present study (Guerra-
Hernandez et al., 2002). The analysis of furosine illustrated that formation of the initial MRP is
highly temperature dependent. During 24 weeks of storage, the formation was significantly
increasing in both skimmed and full fat UHT milk stored at 20 °C and above. This demonstrates a
continuous formation of lactulosyllysine. In samples stored between 10 °C and 30 °C the furosine
formation seemed to follow a linear trend, but in samples stored between 40 °C and 50 °C the
formation of furosine became non-linear, and was more likely to fit into a first order reaction. On
basis of this, all samples have been fitted into a first order reaction kinetic, common for product
formation (5). This pattern can possibly be due to substrate depletion or because the initial MRP is
used in the intermediate MR´s, with formation of volatile products like Strecker aldehydes. The
latter is most likely to be the reason, since the amino groups are partly recycled in the intermediate
stage of the MR. In addition, previous studies have documented that lactose in milk is not a limiting
factor to the MR (Jansson, 2014a). A similar formation of furosine, with storage time and
temperature, has been observed by Nangpal and Reuters (1990). In this study full fat direct UHT
milk was exposed to 20 °C, 30 °C and 50 °C over a period of 19 weeks. During storage, milk stored
at 20 °C and 30 °C followed a linear trend, whereas at 50 °C the curve leveled off. A decline of
furosine after overheating or during prolonged storage has also been described in literature (Metha
and Deeth, 2016).
Page 59 of 85
The effect of storage temperature on the reaction rate of furosine has been evaluated with use of the
Arrhenius equation. From this plot a linear correlation was observed between changes in rate
constants and storage temperature. This correlation fitted into linear regressions with R2 of 0.993
and 0.989, for skimmed and full fat milk respectively. A linear correlation indicates a constant
increase in reaction rate with temperature. This was supported by the Q10 values, which were in the
range of 1.5 and 2.3. The temperature dependence of the reaction rate is consistent with previous
studies, which have documented Q10 values of approximately 2 (Labuza et al., 1994). The activation
energies based on the Arrhenius plot were found to be 51 kJ/mol and 46.7 kJ/mol for skimmed and
full fat milk respectively. Activaltion enegies of furosine formation in UHT milk are not well
documented in literature. After 24 weeks, the formation of furosine was observed to be accelerated
3 and 8 times when exposed to 30 °C and 40 °C respectively, compared to at ambient temperatures
(20 °C). This indicates that it is possible to accelerate initial MR´s, and predict shelf life based on
furosine concentrations.
In the intermediate stage of the MR several reactive AGE products are formed, of which most are
able to absorb and emit light (Lakowicz, 1999). In this study, an unspecific detection of
intermediate and late MRP´s has been conducted by measurement of fluorescence changes. A
significant increase in fluorescence intensities over the storage period was observed in samples
stored between 30 °C and 50 °C (p<0.05), meaning that no significant changes were observed at
ambient temperatures. Thus, it can be considered whether these compounds contribute to limitations
of shelf life at ambient temperatures after 6-9 months, which is the reported shelf life of commercial
UHT products. And hence, if they are appropriate to accelerate in a shelf life study.
The formation of fluorescent compounds seemed overall to follow a linear correlation with time,
reflecting that this relation can be described by a zero order reaction kinetic. However a short lag
phase was observed in milk stored at 50 °C and cycle 3 during the first weeks of storage. This
indicates that the formation of these compounds is probably more complex. The insignificant
changes at 10 °C and 20 °C, and the lag phase at higher temperatures may indicate that a formation
of precursors is required before fluorescent compounds can be formed. This tendency fits well into
the pattern observed for the formation of furosine. Furosine increased according to a first order
reaction kinetic, with a steep linear increase followed by a flattening when exposed to higher
storage temperatures. This pattern illustrates a conversion of lactulosyllysine into intermediate

Page 60 of 85
MRP´s. Similar trends have previously been observed, supporting this theory (Birolouez-Aragon et
al. 1998).
The rate constants depicted in table 2 indicates a high temperature dependency of these intermediate
MR´s. This temperature dependence has been evaluated with an Arrhenius plot illustrating a
correlation between the rate and the storage temperature from 20 °C to 50 °C. At 10 °C it seems that
the rate is almost constant, whereas increasing from 20 °C to 50 °C. This observation could possibly
be due to other reactions proceeding at 10 °C and below. If this is the case, these reactions are using
the fluorescent compounds as substrate or are inhibiting their formation. It is important to note that
the Arrhenius plot includes several elementary reactions, with individual activation energies and
temperature sensitivities. Therefore a more likely explanation to this observation may be that some
of the reactions included at 20 °C and above, require energies above what is available at 10 °C.
Hence these reactions are very slow or absent at 10 °C. Under these cooled conditions it may also
be possible that the concentration of the Amadori product is too low for the intermediate stage to
proceed. The Q10 values calculated between 10 °C and 20 °C were 1.3, whereas values from 20 °C
to 50 °C were 10.9, 6.8 and 3.9 for each 10 °C rise. Based on this, data from milk stored at 10 °C is
not included in the linear regressions from the Arrhenius plot, with R2 of 0.992 for skimmed milk
and 0.986 for full fat milk. Hence the Q10 values vary between 3.9 and 10.9, which is more than
what is previously reported for intermediate MRP´s varying from 4 to 6 approximately (Labuza et
al. 1994). From the slope of an Arrhenius plot it is possible to calculate the activation energy of a
reaction. Activation energies give information about the temperature sensitivity, but in this case the
Arrhenius plot represents various reactions with different temperature sensitivities. Thus, it can be
hard to draw conclusions about activation energies in this case. It is also important to note that the
fluorescent compounds detected can possibly also originate from other reactions e.g. sugar
fragmentations (Morales and Jiménez-Pérez, 1999). Since the detection of fluorescent MRP´s is
unspecific, it does not give information about the composition of compounds included. The
composition of fluorescent compounds may differ between milk types and reflect different sensory
thresholds and different off-flavors, such as cooked, heated or stale flavors. This may be a problem
in order to predict shelf life of newly developed products, with other sensory threshold and hence
other upper limits of the markers. This method has been considered less sensitive for a global
approach compared to detection of specific compounds (Birlouez-Aragon et al., 2001). In this study
specific intermediate MRP´s have been relatively quantified with use of SPME-GC-MS.

Page 61 of 85
Flavour and aroma changes are major contributors to product deterioration, and hence to limitations
of consumer acceptance. In order to predict shelf life with respect to sensory quality, it is hence
important to select markers with a low sensory threshold. Several studies have investigated specific
volatile components responsible for flavor changes in milk, using GC-MS coupled to different
extraction techniques (Contarini and Polovo, 2002; Vazquez-Landaverde et al., 2005; Marsili,
1999). Two of the most commonly applied extraction techniques for this approach are DHS and
SPME, which particularly have been compared by Contarini and Polovo (2002), Marsili (1999) and
Elmore et al. (1994). Both techniques are non-solvent extraction techniques analyzing the
headspace composition. It seems that both methods are sensitive and reproducible, but their
specificity for volatiles differs. Marsili (1999) investigated volatile lipid oxidation products, and
found that the SPME extraction detected the compounds with higher precision than DHS. In this
study lower variation between replicates and higher linearity of calibration curves were found. In
addition SPME is a rapid and less expensive technique compared to DHS. In another comparative
study Elmore et al. (1997) documented a higher sensitivity of DHS, especially for trace analysis.
This extraction technique provided a higher quantity and number of different volatile compounds
detected by DHS-GC-MS, mainly due to a larger surface area of the adsorbent trap (Barrious et al.,
2013; Jansson, 2014a). Moreover, no equilibrium is required with DHS sampling instead a
continuous flow of carrier gas is purged through and above the sample. This can possibly enhance
the efficiency of the extraction. With SPME two equilibriums are reached; first an equilibrium
between the sample and the head space, and secondly an equilibrium between the head space and
the contact fibre (Barrious et al., 2013). Due to the lower specificity of SPME when used for trace
analysis it can be necessary to quantify in SIM mode.
On basis of the previous studies comparing SPME and DHS, it was considered preferable to use
DHS for detection of intermediate MRP´s, but due to technical problems this was not possible.
Instead a single determination using SPME-GC-MS was applied. Markers for MR and lipid
oxidation were chosen. These were; furfural, 2-furanmethanol, 2-ethylfuran, 2-heptanone, 2-
nonanoneand 2-undecanone. The formation of furfural can proceed in two possible ways. Furfural
can originate from the intermediate stage of the MR, through the pH dependent breakdown of the
Amadori product. This includes an enolization reaction under acidic conditions, followed by a
dehydrogenation of 3-deoxyosone. Secondly furfural can be formed from lactose isomerization by
the so called Lobry de Bruyn-van Ekenstein transformation (LA-transformation) followed by

Page 62 of 85
degradations (Ferrer et al., 2002). 2-furanmethanol, also referred to as furfurylalcohol, is only
slightly investigated in previous studies. This compound can, like furfural, be a product from the 3-
deoxyosone pathway or from sugar degradation (Van Boekel, 1998). 2-furanmethanol consists of a
furan with a hydroxymethyl group attached, which is hence the reduced form of furfural, consisting
of a furan with an aldehyde group. Furfural has previously shown to be a precursor for other furan
derivatives (Jansson et al., 2014c). Hence it is possible that 2-furanmethanol is formed from furfural
or maybe more likely that furfural is formed from 2-furanmethanol by an oxidation. The formation
of 2-furanmethanol was observed to go through a lag phase during the first weeks of storage,
followed by a steep increase (Figure 24). The low initial rate may indicate that a formation of
precursors is needed before 2-furanmethanol can be formed. This pattern of formation is typical for
an intermediate product, which supports the theory of a formation by the MR. On the other hand,
the formation of furfural and 2-furanmethanol is not likely to be derived from the 3-deoxyosone
pathway, since this reaction proceeds under acidic conditions. In the beginning of the study the
UHT milk had a pH of 6.7, which decreased only slightly during storage. Moreover, the 3-
deoxyosone pathway has been found only to proceed in presence of pentose sugars (Van Boekel,
2006). Since the major carbohydrate in milk is the hexose sugar lactose, it is not likely that the
furfural and 2-furanmethanol detected in milk originates from the MR. In respect to the
predominant carbohydrate of milk; lactose degradation seems to be the most likely reason to the
observed formation of these compounds. In the present study furfural was only detected in milk
stored at 40 °C and 50 °C, and 2-furanmethanol in milk stored at 30 °C, 40 °C and 50 °C. The
absence of these compounds at storage temperatures below 30 °C may again indicate a formation
through sugar degradations, which proceeds at higher temperatures than the MR. The relative
concentrations of the two compounds were increasing significantly with time and temperature at
40 °C and 50 °C. For both compounds an elevation of the storage temperature from 40 °C to 50 °C
seemed to speed up the processes approximately 4 times. Another furfural compound often used as
marker is hydroxymethylfurfural (HMF). This compound is also formed in the 3-deoxyosone
pathway, but in presence of hexose sugars. It is therefore observed naturally in milk (Van Boekel,
1998), though this compound was not detected in the present study. A possible explanation is that
HMF is too polar to be extracted by the SPME fibre.
In addition to furfural and 2-furanmethanol, the furan compound 2-ethylfuran was detected by GC-
MS. 2-ethylfuran consists of a furan with an ethyl group attached and can possibly be formed in

Page 63 of 85
three ways (Vranová and Ciesarová, 2009; Jansson et al., 2014c). 2-ethylfuran has been found to
originate from the Strecker degradation products acetaldehyde (from alanine) and lactaldehyde
(from threonine). Secondly it can be formed from degradation of carbohydrates and finally from
lipid oxidation (Limacher et al., 2008; Jansson, 2014a; Vranová and Ciesarová, 2009). The latter
way of formation is in literature mainly documented for the parent furan (Vranová and Ciesarová,
2009). The relative intensities of 2-ethylfuran were significantly correlated with the storage time
(p<0.05) in UHT milk stored between 30 °C and 50 °C. After 24 weeks of storage the 2-ethylfuran
content was approximately 3.8 times higher in milk stored at 30 °C than in milk stored at the
ambient temperature of 20 °C, and approximately 7.2 times higher in milk stored at 40 °C than in
milk stored at 20 °C. Jansson et al. (2014c) has investigated the formation of 2-ethylfuran in
conventional and lactose-hydrolysed UHT milk. In this study a significantly higher formation was
observed in conventional compared to lactose hydrolysed milk, indicating that the formation of 2-
ethylfuran is favored in presence of lactose and not glucose and galactose. For most MRP´s the
opposite trend is observed, which can be an explanation for the high concentration of this
compound in the present study. In milk it would have been expected mainly to detect MRP´s from
the 2,3-enolisation pathway, which is favored at neutral pH (Nursten, 2005; Martins et al., 2001).
The absence of these products is considered to be explained by the SPME extraction of the GC-MS
system.
The three following methyl ketones were chosen as markers for lipid oxidation; 2-heptanone, 2-
nonanone and 2-undecanone. Ketones are mainly formed in a heat-induced decarboxylation of β-
oxidized saturated fatty acids, primarily by thermal degradation. Therefore the formation of these
compounds is highly temperature dependent (Jansson et al., 2014c; Vazquez-Landaverde et al.,
2005). The relative formation of these ketones was significantly increasing with storage time when
exposed to storage temperatures of 30 °C and above (p<0.05), as shown in table 3. They were
observed to follow the same pattern as 2-ethylfuran, consistent with findings by Jansson (2014a).
The relative formation was linearly correlated with storage time and all with R2 values above 0.86.
The rate constants observed were in addition increasing with the storage temperatures. This
temperature dependence has previously been documented by Contarini and Povolo (2002) and
Vazquez-Landaverde et al. (2005). They both observed that the amount of these compounds
correlated with the severity of the heat treatment. These three ketones were the most abundant
secondary oxidation products found in the present study. This was also in agreement with the study

Page 64 of 85
of Vazquez-Landaverde et al. (2005) who observed that 2-heptanone and 2-nonanone were the most
abundant ketones, and concluded that these were major contributors to the flavour changes in heat
treated milk. The temperature dependence has further been investigated with use of the Arrhenius
equation. From the Arrhenius plot (Figure 26) a linear relation between rate constants for 2-
ethylfuran and storage temperatures was observed within two temperature ranges; 10-30 °C and 30-
50 °C. The same tendency was observed for the lipid oxidation products. At storage temperatures
between 10 °C and 30 °C the reaction rates increased more with temperature than between 30 °C
and 50 °C. These findings were supported by Q10 values corresponding to the changes in rate for
each 10 °C. Between 20 °C and 30 °C, Q10 values of 12.5 and 29 were found for 2-ethylfuran and 2-
undecanone respectively, whereas Q10 values of 2.8 and 3.7 were found for the same compounds
between 40 °C and 50 °C. This results in a breaking point at 30 °C, indicating that something affects
the formation of these ketones at higher temperatures. A possible explanation could be that the
ketones are used in other reactions such as the MR, when exposed to temperatures above 30 °C. The
most evident breaking points were observed for 2-ethylfuran and 2-undecanone, which may indicate
that these are more likely to react with non-lipid compounds, possibly in the MR. Secondary
oxidation products, like aldehydes and ketones, can be included in the MR due to their reactive
carbonyl groups (Zamora and Hidalgo 2005). MRP´s on the other hand may reduce lipid oxidation
by the formation of compounds with antioxidant properties, which include melanoidins (Zamora
and Hidalgo 2005). Thus, the MR and lipid oxidation are dynamic and often correlated cascades of
reactions (O´Brien, 2009; Shahidi and Zhong, 2010).
The final stage of the MR constitutes a formation of brown-colored polymers, referred to as
melanoidins. The formation and the complex structure of melanoidins are still not well
characterized, which makes a quantification of these components difficult (Van Boekel, 1998;
Brands et al., 2002). Due to the browning these components have detrimental effect on the product,
and hence on the shelf life. For optimization and prediction of these processes colour measurements
have mainly been conducted (Nursten, 2005). Two methods are commonly applied for this
approach; absorption measured at 420 nm and a tristimulus measurement with colour parameters
expressed according to the CIELAB system (Van Boekel, 2001).
This part of the study showed that both skimmed and full fat UHT milk were changing in colour,
with a linear trend over the storage period of 24 weeks. This zero order reaction kinetic is consistent

Page 65 of 85
with findings from previous studies on UHT milk during storage (Gaucher et al,. 2008; Al-Saadi
and Deeth, 2015). The observed linear formation over time may indicate that the precursors are
present in high amounts, relative to the products. The precursors seem therefore not to be a limiting
factor for these reactions, resulting in a constant formation of melanoidins. The formation of these
brown polymers were observed as a significant decrease of lightness (L*) in samples stored
between 20 °C and 50 °C. Moreover, a significant increase of red (a*) and yellow colour (b*) in
samples stored between 30 °C and 50 °C were observed (p<0.05). The two milk types followed the
same pattern, though with different off set, which is assumed mainly to be due to the whitening
effect of fat in full fat milk. In some studies an induction period has been observed, indicating that
precursors need to be formed prior to the melanoidins, though this was not observed in the present
study. In addition browning curves have been observed to level off due to saturation (Van Boekel,
2001; Matiacevich and Buera, 2006). For this to be observed, an extension of the storage period is
required, or possibly a further elevation of storage temperatures. The storage time and temperature
required to observe such a flattening of the curve, will depend on the composition of the specific
system, and can be hard to predict from these observations.
The colour space component b* is often used as indicator for browning in investigations of the MR
(Al-Saadi and Deeth, 2015) and will therefore mainly be referred to in the following. The b* value
was observed to increase significantly with the elevated storage temperatures. Results obtained
from Al-Saadi and Deeth (2015) and Gaucher et al. (2008) are comparable to results obtained in the
present study. Al-Saadi and Deeth measured a b* value of 6 in skimmed UHT milk stored at 45 °C
after 12 weeks. Over the same period, Gaucher et al. observed a b* value of approximately 12 in
semi-skimmed UHT milk stored at 40 °C. In the present study a b* value of approximately 8 were
observed in skimmed UHT milk stored at 40 °C after 12 weeks. These variations are possibly due to
differences in the UHT treatment or differences in the sensitivity of the applied method. The
temperature dependence of the rate constant for the late MR´s was evaluated with Arrhenius plots
(Figure 29a and b) and Q10 values. The Q10 values calculated for a* and b* within the interval of
30 °C to 50 °C were between 2.8 and 6. Q10 values within the same range are previously found in
studies investigating the late MR´s. According to Nursten (2005) Q10 values corresponding to these
reactions are mainly between 3 and 6.

Page 66 of 85
The temperature cycles for all three stages of the MR, followed the same pattern of formation. All
temperature cycles with values above those of their average temperature. This indicates that once
the MR is started, it continues at a considerable rate, even when exposed to lower storage
temperatures. In this study only a slight delay in the rate was observed for all three stages of the
MR.
The increase of the MR with storage time and temperature, were supported by an analysis of the
protein composition using HPLC. From the chromatographic profiles it is shown that particularly
the fractions of κ-CN and αS1-CN were modified with time and temperature (Figure 30). This
analysis indicates extensive changes in the milk proteins during storage at different temperatures.
The changes observed in the chromatographic profiles are due to alterations in hydrophobicity of
the proteins. This can possibly be caused by lactosylations, dephosphorylations, deamidations and
polymerizations (Al-Saadi and Deeth, 2015). These results were in agreement with previous
investigations on protein composition of UHT milk at different temperatures. Gaucher et al. (2008)
observed the same tendency in semi-skimmed indirect UHT milk and Al-Saadi and Deeth (2015) on
skimmed indirect UHT milk.
Several parameters affect the pH of milk during storage. In the present study, pH decreased
significantly with time in both skimmed and full fat UHT milk, though changes in milk stored at
10 °C were minimal. The pH of skimmed milk was from the beginning of the study 6.7 and
decreased to 6.67, 6.62, 6.58, and 6.36 when stored at 10 °C, 20 °C, 30 °C and 40 °C for 24 weeks
respectively. These changes can be attributable to various processes occurring during storage. A
major reason to the decreased pH is the high degree of MR observed in the study, especially with
formation of formic acid in the intermediate stage. In addition, degradation of lactose may lead to
formation of organic acids, such as formic and acetic acid (Limacher et al., 2008; Walstra et al.,
2006). Moreover, changes in the salt-equilibria will affect pH. Casein micelles can undergo
dephosphorylation (Al-Saadi and Deeth, 2008) and association of dissolved calcium and phosphate
to the casein micelle will result in a release of protons, which decreases pH (Van Boekel, 1998;
Walstra et al., 2006). It is of major importance to be aware of these pH changes when conducting a
shelf life study. The changes in pH may affect reactions of interest. A decrease in pH may possibly
enhance formation of intermediate products from the 3-deoxyosone pathway. In the present study
the pH decrease was only slight, and was therefore not considered to have a significant effect on the

Page 67 of 85
observed formation of furfural and 2-furanmethanol. On the other hand, the early MR is enhanced
by increases in pH. This can be explained by deprotonation of the amino groups, resulting in more
nucleophile and reactive amino groups. Additionally, the open-chain form of lactose is favored with
increases in pH. In this study it may be considered that the formation of furosine would have been
higher if the pH was unaffected. This could possibly also contribute to the flattening of the curve
observed for furosine formation, though it is more likely that furosine are used in the intermediate
stage of the MR.
6.2 Physical changes
Different analytical techniques have been applied for the investigation of physical changes during
storage at different temperatures. In this study, an evaluation of physical destabilization was
conducted with use of optical centrifugation, light scattering, particle size measurement as well as
analysis of protein and fat content in three fractions; top, middle and bottom. It was chosen mainly
to analyze sedimentation in skimmed milk and creaming in full fat milk, since it is here the
processes are most pronounced.
From analysis with Lumifuge, an instability index was calculated. A very low instability index was
found for full fat milk relative to skimmed milk. This is possibly due to a very low transmission
through full fat milk, reflected by its opaqueness. The turbidity difference between skimmed and
full fat milk seems to influence the measured transmission, and has hence an impact on the
differences observed. Thus, stability analysis based on transmission does not seem to be suitable for
concentrated and opaque dispersions. On the other hand, backscattering measurements conducted
with Turbiscan seemed to be less affected by the turbidity difference of the two milk types.
Changes in instability index were most pronounced within the first 10 weeks of storage. This
observation was consistent with what was observed for creaming and sedimentation analysed with
Turbiscan and Milkoscan. A possible explanation to this is that a fast creaming and sedimentation
of the largest fat globules and proteins, is proceeding in the start of the storage period. Supported by
Stokes equation, which reveals that particle size is positive correlated with particle migration
velocity. Since the major changes of physical stability take place within the first 10 weeks at all
storage temperatures, it may be considered that these parameters are not the most appropriate for an
accelerated shelf life study. After the storage period of 24 weeks the variation in backscattering

Page 68 of 85
(measured with Turbiscan) was higher for sedimentation than for creaming. This observation could
indicate that the creaming process has reached a maximum before the sedimentation process.
Fat and protein content was analysed in three fractions; top, middle and bottom, using Milkoscan.
This analysis provided information about the content of fat, going to the top fraction by creaming,
and the content of protein sinking to the bottom by sedimentation. Here it is important to note that a
creaming layer can include proteins attached to fat and a sediment can include fat attached to
proteins. These conditions may result in a confounding estimate of creaming and sedimentation,
when analysed with Milkoscan, since the amount of creaming is based on the fat content of the top
fraction alone. Though, it has previously been observed that relatively little protein is included in
the creaming layer of UHT milk (Nieuwenhuijse and Van Boekel, 2003). The fat content in the top
fraction increased significantly, whereas the middle and bottom fractions decreased. The protein
content decreased in the top fraction, increased in the bottom fraction and remained stable in the
middle fraction. Similar distribution of fat and protein in the top, middle and bottom fractions were
observed by Lu et al. (2013), who investigated the effect of homogenization pressure on physico-
chemical changes in UHT milk. In the present study a similar decreasing trend of fat was observed
in the middle fraction of backscattering profiles provided by Turbiscan, which is depicted in
Figure 32b. Whereas, backscattering in the bottom fraction of full fat milk was more or less
constant over the period, possibly due to sedimentation.
Common for all three analyses is that the physical stability decreased with higher storage
temperatures. The temperature cycles followed the same development as their average temperature.
This pattern was consistent for all physical parameters included in the study. The acceleration of the
different physical parameters varied between the applied methods. Creaming was accelerated
approximately four times when exposed to 40 °C compared to 20 °C when analysed with Turbiscan,
and two times when analysed with Milkoscan. A possible explanation for the higher acceleration of
creaming with Turbiscan may be that proteins attached to fat globules, will contribute to the
backscattering measured at the creaming layer. These proteins will not be measured as a part of the
creaming layer when Milkoscan is applied. Sedimentation was proceeding approximately twice as
fast when exposed to 40 °C compared to 20 °C for milk analysed with Turbiscan as well as
Milkoscan. Whereas the instability index reflecting sedimentation was accelerated 12 times when
analysed with Lumifuge. The instability index provided by Lumifuge reflects the propensity of
Page 69 of 85
particles to migrate when affected by gravitational forces. Equation 9 describes that a high
instability index is reflected by; a fast change in transmission after a defined time and at a defined
position on the sample cell. In skimmed milk the instability index will therefore reflect how likely
the proteins are to migrate to the bottom under centrifugation. The observations indicate that the
proteins are more likely to migrate, when the milk have been exposed to elevated temperatures prior
to centrifugation. Thus, the outcome from the three techniques applied in the study varies a lot,
especially parameters provided by Lumifuge.
Static light scattering was used to evaluate the effect of elevated storage temperatures on fat globule
size distribution. This analysis would in addition provide information about why these physical
instabilities are occurring during storage. But no significant changes in fat globule size distribution
were observed, over the storage period. It may be possible that fat globules aggregate in the form of
flocculation, which can be disrupted when the milk is homogenized by shaking from side to side,
prior to analysis. In addition this observation reflects that other parameters are accelerating the
destabilizations. According to Stokes low, viscosity and density are parameters affecting the
velocity of creaming. The continuous phase viscosity of milk and the density of milk fat are both
decreasing with temperature, which will increase particle migration velocity (Bandari and Singh,
2011; Rousseau, 2002). Based on this analysis, fat globule size measurements do not seem to be a
good parameter to evaluate in an accelerated shelf life study of UHT milk. Particle size is
considered an important factor to the creaming rate. Hence particle size measurements may be
relevant for products with less stable globules e.g. non homogenized products.
Another parameter of major concern, when evaluating shelf life of UHT milk, is age gelation. The
gelation of UHT milk depends on several factors, to mention is; raw milk quality, proteolysis,
severity and duration of heat treatment and storage conditions (Chavan et al., 2011; Datta et al.,
2001). Previous studies have shown major differences in the degree of gelation between direct and
indirect UHT milk, with the highest degree of gelation in direct UHT milk (Datta et al., 2002). No
gelation was observed in the studied indirect UHT milk. This is considered to be due to the low
enzyme activity observed with the peptide analysis. Datta et al. (2002) reported plasmin and
plasminogen activities in direct and indirect UHT milk. After direct UHT treatment 19% plasmin
activity and 37% plasminogen activity were found, whereas in indirect UHT milk no plasmin
activity were present and 19 % plasminogen activity. In addition indirect UHT milk is exposed to a

Page 70 of 85
higher heat load over longer time than direct UHT milk, this result in more denaturation of whey
proteins, which will bind to casein micelles and stabilize them. The severe heat treatment will also
enhance chemical cross-linking of casein micelles, making the bonds within them more stable
(Datta et al., 2001).
6.3 Comparison of accelerated parameters
A principal component analysis (PCA) was applied to provide a holistic characterization of the
chemical and physical parameters obtained in the study. On basis of this multivariate data analysis
the chemical and physical parameters did not seem to be markedly correlated. This may indicate
that it is important to evaluate both aspects when conducting a shelf life study, since one of the
parameters do not directly give information about the other. There are, however, processes that
connect chemical and physical parameters during storage of UHT milk. A major factor is chemical
cross-linking that will affect the physical sedimentation and probably delay age gelation.
To save time and resources in the development of long life products, prediction of shelf life through
accelerated shelf life studies are often applied (Hough et al., 2006; Richards et al., 2014). These
tests assume that the accelerated processes fit into a kinetic model. Therefore a main challenge may
be the availability of a valid kinetic model that besides fitting into homogeneous systems also fits
into complex heterogeneous systems (Mizrahi, 2000). In an accelerated shelf life test parameters
considered important to consumer acceptance are speeded up by exposure to modified storage
conditions. Although an increased rate of these processes is aimed for, the deteriorative processes
need to be the same as under ambient conditions. When elevated temperatures are applied the most
favorable condition is hence the maximal temperature, for which the data still fits into the Arrhenius
equation (Mizrahi, 2000; Richards et al., 2014). In the present study an upper limit of the
accelerating factor seems to be 30 °C. From the GC-MS analysis of volatile compounds, 2-
ethylfurane, 2-heptanone, 2-nonanone and 2-undecanone were detected. These compounds revealed
an Arrhenius plot with a breaking point at 30 °C, indicating that something affects the rate of
formation at temperatures above. Moreover, the formation of furfural and 2-furanmethanol were
only detectable from 30 °C and 40 °C, respectively. On basis of these observations it may be hard to
predict shelf life above 30 °C. Though, it is important to note that these perspectives are based on
single determinations. In addition, a prediction of shelf life from UHT milk stored at 10 °C appears
to be challenging. From analysis of fluorescence and colour it seems that some reactions are present

Page 71 of 85
at 20 °C and above, that are not present at 10 °C. This is not considered a problem to UHT products
since these are mainly stored at room temperature.
When predicting shelf life of a product it is important to note, that complex systems include several
elementary reactions with individual temperature sensitivities. In the present study, varying Q10
values were calculated for the three stages of the MR. The initial stage revealed Q10 values in the
range of 1.5 to 2.3, consistent with previous findings (Labuza et al., 1994). The intermediate stage
revealed Q10 values in the range of 3.9 to 10.9, which is slightly above findings of 4 to 6 (Labuza et
al., 1994) and finally a range from 2.8 to 6 was found for the late MR´s, consistent with 3 to 6
published by Nursten (2005). Thus, the MR seems overall to be highly affected by temperature.
These findings were all validated by fitting into the Arrhenius equation. The variations in Q10 of the
three stages of the MR reflect that these stages have different temperature dependencies. In this
study the highest Q10 were found for the intermediate MR´s, meaning that these reactions seem to
be most temperature sensitive. Elevation in temperature from 20 °C to 30 °C was found to be
preferable for an accelerated shelf life study, based on findings of the present study. Since this is not
a high elevation in temperature, it may be an advantage to use markers with high temperature
sensitivities, for a minimization of time and resources.
7. Conclusion
The present master thesis is a step towards a valid shelf life test, accelerating both chemical and
physical changes in UHT milk. Such a test would be a valuable tool providing a more holistic
prediction of shelf life, compared to previous investigations. The objective of this study was to give
a quantification of physico-chemical changes with use of elevated storage temperatures, to establish
a setup to accelerate shelf life development. Commercial skimmed and full fat UHT milk were
exposed to 10 °C, 20 °C, 30 °C, 40 °C and 50 °C and three temperature cycles. The chemical
analyses included an evaluation of the three stages of the MR as well as the lipid oxidation, and the
physical analyses included an evaluation of physical destabilization.
In the present study, skimmed and full fat UHT milk seemed to follow a similar pattern for all
parameters analysed. The exposure to elevated temperatures accelerated both chemical and physical
changes over the storage period of 24 weeks. Investigation of chemical changes revealed data
possible to describe with kinetic models. Formation of furosine followed a first order reaction
Page 72 of 85
kinetic for product formation, whereas fluorescence and colour changes followed a zero order
reaction kinetic. Moreover, data obtained for all three stages of the MR fitted into the Arrhenius
equation, with corresponding Q10 values; for the initial MR´s of 1.5 to 2.3, for the intermediate
MR´s of 3.9 to 10.9 and for the late MR´s of 2.8 to 6.
Acceleration of physical changes varied between the applied methods. Creaming was accelerated
approximately four times when exposed to 40 °C compared to 20 °C when analysed with Turbiscan,
and two times when analysed with Milkoscan. Sedimentation was accelerated approximately two
times when exposed to 40 °C compared to 20 °C when analysed with Turbiscan as well as
Milkoscan. Additionally, the instability index for sedimentation was accelerated 12 times when
analysed with Lumifuge. No effect was observed on fat globule size when exposed to elevated
temperature over time. This indicates that other parameters are affecting the creaming observed in
the present study, probably by changes in viscosity of the continuous phase and density of the fat
globules.
Development of the three temperature cycles varied between chemical and physical parameters
analysed. The temperature cycles included in the chemical analyses increased with a higher rate
than at the average temperature of which they were exposed to. Whereas the temperature cycles
included in the physical analyses followed the same development as at the average temperature of
which they were exposed to. This reflects that it is only slightly possible to delay the MR once it
has started, even when exposed to lower storage temperatures.
A prediction of shelf life from characterisation of chemical and physical changes seems to be
possible within the temperature range of 20 °C to 30 °C. Analysis of volatile compounds revealed
an Arrhenius plot for 2-ethylfuran with two temperature ranges from 10-30 °C and 30-50 °C.
Additionally, furfural and 2-furanmethanol were only detected from 30 °C and 40 °C, respectively.
Both observations indicate that other reactions are proceeding at temperatures above 30 °C,
compared to at ambient temperatures. Analysis of fluorescence and colour revealed Arrhenius plots
indicating that the rate is almost constant at 10 °C, and increasing from 20 °C and above. Further
investigations are needed to validate the accelerated shelf life test for prediction of shelf life of
UHT milk.

Page 73 of 85
8. Perspectives
Accelerated shelf life tests are valuable tools in the prediction of shelf life. For complex
heterogeneous systems like milk it may be a challenge to fit accelerated parameters into kinetic
models. A future approach may be a better characterization of the mechanisms behind the
deterioration processes, with the aim of developing kinetic models for more specific reactions. Such
models would validate future accelerated shelf life tests.
An accelerated shelf life test based on the present setup would be interesting to couple with a
sensory descriptive analysis. This would provide knowledge about the sensory characteristics of the
volatile compounds formed by lipid oxidation and in the intermediate stage of the MR. Due to
differences in sensory thresholds some compounds are affecting flavour and aroma more than
others. This would moreover give information about which volatile compounds should be of
particular importance in an accelerated shelf life test.
Finally, it would be interesting to expand this accelerated shelf life study to other long life products
than UHT milk. Markers relevant for other products would mainly depend on the composition of
the specific product and the severity of heat treatment.

Page 74 of 85
9. List of references
Aguilar, M. S. (2004). HPLC of peptides and proteins: Methods and protocol. Human press.
Al-Saadi, J. M. S., and Deeth, H. C. (2008). Cross-linking of proteins and other changes in UHT
milk during storage at different temperatures. The Australian Journal of Dairy Technology.
63;79-85.
Bandari, V. and Singh, H. (2011). Analytical methods, physical methods. In Fuquay, J. W., Fox, P.
F. and McSweeney. Encyclopedia of Dairy Science. Academic press, second edition.
Barrious, B., Astiasarán, I. and Ansorena, D. (2013). A review of analytical methods measuring
lipid oxidation status in foods: a challenging task. Eur Food Res Technol, 236;1-15.
Berg, J. M., Tymoczko, J. L. and Stryer, L. (2006). Biochemistry. New York: W. H. Freeman and
company.
Bimbo, F., Bonanno, A. and Viscecchia, B. (2016). Hedonic analysis of the price of UHT-treated
milk in Italy. J. Dairy Sci. 99:1095-1102.
Birlouez-Aragon, I., Leclere, J., Quedraogo, C. L., Birlouez, E. and Grongnet, J. F. ( 2001). The
FAST method, a rapid approach of the nutritional quality of heat-treated foods.
Nahrung/Food, 3;201-205.
Birlouez-Aragon, I., Nicolas, M., Matais, A., Marchond, N. Grenier, J. and Calvo, D. (1998). A
rapid fluorimetric method to estimate the heat treatment of liquid milk. Int. Dairy Journal,
8;771-777.
Birlouez-Aragon, I., Sabat, P., Gouti, N. (2002). A new method for discriminating milk heat
treatment. International Dairy Journal. 12;59-67.
Bonfatti, V., Grigoletto, L., Cecchinato, Gallo, L., Carnier, P. (2008). Validation of a new reversed-
phase high-performance liquid chromatography method for separation and quantification of
bovine milk protein genetic variants. Journal of Chromatography A. 119;101-106.
Bordin, G., Cordeiro Raposo, F., De la Calle, B., Rodriguez, A. R. (2001). Identification and
quantification of major bovine milk proteins by liquid chromatography. Journal of
Chromatography, 928; 63-76.
Bosch, L., Alegría, A., Farré, R., Clemente, G. (2007). Fluorescence and color as marker for the
Maillard reaction in milk-cereal based infant foods during storage. Food Chemistry.
105;1135-1143.

Page 75 of 85
Brands, C. M. J., Wedzicha, B. L., Van Boekel, M. A. J. S. (2002). Quantification of melanoidin
concentration in sugar-casein systems. J Agric Food Chem. 50:1178-83.
Button, P. D., Roginski, H., Deeth, H. C., Craven, H. M. (2011). Improved shelf life estimation of
UHT milk by prediction of proteolysis. Journal of Food Quality, 1745-4557.
Calvo, M. M. and de la Hoz, L. (1992). Flavour of heated milks. A review. International Dairy
Journal, 2;69-81.
Chavan R. S., Khedkar, C. D., Jana, A. H. (2011). UHT milk processing and effect of plasmin
activity on shelf life: A review. Institute of Food Technologist.s
Contarini, G., Polovo, M. (2002). Volatile fraction of milk: Comparison between purge and trap and
solid phase Microextraction techniques. J. Agric Food Chem, 50;7350-7355.
Contarini, G., Povolo, M., Leardi, R., Toppino, P. M. (1997). Influence of Heat Treatment on the
Volatile Compounds of Milk. J. Agric. Food Chem, 45;3171-3177.
Dalgleish, D. G. (2011). On the structural models of bovine casein micelles review and possible
improvements. Soft Matter, 7;2265-2272.
Dalgleish, D. G. (1992). Sedimentation of casein micelles during the storage of ultra-high
temperature milk products – a calculation. Dairy Sci. 75;371-379.
Dalgleish, D. G., Corredig, M. (2012). The structure of the casein micelle of milk and its changes
during processing. Annual Review of Food Science and Technology, 3:449-67.
Datta, N. and Deeth, H. C. (2001). Age gelation of UHT milk – A review. Trans IChemE, Vol 79.
Datta, N., Elliott, A., Perkins, M. L., & Deeth, H. C. (2002). Ultra-high temperature (UHT)
treatment of milk: Comparison of direct and indirect modes of heating Australian Journal of
Dairy Technology, 57:211-227.
De Jong, N., Visser, S., Olieman, C. (1993). Determination of milk proteins by capillary
electrophoresis. J Chromatogr. A. 652; 207-213.
Delgado, T., Corzo, N., Santa-María, G., Jimeno, M. L., Olano, A. (1992). Determination of
furosine in milk samples by ion-pair reversed phase liquid chromatography.
Chromatographia 33:374-376.

Page 76 of 85
Dewettinck, K., Rombaut, R., Thienpont, N., Le, T. T., Messens, K., Camp, J. V. (2008).
Nutritional and technological aspects of milk fat globule membrane material. International
Dairy Journal 18. 436-457.
Dissanayake, M. and Vasiljevic, T. (2009). Functional properties of whey proteins affected by heat
treatment and hydrodynamic high-pressure shearing. J. Dairy Sci. 92;1387-1397.
Elmore, J. S., Erbahadir, M. A., Mottram, D. S. (1997). Comparison of Dynamic Headspace
concentration on Tenax with Solid Phase Microextraction for the analysis of aroma volatiles.
J Agric Food Chem 45;2638-2641.
Farrell, Jr., H. M., Jimenez-Flores, R., Bleck, G. T., Brown, E. M., Butler, J. E.. Creamer, L. K.,
Hicks, C. L., Hollar, C. L., Ng-Kwai-Hang, K. F., Swaisgood, H. E. (2004). Nomenclature of
Proteins of Cows’ Milk – Sixth Revision. J. Dairy Sci. 87:1641-1674.
Farrell, Jr., H. M., Malin, E. L., Brown, E. M., Qi, P. X. (2006). Casein micelle structure: What can
be learned from milk synthesis and structural biology? Current Opinion in Colloid &
Interface Science, 11;135-147.
Ferrer, E., Alegría, A., Farré, R., Abellán, P. and Romero, F. (2002). High-performance liquid
chromatographic determination of furfural compounds in infant formulas – Changes during
heat treatment and storage. Journal of Chromatography A, 947;85-95.
Fox, P. F. (2009). Lactose: Chemistry and properties. In Fox, P. F. & McSweeney, P. L. H. (Eds.),
Advanced Dairy Chemistry - 3 Lactose, water, salts and minor constituents (pp 1-15):
Springer US.
Fox, P. F. (2003). Milk Proteins: General and historical aspects. In Fox, P. F. & McSweeney, P. L.
H. (Eds.), Advanced Dairy Chemistry – 1 Proteins (pp. 947-974): Springer US.
Fox, P. F. and Kelly, A. L. (2012). Chemistry and biochemistry of milk constituents. In Simpson, B.
K., Food biochemistry and food processing. Wiley-Blackwell (pp 442 – 490).
Gaucher, I., Molle, D., Gagnaire, V., Gaucheron, F. (2008). Effects of storage temperature on
physico-chemical characteristics of semi-skimmed UHT milk. Food Hydrocolloids 22; 130–
143.
Gaucheron, F. (2005). The minerals of milk. Reprod. Nutr.Dev. 45;473-483.
Gomez, M. J. Garde, S., Gaya, P., Medina, M., Nunn, M. (1997). Relationship between level of
hydrophobic peptides and bitterness in cheese made from pasteurized and raw milk. J Dairy
Res. 164:289-297.

Page 77 of 85
Guerra-Hernandez, E., Gomez, C. L., Garcia-Villanova, B., Sanchez, N. C. And Gomez, J. M. R.
(2002). Effect of storage on non-enzymatic browning of liquid infant milk formulae. J Sci
Food Agric 82:587-592.
Gutierrez, A. M. (2015). Effects of lipid oxidation initiators and antioxidants on the total
antioxidant capacity of milk and oxidation products during storage. Graduate Theses and
Dissertations. Paper 14073.
Hawke, J. C. (1966). Reviews of the progress of dairy science. J Dairy Res 33:225-243.
Heck, J. M. L., Van Valenberg, H. J. F., Dijkstra, J., and Van Hooijdonk, A. C. M. (2009). Seasonal
variation in the Dutch bovine raw milk composition. J. Dairy Sci. 92, 4745-4755.
Hedegaard, R. V. and Skibsted, L. F. (2010). Dannelse af acrylamide og andre bruningsprodukter.
LMFK-bladet, nr 6, november 2010.
Henle, T. Walter, H., Klostermeyer, H. (1991). Evaluation of the extent of the early Maillard-
reaction in milk products by direct measurement of the Amadori-product lactuloselysine.
Lebensm Unters Forsch. 193:119-22.
Holt, C. and Horne, D. (1996). The hairy casein micelle: Evolution of the concept and its
implication for dairy technology. Neth Milk Dairy J. 50;85-111.
Hough, G., Garitta, L., Gomez, G. (2006). Sensory shelf-life predictions by survival analysis
accelerated storga models. Food Quality and Preference 17:468-473.
Huppertz, T. and Kelly, A. L. (2006). Physical Chemistry of Milk Fat Globules. In Fox, P. F. &
McSweeney, P. L. H. (Eds.), Advanced Dairy Chemistry – 2 Lipids (pp. 173-212): Springer
US.
Ismail, B., and Nielsen, S. S. (2010). Invited review: Plasmin protease in milk: Current knowledge
and relevance to dairy industry. Journal of Dairy Science, 93, 4999-5009.
Jansson, T. (2014a). Chemical changes and off-flavour development in lactose-hydrolyzed UHT
milk during storage. PhD Thesis, Aarhus University, Science and technology.
Jansson, T., Jensen, S., Eggers, N., Clausen, M. R., Larsen, L. B., Ray, C., Sundgren, A., Andersen,
H. J., Bertram, H. C. (2014b). Volatile component profiles of conventional and lactose-
hydrolysed UHT milk – a dynamic headspace gas chromatography-mass spectrometry study.
Dairy Sci. & Technol. 94;311-325.
Page 78 of 85
Jansson, T., Clausen, M. R., Sundkilde, U. K., Eggers, N., Nyegaard, S. (2014c). Lactose-
hydrolyzed milk is prone to chemical changes during storage than conventional ultra-high-
temperature (UHT) milk. J. Agric. Food Chem. 62;7886-7896.
Johns, D. O., Dills, R. L., Morgan, M. S. (2005). Evaluation of dynamic headspace with gas
chromatography/mass spectrometry for the detection of 1,1,1-trichloroethane,
trichloroethanol, and trichloroacetic acid in biological samples. J. Chromatogr B, 817;255-
261.
Kessler, H. G. (2002). Food and bio process engineering: Dairy technology. Fifth edition. Munich,
Germany: Verlag A. Kessler.
Kilara, A. and Panyam, D. (2003). Peptides from milk proteins and their properties. Crit Rev Food
Sci Nutr. 43:607-33.
Kontopidis, G., Holt, C., Sawyer, L. (2004). Invited review: Beta-lactoglobulin: Binding properties,
structure, and function. J Dairy Sci 87:785-96.
Labuza, T. P., Reineccius, G. A. , Baynes, J. and Monnier, V. (Eds) (1994). The Maillard reaction
in food, nutrition and health. Royal Chemical Society, London.
Laguerre, M., Lecomte, J. and Villeneuve, P. (2007). Evaluation of the ability of antioxidants to
counteract lipid oxidation: Existing methods, new trends and challenges. Progress in Lipid
Research, 46;244-282.
Lakowicz, J. R. (1999). Principles of Fluorescence Spectroscopy. Second edition. Kluver
Academic/Plenum Publishers, New York.
Lemieux, L. and Simard, R. E. (1992). Bitter flavour in dairy products. I A. A review of bitter
peptides from caseins: Their formation, isolation and identification, structure masking and
inhibition. 72:335-382.
Lewis, M. J. and Deeth, H. D. (2008). Heat treatment of milk. BLBK061-Tamime. 183-194.
Limacher, A. Kerler, J., Davidek, T., Schmamalzried, F. and Blank, I. (2008). Formation of furan
and methylfuran by Maillard-type reactions in model systems and food. J Agric Food Chem
56;3639-47.
Lu, C., Wang, G. and Zhang, L. (2013). Effects of homogenisation pressures on physicochemical
changes in different layers of ultra-high temperature whole milk during storage. Society of
Dairy technology, 1111:1471-0307

Page 79 of 85
Malvern Instruments Ltd. (1997). Sample dispersion & refractive index guide. MAN 0079, version
3.1, England.
Malvern Instrument Ltd, (2015). A basic guide to particle characterization. Malvern Instruments
Worldwide, pp. 1-23.
Marsili, R. T. (1999). Comparison of solid-phase microextraction and dynamic headspace methods
for gas chromatographic-mass spectrometric analysis of light-induced lipid oxidation products
in milk. J Chromatogr Sci 37:17-23
Martins, S.I.F.S., Jorgen, W.M.F., Van Boekel, M.A.J.S. (2001). A review of Maillard reaction in
food and implications of kinetic modelling. Trends in Food Science & Technology, 11, 364-
373.
Matiacevich, S. B. and Buera, M. P (2006). A critical evaluation of fluorescence as a potential
marker for the Maillard reaction. Food Chemistry, 95;423-430.
McClements, D. J. (2007). Critical review of techniques and methodologies for characterization of
emulsion stability. Taylor and Francies Group, 47;611-649.
McGuire, R. G. (1992). Reporting of objective color measurements. HortScience, 27;1254-1255.
McKellar, R. C., Froehlich, D. A., Butler, G., Cholette, H., Campbell, C. (1984). The effect of
uncooled storage on proteolysis bitterness and apparent viscosity in ultra high temperature
milk. Can Inst Food Sci Technol J 17:14-17.
Mengual, O., Meunier, G., Cayré, I., Puech, K. Snabre, P. (1999). Turbiscan MA 2000: Multiple
light scattering measurement for concentrated emulsion and suspension instability analysis.
Talanta 50;445-456.
Metha, B. M. and Deeth, H. C. (2016). Blocked Lysine in Dairy Products: Formation, Occurrence,
Analysis, and Nutritional Implications. Institute of Food Technologists. 1541-4337
Mickalski, M. C., Briard, V., Michel, F. (2001). Optical parameters of milk fat globules for laser
light scattering measurements. EDP Science, 81;787-796.
Mizrahi, S. (2000). Accelerated shelf-life tests. In Kilcast, D. and Subramaniam, P. (Eds.), The
stability and shelf-life of food. (pp.108-128). Woodhead Publishing Limited.
Morales, F. J. and Jiménez-Pérez, S. (1999). HMF formation during heat-treatment of milk-type
products as related to milkfat content. Journal of food science, 64;855-859.

Page 80 of 85
Nangpal, A., & Reuter, H. (1990). Reference diagram for furosine content in UHT milk. Kieler
Milchw. Forsch, 45, 77-86.
Ng, S. H., Woi, P. M., Basri, M. and Ismail, Z. (2013). Characterization of structural stability of
palm oil esters-based nanocosmeceuticals loaded with tocotrienol. Journal of
Nanobiotechnology, 11;1-7.
Nielsen, S. S. (2002). Plasmin System and Microbial Proteases in Milk: Characteristics, Roles and
Relationship. J Agric Food Chem. 50:6628-6634.
Nieuwenhuijse, J. A. and Van Boekel, M. A. J. S. (2003). Protein Stability in Sterilised Milk and
Milk Products. In Fox, P. F. & McSweeney, P. L. H. (Eds.), Advanced Dairy Chemistry – 1
Proteins (pp. 947-974): Springer US.
Nursten, H. (2005). Maillard Reaction - Chemistry, Biochemistry and Implications. Royal Society of
Chemistry.
O´Brien, J. (2009). Non-enzymatic degradation pathways of lactose and their significance in dairy
products. In Fox, P. F. & McSweeney, P. L. H. (Eds.), Advanced Dairy Chemistry— 3
Lactose, water, salts and minor constituents (pp 231-294): Springer US.
Oldfield, D. J., Singh, H., Taylor, M. W. and Pearce, K. N. (2000). Heat-induced interactions of β-
lactoglobulin and α-lactalbumin with the casein micelle in pH-adjusted skim milk. Int. Dairy
J. 10, 509-518.
Oliver, C. M., Melton, L. D and Stanley, R. A. (2006). Creating proteins with novel functionality
via the Maillard reaction: A review. Critical reviews in food science and nutrition, 46; 337-
350.
Perkins, M. and Elliott, A. (2005). Stale flavour volatiles in Autralian commercial UHT milk during
storage. Aust J Dairy Technol 60:231-237.
Rauh, V. M. (2014a). Impact of plasmin activity on the activity on the shelf life and stability of
UHT milk. PhD Thesis, Aarhus University, Science and technology.
Rauh, V. M., Johansen, L. B., Bakman, M., Ipsen, R., Paulsson, M., Larsen, L. B., Hammershøj, M.
(2014b). Protein lactosylation in UHT milk during storage measured by liquid
chromatography-mass spectrometry and furosine. International Journal of Dairy Technology.
68;486-494.

Page 81 of 85
Rauh, V. M., Sundgren, A., Bakman, M., Ipsen, R., Paulsson, M., Larsen, L. B., Hammershøj, M.
(2014c). Plasmin activity as a possible cause for age gelation in UHT milk produced by direct
steam infusion. International Dairy Journal, 38;199-207.
Raikos, V. (2010). Effect of heat treatment on milk protein functionality at emulsion interfaces. A
review. Food Hydrocolloides, 24;259-265.
Richards, M., De Kock, H. L., Buys, E. M. (2014). Multivariate accelerated shelf-life test of low fat
UHT milk. International Dairy Journal 36; 38-45
Rousseau, D. (2002). Fat crystal behavior in food emulsions. In Marangoni, A. G., and Narin, S. S.
(Eds.), Physical properties of lipids. Marcel Dekker, Inc.
Sakkas, L., Moutafi, A., Moschopoulou, E., Moatsou, G. (2014). Assessment of heat treatment of
various types of milk. Food Chemistry 159:293-301.
Samková, E., Spicka, J., Pesek, M., Pelikanova, T. and Hanus, O. (2012). Animal factors affecting
fatty acid composition of cow milk fat: A review. South African Journal of Animal Science,
42;83-100.
Serrano, M. A., Castillo, G., Muñoz, M. M., Hernández, A. (2002). Influence of Hydrolysis,
Purification and Calibration Method on Furosine Determination Using Liquid
Chromatography. J Chromatogr Sci 40:87-91.
Shahidi, F. and Zhong, Y. (2010). Lipid oxidation and improving the oxidative stability. Chem Soc
Rev 39: 4067-79.
Siciliano, R. A., Mazzeo, M. F., Arena, S., Renzone, G., & Scaloni, A. (2013). Mass spectrometry
for the analysis of protein lactosylation in milk products. Food Research International, 54,
988-1000.
Singh, H. and Havea, P. (2003). Thermal denaturation aggregation and gelation of whey proteins. In
Advanced Dairy Chemistry, Volume 1, Proteins, P. F. Fox, and P. L. H. McSweeney, eds.
(Kluwer Academic/Plenum Publishers).
Singh, H. and Waungana, A. (2001). Influence of heat treatment of milk on cheesemaking
properties. Cheese Ripening Technol. 11,543-551.
Singh, R. R. B., Ruhil, A. P., Jain, D. K., Patel, A. A. and Patil, G. R. (2009). Prediction of sensory
quality of UHT milk – A comparison of kinetic and neutral network approaches. Journal of
Food Engineering, 92;146-151.

Page 82 of 85
Van Boekel, M. A. J. S. (2001). Kinetic aspects of the Maillard reaction: A critical review.
Nahrung/Food 45; 150-159
Van Boekel, M. A. J. S. (2006). Formation of flavour compounds in the Maillard reaction.
Biotechnology Advances 24; 230– 233
Van Boekel, M. A. J. S. (1998). Effect of heating on Maillard reaction in milk. Food Chem 62; 403-
414.
Vazquez-Landaverde, P. A., Torres, J. A., Qian, M. C. (2005). Quantification of trace volatile sulfur
compounds in milk by solid-phase microextraction and gas chromatography-pulsed flame
photometric detection. J Dairy Sci 89:2919-27.
Vazquez-Landaverde, P. A., Torres, J. A., Qian, M. C. (2006). Quantitative determination of
thermally derived off-flavor compounds in milk using solid-phase microextraction and gas
chromatography. J Dairy Sci 88:3764-72.
Vranová, J. and Ciesarová, Z. (2009). Furan in food – A review. Czech J. Food Sci. 27;1-10.
Walstra, P., Wouters, J. T. M., Geurts, T. J. (2006). Dairy Science and Technology. Boca Raton,
USA: Taylor & Francis.
Wang, J., Zang, Q-H., Wang, Z-H., Li H-M. (2009). Determination of Major Bovine Milk Proteins
by Reversed Phase High Performance Liquid Chromatography. Chinese J Anal Chem
37:1667-1670
Wang, Q. and Ismail, B. (2012). Effect of Maillard-induced glycosylation on the nutritional quality
solubility, thermal stability and molecular configuration of whey protein. International Dairy
Journal, 25:112-122.
Wijayanti, H. B., Bansal, N., Deeth, H. C. (2014). Stability of Whey Proteins during Thermal
Processing: A review. Comprehensive Reviews in Food Science and Food Safety, 13;1235-
1251.
Wright, A. J and Marangoni, A. G. (2006). Crystallization and Rheological Properties of Milk Fat.
Fox, P. F. & McSweeney, P. L. H. (Eds.), Advanced Dairy Chemistry – 2 Lipids (pp. 245-
291): Springer US.
www.sigmaaldrich.com/technical-documents/articles/reporter-us/bioanalysis-with-spme.html.
(2016) Sigma Aldrich co. LCC.
www.dba.med.sc.edu/price/irf/Adobe_tg/models/cielab.html. (2000). Adobe Systems Incorporated

Page 83 of 85
Xu, W., Nikolov, A., Wasan, D. T., Gonsalves, A. and Borwankar, R. P. (1998). Fat particle
structure and stability of food emulsions. Journal of food science, 63;183-188.
Zamora, R., Hidalgo, F. J. (2005). Coordinate contribution of lipid oxidation and Maillard reaction
to the nonenzymatic food browning. Crit Rev Food Sci Nutr 45:49-59.

Page 84 of 85
10. Appendix
Appendix 1: Transmission profiles provided by Lumifuge
Figure 37 – Transmission profile of full fat UHT milk stored at 40 °C, illustrating measured transmission as function of the local position on the sample cell. Red curves indicate the first measurements, which becomes green over time of analysis. The position selected for calculation of instability index is marked with blue.
Figure 38 - Transmission profile of skimmed milk stored at 40 °C, illustrating measured transmission as function of the local position on the sample cell. Red curves indicate the first measurements, which becomes green over time of analysis. The position selected for calculation of instability index is marked with blue.

Page 85 of 85
Appendix 2: Backscattering profiles provided by Turbiscan
Figure 39 – Backscattering profile of full fat milk stored at 40 °C, illustrating measured backscattering as function of the local position on the sample cell. The blue line indicates clarification of the middle layer, measured 25 mm from the bottom of the sample cell.
Figure 40 - Backscattering profile of skimmed milk stored at 40 °C, illustrating measured backscattering as function of the local position on the sample cell. The blue line indicates clarification of the middle layer, measured 25 mm from the bottom of the sample cell.