evaluation of a short-run injection molding process …sequin/papers/theses/...evaluation of a...
TRANSCRIPT

Evaluation of a Short-Run Injection Molding Process with Somos NanoForm 15120 Tooling Alexander K. Do University of California, Berkeley Department of Mechanical Engineering
ABSTRACT A low-cost, short-run injection molding process was investigated using a tool directly fabricated from stereolithography with Somos NanoForm 15120 in high-resolution build mode. The tool produced 150 small, flat parts (2” wide by 3.5” long), cost less than $2,500 to implement, and had a lead time of three weeks from order to final injection-molded parts. Results from the investigation indicate that the process is viable for short-run injection molding but challenges and deficiencies exist. Primarily, the SLA industry must address anisotropy in the dimensional accuracy of the high-resolution stereolithography process of NanoForm. Thermal and mechanical properties of NanoForm tooling are also found to be unique in comparison to conventional injection molding practices, requiring a learning curve on part of the processor.
1. INTRODUCTION
1.1. Economics of Injection Molding Injection molding remains a very prominent manufacturing technology globally for the production of goods in industries varying from consumer products to medical devices. Tooling for the injection molding process represents a large fixed cost and long lead time within the total product development process. Interviews conducted with local and global industry operators revealed that while advances in technology and growth in foreign markets in recent years have lowered tool costs from hundreds of thousands of dollars to tens of thousands, lead times can still span 8 weeks or longer. Due to the costs and lead times, conventional injection molding processes are generally not economical for production runs of less than 500 parts. For such batch sizes, alternative tooling strategies must be investigated to fabricate parts with the quality and properties achieved by high-pressure injection molding.
1.2. Rapid Prototyping in Mold Tooling The set of fabrication processes classified as “rapid prototyping” (RP) technologies have shown to be effective low-cost tools for prototyping parts, primarily in areas of design validation. Generally, RP refers to any process which uses a layer-based solid freeform fabrication method to create physical parts directly from digital CAD data. Prototypes and models built from RP have been used for interaction between disciplines in product development: design, engineering, marketing, buyers, and manufacturing. However, material properties, quality factors, costs, and lead times of RP
processes have limited their viability as methods of direct production.
In recent years, RP has been used in direct and indirect methods to fabricate injection mold tools, with varying results. Examples of such work include research by Dickens and Smith [1], and Harris et al. [2-4]. The ability to fabricate injection molding tools directly from RP would dramatically simplify production of injection-molded parts. However, the processes for doing so are still in their infancy and there is a lack of extensive knowledge and literature about them. In this research, a low-cost, short-run injection molding process is investigated using a tool directly fabricated from stereolithography with Somos NanoForm 15120.
2. REVIEW
2.1. Direct and Indirect Tooling Methods An indirect RP tooling method refers to a process in which a rapid prototyped master part is used as a casting pattern for a final molding tool. One example of indirect tooling is the spray metal tooling method [5], in which an RP model is sprayed with fine droplets of molten metal, creating a metal shell about 0.08” thick. The shell is backed with an epoxy filling, allowing for the integration of cooling channels and an ejection system. Another casting method which uses a sintered metal-powder mixture is the 3D-Keltool process [6]. The 3D-Keltool process can be used to produce a cavity and core set or to build an electrical discharge machining (EDM) electrode for creating hard metal tooling. Indirect methods have been proven with accurate and durable tools, but the availability of processors is limited – for example the 3D-Keltool process requires an operating license. Direct tooling methods, by contrast, use RP technologies to produce the final mold core and cavity. In addition to Dickens’ work in stereolithography, other processes such as Z-Corporation 3D printing have been studied in injection molding [7]. While direct tooling methods offer the ability to easily produce a tool in-house or through a service bureau, the limiting factors in material properties have prevented them from become industry standards for short-run injection molding.
2.2. Stereolithography The stereolithography (SL) process by 3D systems became in 1987 the first commercially available layered manufacturing process for producing parts directly from CAD data, and 19 years later it still remains the standard for precision and accuracy in rapid prototyping. Since its introduction, the
Alexander K. Do Page 2 of 18
process capabilities and available materials have dramatically improved. Attainable feature sizes are now within 0.005” on an SLA Viper [8] machine and layer thicknesses of 0.001” are possible on an SLA 7000 [9]. Elastomeric materials allow for parts with a Shore A hardness of 70 and 75% elongation at break (Somos ULM17220 [10]), while particle-filled composite materials from Somos and 3D Systems can attain a tensile modulus of 1,700,000 psi (Somos ProtoTool [10], 3D Systems Bluestone [11]). Per-part costs have gone down at least an order of magnitude since commercialization and it has recently become viable to use SL models in many more applications.
The chemical process for stereolithography is based upon the photopolymerization of a monomer resin with ultraviolet (UV) light providing the activation energy. Typically, a table or stage submerged into the resin forms a platform for the part, which is polymerized as a UV laser traces out each layer using a hatching pattern such as STAR-Weave or ACES [6]. The stage lowers itself into the resin as a new layer of uncured resin is spread over the part for hatching. The polymers in stereolithography apparatus (SLA) systems consist of acrylates, epoxies, and vinylethers which are cured by free radical or cationic polymerization. During polymerization, the polymer chains are cross-linked to create a thermosetting part.
2.3. Somos NanoForm 15120 Stereolithography resins have long been studied for direct injection mold tooling [1], but limitations in accuracy, durability, and heat resistance hindered practical applications [12]. Composite materials recently introduced by materials manufacturers DSM Somos and 3D Systems offer dramatically increased material properties in the areas previously listed. The materials employ a matrix of thermosetting polymer around a reinforcing type of ceramic which is used to provide stiffness and heat resistance while maintaining the manufacturability of stereolithography. The composite materials available at the time of this writing consist of ProtoTool and NanoForm by DSM Somos and Bluestone by 3D Systems. Of the three composite materials, NanoForm is particularly interesting not only because it is a lower cost than Bluestone and ProtoTool, but it has been reported by SLA operators to be a more “user friendly” material. Specifically, the silica “nanoparticles” suspended in NanoForm do not settle into the uncured resin – unlike ProtoTool which requires a mixing unit to maintain particle suspension and Bluestone which requires vat stirring. One of the most compelling reasons to investigate NanoForm specifically over the other two is that while it offers lower strength and thermal resistance properties, it is the only composite resin which can be run at high-resolution. The high-resolution build mode enables a 0.002” layer thickness and 0.003” beam diameter – contrasted to 0.004” layer thickness and 0.010” beam diameter in standard build modes [8]. The material properties for NanoForm are listed in Appendix 9.2.1.
3. EXPERIMENTAL WORK
3.1. SLA Direct Tooling Molding Process The total design-and-manufacturing process used for the short-run injection molding study is similar to the process which would be taken for a standard production-quantity mold:
1. Design and validate part: -Design for manufacturability (DFM) analysis -Moldflow analysis -Rapid prototyping
2. Design mold and ejection system: -Cavity scaling factor -Parting line -Runners, gating, venting
3. Partition cavity/core features to interchangeable inserts: -Mechanism to secure inserts
4. Fabricate SL inserts and mold base: -Outside service bureau or in house
5. Determine injection parameters by testing: -Injection pressure and speed -Clamping force -Holding and cooling time
The primary novelty in this process occurs during Step 3, the partitioning of cavity and core features to inserts. Generally, cavity and core features are be formed by a single or multiple metal parts in a production tool which are pressed or bolted into the mold assembly. Similarly, designing a mold assembly to use SL cavity and core inserts which can be secured into a metal base allow the complex geometric features to be rapidly manufactured by SLA. Securing these inserts into a base rather than fabricating the entire tool from stereolithography allows for a number of benefits:
• Reduced amount of volume to be built on SLA, reducing lead time and cost
• Use of a generic mold base for a family of interchangeable SL inserts, reducing tool costs
• Installation and mating of the assembly to standard platen / nozzle interfaces, which create better distribution of clamping force through the hard metal mold base
• Simpler installation of alignment, ejection, and cooling systems
• In the case that the tool fails or needs considerable adjustment in geometry, a new insert can be fabricated quickly at a low cost
Fabrication of the SL inserts can be done in-house with SLA equipment, but with the widely available number of service bureaus it can be very simple to use a third-party vendor for this process. Some service bureaus such as Quickparts.com offer electronic online quoting systems [13], and many other vendors will accept files by email and return quotes within hours. This enables a particularly good lead time for fabricating the inserts, typically as fast as one week including shipping.

Alexander K. Do Page 3 of 18
The process, assuming access to a molding press and a stock of molding materials, can cost anywhere from $1,000 to $6,000 or more depending on size, complexity, and materials. A summary of the approximate costs and turn time:
• Aluminum mold base: $500 - $3,000 depending on material, machining time, in-house capabilities
• SL inserts: $500 - $3,000 depending on material, volume, z-height (build time), layer thickness
• Alignment and ejection hardware: $100 • Turn time: 1-2 weeks
3.2. Design of Mold Cavity Set (Case Study)
3.2.1. Project Background The motivation for this case study originated from an academic design project for an injection mold which was to produce a pilot series of a particular tile from ABS plastic. The part was designed with unique geometry so that six pieces could be assembled to form a rhomboid building block for the visualization of various zonohedra – in lay terms, mathematical Legos. In particular, these tiles had unique features which would be difficult to machine into a mold: sharp angles, well-defined teeth, and two parting planes. Figure 1 shows a computer-aided design (CAD) rendering of tile design, showing the teeth on each edge, with a secondary parting plane for the teeth on the left side of the tile. For a sense of scale, each of the tile edges are 2 inches long, and the teeth are 1/8” wide.
Figure 1 - CAD rendering of zonohedra tile
The original design was adapted for manufacturability, considering both injection molding and tool machining requirements. There were some geometric features which could not be sacrificed during the redesign, and it became clear that the machining would not only be very difficult, but it would be quite expensive as well. Conventional CNC machining could not produce the required geometry, and the most viable option for machining the cavity and core was with wire-EDM, a slow and costly process. Since neither the designers nor machinists could be sure of how the final part would behave after molding, the money for an expensive tool could not be invested. The
project became shelved for one year but was revived when other research work demonstrating the viability of direct SL tooling was discovered.
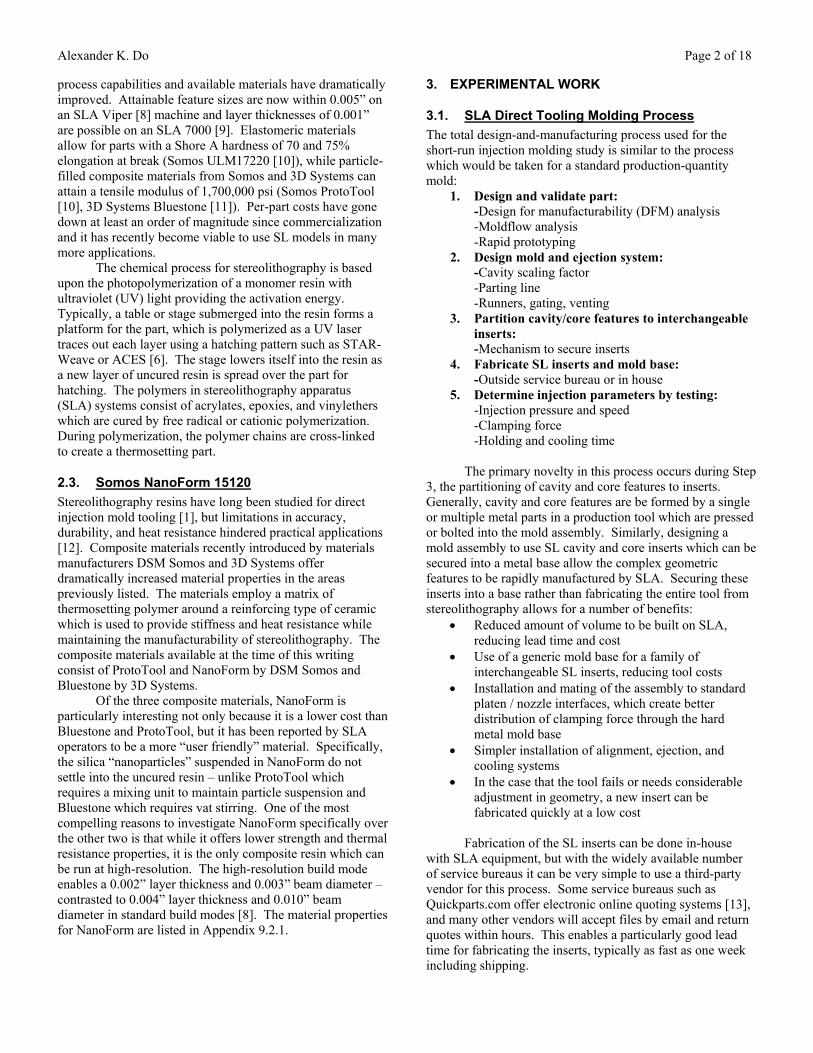
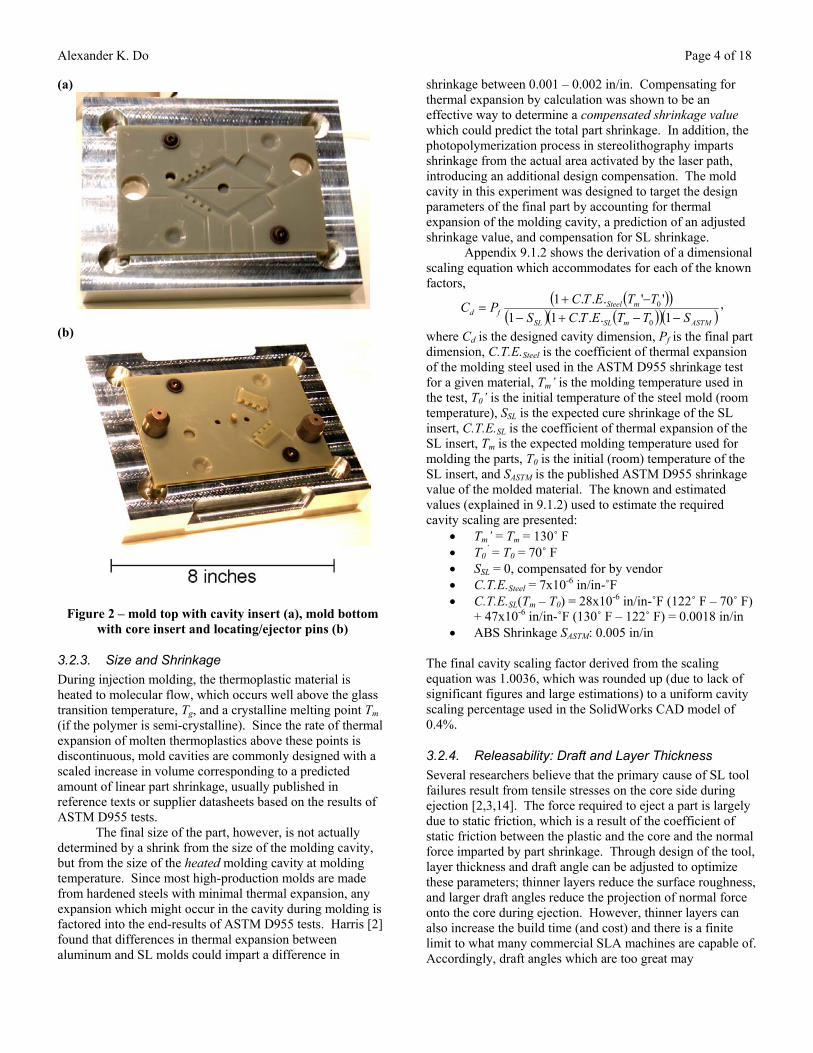
3.2.2. Interchangeable Cavity and Core Inserts The mold assembly consisted of aluminum blocks for alignment and distribution of clamping force, SL cavity and core inserts secured by flange screws, two hardened steel locating pins, and two hardened steel ejector pins. No active cooling was designed into the mold assembly – instead the mold would need to be air-cooled between shots. The cavity and core inserts for the mold assembly were designed to minimize volume and thickness so that the cost of the SL inserts would be minimal. The x and y-dimensions of the cavity and core inserts were 6” x 4”, and the z-dimensions were 0.4” and 0.25” respectively. The aluminum base parts measured 8” x 6” x ~1.25”. The pockets in the aluminum base were also designed with 0.015” of relief above the length and width dimensions of the inserts, so that any thermal expansion of the inserts would be unbounded. The locating pins were pressed into the aluminum blocks to align the cavity and core. The ejection method is discussed in further detail in Section 3.2.5. The aluminum used was 6061-T6 for its ease of machining. The inserts were fabricated by Protogenic Inc. with Somos NanoForm 15120 on an SLA Viper at a high-resolution build with 0.002” layer thickness. STL files were sent to the service bureau to make the parts, exported from SolidWorks CAD software with 0.00058” deviation tolerance and a 2.1˚ angle tolerance to ensure that limitations in accuracy were at the machine-level and not in the 3D data. Except for basic support removal and UV/thermal post-curing, no added post-processing, such as polishing or finishing inside diameters of holes, was used on the inserts so that issues resulting from the SLA process could be analyzed. An analysis of the stresses in the SL inserts predicted a factor of safety (FOS) of 3 before failure from compressive yielding (Appendix 9.1.1) during injection, and an FOS greater than 10 for failure during clamping. Figures 2a and 2b show the mold assembly for the cavity and core, respectively.
Alexander K. Do Page 4 of 18
(a)
(b)
Figure 2 – mold top with cavity insert (a), mold bottom
with core insert and locating/ejector pins (b)
3.2.3. Size and Shrinkage During injection molding, the thermoplastic material is heated to molecular flow, which occurs well above the glass transition temperature, Tg, and a crystalline melting point Tm (if the polymer is semi-crystalline). Since the rate of thermal expansion of molten thermoplastics above these points is discontinuous, mold cavities are commonly designed with a scaled increase in volume corresponding to a predicted amount of linear part shrinkage, usually published in reference texts or supplier datasheets based on the results of ASTM D955 tests.
The final size of the part, however, is not actually determined by a shrink from the size of the molding cavity, but from the size of the heated molding cavity at molding temperature. Since most high-production molds are made from hardened steels with minimal thermal expansion, any expansion which might occur in the cavity during molding is factored into the end-results of ASTM D955 tests. Harris [2] found that differences in thermal expansion between aluminum and SL molds could impart a difference in
shrinkage between 0.001 – 0.002 in/in. Compensating for thermal expansion by calculation was shown to be an effective way to determine a compensated shrinkage value which could predict the total part shrinkage. In addition, the photopolymerization process in stereolithography imparts shrinkage from the actual area activated by the laser path, introducing an additional design compensation. The mold cavity in this experiment was designed to target the design parameters of the final part by accounting for thermal expansion of the molding cavity, a prediction of an adjusted shrinkage value, and compensation for SL shrinkage. Appendix 9.1.2 shows the derivation of a dimensional scaling equation which accommodates for each of the known factors,
( )( )( ) ( )( )( )ASTMmSLSL
mSteelfd STTETCS
TTETCPC−−+−
−+=
1...11''...1
0
0 ,
where Cd is the designed cavity dimension, Pf is the final part dimension, C.T.E.Steel is the coefficient of thermal expansion of the molding steel used in the ASTM D955 shrinkage test for a given material, Tm’ is the molding temperature used in the test, T0’ is the initial temperature of the steel mold (room temperature), SSL is the expected cure shrinkage of the SL insert, C.T.E.SL is the coefficient of thermal expansion of the SL insert, Tm is the expected molding temperature used for molding the parts, T0 is the initial (room) temperature of the SL insert, and SASTM is the published ASTM D955 shrinkage value of the molded material. The known and estimated values (explained in 9.1.2) used to estimate the required cavity scaling are presented:
• Tm’ = Tm = 130˚ F • T0
’ = T0 = 70˚ F • SSL = 0, compensated for by vendor • C.T.E.Steel = 7x10⁻⁶ in/in-˚F • C.T.E.SL(Tm – T0) = 28x10-6 in/in-˚F (122˚ F – 70˚ F)
+ 47x10-6 in/in-˚F (130˚ F – 122˚ F) = 0.0018 in/in • ABS Shrinkage SASTM: 0.005 in/in
The final cavity scaling factor derived from the scaling equation was 1.0036, which was rounded up (due to lack of significant figures and large estimations) to a uniform cavity scaling percentage used in the SolidWorks CAD model of 0.4%.
3.2.4. Releasability: Draft and Layer Thickness Several researchers believe that the primary cause of SL tool failures result from tensile stresses on the core side during ejection [2,3,14]. The force required to eject a part is largely due to static friction, which is a result of the coefficient of static friction between the plastic and the core and the normal force imparted by part shrinkage. Through design of the tool, layer thickness and draft angle can be adjusted to optimize these parameters; thinner layers reduce the surface roughness, and larger draft angles reduce the projection of normal force onto the core during ejection. However, thinner layers can also increase the build time (and cost) and there is a finite limit to what many commercial SLA machines are capable of. Accordingly, draft angles which are too great may

Alexander K. Do Page 5 of 18
compromise the design of the part. Harris’ study of ejection forces in SL5190 tooling [3] shown in Figure 3 demonstrate that there is a linear relationship between ejection force and draft angle and a non-linear relationship between ejection force and layer thickness, with layer thickness having a much bigger impact than draft angle.
Figure 3 - Ejection force as a result of draft angle
and layer thickness [3]
From our particular vendor, the marginal cost from 0.004” layer thickness to 0.002” was 33% more so 0.002” was chosen as the layer thickness. A draft angle of 1˚ on all faces would not compromise the geometric features in the design so that was used as a minimum value for draft.
3.2.5. Ejection Examination of the mold geometry suggested that most forces resulting from part shrinkage would be concentrated around the pin on the core side of the mold. To aid ejection, the mold was designed with one 3/16” ejector pin on each sides of the core pin for manual ejection, shown in Figure 4a. There was early speculation that shrinkage of the teeth features on the cavity side would cause sticking during mold opening, but a cooled and hardened sprue could be used during mold separation as an ejector to keep the part on the core side. (a) (b)
Figure 4 - ejector pins from above (a), gate location and dimensions (b)
3.2.6. Gating and Venting The part was gated from the sprue (eliminating the need for a runner), with a flat gate at the parting line which was 0.280” wide and 0.032” thick, shown in Figure 4b. This gate thickness was smaller than the recommended 40 to 90% of wall thickness [15], which was 0.120” around the perimeter of the part and 0.080” in the center. This small gate thickness was a result of a CAD design error and was originally intended to be 0.050” thick. Between molding runs the gate thickness was eventually increased by approximately 0.010” to 0.020” which aided in molding. The high-resolution 0.002” build thickness allowed the addition of parting line vents to allow removal of air from the cavity to aid in part fill. Primary vents must be thin enough to prevent plastic from leaving the cavity, and Bryce [15] recommends vents for ABS which are 0.002” deep. Four vents were located at each of the part corners which were 0.25” wide by 0.15” long. The short length was designed to reduce clogging of the vents by moisture or other condensation from the plastic and mold-release spray. These vents opened into larger channels, referred to as secondary vents, which were 0.020” deep, running to outside atmosphere. Figure 5 shows the vents designed into the cavity insert. Additional venting was located at the teeth features, with a different venting strategy used for each tooth block to determine the minimal venting required at the teeth. The four combinations used were: no venting, 0.002” deep pressure relief gaps (lower right of cavity in Figure 5) which did not go to outside atmosphere, primary vents which went directly to outside atmosphere, and primary vents which fed into a secondary vent leading to outside atmosphere (upper right of cavity in Figure 5).
Figure 5 - Mold cavity design showing venting system
3.2.7. Total Cost and Time to Develop Once the design was finalized, it took a couple of weeks to locate and consult with vendors for the machining and stereolithography process. The effort it took to modify the original mold design to use cavity and core inserts was minimal. Here is a breakdown of the costs and lead times for each part of the mold assembly:
0.002” deep
0.020” deep
0.280” wide
0.032” thick
s
ejector pins
core pin sprue
Alexander K. Do Page 6 of 18
• Local shop-machined aluminum: o raw material – $100 o setup and machining – $1100 o machine time – 4 hours o lead time – one week
• SL from Protogenic Inc.: $1200 o 0.002” layer thickness o machine time – 24 hours total,
plus 5-6 hours curing o lead time – one week
• Alignment and ejection hardware: $20 • TOTAL COST: Less than $2,500 • TOTAL LEAD TIME: One week
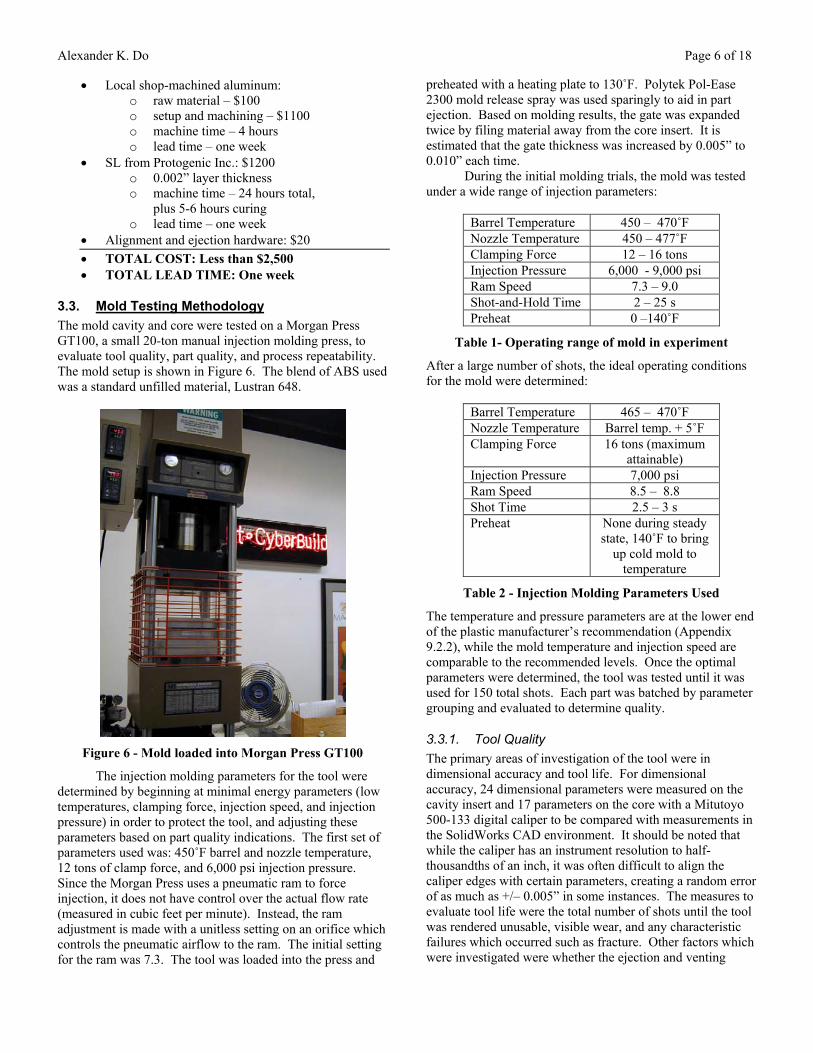
3.3. Mold Testing Methodology The mold cavity and core were tested on a Morgan Press GT100, a small 20-ton manual injection molding press, to evaluate tool quality, part quality, and process repeatability. The mold setup is shown in Figure 6. The blend of ABS used was a standard unfilled material, Lustran 648.
Figure 6 - Mold loaded into Morgan Press GT100
The injection molding parameters for the tool were determined by beginning at minimal energy parameters (low temperatures, clamping force, injection speed, and injection pressure) in order to protect the tool, and adjusting these parameters based on part quality indications. The first set of parameters used was: 450˚F barrel and nozzle temperature, 12 tons of clamp force, and 6,000 psi injection pressure. Since the Morgan Press uses a pneumatic ram to force injection, it does not have control over the actual flow rate (measured in cubic feet per minute). Instead, the ram adjustment is made with a unitless setting on an orifice which controls the pneumatic airflow to the ram. The initial setting for the ram was 7.3. The tool was loaded into the press and
preheated with a heating plate to 130˚F. Polytek Pol-Ease 2300 mold release spray was used sparingly to aid in part ejection. Based on molding results, the gate was expanded twice by filing material away from the core insert. It is estimated that the gate thickness was increased by 0.005” to 0.010” each time.
During the initial molding trials, the mold was tested under a wide range of injection parameters:
Barrel Temperature 450 – 470˚F Nozzle Temperature 450 – 477˚F Clamping Force 12 – 16 tons Injection Pressure 6,000 - 9,000 psi Ram Speed 7.3 – 9.0 Shot-and-Hold Time 2 – 25 s Preheat 0 –140˚F
Table 1- Operating range of mold in experiment
After a large number of shots, the ideal operating conditions for the mold were determined:
Barrel Temperature 465 – 470˚F Nozzle Temperature Barrel temp. + 5˚F Clamping Force 16 tons (maximum
attainable) Injection Pressure 7,000 psi Ram Speed 8.5 – 8.8 Shot Time 2.5 – 3 s Preheat None during steady
state, 140˚F to bring up cold mold to
temperature
Table 2 - Injection Molding Parameters Used
The temperature and pressure parameters are at the lower end of the plastic manufacturer’s recommendation (Appendix 9.2.2), while the mold temperature and injection speed are comparable to the recommended levels. Once the optimal parameters were determined, the tool was tested until it was used for 150 total shots. Each part was batched by parameter grouping and evaluated to determine quality.
3.3.1. Tool Quality The primary areas of investigation of the tool were in dimensional accuracy and tool life. For dimensional accuracy, 24 dimensional parameters were measured on the cavity insert and 17 parameters on the core with a Mitutoyo 500-133 digital caliper to be compared with measurements in the SolidWorks CAD environment. It should be noted that while the caliper has an instrument resolution to half-thousandths of an inch, it was often difficult to align the caliper edges with certain parameters, creating a random error of as much as +/– 0.005” in some instances. The measures to evaluate tool life were the total number of shots until the tool was rendered unusable, visible wear, and any characteristic failures which occurred such as fracture. Other factors which were investigated were whether the ejection and venting
Alexander K. Do Page 7 of 18
systems had been properly designed. During the experimentation, it was determined that mold temperature played a significant role in determining the part quality, so a Mannix IRT4 infrared thermometer was used to measure the mold temperature at various locations between injection cycles.
3.3.2. Part Quality The intended purpose of the parts was to study their usability in the assembled rhomboid form, and learn how to adjust certain design parameters to produce a revised tool. The parts were primarily examined for aesthetic qualities such as warp, sink, fill, and surface quality, and dimensional accuracy to verify whether they would be within the predicted size. The same Mitutoyo caliper was used to measure several dimensional parameters on the final molded parts. For shrinkage calculations, cavity features corresponding to the measured part dimensions were measured between molding cycles to attain the heated cavity dimensions. The teeth on the final parts were also studied to find out if any particular strategy of tooth block venting worked better: no vent, pressure relief only, primary to outside atmosphere, primary plus secondary.
3.3.3. Process Repeatability For process repeatability, the primary criterion used was to see whether part quality could be reasonably controlled from shot to shot. As part of this test, the cycle times (injection, part cooling, open close, mold cooling) were adjusted to determine if a steady-state molding cycle could be implemented on this tool. Unfortunately the injection timer on Morgan Press consisted of analog electronics which were in disrepair and could not be used to control the shot time. All of the timing was controlled by hand, and measured with a digital watch or timer. This limited the timing resolution to being within one second only.
4. RESULTS
4.1. Tool Quality
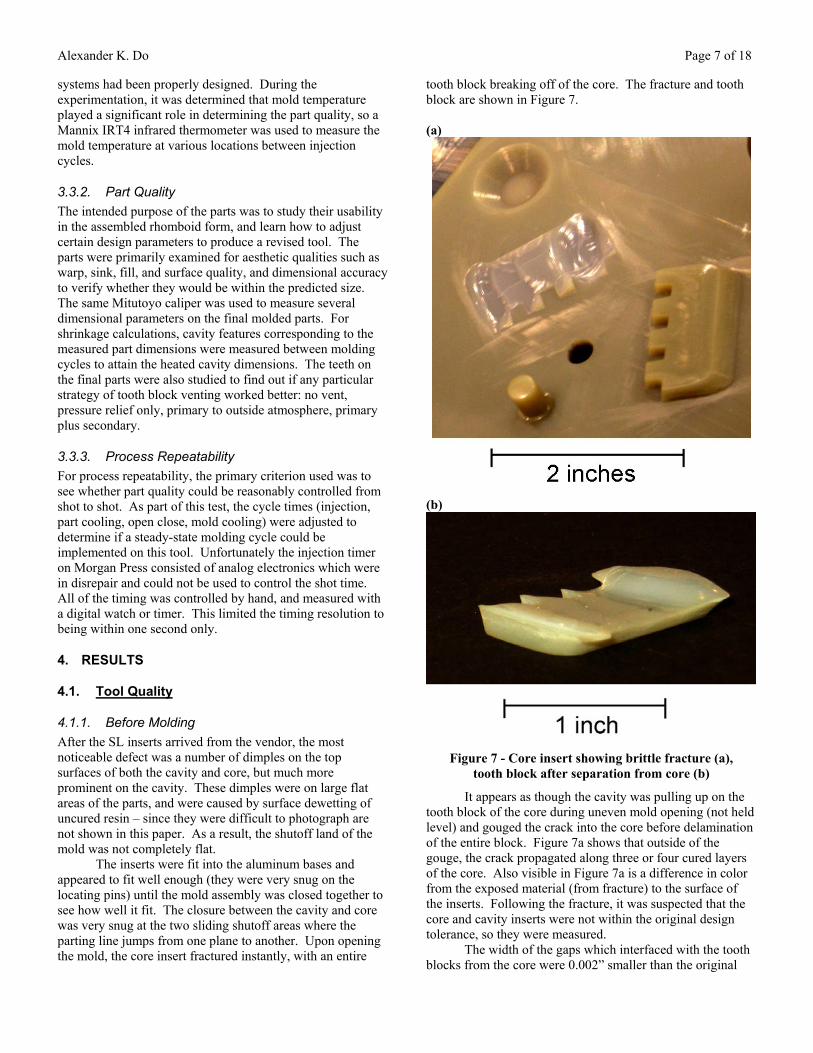
4.1.1. Before Molding After the SL inserts arrived from the vendor, the most noticeable defect was a number of dimples on the top surfaces of both the cavity and core, but much more prominent on the cavity. These dimples were on large flat areas of the parts, and were caused by surface dewetting of uncured resin – since they were difficult to photograph are not shown in this paper. As a result, the shutoff land of the mold was not completely flat. The inserts were fit into the aluminum bases and appeared to fit well enough (they were very snug on the locating pins) until the mold assembly was closed together to see how well it fit. The closure between the cavity and core was very snug at the two sliding shutoff areas where the parting line jumps from one plane to another. Upon opening the mold, the core insert fractured instantly, with an entire
tooth block breaking off of the core. The fracture and tooth block are shown in Figure 7. (a)
(b)
Figure 7 - Core insert showing brittle fracture (a),
tooth block after separation from core (b)
It appears as though the cavity was pulling up on the tooth block of the core during uneven mold opening (not held level) and gouged the crack into the core before delamination of the entire block. Figure 7a shows that outside of the gouge, the crack propagated along three or four cured layers of the core. Also visible in Figure 7a is a difference in color from the exposed material (from fracture) to the surface of the inserts. Following the fracture, it was suspected that the core and cavity inserts were not within the original design tolerance, so they were measured.
The width of the gaps which interfaced with the tooth blocks from the core were 0.002” smaller than the original
Alexander K. Do Page 8 of 18
dimensions while the block which fractured was 0.003” wider at the base than designed. In total, 24 cavity parameters and 17 core parameters were measured, resulting in 11 parameters in the cavity and 4 in the core which were more than 0.005” from the designed dimensions. Two of the larger offsets, coming from approximately 0.010” overshoot of the plate thicknesses of both inserts, were later excluded from analysis since the vendor stated they would not be within specification without post-processing (as a result of the necessary support base during the SLA process). The offsets from the design specifications of the remaining 39 measurements ranged from +0.005” to –0.027”, with a mean value of –0.004” and a standard deviation of 0.006”.
Following the observations in dimensional accuracy, the inserts needed some manual rework with sandpaper and other polishing agents to fit with each other, the locating pins, and ejector pins. After reducing its size, the fractured block was bonded back to the insert with a cyanoacrylate adhesive.
4.1.2. During and After Molding
Figure 8 - Shot 1 in mold (sprue removed)
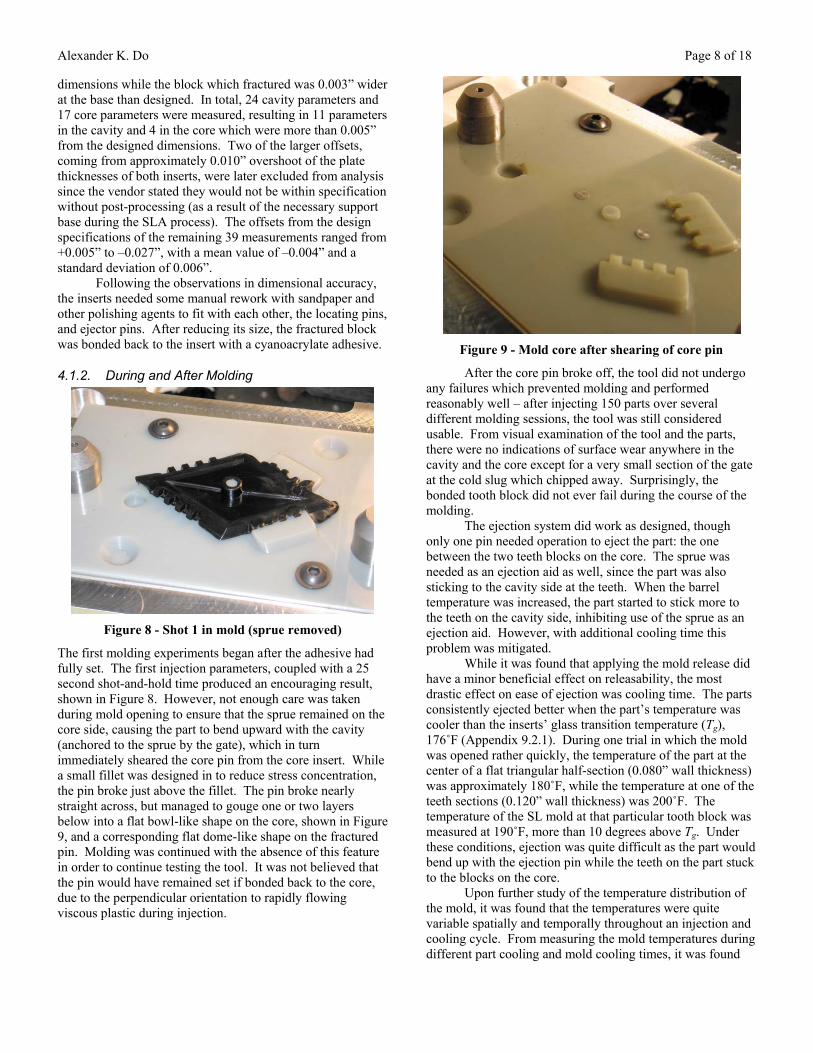
The first molding experiments began after the adhesive had fully set. The first injection parameters, coupled with a 25 second shot-and-hold time produced an encouraging result, shown in Figure 8. However, not enough care was taken during mold opening to ensure that the sprue remained on the core side, causing the part to bend upward with the cavity (anchored to the sprue by the gate), which in turn immediately sheared the core pin from the core insert. While a small fillet was designed in to reduce stress concentration, the pin broke just above the fillet. The pin broke nearly straight across, but managed to gouge one or two layers below into a flat bowl-like shape on the core, shown in Figure 9, and a corresponding flat dome-like shape on the fractured pin. Molding was continued with the absence of this feature in order to continue testing the tool. It was not believed that the pin would have remained set if bonded back to the core, due to the perpendicular orientation to rapidly flowing viscous plastic during injection.
Figure 9 - Mold core after shearing of core pin
After the core pin broke off, the tool did not undergo any failures which prevented molding and performed reasonably well – after injecting 150 parts over several different molding sessions, the tool was still considered usable. From visual examination of the tool and the parts, there were no indications of surface wear anywhere in the cavity and the core except for a very small section of the gate at the cold slug which chipped away. Surprisingly, the bonded tooth block did not ever fail during the course of the molding.
The ejection system did work as designed, though only one pin needed operation to eject the part: the one between the two teeth blocks on the core. The sprue was needed as an ejection aid as well, since the part was also sticking to the cavity side at the teeth. When the barrel temperature was increased, the part started to stick more to the teeth on the cavity side, inhibiting use of the sprue as an ejection aid. However, with additional cooling time this problem was mitigated.
While it was found that applying the mold release did have a minor beneficial effect on releasability, the most drastic effect on ease of ejection was cooling time. The parts consistently ejected better when the part’s temperature was cooler than the inserts’ glass transition temperature (Tg), 176˚F (Appendix 9.2.1). During one trial in which the mold was opened rather quickly, the temperature of the part at the center of a flat triangular half-section (0.080” wall thickness) was approximately 180˚F, while the temperature at one of the teeth sections (0.120” wall thickness) was 200˚F. The temperature of the SL mold at that particular tooth block was measured at 190˚F, more than 10 degrees above Tg. Under these conditions, ejection was quite difficult as the part would bend up with the ejection pin while the teeth on the part stuck to the blocks on the core.
Upon further study of the temperature distribution of the mold, it was found that the temperatures were quite variable spatially and temporally throughout an injection and cooling cycle. From measuring the mold temperatures during different part cooling and mold cooling times, it was found

Alexander K. Do Page 9 of 18
that the amplitude of a thermal cycle for a given section was generally at least 60˚F in areas which contacted the ABS plastic. Specifically, the temperature of the repaired tooth block typically went from 120˚F to at least 190˚F during the injection cycle. Without an instrument to continuously monitor the temperature through the molding cycle, the peak temperatures could not be determined, so instead the mold was opened with minimal cooling time in some instances to record the temperatures of the hotter areas. Figure 10 shows a thermal map of the mold temperatures after part ejection, with each measurement taken immediately after part ejection under steady-state molding. The map shows a high spatial variation of temperatures in the mold, with as much as 60-degree difference between molding areas and shutoff on the inserts. It should be noted that during peak temperatures this difference was closer to the order of 100˚F. (a)
(b)
Figure 10 - Mold temperature distribution after part
ejection in cavity (a), core (b) (˚F)
With persistent use, the SL inserts began to change color in certain areas, shown in Figure 11. (a)
(b)
Figure 11 - Visible discoloration in cavity (a) and core (b)
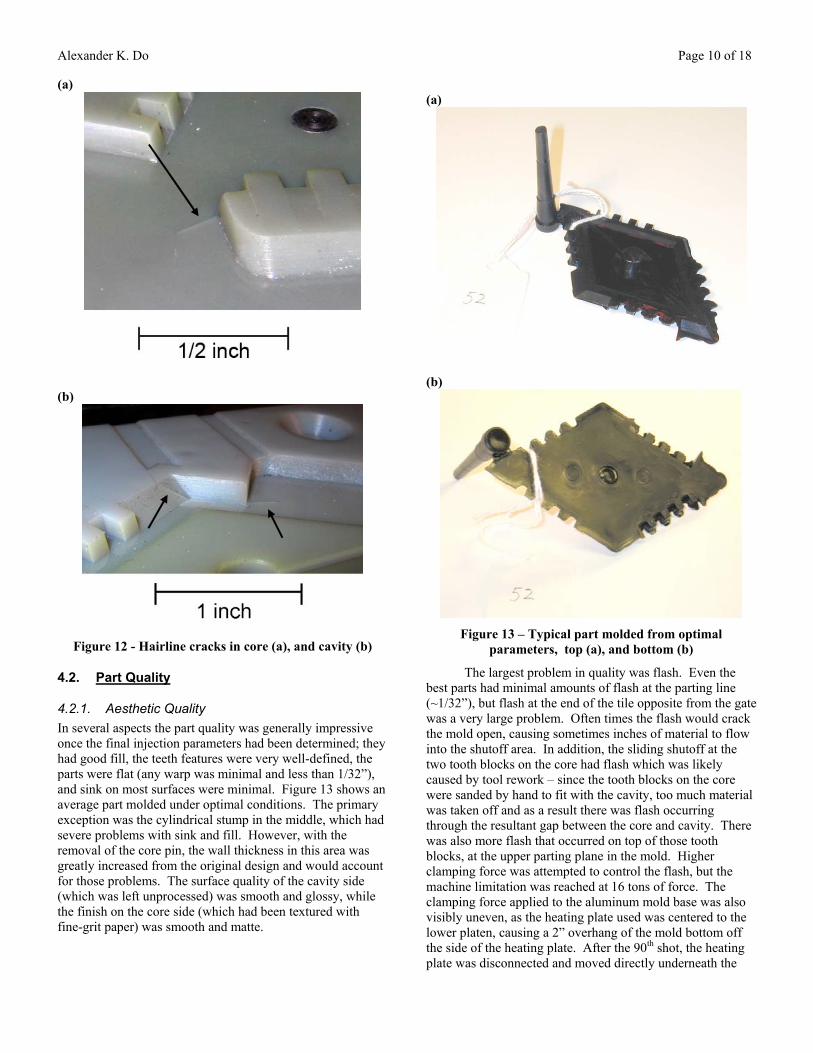
After 90 shots, a small hairline crack was discovered in the core of the mold, seen in Figure 12a. The crack measured about 0.21” and extended from the corner of the base of the repaired tooth block along the approximate outline of the cavity parting line. The crack was very difficult to see in most lighting conditions and there was no noticeable gap. Another similar crack was discovered after 100 shots in the cavity, pictured in Figure 12b. This crack was considerably larger, measuring nearly 0.84” long. The crack ran from a corner of the parting line vent down to the part top (base-layer of the cavity), along the edge of the cavity wall, and into the shutoff area where the cavity meets a tooth block from the core. It is not known when the cracks first developed, as they were not obvious. Once they were discovered, neither crack seemed to propagate with continued cycling for the rest of the molding experiment.
160˚
110˚ 125˚
145˚
98˚
106˚
147˚
160˚
85˚
90˚ 140˚
120˚
105˚
103˚
95˚
90˚
Alexander K. Do Page 10 of 18
(a)
(b)
Figure 12 - Hairline cracks in core (a), and cavity (b)
4.2. Part Quality
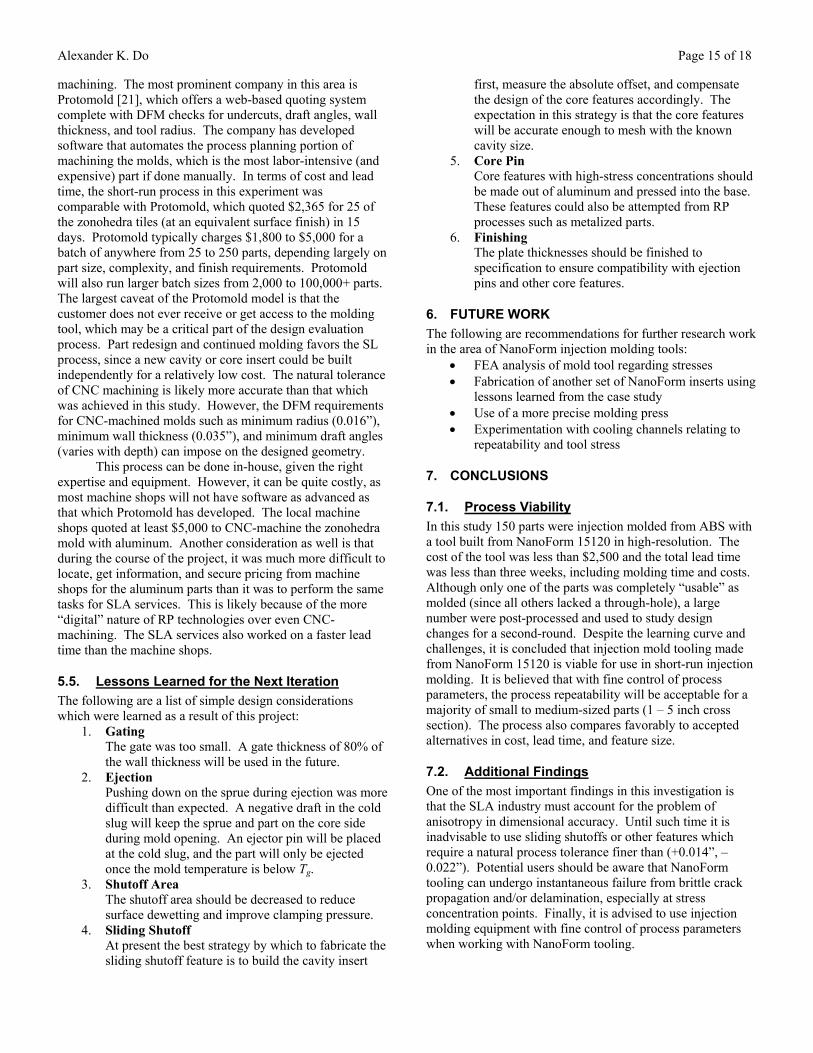
4.2.1. Aesthetic Quality In several aspects the part quality was generally impressive once the final injection parameters had been determined; they had good fill, the teeth features were very well-defined, the parts were flat (any warp was minimal and less than 1/32”), and sink on most surfaces were minimal. Figure 13 shows an average part molded under optimal conditions. The primary exception was the cylindrical stump in the middle, which had severe problems with sink and fill. However, with the removal of the core pin, the wall thickness in this area was greatly increased from the original design and would account for those problems. The surface quality of the cavity side (which was left unprocessed) was smooth and glossy, while the finish on the core side (which had been textured with fine-grit paper) was smooth and matte.
(a)
(b)
Figure 13 – Typical part molded from optimal
parameters, top (a), and bottom (b)
The largest problem in quality was flash. Even the best parts had minimal amounts of flash at the parting line (~1/32”), but flash at the end of the tile opposite from the gate was a very large problem. Often times the flash would crack the mold open, causing sometimes inches of material to flow into the shutoff area. In addition, the sliding shutoff at the two tooth blocks on the core had flash which was likely caused by tool rework – since the tooth blocks on the core were sanded by hand to fit with the cavity, too much material was taken off and as a result there was flash occurring through the resultant gap between the core and cavity. There was also more flash that occurred on top of those tooth blocks, at the upper parting plane in the mold. Higher clamping force was attempted to control the flash, but the machine limitation was reached at 16 tons of force. The clamping force applied to the aluminum mold base was also visibly uneven, as the heating plate used was centered to the lower platen, causing a 2” overhang of the mold bottom off the side of the heating plate. After the 90th shot, the heating plate was disconnected and moved directly underneath the

Alexander K. Do Page 11 of 18
mold bottom to eliminate the overhang. This improved the flash at the opposite end of the gate but did not eliminate it. Defects which were prominent in earlier runs (before identifying the optimal parameters) were generally characterized by flow lines. In many cases the flow lines were fairly deep and marked with ripples, appearing to be formed by cold-flowing plastic. To mitigate the flow lines the gate was opened up twice and the barrel temperature was increased. However as the temperature was increased, the tendency for sink increased as well. The quality of the teeth features did not appear to favor any one venting strategy over another. Generally, fill was not a problem and as stated earlier there was a consistent amount of flash (though minimal) in these areas.
4.2.2. Shrinkage The dimensions of the cavity during molding were demonstrably different than when at room temperature, so measurements of the cavity during molding were used to determine the dimensional accuracy of the molded parts. However, it was only possible to measure the heated cavity dimensions after the mold had cooled enough to open, so the measurements may not correspond to the actual sizes imparted onto the molten plastic. Because the cavity and core inserts were cooling as the measurements were taken, it was necessary to take the measurements over multiple cycles and very quickly.
Of the measurements, the three largest parameters were used for calculating part shrinkages from the cavity at room temperature and when heated. The two parameters which expanded the most were the corner-to-corner length and width of the cavity, which expanded 0.011” and 0.014” respectively. The normal distance between the tile edges was also measured and used for shrinkage calculations, presented below in Table 3. The measurements are also compared in the table to the original design dimensions to gauge error in scaling the cavity size.
Many of the other parameters measured were too small in relation to the instrument error to use for meaningful shrinkage results. However, an interesting result which was
verified through repeated measurement was that the width of the individual teeth experienced a “negative shrinkage” from the original cavity dimensions. The average tooth width on the molded part was 0.1131”, compared to an average cavity width of 0.1086”. When these features were measured on the cavity after ejection, they were found to be only 0.001” to 0.002” larger with the tooth block at 120˚F.
4.3. Process Repeatability Repeatability in part quality was fairly difficult to attain, and was not achieved to satisfaction. The variability in flash was fairly high, and the nature of the sink tended to vary a bit from part to part. Dimensional stability of the length and width parameters was very repeatable, with parts lining up with each other when placed back-to-back.
In the earlier cycles, the heating plate was left on at 130˚F throughout the process, but it was causing the mold to cool very slowly. It was found that preheating a cold mold to 140˚F and then turning off the heating plate worked better, bringing the mold to steady state more quickly. A somewhat steady state cycle was achieved in spite of variations in flash and sink – hindered slightly by both the timing of manual operations (such as opening the mold) and thermal control of the mold assembly. The ideal shot time was somewhere between 2 and 3 seconds, with too short of a time causing short-shots and too long of a time causing potentially large amounts of flash. The approximate cycle times attained under the optimal molding conditions (Table 2) are presented here:
Injection and packing 2.5 s, +/– .5 s Holding (no packing pressure)
10 s
Part cooling in mold 45 s Mold opening and ejection 20 – 30 s Mold cooling and hopper refill 20 – 30 s Alignment and clamping 10 – 15 s
TOTAL 2 min
Table 3 – Cycle time under steady state
Part Heated Cavity
% Shrinkage, Heated
Unheated Cavity % Shrinkage Design % Error
Length 3.3550” 3.3800” 0.70 3.3685” 0.40 3.4027” 1.4 Width 2.0690” 2.0910” 1.0 2.0775” 0.41 2.1028” 1.61
Normal 1.7810” 1.8045” 0.86 1.7980” 0.50 1.7888” 0.011
Table 4 - Part dimensions, compared to heated cavity, cavity at room temperature, and original design dimensions

Alexander K. Do Page 12 of 18
5. DISCUSSION
5.1. Tool Design and Quality
5.1.1. Dimensional Accuracy The primary issue with the tool was that the dimensional measurements revealed serious anisotropy in accuracy. A histogram of offset errors is presented in Table 5. The histogram shows the majority of the offsets fall within the bin for [0, –0.005”). The table also shows a strong weighting toward negative offset errors, corroborating the mean value of –0.004”. From these two parts, the resultant natural tolerance (following the +/– 3σ model [16]) of NanoForm in high-resolution is determined as (+0.014”, –0.022”).
Bin Frequency –0.030” 0 –0.025” 1 –0.020” 1 –0.015” 0 –0.010” 2 –0.005” 8
0” 21 0.005” 6 More 0
Table 5 - Histogram data for cavity and core offset errors
Since there was a limit to measurement accuracy with calipers for many of the dimensions, as well as a process capability limitation outlined by the vendor (+/– 0.005”), all offsets which were greater in magnitude than 0.005” were compared. What was found was that of these 13 larger offsets, 11 of the errors were from “female” type features, consisting of inside diameters of holes or widths of cavity/gap features. The other types of features which were characterized were “male” features, which consisted of diameters and widths of protruding material, and “depth” features, which were dimensioned along the layer axis (z-axis). This characterization of the 41 parameters showed the following trends:
• female features smaller than designed (all); mean offset –0.008”, standard deviation of 0.006”
• male features very accurate (most); mean offset –0.001”, standard deviation of 0.004”
• depth features within 0.002” layer resolution (all except plate thickness)
• hole centers on target (x-y location) Included as a subset of the depth features were also the primary vents, which were successfully built to one layer. Conversation with an industry operator confirmed that they had seen a similar issue in dimensional accuracy, though no publications on the matter are known to exist at the time of this writing. The resulting anisotropy in accuracy can be identified as the cause of the initial tooth block fracture; the smaller
cavity was press fit into the slightly larger block. It is not believed that this error could be accounted for beforehand in the design, as the sliding shutoff required a very narrow tolerance. The offset errors of the female features were not consistent with the original design parameters to neither an absolute amount nor linear ratio. The offset magnitudes ranged from 0.002” to 0.013” and the percent error from 0.2% to 5%. As a result, it is highly unlikely that a designer would be able to compensate for this in a CAD model. It is not known whether the problems in accuracy were a result of improper configuration of the SLA machine used to build the part, but that is not believed to be the case since the accuracy of male features was within expectation and considerably better than that of female features. At the time of this writing, interviews with three SLA processors revealed that there has not been much industry experience with the NanoForm material built in high-resolution. More investigation into the interaction between material properties and process control are necessary to determine the cause of the anisotropy.
The errors in plate thickness which were excluded from analysis can have an effect on the mold construction as well, as they affect hybridization with other components such as the ejection system and any metal inserts secured to the base. For example, the ejector pins are mounted onto an ejector plate from below, which must be aligned such that the pins are flush with the surface of the core; any variations in the core thickness will require adjustment of the ejection system. It is therefore recommended to request finishing of the insert bases from the service bureau or to finish them independently with a milling machine.
5.1.2. Thermal Management The second-most important issue arising from the study was thermal management; the variability in temperature affected cycle times, part quality, repeatability, and possibly tool life. Without an active cooling system, the cycle times in this study were much longer than what could be expected from a metal tool, even one without active cooling as well. The thermal conductivity of NanoForm is 0.09 lbs./s-˚F (0.7 W/m-K) (Appendix 9.2.1), compared to that of aluminum: 25 lbs./s-˚F (200 W/m-K) [17] – the ratio between the two is greater than 275! An active cooling system, such as liquid coolant pumped through copper piping between the insert and the base, may reduce the cycle time but could also introduce more stresses into the tool that would affect its life.
The results shown in Figure 10 and knowledge of the thermal cycling amplitude suggest that large internal stresses could have been occurring during the injection and cooling cycles, since the thermal gradients were great and the cooling rate was uneven within the mold. While fully constrained thermal expansion would cause compressive stresses which would not lead to crack propagation, differences in cooling rate would create tensile stresses which would lead to crack growth. It is very likely that such stresses would have caused the two fractures pictured in Figure 12. Both of the cracks initiated from stress concentration points and traced along the outline between cavity and shutoff; the cooling rate at an

Alexander K. Do Page 13 of 18
interface with the molded part would be expected to be slower than at the shutoff.
Research by Ahrens, Riberio Jr. and Beal [18] to improve cooling in SL molds has shown increased efficiency in cooling, but has yet to demonstrate improvements in quality, repeatability, and tool life. Active pumping of heated liquid may help to stabilize the mold temperature as well. Ultimately, finite element analysis of the tool is necessary to understand whether active cooling and/or heating would improve or degrade the tool life.
Another alternative method to aid thermal management of the mold is electroplating of the core and cavity inserts. A process by RePliForm Inc. deposits 0.002” to 0.003” of copper and nickel on the top surface of an SL insert. Metal-coating of the core and cavity would not only increase their impact and abrasion resistance, but it would also transfer heat much better, likely reducing cooling time and thermal gradients. This would likely increase the tool life, but uniformity of the coating over sharp or narrow geometric features is questionable. In addition, differences in thermal expansion could lead to delamination due to fatigue. For these specific inserts, the cost is estimated to be less than $140 per insert, with an expected turn-around time of two days [19].
5.1.3. Cavity Size and Shrinkage While the problems with dimensional accuracy prevented the final part dimensions from being reasonably within predictions, the 0.4% scaling factor used to design the cavity agreed fairly well with the 0.40%, 0.41%, and 0.50% part shrinkage from the cavity size at room temperature. The 0.7% – 1.0% shrinkage values resulting from the heated cavity measurements are larger than the term produced by the ratio:
( )( )( )ASTM
mSteel
STTETC
−−+
1''...1 0 ,
which should produce a shrinkage factor compensated for mold material. Given the values determined in Appendix 9.1.2, the compensated shrinkage should be on the order of 0.54%, which is comparable in magnitude but lower the 0.7% - 1.0% attained values. Some deviation from the predicted compensated shrinkage value is expected since the thermally insulating properties of NanoForm creates high variability in mold temperature, resulting in local variations in cavity expansion and prolonged cooling times which could increase shrinkage and/or sink. In addition, continued thermal expansion of the cavity after the injected parts have set their shape is expected through continued heat transfer between the hot plastic and the mold.
5.1.4. Tool Wear and Other Quality Issues The most prominent types of tool wear which affected part quality were the fractures of the tooth block and core pin. In the tooth block, the fracture line shown in Figure 7 and cycles to failure (one) qualify a very brittle type of failure. This is consistent with both the brittle nature of the material – a high tensile modulus, low tensile strength and high compressive
strength (Appendix 9.2.1) – and the inherent anisotropic nature of parts made from layer-based fabrication processes such as stereolithography.
The core pin is believed to have fractured during ejection, and not during injection. While it is possible that the viscous flowing plastic could have initiated the crack on contact with the pin – the initial strategy of using low-energy parameters may have been detrimental, as the initial molding temperature was relatively low – the even wall thickness and vertical nature of the through-hole in part #1 do not corroborate this. The crack initiated at a stress concentration, as it started the layer directly above the “fillet.” The word fillet is used colloquially due to the discrete reduction of geometry to 0.002” layer thicknesses, especially apparent in very small fillets. The fracture angle of the core pin (straight across) in Figure 9 suggests that the crack propagated by delamination, as only three layers were spanned from the point of initiation to the apex of the gouge. This is to be contrasted to more typical brittle failures in non-layered materials which propagate at an angle of maximum shear stress.
An interesting observation is that the discoloration shown in Figure 11 did not match up with any visible wear on the surface or to the distribution of temperature after ejection shown in Figure 10. It does appear as though the discoloration corresponds to the high-stress locations in the cavity and core, as evidenced by the prominent discoloration about the gate and other low-thickness areas.
Because of the visible surface dewetting in the shutoff areas, the flatness of the shutoff was questionable and may have led to insufficient clamping, which could account for the flash problems. Three SLA operators confirmed that surface dewetting is a known problem when highly viscous SL resins are spread across large flat areas, and the results are even more apparent in the ProtoTool material. One strategy to mitigate this would be to reduce the shutoff area either by trimming the perimeter of the inserts or by creating a stepped platform for the shutoff. This change would lead to a greater apparent clamping pressure from a reduction of the shutoff area. Another strategy would be to try an upright build orientation, building the inserts on their sides such that the z-height would be 4”, eliminating the surface dewetting on the flat surfaces and likely aiding ejection. However, the appreciable increase in z-height, and consequently build time, would increase the cost of the inserts to $1,600, 33% more than when built flat. This orientation would also make the vents difficult to build, as the beam tracing (0.003” beam thickness) is more difficult to consistently control than layer thickness.
5.2. Process Repeatability Many of the problems with repeatability are believed to have been caused by limitations in the equipment. Primarily, the Morgan Press does not support closed-loop control of parameters other than the barrel and nozzle temperature. The other parameters are controlled by analog potentiometers or mechanical valves.

Alexander K. Do Page 14 of 18
The problems with flash are believed to be a result of the following factors:
1. Insufficient clamping force. The Morgan Press GT100 claims a 20-ton clamping capability, but no more than 16 tons of force could be achieved according to the dial indicator.
2. Uneven clamping force. The off-center location of the nozzle seat in the mold likely caused an uneven clamping force imparted from the platen assembly.
3. Poor control of shot weight. Since injection in a Morgan Press is driven by a pneumatic ram and does not use a screw, it is impossible to independently control the volume of the shot, the injection rate, and the injection pressure. In particular, the ram sits above the barrel of semi-molten plastic. Depending upon the exact amount and phase of plastic in the barrel, a different shot amount is delivered for the same injection time.
4. Poor control of shot timing. Using a digital timer or stopwatch to coordinate hand-operations on the machine was incredibly difficult, as the difference between 2 seconds and 3 seconds was often the difference between short-shots and excessive flash.
In addition to the flash, the second major theme in
repeatability was mold temperature. As mentioned earlier, unpredictable behavior of core and cavity temperatures affected the part quality and cycle time, and therefore overall repeatability. Minor variations in sink in the final parts may be acceptable at a prototyping stage, but are not acceptable for a high-yield, tight-tolerance project. For low part volumes however, longer cycle times do not pose a critical disadvantage to the process.
Finally, the gate thickness is believed to have limited the range of injection parameters under which the mold produced good parts. The gate thickness, which was less than 30% of the wall thickness, was simply too small. This caused the part to cool very fast. As the barrel temperature was increased to reduce viscosity, the resulting increased temperature variations in the mold caused repeatability issues such as increased sink and problematic ejection for insufficient cooling times. In this case, a larger gate would have allowed for more a flexible window of processing parameters.
By addressing all of these issues with a larger gate, a more advanced molding press, and an active heating and cooling system, it is believed that part repeatability can be drastically improved.
5.3. Process Viability and Quality If the repeatability can be addressed with more precise molding equipment, nothing in this research indicates that injection molding with NanoForm will not work. 150 parts were produced on the tool, demonstrating a viable tool life and low cost-per-part ($16).
There are a number of particular strengths in the injection molding process investigated:
• The primary DFM restriction in high-resolution mode is that feature sizes are limited by 0.002” layer thickness and limited by a 0.003” laser spot
• Low cost and quick lead time of tool inserts • For a family of similar parts, a single mold base can
be combined with different cavity and core inserts to reduce the total cost of tooling
Of course, a number of weaknesses are specific to this process:
• Dimensional accuracy, as discussed • Tool failure, while sometimes reparable, can be
instantaneous; areas of stress concentration can be particularly vulnerable
• The maximum tool size at high-resolution is recommended 5” (L) x 5” (W) by 10” (H); this is meant to reduce parallax error, as a Viper can actually build up to 10” x 10” x 10”
• Crystallinity (and effectively shrinkage) in semi-crystalline polymers cannot be easily controlled
The final point can be a serious limiting factor in the types of materials which can be accurately and repeatedly molded. Since a metal such as aluminum is 275 times more thermally conductive than NanoForm, the two materials will impart a different thermal cycle upon the molded plastic and as a result a different percent of cyrstallinity, χc, in semi-crystalline polymers. As the percent cyrstallinity increases, not only will the mechanical properties of the molded part change, but the final amount of shrinkage will increase as well. Harris [2] showed that the resultant difference in shrinkage from SL tools is appreciable in a semi-crystalline material such as polyamide 66 (Nylon PA66). In addition, variability in temperature throughout the mold cavity and core are likely to induce uneven cooling, and consequently shrinkage. These unique process characteristics bring about a learning curve. As stated by DSM ProtoComposites Marketing Manager Eva Montgomery, “tool design and processing optimization remain critical differentiators relative to meeting expectations” [20]. While it is the intention of this research to provide information relative to these issues, much of the process knowledge may not be transferable to or from other short-run or production-volume tooling strategies. Even if success is achieved in a NanoForm process, it is not believed that injection parameters can be carried over to a production tool. However, since the NanoForm material properties are not as high-performing as those in metals, tool design parameters such as gate and vent geometry may work equally well in a high-production tool.
5.4. Comparison to the Industry Standard The most popular and likely lowest-cost alternative to this process in short-run injection molding is known as “rapid injection molding.” The term generally describes the fabrication simple aluminum molds made by CNC-
Alexander K. Do Page 15 of 18
machining. The most prominent company in this area is Protomold [21], which offers a web-based quoting system complete with DFM checks for undercuts, draft angles, wall thickness, and tool radius. The company has developed software that automates the process planning portion of machining the molds, which is the most labor-intensive (and expensive) part if done manually. In terms of cost and lead time, the short-run process in this experiment was comparable with Protomold, which quoted $2,365 for 25 of the zonohedra tiles (at an equivalent surface finish) in 15 days. Protomold typically charges $1,800 to $5,000 for a batch of anywhere from 25 to 250 parts, depending largely on part size, complexity, and finish requirements. Protomold will also run larger batch sizes from 2,000 to 100,000+ parts. The largest caveat of the Protomold model is that the customer does not ever receive or get access to the molding tool, which may be a critical part of the design evaluation process. Part redesign and continued molding favors the SL process, since a new cavity or core insert could be built independently for a relatively low cost. The natural tolerance of CNC machining is likely more accurate than that which was achieved in this study. However, the DFM requirements for CNC-machined molds such as minimum radius (0.016”), minimum wall thickness (0.035”), and minimum draft angles (varies with depth) can impose on the designed geometry. This process can be done in-house, given the right expertise and equipment. However, it can be quite costly, as most machine shops will not have software as advanced as that which Protomold has developed. The local machine shops quoted at least $5,000 to CNC-machine the zonohedra mold with aluminum. Another consideration as well is that during the course of the project, it was much more difficult to locate, get information, and secure pricing from machine shops for the aluminum parts than it was to perform the same tasks for SLA services. This is likely because of the more “digital” nature of RP technologies over even CNC-machining. The SLA services also worked on a faster lead time than the machine shops.
5.5. Lessons Learned for the Next Iteration The following are a list of simple design considerations which were learned as a result of this project:
1. Gating The gate was too small. A gate thickness of 80% of the wall thickness will be used in the future.
2. Ejection Pushing down on the sprue during ejection was more difficult than expected. A negative draft in the cold slug will keep the sprue and part on the core side during mold opening. An ejector pin will be placed at the cold slug, and the part will only be ejected once the mold temperature is below Tg.
3. Shutoff Area The shutoff area should be decreased to reduce surface dewetting and improve clamping pressure.
4. Sliding Shutoff At present the best strategy by which to fabricate the sliding shutoff feature is to build the cavity insert
first, measure the absolute offset, and compensate the design of the core features accordingly. The expectation in this strategy is that the core features will be accurate enough to mesh with the known cavity size.
5. Core Pin Core features with high-stress concentrations should be made out of aluminum and pressed into the base. These features could also be attempted from RP processes such as metalized parts.
6. Finishing The plate thicknesses should be finished to specification to ensure compatibility with ejection pins and other core features.
6. FUTURE WORK The following are recommendations for further research work in the area of NanoForm injection molding tools:
• FEA analysis of mold tool regarding stresses • Fabrication of another set of NanoForm inserts using
lessons learned from the case study • Use of a more precise molding press • Experimentation with cooling channels relating to
repeatability and tool stress
7. CONCLUSIONS
7.1. Process Viability In this study 150 parts were injection molded from ABS with a tool built from NanoForm 15120 in high-resolution. The cost of the tool was less than $2,500 and the total lead time was less than three weeks, including molding time and costs. Although only one of the parts was completely “usable” as molded (since all others lacked a through-hole), a large number were post-processed and used to study design changes for a second-round. Despite the learning curve and challenges, it is concluded that injection mold tooling made from NanoForm 15120 is viable for use in short-run injection molding. It is believed that with fine control of process parameters, the process repeatability will be acceptable for a majority of small to medium-sized parts (1 – 5 inch cross section). The process also compares favorably to accepted alternatives in cost, lead time, and feature size.
7.2. Additional Findings One of the most important findings in this investigation is that the SLA industry must account for the problem of anisotropy in dimensional accuracy. Until such time it is inadvisable to use sliding shutoffs or other features which require a natural process tolerance finer than (+0.014”, –0.022”). Potential users should be aware that NanoForm tooling can undergo instantaneous failure from brittle crack propagation and/or delamination, especially at stress concentration points. Finally, it is advised to use injection molding equipment with fine control of process parameters when working with NanoForm tooling.

Alexander K. Do Page 16 of 18
8. ACKNOWLEDGEMENTS For their contributions to this research, the authors wish to acknowledge the following individuals and corporations:
o Dan Odell, UC Berkeley, o Xiaorui Chen, UC Berkeley, o Lisa Pruitt,UC Berkeley, o Tim Nakari and Jason Boh, Protogenic, o Paul and Bret Bordner, Laser Reproductions, o Brian Bauman, DSM Somos, o Mike Daniels, Production Robotics, o Erik Appelbom, Jatco, and o Tom Hagen, Poly-Tek
This project was funded by the Ford Motor Company, CITRIS, and in by the California Energy Commission under Grant Award DR-03-01.
REFERENCES 1. P.M. Dickens and P. Smith, “Stereolithography
Tooling,” Proceedings of the 1st European Conference on Rapid Prototyping, 1992, 309-317.
2. R.A. Harris, H.A. Newlyn, R.J.M. Hague, P.M. Dickens, “Part shrinkage anomalies from stereolithography injection mould tooling,” International Journal of Machine Tools & Manufacture, 2003, Vol. 43, 879-887.
3. R A Harris, H A Newlyn and P M Dickens, “Selection of mould design variables in direct stereolithography injection mould tooling,” Proceedings of the Institution of Mechanical Engineers, Part B, Journal of Engineering Manufacture, 2002, Vol216 No. B4, 499-505.
4. R. Harris, N. Hopkinson, H. Newlyn, R. Hague and P. Dickens, “Layer thickness and draft angle selection for stereolithography injection mould tooling,” International Journal of Production Research, 2002, Vol. 40, No. 3, 719-729.
5. Martyniak, S. A., “Prototype and Limited Production, Spray Metal Tools for Injection and Blow Molding,” Proceedings of the SME Rapid Prototyping and Manufacturing ’93 Conference, Dearborn, Michigan, 1993.
6. Gebhardt, Andreas, Rapid Prototyping, Concinatti, Ohio: Hanser Gardner Publications, Inc., 2003.
7. P M Hackney and K P Pancholi, “Analysis of the application of the Z-Corps three-dimensional printing system for rapid tooling for plastic injection moulded components,” Fifth National Conference on Rapid Design, Prototyping, and Manufacturing, Centre for Rapid Design and Manufacture, Buckingham Chilterns University College, and Lancaster Product Development Unit, Lancaster University, UK, 2004.
8. Viper Data Sheet, 3D Systems. http://3dsystems.com/products/datafiles/viper/datasheets/Viper_final_rev_0303.pdf.
9. SLA 7000 Data Sheet, 3D Systems. http://www.3dsystems.com/products/datafiles/sla7000/datasheets/SLA_7000_system_rev_0204.pdf.
10. Materials Data Sheets page, DSM Somos. http://www.dsm.com/en_US/html/dsms/pd_product_data_sheets.htm.
11. Bluestone Data Sheet, 3D Systems. http://www.3dsystems.com/products/datafiles/accura/datasheets/DS-Accura_Bluestone_nano-composite.pdf.
12. Williams, Jim and Kaufmann, Charles, “Injection Molding with Composite Stereolithography Resins,” SME Rapid Prototyping 2005, Dearborn, Michigan, 2005.
13. Quickparts. http://www.quickparts.com. 14. Jacobs, P.F., “Recent advances in rapid tooling from
stereolithography,” Proceedins of 2nd National Conference on Rapid Prototyping and Tooling Research, Buckinghamshire College, 1996.
15. D. M. Bryce, Plastic Injection Molding … mold design and construction fundamentals. Dearborn, Michigan: Society of Manufacturing Engineers, 1998.
16. Wright, Paul Kenneth, 21st Century Manufacturing. Upper Saddle River, New Jersey: Prentice-Hall Inc., 2001.
17. MatWeb, Material Property Data, http://www.matweb.com.
18. C. H Ahrens, A. S. Riberio Jr, V. E. Beal, “Heat flux canals (HFC) technique: an alternative to cool down stereolithography moulds,” Journal of the Brazilian Society of Mechanical Sciences and Engineering, 2003, Vol. 25, No. 3
19. From a presentation at the DSM Somos Rapid Tooling Roundtable session on June 8, 2005. Information available directly from RePliForm Inc. www.repliforminc.com.
20. E. Montgomery, “Composite SL Materials Paving the Way Fore Advancements in Rapid Tooling,” Time Compression Technologies, May 2005.
21. Protomold. http://www.protomold.com. 22. Morgan Instrustries, Cutting Costs in Short-run
Plastics Injection Molding. Long Beach, California: Twelfth Printing, 1998.

Alexander K. Do Page 17 of 18
9. APPENDIX
9.1. Molding equations
9.1.1. Clamp Force and Injection Pressure The clamping force, Fc, required to keep a mold closed must be greater than the distribution of the pressure of molten plastic in the mold over the projected area on the parting plane, A. The maximum pressure in the cavity is a product of the injection pressure, PI, against a viscosity factor, η [22], which is a function of not only time, but also geometry of the sprue, runner, and gate system. An equation for clamping force Fc is shown below:
APF Ic •≥η [22] Since it is difficult to characterize the viscosity factor, it is more practical in industrial settings to set the clamping force to exceed the injection pressure against the projected area. A measurement in SolidWorks of the area of the molded part projected onto the parting plane was approximately 3.5 in2. Due to the 20-ton clamp force limitation in the Morgan Press GT100, the maximum injection pressure for this part before exceeding clamping could be 11,400 psi. To ensure that the SL inserts would not fail during clamping and injection, a rudimentary comparison between these forces and the maximum compressive strength of the material is sufficient since tensile and shear stresses can be neglected in the loading configuration of the inserts. The maximum compressive strength of NanoForm 15120 as reported by Somos (Appendix 9.2.1) is 34,000 psi. A measurement of the total shutoff area (area loading the clamping force) for the cavity insert in SolidWorks was reported as 16.6 in2. At 20 tons of clamp force, this creates an average normal stress of 2.4 kpsi, allowing a rather large FOS (factor of safety) > 10. Simply comparing the maximum injection pressure of 16,300 psi, corresponding to a plastic pressure of 11,400 psi in the cavity area to the maximum compressive strength allows for an FOS of approximately 3. A more rigid analysis of stresses in the cavity during injection would require finite element analysis due to the complexity in geometry. The actual injection pressure used was in the region of 6,000 - 9,000 psi, and a maximum clamping force of 16 tons was applied to the mold.
9.1.2. Calculation of Cavity Size There are three independent volumetric changes of the cavity which affect the final part size:
1. Tool shrinkage after curing 2. Thermal expansion of the cavity during molding 3. Part shrinkage from above Tg to room temperature
Tool Shrinkage After Curing Stereolithography parts are known to shrink after final curing. DSM Somos reports that NanoForm has final cure shrinkage (SSL) between 0.001-0.0015 in/in [20]. The relationship between the designed cavity size, Cd, and final cavity size at room temperature, C0, can be expressed as:
C0=Cd(1-SSL). (9.1) However, the SLA vendor assured before the part would be made that the design would not be needed to compensate for shrinkage, such that SSL could be set to zero in the prediction of cavity scaling. Cavity Expansion Differences in mold tooling materials necessitate that thermal expansion be accounted for in order to more accurately estimate the cavity dimensions. The relationship between a cavity size at room temperature, C0, and the heated cavity size, Ch, can be expressed as:
Ch=C0(1+C.T.E.SL(Tm-T0)), (9.2) where C.T.E.SL is the coefficient of thermal expansion of the stereolithography insert, Tm is the molding temperature, and T0 is room temperature, assumed to be 70˚ F. While it is difficult to predict the actual temperature of the cavity during molding, an approximation is sufficient since the final effect will be on order of 0.05% per 10 degree F. The Lustran 648 datasheet recommends molding between 110 - 150˚F, yielding a thermal expansion over that 40-degree range of 0.2%. With an approximation of Tm = 130˚ F and T0 = 70˚ F, the calculation of thermal expansion based upon the properties listed in Appendix 9.2.1 is shown:
Expansion = 28x10-6 in/in-˚F (122˚ F – 70˚ F) + 47x10-6 in/in-˚F (130˚ F – 122˚ F) = 0.0018 in/in
Based upon the likely molding range of 110 - 150˚ F, the predicted thermal expansion of the tool is 0.18 ± 0.1%. Part Shrinkage Part shrinkage, measured by ASTM D955 standards, is inclusive of the thermal expansion of the molding material (usually hardened steel). The part shrinkage, Spart, is related to the original cavity dimensions and final part dimensions through the relationship:
Pf=C0(1-Spart), (9.3) where Pf is the final part dimension. Since Harris [2] showed that there can be some discrepancy between measured shrinkage values due to thermal expansion, an adjusted shrinkage, Sadj, which accounts for thermal expansion of the steel must be used to predict the thermal contraction of plastic from barrel temperature to room temperature:
Pf=Ch(1-Sadj), (9.4) where Ch is the heated cavity dimension at molding temperature. Substituting 8.2 into 8.4, we get:
Pf=C0(1+C.T.E.SL(Tm-T0))(1-Sadj). (9.5) Combining the two RHS equations from 9.3 and 9.5 yields the following relationship between Spart and Sadj:
1-Spart=(1+C.T.E.SL(Tm-T0))(1-Sadj). (9.6) The adjusted shrinkage can now be expressed in material properties which can be measured or are already known, Spart and C.T.E.SL:
( )0...11
1TTETC
SS
mSL
partadj −+
−−= . (9.7)

Alexander K. Do Page 18 of 18
However, we cannot determine the part shrinkage before the tool is made, so we must use another set of known properties. Without loss of generality, this relationship can be held true for any molding material. In particular, if the molding material is a hardened tool steel, the Spart becomes the ASTM D955 published shrinkage SASTM:
( )''...111
0TTETCSS
mSteel
ASTMadj −+
−−= , (9.8)
with Tm’ and T0’ as the range of temperatures used in the steel rather than SL mold. Final Equation Combing equations 9.1, 9.5, and 9.8 algebraically, we obtain the following relation:
( )( )( ) ( )( )( )ASTMmSLSL
mSteelfd STTETCS
TTETCPC−−+−
−+=
1...11''...1
0
0 . (9.9)
While we do not know the coefficient of thermal expansion of the actual tool used in the ASTM shrinkage tests, we can estimate that for a standard molding steel such as P20 tool steel which is commonly used for cavities and cores [15], the CTE will be approximately 7x10⁻⁶ in/in-˚F [17], and molding temperatures Tm’ and T0’ will be on par with Tm and T0. This yields a total thermal expansion of 0.042%. At this point, all the parameters which are required to predict the required cavity scaling above the designed part dimensions are known.
9.2. Material Properties
9.2.1. Somos NanoForm 15120 Information obtained from DSM Somos Property ASTM
Method NanoForm 15120 UV + Thermal Postcure
Tensile Strength 7.7 ksi Modulus of Elasticity
D638M 856 ksi
Flexural Strength 18.7 ksi Flexural Modulus
D790M 645 ksi
Compressive Strength 34 ksi Compressive Modulus
D695-02a 678 ksi
CTE 32°F – 122°F 28 x 10-6 in/in-°F
CTE 122°F – 212°F
E831-00
47 x 10-6 in/in-°F
Tg E1545-00 176 °F HDT @ 66 psi 517 °F HDT @ 264 psi
D648-98c 240 °F
k (Thermal Conductivity) 0.09 lbs./s-˚F (0.7 W/m-K)
9.2.2. Lustran ABS 648 Information obtained from Lanxess Lustran datasheet Typical Injeciton Molding Conditions Barrel Temperature at Nozzle 475 – 500 °F Melt Temperature 475 – 510 °F Mold Temperature 112 – 150 °F Injection Pressure 10,000 – 16,000 psi Injection Speed High Typical Properties for Natural Resin Mold Shrinkage (ASTM D955) 0.004 – 0.006 in/in Tensile Modulus (ASTM D638) 340 ksi Coefficient of Linear Thermal Expansion (ASTM D696)
51 x 10-6 in/in/°F