evaluation of a flipped classroom format for an ... · evaluation of a flipped classroom format for...
TRANSCRIPT

Evaluation of a Flipped Classroom Format for an Introductory-Level Marketing Class
George B. Krueger
University of Wisconsin-Platteville
Christine H. Storlie University of Wisconsin-Platteville
The purpose of this study was to evaluate the implementation of a flipped approach to classroom instruction using a case study methodology. In the fall of 2013, two sections of an Introduction to Marketing course were taught by a professor who flipped one section but not the other. Student’s opinions and learning outcomes were assessed. The students in the flipped classroom rated the professor significantly higher than the un-flipped classroom but there was no indication that this particular approach to flipping the classroom improved the students’ understanding of the course learning outcomes. BACKGROUND
Sams & Bergman (2013), Berrett (2012), and Demski (2013) advocate the use of flipped instruction methodology to more effectively use class time by minimizing traditional lectures and while focusing more on individualized teaching activities. DeFour (2013) found positive learning outcomes, while Davies, Dean, and Ball (2013) found that the flipped classroom created positive learning outcomes but created negative attitudes toward the instruction method.
There are numerous ways to define flipped instruction as a teaching methodology. Methods may include: video presentations, pre-assigned readings, assignments to be completed outside of class and then reviewed during class, outside of class online discussions, online quizzes completed before class, and preparation for student presentations. Flipped courses vary in the extent to which they use these different methods. Some of these methods have been used in introductory-level courses with varying degrees of success.
There are several issues with teaching a required introductory level class. Students are required to take the class and often are not engaged in the subject matter because they “have to be there.” Also, the students often don’t see the big picture of relevance to their education and/or career goals. Finally, there can be wide variability on the level of expertise in the subject area in the class, which can lead to frustration and/or boredom depending on the student’s level of interest and expertise in the subject area.
Stone (2012) showed positive results for an introductory biology class. The improvements were reflected in fewer drops, higher attendance, positive student attitudes in the student evaluations, and improved exam scores. In an introduction to Excel course, the flipped approach was shown to improve student understanding, application, and retention of the material, in addition to increasing their level of
Journal of Higher Education Theory and Practice Vol. 15(1) 2015 19
satisfaction with the course (Frydenberg, 2013). Therefore, the flipped class strategy offers the opportunity to engage the students more effectively in the classroom and improve their mastery of learning outcomes. The Study
The purpose of this study was to evaluate the flipped classroom methodology in an introductory level marketing course. The professor has taught the course for several years in a conventional lecture format, so a baseline of learning outcomes and student evaluations data was available. Specific Flipped Methods
This study was focused on two specific flipped methods. The first was online quizzes that the students took ahead of the actual class lecture/discussion. The purpose of the online quizzes was for the students to be familiar with the subject matter for each week when they came to class. The second method was expanded classroom discussions and applications focused on specific group projects where the students prepared for the presentations and discussions outside of class.
The online quizzes were focused on the weekly textbook chapters. The quizzes were taken by the students each week. The flipped class took the quizzes before the subject matter was covered in class. The rationale was that the students would be familiar with the subject matter before the subject matter was covered in class. This familiarity would result in lectures that were more focused on key points and more in-depth discussion of the basic subject matter. Rather than focusing on presenting content for the first time at the most basic level the subject matter was covered briefly but then applied more intensely in the flipped format.
The quizzes were administered online in the Desire-2-Learn (D2L) learning management system. The multiple choice questions were loaded directly from the textbook test-bank and the quiz questions were randomized for each student. The quizzes were open book/open notes. The quizzes covered the chapters that were assigned for each week. The flipped classroom (Tuesday/Thursday) took the quizzes before the first class of the week (due Monday night at 11:59 pm before the Tuesday class) and the control (Monday/Wednesday/Friday) took the quizzes on Monday of each week.
The flipped classroom’s quizzes were worth 50 points each and the control’s quizzes were worth 20 points each. There were a total of 11 quizzes with the 11th quiz being a “bonus”. This allowed each student to miss one quiz and not be penalized.
The flipped class quizzes were set at 50 points to emphasize the importance of reading the material ahead of time and to highly incentivize the students for being prepared by having read the chapters and taken the quiz before coming to class.
The second flipped tool was the allocation of class time to student presentations and a more in-depth discussion of key marketing issues in the flipped class rather than a more lecture-oriented format for the control class. The purpose was to have the students in the flipped class discuss the material and develop presentations outside of class and then present to the rest of the class during class time. Each group presented twice during the semester. During the group presentations the professor interjected important learning points, emphasized key areas of study and added to the content of the presentation pertaining to the subject matter for the week. Discussions often ensued throughout the class since the class was highly engaged in the company’s products on which the groups were working. The Classes
The course used in this study was BSAD 2630 Introduction to Marketing. There were two sections of the course; one section met Tuesdays and Thursdays from 9:30 to 11:48 and the second section met Monday, Wednesday, Friday from 9:00 to 9:52. The classes used the same textbook, in-class instruction materials, and covered the same course content. At the start of the semester, each class had a total of 35 students enrolled. The students were predominantly business majors along with business minors; however, very few were marketing emphasis students. The students were not told that they were
20 Journal of Higher Education Theory and Practice Vol. 15(1) 2015

participating in a study until the mid-point of the semester when the first student opinion survey was administered.
The Tuesday/Thursday class was taught in a flipped format. Generally, the Tuesday class was lecture and class discussion on the chapters and subject matter for the week. The flipped class took the online quizzes ahead of the actual week’s subject matter so they had no prior exposure to the subject matter. The Thursday class was taught by groups who were instructed by the professor to emphasize certain key areas. The discussion topics and questions are in Appendix 1. They then were expected to present and discuss on Thursday with no lecture from the professor.
The Monday/Wednesday/Friday class was taught in the similar style to previous semesters. The professor lectured for approximately 20-30 minutes each day and then led class discussions, group discussions, projects or in-class work. During high content weeks, the professor might have to lecture for the entire 52 minute class to cover the content. Assessment of the Flipped Approach
The flipped approach was assessed by comparing the average scores for the following items for the flipped and control classes: group projects, exams, final exams, final individual projects, class participation, student opinion surveys, and student course/instructor evaluations. These assessments were compared for the flipped and control classes in order to determine if scores were higher for the flipped classroom. Group Projects
The flipped class was split into 6 groups of 5-6 students. Each group then picked a company to follow to evaluate their marketing and present to the class. The focus companies for the flipped class were:
• Oakley Sunglasses • Gatorade • Canon Digital Photography • Monster Beverages • Blackberry • UnderArmour
Each group was assigned a week where they presented the application of the concepts following the
guides in Exhibit 1. Each group had to spend time outside of class preparing for their week. They were also required to involve the rest of the class in their focus subject area during Thursday’s presentation. At the end of the semester, each group briefly presented their learning outcomes to the class for their company.
The control class was split into 5 groups of 6-7 students. Each group then selected a company to evaluate. The focus companies for the conventional class were:
• Sunday Ticket—Direct TV • Netflix • Kwik Trip Convenience Stores • Mountain Dew KickStart • Domino’s
Most weeks, the discussion of their work was interwoven into the lecture and discussed in class.
There was little work outside of class assigned. At the end of the semester each group briefly presented their learning outcomes to the class for their company. Exams
There were 3 exams administered during the semester. These exams covered the chapters and subject matter assigned. There were study guides provided and the professor emphasized key items that would be
Journal of Higher Education Theory and Practice Vol. 15(1) 2015 21

on the exam during the class review. The exams were similar but not exactly the same for the two classes. They were approximately 60% multiple choice and 40% short answer/essay questions. The exams were returned to the students for review. Final Exam
The final exam was a comprehensive exam covering the entire semester. The exams were exactly the same. The final exam was 40% multiple choice and 60% application of terms related to a case on Subway Restaurant’s marketing. The case subject was given to the students along with a study guide before the exam. Final Individual Project
A final individual project was assigned to the students. The assignment was for the student to select a product or service to market and write a marketing plan for their selection. An outline and grading rubric was provided to each class. This project is intended to be a capstone application of the marketing concepts. Class Participation
Class participation points are awarded based on attendance and involvement in class discussions. In general, the intent is to reward attending class and being involved while in attendance.
TABLE 1 SUMMARY OF ASSIGNMENT POINTS
Control Class Flipped Class
Online Quizzes 200 500
Group Projects 100 100
Exams 300 300
Final Exam 100 100
Final Individual Project 100 100
Class Participation 100 100
Total Points 900 1200
Student Evaluations
There were three separate evaluations administered to the students to measure their perceptions. Pre and post student opinion surveys were administered specifically to evaluate the flipped format (Appendix 2). A routine semester-end student evaluation was administered and was compared to the professor’s previous student evaluations for this course (Appendix 3). Data Analysis
The data for the flipped and control classes were compared using t-tests. The scores for the various assignments (quizzes, exams, projects, participation, etc.) were compared for the two groups using
22 Journal of Higher Education Theory and Practice Vol. 15(1) 2015
independent samples t-tests to determine if a statistically significant difference existed. The pre and post student opinion survey data were also analyzed using an independent samples t-test since the surveys were completed anonymously, so there was no way to match the participants’ pre surveys with their post surveys. Lastly, the student course/instructor evaluations were compared using analysis of variance because the comparison was not only between the control and flipped classes, but also the previous four semesters of the class taught by this professor. For all of these tests, the null hypothesis was that there was not a statistically significant difference in the average scores for the flipped and control classes, while the alternative hypothesis was that the flipped class had significantly higher average scores than the control class. RESULTS Online Quizzes
The conventional class took the quizzes after the course material had been covered in class and averaged 77.4%. Even though the flipped class took the quizzes before the lecture they only trailed the conventional class by .7 at 76.7%. There is no statistical difference between the two measurements at the .05 significance level. Group Projects
The flipped class was more focused on their projects and the perception of the professor was they were more engaged and had a better understanding of the concepts as applied to the projects. The papers submitted in both classes were initially unacceptable and had to be reworked. At the end the flipped class scored 86.6% average and the conventional class was at 84.0% with no statistical difference at the .05 significance level. Exams
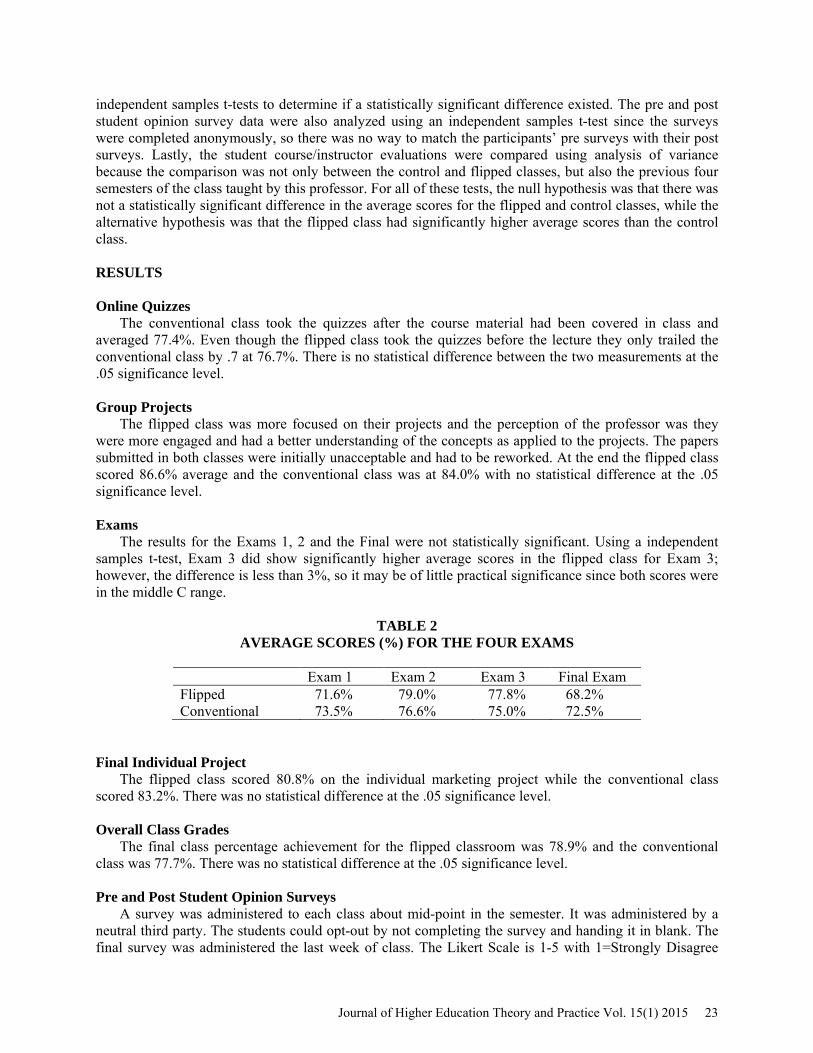
The results for the Exams 1, 2 and the Final were not statistically significant. Using a independent samples t-test, Exam 3 did show significantly higher average scores in the flipped class for Exam 3; however, the difference is less than 3%, so it may be of little practical significance since both scores were in the middle C range.
TABLE 2 AVERAGE SCORES (%) FOR THE FOUR EXAMS
Exam 1 Exam 2 Exam 3 Final Exam Flipped 71.6% 79.0% 77.8% 68.2% Conventional 73.5% 76.6% 75.0% 72.5%
Final Individual Project
The flipped class scored 80.8% on the individual marketing project while the conventional class scored 83.2%. There was no statistical difference at the .05 significance level. Overall Class Grades
The final class percentage achievement for the flipped classroom was 78.9% and the conventional class was 77.7%. There was no statistical difference at the .05 significance level. Pre and Post Student Opinion Surveys
A survey was administered to each class about mid-point in the semester. It was administered by a neutral third party. The students could opt-out by not completing the survey and handing it in blank. The final survey was administered the last week of class. The Likert Scale is 1-5 with 1=Strongly Disagree
Journal of Higher Education Theory and Practice Vol. 15(1) 2015 23

and 5=Strongly Agree. The last two questions were on a 3-point Likert Scale of 1-3 with 1=Too Little/Too Easy, 2=Just Right and 3=Too Much/Too Difficult.
The survey results were analyzed for differences in the mean response scores pre and post for each of the classes using a paired t-test. In addition, the pre survey results were analyzed to determine if there was a significant difference in the average scores for both the flipped and control class using an independent samples t-test. Lastly, the post survey results were analyzed to determine if there was a significant difference in the average scores for both the control and flipped using an independent samples t-test. None of these comparisons were significant. There were no statistically significant differences in the responses of the two classes on the pre and post surveys across all questions at the .05 significance level (Table 3). This lack of results may be due to weaknesses in the survey instrument.
TABLE 3 AVERAGE SCORES FOR THE STUDENT OPINION SURVEY
Question
Flipped Control Average Pre (s.d.) n = 27
Average Post (s.d.) n = 30
Average Pre (s.d.) n = 26
Average Post (s.d.) n = 24
This class has met my expectations so far for content delivery
4.19 (0.62) 4.10 (0.61) 4.27 (0.53) 4.08 (0.65)
This class is taught like most classes that I have taken
3.33 (0.92) 2.80 (0.96) 2.93 (0.89) 2.79 (0.78)
I am satisfied with the way this course is being taught
4.22 (0.80) 4.03 (0.72) 4.04 (0.92) 3.71 (0.91)
I believe that I understand the content that has been covered so far in the class
3.78 (0.85) 3.80 (0.76) 3.77 (0.71) 3.71 (0.75)
I believe that I can apply the content that has been covered so far in the class
3.96 (0.76) 4.03 (0.76) 4.00 (0.69) 3.88 (0.61)
I believe that the learning objectives are clear
3.96 (0.59) 3.93 (0.69) 4.00 (0.75) 3.92 (0.78)
I am satisfied with my learning so far in this class
3.78 (0.80) 3.93 (0.83) 3.84 (0.61) 3.75 (0.74)
I believe that the amount of homework in the course is*
2.07 (0.27) 1.93 (0.25) 2.00 (0.00) 1.92 (0.41)
I believe the difficulty of the homework is*
1.93 (0.27) 1.93 (0.25) 1.96 (0.20) 1.83 (0.48)
* Scale of 1-3
24 Journal of Higher Education Theory and Practice Vol. 15(1) 2015

It is possible that the Student Opinion Survey was not an effective instrument for assessing students’ perceptions of the flipped approach to teaching the course. Surveys must be designed so that the questions being asked as are accurately measuring the desired variable, which is the validity of the instrument. The validity of the survey was assessed by the two researchers but not by any additional experts in pedagogy, so the questions that were asked might not have adequately measured the students’ perception of the flipped teaching method.
One of the professor’s perceived issues with flipped classroom teaching methods is that student’s perceive that it is too much work on their part to prepare for class compared to conventional lecture format. The issue of increased work outside the class creating dissatisfaction with the students was not observed. The study showed that the homework was not perceived as different between the classes but in practice the flipped classroom required a much higher level of student work outside of class in addition to class presentations by the students. The professor perceives that the higher level of student engagement was not viewed as a negative by the students in the context of the flipped class. It was often a point of pride on behalf of the students on the quality of their presentations and the groups were competitive with each other on the quality of their presentations. End-of-Semester Student Evaluations
The end-of-semester student evaluations were used to determine if there was a difference in the students’ satisfaction with the class for the flipped class and the control class. There was a statistically (α = .05) higher level of satisfaction from the students in the flipped classroom compared to the control class and previous classes (Table 4). Also, the overall mean score at 4.738 was significantly higher compared to the control class and previous classes (Table 4).
TABLE 4 MEAN SCORES FROM ROUTINE SEMESTER-END STUDENT EVALUATIONS
Mean Score Standard Deviation Number of Respondents Flipped Fall 13 4.738* 0.136 28 Control F 13 4.394 0.248 21 Sp 13 4.361 0.227 30 Fall 12-sec1 4.278 0.266 26 Fall 12-sec2 4.510 0.274 27 Fall 11-sec1 4.498 0.207 31 Fall 11-sec2 4.420 0.216 29 *Significant at the α < .001.
Student Comments
The qualitative student comments were answers to the following questions: 1. Identify specific things your instructor has done especially well in teaching this course. 2. Identify specific things you believe could be done to improve the teaching of this course. 3. Other constructive comments.
The comments were coded into categories and divided into two groups: Done Well and
Improvements. The coded comments are shown in Table 5. The most frequent positive comment from both the flipped and control class was that the professor
was entertaining, engaging, and/or enthusiastic, such that 14 students in each class made this type of comment (Table 5). In addition, there were six students in the flipped class and five students in the control class who indicated that they thought the professor had good knowledge of the subject (Table 5). These similarities in the comments of the two classes are a result of the professor’s teaching style and personality, as he has seen these types of comments in all his classes for the last several years. The
Journal of Higher Education Theory and Practice Vol. 15(1) 2015 25

biggest difference in the “Well Done” comments was that there were six individuals in the flipped class who liked the group presentations and discussions, while there was only one student in the control class who liked the group presentations (Table 5).
The most frequent negative comment from both classes was that they needed more help on projects, expectations, and assignments, such that nine students in the flipped class and seven students in the control made this comment (Table 5). The professor agreed that he could have provided clearer instructions for the projects and assignments, thoroughly explained his expectations for student performance, and offered the students assistance more often.
TABLE 5 CATEGORICAL ASSESSMENT OF STUDENT COMMENTS
Done Well n Flipped n Control 14 Entertaining/enthusiasm/engaging 14 Entertaining/enthusiasm/engaging 6 Good knowledge 5 Good knowledge/examples 6 Liked group presentations/discussions 1 Liked group presentations/discussions 1 Professor is concerned about students (cares)
Improvements n Flipped n Control 9 More help on
projects/expectations/assignments
7 More help on projects/expectations/assignments
2 Dislike online quizzes 6 Dislike online quizzes 4 Go through study guides & reviews 1 Go through study guides & reviews
1 Less PowerPoint by professor 3 Lectures can be confusing at times
1 Some student groups were not good
presenters
1 Stay on syllabus
1 More activities
It is interesting to note that the online quizzes were disliked by more students in the control class than in the flipped class (Table 5). In the control class, they took the quizzes on Monday night after the subject matter was covered in the Monday class and where the quizzes counted for only 20 points (200 total). The flipped class took the quizzes on Monday before the subject matter was covered on Tuesday and the quizzes were worth 50 points (500 points total). The professor expected the opposite effect. Professor’s Observations
Having students present material can be challenging. Several times during the semester the professor had to intervene in the group presentations to correct mistakes and add in omitted subject matter. In addition, some of the presentations were very poor and student’s attention was lacking. However, the increased engagement by the students far outweighed the issues and resulted in a more positive and vibrant classroom environment.
26 Journal of Higher Education Theory and Practice Vol. 15(1) 2015

Several times the professor noted disengagement by the students while other students were presenting. This could result in less learning by individual students that choose to not pay close attention or engage with the students that are presenting.
The flipped format was a challenge with 30-35 students. Providing individual attention to a large number of groups can be difficult to manage in a classroom environment. Often, when the professor is focusing on a group of 6 students the other 29 students can be disengaged from the class.
As noted in the research, not having a base of knowledge led to visible frustration from some students as observed by the professor. Often when the subject matter was enhanced in the presentations by the professor the response from the students was something like, “how are we supposed to know that?” Care must be taken to remember that teaching an introductory level class is a unique challenge due to the lack of and variability of basic subject matter knowledge within the class.
The flipped format required more work outside of class for the students. This was perceived by the professor based on observations and comments by the students to be an issue during the semester. However, this perception did not manifest itself in the evaluations.
Some students expressed their preference to be presented the information in lecture format first with explanation by the professor. They were then more comfortable and effective with the group work and projects. These comments have merit.
The online quizzes are a constant source of negative student comments. The questions in the testbank can often be poorly written and unclear. All quiz questions should be reviewed by the professor before being added to the random question options.
The online quizzes force the student to engage with the subject matter outside of class. When asked if they would read the textbook without some measurement of their performance most students admitted that they would not unless there was an incentive.
The professor observed a general lower quality of work on the individual projects in the flipped class format. The conventional class did score higher by 3 points than the flipped class although the results were not statistically different. The application of key concepts was perceived by the professor to be at a lower level of understanding in the flipped format.
The overall score on the final exam was not statistically significant with the flipped class scoring a 68.2% and the conventional class scoring a 72.5%. However, the professor observed that final exam final case answers of the flipped class was also of lower quality and indicated a lesser understanding in the flipped class. The case was on Subway Restaurants and the students were to apply key marketing concepts (positioning, target markets, objectives, 4 P’s, segmentation, promotion mix) to Subway’s marketing strategy. The student’s answers to the final case question (60% of the total exam) were of less quality and did not show as complete of an understanding of the basic concepts of marketing as the conventional class.
The professor perceived that the student presentations of key concepts were not as effective as desired in the flipped class. More emphasis needs to be put on key concepts to be sure that the students understand key concepts when teaching in a flipped class format. One of the downsides of this type of format is that if the students are not actually presenting the subjects they will not master the subject matter as completely. Students that are not presenting may also disengage from the presentation resulting in reduced learning. The conventional format may have an overall advantage as the Professor is presenting the key concepts and its applications. CONCLUSIONS
The flipped classroom methodology utilizing the key tools of online quizzes taken before classroom coverage of the subject matter, student preparation for presentations outside of class, student presentations each week and a much higher level of group work in class yielded no statistical differences in seven of eight (only Exam 3 was statistically different in favor of the flipped class) student outcomes as measured by grades when compared the control class taught in conventional format.
Journal of Higher Education Theory and Practice Vol. 15(1) 2015 27

The students did not perceive a significant level of difference in the way the flipped and conventional classes were taught from their previous experiences when surveyed at mid-point and at the end of the semester. They did not perceive that the additional effort required on their part to participate in a flipped class to be an issue.
The professor did perceive less understanding of key concepts in the individual project and the final exam in the flipped class as compared to the conventional class although the results were not statistically significant.
The flipped classroom did create a higher level of satisfaction for the students and did appear to engage the students more actively as measured by statistically significant higher student evaluation scores in the flipped classroom as compared to the control class and previously taught classes in conventional format. IMPLICATIONS
The primary result of this study was that using a flipped classroom format for an introductory level class created a more positive student learning environment. Specifically, increased involvement in the subject matter greatly increased the student’s satisfaction with an introductory level course which supports the results reported by Frydenberg (2013).
Many studies have indicated that the flipped method allows for more effective use of class time (Sams & Bergman, 2013; Berrett, 2011; Demski, 2013). However, care must be taken to thoroughly cover the course content to achieve the desired learning outcomes. Overuse of the flipped format has the potential to actually result in reduced learning outcomes if the course content is not delivered effectively.
The flipped teaching methods of students preparing for presentations, group work outside of class and online quizzes was effectively used in an introductory level course to more fully engage students in the subject matter. This study showed positive student attitudes on the student evaluations and supports the results of a study by Stone (2012) that indicated positive attitudes. Therefore, the flipped classroom approach can be an effective approach to introductory classes. REFERENCES Berrett, D., (2012), How ‘Flipping’ the Classroom Can Improve the Traditional Lecture. The Chronicle of
Higher Education. Retrieved May 5, 2014 from www.chronicle.com/article/How-Flipping-the-Classroom/130857/.
Davies, R., Dean, D., & Ball, N., (2013). Flipping the Classroom and Instructional Technology Integration in a College-level Information Systems Spreadsheet Course. Educational Technology Research & Development, (Vol. 61, Issue 4, pp. 563-580)
Defour, M., (2013). Flipped Classrooms’ Spreading in Wisconsin. Community College Week, (Vol. 25, Issue 16, p. 10).
Demski, J., (2013). 6 Expert Tips for Flipping the Classroom. Campus Technology, (Vol. 25, pp. 32-37). Frydenberg, M. E. (2013). Flipping Excel. Information Systems Education Journal, 11 (1), 63-73. Sams, A., & Bergmann, J., (2013). Flip Your Students’ Learning. Educational Leadership, (Vol. 70,
Issue 6, pp. 16-20). Strayer, J., (2012). How Learning in an Inverted Classroom Influences Cooperation, Innovation and Task
Orientation. Learning Environments Research, (Vol. 15, Issue 2, pp. 171-193). Stone, B. (2012). Flip Your Classroom to Increase Active Learning and Student Engagement. 28th Annual
Conference on Distance Teaching and Learning, Retrieved May 30, 2014 from http://www.uwex.edu/disted/conference/Resource_library/proceedings/56511_2012.pdf
28 Journal of Higher Education Theory and Practice Vol. 15(1) 2015

APPENDIX 1—WEEKLY ASSIGNMENTS—GROUP PRESENTATIONS Week 1
• Target market • Customer profile—(What do they do? What do they look like? Where are they? What do they
want?) • Develop a marketing mix to appeal to your target market • Address the 6 marketing environment variables • What is value to the customer • Is the marketing mix working? • What do they need to do to grow sales and market share? • Do a brief SWOT analysis • What is the firm’s core competencies? • What is the market opportunity, strategic window, competitive advantage • What is their market share objective • Is this a successful marketing strategy? Justify your position
Week 2
• What is the competitive structure of the industry you are marketing in? • What economic forces are influencing your marketing and how is the marketing department
dealing with these forces? • Where does the product fall in the buying analysis—where in the consumer’s income? • What political forces are influencing your marketing and how is the marketing department
dealing with these forces? • What legal & regulatory forces are influencing your marketing and how is the marketing
department dealing with these forces? • Is the business practicing self-regulation? Give examples. • What technological forces are influencing your marketing and how is the marketing department
dealing with these forces? • What sociocultural forces are influencing your marketing and how is the marketing department
dealing with these forces? • How is the company dealing with ethical issues that have surfaced in the past few years in their
industry? • How is the company being socially responsible? • Cover the 4 levels on the Pyramid of Social Responsibility on page 96. • What are their ethical statements? • What cause-related marketing are they doing? Is it effective? • Address their sustainability programs and philosophies. • Are they doing any green marketing and are they practicing consumerism? If yes, what, if no,
what could they do? • What is their ethical culture? How did you arrive at this conclusion? • How are they adhering to the 3 general norms of marketing ethics on page 111.
Week 3
• Run the class through the marketing research process for your product area. Be sure to cover the process in detail.
• Find secondary data on your product area. • Have the class do:
o Survey
Journal of Higher Education Theory and Practice Vol. 15(1) 2015 29

o Focus group o Intercept o Observation
• Have the class then summarize and present their findings. • Find how Blackberry uses a MDSS. • What ethical issues does Blackberry deal with in their marketing research? • Apply the target market selection process to a Blackberry device in detail. • Have the class apply the 4 segmentation variables to the target market. • What is the product positioning of Blackberry and 3 major competitive products. • Apply a perceptual map to Blackberry. • Develop a sales forecast for Blackberry’s new product using the breakdown and buildup
approaches. • What is Blackberry going to do now for target market and positioning given that they are
abandoning the consumer market? Week 4
• Apply the Consumer Buying Process Figure 7.1 on page 193 to your products. Don’t just talk about it, do a role play.
o Select your major product o Select your target customer o Outline the marketing mix o Walk through the process
• Split the class into 3 sections. Have group members lead a discussion on each section and then report out to the class.
o Situational o Psychological o Social
• Business Markets o Select a retailer that you will sell to: o Again, role play the process on page 235, Figure 8.2 o Cover the 4 areas of influence from the business buyer’s perspective o Look up on www.census.gov what your NAICS code is and how much your product area
sells. • Do a demonstration on buying behavior on the concept of “don’t listen to what people say, watch
what they do!” Week 5
Chapter 9--Global • What is international marketing? • What are the key environmental forces in global markets? • What are the key modes of entry into international markets? • What is the concept of globalization vs. customization in developing marketing strategies
for global markets? • What is your company’s global strategy • What markets are they strongest/weakest from a performance standpoint?
Chapter 10—e-Marketing Part 1—Relate these concepts to your company
• What are the unique characteristics of e-Marketing?
30 Journal of Higher Education Theory and Practice Vol. 15(1) 2015

• What are the key ethical and legal issues in e-Marketing? • How does e-Marketing fit in an integrated marketing strategy?
Part 2 • Review the e-Marketing Strategy
o Website design o SEM/SEO o Social media o Data mining o Content marketing o Video
• How do they integrate the e-Marketing with traditional marketing? Week 6
Chapter 11--Product • What is their core product? What are their supplementary products? • Define the product line and their product mix. • Identify a product in each stage of the product life cycle. • What is the product adoption process for their new technologically advanced products. • What part of the product adoption curve do they appeal to for different product offerings.
Chapter 12—Developing and Managing Products • Apply the various strategies for managing existing products. • What is the process for new product development? Have the class design a new product. • Test market a new product using the class as a demonstration? • How does Under Armour practice the concept of product differentiation? Bring in
samples of products to compare. Show videos and ads. • You are a product manager for one of the lines. Show how you spend your day in a
creative way. Key Points to Cover
• What happened to their original shoe strategy? Why did it fail? • What is their current shoe strategy? • What is their retail strategy? How do they merchandise their products? • How did Under Armour start and what about the founder is unique? • Show a sales chart and compare to Nike & Adidas • Celebrity spokespeople is a core strategy, why??
Week 7
• What is your brand, brand name, brad mark and key trademarks? • What is the level of brand loyalty that your brand possesses? Describe the position of your brand
using the 4 major elements of the brand equity on page 401. • Develop a brand name for a new product you think that your company should launch. How will
you protect your brand name? • What co-branding and brand licensing is your company doing? • What is the packaging strategy? • How successful is your company’s brand and how have they developed the brand over the years?
Week 8
• What is the supply chain strategy? • How does your company manage the key tasks in supply chain management:
Journal of Higher Education Theory and Practice Vol. 15(1) 2015 31
o Operations o Supply o Logistics o Channel
• Who are the intermediaries? • How does your company use supply chain to gain a competitive advantage? • How does the marketing channel support the brand through activities involving:
o Marketing information o Marketing management o Facilitating exchanges o Promotion o Price o Physical distribution
• There are 6 areas to focus on for selecting a marketing channel. What are your company’s needs in each area?
• There are 3 levels of intensity of market coverage. Which one does your company exhibit? • Who are the channel leaders? • Where are the channel conflicts? • What are the goals of physical distribution (7 of them). • Are there legal issues to deal with?
• Retail
o Which types of retailers does your company focus on? o What geographic location do you want retailers to distribute your products? o How does your company practice category management? o Alternate retail strategies? Any used?
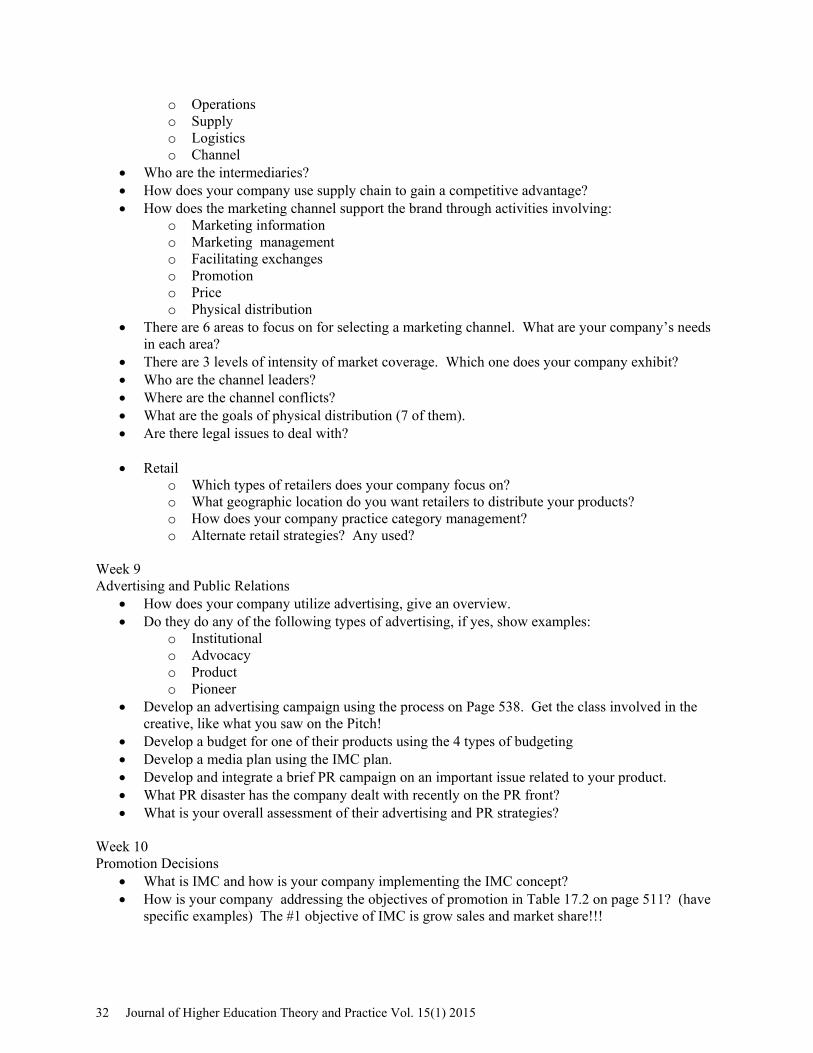
Week 9 Advertising and Public Relations
• How does your company utilize advertising, give an overview. • Do they do any of the following types of advertising, if yes, show examples:
o Institutional o Advocacy o Product o Pioneer
• Develop an advertising campaign using the process on Page 538. Get the class involved in the creative, like what you saw on the Pitch!
• Develop a budget for one of their products using the 4 types of budgeting • Develop a media plan using the IMC plan. • Develop and integrate a brief PR campaign on an important issue related to your product. • What PR disaster has the company dealt with recently on the PR front? • What is your overall assessment of their advertising and PR strategies?
Week 10 Promotion Decisions
• What is IMC and how is your company implementing the IMC concept? • How is your company addressing the objectives of promotion in Table 17.2 on page 511? (have
specific examples) The #1 objective of IMC is grow sales and market share!!!
32 Journal of Higher Education Theory and Practice Vol. 15(1) 2015
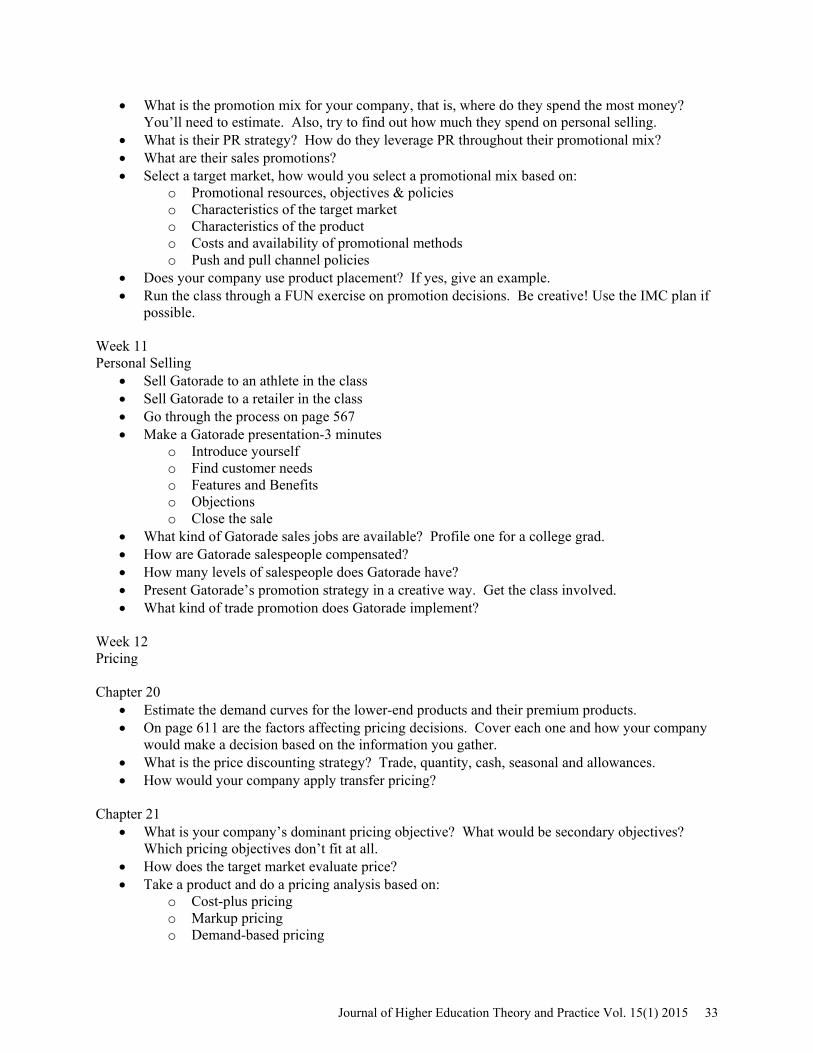
• What is the promotion mix for your company, that is, where do they spend the most money? You’ll need to estimate. Also, try to find out how much they spend on personal selling.
• What is their PR strategy? How do they leverage PR throughout their promotional mix? • What are their sales promotions? • Select a target market, how would you select a promotional mix based on:
o Promotional resources, objectives & policies o Characteristics of the target market o Characteristics of the product o Costs and availability of promotional methods o Push and pull channel policies
• Does your company use product placement? If yes, give an example. • Run the class through a FUN exercise on promotion decisions. Be creative! Use the IMC plan if
possible. Week 11 Personal Selling
• Sell Gatorade to an athlete in the class • Sell Gatorade to a retailer in the class • Go through the process on page 567 • Make a Gatorade presentation-3 minutes
o Introduce yourself o Find customer needs o Features and Benefits o Objections o Close the sale
• What kind of Gatorade sales jobs are available? Profile one for a college grad. • How are Gatorade salespeople compensated? • How many levels of salespeople does Gatorade have? • Present Gatorade’s promotion strategy in a creative way. Get the class involved. • What kind of trade promotion does Gatorade implement?
Week 12 Pricing Chapter 20
• Estimate the demand curves for the lower-end products and their premium products. • On page 611 are the factors affecting pricing decisions. Cover each one and how your company
would make a decision based on the information you gather. • What is the price discounting strategy? Trade, quantity, cash, seasonal and allowances. • How would your company apply transfer pricing?
Chapter 21
• What is your company’s dominant pricing objective? What would be secondary objectives? Which pricing objectives don’t fit at all.
• How does the target market evaluate price? • Take a product and do a pricing analysis based on:
o Cost-plus pricing o Markup pricing o Demand-based pricing
Journal of Higher Education Theory and Practice Vol. 15(1) 2015 33

o Competition-based pricing • Apply as many of the common pricing strategies in table 21.3 on page 636 as possible. • Get the class involved and do a pricing game with the winning team getting 10 extra credit points.
Final Case Presentations
• Segmentation (various strategies and then pick one) • Target Customer (pick your best one) • 4 P’s • Strategies (focus on where you win) • Implementation—IMC Plan (use the IMC spreadsheet) • Recommendations
Oakley Under Armour Canon Gatorade Blackberry Monster 5 minute presentation max Tips for the presentation/discussion Have fun! Be visual—show ads Apply what you learned this semester Focus on big ideas, not a laundry list of small ideas Where do you have to win to be successful? Recommendations—now, 1 year, 3 years APPENDIX 2—PRE AND POST STUDENT SURVEYS Survey Instrument--Pre
1. This class has met my expectations so far for content delivery. Strongly Agree Agree Neutral Disagree Strongly Disagree
X X X X X 2. This class is taught like most classes that I have taken.
Strongly Agree Agree Neutral Disagree Strongly Disagree X X X X X
3. If you Strongly Agree or Agree that the class is being taught differently from other classes you have taken, how is it different? Please list exact reasons for your position.
4. I am satisfied with the way this course is being taught.
Strongly Agree Agree Neutral Disagree Strongly Disagree X X X X X
5. I believe that I understand the content that has been covered so far in the class. Strongly Agree Agree Neutral Disagree Strongly Disagree
X X X X X 6. I believe that I can apply the content that has been covered so far in the class.
34 Journal of Higher Education Theory and Practice Vol. 15(1) 2015

Strongly Agree Agree Neutral Disagree Strongly Disagree X X X X X
7. I believe that the learning objectives are clear. Strongly Agree Agree Neutral Disagree Strongly Disagree
X X X X X 8. I am satisfied with my learning so far in this class.
Strongly Agree Agree Neutral Disagree Strongly Disagree X X X X X
9. I believe that the amount of homework in the course is: Too little About Right Too Much X X X
10. I believe the difficulty of the homework is: Too Easy About Right Too Difficult X X X Other Comments Survey Instrument—Post
1. This class met my expectations for content delivery. Strongly Agree Agree Neutral Disagree Strongly Disagree
X X X X X 2. This class was taught like most classes that I have taken.
Strongly Agree Agree Neutral Disagree Strongly Disagree X X X X X
3. If you Strongly Agree or Agree that the class was taught differently from other classes you have taken, how was it different? Please list exact reasons for your position.
4. I am satisfied with the way this course was taught.
Strongly Agree Agree Neutral Disagree Strongly Disagree X X X X X
5. I believe that I understand the content that has been covered in the class. Strongly Agree Agree Neutral Disagree Strongly Disagree
X X X X X 6. I believe that I can apply the content that has been covered in the class.
Strongly Agree Agree Neutral Disagree Strongly Disagree X X X X X
7. I believe that the learning objectives were clear. Strongly Agree Agree Neutral Disagree Strongly Disagree
X X X X X 8. I am satisfied with my learning in this class.
Strongly Agree Agree Neutral Disagree Strongly Disagree X X X X X
9. I believe that the amount of homework in the course was: Too little About Right Too Much X X X 10. I believe the difficulty of the homework was: Too Easy About Right Too Difficult X X X Other Comments
Journal of Higher Education Theory and Practice Vol. 15(1) 2015 35
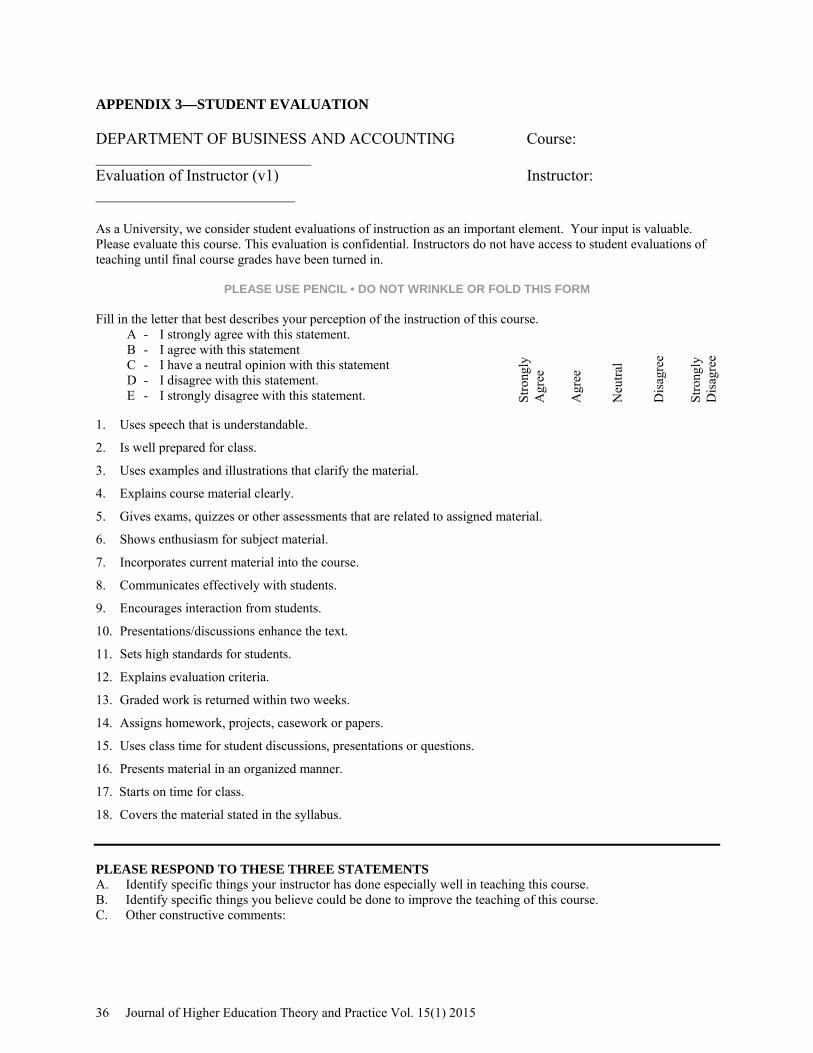
APPENDIX 3—STUDENT EVALUATION DEPARTMENT OF BUSINESS AND ACCOUNTING Course: ___________________________ Evaluation of Instructor (v1) Instructor: _________________________ As a University, we consider student evaluations of instruction as an important element. Your input is valuable. Please evaluate this course. This evaluation is confidential. Instructors do not have access to student evaluations of teaching until final course grades have been turned in.
PLEASE USE PENCIL • DO NOT WRINKLE OR FOLD THIS FORM Fill in the letter that best describes your perception of the instruction of this course.
A - I strongly agree with this statement.
Stro
ngly
A
gree
Agr
ee
Neu
tral
Dis
agre
e
Stro
ngly
D
isag
ree B - I agree with this statement
C - I have a neutral opinion with this statement D - I disagree with this statement. E - I strongly disagree with this statement.
1. Uses speech that is understandable.
2. Is well prepared for class.
3. Uses examples and illustrations that clarify the material.
4. Explains course material clearly.
5. Gives exams, quizzes or other assessments that are related to assigned material.
6. Shows enthusiasm for subject material.
7. Incorporates current material into the course.
8. Communicates effectively with students.
9. Encourages interaction from students.
10. Presentations/discussions enhance the text.
11. Sets high standards for students.
12. Explains evaluation criteria.
13. Graded work is returned within two weeks.
14. Assigns homework, projects, casework or papers.
15. Uses class time for student discussions, presentations or questions.
16. Presents material in an organized manner.
17. Starts on time for class.
18. Covers the material stated in the syllabus.
PLEASE RESPOND TO THESE THREE STATEMENTS A. Identify specific things your instructor has done especially well in teaching this course. B. Identify specific things you believe could be done to improve the teaching of this course. C. Other constructive comments:
36 Journal of Higher Education Theory and Practice Vol. 15(1) 2015