evaluation of a dual-frequency imaging sonar for ... · evaluation of a dual-frequency imaging...
TRANSCRIPT

Fishery Data Series No. 07-44
Evaluation of a Dual-Frequency Imaging Sonar for Detecting and Estimating the Size of Migrating Salmon
by
Debby L. Burwen,
Steve J. Fleischman,
and
James D. Miller
Alaska Department of Fish and Game Divisions of Sport Fish and Commercial Fisheries
August 2007

Symbols and Abbreviations The following symbols and abbreviations, and others approved for the Système International d'Unités (SI), are used without definition in the following reports by the Divisions of Sport Fish and of Commercial Fisheries: Fishery Manuscripts, Fishery Data Series Reports, Fishery Management Reports, and Special Publications. All others, including deviations from definitions listed below, are noted in the text at first mention, as well as in the titles or footnotes of tables, and in figure or figure captions. Weights and measures (metric) centimeter cm deciliter dL gram g hectare ha kilogram kg kilometer km liter L meter m milliliter mL millimeter mm Weights and measures (English) cubic feet per second ft3/s foot ft gallon gal inch in mile mi nautical mile nmi ounce oz pound lb quart qt yard yd Time and temperature day d degrees Celsius °C degrees Fahrenheit °F degrees kelvin K hour h minute min second s Physics and chemistry all atomic symbols alternating current AC ampere A calorie cal direct current DC hertz Hz horsepower hp hydrogen ion activity pH (negative log of) parts per million ppm parts per thousand ppt, ‰ volts V watts W
General Alaska Administrative Code AAC all commonly accepted abbreviations e.g., Mr., Mrs.,
AM, PM, etc. all commonly accepted professional titles e.g., Dr., Ph.D., R.N., etc. at @ compass directions:
east E north N south S west W
copyright © corporate suffixes:
Company Co. Corporation Corp. Incorporated Inc. Limited Ltd.
District of Columbia D.C. et alii (and others) et al. et cetera (and so forth) etc. exempli gratia (for example) e.g. Federal Information Code FIC id est (that is) i.e. latitude or longitude lat. or long. monetary symbols (U.S.) $, ¢ months (tables and figures): first three letters Jan,...,Dec registered trademark ® trademark ™ United States (adjective) U.S. United States of America (noun) USA U.S.C. United States
Code U.S. state use two-letter
abbreviations (e.g., AK, WA)
Measures (fisheries) fork length FL mideye-to-fork MEF mideye-to-tail-fork METF standard length SL total length TL Mathematics, statistics all standard mathematical signs, symbols and abbreviations alternate hypothesis HA
base of natural logarithm e catch per unit effort CPUE coefficient of variation CV common test statistics (F, t, χ2, etc.) confidence interval CI correlation coefficient (multiple) R correlation coefficient (simple) r covariance cov degree (angular ) ° degrees of freedom df expected value E greater than > greater than or equal to ≥ harvest per unit effort HPUE less than < less than or equal to ≤ logarithm (natural) ln logarithm (base 10) log logarithm (specify base) log2, etc. minute (angular) ' not significant NS null hypothesis HO
percent % probability P probability of a type I error (rejection of the null hypothesis when true) α probability of a type II error (acceptance of the null hypothesis when false) β second (angular) " standard deviation SD standard error SE variance population Var sample var
FISHERY DATA SERIES NO. 07-44
EVALUATION OF A DUAL-FREQUENCY IMAGING SONAR FOR DETECTING AND ESTIMATING THE SIZE OF MIGRATING SALMON
by
Debby L. Burwen, Steve J. Fleischman,
and James D. Miller
Alaska Department of Fish and Game, Division of Sport Fish, Anchorage
Alaska Department of Fish and Game Division of Sport Fish, Research and Technical Services
333 Raspberry Road, Anchorage, Alaska 99518-1565
August 2007
This investigation was partially financed by the Federal Aid in Sport Fish Restoration Act (16 U.S.C. 777-777K) under Projects F-10-18, 19, 20, Job No. S-2-28.
The Division of Sport Fish Fishery Data Series was established in 1987 for the publication of technically oriented results for a single project or group of closely related projects. Since 2004, the Division of Commercial Fisheries has also used the Fishery Data Series. Fishery Data Series reports are intended for fishery and other technical professionals. Fishery Data Series reports are available through the Alaska State Library and on the Internet: http://www.sf.adfg.state.ak.us/statewide/divreports/html/intersearch.cfm This publication has undergone editorial and peer review.
Debby L. Burwen, Steve J. Fleischman, and James D. Miller Alaska Department of Fish and Game, Division of Sport Fish 333 Raspberry Road, Anchorage, Alaska 99518-1599, USA
This document should be cited as: Burwen, D. L., S. J. Fleischman, and J. D. Miller. 2007. Evaluation of a dual-frequency imaging sonar for
estimating fish size in the Kenai River. Alaska Department of Fish and Game, Fishery Data Series No. 07-44, Anchorage.
The Alaska Department of Fish and Game (ADF&G) administers all programs and activities free from discrimination based on race, color, national origin, age, sex, religion, marital status, pregnancy, parenthood, or disability. The department administers all programs and activities in compliance with Title VI of the Civil Rights Act of 1964, Section 504 of the Rehabilitation Act of 1973, Title II of the Americans with Disabilities Act (ADA) of 1990, the Age Discrimination Act of 1975, and Title IX of the Education Amendments of 1972. If you believe you have been discriminated against in any program, activity, or facility please write:
ADF&G ADA Coordinator, P.O. Box 115526, Juneau AK 99811-5526 U.S. Fish and Wildlife Service, 4040 N. Fairfax Drive, Suite 300 Webb, Arlington VA 22203 Office of Equal Opportunity, U.S. Department of the Interior, Washington DC 20240
The department’s ADA Coordinator can be reached via phone at the following numbers: (VOICE) 907-465-6077, (Statewide Telecommunication Device for the Deaf) 1-800-478-3648, (Juneau TDD) 907-465-3646, or (FAX) 907-465-6078
For information on alternative formats and questions on this publication, please contact: ADF&G, Sport Fish Division, Research and Technical Services, 333 Raspberry Road, Anchorage AK 99518 (907)267-2375.

i
TABLE OF CONTENTS Page
LIST OF TABLES.........................................................................................................................................................ii LIST OF FIGURES.......................................................................................................................................................ii LIST OF APPENDICES ...............................................................................................................................................ii ABSTRACT ..................................................................................................................................................................1 INTRODUCTION.........................................................................................................................................................1 METHODS....................................................................................................................................................................2 Tethered Fish .................................................................................................................................................................2 Free-swimming Fish ......................................................................................................................................................2 Hydroacoustic Measurements........................................................................................................................................3 Analytic Methods ..........................................................................................................................................................4 RESULTS AND DISCUSSION....................................................................................................................................4 Estimation of Fish Size..................................................................................................................................................4 Effects of Distance from Transducer on Detection........................................................................................................6 Determining Direction of Travel ...................................................................................................................................6 Tracking Fish at High Densities ....................................................................................................................................7 Detection Capabilities Near Bottom and Mid-water .....................................................................................................7 Equipment Settings........................................................................................................................................................8 CONCLUSIONS ...........................................................................................................................................................8 ACKNOWLEDGMENTS .............................................................................................................................................9 REFERENCES CITED .................................................................................................................................................9 TABLES......................................................................................................................................................................11 FIGURES ....................................................................................................................................................................13 APPENDIX A .............................................................................................................................................................31
LIST OF TABLES Table Page 1. Parameter estimates and statistics from regression analysis of DIDSON-estimated length (DL, cm) on
true total length (TTL, cm), and distance from the transducer (m), for tethered fish in the Kenai River in 2002, and free-swimming fish in the Anchor River in 2004. ....................................................................12
LIST OF FIGURES Figure Page 1. Kenai River showing location of Chinook salmon sonar site and DIDSON experiments, 2002...................14 2. Aerial and cross-sectional views of the sonar site at river km 14 on the Kenai River...................................15 3. Configuration for tethering fish in side-looking sonar beams from side (top) and aerial (bottom) views.....16 4. The southern Kenai Peninsula showing location of the Anchor River weir site and DIDSON
experiments, 2004. ........................................................................................................................................17 5. View of Anchor River weir from downstream. .............................................................................................18 6. DIDSON deployment at Anchor River weir site. ..........................................................................................19 7. Using the DIDSON software’s manual fish marking tool to obtain length measurements on fish images
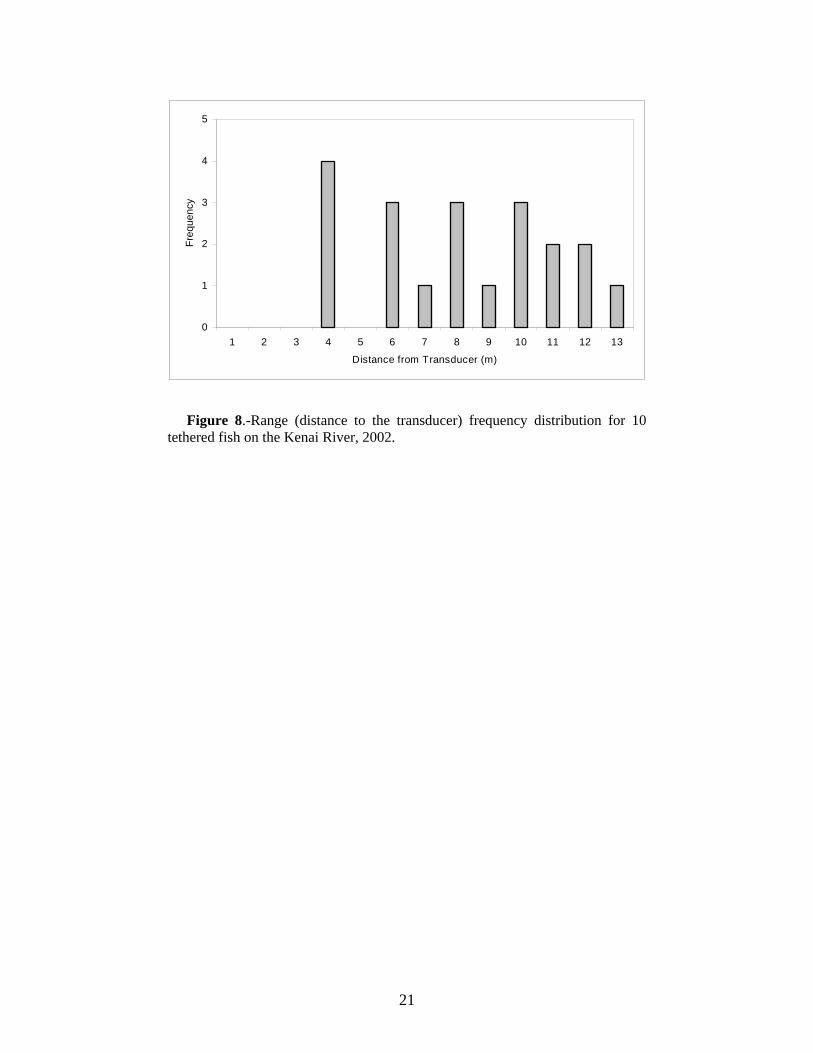
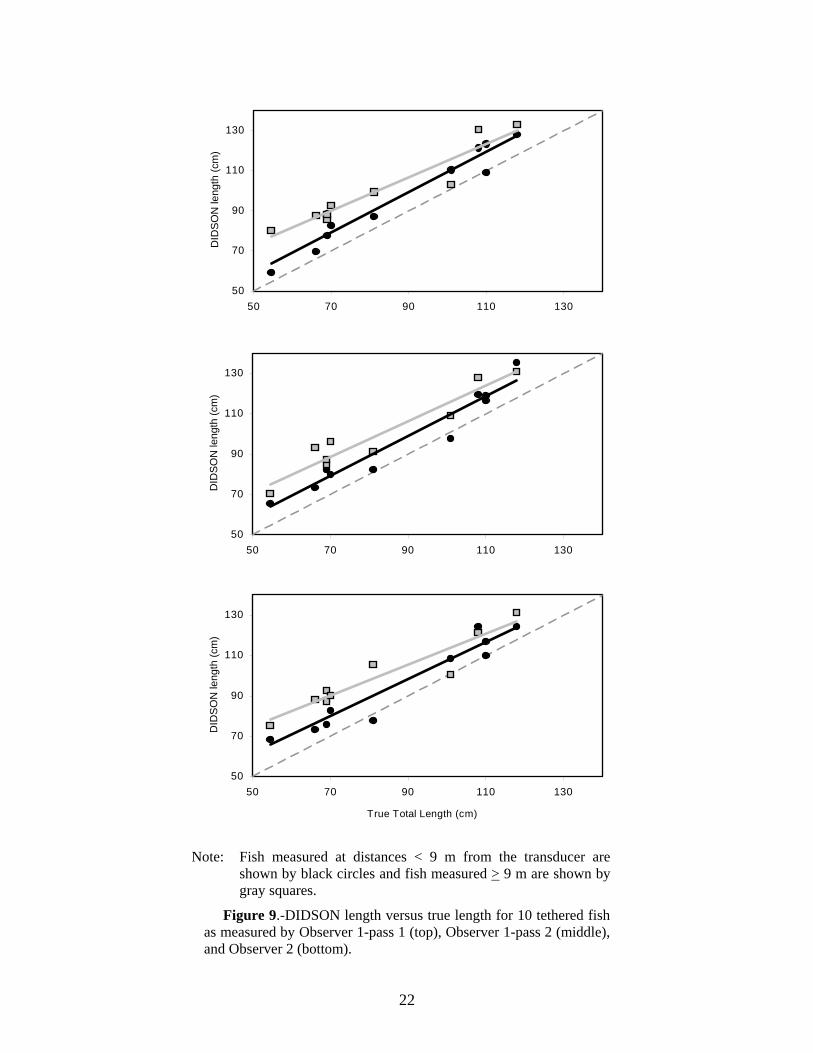
in normal (top) and zoom (bottom) modes. ...................................................................................................20 8. Range (distance to the transducer) frequency distribution for 10 tethered fish on the Kenai River, 2002. ...21 9. DIDSON length versus true length for 10 tethered fish as measured by Observer 1-pass 1 (top),
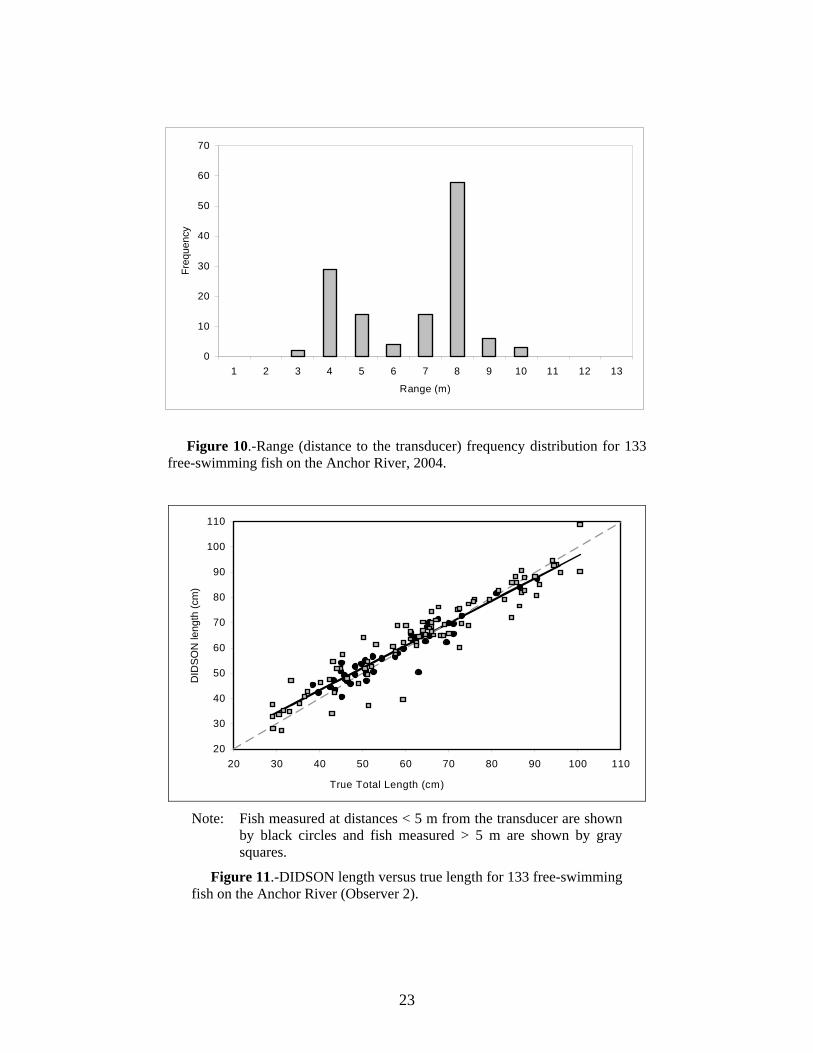
Observer 1-pass 2 (middle), and Observer 2 (bottom). .................................................................................22 10. Range (distance to the transducer) frequency distribution for 133 free-swimming fish on the Anchor
River, 2004. ...................................................................................................................................................23 11. DIDSON length versus true length for 133 free-swimming fish on the Anchor River (Observer 2). ...........23 12. DIDSON frame showing a 71 cm sockeye tethered at 10 m and a 101 cm Chinook salmon tethered at
20 m...............................................................................................................................................................24 13. Two downstream traveling fish (left) meet an upstream traveling fish (right). .............................................25 14. Visually tracking fish images swimming through the 30o field of view of the DIDSON display (top) is
easier and more intuitive than with the traditional echogram produced by split- and single-beam sonars (example from a split-beam with a 3ox10o transducer shown on bottom). ....................................................26
15. Conventional (top) and DIDSON (bottom) sonar beams aimed in the side-looking configuration typical of riverine assessment. ..................................................................................................................................27
16. Demonstration of the DIDSON background subtraction feature. The frame at left shows an image with the structure displayed while the frame at right shows the same image with the bottom structure removed.........................................................................................................................................................28
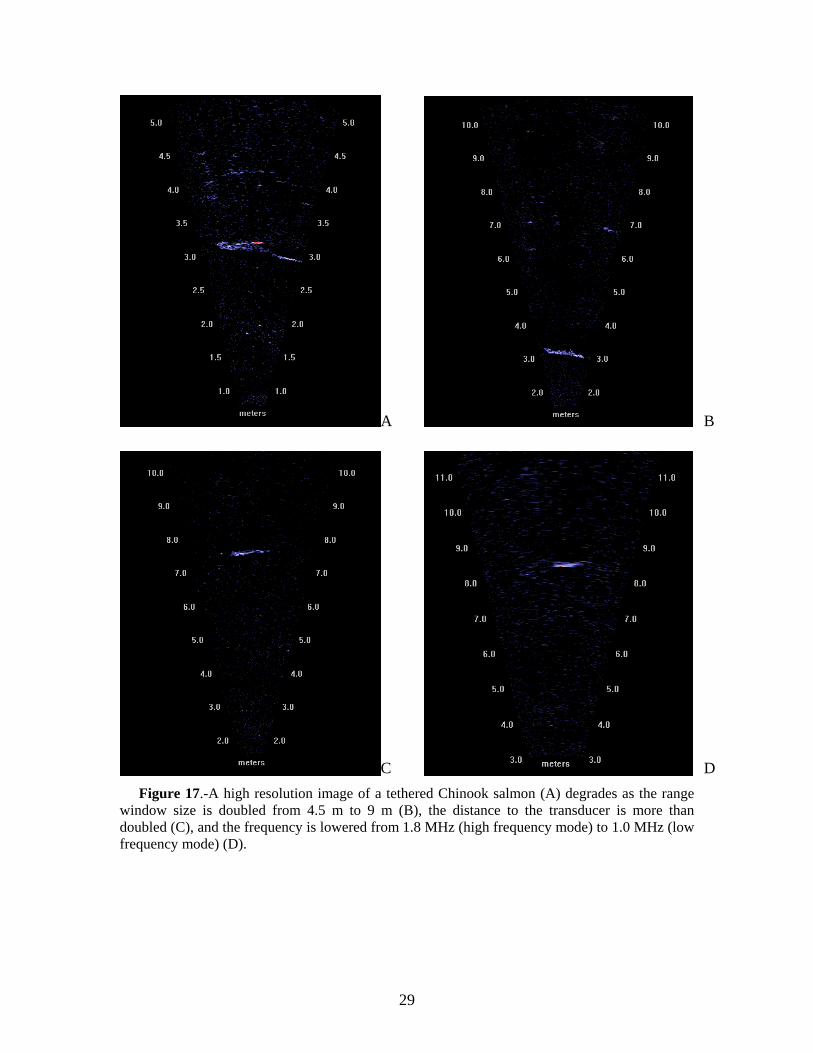
17. A high resolution image of a tethered Chinook salmon (A) degrades as the range window size is doubled from 4.5 m to 9 m (B), the distance to the transducer is more than doubled (C), and the frequency is lowered from 1.8 MHz (high frequency mode) to 1.0 MHz (low frequency mode) (D). .........29
LIST OF APPENDICES Appendix Page A. Differential beam sensitivity as an explanation for divergent DIDSON length measurements between
tethered and free-swimming fish. ..................................................................................................................32
ii

ABSTRACT Experiments were conducted with a DIDSON (Dual frequency IDentification SONar) acoustic system to evaluate the potential for estimating fish size from images of tethered and free-swimming fish in two Alaskan rivers. DIDSON is a recently developed imaging sonar that incorporates a sophisticated lensing system to improve image quality. In the first experiment, DIDSON images were collected from six Chinook salmon Oncorhynchus tsawytscha and four sockeye salmon O. nerka tethered in the center of the DIDSON’s multibeam array. In the second experiment, 130 Pacific salmon Oncorhynchus and Dolly Varden Salvelinus malma Walbaum were allowed to swim freely through the DIDSON multibeam array after being released from a weir live-box. Length estimates from DIDSON images of tethered fish were subject to a positive bias that increased with range of the fish from the transducer (approximately 1.3 cm/m of range). Measurements from free-swimming fish did not demonstrate the same size bias with range. Possible causes for the differing results are discussed, as well as the performance of the DIDSON with respect to detecting fish, determining direction of travel, and tracking fish at high densities.
Key words: multibeam sonar, imaging sonar, DIDSON sonar, fisheries acoustics, Chinook salmon, Oncorhynchus tshawytscha, sockeye salmon, Oncorhynchus nerka, hydroacoustic assessment, Kenai River, riverine sonar
INTRODUCTION Fixed-location, side-looking sonar techniques are often the only way to obtain inseason abundance estimates for anadromous fish stocks in rivers that are too wide for weir structures and too occluded for visual observations (Daum and Osborne 1998; Dunbar 2001; McKinley 2003; Osborne and Melegari 2002; Westerman and Willette 2003). Acoustic assessment sites currently exist on 10 rivers in Alaska. One of the primary barriers to wider use of sonar assessment has been difficulty in discriminating among fish species.
For example, to obtain inseason abundance estimates on the Kenai River, the Alaska Department of Fish and Game (ADF&G) uses split-beam sonar estimates of target strength and range to attempt to discriminate Chinook salmon Oncorhynchus tshawytscha from more abundant sockeye salmon O. nerka (Miller et al. 2005). These criteria are based on the premise that sockeye salmon are smaller and migrate primarily near shore whereas Chinook salmon are larger and tend to migrate up the middle of the river. However, studies have concluded that some sockeye salmon are still being erroneously classified as Chinook salmon, inflating Chinook abundance estimates to some degree (Burwen et al. 1998). Efforts are underway to develop improved species discrimination techniques for the Kenai River (Burwen et al. 2003; Fleischman and Burwen 2003).
Recently, new sonar technology has been developed that may provide a promising new tool for addressing the issue of species discrimination. The new system is called a Dual frequency IDentification SONar (DIDSON). DIDSON is a high-definition imaging sonar designed and manufactured by the University of Washington’s Applied Physics Lab for military applications such as diver detection and underwater mine identification. The DIDSON is the first imaging sonar to incorporate a sophisticated lensing system that improves image quality (Belcher et al. 2001). At close ranges, this new class of acoustic camera provides images approaching the quality achieved with conventional optics (Simmonds and MacLennan 2005), with the added advantage that images can be obtained in dark or turbid water.
This report summarizes results of several experiments conducted with the DIDSON system from 2002 to 2004. Our primary objective was to determine what size metrics were available from the DIDSON images of fish and to assess their accuracy and precision. We were interested in the potential for deriving size-related information from the DIDSON images of fish since this would
1
determine how well the DIDSON could assist in species discrimination. We also investigated how well the DIDSON was able to detect targets at range, determine direction of travel, and track fish at high densities.
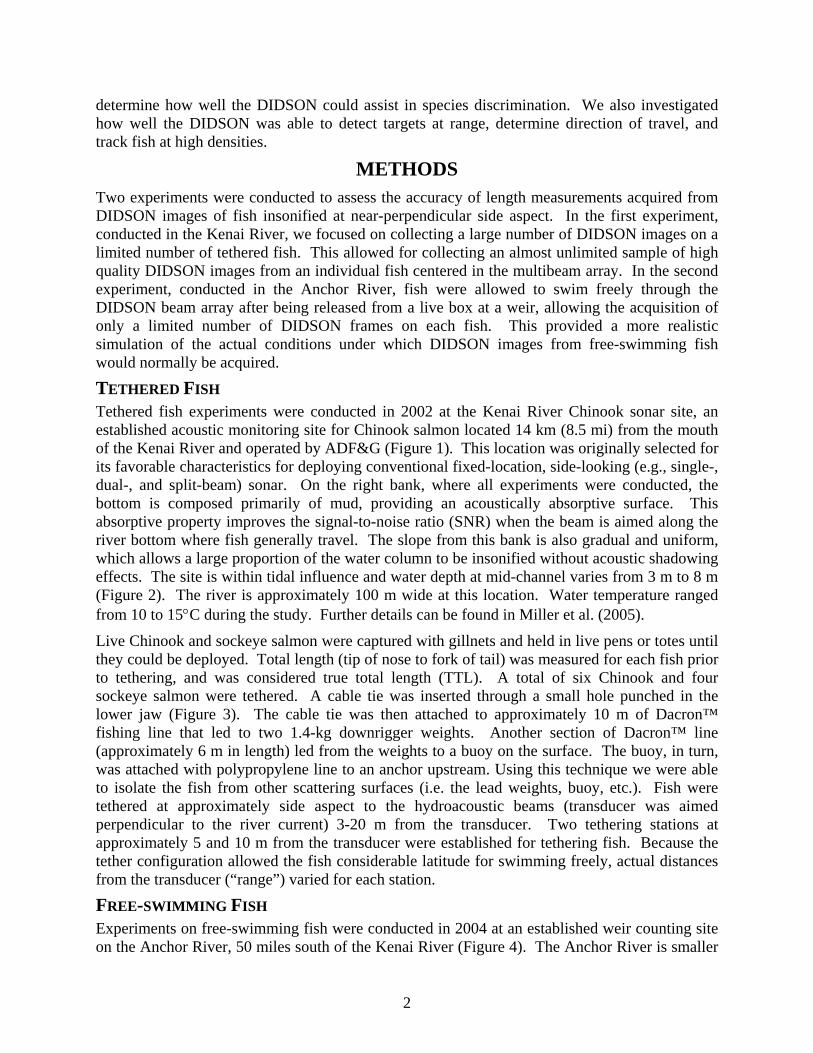
METHODS Two experiments were conducted to assess the accuracy of length measurements acquired from DIDSON images of fish insonified at near-perpendicular side aspect. In the first experiment, conducted in the Kenai River, we focused on collecting a large number of DIDSON images on a limited number of tethered fish. This allowed for collecting an almost unlimited sample of high quality DIDSON images from an individual fish centered in the multibeam array. In the second experiment, conducted in the Anchor River, fish were allowed to swim freely through the DIDSON beam array after being released from a live box at a weir, allowing the acquisition of only a limited number of DIDSON frames on each fish. This provided a more realistic simulation of the actual conditions under which DIDSON images from free-swimming fish would normally be acquired.
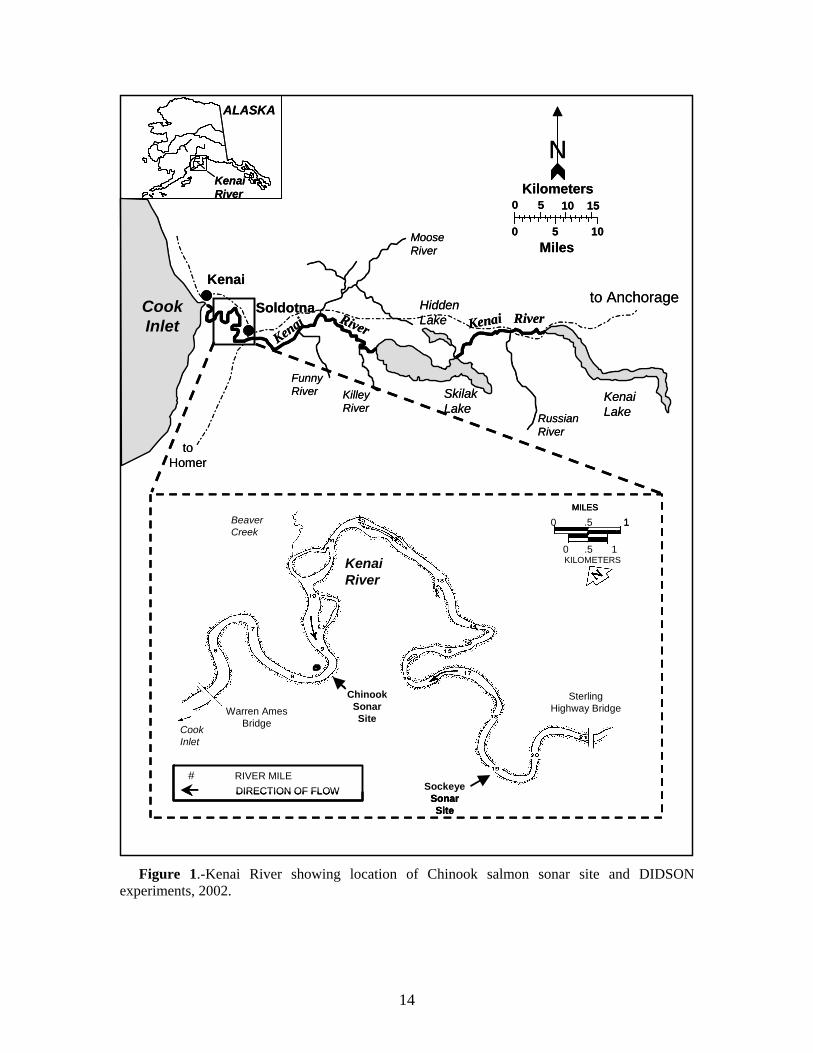
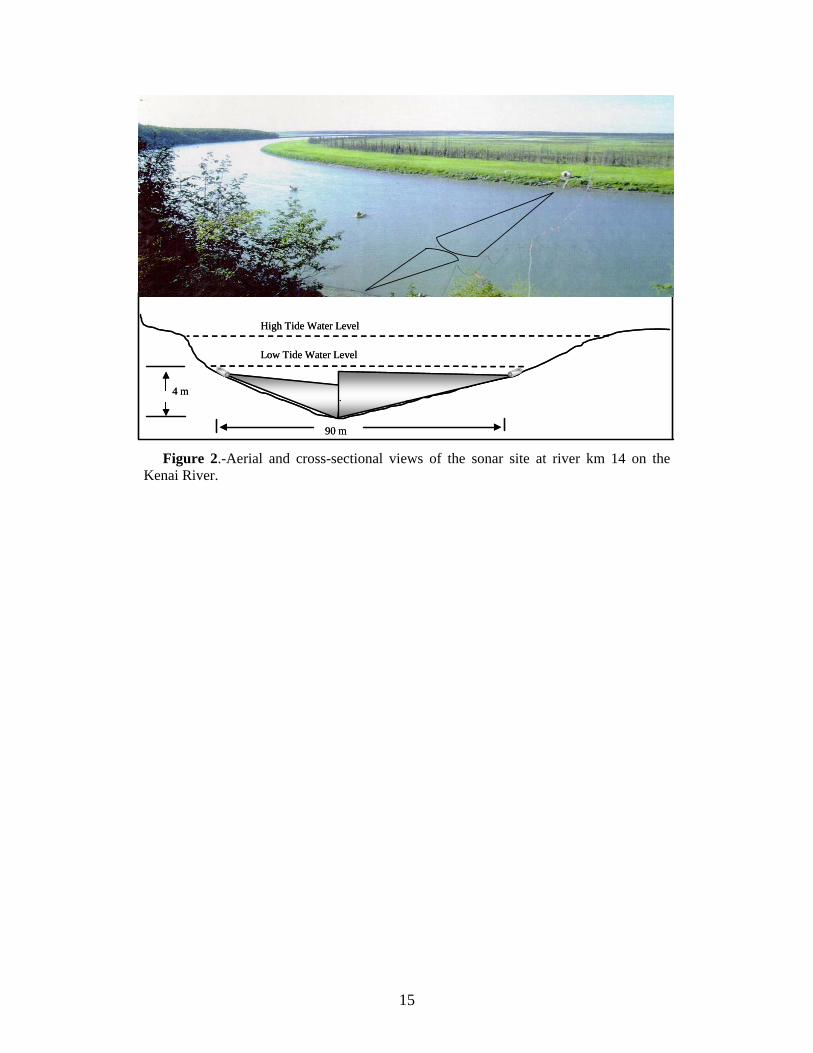
TETHERED FISH Tethered fish experiments were conducted in 2002 at the Kenai River Chinook sonar site, an established acoustic monitoring site for Chinook salmon located 14 km (8.5 mi) from the mouth of the Kenai River and operated by ADF&G (Figure 1). This location was originally selected for its favorable characteristics for deploying conventional fixed-location, side-looking (e.g., single-, dual-, and split-beam) sonar. On the right bank, where all experiments were conducted, the bottom is composed primarily of mud, providing an acoustically absorptive surface. This absorptive property improves the signal-to-noise ratio (SNR) when the beam is aimed along the river bottom where fish generally travel. The slope from this bank is also gradual and uniform, which allows a large proportion of the water column to be insonified without acoustic shadowing effects. The site is within tidal influence and water depth at mid-channel varies from 3 m to 8 m (Figure 2). The river is approximately 100 m wide at this location. Water temperature ranged from 10 to 15°C during the study. Further details can be found in Miller et al. (2005).
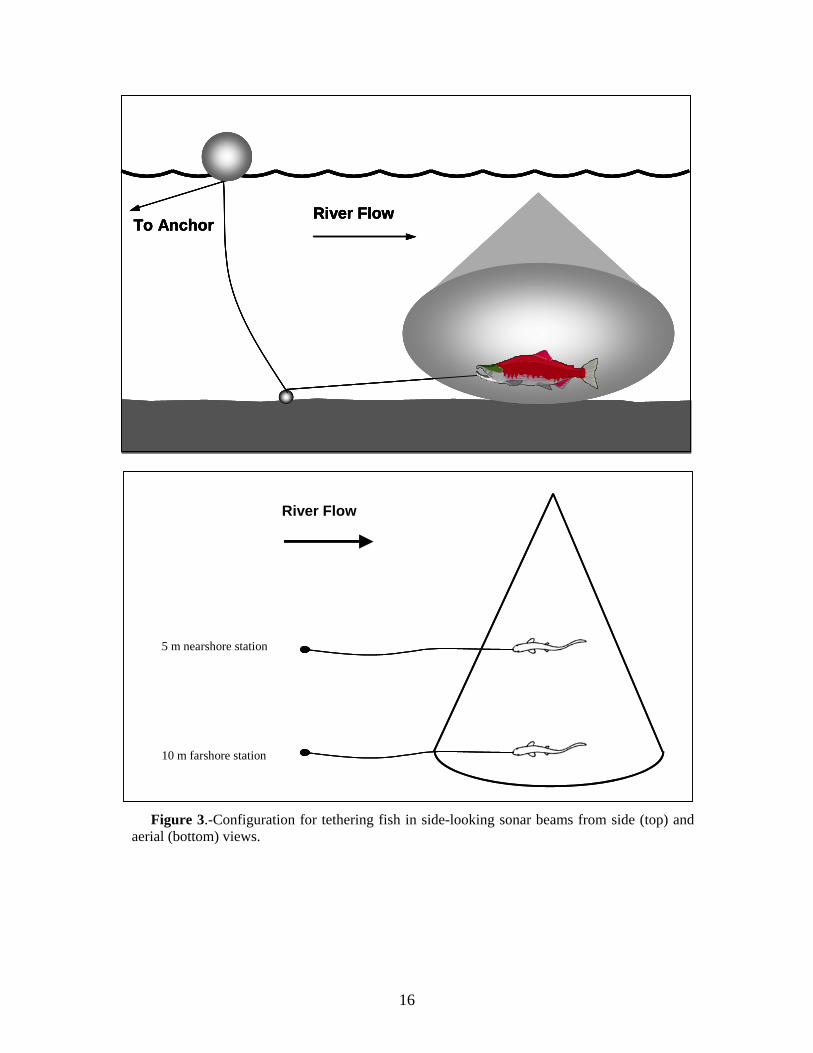
Live Chinook and sockeye salmon were captured with gillnets and held in live pens or totes until they could be deployed. Total length (tip of nose to fork of tail) was measured for each fish prior to tethering, and was considered true total length (TTL). A total of six Chinook and four sockeye salmon were tethered. A cable tie was inserted through a small hole punched in the lower jaw (Figure 3). The cable tie was then attached to approximately 10 m of Dacron™ fishing line that led to two 1.4-kg downrigger weights. Another section of Dacron™ line (approximately 6 m in length) led from the weights to a buoy on the surface. The buoy, in turn, was attached with polypropylene line to an anchor upstream. Using this technique we were able to isolate the fish from other scattering surfaces (i.e. the lead weights, buoy, etc.). Fish were tethered at approximately side aspect to the hydroacoustic beams (transducer was aimed perpendicular to the river current) 3-20 m from the transducer. Two tethering stations at approximately 5 and 10 m from the transducer were established for tethering fish. Because the tether configuration allowed the fish considerable latitude for swimming freely, actual distances from the transducer (“range”) varied for each station.
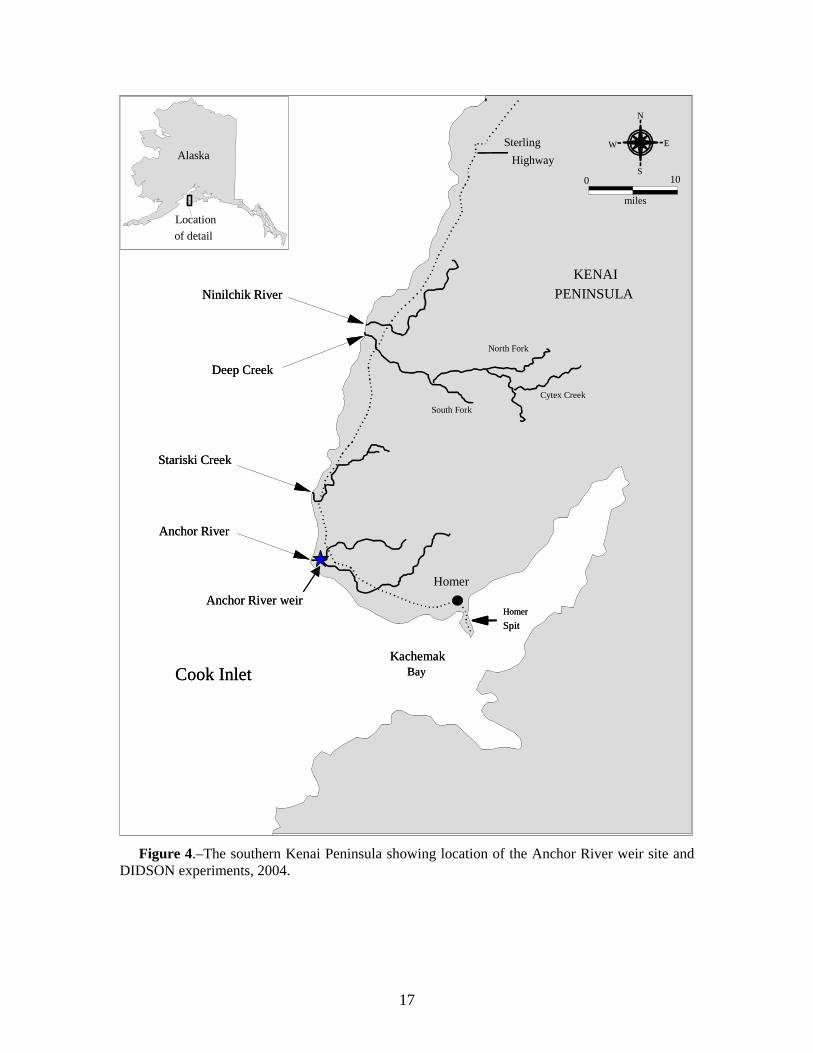
FREE-SWIMMING FISH Experiments on free-swimming fish were conducted in 2004 at an established weir counting site on the Anchor River, 50 miles south of the Kenai River (Figure 4). The Anchor River is smaller
2

and shallower than the Kenai River, averaging about 30 m wide and 1 m in depth but subject to higher water levels, particularly in the spring and fall. Since 2003, a DIDSON unit has been deployed to assess Chinook salmon abundance in the Anchor River from early May through mid June, at which time water levels have usually subsided enough to install a full counting weir. A partial weir is installed with the DIDSON to direct migrating fish through the sonar beam. In 2004, water levels had receded sufficiently by June 9 to install the remaining weir, including fish passage gates and live box.
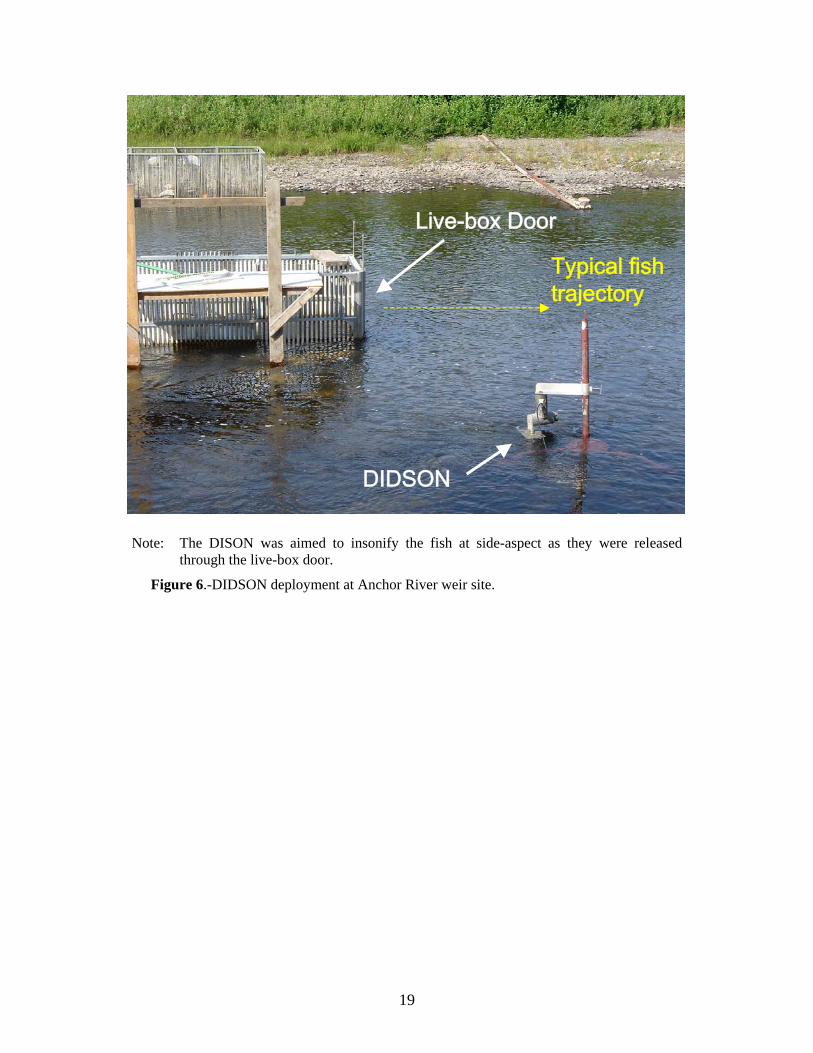
After installation of the full weir, a DIDSON was deployed just upstream of the weir trap (Figures 5 and 6). The sonar was situated at two different locations so that fish passed at a distance of approximately 4 m and 8 m from the transducer. Eight meters was the maximum allowable distance the DIDSON could be placed from the weir trap based on prevailing water level conditions. Fish were allowed to enter the trap from downstream and held with the upstream door closed until a sufficient number had accumulated. Fish were removed from the trap, measured for true total length (TTL), then released one at a time to swim upstream through the DIDSON beam array (Figure 6).
Some additional data on free-swimming fish were collected in the Kenai River in 2002, during intervals when the DIDSON was not being used to collect data on tethered fish. These data provided the opportunity to evaluate the ability of the DIDSON to detect fish at various distances from the transducer, determine direction of travel for fish and debris, and distinguish among individual fish at high passage rates.
HYDROACOUSTIC MEASUREMENTS Hydroacoustic data were collected with a standard DIDSON imaging sonar system that operated at 1.8 MHz (high-frequency mode) for observations close to the transducer (less than 12 m) and 1.0 MHz (low-frequency mode) for detecting targets at distances up to 30 m. Overall beam dimensions were 29o in the horizontal axis, and 12o in the vertical axis. The 29o horizontal axis is actually a radial array of multiple smaller beams with 96 beams 0.3o wide in high frequency mode and 48 beams 0.6o wide in low frequency mode. Frame rate varied from 4 to 8 frames sec-1. Further details on DIDSON sonar specifications can be found in Belcher (2001).
Data were collected from some tethered and free-swimming fish at more than one image window length setting. The size of the image window determines the display resolution. Because the DIDSON is limited to 512 samples (pixels) for displaying each frame, images with smaller window lengths are better resolved. Possible values are 4.5, 9.0, 18.0, and 36.0 meters for low-frequency (LF) operation, and 1.125, 2.25, 4.5, and 9.0 meters for high-frequency (HF) operation. Data were collected at window lengths of 2.25 m, 4.5 m, 9 m, 18, and 36 m. For most tethered and free-swimming fish, the window length was set at 9 m, a compromise which allowed the maximum distance to be covered while still operating in high frequency mode for optimal resolution.
Measurements of fish length were made from the DIDSON images using the manual fish-measuring feature included in the DIDSON software (Figure 7). Efforts were made to take measurements only from frames where the fish appeared to be displaying its full length and where contrast between the fish image and background was high.
Because of the potential for subjectivity in selecting and measuring DIDSON images, length measurements on tethered fish images were made by two different observers to assess between-observer variability. Neither observer had knowledge of actual fish size or identity. Each
3
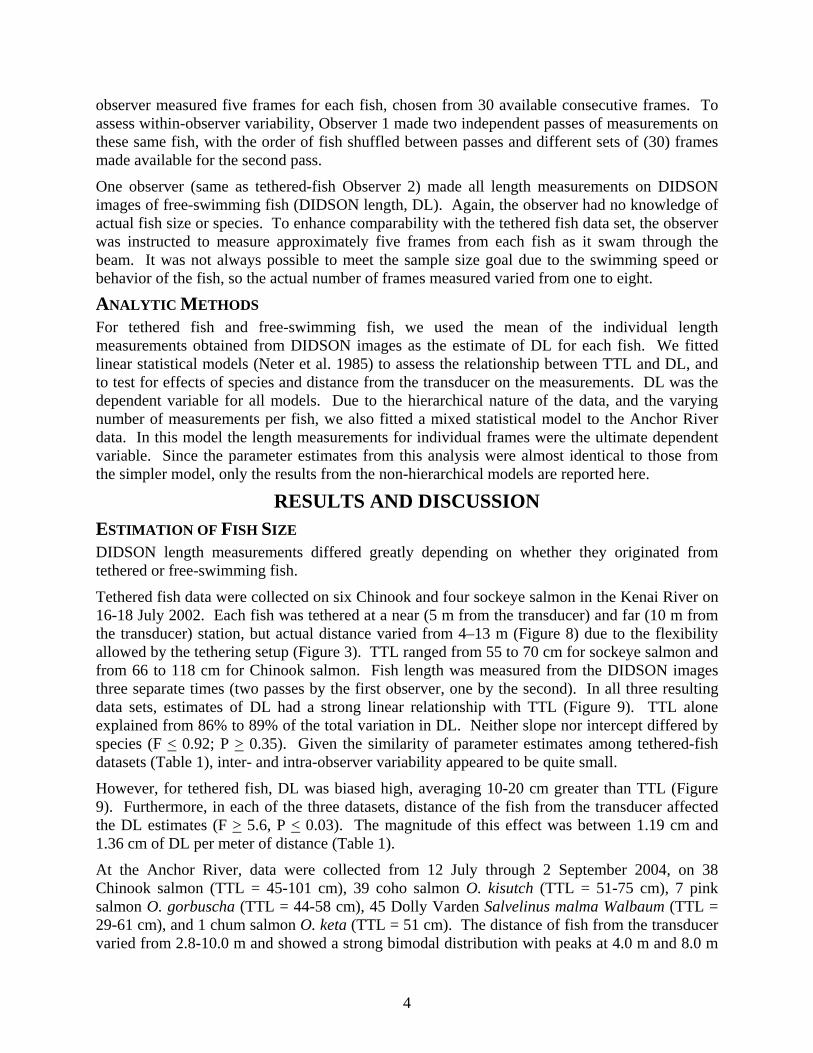
observer measured five frames for each fish, chosen from 30 available consecutive frames. To assess within-observer variability, Observer 1 made two independent passes of measurements on these same fish, with the order of fish shuffled between passes and different sets of (30) frames made available for the second pass.
One observer (same as tethered-fish Observer 2) made all length measurements on DIDSON images of free-swimming fish (DIDSON length, DL). Again, the observer had no knowledge of actual fish size or species. To enhance comparability with the tethered fish data set, the observer was instructed to measure approximately five frames from each fish as it swam through the beam. It was not always possible to meet the sample size goal due to the swimming speed or behavior of the fish, so the actual number of frames measured varied from one to eight.
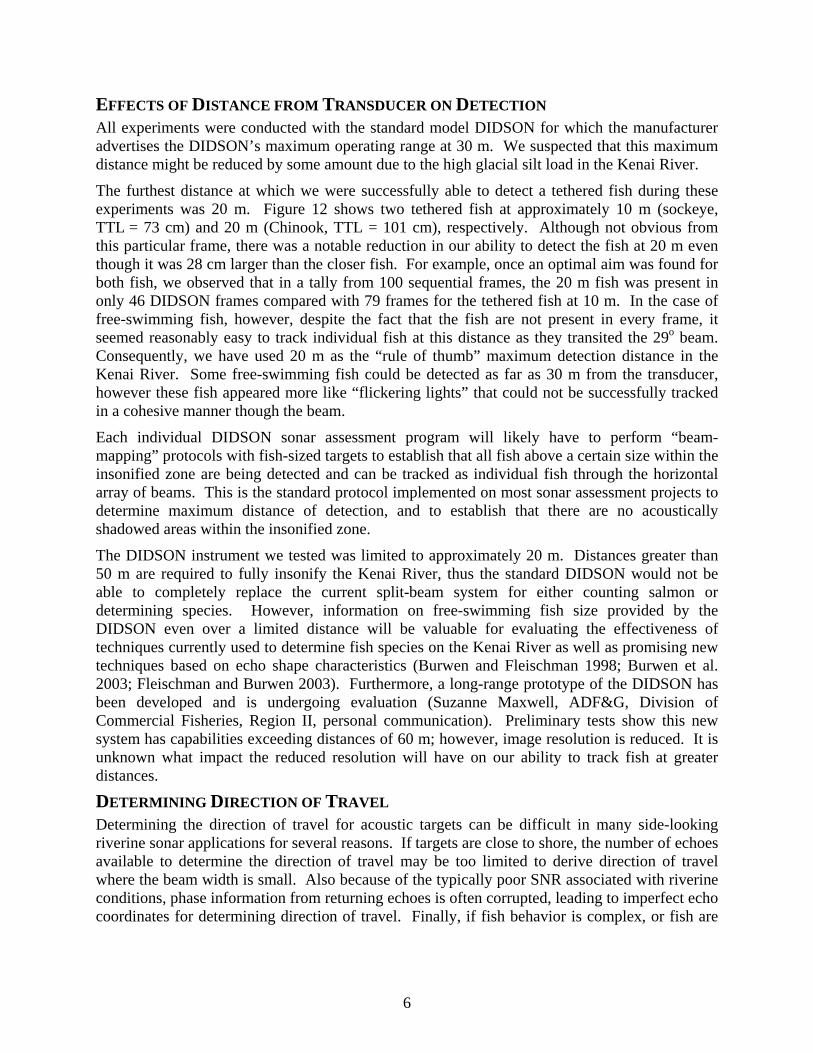
ANALYTIC METHODS For tethered fish and free-swimming fish, we used the mean of the individual length measurements obtained from DIDSON images as the estimate of DL for each fish. We fitted linear statistical models (Neter et al. 1985) to assess the relationship between TTL and DL, and to test for effects of species and distance from the transducer on the measurements. DL was the dependent variable for all models. Due to the hierarchical nature of the data, and the varying number of measurements per fish, we also fitted a mixed statistical model to the Anchor River data. In this model the length measurements for individual frames were the ultimate dependent variable. Since the parameter estimates from this analysis were almost identical to those from the simpler model, only the results from the non-hierarchical models are reported here.
RESULTS AND DISCUSSION ESTIMATION OF FISH SIZE DIDSON length measurements differed greatly depending on whether they originated from tethered or free-swimming fish.
Tethered fish data were collected on six Chinook and four sockeye salmon in the Kenai River on 16-18 July 2002. Each fish was tethered at a near (5 m from the transducer) and far (10 m from the transducer) station, but actual distance varied from 4–13 m (Figure 8) due to the flexibility allowed by the tethering setup (Figure 3). TTL ranged from 55 to 70 cm for sockeye salmon and from 66 to 118 cm for Chinook salmon. Fish length was measured from the DIDSON images three separate times (two passes by the first observer, one by the second). In all three resulting data sets, estimates of DL had a strong linear relationship with TTL (Figure 9). TTL alone explained from 86% to 89% of the total variation in DL. Neither slope nor intercept differed by species (F < 0.92; P > 0.35). Given the similarity of parameter estimates among tethered-fish datasets (Table 1), inter- and intra-observer variability appeared to be quite small.
However, for tethered fish, DL was biased high, averaging 10-20 cm greater than TTL (Figure 9). Furthermore, in each of the three datasets, distance of the fish from the transducer affected the DL estimates (F > 5.6, P < 0.03). The magnitude of this effect was between 1.19 cm and 1.36 cm of DL per meter of distance (Table 1).
At the Anchor River, data were collected from 12 July through 2 September 2004, on 38 Chinook salmon (TTL = 45-101 cm), 39 coho salmon O. kisutch (TTL = 51-75 cm), 7 pink salmon O. gorbuscha (TTL = 44-58 cm), 45 Dolly Varden Salvelinus malma Walbaum (TTL = 29-61 cm), and 1 chum salmon O. keta (TTL = 51 cm). The distance of fish from the transducer varied from 2.8-10.0 m and showed a strong bimodal distribution with peaks at 4.0 m and 8.0 m
4

corresponding to the two locations at which the DIDSON was positioned relative to the live-box door (Figure 10). As with tethered fish, estimates of DL from images of free-swimming fish had a strong linear relationship with TTL (Figure 11). TTL alone explained 90% of the total variation in DL, and neither slope nor intercept differed by species (F < 2.2; P > 0.09). Unlike the tethered fish, DL estimates of free-swimming fish were not affected by distance of the fish from the transducer (F = 0.7; df = 1,129; P = 0.41), and exhibited little or no bias (Figure 11). The intercept of the regression between DL and TTL was positive, and the slope was slightly less than one (Table 1). Thus there was a slight positive bias for fish less than 68 cm and a slight negative bias for fish greater than 68 cm (Figure 11). For example, a Dolly Varden whose TTL is 40 cm would have a length 3.3 cm (SE = 0.7) higher when estimated from DIDSON images, and a Chinook whose TTL is 90 cm would have a length 2.5 cm (SE = 0.9) lower based on DIDSON images. This effect would be negligible under most circumstances.
Occasionally there was substantial error associated with individual DIDSON length estimates, especially when fish behavior was erratic. Natural arching of the fish body or changes in orientation sometimes led to individual measurements that were too small. We found that it was critical to inspect as much of the data as possible from each fish, and to disregard frames in which such a behavior effect was evident. The combination of erratic behavior and a narrow beam (at close distances, relative to fish size) sometimes limited the number of satisfactory frames from which to make measurements. These factors all contributed to produce moderate measurement error in the DIDSON length estimates (square root of mean squared error [RMSE] between 5.1 and 6.8 cm, Table 1).
In the case of the tethered fish, DIDSON length measurements were also biased and affected by distance from the transducer. The bias and the distance effect are problematic because they make it difficult to translate DL into TTL. If length estimates were needed for species discrimination applications, but only biased measurements were available from the DIDSON, it would be desirable to conduct a special tethered-fish study to estimate the magnitude of the bias for each and every potential application.
In contrast, the measurements of free-swimming fish in the Anchor River exhibited neither bias nor an effect of distance from transducer. Fortunately, the Anchor River results are the most relevant because future DIDSON applications would involve measurements of free-swimming fish. Nevertheless, it is important to understand how the results from the two experiments could differ so radically. We believe that the divergent results are largely the result of differential sensitivity of DIDSON sub-beams depending on distance from the acoustic axis. Thus the bias and distance effects that were evident in the tethered fish results were probably an artifact of an (unnatural) restriction of measurements to fish located only in the center of the beam. See Appendix A for a proposed explanation of the differences in DIDSON length measurements between tethered- and free-swimming fish.
Overall, DIDSON measurements of fish size show good potential for discrimination among species of different sizes. Ideally the size difference should be large relative to the DIDSON length measurement error standard deviation (RMSE = 5.1-6.8 cm, Table 1). Under these conditions, simple size thresholds may suffice for species discrimination. Even when length measurements overlap, it may still be possible to estimate species composition by fitting mixture models (Fleischman and Burwen 2003) of the DIDSON length frequency distribution.
5
EFFECTS OF DISTANCE FROM TRANSDUCER ON DETECTION All experiments were conducted with the standard model DIDSON for which the manufacturer advertises the DIDSON’s maximum operating range at 30 m. We suspected that this maximum distance might be reduced by some amount due to the high glacial silt load in the Kenai River.
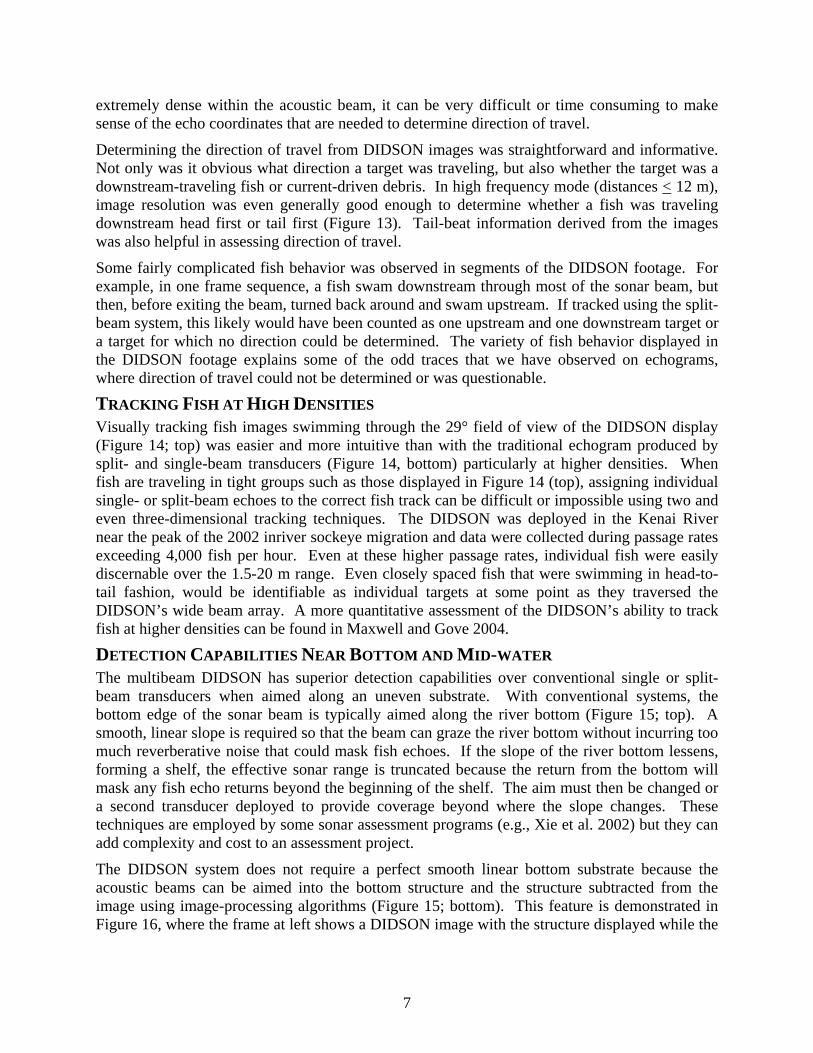
The furthest distance at which we were successfully able to detect a tethered fish during these experiments was 20 m. Figure 12 shows two tethered fish at approximately 10 m (sockeye, TTL = 73 cm) and 20 m (Chinook, TTL = 101 cm), respectively. Although not obvious from this particular frame, there was a notable reduction in our ability to detect the fish at 20 m even though it was 28 cm larger than the closer fish. For example, once an optimal aim was found for both fish, we observed that in a tally from 100 sequential frames, the 20 m fish was present in only 46 DIDSON frames compared with 79 frames for the tethered fish at 10 m. In the case of free-swimming fish, however, despite the fact that the fish are not present in every frame, it seemed reasonably easy to track individual fish at this distance as they transited the 29o beam. Consequently, we have used 20 m as the “rule of thumb” maximum detection distance in the Kenai River. Some free-swimming fish could be detected as far as 30 m from the transducer, however these fish appeared more like “flickering lights” that could not be successfully tracked in a cohesive manner though the beam.
Each individual DIDSON sonar assessment program will likely have to perform “beam-mapping” protocols with fish-sized targets to establish that all fish above a certain size within the insonified zone are being detected and can be tracked as individual fish through the horizontal array of beams. This is the standard protocol implemented on most sonar assessment projects to determine maximum distance of detection, and to establish that there are no acoustically shadowed areas within the insonified zone.
The DIDSON instrument we tested was limited to approximately 20 m. Distances greater than 50 m are required to fully insonify the Kenai River, thus the standard DIDSON would not be able to completely replace the current split-beam system for either counting salmon or determining species. However, information on free-swimming fish size provided by the DIDSON even over a limited distance will be valuable for evaluating the effectiveness of techniques currently used to determine fish species on the Kenai River as well as promising new techniques based on echo shape characteristics (Burwen and Fleischman 1998; Burwen et al. 2003; Fleischman and Burwen 2003). Furthermore, a long-range prototype of the DIDSON has been developed and is undergoing evaluation (Suzanne Maxwell, ADF&G, Division of Commercial Fisheries, Region II, personal communication). Preliminary tests show this new system has capabilities exceeding distances of 60 m; however, image resolution is reduced. It is unknown what impact the reduced resolution will have on our ability to track fish at greater distances.
DETERMINING DIRECTION OF TRAVEL Determining the direction of travel for acoustic targets can be difficult in many side-looking riverine sonar applications for several reasons. If targets are close to shore, the number of echoes available to determine the direction of travel may be too limited to derive direction of travel where the beam width is small. Also because of the typically poor SNR associated with riverine conditions, phase information from returning echoes is often corrupted, leading to imperfect echo coordinates for determining direction of travel. Finally, if fish behavior is complex, or fish are
6
extremely dense within the acoustic beam, it can be very difficult or time consuming to make sense of the echo coordinates that are needed to determine direction of travel.
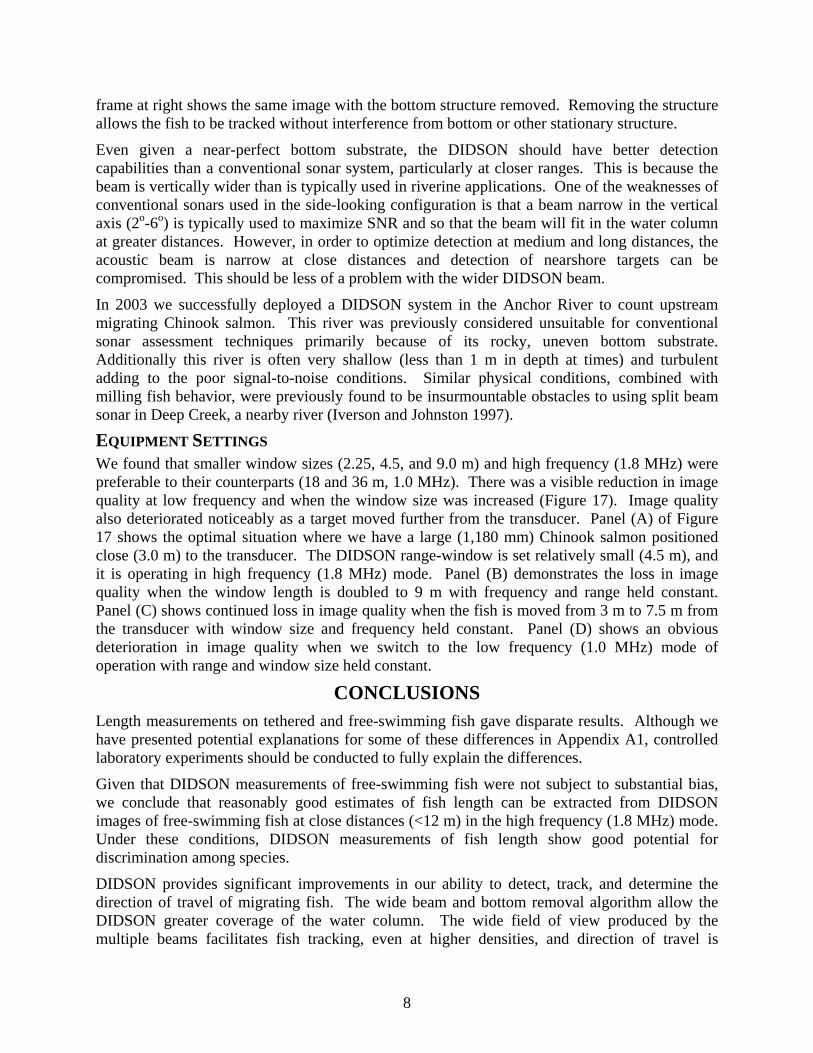
Determining the direction of travel from DIDSON images was straightforward and informative. Not only was it obvious what direction a target was traveling, but also whether the target was a downstream-traveling fish or current-driven debris. In high frequency mode (distances < 12 m), image resolution was even generally good enough to determine whether a fish was traveling downstream head first or tail first (Figure 13). Tail-beat information derived from the images was also helpful in assessing direction of travel.
Some fairly complicated fish behavior was observed in segments of the DIDSON footage. For example, in one frame sequence, a fish swam downstream through most of the sonar beam, but then, before exiting the beam, turned back around and swam upstream. If tracked using the split-beam system, this likely would have been counted as one upstream and one downstream target or a target for which no direction could be determined. The variety of fish behavior displayed in the DIDSON footage explains some of the odd traces that we have observed on echograms, where direction of travel could not be determined or was questionable.
TRACKING FISH AT HIGH DENSITIES Visually tracking fish images swimming through the 29° field of view of the DIDSON display (Figure 14; top) was easier and more intuitive than with the traditional echogram produced by split- and single-beam transducers (Figure 14, bottom) particularly at higher densities. When fish are traveling in tight groups such as those displayed in Figure 14 (top), assigning individual single- or split-beam echoes to the correct fish track can be difficult or impossible using two and even three-dimensional tracking techniques. The DIDSON was deployed in the Kenai River near the peak of the 2002 inriver sockeye migration and data were collected during passage rates exceeding 4,000 fish per hour. Even at these higher passage rates, individual fish were easily discernable over the 1.5-20 m range. Even closely spaced fish that were swimming in head-to-tail fashion, would be identifiable as individual targets at some point as they traversed the DIDSON’s wide beam array. A more quantitative assessment of the DIDSON’s ability to track fish at higher densities can be found in Maxwell and Gove 2004.
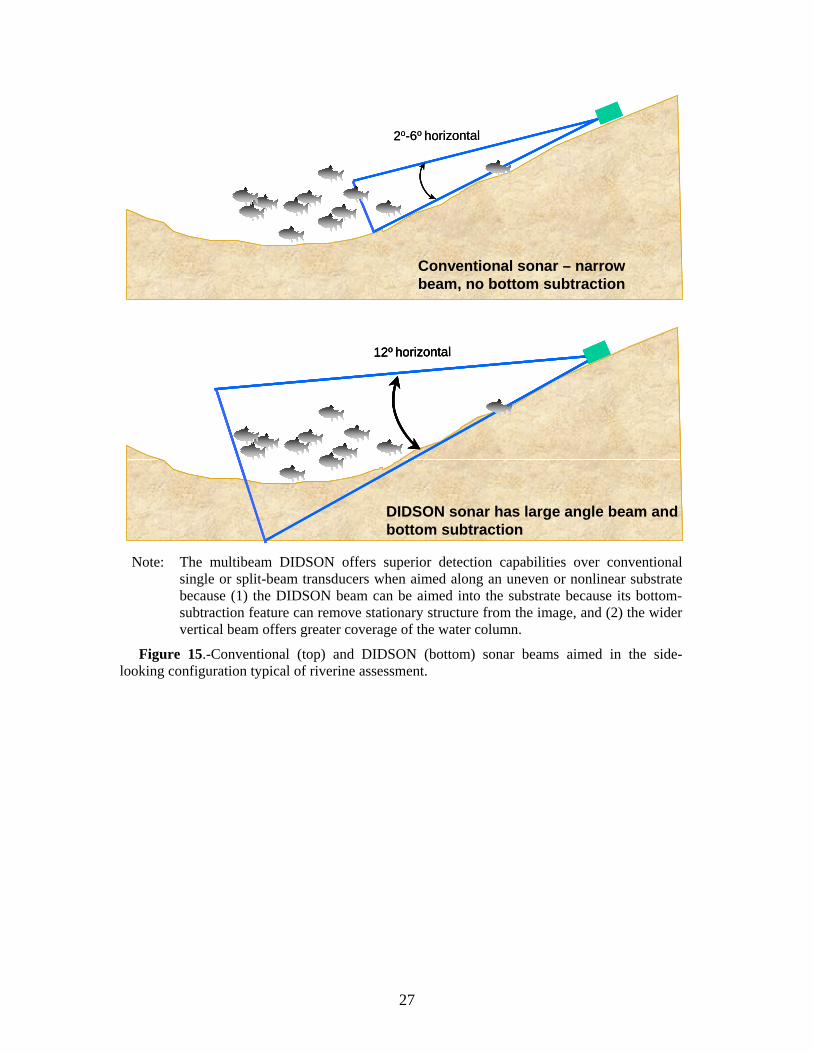
DETECTION CAPABILITIES NEAR BOTTOM AND MID-WATER The multibeam DIDSON has superior detection capabilities over conventional single or split-beam transducers when aimed along an uneven substrate. With conventional systems, the bottom edge of the sonar beam is typically aimed along the river bottom (Figure 15; top). A smooth, linear slope is required so that the beam can graze the river bottom without incurring too much reverberative noise that could mask fish echoes. If the slope of the river bottom lessens, forming a shelf, the effective sonar range is truncated because the return from the bottom will mask any fish echo returns beyond the beginning of the shelf. The aim must then be changed or a second transducer deployed to provide coverage beyond where the slope changes. These techniques are employed by some sonar assessment programs (e.g., Xie et al. 2002) but they can add complexity and cost to an assessment project.
The DIDSON system does not require a perfect smooth linear bottom substrate because the acoustic beams can be aimed into the bottom structure and the structure subtracted from the image using image-processing algorithms (Figure 15; bottom). This feature is demonstrated in Figure 16, where the frame at left shows a DIDSON image with the structure displayed while the
7
frame at right shows the same image with the bottom structure removed. Removing the structure allows the fish to be tracked without interference from bottom or other stationary structure.
Even given a near-perfect bottom substrate, the DIDSON should have better detection capabilities than a conventional sonar system, particularly at closer ranges. This is because the beam is vertically wider than is typically used in riverine applications. One of the weaknesses of conventional sonars used in the side-looking configuration is that a beam narrow in the vertical axis (2o-6o) is typically used to maximize SNR and so that the beam will fit in the water column at greater distances. However, in order to optimize detection at medium and long distances, the acoustic beam is narrow at close distances and detection of nearshore targets can be compromised. This should be less of a problem with the wider DIDSON beam.
In 2003 we successfully deployed a DIDSON system in the Anchor River to count upstream migrating Chinook salmon. This river was previously considered unsuitable for conventional sonar assessment techniques primarily because of its rocky, uneven bottom substrate. Additionally this river is often very shallow (less than 1 m in depth at times) and turbulent adding to the poor signal-to-noise conditions. Similar physical conditions, combined with milling fish behavior, were previously found to be insurmountable obstacles to using split beam sonar in Deep Creek, a nearby river (Iverson and Johnston 1997).
EQUIPMENT SETTINGS We found that smaller window sizes (2.25, 4.5, and 9.0 m) and high frequency (1.8 MHz) were preferable to their counterparts (18 and 36 m, 1.0 MHz). There was a visible reduction in image quality at low frequency and when the window size was increased (Figure 17). Image quality also deteriorated noticeably as a target moved further from the transducer. Panel (A) of Figure 17 shows the optimal situation where we have a large (1,180 mm) Chinook salmon positioned close (3.0 m) to the transducer. The DIDSON range-window is set relatively small (4.5 m), and it is operating in high frequency (1.8 MHz) mode. Panel (B) demonstrates the loss in image quality when the window length is doubled to 9 m with frequency and range held constant. Panel (C) shows continued loss in image quality when the fish is moved from 3 m to 7.5 m from the transducer with window size and frequency held constant. Panel (D) shows an obvious deterioration in image quality when we switch to the low frequency (1.0 MHz) mode of operation with range and window size held constant.
CONCLUSIONS Length measurements on tethered and free-swimming fish gave disparate results. Although we have presented potential explanations for some of these differences in Appendix A1, controlled laboratory experiments should be conducted to fully explain the differences.
Given that DIDSON measurements of free-swimming fish were not subject to substantial bias, we conclude that reasonably good estimates of fish length can be extracted from DIDSON images of free-swimming fish at close distances (<12 m) in the high frequency (1.8 MHz) mode. Under these conditions, DIDSON measurements of fish length show good potential for discrimination among species.
DIDSON provides significant improvements in our ability to detect, track, and determine the direction of travel of migrating fish. The wide beam and bottom removal algorithm allow the DIDSON greater coverage of the water column. The wide field of view produced by the multiple beams facilitates fish tracking, even at higher densities, and direction of travel is
8

unambiguous for most targets. The DIDSON is easy to aim and easy to operate resulting in minimal operator errors, and subsequently a higher level of accuracy and confidence in sonar estimates of fish abundance. ADF&G has selected the DIDSON as the preferred system for replacing many of its aging sonar systems at sites where coverage up to 20 m is sufficient.
The DIDSON’s high-resolution image and bottom removal feature may allow acoustic assessment of fish passage in many rivers and streams previously considered unsuitable for sonar assessment due to their physical attributes.
ACKNOWLEDGMENTS We would like to thank the Kenai River Sportfishing Association for funding a large portion of this research study. We are grateful to Bill Hanot for the training and assistance in running the DIDSON sonar unit and for the many software modifications he made on site. We would like to thank Pat Nealson who attended the operation of the HTI split-beam sonar throughout the experiments and provided invaluable assistance in all other aspects of these experiments. We would also like to thank Mark Jensen for his competent help in deploying sonar equipment and for his considerable fish tethering expertise. We would also like to thank Linda Lowder, Mike Hopp, Sarah Donchi, and Don Eide, for continuing to meticulously collect sonar data for Chinook salmon estimates while we created many disturbances to their immediate environment. We also thank Tom Kerns, and Jeff Perschbacher for their enthusiastic assistance on the Anchor River experiments. Special thanks, also, to Division of Sport Fish staff in Soldotna who provided logistical support whenever needed. We are also grateful for the helpful and thorough reviews of this report (or sections of) by Carl Pfisterer, Suzanne Maxwell, and Tom Brookover.
REFERENCES CITED Belcher, E. O., B. Matsuyama, and G. R. Trimble. 2001. Object identification with acoustic lenses. Proceedings of
MTS/IEEE Oceans 2001, 1:6-11, Honolulu, Hawaii.
Burwen, D. L., D. E. Bosch, and S. J. Fleischman. 1998. Evaluation of hydroacoustic assessment techniques for Chinook salmon on the Kenai River, 1995. Alaska Department of Fish and Game, Fishery Data Series No. 98-3, Anchorage. http://www.sf.adfg.state.ak.us/FedAidPDFs/fds98-03.pdf
Burwen, D. L., and S. J. Fleischman. 1998. Evaluation of side-aspect target strength and pulse width as hydroacoustic discriminators of fish species in rivers. Canadian Journal of Fisheries and Aquatic Sciences 55:2492-2502.
Burwen, D. L., S. J. Fleischman, J. D. Miller, and M. E. Jensen. 2003. Time-based signal characteristics as predictors of fish size and species for a side-looking hydroacoustic application in a river. ICES Journal of Marine Science 60:662-668.
Daum, D. W., and B. M. Osborne. 1998. Use of fixed-location, split-beam sonar to describe temporal and spatial patterns of adult fall chum salmon migration in the Chandalar River, Alaska. North American Journal of Fisheries Management 18:477-486.
Dunbar, R. 2001. Copper River hydroacoustic salmon enumeration studies, 2000 and 2001. Alaska Department of Fish and Game, Commercial Fisheries Division, Regional Information Report 2A01-3, Anchorage.
Fleischman, S. J., and D. L. Burwen. 2003. Mixture models for the species apportionment of hydroacoustic data, with echo-envelope length as the discriminatory variable. ICES Journal of Marine Science 60:592-598.
Iverson, T. K., and S. V. Johnston. 1997. Hydroacoustic evaluation of adult Chinook salmon in Deep Creek during 1996: second year feasibility study. Report by Hydroacoustic Technology, Inc. to Alaska Department of Fish and Game, Division of Sport Fish, Anchorage, Alaska.
9
REFERENCES CITED (Continued) Maxwell, S. L., and N. E. Gove. 2004. The feasibility of estimating migrating salmon passage rates in turbid rivers
using a dual frequency identification sonar (DIDSON) 2002. Alaska Department of Fish and Game, Division of Commercial Fisheries, Regional Information Report 2A04-05, Anchorage.
McKinley, L. 2003. Sonar enumeration of Pacific salmon escapement into the Nushagak River, 2002. Alaska Department of Fish and Game, Division of Commercial Fisheries, Regional Information Report 2A03-05, Anchorage.
Miller, J. D., D. L. Burwen, and S. J. Fleischman. 2005. Estimates of Chinook salmon abundance in the Kenai River using split-beam sonar, 2003. Alaska Department of Fish and Game, Fishery Data Series No. 05-59, Anchorage. http://www.sf.adfg.state.ak.us/FedAidPDFs/fds05-59.pdf
Neter, J., W. Wasserman, and M. H. Kutner. 1985. Applied linear statistical models, second edition. Richard D. Irwin, Inc., Homewood, Illinois.
Osborne, M., and J. L. Melegari. 2002. Use of split-beam sonar to enumerate Chandalar River fall chum salmon, 2000. U.S. Fish and Wildlife Service. Alaska Fisheries Technical Report No. 61. Fishery Resource Office, Fairbanks, Alaska.
Simmonds, E. J., and D. N. MacLennan. 2005. Fisheries acoustics theory and practice, second edition. Blackwell Science, Oxford.
Westerman, D., and T. M. Willette. 2003. Upper Cook Inlet salmon escapement studies, 2002. Alaska Department of Fish and Game, Division of Commercial Fisheries, Regional Information Report 2A03-24, Anchorage.
Xie, Y., T. J. Mulligan, G. M. W. Cronkite, and A. P. Gray. 2002. Assessment of potential bias in hydroacoustic estimation of Fraser River sockeye and pink salmon at Mission, B.C. Pacific Salmon Commission Technical Report No. 11. Pacific Salmon Commission. Vancouver, B.C.
10

TABLES
11
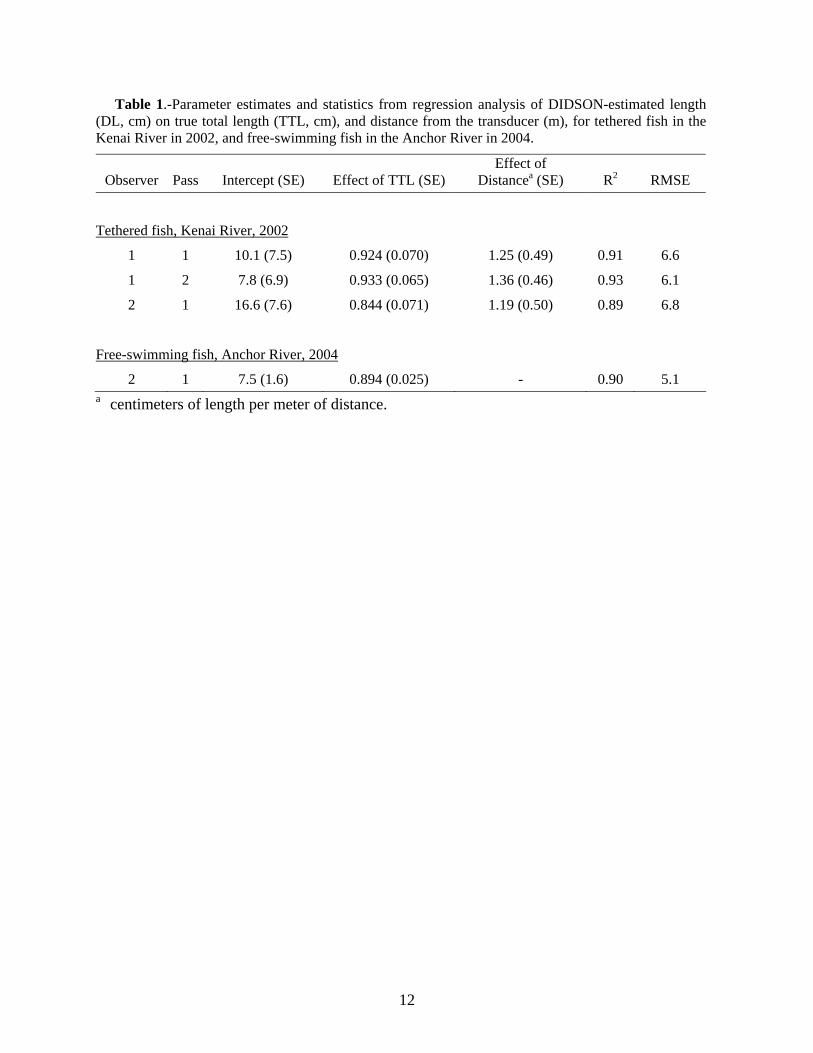
Table 1.-Parameter estimates and statistics from regression analysis of DIDSON-estimated length (DL, cm) on true total length (TTL, cm), and distance from the transducer (m), for tethered fish in the Kenai River in 2002, and free-swimming fish in the Anchor River in 2004.
Pass Intercept (SE) Effect of TTL (SE) Effect of
Distancea (SE) R2 RMSE Observer
Tethered fish, Kenai River, 2002
1 1 10.1 (7.5) 0.924 (0.070) 1.25 (0.49) 0.91 6.6
1 2 7.8 (6.9) 0.933 (0.065) 1.36 (0.46) 0.93 6.1
2 1 16.6 (7.6) 0.844 (0.071) 1.19 (0.50) 0.89 6.8
Free-swimming fish, Anchor River, 2004
2 1 7.5 (1.6) 0.894 (0.025) - 0.90 5.1 a centimeters of length per meter of distance.
12

FIGURES
13
0
0 .5 1
1.5
MILES
KILOMETERS
# RIVER MILEDIRECTION OF FLOW
Beaver Creek
Kenai River
Sterling Highway BridgeWarren Ames
Bridge
Chinook Sonar Site
Cook Inlet
Sockeye Sonar Site
Kilometers
to Anchorage
ALASKA
Kenai River
MooseRiver
Hidden Lake
SkilakLake
Kenai River
Kenai
FunnyRiver
RussianRiver
Soldotna
KilleyRiver
N
Miles0 105
0 5 10 15
CookInlet Kenai River
KenaiLake
toHomer
0
0 .5 1
1.5
MILES
KILOMETERS
# RIVER MILEDIRECTION OF FLOW
Beaver Creek
Kenai River
Sterling Highway BridgeWarren Ames
Bridge
Chinook Sonar Site
Cook Inlet
Sockeye Sonar Site
0
0 .5 1
1.5
MILES
KILOMETERS
# RIVER MILEDIRECTION OF FLOW
Beaver Creek
Kenai River
Sterling Highway BridgeWarren Ames
Bridge
Chinook Sonar Site
Cook Inlet
Sockeye Sonar Site
Kilometers
to Anchorage
ALASKA
Kenai River
MooseRiver
Hidden Lake
SkilakLake
Kenai River
Kenai
FunnyRiver
RussianRiver
Soldotna
KilleyRiver
N
Miles0 105
0 5 10 15
CookInlet Kenai River
KenaiLake
toHomer
Figure 1.-Kenai River showing location of Chinook salmon sonar site and DIDSON
experiments, 2002.
14
90 m
4 m
High Tide Water Level
Low Tide Water Level
90 m
4 m
High Tide Water Level
Low Tide Water Level
Figure 2.-Aerial and cross-sectional views of the sonar site at river km 14 on the
Kenai River.
15
River FlowTo Anchor
River Flow
5 m nearshore station
10 m farshore station
River FlowTo Anchor
River FlowTo Anchor
River FlowTo Anchor
River Flow
5 m nearshore station
10 m farshore station
Figure 3.-Configuration for tethering fish in side-looking sonar beams from side (top) and
aerial (bottom) views.
16
KENAI PENINSULANinilchik River
Deep Creek
Stariski Creek
Homer
Kachemak Bay
SterlingHighway
North Fork
South Fork
Cook Inlet
Anchor River
Homer Spit
Cytex Creek
Location of detail
Alaska
0 10
miles
N
S
W E
Anchor River weir
KENAI PENINSULANinilchik River
Deep Creek
Stariski Creek
Homer
Kachemak Bay
SterlingHighway
North Fork
South Fork
Cook Inlet
Anchor River
Homer Spit
Cytex Creek
Location of detail
Alaska
0 10
miles
N
S
W E
Anchor River weir
Figure 4.–The southern Kenai Peninsula showing location of the Anchor River weir site and
DIDSON experiments, 2004.
17
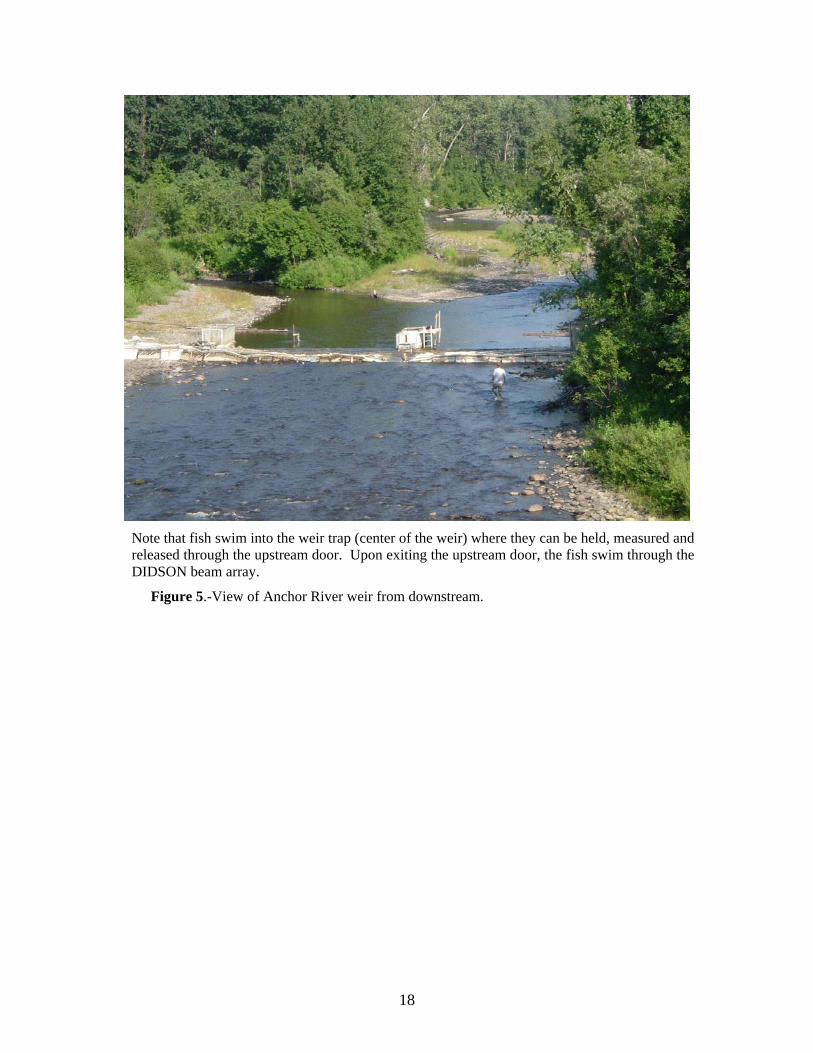
Note that fish swim into the weir trap (center of the weir) where they can be held, measured and released through the upstream door. Upon exiting the upstream door, the fish swim through the DIDSON beam array.
Figure 5.-View of Anchor River weir from downstream.
18
Live-box Door
DIDSON
Typical fish trajectory
Live-box Door
DIDSON
Typical fish trajectory
Note: The DISON was aimed to insonify the fish at side-aspect as they were released
through the live-box door. Figure 6.-DIDSON deployment at Anchor River weir site.
19
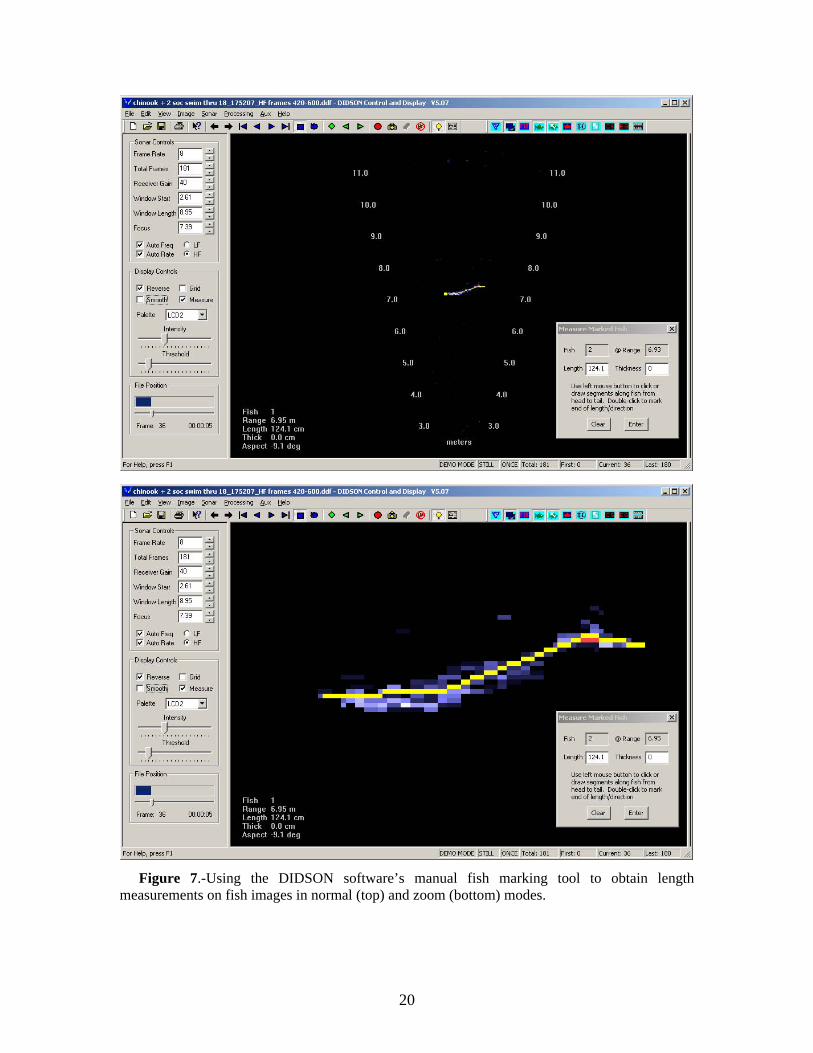
Figure 7.-Using the DIDSON software’s manual fish marking tool to obtain length
measurements on fish images in normal (top) and zoom (bottom) modes.
20
0
1
2
3
4
5
1 2 3 4 5 6 7 8 9 10 11 12 13
Distance from Transducer (m)
Freq
uenc
y
Figure 8.-Range (distance to the transducer) frequency distribution for 10
tethered fish on the Kenai River, 2002.
21
50
70
90
110
130
50 70 90 110 130
DID
SON
leng
th (c
m)
50
70
90
110
130
50 70 90 110 130
DID
SON
leng
th (c
m)
50
70
90
110
130
50 70 90 110 130
DID
SON
leng
th (c
m)
True Total Length (cm)
Note: Fish measured at distances < 9 m from the transducer are
shown by black circles and fish measured > 9 m are shown by gray squares.
Figure 9.-DIDSON length versus true length for 10 tethered fish as measured by Observer 1-pass 1 (top), Observer 1-pass 2 (middle), and Observer 2 (bottom).
22
23
0
10
20
30
40
50
60
70
1 2 3 4 5 6 7 8 9 10 11 12 13
Range (m)
Freq
uenc
y
Figure 10.-Range (distance to the transducer) frequency distribution for 133
free-swimming fish on the Anchor River, 2004.
20
30
40
50
60
70
80
90
100
110
20 30 40 50 60 70 80 90 100 110
DID
SO
N le
ngth
(cm
)
True Total Length (cm)
Note: Fish measured at distances < 5 m from the transducer are shown by black circles and fish measured > 5 m are shown by gray squares.
Figure 11.-DIDSON length versus true length for 133 free-swimming fish on the Anchor River (Observer 2).
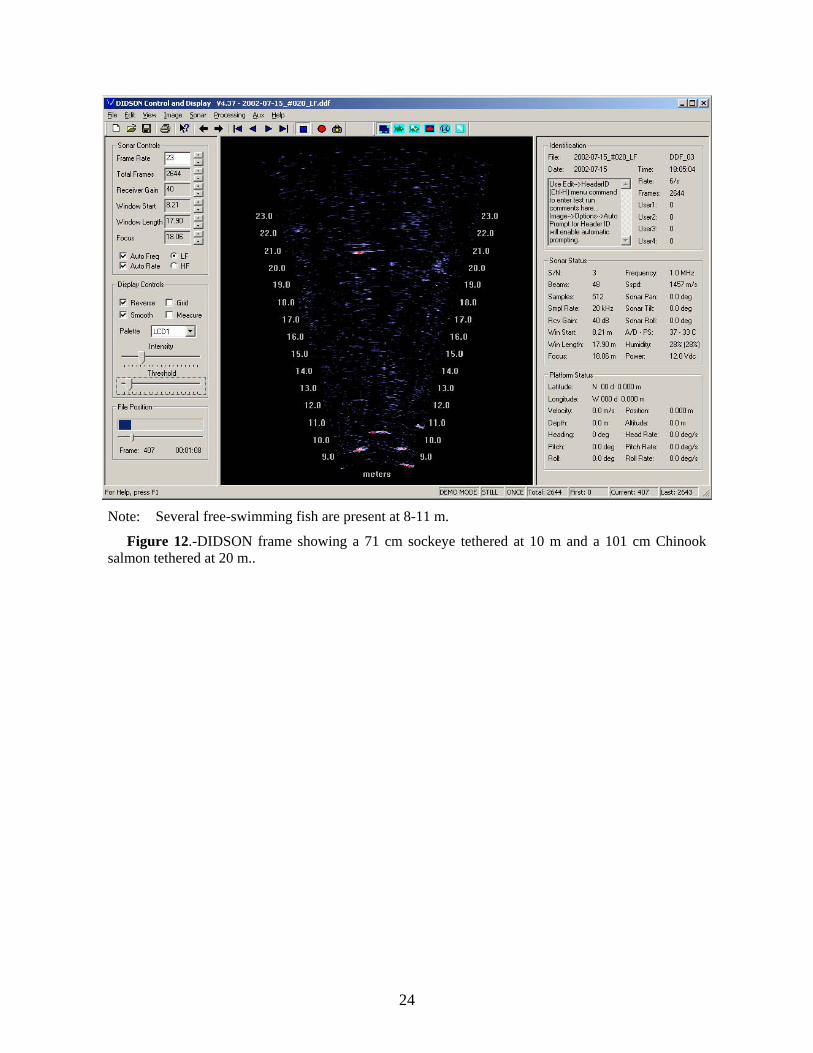
Note: Several free-swimming fish are present at 8-11 m.
Figure 12.-DIDSON frame showing a 71 cm sockeye tethered at 10 m and a 101 cm Chinook salmon tethered at 20 m..
24
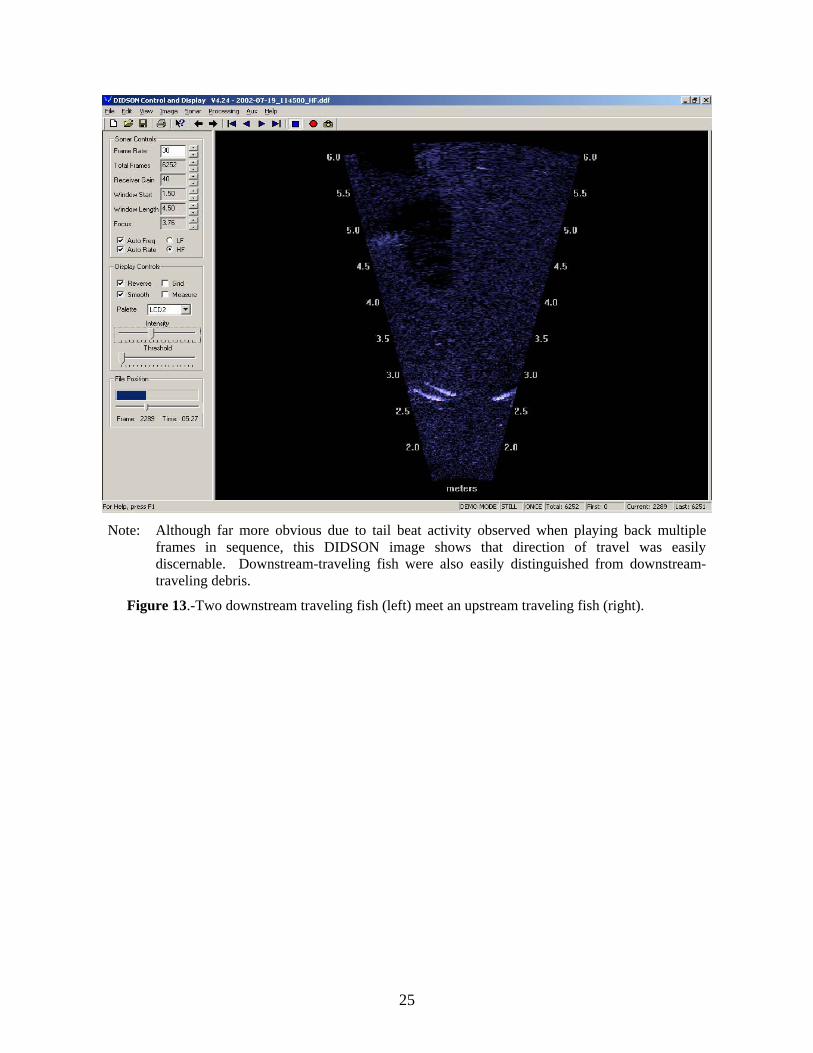
Note: Although far more obvious due to tail beat activity observed when playing back multiple
frames in sequence, this DIDSON image shows that direction of travel was easily discernable. Downstream-traveling fish were also easily distinguished from downstream-traveling debris.
Figure 13.-Two downstream traveling fish (left) meet an upstream traveling fish (right).
25

Figure 14.-Visually tracking fish images swimming through the 30o field of view
of the DIDSON display (top) is easier and more intuitive than with the traditional echogram produced by split- and single-beam sonars (example from a split-beam with a 3ox10o transducer shown on bottom).
26
2o-6o horizontal
Conventional sonar – narrow beam, no bottom subtraction
12o horizontal
DIDSON sonar has large angle beam and bottom subtraction
2o-6o horizontal
Conventional sonar – narrow beam, no bottom subtraction
12o horizontal
DIDSON sonar has large angle beam and bottom subtraction
12o horizontal
DIDSON sonar has large angle beam and bottom subtraction
Note: The multibeam DIDSON offers superior detection capabilities over conventional
single or split-beam transducers when aimed along an uneven or nonlinear substrate because (1) the DIDSON beam can be aimed into the substrate because its bottom-subtraction feature can remove stationary structure from the image, and (2) the wider vertical beam offers greater coverage of the water column.
Figure 15.-Conventional (top) and DIDSON (bottom) sonar beams aimed in the side-looking configuration typical of riverine assessment.
27
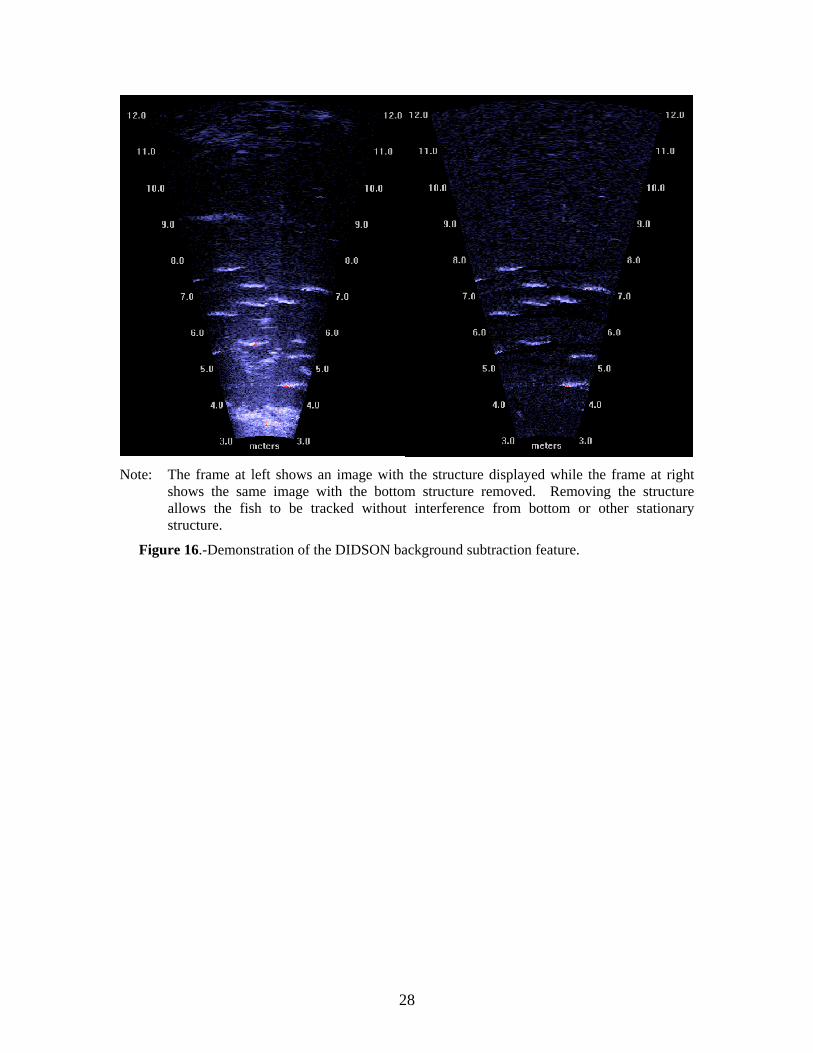
Note: The frame at left shows an image with the structure displayed while the frame at right
shows the same image with the bottom structure removed. Removing the structure allows the fish to be tracked without interference from bottom or other stationary structure.
Figure 16.-Demonstration of the DIDSON background subtraction feature.
28
A B
C D Figure 17.-A high resolution image of a tethered Chinook salmon (A) degrades as the range
window size is doubled from 4.5 m to 9 m (B), the distance to the transducer is more than doubled (C), and the frequency is lowered from 1.8 MHz (high frequency mode) to 1.0 MHz (low frequency mode) (D).
29

30

APPENDIX A
31
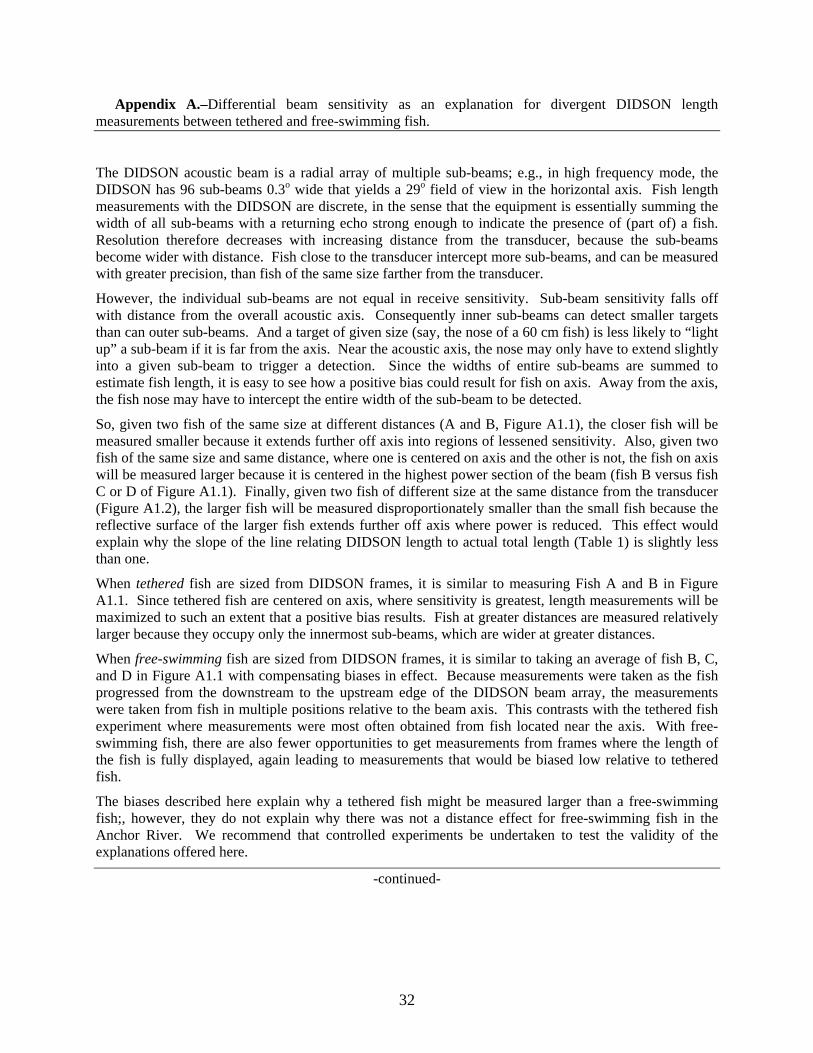
Appendix A.–Differential beam sensitivity as an explanation for divergent DIDSON length measurements between tethered and free-swimming fish.
The DIDSON acoustic beam is a radial array of multiple sub-beams; e.g., in high frequency mode, the DIDSON has 96 sub-beams 0.3o wide that yields a 29o field of view in the horizontal axis. Fish length measurements with the DIDSON are discrete, in the sense that the equipment is essentially summing the width of all sub-beams with a returning echo strong enough to indicate the presence of (part of) a fish. Resolution therefore decreases with increasing distance from the transducer, because the sub-beams become wider with distance. Fish close to the transducer intercept more sub-beams, and can be measured with greater precision, than fish of the same size farther from the transducer.
However, the individual sub-beams are not equal in receive sensitivity. Sub-beam sensitivity falls off with distance from the overall acoustic axis. Consequently inner sub-beams can detect smaller targets than can outer sub-beams. And a target of given size (say, the nose of a 60 cm fish) is less likely to “light up” a sub-beam if it is far from the axis. Near the acoustic axis, the nose may only have to extend slightly into a given sub-beam to trigger a detection. Since the widths of entire sub-beams are summed to estimate fish length, it is easy to see how a positive bias could result for fish on axis. Away from the axis, the fish nose may have to intercept the entire width of the sub-beam to be detected.
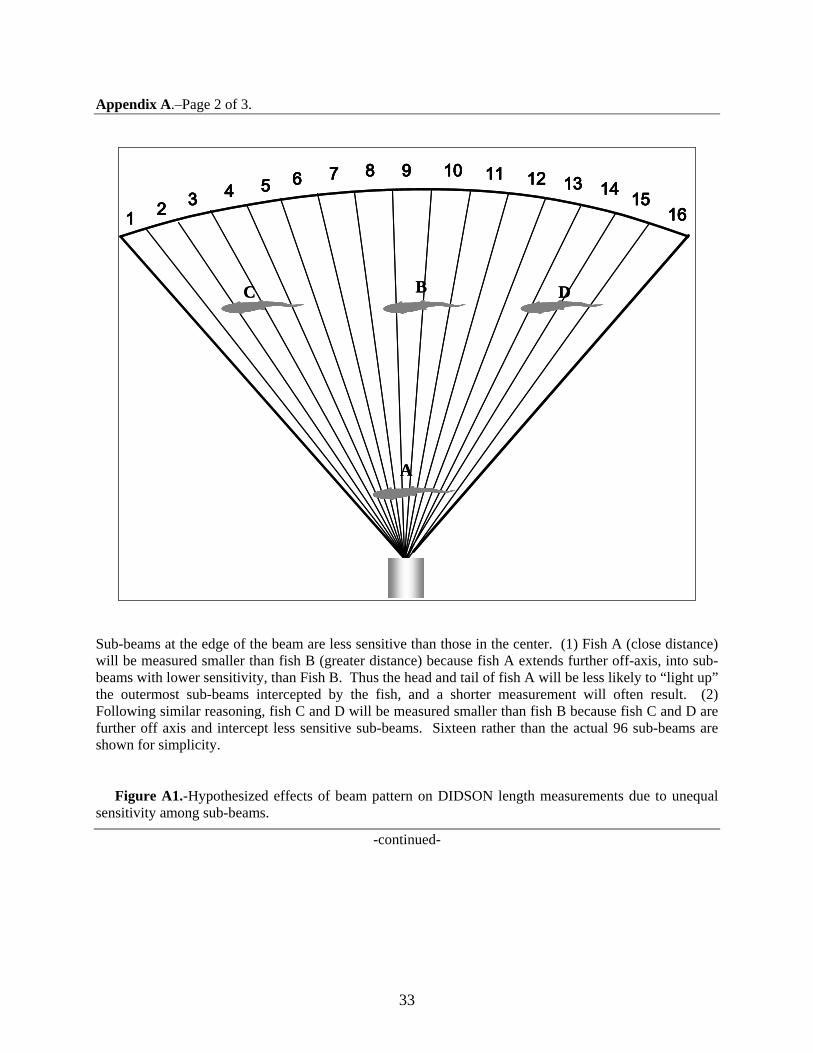
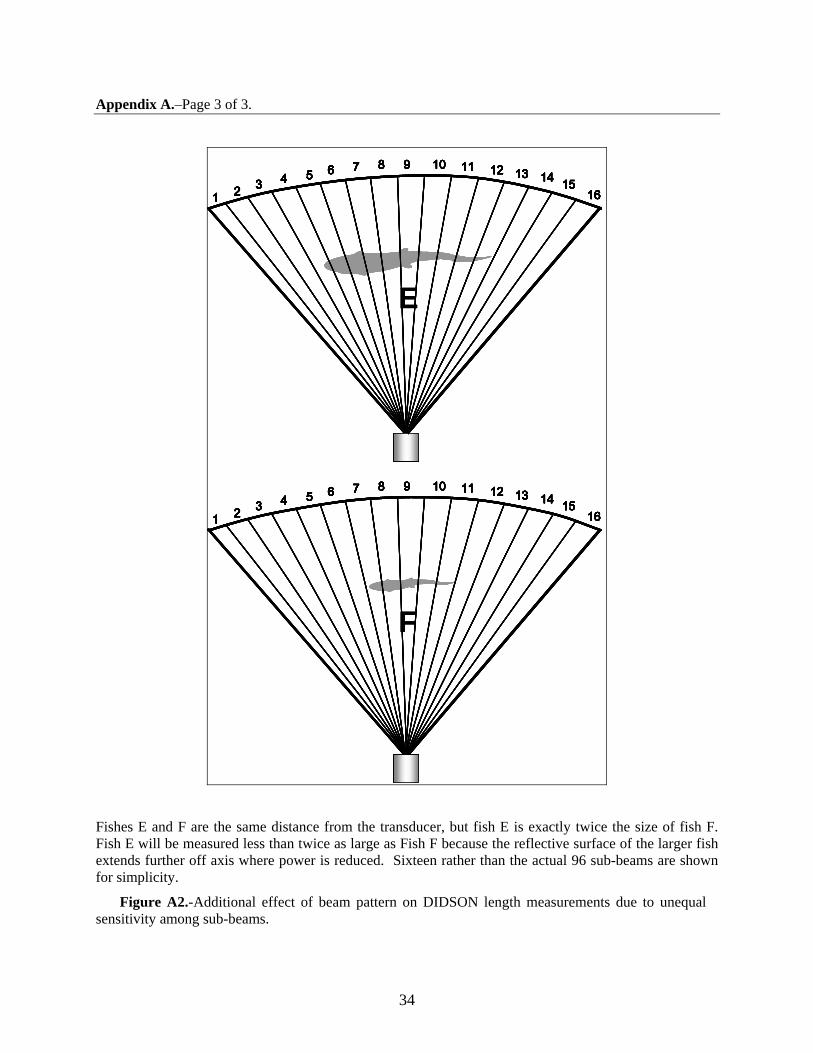
So, given two fish of the same size at different distances (A and B, Figure A1.1), the closer fish will be measured smaller because it extends further off axis into regions of lessened sensitivity. Also, given two fish of the same size and same distance, where one is centered on axis and the other is not, the fish on axis will be measured larger because it is centered in the highest power section of the beam (fish B versus fish C or D of Figure A1.1). Finally, given two fish of different size at the same distance from the transducer (Figure A1.2), the larger fish will be measured disproportionately smaller than the small fish because the reflective surface of the larger fish extends further off axis where power is reduced. This effect would explain why the slope of the line relating DIDSON length to actual total length (Table 1) is slightly less than one.
When tethered fish are sized from DIDSON frames, it is similar to measuring Fish A and B in Figure A1.1. Since tethered fish are centered on axis, where sensitivity is greatest, length measurements will be maximized to such an extent that a positive bias results. Fish at greater distances are measured relatively larger because they occupy only the innermost sub-beams, which are wider at greater distances.
When free-swimming fish are sized from DIDSON frames, it is similar to taking an average of fish B, C, and D in Figure A1.1 with compensating biases in effect. Because measurements were taken as the fish progressed from the downstream to the upstream edge of the DIDSON beam array, the measurements were taken from fish in multiple positions relative to the beam axis. This contrasts with the tethered fish experiment where measurements were most often obtained from fish located near the axis. With free-swimming fish, there are also fewer opportunities to get measurements from frames where the length of the fish is fully displayed, again leading to measurements that would be biased low relative to tethered fish.
The biases described here explain why a tethered fish might be measured larger than a free-swimming fish;, however, they do not explain why there was not a distance effect for free-swimming fish in the Anchor River. We recommend that controlled experiments be undertaken to test the validity of the explanations offered here.
-continued-
32
33
Appendix A.–Page 2 of 3.
1 2 3 4 5 6 7 8 9 10 11 12 13 14 1516
A
BC D
1 2 3 4 5 6 7 8 9 10 11 12 13 14 15161 2 3 4 5 6 7 8 9 10 11 12 13 14 1516
A
BC D
Sub-beams at the edge of the beam are less sensitive than those in the center. (1) Fish A (close distance) will be measured smaller than fish B (greater distance) because fish A extends further off-axis, into sub-beams with lower sensitivity, than Fish B. Thus the head and tail of fish A will be less likely to “light up” the outermost sub-beams intercepted by the fish, and a shorter measurement will often result. (2) Following similar reasoning, fish C and D will be measured smaller than fish B because fish C and D are further off axis and intercept less sensitive sub-beams. Sixteen rather than the actual 96 sub-beams are shown for simplicity.
Figure A1.-Hypothesized effects of beam pattern on DIDSON length measurements due to unequal
sensitivity among sub-beams.
-continued-
Appendix A.–Page 3 of 3.
F
1 2 3 4 5 6 7 8 9 10 11 12 13 14 1516
1 2 3 4 5 6 7 8 9 10 11 12 13 14 1516
E
F
1 2 3 4 5 6 7 8 9 10 11 12 13 14 15161 2 3 4 5 6 7 8 9 10 11 12 13 14 15161 2 3 4 5 6 7 8 9 10 11 12 13 14 15161 2 3 4 5 6 7 8 9 10 11 12 13 14 15161 2 3 4 5 6 7 8 9 10 11 12 13 14 1516
1 2 3 4 5 6 7 8 9 10 11 12 13 14 15161 2 3 4 5 6 7 8 9 10 11 12 13 14 15161 2 3 4 5 6 7 8 9 10 11 12 13 14 15161 2 3 4 5 6 7 8 9 10 11 12 13 14 15161 2 3 4 5 6 7 8 9 10 11 12 13 14 1516
E
Fishes E and F are the same distance from the transducer, but fish E is exactly twice the size of fish F. Fish E will be measured less than twice as large as Fish F because the reflective surface of the larger fish extends further off axis where power is reduced. Sixteen rather than the actual 96 sub-beams are shown for simplicity.
Figure A2.-Additional effect of beam pattern on DIDSON length measurements due to unequal sensitivity among sub-beams.
34