evaluation metrics and analysis of first annotation round
TRANSCRIPT
This document is part of the Research and Innovation Action “Quality Translation 21 (QT21)”.This project has received funding from the European Union’s Horizon 2020 program for ICT
under grant agreement no. 645452.
Deliverable D3.3
Evaluation metrics and analysis offirst annotation round
Aljoscha Burchardt (DFKI), Frederic Blain (USFD), Ondrej Bojar (CUNI),Jon Dehdari (DFKI), Yvette Graham (DCU), Attila Görög (TAUS), Georg
Heigold (DFKI), Qun Liu (DCU), Qingsong Ma (DCU),Lucia Specia (USFD), Inguna Skadiņa (Tilde), Mārcis Pinnis (Tilde),
Marco Turchi (FBK), Vivien Macketanz (DFKI),Jan-Thorsten Peter (RWTH), Philip Williams (UEDIN)
Dissemination Level: Public
Draft (Revision 0.1), 31st January, 2017
Quality Translation 21D3.3: Evaluation metrics and analysis of first annotation round
Grant agreement no. 645452Project acronym QT21Project full title Quality Translation 21Type of action Research and Innovation ActionCoordinator Prof. Josef van Genabith (DFKI)Start date, duration 1st February, 2015, 36 monthsDissemination level PublicContractual date of delivery 31st January, 2017Actual date of delivery 31st January, 2017Deliverable number D3.3Deliverable title Evaluation metrics and analysis of first annotation roundType ReportStatus and version Draft (Revision 0.1)Number of pages 146Contributing partners DFKI, USFD, DCU, FBK, TAUS, TILDE, UEDIN, RWTHWP leader FBKAuthor(s) Aljoscha Burchardt (DFKI), Frederic Blain (USFD),
Ondrej Bojar (CUNI), Jon Dehdari (DFKI), Yvette Graham (DCU),Attila Görög (TAUS), Georg Heigold (DFKI), Qun Liu (DCU),Qingsong Ma (DCU), Lucia Specia (USFD), Inguna Skadiņa (Tilde),Mārcis Pinnis (Tilde), Marco Turchi (FBK), Vivien Macketanz (DFKI),Jan-Thorsten Peter (RWTH), Philip Williams (UEDIN)
EC project officer Susan FraserThe partners in QT21 are: • Deutsches Forschungszentrum für Künstliche Intelligenz GmbH
(DFKI), Germany• Rheinisch-Westfälische Technische Hochschule Aachen (RWTH),
Germany• Universiteit van Amsterdam (UvA), Netherlands• Dublin City University (DCU), Ireland• University of Edinburgh (UEDIN), United Kingdom• Karlsruher Institut für Technologie (KIT), Germany• Centre National de la Recherche Scientifique (CNRS), France• Univerzita Karlova v Praze (CUNI), Czech Republic• Fondazione Bruno Kessler (FBK), Italy• University of Sheffield (USFD), United Kingdom• TAUS b.v. (TAUS), Netherlands• text & form GmbH (TAF), Germany• TILDE SIA (TILDE), Latvia• Hong Kong University of Science and Technology (HKUST), Hong
Kong
For copies of reports, updates on project activities and other QT21-related information, contact:Prof. Stephan Busemann, DFKI GmbHStuhlsatzenhausweg 366123 Saarbrücken, Germany
[email protected]: +49 (681) 85775 5286Fax: +49 (681) 85775 5338
Copies of reports and other material can also be accessed via the project’s homepage:http://www.qt21.eu/
© 2017, The Individual AuthorsNo part of this document may be reproduced or transmitted in any form, or by any means,
electronic or mechanical, including photocopy, recording, or any information storage and retrievalsystem, without permission from the copyright owner.
Page 2 of 146
Quality Translation 21D3.3: Evaluation metrics and analysis of first annotation round
Contents1 Preliminary remark 5
2 Target diagnostics 7
3 Source-driven evaluation 8
4 Reference-based evaluation 104.1 Novel Reference-based MT Metrics . . . . . . . . . . . . . . . . . . . . . . . . . . 104.2 Reference-based Human Evaluation . . . . . . . . . . . . . . . . . . . . . . . . . . 104.3 Improvements to the Evaluation of Reference-based Metrics . . . . . . . . . . . . 11
5 Reference-free evaluation 155.1 What Can Language Industry Learn from Post-editing? . . . . . . . . . . . . . . 155.2 MT Quality Estimation for Computer-assisted Translation: Does it Really Help? 155.3 Online Multitask Learning for Machine Translation Quality Estimation . . . . . 155.4 Novel Quality Estimation Approaches . . . . . . . . . . . . . . . . . . . . . . . . 165.5 Improvements to Evaluation of MT Quality Estimation . . . . . . . . . . . . . . 17
References 19
A Report on activities related to MQM/DQF since M6 23
B Report on validation of MQM (subcontract Alan Melby, FIT) 28
C Statement from the European Commission’s Directorate General for Trans-lation on MQM 32
D Quality Test Suite and Results of First Annotation Round 33D.1 Test suite creation . . . . . . . . . . . . . . . . . . . . . . . . . . . . . . . . . . . 33D.2 Data structure . . . . . . . . . . . . . . . . . . . . . . . . . . . . . . . . . . . . . 34D.3 Privacy and Workflow . . . . . . . . . . . . . . . . . . . . . . . . . . . . . . . . . 36D.4 General use case: Evaluating QT21 engines and online system in a first annota-
tion round . . . . . . . . . . . . . . . . . . . . . . . . . . . . . . . . . . . . . . . . 36D.4.1 Results . . . . . . . . . . . . . . . . . . . . . . . . . . . . . . . . . . . . . 37D.4.2 Towards more generalisable results . . . . . . . . . . . . . . . . . . . . . . 49
D.5 Technical use case: Evaluating QTLeap WMT engines . . . . . . . . . . . . . . . 52D.5.1 Results on technical test suite . . . . . . . . . . . . . . . . . . . . . . . . . 52
D.6 Towards automation . . . . . . . . . . . . . . . . . . . . . . . . . . . . . . . . . . 53
E MT Quality Estimation for Computer-assisted Translation: Does it ReallyHelp? 56
F Online Multitask Learning for Machine Translation Quality Estimation 62
G CobaltF: A Fluent Metric for MT Evaluation 72
H Reference Bias in Monolingual Machine Translation Evaluation 80
I Multi-level Translation Quality Prediction with QuEst++ 86
J SHEF-MIME: Word-level Quality Estimation Using Imitation Learning 92
K SHEF-NN: Translation Quality Estimation with Neural Networks 97
L Phrase Level Segmentation and Labelling of Machine Translation Errors 103
Page 3 of 146
Quality Translation 21D3.3: Evaluation metrics and analysis of first annotation round
M USFD’s Phrase-level Quality Estimation Systems 109
N Investigating Continuous Space Language Models for Machine TranslationQuality Estimation 115
O SHEF-LIUM-NN: Sentence level Quality Estimation with Neural NetworkFeatures 121
P Exploring Prediction Uncertainty in Machine Translation Quality Estimation126
Q Large-scale Multitask Learning for Machine Translation Quality Estimation137
Page 4 of 146
Quality Translation 21D3.3: Evaluation metrics and analysis of first annotation round
1 Preliminary remarkThis is the first Deliverable of QT21 reporting in detail on the work performed mainly in Task3.2. Before we report on the achievements in some detail, we want to set the task in perspectiveto QT21 as it stands now. As discussed in the mid-term review meeting and later detailed inwriting, a lot has changed in MT research since the DoA was written and the project consortiumhas refined and re-adjusted its scientific goals and work plan.
One of the goals of QT21 is the advancement of evaluation methods for quality translation.Task 3.2 is concerned with the human-informed diagnosis of MT quality. However, the originalformulation of Task 3.2 had a rather narrow view on it. The original short description of Task3.2 is cited below for reference:
The goal of this task is to utilize human annotation and automatic assessment oftranslations to evaluate translations and provide detailed guidance as to the causesof quality failures and deliver concrete guidance for fixing them. This involves theharmonization of the Multidimensional Quality Metrics (MQM) framework from theQTLaunchPad project and the Dynamic Quality Framework (DQF) from TAUS intoa flexible and unified evaluation model that serves both MT research and productionneeds.
Next we use the validated metrics for larger-scale annotation of data gathered inTask T3.1 to feed into the general model improvements in WP1 and the language-specific improvements in WP2. The data will also be made available for use intraining in WP4 (Shared Task).
This was formulated as if the only purpose of the tasks was that of an internal error an-notation service to other work packages and it was left unclear how error annotations wouldfeed into model improvements. In line with other changes in the project driven by externalscientific developments and internal considerations, the consortium has decided to extend theimpact of the whole WP and thus also this task to make it more far-reaching and self-containedat the same time by extending the notion of user informed feedback and putting forward theimprovement of several different tools and methods for more detailed evaluation.
In order to diagnose the performance of several WP 1/2 engines and to relate them toperformance of a well-known online engine that has turned to neural MT, we have extendedresearch that had started on a small scale within the QTLaunchPad project in the contextof MQM annotation, but that has rather become a complementary general-purpose diagnosticinstrument in QT21. We manually created a domain-independent database (“test suite”) nowcontaining more than 4000 test items for two language directions. In a first annotation roundwe have used the test suite to compare project engines with the state of the art. Details can befound in Section 3.
From today’s perspective, the task puts too much emphasis on explicit error annotation leav-ing little room for other forms of informed feedback for translation diagnosis. While MQM/DQFhas been emphatically embraced by industry, is being used at large, and is now subject tostandardisation efforts at ASTM (see Section 2), it is clear that research has to continue theadvancement of both human-reference-based and reference-free automatic quality metrics aswell. Especially now that there is a completely new class of MT systems, we need improvedtools for more detailed evaluation that goes beyond the mere tracking of improvements of onesystem. This deliverable will report on the respective contributions and achievements fromQT21 in Sections 4 and 5, respectively.
The original task description was written under the idealistic assumption that work pack-ages 1-4 are maximally intertwined. The idea of testing WP 1/2 engines at certain intervals(“annotation rounds”) led to naming the Deliverable “Evaluation metrics and analysis of firstannotation round”. The description of D3.3. was written accordingly:
This deliverable will report on the results of the first annotation round, includingerror profiles for each language pair and a comparison of the results with analysis
Page 5 of 146

Quality Translation 21D3.3: Evaluation metrics and analysis of first annotation round
based on post-edited examples. It will also include a database of the annotateddata for use in training systems and for further analysis and a listing and analysisof measurable factors (semantics and linguistics analyses) found in the annotationdone in T3.1 that correspond to human quality judgments. This deliverable willalso evaluate the progress on syntax and semantic-informed evaluation metrics.
In Section 4, we will report on first findings using the post-edited data. We expect errorannotations to be finished soon (see D3.6), but we will postpone the reporting of the find-ings related to error annotation to D3.5. This will also have the advantage that the ongoingdevelopments around the TAUS Quality Dashboard can be reported and we can compare theannotations results and error profiles from the project with those from industry. To this end, wewill import the error annotations from QT21 into the Dashboard. The annotations performedin the project are even more important now that TAUS API version 3.5 has been launched.This version will collect only meta-data and not the annotations themselves and most industrialusers will probably use this option. So the resources and analyses created by QT21 will be aunique contribution to both the scientific community and industry.
As described in D3.6, partners have built domain-specific PBMT and NMT engines for use inWP3 for several important research activities in the area of informed quality diagnosis, metrics,evaluation, feedback, and prediction. The insights and feedback will be shared with WP1 andWP2 where they can be considered when improving the domain-independent engines. Thisdocument is structured according to the following main aspects of MT diagnosis and evaluationresearched in QT21:
• Target diagnostics (Section 2)
• Source-driven evaluation (Section 3)
• Reference-based evaluation (Section 4)
• Reference-free evaluation/prediction (Section 5)
Page 6 of 146

Quality Translation 21D3.3: Evaluation metrics and analysis of first annotation round
2 Target diagnosticsThe goal of this subtask is the harmonization of the Multidimensional Quality Metrics (MQM)framework from the QTLaunchPad project and the Dynamic Quality Framework (DQF) fromTAUS into a flexible and unified evaluation model that serves both MT research and productionneeds. In the first phase of QT21, both metrics have been made 100% compatible: DQF is nowa proper subset of the full MQM. The resulting harmonised metric has been coined MQM/DQFto be maximally recognisable by people who are familiar with one or the other or both. Theharmonised error metric has been published at several scientific events [1, 2, 3] and at industryevents, e.g., at the TAUS roundtable in Vienna in March 2016 where Aljoscha Burchardt (DFKI)and Kim Harris (text&form) presented the project results to a very interested audience of LSPsand large companies requesting translations.
As detailed in the report by the subcontractor Alan Melby, the European Commission’s Di-rectorate General for Translation (DGT) has expressed strong interest in MQM. Alan Melby andAljoscha Burchardt have presented MQM in a workshop in Brussels with 80 people attendingof which 15 were from the Council, one from the EP and one from the translation centre. Mostattendees were from DGT, two directors and mainly quality managers, evaluators/validatorsof freelance work or people from the freelance unit. A statement from DGT on MQM can befound in Appendix C.
The metric has been used in the evaluation of MT Quality in cooperation with the QTLeapproject (cf. [4]). Details about the metric and framework can be found in Deliverable D3.1.
Industry uptake TAUS has been promoting the MQM-DQF error typology by facilitating in-tegration in a number of CAT tools (SDL Trados Studio) and Translation Management Systems(SDL WorldServer, SDL TMS) used in the translation industry. Collaboration agreements havebeen made with a number of technologies that have committed to deliver an integrated solu-tion in their software packages in 2017 (GlobalLink, MemoQ, Lingotek, Memsource, Ontram,Leaf/Fabric by Microsoft).
User group In the summer of 2016, TAUS initiated a user group made up of large enter-prises and organizations to discuss topics related to translation quality evaluation includingerror-typology based evaluation. Participating companies and organizations in this consulta-tion include: ADP, Alibaba, Alpha CRC, Amazon, CA Technologies, Cisco, DFKI, Dell - EMC,eBay, Intel, LDS Church, Lionbridge, Microsoft, Oracle, PayPal, Symantec, Tableau Software,Translated, Translations.com, Welocalize.
Standardization efforts In Q4 of 2016, ASTM has taken up the work item to work further onthe MQM-DQF harmonized metric. The consortium have bi-weekly calls to discuss and furtherimprove the error typology and to polish the definitions. The group has agreed to start withthe DQF subset and is gathering feedback. Participating companies and organizations in thisconsultation include: SAP, EC, DFKI, FBI, eBay, UMD, Mitre and TAUS.
More details can be found in Appendix A. An independet validation of MQM involving manydifferent stakeholders has been performed by way of a subcontract with the International Fed-eration of Translators (FIT). The respective report by Prof. Alan Melby can be found in Ap-pendix B.
Page 7 of 146
Quality Translation 21D3.3: Evaluation metrics and analysis of first annotation round
3 Source-driven evaluationTest suites are a familiar tool in NLP in areas such as grammar checking, where one may wishto ensure that a parser is able to analyse certain sentences correctly or test the parser afterchanges to see if it still behaves in the expected way. By test suite, we refer to a selected set ofinput-output pairs that reflects interesting or difficult cases. In contrast to a “real-life” corpusthat includes reference translations, the input in a test suite may well be made-up or edited toisolate and illustrate issues.
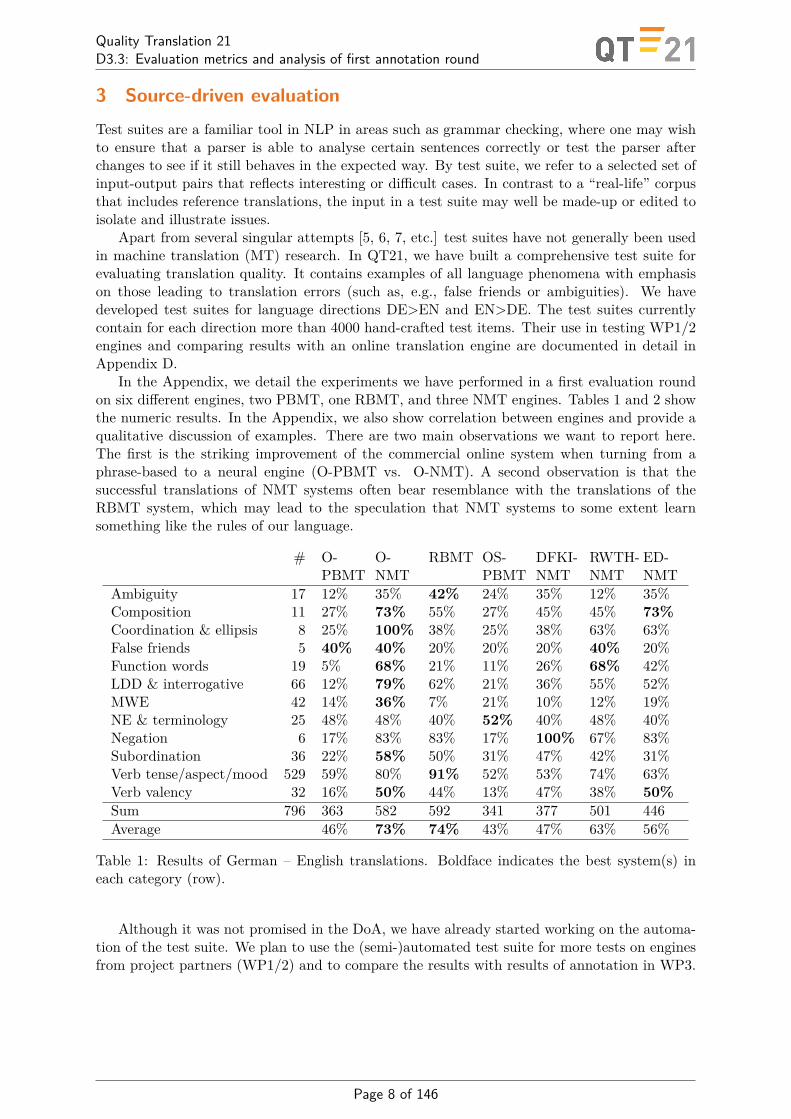
Apart from several singular attempts [5, 6, 7, etc.] test suites have not generally been usedin machine translation (MT) research. In QT21, we have built a comprehensive test suite forevaluating translation quality. It contains examples of all language phenomena with emphasison those leading to translation errors (such as, e.g., false friends or ambiguities). We havedeveloped test suites for language directions DE>EN and EN>DE. The test suites currentlycontain for each direction more than 4000 hand-crafted test items. Their use in testing WP1/2engines and comparing results with an online translation engine are documented in detail inAppendix D.
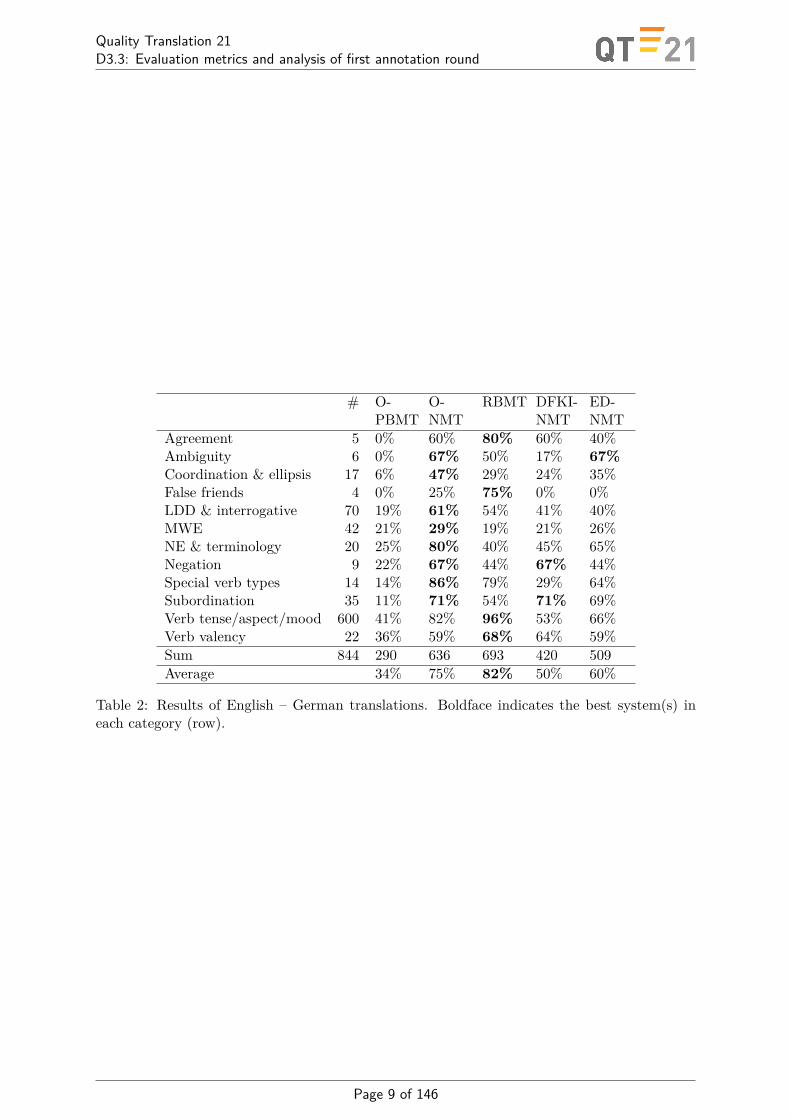
In the Appendix, we detail the experiments we have performed in a first evaluation roundon six different engines, two PBMT, one RBMT, and three NMT engines. Tables 1 and 2 showthe numeric results. In the Appendix, we also show correlation between engines and provide aqualitative discussion of examples. There are two main observations we want to report here.The first is the striking improvement of the commercial online system when turning from aphrase-based to a neural engine (O-PBMT vs. O-NMT). A second observation is that thesuccessful translations of NMT systems often bear resemblance with the translations of theRBMT system, which may lead to the speculation that NMT systems to some extent learnsomething like the rules of our language.
# O-PBMT
O-NMT
RBMT OS-PBMT
DFKI-NMT
RWTH-NMT
ED-NMT
Ambiguity 17 12% 35% 42% 24% 35% 12% 35%Composition 11 27% 73% 55% 27% 45% 45% 73%Coordination & ellipsis 8 25% 100% 38% 25% 38% 63% 63%False friends 5 40% 40% 20% 20% 20% 40% 20%Function words 19 5% 68% 21% 11% 26% 68% 42%LDD & interrogative 66 12% 79% 62% 21% 36% 55% 52%MWE 42 14% 36% 7% 21% 10% 12% 19%NE & terminology 25 48% 48% 40% 52% 40% 48% 40%Negation 6 17% 83% 83% 17% 100% 67% 83%Subordination 36 22% 58% 50% 31% 47% 42% 31%Verb tense/aspect/mood 529 59% 80% 91% 52% 53% 74% 63%Verb valency 32 16% 50% 44% 13% 47% 38% 50%Sum 796 363 582 592 341 377 501 446Average 46% 73% 74% 43% 47% 63% 56%
Table 1: Results of German – English translations. Boldface indicates the best system(s) ineach category (row).
Although it was not promised in the DoA, we have already started working on the automa-tion of the test suite. We plan to use the (semi-)automated test suite for more tests on enginesfrom project partners (WP1/2) and to compare the results with results of annotation in WP3.
Page 8 of 146
Quality Translation 21D3.3: Evaluation metrics and analysis of first annotation round
# O-PBMT
O-NMT
RBMT DFKI-NMT
ED-NMT
Agreement 5 0% 60% 80% 60% 40%Ambiguity 6 0% 67% 50% 17% 67%Coordination & ellipsis 17 6% 47% 29% 24% 35%False friends 4 0% 25% 75% 0% 0%LDD & interrogative 70 19% 61% 54% 41% 40%MWE 42 21% 29% 19% 21% 26%NE & terminology 20 25% 80% 40% 45% 65%Negation 9 22% 67% 44% 67% 44%Special verb types 14 14% 86% 79% 29% 64%Subordination 35 11% 71% 54% 71% 69%Verb tense/aspect/mood 600 41% 82% 96% 53% 66%Verb valency 22 36% 59% 68% 64% 59%Sum 844 290 636 693 420 509Average 34% 75% 82% 50% 60%
Table 2: Results of English – German translations. Boldface indicates the best system(s) ineach category (row).
Page 9 of 146

Quality Translation 21D3.3: Evaluation metrics and analysis of first annotation round
4 Reference-based evaluation4.1 Novel Reference-based MT MetricsManually created structures are required by most syntax-based MT evaluation metrics. Wepropose a novel method of automatic evaluation of MT based on models of dependency parsing,Dependency Parsing Model F-score (DPMF), that overcomes the need for any human input.DPMF scores are obtained via a five step procedure as follows:
1. Dependency parse the reference translation (automatic parsing tools or human-labelling);
2. Train a dependency parser using the output of (1), the reference dependency structure;
3. Parse the hypothesis using the dependency parser trained in step (2) to produce an esti-mate of the probability of the hypothesis dependency tree given the reference;
4. Normalize the output of (3), the probability estimate, to produce the depedency parsemodel (DPM) score.
5. Multiply the DPM score by a unigram F-score to get the final DPMF score.
Further details of DPMF metric formulation are provided in [8].Experiment results for DPMF show that the new metric achieves stronger correlation with
human assessment than other popular metrics on the system level and achieves comparableperformance on the sentence level. In addition, we include a formulation of the new metric thatcombines a large number of other metric scores for translations (DPMFcomb), and this metricobtained a top rank in the segment-level metrics shared task for to-English language pairs atWMT-16.
Additional development of novel automatic metrics include MaxSD, a MT metric based onneural networks that maximizes the distance between similarity scores of high and low-qualityMT output hypotheses. MaxSD efficiently incorporates lexical and syntactic metrics as featuresin the network [9]. Figure 1 shows the overall architecture of MaxSD. Preliminary results forthe metric show promising correlations with human assessment although not yet significantlyoutperforming BLEU across all language pairs.
Further work on reference-based evaluation of MT includes extensions to the existing metric,Cobalt, by addition of an explicit fluency component, a metric included as a participant inWMT-16 metrics shared task for all into-English languages at the segment-level. The originalCobalt metric [10] is based on the number of words aligned between the reference translation andMT output for a range of lexical similarity levels. The most important feature of the metricis a syntactically informed context penalty aimed at penalising the matches of similar wordsthat play different roles in the candidate and reference sentences. The context penalty allowsbetter discrimination between acceptable and unacceptable differences between the candidateand reference translation words. The metric was extended into CobaltF [?] (see Appendix G)by inclusion of a total of 49 additional fluency-oriented features, all of which are estimatedindependent of the reference translation, and derived solely from the MT output translationand are the same or inspired by MT quality estimation features. Examples include a languagemodel, its back-off behaviour, in addition to an out of vocabulary word rate. The metric achievesstate-of-the-art performance for sentence-level evaluation. Furthermore, when the metric scoresare combined with BLEU and Meteor, it ranks among the top 3 at WMT-16 for all into-Englishlanguages.
4.2 Reference-based Human EvaluationIn the translation industry, human translations are assessed by comparison with source texts.In MT research, however, it is common practice to perform quality assessment using a referencetranslation instead of the source text. In [11] we carry out an investigation into the effectof reference bias in human evaluation of MT to show that this practice has a serious issue
Page 10 of 146

Quality Translation 21D3.3: Evaluation metrics and analysis of first annotation round
Figure 1: The overall architecture of the maxSD model. Bi(C)-LSTM means either Bi- LSTM orBiC-LSTM network. Bi-LSTM network takes the left side of ‘/’ as input, while BiC-LSTM theright. The Bi-LSTM or BiC-LSTM network produces the representation of each input, whichare then used to compute simPn and simNn. simP and simN are computed by incorporating 5metric scores, namely Spr and Snr, respectively. The objective of the architecture is to maximizethe distance between simP and simN.
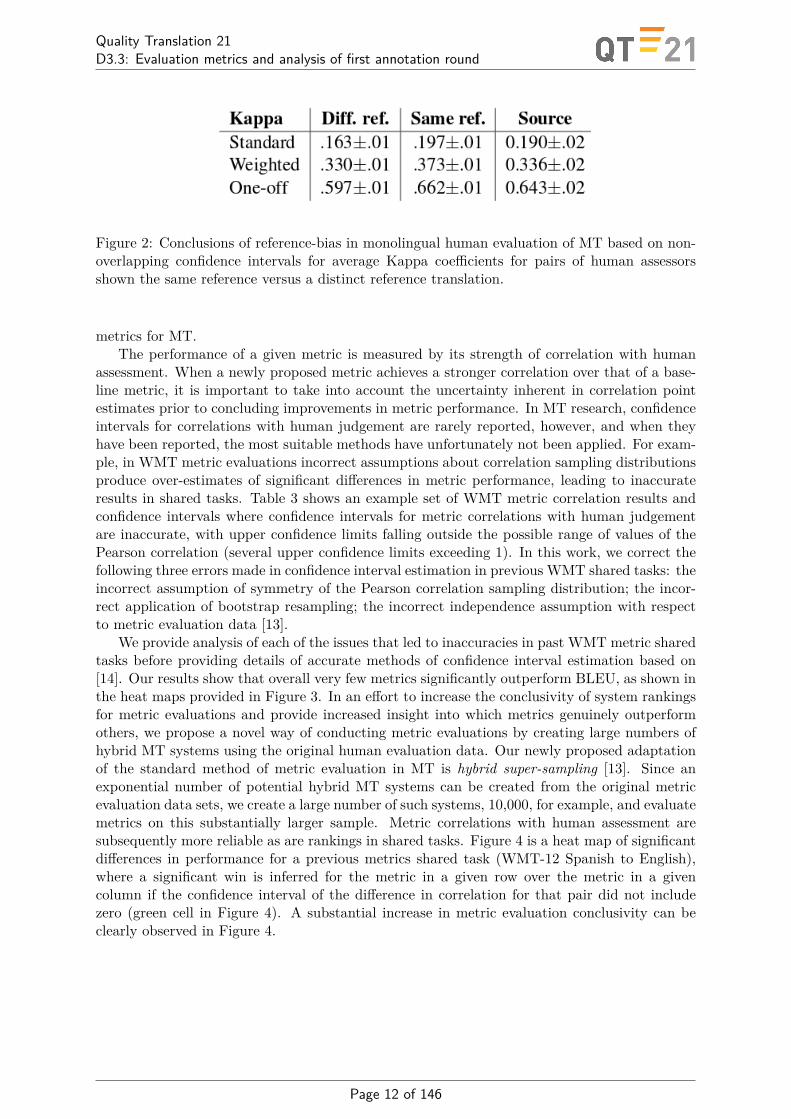
– annotators are strongly biased by the reference translation provided – and this can havea negative impact on the assessment of MT quality. Experiments with volunteer translatorsshowed that annotators are strongly biased by the reference translation in monolingual humanevaluation of MT and assign different quality scores to the same MT outputs when a differenthuman translation is employed in the assessment. Experiments were carried out for 100 Chineseto English MT output translations (produced by 10 MT systems), each with 4 distinct human-generated reference translations. Our analysis of results showed significantly higher levels ofagreement between human assessors for those that were shown the same reference translationcompared to agreement levels between human judges shown different references, in additionto significant differences in agreement levels when assessment employed the source segment (orbilingual evaluation). Figure 2 shows average Kappa coefficients measuring agreement in humanassessment for pairs of human assessors shown the source input (Source), the same reference(Same ref.) translation or distinct reference translations (Diff. ref.), where the non-overlapof reported confidence intervals for average Kappa coefficients (or weighted Kappas) of Sameref. and Diff ref. led to the conclusion that a strong reference bias is present in monolingualevaluation of MT. The complete results are presented in Appendix H.
4.3 Improvements to the Evaluation of Reference-based MetricsAutomatic Machine Translation metrics, such as BLEU [12], are widely employed in empiricalevaluation of MT as a substitute for human assessment. Development of better methods ofautomatic evaluation has been hindered to some degree by the absence of accurate methodsof evaluation of automatic metrics. Without sound and valid methods of evaluating metrics,new metrics that might in fact provide better ways of evaluating MT systems automaticallyare likely to go unrecognised as such, ultimately resulting in slower progress in development ofaccurate automatic metrics. This motivates our work to improve the accuracy of evaluation of
Page 11 of 146
Quality Translation 21D3.3: Evaluation metrics and analysis of first annotation round
Figure 2: Conclusions of reference-bias in monolingual human evaluation of MT based on non-overlapping confidence intervals for average Kappa coefficients for pairs of human assessorsshown the same reference versus a distinct reference translation.
metrics for MT.The performance of a given metric is measured by its strength of correlation with human
assessment. When a newly proposed metric achieves a stronger correlation over that of a base-line metric, it is important to take into account the uncertainty inherent in correlation pointestimates prior to concluding improvements in metric performance. In MT research, confidenceintervals for correlations with human judgement are rarely reported, however, and when theyhave been reported, the most suitable methods have unfortunately not been applied. For exam-ple, in WMT metric evaluations incorrect assumptions about correlation sampling distributionsproduce over-estimates of significant differences in metric performance, leading to inaccurateresults in shared tasks. Table 3 shows an example set of WMT metric correlation results andconfidence intervals where confidence intervals for metric correlations with human judgementare inaccurate, with upper confidence limits falling outside the possible range of values of thePearson correlation (several upper confidence limits exceeding 1). In this work, we correct thefollowing three errors made in confidence interval estimation in previous WMT shared tasks: theincorrect assumption of symmetry of the Pearson correlation sampling distribution; the incor-rect application of bootstrap resampling; the incorrect independence assumption with respectto metric evaluation data [13].
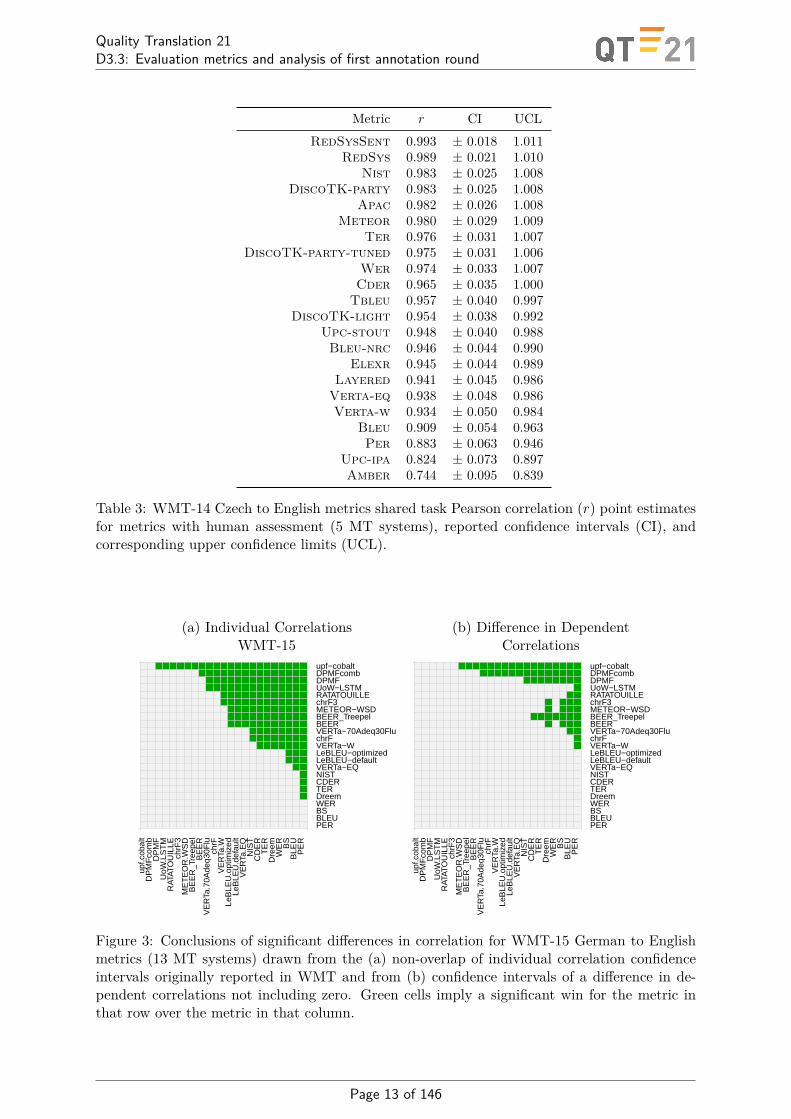
We provide analysis of each of the issues that led to inaccuracies in past WMT metric sharedtasks before providing details of accurate methods of confidence interval estimation based on[14]. Our results show that overall very few metrics significantly outperform BLEU, as shown inthe heat maps provided in Figure 3. In an effort to increase the conclusivity of system rankingsfor metric evaluations and provide increased insight into which metrics genuinely outperformothers, we propose a novel way of conducting metric evaluations by creating large numbers ofhybrid MT systems using the original human evaluation data. Our newly proposed adaptationof the standard method of metric evaluation in MT is hybrid super-sampling [13]. Since anexponential number of potential hybrid MT systems can be created from the original metricevaluation data sets, we create a large number of such systems, 10,000, for example, and evaluatemetrics on this substantially larger sample. Metric correlations with human assessment aresubsequently more reliable as are rankings in shared tasks. Figure 4 is a heat map of significantdifferences in performance for a previous metrics shared task (WMT-12 Spanish to English),where a significant win is inferred for the metric in a given row over the metric in a givencolumn if the confidence interval of the difference in correlation for that pair did not includezero (green cell in Figure 4). A substantial increase in metric evaluation conclusivity can beclearly observed in Figure 4.
Page 12 of 146
Quality Translation 21D3.3: Evaluation metrics and analysis of first annotation round
Metric r CI UCLRedSysSent 0.993 ± 0.018 1.011
RedSys 0.989 ± 0.021 1.010Nist 0.983 ± 0.025 1.008
DiscoTK-party 0.983 ± 0.025 1.008Apac 0.982 ± 0.026 1.008
Meteor 0.980 ± 0.029 1.009Ter 0.976 ± 0.031 1.007
DiscoTK-party-tuned 0.975 ± 0.031 1.006Wer 0.974 ± 0.033 1.007
Cder 0.965 ± 0.035 1.000Tbleu 0.957 ± 0.040 0.997
DiscoTK-light 0.954 ± 0.038 0.992Upc-stout 0.948 ± 0.040 0.988
Bleu-nrc 0.946 ± 0.044 0.990Elexr 0.945 ± 0.044 0.989
Layered 0.941 ± 0.045 0.986Verta-eq 0.938 ± 0.048 0.986Verta-w 0.934 ± 0.050 0.984
Bleu 0.909 ± 0.054 0.963Per 0.883 ± 0.063 0.946
Upc-ipa 0.824 ± 0.073 0.897Amber 0.744 ± 0.095 0.839
Table 3: WMT-14 Czech to English metrics shared task Pearson correlation (r) point estimatesfor metrics with human assessment (5 MT systems), reported confidence intervals (CI), andcorresponding upper confidence limits (UCL).
(a) Individual Correlations (b) Difference in DependentWMT-15 Correlations
upf.c
obal
tD
PM
Fco
mb
DP
MF
UoW
.LS
TM
RAT
ATO
UIL
LEch
rF3
ME
TE
OR
.WS
DB
EE
R_T
reep
elB
EE
RV
ER
Ta.7
0Ade
q30F
luch
rFV
ER
Ta.W
LeB
LEU
.opt
imiz
edLe
BLE
U.d
efau
ltV
ER
Ta.E
QN
IST
CD
ER
TE
RD
reem
WE
RB
SB
LEU
PE
R
PERBLEUBSWERDreemTERCDERNISTVERTa−EQLeBLEU−defaultLeBLEU−optimizedVERTa−WchrFVERTa−70Adeq30FluBEERBEER_TreepelMETEOR−WSDchrF3RATATOUILLEUoW−LSTMDPMFDPMFcombupf−cobalt
Figure 3: Conclusions of significant differences in correlation for WMT-15 German to Englishmetrics (13 MT systems) drawn from the (a) non-overlap of individual correlation confidenceintervals originally reported in WMT and from (b) confidence intervals of a difference in de-pendent correlations not including zero. Green cells imply a significant win for the metric inthat row over the metric in that column.
Page 13 of 146

Quality Translation 21D3.3: Evaluation metrics and analysis of first annotation round
Original (12 Systems) Super-Sample (10k Systems)
Terr
orC
atS
AG
AN
_ST
SM
eteo
rpo
sFsp
ede0
7_fP
sped
e07_
fsp
ede0
8_fP
XE
nErr
Cat
ssp
ede0
7_pP
sped
e07_
pW
ordB
lock
Err
Cat
sA
MB
ER
Blo
ckE
rrC
ats
SIM
PB
LEU
BLE
U
BLEUSIMPBLEUBlockErrCatsAMBERWordBlockErrCatsspede07_pspede07_pPXEnErrCatsspede08_fPspede07_fspede07_fPposFMeteorSAGAN_STSTerrorCat
Terr
orC
atS
AG
AN
_ST
SM
eteo
rpo
sFsp
ede0
7_fP
sped
e08_
fPsp
ede0
7_f
sped
e07_
pPsp
ede0
7_p
XE
nErr
Cat
sA
MB
ER
Wor
dBlo
ckE
rrC
ats
SIM
PB
LEU
BLE
UB
lock
Err
Cat
sBlockErrCatsBLEUSIMPBLEUWordBlockErrCatsAMBERXEnErrCatsspede07_pspede07_pPspede07_fspede08_fPspede07_fPposFMeteorSAGAN_STSTerrorCat
Figure 4: Pairwise conclusions for pseudo document-level metrics (averaged segment-level met-rics) from WMT-12 Spanish-English metrics shared task, where a green cell indicates a signifi-cant win for the metric in a given row over the metric in the corresponding column.
Page 14 of 146

Quality Translation 21D3.3: Evaluation metrics and analysis of first annotation round
5 Reference-free evaluation5.1 What Can Language Industry Learn from Post-editing?In [15], we have analysed the efficacy of post-editing of highly technical texts in a specializeddomain (medical) as performed in Task 3.1 and provided answers to questions important tolocalization service providers that consider the introduction of post-editing in their translationworkflows. We were able to make four concrete findings:
• Post-editing resulted in a huge increase in translation productivity (200%)
• The amount of time spent on post-editing a segment is, on average, directly proportionalto the quality of the MT
• High quality MT results lead to relatively consistent post-editing quality
• Poor quality MT leads to a high degree of inconsistency between post-editing quality anda perfect human translation
Most importantly, however, these results have allowed us to offer several recommendationsfor localization service providers utilizing MT in the post-editing process. More details can befound in the paper in Appendix E.
5.2 MT Quality Estimation for Computer-assisted Translation: Does it ReallyHelp?
In [16], the usefulness of translation quality estimation (QE) is tested in a computer assistedtranslation tool. For each segment proposed to a professional post-editor, a QE label is addedreflecting the translation quality. Contrastive experiments are carried out by measuring post-editing time differences when i) translation suggestions are presented together with binaryquality estimates, and ii) the same suggestions are presented without quality indicators. Thefindings of this paper can be summarized as follows:
• When using QE labels, global post-editing time reductions do not necessarily show sta-tistically significant productivity gains;
• An in-depth analysis abstracting from the presence of outliers and from the high variabilityacross post-editors, indicates that the usefulness of QE is verified, at least to some extent;
• Productivity gains are observed with QE at a global level when source sentence lengthis between 5 and 20 words and translation quality of the proposed MT suggestions isbetween 0.2 and 0.5 HTER.
5.3 Online Multitask Learning for Machine Translation Quality EstimationIn [17], an approach is presented for on-the-fly MT quality prediction for a stream of heteroge-neous data coming from different domains/users/MT systems. This novel regression algorithmincludes the capability to: i) continuously learn and self-adapt to a stream of data coming frommultiple translation jobs, ii) react to data diversity by exploiting human feedback, and iii)leverage data similarity by learning and transferring knowledge across domains. For doing this,the proposed approach combines two supervised machine learning paradigms, online (i.e. onlinepassive aggressive algorithm) and multitask (i.e. online task relationship learning algorithm),adapting and unifying them in a single framework. This technique has been successfully eval-uated against strong online single-task competitors in a scenario involving four domains. Thegood performance achieved has shown the capability of the algorithm to leverage data comingfrom different domains and to automatically infer domain similarities.
Page 15 of 146
Quality Translation 21D3.3: Evaluation metrics and analysis of first annotation round
5.4 Novel Quality Estimation ApproachesUsing the post-edited data collected within QT21 (T3.1, EN-DE, 15K segments), and as partof the shared tasks on Quality Estimation (QE), also organised by QT21 (WP4)1 with FirstConference on Machine Translation (WMT6), we proposed novel methods for word, phrase andsentence-level QE.
• A new approach for word-level quality estimation, with a system submitted to the WMT16word-level quality estimation task. The approach [18] (Appendix J) exploits a linearword-level classifier trained using imitation learning. Imitation learning is a techniquecommonly used for structured prediction problems that has as main advantages the useof arbitrary information from previous tag predictions and the use of non-decomposableloss functions over the structure. As in other sequence labelling techniques, learning takesinto account tags of neighbouring words, which are gold-standard at training time, andpredicted at test time. This mismatch often leads to suboptimal models. Unlike othertechniques, imitation learning addresses this mismatch by generating examples using thetrained classifier to re-predict the training set and updating the classifier using these newexamples during training.
• A new approach for word-level quality estimation using a combination of standard andword-embedding features and traditional sequence labelling techniques (CRFs) was sub-mitted to WMT15 and performed among the top three groups [19] (Appendix K).
• An investigation on alternative strategies to segment and label phrases in a sentence tobuild phrase-level quality estimation systems [20] (Appendix L). These include segmenta-tion given by post-edited spans, by the decoder, and by a shallow linguistic parser, andlabelling given indirectly by post-editing and explicitly by humans.
• Two new approaches to phrase-level quality estimation and systems submitted to theWMT16 newly created shared task (organised by QT21, WP4) [21] (Appendix M). Theseexplore a combination of features adapted from sentence and word-level quality estimation,plus predictions made for these other levels: word and sentence. The system achieved verycompetitive results in the WMT task, ranking first along with other systems.
• Further work on sentence-level quality estimation. This includes (i) improved systems us-ing neural network-based language model features, which were submitted to the WMT15shared task [19] (Appendix K), and subsequently further improved and tested in otherdatasets [22, 23] (Appendices N and O), improving over the state-of-the-art performance;(ii) experiments with large-scale datasets (hundreds of thousands of segments) producedby multiple annotators post-editing machine translation output and the use of such datafor quality estimation [24] (Appendix Q). We apply multi-task learning to model specificannotator biases and preferences and learn more robust quality prediction models; (iii) anapproach to exploit prediction uncertainty in quality estimation using probabilistic meth-ods [25] (Appendix P). This allows for better evaluation of quality estimation models,particularly in distinguishing among models with seemingly identical or similar perfor-mance according to standard point estimate error metrics: models with low error and lowuncertainty should be considered better than those with similar error but higher uncer-tainty; and (iv) a method for feature selection in quality estimation based on GaussianProcesses [26].
In addition, we worked on further improvements and maintenance of QuEst, USFD’s toolkitfor QE, leading to QuEst++ [27] (Appendix I), a refactored version of the tool that also includesword-level feature extraction and prediction algorithms. QuEst++ is used as baseline systemin the WMT15 and WMT16 shared tasks on Quality Estimation (the latter organised by QT21,WP4).
1http://www.statmt.org/wmt16/quality-estimation-task.html
Page 16 of 146
Quality Translation 21D3.3: Evaluation metrics and analysis of first annotation round
5.5 Improvements to Evaluation of MT Quality EstimationProgress in any area of NLP is inevitably hindered if a lack of accurate methods of evalua-tion exists in that area. This motivates our investigation into ways of improving evaluationmethodologies applied in MT quality estimation (QE). Our initial work in this area includes aninvestigation into the degree to which human-targeted metrics, commonly employed as a goldstandard in MT QE, provide a valid substitute for human assessment.
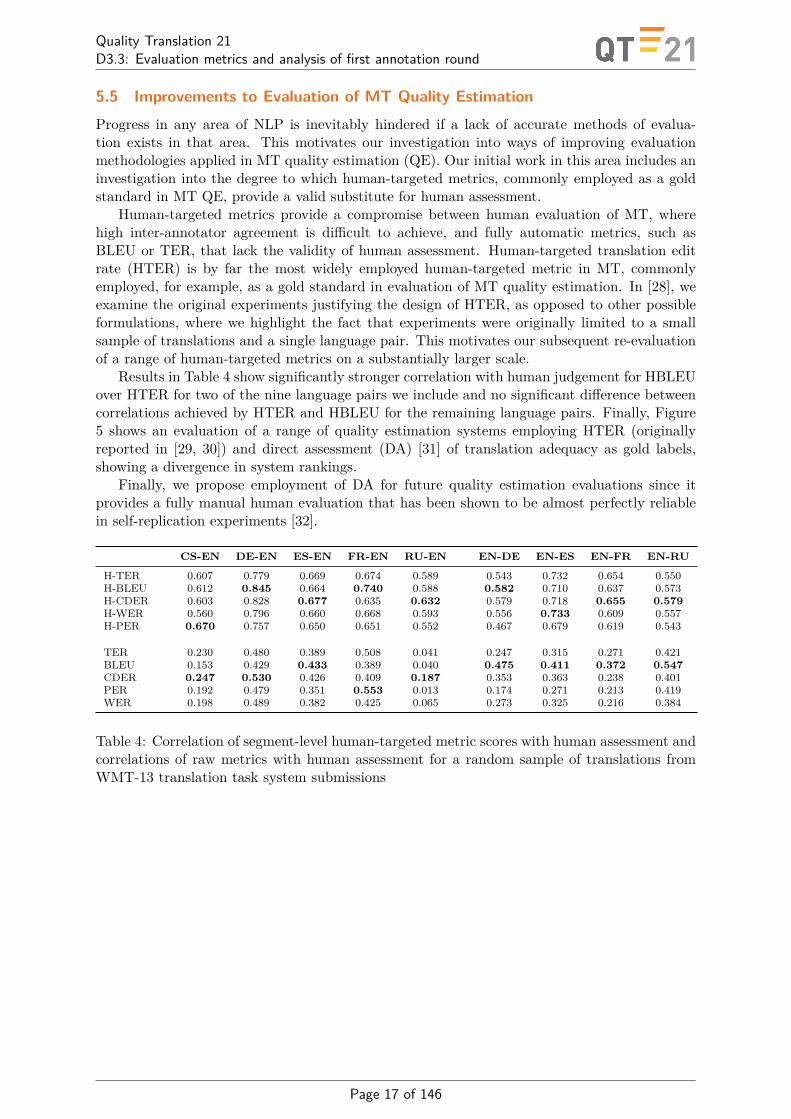
Human-targeted metrics provide a compromise between human evaluation of MT, wherehigh inter-annotator agreement is difficult to achieve, and fully automatic metrics, such asBLEU or TER, that lack the validity of human assessment. Human-targeted translation editrate (HTER) is by far the most widely employed human-targeted metric in MT, commonlyemployed, for example, as a gold standard in evaluation of MT quality estimation. In [28], weexamine the original experiments justifying the design of HTER, as opposed to other possibleformulations, where we highlight the fact that experiments were originally limited to a smallsample of translations and a single language pair. This motivates our subsequent re-evaluationof a range of human-targeted metrics on a substantially larger scale.
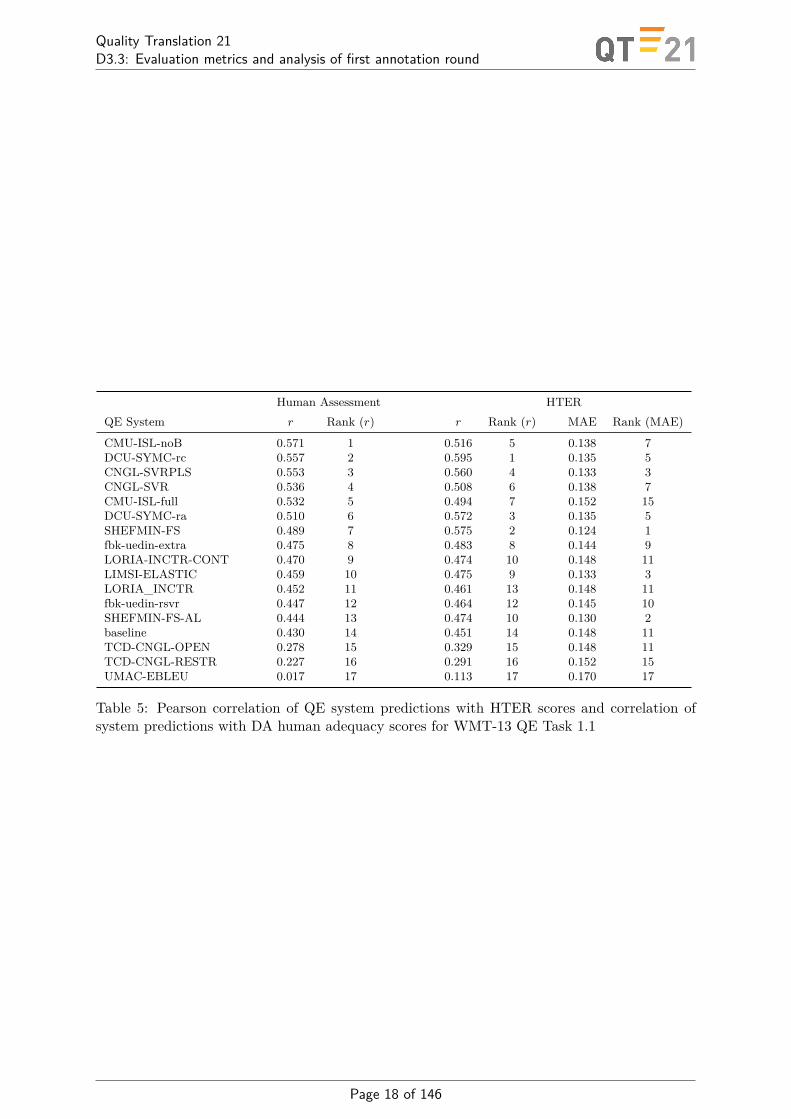
Results in Table 4 show significantly stronger correlation with human judgement for HBLEUover HTER for two of the nine language pairs we include and no significant difference betweencorrelations achieved by HTER and HBLEU for the remaining language pairs. Finally, Figure5 shows an evaluation of a range of quality estimation systems employing HTER (originallyreported in [29, 30]) and direct assessment (DA) [31] of translation adequacy as gold labels,showing a divergence in system rankings.
Finally, we propose employment of DA for future quality estimation evaluations since itprovides a fully manual human evaluation that has been shown to be almost perfectly reliablein self-replication experiments [32].
CS-EN DE-EN ES-EN FR-EN RU-EN EN-DE EN-ES EN-FR EN-RU
H-TER 0.607 0.779 0.669 0.674 0.589 0.543 0.732 0.654 0.550H-BLEU 0.612 0.845 0.664 0.740 0.588 0.582 0.710 0.637 0.573H-CDER 0.603 0.828 0.677 0.635 0.632 0.579 0.718 0.655 0.579H-WER 0.560 0.796 0.660 0.668 0.593 0.556 0.733 0.609 0.557H-PER 0.670 0.757 0.650 0.651 0.552 0.467 0.679 0.619 0.543
TER 0.230 0.480 0.389 0.508 0.041 0.247 0.315 0.271 0.421BLEU 0.153 0.429 0.433 0.389 0.040 0.475 0.411 0.372 0.547CDER 0.247 0.530 0.426 0.409 0.187 0.353 0.363 0.238 0.401PER 0.192 0.479 0.351 0.553 0.013 0.174 0.271 0.213 0.419WER 0.198 0.489 0.382 0.425 0.065 0.273 0.325 0.216 0.384
Table 4: Correlation of segment-level human-targeted metric scores with human assessment andcorrelations of raw metrics with human assessment for a random sample of translations fromWMT-13 translation task system submissions
Page 17 of 146
Quality Translation 21D3.3: Evaluation metrics and analysis of first annotation round
Human Assessment HTERQE System r Rank (r) r Rank (r) MAE Rank (MAE)
CMU-ISL-noB 0.571 1 0.516 5 0.138 7DCU-SYMC-rc 0.557 2 0.595 1 0.135 5CNGL-SVRPLS 0.553 3 0.560 4 0.133 3CNGL-SVR 0.536 4 0.508 6 0.138 7CMU-ISL-full 0.532 5 0.494 7 0.152 15DCU-SYMC-ra 0.510 6 0.572 3 0.135 5SHEFMIN-FS 0.489 7 0.575 2 0.124 1fbk-uedin-extra 0.475 8 0.483 8 0.144 9LORIA-INCTR-CONT 0.470 9 0.474 10 0.148 11LIMSI-ELASTIC 0.459 10 0.475 9 0.133 3LORIA_INCTR 0.452 11 0.461 13 0.148 11fbk-uedin-rsvr 0.447 12 0.464 12 0.145 10SHEFMIN-FS-AL 0.444 13 0.474 10 0.130 2baseline 0.430 14 0.451 14 0.148 11TCD-CNGL-OPEN 0.278 15 0.329 15 0.148 11TCD-CNGL-RESTR 0.227 16 0.291 16 0.152 15UMAC-EBLEU 0.017 17 0.113 17 0.170 17
Table 5: Pearson correlation of QE system predictions with HTER scores and correlation ofsystem predictions with DA human adequacy scores for WMT-13 QE Task 1.1
Page 18 of 146
Quality Translation 21D3.3: Evaluation metrics and analysis of first annotation round
References[1] K. Harris, A. Burchardt, G. Rehm, and L. Specia, “Technology landscape for quality
evaluation: Combining the needs of research and industry,” in Proceedings of the LREC2016 Workshop “Translation Evaluation: From Fragmented Tools and Data Sets to anIntegrated Ecosystem”, located at International Conference on Language Resources andEvaluation (LREC), May 24, Portorosz, Slovenia, G. Rehm, A. Burchardt, O. Bojar,C. Dugast, M. Federico, J. van Genabith, B. Haddow, J. Hajic, K. Harris, P. Koehn,M. Negri, M. Popel, L. Specia, M. Turchi, and H. Uszkoreit, Eds. o.A., 5 2016.
[2] A. Burchardt, K. Harris, G. Rehm, and H. Uszkoreit, “Towards a systematic and human-informed paradigm for high-quality machine translation,” in Proceedings of the LREC2016 Workshop “Translation Evaluation: From Fragmented Tools and Data Sets to anIntegrated Ecosystem”, located at International Conference on Language Resources andEvaluation (LREC), May 24, Portorosz, Slovenia, G. Rehm, A. Burchardt, O. Bojar,C. Dugast, M. Federico, J. van Genabith, B. Haddow, J. Hajic, K. Harris, P. Koehn,M. Negri, M. Popel, L. Specia, M. Turchi, and H. Uszkoreit, Eds. o.A., 5 2016.
[3] A. Burchardt, A. Lommel, L. Bywood, K. Harris, and M. Popovic, “Machine translationquality in an audiovisual context,” Target, vol. 28, no. 2, pp. 206–221, 2016.
[4] N. Aranberri, E. Avramidis, A. Burchardt, O. Klejch, M. Popel, and M. Popovic, “Toolsand guidelines for principled machine translation development,” in Proceedings of the TenthInternational Conference on Language Resources and Evaluation. European LanguageResources Association, 5 2016, pp. 1877–1882.
[5] M. King and K. Falkedal, “Using test suites in evaluation of machine translationsystems,” in Proceedings of the 13th Conference on Computational Linguistics - Volume 2,ser. COLING ’90. Stroudsburg, PA, USA: Association for Computational Linguistics,1990, pp. 211–216. [Online]. Available: http://dx.doi.org/10.3115/997939.997976
[6] H. Isahara, “Jeida’s test-sets for quality evaluation of mt systems: Technical evaluationfrom the developer’s point of view,” in Proceedings of the MT Summit V. Luxembourg,1995.
[7] S. Koh, J. Maeng, J.-Y. Lee, Y.-S. Chae, and K.-S. Choi, “A test suite for evaluation ofenglish-to-korean machine translation systems,” in Proceedings of the MT Summit VIII.Santiago de Compostela, Spain, 2001.
[8] H. Yu, X. Wu, W. Jiang, Q. Liu, and S. Lin, “An Automatic Machine Translation Evalu-ation Metric Based on Dependency Parsing Model,” ArXiv e-prints, Aug. 2015.
[9] Q. Ma, F. Meng, D. Zheng, M. Wang, Y. Graham, W. Jiang, and Q. Liu, “Maxsd: A neuralmachine translation evaluation metric optimized by maximizing similarity distance,”in Natural Language Understanding and Intelligent Applications: 5th CCF Conference onNatural Language Processing and Chinese Computing and 24th International Conferenceon Computer Processing of Oriental Languages, C.-Y. Lin, N. Xue, D. Zhao, X. Huang,and Y. Feng, Eds. Kunming, China: Springer International Publishing, 2016, pp.153–161. [Online]. Available: http://dx.doi.org/10.1007/978-3-319-50496-4_13
[10] M. Fomicheva, N. Bel, I. da Cunha, and A. Malinovskiy, “UPF-Cobalt Submissionto WMT15 Metrics Task,” in Proceedings of the Tenth Workshop on Statistical MachineTranslation, Lisbon, Portugal, 2015, pp. 373–379. [Online]. Available: http://aclweb.org/anthology/W15-3046
[11] M. Fomicheva and L. Specia, “Reference bias in monolingual machine translationevaluation,” in Proceedings of the 54th Annual Meeting of the Association for Computational
Page 19 of 146

Quality Translation 21D3.3: Evaluation metrics and analysis of first annotation round
Linguistics (Volume 2: Short Papers), Berlin, Germany, 2016, pp. 77–82. [Online].Available: http://anthology.aclweb.org/P16-2013
[12] K. Papineni, S. Roukos, T. Ward, and W.-J. Zhu, “BLEU: A method for automatic eval-uation of machine translation,” IBM Research, Thomas J. Watson Research Center, Tech.Rep. RC22176 (W0109-022), 2001.
[13] Y. Graham and Q. Liu, “Achieving accurate conclusions in evaluation of automatic machinetranslation metrics,” in Proceedings of the 15th Annual Conference of the North AmericanChapter of the Association for Computational Linguistics: Human Language Technologies.San Diego, CA: Association for Computational Linguistics, 2016.
[14] G. Y. Zou, “Toward using confidence intervals to compare correlations.” PsychologicalMethods, vol. 12, no. 4, pp. 399 – 413, 2007. [Online]. Available: http://search.ebscohost.com/login.aspx?direct=true&db=pdh&AN=2007-18729-002&site=ehost-live
[15] M. Pinnis, R. Kalnins, R. Skadins, and I. Skadina, “What Can We Really Learn from Post-editing?” in Proceedings of the 12th Conference of the Association for Machine Translationin the Americas (AMTA 2016), vol. 2. Austin, USA: Association for Machine Translationin the Americas, 2016, pp. 86–91.
[16] M. Turchi, M. Negri, and M. Federico, “MT Quality Estimation for Computer-assistedTranslation: Does it Really Help?” in Volume 2: Short Papers, 2015, p. 530.
[17] J. G. de Souza, M. Negri, E. Ricci, and M. Turchi, “Online multitask learning for ma-chine translation quality estimation,” in Proceedings of the 53rd Annual Meeting of theAssociation for Computational Linguistics, ACL, 2015, pp. 26–31.
[18] D. Beck, A. Vlachos, G. Paetzold, and L. Specia, “Shef-mime: Word-level qualityestimation using imitation learning,” in First Conference on Machine Translation, Volume2: Shared Task Papers, ser. WMT, Berlin, Germany, 2016, pp. 762–766. [Online].Available: http://www.aclweb.org/anthology/W/W16/W16-2380
[19] K. Shah, V. Logacheva, G. Paetzold, F. Blain, D. Beck, F. Bougares, and L. Specia,“Shef-nn: Translation quality estimation with neural networks,” in Tenth Workshop onStatistical Machine Translation, Lisboa, Portugal, 2015, pp. 338–343. [Online]. Available:http://aclweb.org/anthology/W15-3041
[20] F. Blain, V. Logacheva, and L. Specia, “Phrase level segmentation and labelling ofmachine translation errors,” in Tenth International Conference on Language Resourcesand Evaluation, ser. LREC, Portoroz, Slovenia, 2016, pp. 2240–2245. [Online]. Available:http://www.lrec-conf.org/proceedings/lrec2016/pdf/1194_Paper.pdf
[21] V. Logacheva, F. Blain, and L. Specia, “Usfd’s phrase-level quality estimation systems,”in First Conference on Machine Translation, Volume 2: Shared Task Papers, ser. WMT,Berlin, Germany, 2016, pp. 790–795. [Online]. Available: www.statmt.org/wmt16/pdf/W16-2386.pdf
[22] K. Shah, R. W. Ng, F. Bougares, and L. Specia, “Investigating continuous space languagemodels for machine translation quality estimation,” in Conference on Empirical Methodsin Natural Language Processing, ser. EMNLP, Lisboa, Portugal, 2015, pp. 1073–1078.[Online]. Available: http://aclweb.org/anthology/D15-1125
[23] K. Shah, F. Bougares, L. Barrault, and L. Specia, “Shef-lium-nn: Sentence level qualityestimation with neural network features,” in First Conference on Machine Translation,Volume 2: Shared Task Papers, ser. WMT, Berlin, Germany, 2016, pp. 828–832. [Online].Available: www.statmt.org/wmt16/pdf/W16-2392.pdf
Page 20 of 146

Quality Translation 21D3.3: Evaluation metrics and analysis of first annotation round
[24] K. Shah and L. Specia, “Large-scale multitask learning for machine translationquality estimation,” in Conference of the North American Chapter of the Association forComputational Linguistics: Human Language Technologies, San Diego, California, 2016,pp. 558–567. [Online]. Available: http://www.aclweb.org/anthology/N16-1069
[25] D. Beck, L. Specia, and T. Cohn, “Exploring prediction uncertainty in machine translationquality estimation,” in Conference on Computational Natural Language Learning, ser.CONLL, Berlin, Germany, 2016. [Online]. Available: https://aclweb.org/anthology/K/K16/K16-1021.pdf
[26] K. Shah, T. Cohn, and L. Specia, “A Bayesian non-linear method for feature selectionin machine translation quality estimation,” Machine Translation, p. 1–25, 2015. [Online].Available: http://dx.doi.org/10.1007/s10590-014-9164-x
[27] L. Specia, G. Paetzold, and C. Scarton, “Multi-level translation quality predictionwith quest++,” in ACL-IJCNLP 2015 System Demonstrations, Beijing, China, 2015, pp.115–120. [Online]. Available: http://www.aclweb.org/anthology/P15-4020
[28] Y. Graham, T. Baldwin, M. Dowling, M. Eskevich, T. Lynn, and L. Tounsi, “Is all thatglitters in machine translation quality estimation really gold standard?” in Proceedings ofthe 26th International Conference on Computational Linguistics, Osaka, Japan, 2016.
[29] O. Bojar, C. Buck, C. Callison-Burch, C. Federmann, B. Haddow, P. Koehn, C. Monz,M. Post, R. Soricut, and L. Specia, “Findings of the 2013 Workshop on Statistical MachineTranslation,” in Proceedings of the Eighth Workshop on Statistical Machine Translation.Sofia, Bulgaria: Association for Computational Linguistics, August 2013, pp. 1–44.[Online]. Available: http://www.aclweb.org/anthology/W13-2201
[30] Y. Graham, “Improving evaluation of machine translation quality estimation,” inProceedings of the 53rd Annual Meeting of the Association for Computational Linguisticsand the 7th International Joint Conference on Natural Language Processing (Volume 1:Long Papers). Beijing, China: Association for Computational Linguistics, July 2015, pp.1804–1813. [Online]. Available: http://www.aclweb.org/anthology/P15-1174
[31] Y. Graham, T. Baldwin, A. Moffat, and J. Zobel, “Continuous measurement scales in hu-man evaluation of machine translation,” in Proceedings of the 7th Linguistic AnnotationWorkshop & Interoperability with Discourse. Sofia, Bulgaria: Association for Computa-tional Linguistics, 2013, pp. 33–41.
[32] Y. Graham, N. Mathur, and T. Baldwin, “Accurate evaluation of segment-level machinetranslation metrics,” in Proceedings of the 2015 Conference of the North American Chapterof the Association for Computational Linguistics Human Language Technologies. Denver,Colorado: Association for Computational Linguistics, 2015, pp. 1183–1191.
[33] N. Schottmüller and J. Nivre, “Issues in translating verb-particle constructions fromgerman to english,” in Proceedings of the 10th Workshop on Multiword Expressions(MWE). Gothenburg, Sweden: Association for Computational Linguistics, April 2014,pp. 124–131. [Online]. Available: http://www.aclweb.org/anthology/W14-0821
[34] L. Guillou and C. Hardmeier, “Protest: A test suite for evaluating pronouns in machinetranslation,” in Proceedings of the Tenth International Conference on Language Resourcesand Evaluation (LREC 2016), N. C. C. Chair), K. Choukri, T. Declerck, S. Goggi, M. Gro-belnik, B. Maegaard, J. Mariani, H. Mazo, A. Moreno, J. Odijk, and S. Piperidis, Eds.Paris, France: European Language Resources Association (ELRA), may 2016.
[35] L. Bentivogli, A. Bisazza, M. Cettolo, and M. Federico, “Neural versus phrase-basedmachine translation quality: a case study,” CoRR, vol. abs/1608.04631, 2016. [Online].Available: http://arxiv.org/abs/1608.04631
Page 21 of 146
Quality Translation 21D3.3: Evaluation metrics and analysis of first annotation round
[36] S. Lehmann, S. Oepen, S. Regnier-Prost, K. Netter, V. Lux, J. Klein, K. Falkedal, F. Fou-vry, D. Estival, E. Dauphin, H. Compagnion, J. Baur, L. Balkan, and D. Arnold, “Tsnlp- test suites for natural language processing,” in Proceedings of the 16th InternationalConference on Computational Linguistics, 1996, pp. 711–716.
[37] P. Koehn, H. Hoang, A. Birch, C. Callison-Burch, M. Federico, N. Bertoldi,B. Cowan, W. Shen, C. Moran, R. Zens, C. Dyer, O. Bojar, A. Constantin, andE. Herbst, “Moses: Open source toolkit for statistical machine translation,” inProceedings of the 45th Annual Meeting of the Association for Computational LinguisticsCompanion Volume Proceedings of the Demo and Poster Sessions. Prague, Czech Republic:Association for Computational Linguistics, June 2007, pp. 177–180. [Online]. Available:http://www.aclweb.org/anthology/P07-2045.pdf
[38] R. Sennrich, B. Haddow, and A. Birch, “Edinburgh neural machine translation systems forWMT 16,” CoRR, vol. abs/1606.02891, 2016.
[39] J.-T. Peter, A. Guta, N. Rossenbach, M. Graça, and H. Ney, “The rwth aachen machinetranslation system for iwslt 2016,” in International Workshop on Spoken Language Trans-lation, Seattle, USA, Dec. 2016.
[40] J. A. Alonso and G. Thurmair, “The Comprendium Translator system,” in Proceedings ofthe Ninth Machine Translation Summit. International Association for Machine Translation(IAMT), 2003.
[41] T. Baldwin and S. N. Kim, “Multiword expressions,” in Handbook of Natural LanguageProcessing, Second Edition. Chapman and Hall/CRC, 2010, pp. 267–292.
[42] E. Avramidis, V. Macketanz, A. Burchardt, J. Helcl, and H. Uszkoreit, “Deepermachine translation and evaluation for german,” in Proceedings of the 2nd DeepMachine Translation Workshop. Deep Machine Translation Workshop (DMTW), October21, Lisbon, Portugal, J. Hajic, G. van Noord, and A. Branco, Eds., CharlesUniversity Prague. Charles University, Prague, 10 2016, pp. 29–38. [Online]. Avail-able: http://www.aclweb.org/anthology/W16-6404https://www.dfki.de/web/forschung/publikationen/renameFileForDownload?filename=W16-6404.pdf&file_id=uploads_2983
[43] E. Avramidis, A. Burchardt, V. Macketanz, and A. Srivastava, “DFKI’ssystem for wmt16 it-domain task, including analysis of systematic errors,” inProceedings of the First Conference on Machine Translation. Workshop on StatisticalMachine Translation (WMT-16), located at The 54th Annual Meeting of the Associ-ation for Computational Linguistics, August 11-12, Berlin, Germany. Associationfor Computational Linguistics, 8 2016, pp. 415–422. [Online]. Available: http://www.aclweb.org/anthology/W/W16/W16-2329https://www.dfki.de/web/forschung/publikationen/renameFileForDownload?filename=W16-2329.pdf&file_id=uploads_2920
Page 22 of 146

Quality Translation 21D3.3: Evaluation metrics and analysis of first annotation round
A Report on activities related to MQM/DQF since M6
Quality Translation 21
Report on activities related to MQM/DQF
Page 1 of 5
ReportonactivitiesrelatedtoMQM/DQFsinceM6
1 IntroductionSince M6, after the MQM-DQF harmonization, TAUS has been promoting the MQM-DQF error typology developed in the QT21 project by facilitating integration in a number of CAT tools (SDL Trados Studio) and Translation Management Systems (SDL WorldServer, SDL TMS) used in the translation industry. Industry events such as the TAUS Annual conference and Industry Leaders Forum as well as several roundtable meetings and the bi-annual QE Summit provided ample opportunities to educate and convince industry professionals about the benefits of the new harmo-nized metrics. Collaboration agreements have been made with a number of technol-ogies that have committed to deliver an integrated solution in their software packages in 2017 (GlobalLink, MemoQ, Lingotek, Memsource, Ontram, Leaf/Fabric by Mi-crosoft). TAUS has started collecting feedback using different channels including events, demo calls, user group calls, webinars and online support and a first round of updates have been carried out in Q3 2016. The TAUS DQF team and DFKI have become involved with ASTM and is actively supporting the standardization of the error typology that will bring the harmonized metric to the next level and will possibly be a trigger for industry-wide adoption.
2 UptakeThere is a growing interest globally in TAUS DQF including the harmonized error typology. Companies and organizations such as Seprotec, LDS Church, Dell and Tableau are on the verge of using the TAUS Quality Dashboard together with that the harmonized error typology in production. TAUS is actively assisting companies in implementing the error-typology by offering one-on-one consulting sessions, organiz-ing and participating in user group calls and webinars and demoing the use of the metric at various events.
3 UsergroupIn the summer of 2016, TAUS initiated a user group made up of large enterprises and organizations to discuss topics related to translation quality evaluation including error-typology based evaluation. The goal of these meetings is to come to an agree-ment on an enterprise solution for using the harmonized metric. This new solution would enable large enterprises having data privacy issues to share error-annotated data without actually sharing textual segments. Participating companies and organizations in this consultation include: ADP, Alibaba, Alpha CRC, Amazon, CA Technologies, Cisco, Dell - EMC, DFKI, eBay, Intel, LDS Church, Lionbridge, Microsoft, Oracle, PayPal, Symantec, Tableau Software, Trans-lated, Translations.com, Welocalize.
Page 23 of 146

Quality Translation 21D3.3: Evaluation metrics and analysis of first annotation round
Quality Translation 21
Report on activities related to MQM/DQF
Page 2 of 5
As part of the consultation during these calls, we have managed to resolve diverging issues in translation quality evaluation. We have addressed the differences in name conventions when it comes to error review and correction. We have agreed on the nomenclature, quality levels and all the attributes for content types and industry do-mains that we want to track in the quality reports of an enterprise solution. We were also able to settle on a pragmatic approach to harmonizing word counts, segmenta-tion and edit distance to make sure that annotated datasets of different companies using different technologies are still comparable when tracking quality and productivi-ty across the industry and supply chains. Finally, we all agreed on the most essential reports we would like to see for benchmarking and trend analysis.
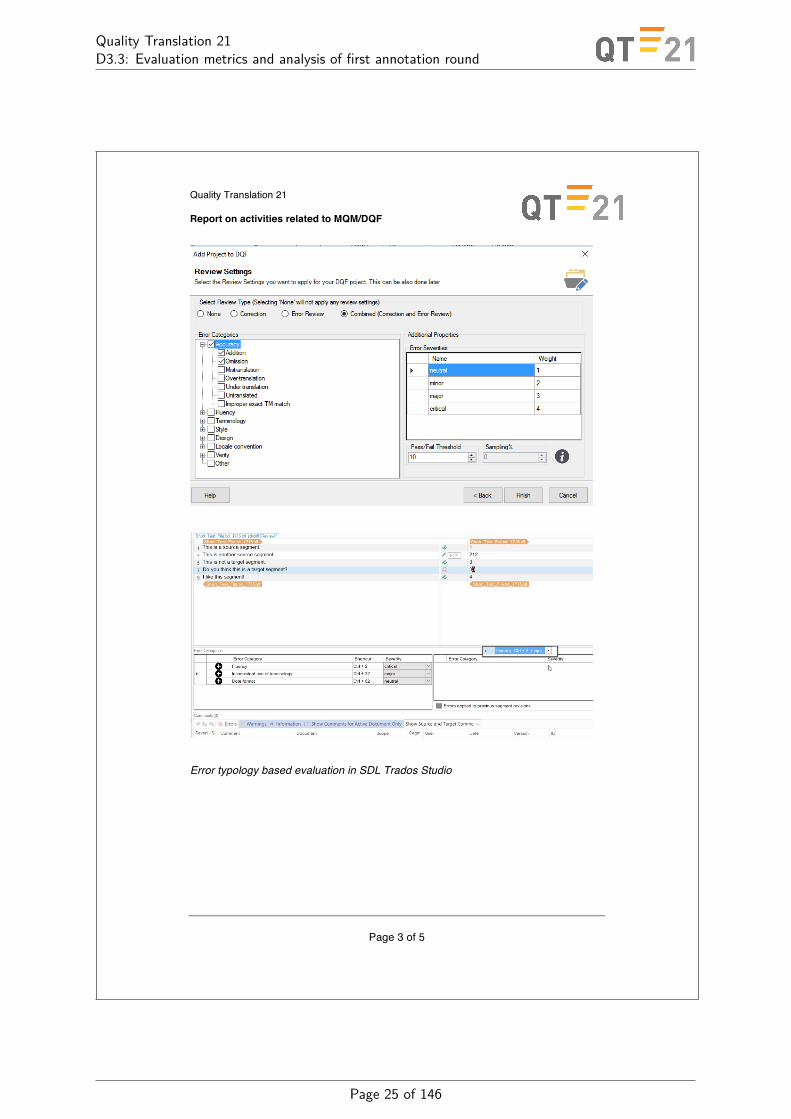
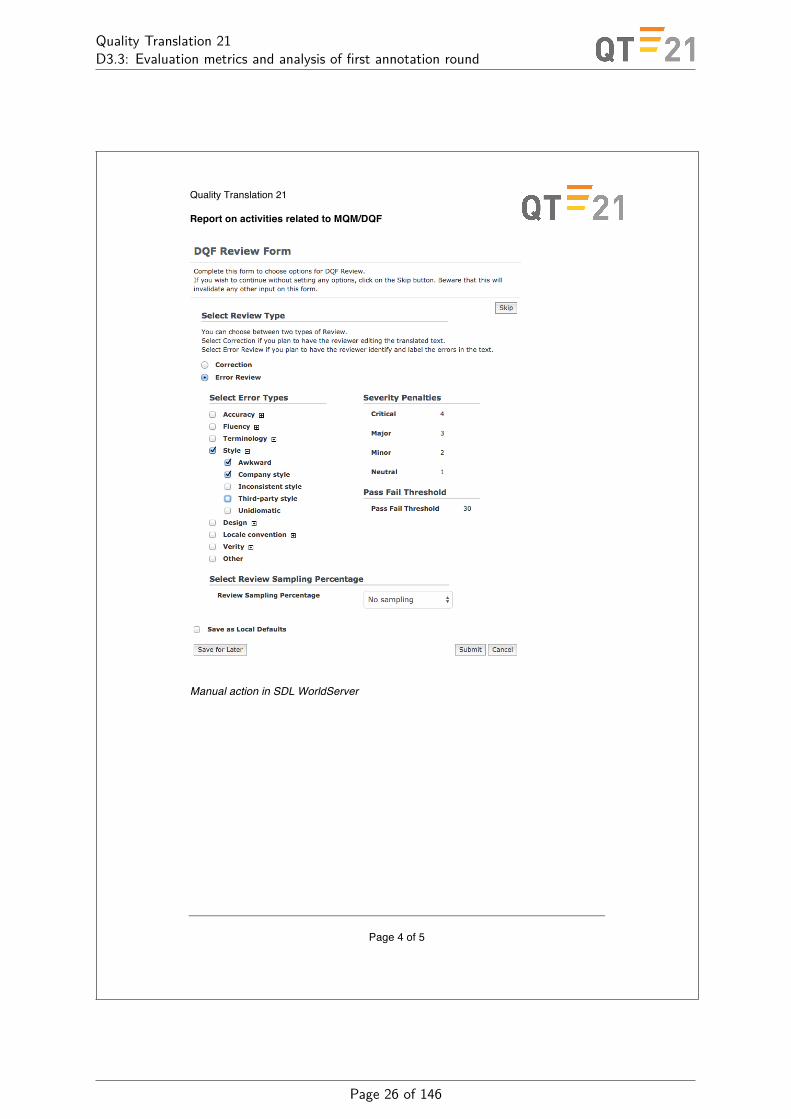
4 QualityDashboardThe Quality Dashboard is an industry-shared platform that visualizes translation qual-ity and productivity data in a flexible reporting environment. Both internal and external benchmarking is supported. The quality reporting builds on the harmonized MQM-DQF error typology developed in the QT21 project. The screenshots below show the integration of the error typology in the Quality Dashboard and in the interface of the various technologies:
Number and types of errors on the project level in the TAUS Quality Dashboard
Page 24 of 146
Quality Translation 21D3.3: Evaluation metrics and analysis of first annotation round
Quality Translation 21
Report on activities related to MQM/DQF
Page 3 of 5
Error typology based evaluation in SDL Trados Studio
Page 25 of 146
Quality Translation 21D3.3: Evaluation metrics and analysis of first annotation round
Quality Translation 21
Report on activities related to MQM/DQF
Page 4 of 5
Manual action in SDL WorldServer
Page 26 of 146
Quality Translation 21D3.3: Evaluation metrics and analysis of first annotation round
Quality Translation 21
Report on activities related to MQM/DQF
Page 5 of 5
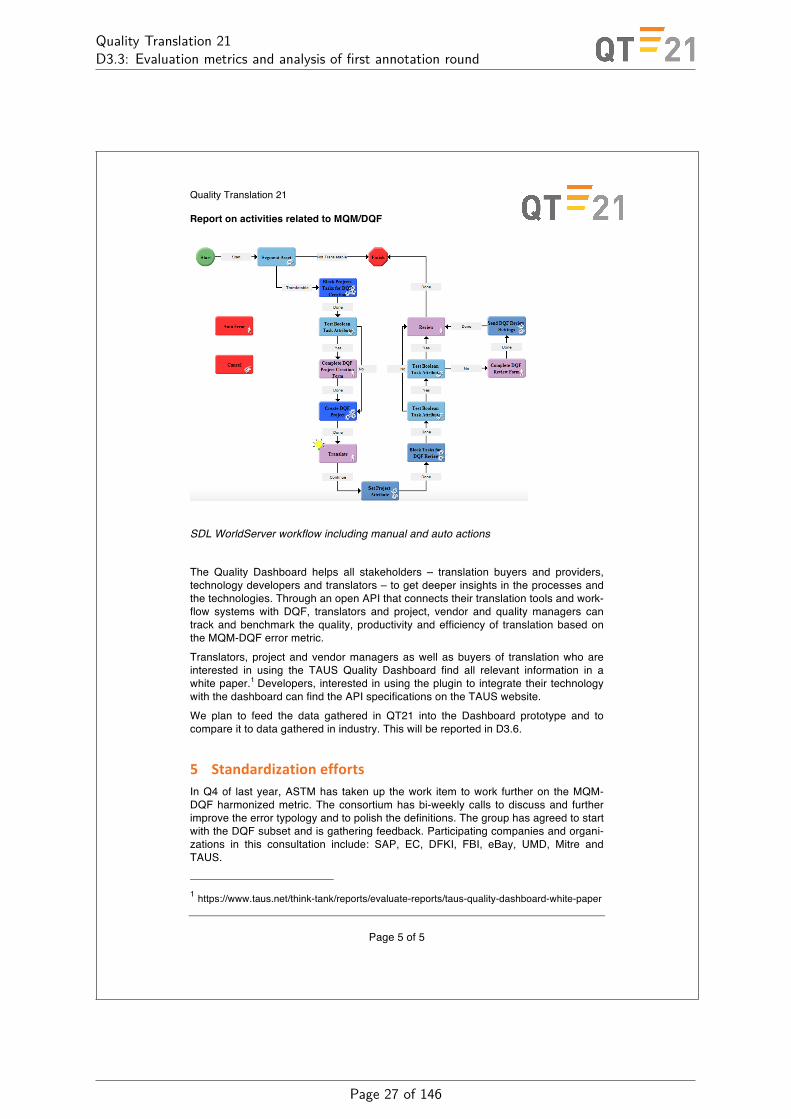
SDL WorldServer workflow including manual and auto actions The Quality Dashboard helps all stakeholders – translation buyers and providers, technology developers and translators – to get deeper insights in the processes and the technologies. Through an open API that connects their translation tools and work-flow systems with DQF, translators and project, vendor and quality managers can track and benchmark the quality, productivity and efficiency of translation based on the MQM-DQF error metric. Translators, project and vendor managers as well as buyers of translation who are interested in using the TAUS Quality Dashboard find all relevant information in a white paper.1 Developers, interested in using the plugin to integrate their technology with the dashboard can find the API specifications on the TAUS website. We plan to feed the data gathered in QT21 into the Dashboard prototype and to compare it to data gathered in industry. This will be reported in D3.6.
5 StandardizationeffortsIn Q4 of last year, ASTM has taken up the work item to work further on the MQM-DQF harmonized metric. The consortium has bi-weekly calls to discuss and further improve the error typology and to polish the definitions. The group has agreed to start with the DQF subset and is gathering feedback. Participating companies and organi-zations in this consultation include: SAP, EC, DFKI, FBI, eBay, UMD, Mitre and TAUS.
1 https://www.taus.net/think-tank/reports/evaluate-reports/taus-quality-dashboard-white-paper
Page 27 of 146
Quality Translation 21D3.3: Evaluation metrics and analysis of first annotation round
B Report on validation of MQM (subcontract Alan Melby, FIT)
1
Reportontasks3and4(validation)ofMQM;subcontract(A14.076c)betweenDFKIandFIT(performedbyAlanK.Melby,memberoftheFITCouncil,v1e)
IgatheredinformationaboutMQMfromhundredsofstakeholdersspreadacrosstwelvetranslation-relatedeventsduring2016.AnanalysisofthisinformationrevealedthatthemainattributesthatdistinguishamongapproachestoTQE(translationqualityevaluation)are(a)whethertheapproachisreference-basedorreference-freeand(b)whetheritisautomaticormanual.MQMisreference-freeandmanual,whileBLEUisreference-basedandautomatic.Generallyspeaking,onlystakeholderswhoalreadyuseorintendtouseareference-free,manualapproachwereinterestedinMQM.Thesestakeholdersconsistofthreemaingroups:(1)translationserviceproviders,suchascommercialtranslationcompaniesandgovernmenttranslationservices;(2)translationbuyers;and(3)translatortooldevelopers.ConspicuouslyabsentfromthoseinterestedinMQMarethosefocusedonmachinetranslationresearchwhodonotdealwithendusers.Theytypicallyusereference-based,automaticapproachestoTQEandfindthatMQMistooexpensiveintermsofhumanresourcesanddonotyetseehowtobenefitfromthedetailederrormarkupprovidedbyanalyticuseofMQM.Butindicationsarethisischanging.1NotethatMQMappliesnotonlytoanalyticevaluation(i.e.identifyingerrorsbycategory,mostlyatthewordandphraselevel)butalsotoothertypesofTQE,e.g.manualcomparisonandranking2.Threeeventswhoseprimarypurposewastofulfiltherequirementsofthesubcontractwere:(1)aninvitedlectureattheDGT(DirectorateGeneralforTranslation)inBrusselsonOctober12th,withhigh-definitionaudio-videolinktoaudiencesinLuxembourg(totalattendeesapproximately90);(2)alectureatanEliaconference,alsoinBrussels,(http://events.elia-association.org/nd-2016/)onOctober14thtoafullroom(approximately40attendees);and(3)apresentationduringahalf-dayworkshopdedicatedtodiscussionofvariousapproachestoTQEatAMTA(amtaweb.org)inAustin,Texas,onOctober28th(approximately20participants),allveryinterestedinTQE.AdoptionofMQMduring2016canbemeasuredinseveralways.First,multiplein-personcontactswithIngemarStrandvikoftheDGTandothers,beginninginMarch,supplementedbyemailandSkypediscussions,resultedintheDGTseriouslylookingatadoptingMQM.SeetheattachedDGTstatementonMQMandotherstatementslaterinthisreport.Secondly,manypeople(estimate:35people)atmultipleeventstoldmethattheresultofharmonizationoftheMQMandDQFerrortypologies,whichisoftenreferredtoasMQM-DQF,makesitobviousthatanyanalytic,reference-free,manualTQEshouldtakeMQM-DQFintoaccount.Thirdly,itisclearthatfurtherworkonMQMawarenessisneeded.Forexample,IaskedtheaudienceattheEliaevent,whichconsistedalmostentirelyoftranslationcompanies,whethertheyhadpreviouslyheardofMQM,andoverninetypercenthadnot.MypresentationwastheirintroductiontoMQM.Ontheotherhand,itisalsoclearthatthepromotionofDQFbyTAUSisveryeffective.Logically,ifeveryonereferredtoMQM-DQFinsteadoftoMQMorDQFseparately,awarenesswouldbeenhanced.EvenidentifyingadoptionofMQM-DQFtakestimeandeffort.AnexampleistheTraMOOCproject(http://tramooc.eu/).IattendedaTraMOOCpresentationattheEliaconferencementionedabove.Thepersonpresentingstatedthatthequalityofthetranslationwouldbeevaluated.IaskedwhetherMQMwouldbeused,butthepresenterdidnotknow.LaterIencounteredJossMoorkens
1 SeeMikeDillingerkeynoteatAMTA2016andDillingerquoteinsupplementaldetailssection,laterinthisreport.2 Ideally,comparisonandrankingshouldbebasedonspecificationsandhigh-levelerrorcategories(i.e.dimensions).
Page 28 of 146

Quality Translation 21D3.3: Evaluation metrics and analysis of first annotation round
2
atanotherevent.HementionedTraMOOC,andIaskedhimaboutMQM.HedidsomeinvestigationandgotbacktometoindicatethatMQM-DQFwillindeedbeusedinthenextphaseoftheproject. Astakeholdergroupthathasnotyetbeenmentionedinthisreportistranslators.Beingacertifiedtranslator,IhaveobservedthatprofessionaltranslatorsarenotusuallyinvolvedinanalyticTQEingeneralandthereforearenotinterestedinMQM-DQF.Inthecaseofhigh-gradetranslation,theworkofonetranslatorisoftencorrectedbyanothertranslator,butnosystematicapproachisused.Instead,editsaremadetotheinitialtranslationbyapersoncalledareviserinEuropeandabilingualeditorintheUnitedStates.Often,thetranslatordoesnotevenseethechangesmadebythereviser/editor.ItispossiblethatafundamentalchangeisneededinthewaytranslationqualityismanagedintranslationproductionworkflowsinordertoproperlyimplementMQM-DQF.However,thereisanotherwaythatMQM-DQFcouldimpacttranslators.Theycoulduseitwhentheydevelopasupplementalskillthathasbeencalledlanguageservicesadvisement3.AsignificantvalidationofMQM-DQFistakingplaceintheASTMInternational(www.astm.org)projecttodevelopastandardforTQE,basedonMQM-DQF.Iamactivelyinvolvedinthisproject(WK46396),whichbringstogetheravarietyofstakeholdersfromNorthAmericaandEurope.Insummary,(re:task3)MQM-DQFhasbeenvalidatedascompatiblewithindustrybestpracticesinreference-freemanualTQEandbecomingthestandard;(re:task4)translatorscurrentlyviewMQM-DQFasnotrelevanttotheirdailywork,butFIThasproposedlanguageservicesadvisementtomakeitrelevant.Beforepresentingsomesupportingdetails,Imakethreerecommendations:(1)Machine-translationresearcherscoulduseMQMtoaddressaknownissueinusingreference-based,automaticmeasuressuchasBLEU,namely,thefactthatBLEUscoresaresensitivetowhichreferencetranslation(s)areused,thusmakingthemunreliableintheQualityManagementsenseofthetermreliability.Inaddition,thereisanopenquestionastowhethertheBLEUscoreisentirelyvalidintheQualityManagementsense.MorecarecouldbetakeninobtainingandcheckingreferencetranslationsbydevelopingstructuredtranslationspecificationsforthereferencetranslationsandthenevaluatingthemmanuallyusinganMQMmetriccustomizedtothosespecifications.Thiswouldnotslowdowntheuseofthereferencetranslation(s)inobtainingBLEUscoresduringdevelopment,butwouldperhapsincreasereliabilityandvalidity.Thisisaquestionthatwouldrequireacarefulstudytoanswer4.(2)Workonautomaticestimationandautomaticpost-editing,whicharereference-freeandautomatic,isclearlyadvancing.HereMQM-DQFanalysiscouldbeperiodicallycalibratedwithautomaticestimationscoresandpost-editingresults,withoutslowingdownautomaticprocessing.(3)Testingofhumantranslators,alltranslatingthesamesourcetext,whichisreference-basedandmanualTQE,couldbenefitfromMQM-DQF,ifthoseinvolvedintranslatortesting,bothinthecommercialworldandtheacademicworld,wouldagreetouseMQM-DQFerrorcategories,sothatstudiesofthevalidityandreliabilityofsuchtestingcanbemoreeasilysharedamongresearchersandeventuallytestresultscanbebettercomparedacrosscandidates.
3 SeeEleanorCorneliuspresentationatAsling2016(http://www.asling.org/tc38/)4 SeeLREC2016workshoponMTevaluation,e.g."BluesforBLEU…"(http://lrec2016.lrec-conf.org/en/)
Page 29 of 146

Quality Translation 21D3.3: Evaluation metrics and analysis of first annotation round
3
SupportingDetailsfortheclaimsmadeaboveMQM-DQFandMTResearchRegardingmyclaimthatMTresearcherswhodonotdealwithenduserslikeBLEUandarenotveryinterestedinMQM-DQF,IaskedMikeDillinger,pastpresidentoftheInternationalAssociationforMachineTranslation,tocomment.Hewrote:"Yes,IagreethatMTresearcherslikeBLEUbecausethere'snoothersimple,automaticoptionthat'sbetter.Yes,IagreethatMQMandqualitativefeedbackaren'tusedbecausethere'snostraightforwardwayto"translate"thatfeedbackintodeveloperactions.OnthatscoreNMTsystemsaremuchworse--everyoneI'veaskedsaysthatthey'reverydifficultto"drive"inoneparticulardirectionoranother."IspokeatlengthwithYANGJin,anMTresearcheratSystran(http://www.systransoft.com/).ShehasworkedtherethroughallthreegenerationsofMTsystems(rule-based,SMT,andnowNMT).SheobservedthatifyoureallywanttoknowwhyanSMTsystemisdoingsomething,youcanlookattheinternaltables,butwithNMT,itismoreofablackbox,andthereisnostraightforwardway,atleastnotyet,toadjustthesystemtocorrectaparticularerrorintheoutput.MQM-DQFandTranslationCompaniesMultilingInternational(www.multiling.com)isadoptingMQM-DQF.TheyareexperimentingwithvariousMQM-basedtranslationqualitymetrics,eachspecifictoasetofspecificationsforatypeoftranslationproject.TheyhavecreatedanMQMpluginforTrados.Theirobjectiveistomakeit"extremelyfastandnon-invasivefor[theirrevisersandreviewers]toaddMQMdata”.TheyplantoimplementMQM-DQFwidelyintheirtranslationworkflowbytheendof2017.MQM-DQFandTranslationBuyersSAP(www.sap.com)isawell-knownsoftwarecompany.Itemfouronmylistoftwelvetranslation-relatedeventsduring2016wasavisittoSAPheadquartersnearHeidelberg,Germany,inOctober.OnJanuary27th,IreceivedthefollowingupdatefromSusanneHempelofSAP:"WehaveanalyzedtheharmonizedMQM/DQFmodel,identifiedtheerrorsthatoccuronSAPuserinterfaces,anddiscussedhowandtowhatlevelofgranularitysuchamodelwouldmakesenseforerrorreportingatSAP.Asnextsteps,welookedatthefeasibilityofautomatederrordetectionintranslationmemories,inthetranslatedtextsaswellasdirectlyonUIscreens.Aschallengesweidentifiedthelackofcontext(inmanycases,errorsareonlyvalidatedaserrorsintherightcontext)…"NoapproachtoTQEcancompensateforlackofcontext,butitappearsthatfornow,SAPistakingMQMseriously.Iwillreceiveupdatesfromtimetotime,sinceMs.HempelisamemberoftheASTMprojectdevelopingatranslationqualitystandardbasedonMQM-DQF.TAUSgathersadditionalinformationabouttranslationbuyerswhoareimplementingMQM,attheirregularQE(qualityevaluation)summits.PerhapstheywillcompileanddistributeadditionalsupportingdetailsaspartoftheirongoingeffortsregardingMQM-DQF,subjecttoconfidentiality.
Page 30 of 146
Quality Translation 21D3.3: Evaluation metrics and analysis of first annotation round
4
NVTC5 connectstranslationbuyersintheUSgovernmentwithtranslationcompaniesandindividualtranslatorsintheprivatesector.Overthecourseof2016,IlookedintohowNTVCevaluatestranslationquality.Afterconsiderablenetworking,Igotapprovaltodiscussthiswiththequalitymanager,thankstomycolleaguesattheFBI.IfoundoutthattheyuseaslightlymodifiedversionofLPET(https://www.casl.umd.edu/projects/lpet/).ItturnsoutthatLPETwasdevelopedbyamemberoftheASTMtranslationqualityprojectteam,EricaMichael.IamincontactwithherandintheprocessofmappingthetranslationerrorcategoriesinLPETwiththoseinMQM-DQF.TheMozillaFoundation(https://www.mozilla.org/en-US/foundation/)wasanearlyadopterofMQM.JeffBeatty,headoflocalizationatMozilla,statedinJune2016thattheyhadalready"guidedatleast25%of[their]localizationcommunitiesthroughtheprocessofcreatingtheirownlanguage-specific[MQM-compliant]styleguides."Forthefuturetheyareconsideringagamifiedsystem,allowinguserstoevaluateoneprojectorevenanisolatedissuetype(errorcategory).TheirgoalistobeoneoftheMQM-compliantorganizationsintheworld,allowingMozillato"deliverbetterlocalizationstothepeopleofEuropeandtheworld". MQMandTranslatorsSteveLank,vice-presidentofalanguageservicescompanyandleaderoftheprojecttoupdatethemainASTMtranslationstandard(F2575-14)accordingtorecentchangesinthetranslationindustry,hasthatindividualtranslatorscurrentlyhavelittlereasontouseMQM-DQF.Oftenwhenaninitialtranslationiscorrectedbyanothertranslator,thepersonwhocreatedthatinitialtranslationoftendoesnotevenseethechangesthatweremadebythebilingualeditor.Accordingtomycolleague,PaulFields,aninternationallyrecognizedexpertinqualitymanagement,thispracticeisnotinlinewithqualitymanagementprinciplesofprocessimprovement.Fundamentalchangesinthetranslationindustry,includingadoptionofqualitymanagementprinciples,areneededbeforetranslatorswillbeabletobenefitfromMQMotherthanbybecominglanguageservicesadvisors.Aspreviouslynoted,EleanorCornelius,FIT-DFKIliaison,haswrittenonthistopic.DavidRumsey,PresidentofATA(www.atanet.org),oneofthelargestassociationsofprofessionaltranslators,withabouteleventhousandmembers,toldmeinJanuary2017"Thesubjectoftranslationqualitysparksalotofdebate.Thereisabsolutelynoconsistency.Sometimesthe[TQE]isdonebythe[translationcompany],sometimesbytherevisers(paidorunpaid)withscalesthatareacrosstheboard."ThissituationbegsforincreaseduseofMQM-DQFintranslationworkflow.ThequestionofTQEissocontroversialamongprofessionaltranslatorsthatin2015PresidentRumseytoldmeIwouldhavetochoosebetweenworkingonMQMandcontinuingaschairoftheATAStandardsCommitteesothatitwouldnotappearthatATAwasendorsingworkonTQE.IresignedandcontinuedworkingonMQM,attemptingtofindwaystoaddresstranslatorconcerns.PresentationsaboutMQMMyfourpresentationsaboutMQMduringOctoberandNovember2016arealldifferent,eachdesignedfortheintendedaudience(DGT,translationcompanies,MTdevelopers,andtranslators).
5 https://www.fbi.gov/about/leadership-and-structure/intelligence-branch/national-virtual-translation-center
Page 31 of 146

Quality Translation 21D3.3: Evaluation metrics and analysis of first annotation round
C Statement from the European Commission’s Directorate Generalfor Translation on MQM
Statement from the European Commission's Directorate General for Translation (DGT) on MQM
Our objective: a common understanding of quality assessment and consistent evaluation practices
The more DGT needs to resort to outsourcing, the more important it becomes to ensure a common
understanding of how to assess translation quality so that our translation quality evaluation
guidelines are applied consistently. In our efforts to achieve this, we want to build on existing best
practices, avoid reinventing the wheel and avoid lengthy internal discussions and "power games"
amongst 24 language communities, which over the years sometimes develop slightly different
practices and which would all tend to defend that their approach is the right one.
Therefore, to determine how to define what we mean in practice with the different quality
requirements, error categories and severity levels that are in the tender specifications, we have
searched for the state of the art as regards existing external authoritative benchmarks for translation
quality assessment. This led us to the MQM.
Since MQM is a framework for describing translation quality assessment criteria and metrics in a
consistent way linked to specific project specifications and quality requirements, we concluded that
we can use the translation quality issues that matter to us, in as much or as little detail as they are
needed for our purposes. Even without changing our current system, we could use MQM straight
away as a benchmark for defining and interpreting error categories, severity levels and principles for
translation quality evaluation in a consistent way.
Recent developments to make the TAUS Dynamic Quality Framework a sub-set of the MQM and the
resulting MQM/DQF harmonised error categorisation have further confirmed the move towards
standardisation. On-going standardisation work in ASTM and ISO will undoubtedly take this
development further. This has further increased our interest in exploring how to use the MQM in
practice.
To get a broader buy-in for the use of MQM, on 12 October 2016, we invited Alan Melby to give a
lecture to present MQM and the broader context to some ninety colleagues from DGT and the
translation services of other EU institutions. He was assisted by Aljocha Burchart from DFKI.
This presentation provided a perfect in-depth contextualisation that paved the way for the further
roll-out of our plan. The next steps are to test different ways of mapping our current system to MQM
and to test different MQM compliant translation quality evaluation (TQE) settings with or without
TQE tools, as well as consider fine-tuning the error categorisation we currently use for the next set of
outsourcing contracts and adapt them to MQM or MQM/DQF. Alan Melby provided valuable support
for this process. These tests will take place throughout 2017.
Ingemar Strandvik
Quality manager, DGT
22 January 2017
Page 32 of 146

Quality Translation 21D3.3: Evaluation metrics and analysis of first annotation round
D Quality Test Suite and Results of First Annotation RoundTest suites are a familiar tool in NLP in areas such as grammar checking, where one may wishto ensure that a parser is able to analyse certain sentences correctly or test the parser afterchanges to see if it still behaves in the expected way. By test suite, we refer to a selected set ofinput-output pairs that reflects interesting or difficult cases. In contrast to a “real-life” corpusthat includes reference translations, the input in a test suite may well be made-up or edited toisolate and illustrate issues.
Apart from several singular attempts [5, 6, 7, etc.] test suites have not generally been usedin machine translation (MT) research. One of the reasons for this might be the fear that theperformance of statistical MT systems depends so much on the particular input data, parametersettings, etc., that final conclusions about the errors they make, particularly about the differentreasons (e.g., length of n-grams, missing training examples), are difficult to obtain.
Another reason might be that “correct” MT output cannot be specified in the same way asthe output of other language processing tasks like parsing or fact extraction where the expectedresults can be more or less clearly defined. Due to the variation of language, ambiguity, etc.,checking and evaluating MT output can be almost as difficult as the translation itself.
Nevertheless, in narrow domains there seems to be interest in detecting differences betweensystems and within the development of one system, e.g., in terms of verb-particle constructions[33] or pronouns [34], a contribution in the context of QT21. [35] performed a comparison ofneural with phrase-based MT systems in the context of QT21 on IWSLT data using a coarse-grained error typology. Neural systems have been found to make less morphology, lexical andword order errors.
The test suite presented below is a pioneering effort to address translation barriers in a sys-tematic fashion. We also present our ongoing efforts for automated checking of MT performanceon the test items.
We are convinced that testing of system performance on error classes leads to insights thatcan guide future research and improvements of systems. By using test suites, MT developerswill be able to see how their systems perform in scenarios that are likely to lead to failure andcan take corrective action.
D.1 Test suite creationThis resource contains a table of machine-translated segments that show errors. The errors wereevaluated and the segments selected by expert linguists and selected because they either repre-sent a barrier for MT systems or because they exhibit errors that exemplify typical problemsthat arise in MT scenarios. The data were derived from several sources:
• Segments from different corpora or other resources such as grammatical resources or onlinelist of typical translation errors. These segments were selected to illustrate particular issuetypes. In some cases, sentences were created ad hoc to illustrate common problems witha minimal example. A few segments were taken over from a pilot attempt to create a testsuite in the QTLaunchPad project.
• Segments from the TSNLP Grammar Test Suite [36]. To prepare this corpus all of the“grammatical” segments from TSNLP for the appropriate source language were reviewed.As TSNLP was not designed for use in MT testing, but rather to provide challenging casesfor grammar checkers, a team of two native-speaker linguists evaluated all segments foreach language and only those segments that both reviewers agreed were truly grammaticaland relevant for MT diagnosis were used. In addition, sentence fragments were removedsince isolated sentence fragments pose particular problems even for human translators. Inmany cases the segments were modified to better reflect “real world” semantic scenarios.
• We have consulted professional translator Prof. Dr. Silvia Hansen-Schirra from the Uni-versity of Mainz who provided us with a list of possible (machine) translation errors in
Page 33 of 146
Quality Translation 21D3.3: Evaluation metrics and analysis of first annotation round
the technical domain.
• Additionally, research assistants from a collaboration of the University of Mainz and DFKIworked on generating example sentences for the given categories to enlarge the quantityof sentences per category.
• Lastly, paradigmatic examples (e.g., for transitive and intransitive verbs) were created bythe authors.
The segments were translated with a prominent online translation service that can be seenas representing the state-of-the-art in statistical MT.
In all segments, the erroneous portions were marked with square brackets, focusing on oneerror at a time (i.e., each row in the suite addresses a single error). If multiple interesting errorsoccurred, we doubled the example and annotated each error in a separate row.
All segments were minimally post-edited to arrive at a correct sentence. Note that this meansthat all errors were corrected, not only the one under consideration. Post-editing was intendedto be minimal, with only enough changes to make the sentence grammatical and acceptable.Full post-editing in many cases would result in more substantive changes in sentence structure,but the goal was not to create a stylistically perfect text.
We found that production of a test suite is a very labour-intensive task, with hundredsof hours required to identify candidates, analyse them, and provide suitable documentation.By contrast, the TSNLP/paradigmatical data provided compact examples that were generallystraightforward to evaluate, but the exemplars have the disadvantage of being somewhat unnat-ural at times. By taking both data “from the wild” and the systematically created examples,however, we hope that we have created a certain balance.
D.2 Data structureEach row consists of the following main items.
Source As previously noted, the source segments were drawn from various sources. They wereoften simplified to exemplify a single error and to remove extraneous factors. Such simpli-fication typically consisted of shortening (e.g., by removing subordinate clauses, “extra”adjectives, or coordinated clauses not part of the error in question), semantic simplifi-cation (replacing “unusual” words with more common alternatives), and substitutionsof constituents in the segment with others to find examples that provided clear resultsunencumbered by other errors.
Phenomenon Each source sentence is annotated with one interesting linguistic phenomenonthat it exhibits (segments containing more than one interesting phenomenon are dupli-cated). The term “linguistic phenomenon” is understood in a pragmatic sense and coversvarious aspects that influence the translation quality. Therefore, our phenomena includemorpho-syntactic and semantic categories as well as issues of style, formatting issues, etc.Although we have used several linguistic theories for reference and to ensure a certaincompleteness of the phenomena covered, we abstain from trying to formulate anythinglike linguistic theory.
Phenomenon Category For reporting purposes, the detailed phenomena above are too finegrained. Therefore, we have created a two-level hierarchy in which each phenomenon isassigned a more abstract category.
Target (raw) The raw MT output. The portion of interest (i.e., the portion exhibiting theerror in question) is enclosed in square brackets. Other errors may be present, but therow concerns only the portion in square brackets.
Page 34 of 146

Quality Translation 21D3.3: Evaluation metrics and analysis of first annotation round
Target (edited) A minimally post-edited version of the raw MT output. Since in many casesother post-edits would be possible, this field should be understood as representing onepossible solution to the problem in brackets. In the edited target, all errors are correctedso that it is a fully correct translation.
Comment (optional) Any informative comments concerning the error in question. Theseare generally intended to guide users to understand the particular phenomena seen in thetarget section.
Positive/Negative token Needed for automation, see Section D.6.
An example showing these fields can be seen in Table 6.
Source Pheno-menonCate-gory
Pheno-menon
Target (raw) Target(edited)
Pos. to-ken (in-dicative)
Neg. to-ken (in-dicative)
English→GermanThey spent alot of moneyduring theirtrip.
MWE Collo-cation
Sie [ver-brachten] vielGeld währendihrer Reise.
Sie gabenviel Geld auswährend ihrerReise.
gaben...aus
ver-brachten
How can Isave a file inNotepad++?
Namedentity &terminol-ogy
Domain-specificterm
Wie kann icheine Datei inNotepad ++[sparen]?
Wie kann icheine Datei inNotepad++abspeichern?
(ab-) spei-chern,sichern
(ein-)sparen
No stopping. Verbtense/aspect/mood
Impera-tive
[Kein Haltenmehr].
Halten ver-boten.
Haltenverboten.
German→EnglishLena machtesich früh vomAcker.
MWE Idiom Lena [left thefield early].
Lena left early. left early field
Lisa hatLasagnegemacht,sie ist schon imOfen.
Non-verbalagreement
Corefer-ence
Lisa has madelasagne, [she] isalready in theoven.
Lisa has madelasagna, it isalready in theoven.
it she
Ich habe derFrau das Buchgegeben.
Verbtense/aspect/mood
Ditran-sitive -perfect
I [have] thewoman of theBook.
I have giventhe woman thebook.
giventhe bookto thewoman,gave thebookto thewoman,given thewomanthe book,gave thewomanthe book
Table 6: Example test suite entries (simplified for display purposes).
Page 35 of 146

Quality Translation 21D3.3: Evaluation metrics and analysis of first annotation round
D.3 Privacy and WorkflowIn order to avoid cheating (e.g., tuning systems on the test suite), the test suite will be kept secretto a large extent and DFKI will offer testing service to the partners. A “preview” is availablethrough META-SHARE.2 For reviewing purposes, the version submitted for Milestone M3 canbe used.
In order to send the sources to the partners for translation in an “anonymised” fashion, wehave compiled a script that takes our test items together with an arbitrary amount of distractoritems and scrambles all the data, so that the test items are “hidden”. Furthermore, there isthe option to send the scrambled data to the commercial online translating system via the APIto generate the translations of all sentences. Afterwards, the hidden data can be unscrambledfrom the distractors and analysed. The script is available from github.3
In the first evaluation round, the analysis was done by and large manually. In this analysis,we only focus on the phenomena in the respective sentences, meaning that translation errorsoccurring in the sentences that can not be ascribed to the phenomenon are being ignored. Thisis actually one of the central ideas for using a test suite as opposed to a normal reference corpus.Yet, in some cases testing for the correct treatment of the phenomenon boils down to checkingthe correctness of the complete sentence as in the case of, e.g., verbal paradigms.
To support manual checking, the outputs of the systems are automatically compared to thereference sentence in a first step. In a second step, the outputs are manually double-checkedas there is always more than one correct translation and, as just mentioned, also erroneoustranslations that correctly translate the linguistic phenomenon count as correct. As this is acomplex and time-consuming method, especially when analysing a great number of sentences, weare currently working on an automation of testing the output, cf. Section D.6. This automationas a side-effect will formalise what exactly is being checked for each phenomenon.
D.4 General use case: Evaluating QT21 engines and online system in a first an-notation round
We have used an early version of our test suite (ca. 800 items per language direction, to alarge extent verb paradigms) to trace the changes of a commercial online translation systemwhich has been switched from a phrase-based to neural approach according to the company’spublications. There are more than 100 different linguistic phenomena that we investigated inthis version of the test suite in each language direction. Many of the phenomena are equal orsimilar in both language directions but naturally some of them are also language-specific andonly occur in one language direction. They can be condensed to approximately 15 more generalcategories per direction.4
In our first evaluation round, we have evaluated several engines from the project and acommercial rule-based system on the basis of the very same test suite version to be able tocompare performance. Below, we will briefly describe the systems:
German – English
O-PBMT Old version of the commercial online system (web interface, February 2016).
O-NMT New version of the commercial online system (web interface, November 2016).2http://metashare.dfki.de/repository/browse/translation-quality-test-suite-de-en/
6ee97bdce3dd11e688ac003048d082a4d91d04d3b10e42bfa37903a31cbe0655/3https://github.com/jnehring/testsuite-scrambler4In our latest version of the test suite we created about 20 examples per phenomenon. However, in the early
version of the test suite that we used for comparing the systems, this wasn’t the case as at that time the testsuite was still work in progress. Therefore, the number of instances reported in the experiments below stronglyvaries among the categories (as well as between the languages). Thus, we excluded a few categories from theanalysis which had too few instances.
Page 36 of 146

Quality Translation 21D3.3: Evaluation metrics and analysis of first annotation round
OS-PBMT Open-source phrase-based system that primarily uses a default configuration toserve as a baseline. This includes a 5-gram modified Kneser-Ney language model, mkclsand MGiza for alignment, GDFA phrase extraction with a maximum phrase length offive, msd-bidi-fe lexical reordering, and the Moses decoder [37]. The WMT’16 data wasMoses-tokenized and normalized, truecased, and deduplicated.
DFKI-NMT Neural system from DFKI. The MT engine is based on the encoder-decoderneural architecture with attention. The model was trained on the respective parallelWMT’16 data.
ED-NMT Neural system from U Edinburgh. This MT engine is the top-ranked system thatwas submitted to the WMT ’16 news translation task [38]. The system was built using theNematus toolkit.5. Among other features, it uses byte-pair encoding (BPE) to split thevocabulary into subword units, uses additional parallel data generated by back-translation,uses an ensemble of four epochs (of the same training run), and uses a reversed right-to-leftmodel to rescore n-best output.
RWTH-NMT NMT-system from RWTH. This system is equal to the ensemble out of 8 NMTsystems optimized on TEDX used in the [39] campaign. The eight networks used make useof subwords units and are finetuned to perform well on the IWSLT 2016 MSLT Germanto English task.
RBMT Commercial rule-based system Lucy [40].
English – German
O-PBMT Old version of the commercial online system (web interface, February 2016).
O-NMT New version of the commercial online system (web interface, November 2016).
OS-PBMT Open-source phrase-based system. The same setup for the DE-EN OS-PBMTsystem was used for the EN-DE task.
DFKI-NMT Neural system from DFKI. The MT engine is based on the encoder-decoderneural architecture with attention. The model was trained on the respective parallelWMT’16 data.
ED-NMT Neural system from U Edinburgh. The University of Edinburgh’s English – Germanengine uses the same setup as the German–English engine.
RBMT Commercial rule-based system Lucy.
D.4.1 Results
German – English
Table 7 shows the results for the translations from German to English from the different systemson the categories. The second column in the table (“#”) contains the number of instances percategory.
First of all, it is striking how much better the neural version of the online system (O-NMT)is as compared to its previous phrase-based version (O-PBMT).
Interestingly, the O-NMT and the RBMT systems – two very different approaches – are thebest-performing systems on average, achieving almost the same amount of correct translationson average, i.e., 72% and 73%, respectively. The O-NMT system is also the most-frequent
5https://github.com/rsennrich/nematus
Page 37 of 146
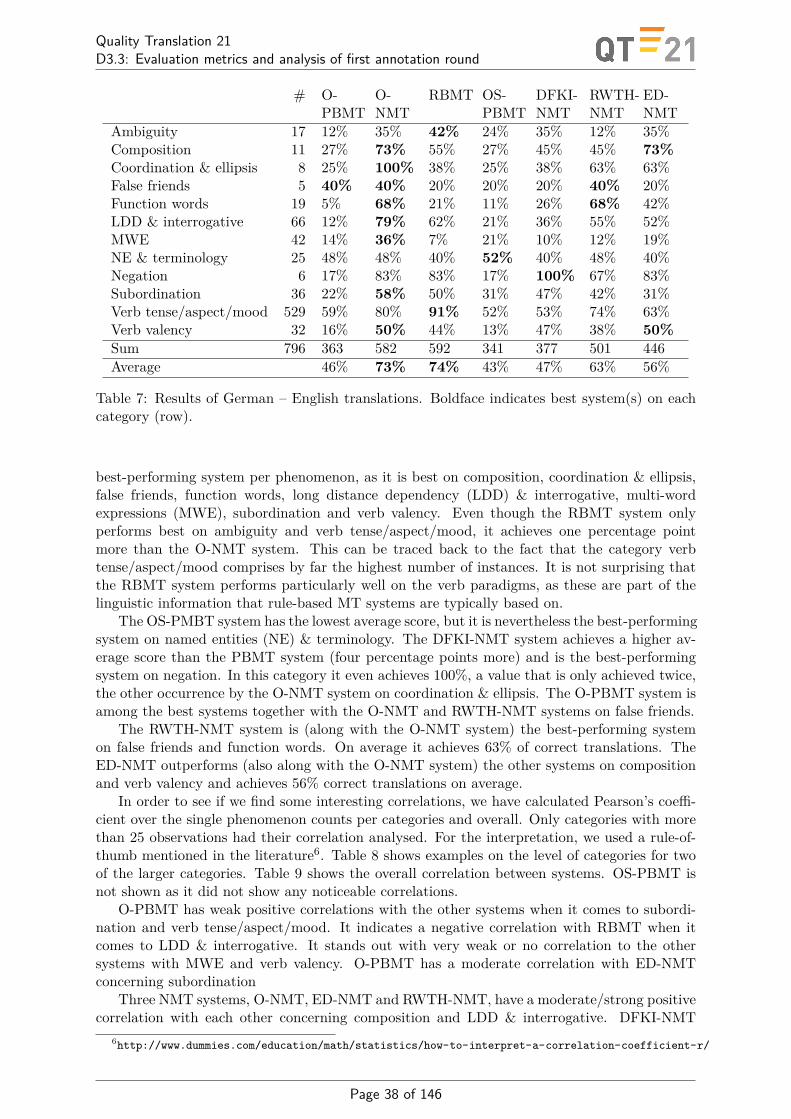
Quality Translation 21D3.3: Evaluation metrics and analysis of first annotation round
# O-PBMT
O-NMT
RBMT OS-PBMT
DFKI-NMT
RWTH-NMT
ED-NMT
Ambiguity 17 12% 35% 42% 24% 35% 12% 35%Composition 11 27% 73% 55% 27% 45% 45% 73%Coordination & ellipsis 8 25% 100% 38% 25% 38% 63% 63%False friends 5 40% 40% 20% 20% 20% 40% 20%Function words 19 5% 68% 21% 11% 26% 68% 42%LDD & interrogative 66 12% 79% 62% 21% 36% 55% 52%MWE 42 14% 36% 7% 21% 10% 12% 19%NE & terminology 25 48% 48% 40% 52% 40% 48% 40%Negation 6 17% 83% 83% 17% 100% 67% 83%Subordination 36 22% 58% 50% 31% 47% 42% 31%Verb tense/aspect/mood 529 59% 80% 91% 52% 53% 74% 63%Verb valency 32 16% 50% 44% 13% 47% 38% 50%Sum 796 363 582 592 341 377 501 446Average 46% 73% 74% 43% 47% 63% 56%
Table 7: Results of German – English translations. Boldface indicates best system(s) on eachcategory (row).
best-performing system per phenomenon, as it is best on composition, coordination & ellipsis,false friends, function words, long distance dependency (LDD) & interrogative, multi-wordexpressions (MWE), subordination and verb valency. Even though the RBMT system onlyperforms best on ambiguity and verb tense/aspect/mood, it achieves one percentage pointmore than the O-NMT system. This can be traced back to the fact that the category verbtense/aspect/mood comprises by far the highest number of instances. It is not surprising thatthe RBMT system performs particularly well on the verb paradigms, as these are part of thelinguistic information that rule-based MT systems are typically based on.
The OS-PMBT system has the lowest average score, but it is nevertheless the best-performingsystem on named entities (NE) & terminology. The DFKI-NMT system achieves a higher av-erage score than the PBMT system (four percentage points more) and is the best-performingsystem on negation. In this category it even achieves 100%, a value that is only achieved twice,the other occurrence by the O-NMT system on coordination & ellipsis. The O-PBMT system isamong the best systems together with the O-NMT and RWTH-NMT systems on false friends.
The RWTH-NMT system is (along with the O-NMT system) the best-performing systemon false friends and function words. On average it achieves 63% of correct translations. TheED-NMT outperforms (also along with the O-NMT system) the other systems on compositionand verb valency and achieves 56% correct translations on average.
In order to see if we find some interesting correlations, we have calculated Pearson’s coeffi-cient over the single phenomenon counts per categories and overall. Only categories with morethan 25 observations had their correlation analysed. For the interpretation, we used a rule-of-thumb mentioned in the literature6. Table 8 shows examples on the level of categories for twoof the larger categories. Table 9 shows the overall correlation between systems. OS-PBMT isnot shown as it did not show any noticeable correlations.
O-PBMT has weak positive correlations with the other systems when it comes to subordi-nation and verb tense/aspect/mood. It indicates a negative correlation with RBMT when itcomes to LDD & interrogative. It stands out with very weak or no correlation to the othersystems with MWE and verb valency. O-PBMT has a moderate correlation with ED-NMTconcerning subordination
Three NMT systems, O-NMT, ED-NMT and RWTH-NMT, have a moderate/strong positivecorrelation with each other concerning composition and LDD & interrogative. DFKI-NMT
6http://www.dummies.com/education/math/statistics/how-to-interpret-a-correlation-coefficient-r/
Page 38 of 146
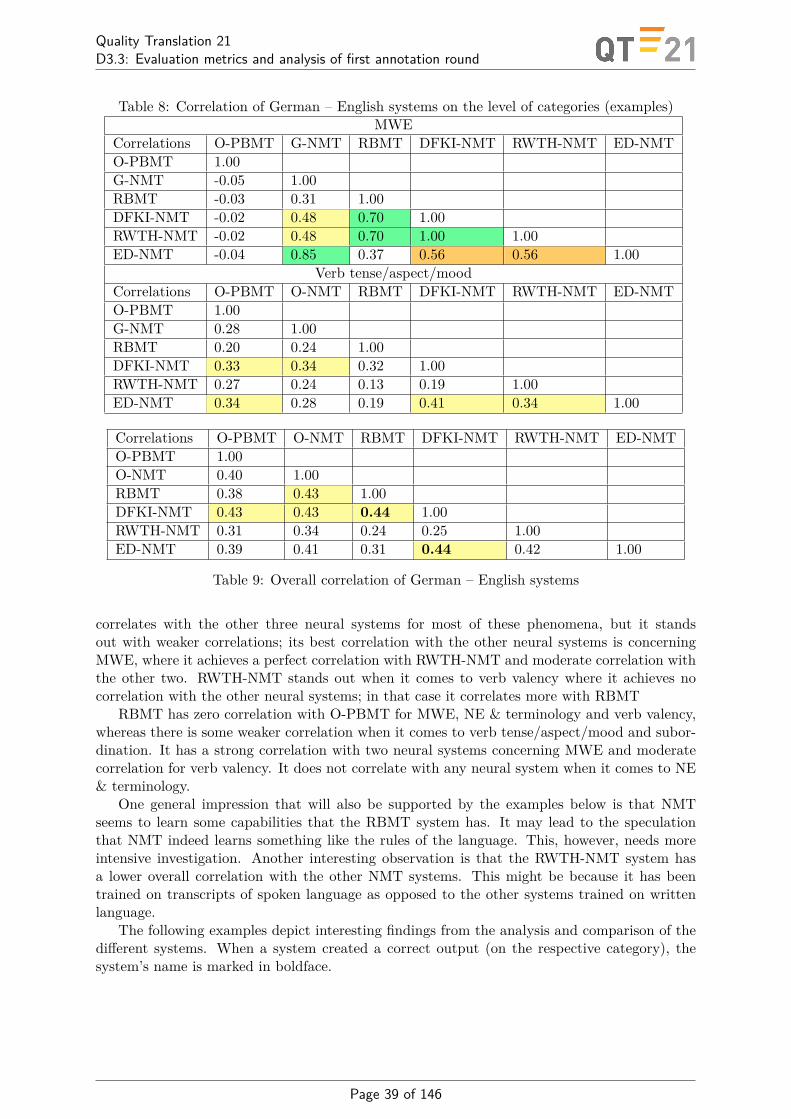
Quality Translation 21D3.3: Evaluation metrics and analysis of first annotation round
Table 8: Correlation of German – English systems on the level of categories (examples)MWE
Correlations O-PBMT G-NMT RBMT DFKI-NMT RWTH-NMT ED-NMTO-PBMT 1.00G-NMT -0.05 1.00RBMT -0.03 0.31 1.00DFKI-NMT -0.02 0.48 0.70 1.00RWTH-NMT -0.02 0.48 0.70 1.00 1.00ED-NMT -0.04 0.85 0.37 0.56 0.56 1.00
Verb tense/aspect/moodCorrelations O-PBMT O-NMT RBMT DFKI-NMT RWTH-NMT ED-NMTO-PBMT 1.00G-NMT 0.28 1.00RBMT 0.20 0.24 1.00DFKI-NMT 0.33 0.34 0.32 1.00RWTH-NMT 0.27 0.24 0.13 0.19 1.00ED-NMT 0.34 0.28 0.19 0.41 0.34 1.00
Correlations O-PBMT O-NMT RBMT DFKI-NMT RWTH-NMT ED-NMTO-PBMT 1.00O-NMT 0.40 1.00RBMT 0.38 0.43 1.00DFKI-NMT 0.43 0.43 0.44 1.00RWTH-NMT 0.31 0.34 0.24 0.25 1.00ED-NMT 0.39 0.41 0.31 0.44 0.42 1.00
Table 9: Overall correlation of German – English systems
correlates with the other three neural systems for most of these phenomena, but it standsout with weaker correlations; its best correlation with the other neural systems is concerningMWE, where it achieves a perfect correlation with RWTH-NMT and moderate correlation withthe other two. RWTH-NMT stands out when it comes to verb valency where it achieves nocorrelation with the other neural systems; in that case it correlates more with RBMT
RBMT has zero correlation with O-PBMT for MWE, NE & terminology and verb valency,whereas there is some weaker correlation when it comes to verb tense/aspect/mood and subor-dination. It has a strong correlation with two neural systems concerning MWE and moderatecorrelation for verb valency. It does not correlate with any neural system when it comes to NE& terminology.
One general impression that will also be supported by the examples below is that NMTseems to learn some capabilities that the RBMT system has. It may lead to the speculationthat NMT indeed learns something like the rules of the language. This, however, needs moreintensive investigation. Another interesting observation is that the RWTH-NMT system hasa lower overall correlation with the other NMT systems. This might be because it has beentrained on transcripts of spoken language as opposed to the other systems trained on writtenlanguage.
The following examples depict interesting findings from the analysis and comparison of thedifferent systems. When a system created a correct output (on the respective category), thesystem’s name is marked in boldface.
Page 39 of 146
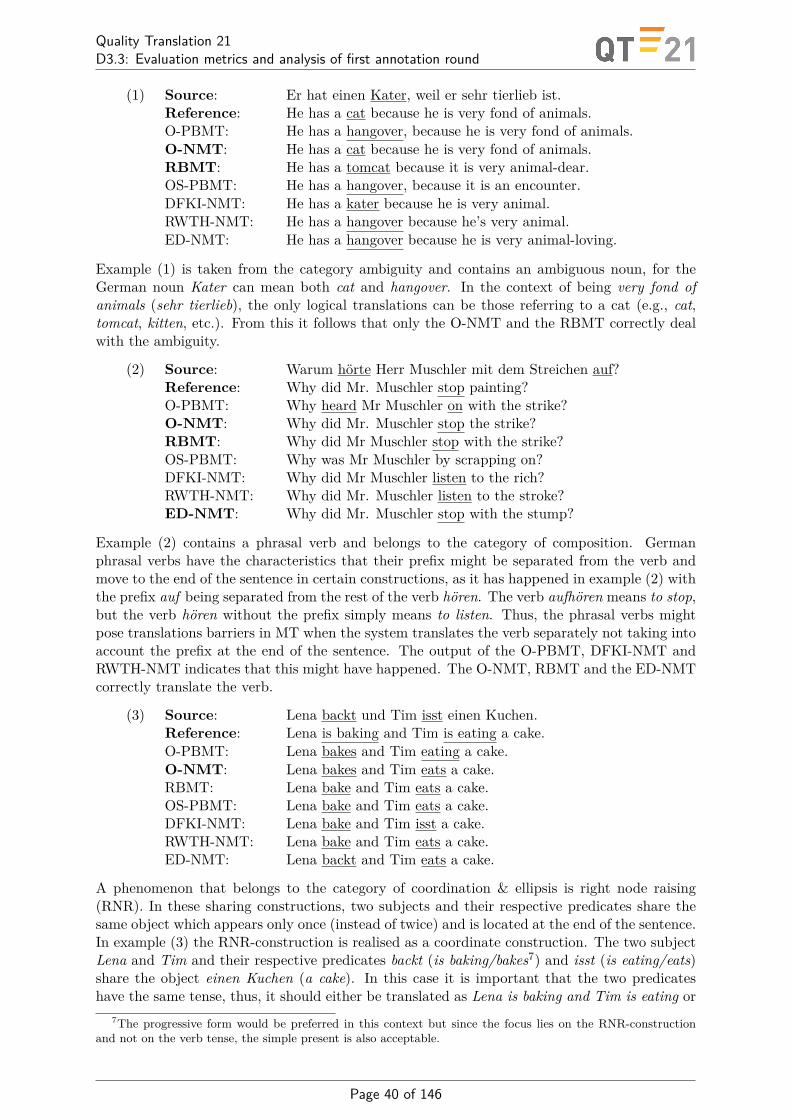
Quality Translation 21D3.3: Evaluation metrics and analysis of first annotation round
(1) Source: Er hat einen Kater, weil er sehr tierlieb ist.Reference: He has a cat because he is very fond of animals.O-PBMT: He has a hangover, because he is very fond of animals.O-NMT: He has a cat because he is very fond of animals.RBMT: He has a tomcat because it is very animal-dear.OS-PBMT: He has a hangover, because it is an encounter.DFKI-NMT: He has a kater because he is very animal.RWTH-NMT: He has a hangover because he’s very animal.ED-NMT: He has a hangover because he is very animal-loving.
Example (1) is taken from the category ambiguity and contains an ambiguous noun, for theGerman noun Kater can mean both cat and hangover. In the context of being very fond ofanimals (sehr tierlieb), the only logical translations can be those referring to a cat (e.g., cat,tomcat, kitten, etc.). From this it follows that only the O-NMT and the RBMT correctly dealwith the ambiguity.
(2) Source: Warum hörte Herr Muschler mit dem Streichen auf?Reference: Why did Mr. Muschler stop painting?O-PBMT: Why heard Mr Muschler on with the strike?O-NMT: Why did Mr. Muschler stop the strike?RBMT: Why did Mr Muschler stop with the strike?OS-PBMT: Why was Mr Muschler by scrapping on?DFKI-NMT: Why did Mr Muschler listen to the rich?RWTH-NMT: Why did Mr. Muschler listen to the stroke?ED-NMT: Why did Mr. Muschler stop with the stump?
Example (2) contains a phrasal verb and belongs to the category of composition. Germanphrasal verbs have the characteristics that their prefix might be separated from the verb andmove to the end of the sentence in certain constructions, as it has happened in example (2) withthe prefix auf being separated from the rest of the verb hören. The verb aufhören means to stop,but the verb hören without the prefix simply means to listen. Thus, the phrasal verbs mightpose translations barriers in MT when the system translates the verb separately not taking intoaccount the prefix at the end of the sentence. The output of the O-PBMT, DFKI-NMT andRWTH-NMT indicates that this might have happened. The O-NMT, RBMT and the ED-NMTcorrectly translate the verb.
(3) Source: Lena backt und Tim isst einen Kuchen.Reference: Lena is baking and Tim is eating a cake.O-PBMT: Lena bakes and Tim eating a cake.O-NMT: Lena bakes and Tim eats a cake.RBMT: Lena bake and Tim eats a cake.OS-PBMT: Lena bake and Tim eats a cake.DFKI-NMT: Lena bake and Tim isst a cake.RWTH-NMT: Lena bake and Tim eats a cake.ED-NMT: Lena backt and Tim eats a cake.
A phenomenon that belongs to the category of coordination & ellipsis is right node raising(RNR). In these sharing constructions, two subjects and their respective predicates share thesame object which appears only once (instead of twice) and is located at the end of the sentence.In example (3) the RNR-construction is realised as a coordinate construction. The two subjectLena and Tim and their respective predicates backt (is baking/bakes7) and isst (is eating/eats)share the object einen Kuchen (a cake). In this case it is important that the two predicateshave the same tense, thus, it should either be translated as Lena is baking and Tim is eating or
7The progressive form would be preferred in this context but since the focus lies on the RNR-constructionand not on the verb tense, the simple present is also acceptable.
Page 40 of 146

Quality Translation 21D3.3: Evaluation metrics and analysis of first annotation round
Lena bakes and Tim eats. As can be seen, only one system – the O-NMT – correctly translatesthis sentence. The other systems either mix the tenses, mistranslate the tenses or even leaveone of the predicates untranslated. An additional difficulty in this sentence might have beenthe fact that the 3rd person singular of the German verb backen can either be bäckt or backt.This circumstance might have been the reason why the ED-NMT leaves the first predicateuntranslated.
(4) Source: Er las gerne Novellen.Reference: He liked to read novelettes.O-PBMT: He liked to read novels.O-NMT: He liked to read novels.RBMT: He read novelettes gladly.OS-PBMT: he read like novels.DFKI-NMT: He would like to read Novelle.RWTH-NMT: He likes to read novels.ED-NMT: He likes to read Nov. 5.
The sentence in example (4) contains a false friend, namely the German noun Novelle whichcan be translated as novella, novelette or short story but not as novel (which would be Romanin German). While humans are prone to making this error, one would not expect systems to doso in the first place. Still, when searching for examples for the test suite we have encounteredmany of these errors in corpora. So, it is clear that systems learn these mistakes during training.The only system that correctly translates this false friend is the RBMT (which has the correcttranslation in its lexicon), most of the other system mistranslate it as novels. The DFKI-NMTleaves the word untranslated while the ED-NMT translates it as Nov. 5.
(5) Source: Kommst du denn?Reference: Are you coming?O-PBMT: You coming?O-NMT: Are you coming?RBMT: Do you come?OS-PBMT: If you arrive?DFKI-NMT: Do you not?RWTH-NMT: Are you coming?ED-NMT: Are you coming?
In the older version of the test suite that we used for this first experiments, most of the sen-tences with functions words were sentences that contained a modal particle. Modal particlesare used only in spoken language, e.g., to indicate that the speaker assumes that s/he refers toan information of the listener’s common knowledge or to express the speakers attitude. Modalparticles exist in German but not in English which makes them hard to translate, as the trans-lation highly depends on the context.The modal particle denn in example (5) emphasizes thespeaker’s interest in the question (if the listener is coming). The simplest translation of the sen-tence into English is done by leaving out the modal particle, as is the case in the reference andalso in some of the MT systems. The translation by the O-PMT was also counted as correct,as You coming? is colloquial and can only be used in spoken language, just like the Germansentence.
Page 41 of 146
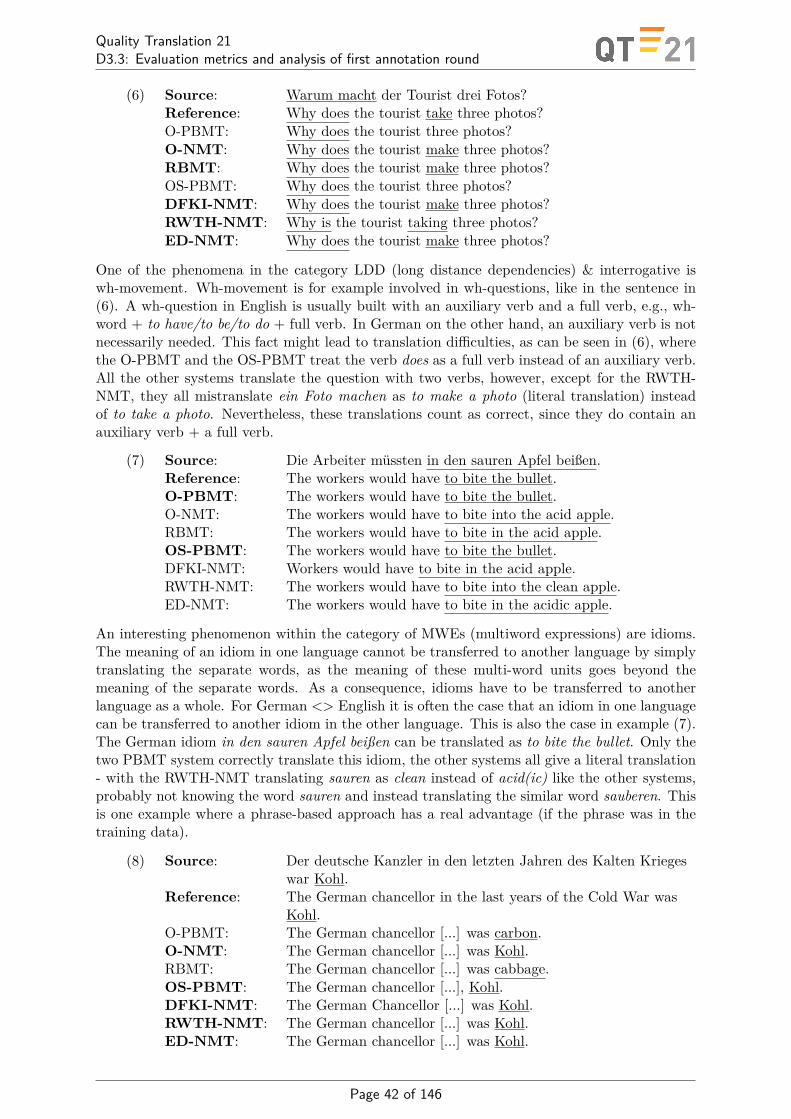
Quality Translation 21D3.3: Evaluation metrics and analysis of first annotation round
(6) Source: Warum macht der Tourist drei Fotos?Reference: Why does the tourist take three photos?O-PBMT: Why does the tourist three photos?O-NMT: Why does the tourist make three photos?RBMT: Why does the tourist make three photos?OS-PBMT: Why does the tourist three photos?DFKI-NMT: Why does the tourist make three photos?RWTH-NMT: Why is the tourist taking three photos?ED-NMT: Why does the tourist make three photos?
One of the phenomena in the category LDD (long distance dependencies) & interrogative iswh-movement. Wh-movement is for example involved in wh-questions, like in the sentence in(6). A wh-question in English is usually built with an auxiliary verb and a full verb, e.g., wh-word + to have/to be/to do + full verb. In German on the other hand, an auxiliary verb is notnecessarily needed. This fact might lead to translation difficulties, as can be seen in (6), wherethe O-PBMT and the OS-PBMT treat the verb does as a full verb instead of an auxiliary verb.All the other systems translate the question with two verbs, however, except for the RWTH-NMT, they all mistranslate ein Foto machen as to make a photo (literal translation) insteadof to take a photo. Nevertheless, these translations count as correct, since they do contain anauxiliary verb + a full verb.
(7) Source: Die Arbeiter müssten in den sauren Apfel beißen.Reference: The workers would have to bite the bullet.O-PBMT: The workers would have to bite the bullet.O-NMT: The workers would have to bite into the acid apple.RBMT: The workers would have to bite in the acid apple.OS-PBMT: The workers would have to bite the bullet.DFKI-NMT: Workers would have to bite in the acid apple.RWTH-NMT: The workers would have to bite into the clean apple.ED-NMT: The workers would have to bite in the acidic apple.
An interesting phenomenon within the category of MWEs (multiword expressions) are idioms.The meaning of an idiom in one language cannot be transferred to another language by simplytranslating the separate words, as the meaning of these multi-word units goes beyond themeaning of the separate words. As a consequence, idioms have to be transferred to anotherlanguage as a whole. For German <> English it is often the case that an idiom in one languagecan be transferred to another idiom in the other language. This is also the case in example (7).The German idiom in den sauren Apfel beißen can be translated as to bite the bullet. Only thetwo PBMT system correctly translate this idiom, the other systems all give a literal translation- with the RWTH-NMT translating sauren as clean instead of acid(ic) like the other systems,probably not knowing the word sauren and instead translating the similar word sauberen. Thisis one example where a phrase-based approach has a real advantage (if the phrase was in thetraining data).
(8) Source: Der deutsche Kanzler in den letzten Jahren des Kalten Kriegeswar Kohl.
Reference: The German chancellor in the last years of the Cold War wasKohl.
O-PBMT: The German chancellor [...] was carbon.O-NMT: The German chancellor [...] was Kohl.RBMT: The German chancellor [...] was cabbage.OS-PBMT: The German chancellor [...], Kohl.DFKI-NMT: The German Chancellor [...] was Kohl.RWTH-NMT: The German chancellor [...] was Kohl.ED-NMT: The German chancellor [...] was Kohl.
Page 42 of 146
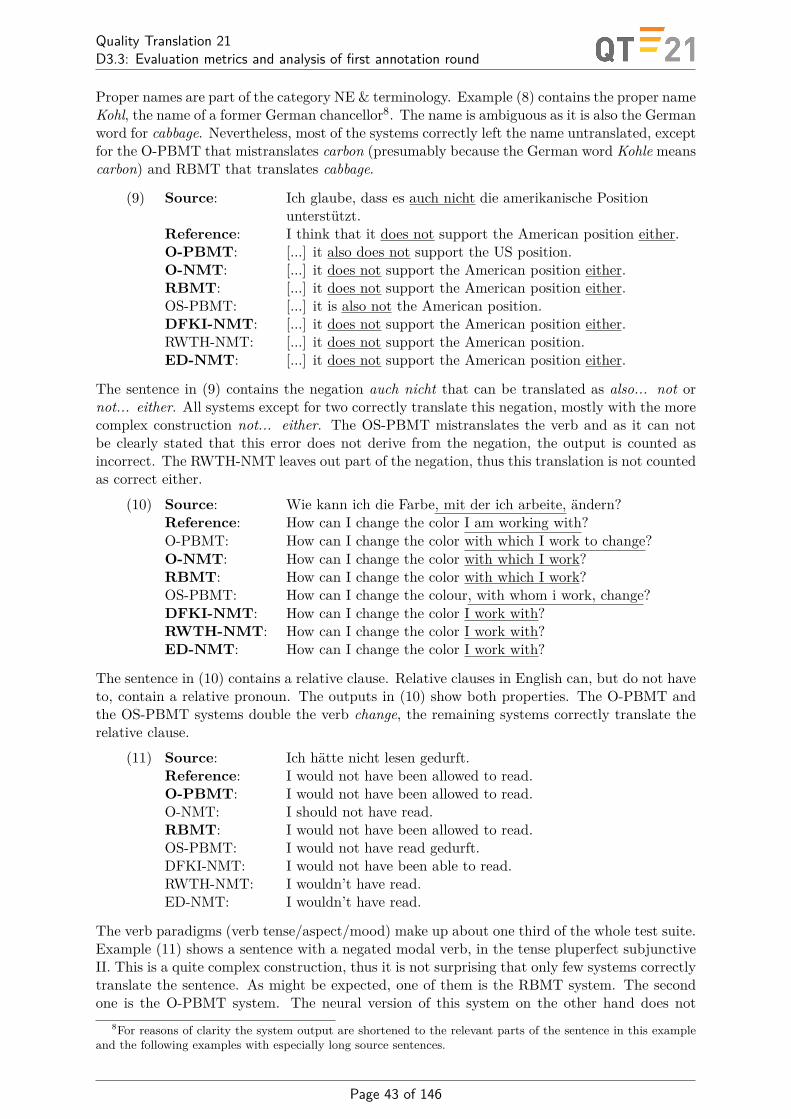
Quality Translation 21D3.3: Evaluation metrics and analysis of first annotation round
Proper names are part of the category NE & terminology. Example (8) contains the proper nameKohl, the name of a former German chancellor8. The name is ambiguous as it is also the Germanword for cabbage. Nevertheless, most of the systems correctly left the name untranslated, exceptfor the O-PBMT that mistranslates carbon (presumably because the German word Kohle meanscarbon) and RBMT that translates cabbage.
(9) Source: Ich glaube, dass es auch nicht die amerikanische Positionunterstützt.
Reference: I think that it does not support the American position either.O-PBMT: [...] it also does not support the US position.O-NMT: [...] it does not support the American position either.RBMT: [...] it does not support the American position either.OS-PBMT: [...] it is also not the American position.DFKI-NMT: [...] it does not support the American position either.RWTH-NMT: [...] it does not support the American position.ED-NMT: [...] it does not support the American position either.
The sentence in (9) contains the negation auch nicht that can be translated as also... not ornot... either. All systems except for two correctly translate this negation, mostly with the morecomplex construction not... either. The OS-PBMT mistranslates the verb and as it can notbe clearly stated that this error does not derive from the negation, the output is counted asincorrect. The RWTH-NMT leaves out part of the negation, thus this translation is not countedas correct either.
(10) Source: Wie kann ich die Farbe, mit der ich arbeite, ändern?Reference: How can I change the color I am working with?O-PBMT: How can I change the color with which I work to change?O-NMT: How can I change the color with which I work?RBMT: How can I change the color with which I work?OS-PBMT: How can I change the colour, with whom i work, change?DFKI-NMT: How can I change the color I work with?RWTH-NMT: How can I change the color I work with?ED-NMT: How can I change the color I work with?
The sentence in (10) contains a relative clause. Relative clauses in English can, but do not haveto, contain a relative pronoun. The outputs in (10) show both properties. The O-PBMT andthe OS-PBMT systems double the verb change, the remaining systems correctly translate therelative clause.
(11) Source: Ich hätte nicht lesen gedurft.Reference: I would not have been allowed to read.O-PBMT: I would not have been allowed to read.O-NMT: I should not have read.RBMT: I would not have been allowed to read.OS-PBMT: I would not have read gedurft.DFKI-NMT: I would not have been able to read.RWTH-NMT: I wouldn’t have read.ED-NMT: I wouldn’t have read.
The verb paradigms (verb tense/aspect/mood) make up about one third of the whole test suite.Example (11) shows a sentence with a negated modal verb, in the tense pluperfect subjunctiveII. This is a quite complex construction, thus it is not surprising that only few systems correctlytranslate the sentence. As might be expected, one of them is the RBMT system. The secondone is the O-PBMT system. The neural version of this system on the other hand does not
8For reasons of clarity the system output are shortened to the relevant parts of the sentence in this exampleand the following examples with especially long source sentences.
Page 43 of 146
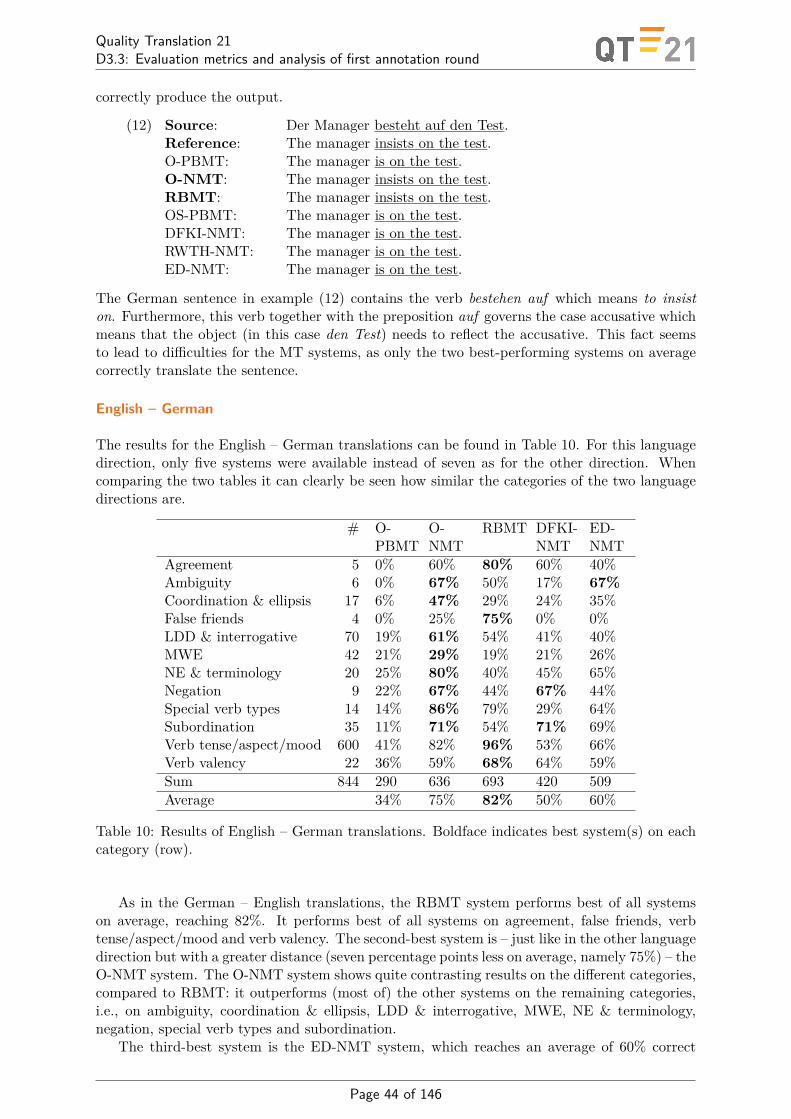
Quality Translation 21D3.3: Evaluation metrics and analysis of first annotation round
correctly produce the output.
(12) Source: Der Manager besteht auf den Test.Reference: The manager insists on the test.O-PBMT: The manager is on the test.O-NMT: The manager insists on the test.RBMT: The manager insists on the test.OS-PBMT: The manager is on the test.DFKI-NMT: The manager is on the test.RWTH-NMT: The manager is on the test.ED-NMT: The manager is on the test.
The German sentence in example (12) contains the verb bestehen auf which means to insiston. Furthermore, this verb together with the preposition auf governs the case accusative whichmeans that the object (in this case den Test) needs to reflect the accusative. This fact seemsto lead to difficulties for the MT systems, as only the two best-performing systems on averagecorrectly translate the sentence.
English – German
The results for the English – German translations can be found in Table 10. For this languagedirection, only five systems were available instead of seven as for the other direction. Whencomparing the two tables it can clearly be seen how similar the categories of the two languagedirections are.
# O-PBMT
O-NMT
RBMT DFKI-NMT
ED-NMT
Agreement 5 0% 60% 80% 60% 40%Ambiguity 6 0% 67% 50% 17% 67%Coordination & ellipsis 17 6% 47% 29% 24% 35%False friends 4 0% 25% 75% 0% 0%LDD & interrogative 70 19% 61% 54% 41% 40%MWE 42 21% 29% 19% 21% 26%NE & terminology 20 25% 80% 40% 45% 65%Negation 9 22% 67% 44% 67% 44%Special verb types 14 14% 86% 79% 29% 64%Subordination 35 11% 71% 54% 71% 69%Verb tense/aspect/mood 600 41% 82% 96% 53% 66%Verb valency 22 36% 59% 68% 64% 59%Sum 844 290 636 693 420 509Average 34% 75% 82% 50% 60%
Table 10: Results of English – German translations. Boldface indicates best system(s) on eachcategory (row).
As in the German – English translations, the RBMT system performs best of all systemson average, reaching 82%. It performs best of all systems on agreement, false friends, verbtense/aspect/mood and verb valency. The second-best system is – just like in the other languagedirection but with a greater distance (seven percentage points less on average, namely 75%) – theO-NMT system. The O-NMT system shows quite contrasting results on the different categories,compared to RBMT: it outperforms (most of) the other systems on the remaining categories,i.e., on ambiguity, coordination & ellipsis, LDD & interrogative, MWE, NE & terminology,negation, special verb types and subordination.
The third-best system is the ED-NMT system, which reaches an average of 60% correct
Page 44 of 146

Quality Translation 21D3.3: Evaluation metrics and analysis of first annotation round
translations. It is the best-performing system on ambiguity along with O-NMT. The otherremaining NMT system, namely the DFKI-NMT system, scores ten percentage points less onaverage than the ED-NMT system, scoring 50%. But it outperforms the other systems onnegation and subordination along with O-NMT.
The system with the lowest average score is the previous version of the O-NMT system,namely O-PBMT. With 34% on average, it reaches only about half of the score of the O-NMTsystem.
MWECorrelations O-PBMT O-NMT RBMT DFKI-NMT ED-NMTO-PBMT 1.00O-NMT 0.79 1.00RBMT 0.48 0.38 1.00DFKI-NMT 0.88 0.90 0.42 1.00ED-NMT 0.67 0.67 0.32 0.57 1.00
Verb tense/aspect/moodCorrelations O-PBMT O-NMT RBMT DFKI-NMT ED-NMTO-PBMT 1.00O-NMT 0.31 1.00RBMT 0.34 0.53 1.00DFKI-NMT 0.22 0.20 0.30 1.00ED-NMT 0.23 0.25 0.40 0.55 1.00
Table 11: Correlation of English – German systems on the level of categories (examples)
Correlations G-SMT G-NMT RBMT DFKI-NMT Ed-NMTG-SMT 1.00G-NMT 0.34 1.00RBMT 0.39 0.55 1.00DFKI-NMT 0.28 0.29 0.36 1.00Ed-NMT 0.30 0.33 0.43 0.55 1.00
Table 12: Overall correlation of English – German systems
For this direction, we have also calculated Pearson’s correlations. Table 11 shows exampleson the level of categories for two of the larger categories. Table 12 shows the overall correlationbetween systems. OS-PBMT is again not shown as it did not show any noticeable correlations.
In the overall correlation, RBMT has a moderate correlation with O-NMT, whereas twoneural systems, DFKI-NMT and ED-NMT, also have moderate correlations. All the othersystems have weak correlation with each other.
O-PBMT has strong correlation with all neural systems concerning MWE and very lowcorrelation with most systems concerning LDD & interrogative.
Concerning MWE, most systems correlate with each other with a moderate to strong cor-relation, apart from RBMT which stands out with a weak correlation with all the systems.O-PBMT has generally the same levels of correlation with most systems, with the exception ofthe category of subordination, where it has no correlation with particularly RBMT.
In the following, we will discuss some examples.
Page 45 of 146
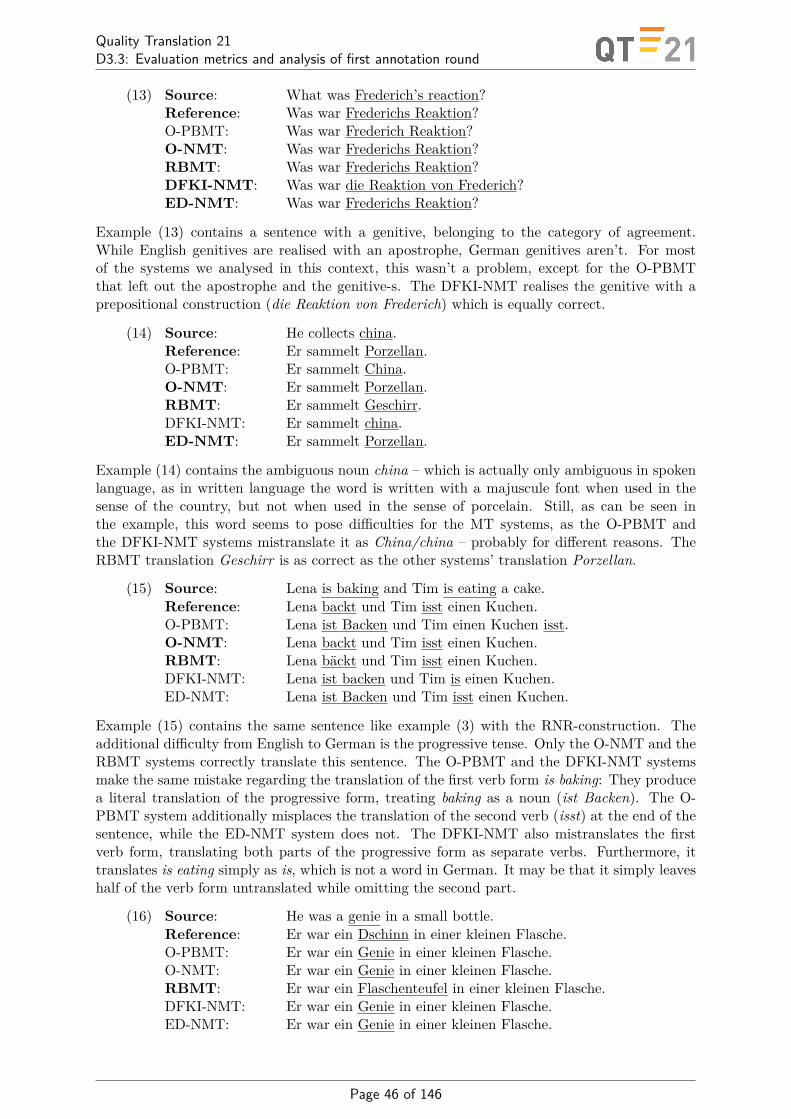
Quality Translation 21D3.3: Evaluation metrics and analysis of first annotation round
(13) Source: What was Frederich’s reaction?Reference: Was war Frederichs Reaktion?O-PBMT: Was war Frederich Reaktion?O-NMT: Was war Frederichs Reaktion?RBMT: Was war Frederichs Reaktion?DFKI-NMT: Was war die Reaktion von Frederich?ED-NMT: Was war Frederichs Reaktion?
Example (13) contains a sentence with a genitive, belonging to the category of agreement.While English genitives are realised with an apostrophe, German genitives aren’t. For mostof the systems we analysed in this context, this wasn’t a problem, except for the O-PBMTthat left out the apostrophe and the genitive-s. The DFKI-NMT realises the genitive with aprepositional construction (die Reaktion von Frederich) which is equally correct.
(14) Source: He collects china.Reference: Er sammelt Porzellan.O-PBMT: Er sammelt China.O-NMT: Er sammelt Porzellan.RBMT: Er sammelt Geschirr.DFKI-NMT: Er sammelt china.ED-NMT: Er sammelt Porzellan.
Example (14) contains the ambiguous noun china – which is actually only ambiguous in spokenlanguage, as in written language the word is written with a majuscule font when used in thesense of the country, but not when used in the sense of porcelain. Still, as can be seen inthe example, this word seems to pose difficulties for the MT systems, as the O-PBMT andthe DFKI-NMT systems mistranslate it as China/china – probably for different reasons. TheRBMT translation Geschirr is as correct as the other systems’ translation Porzellan.
(15) Source: Lena is baking and Tim is eating a cake.Reference: Lena backt und Tim isst einen Kuchen.O-PBMT: Lena ist Backen und Tim einen Kuchen isst.O-NMT: Lena backt und Tim isst einen Kuchen.RBMT: Lena bäckt und Tim isst einen Kuchen.DFKI-NMT: Lena ist backen und Tim is einen Kuchen.ED-NMT: Lena ist Backen und Tim isst einen Kuchen.
Example (15) contains the same sentence like example (3) with the RNR-construction. Theadditional difficulty from English to German is the progressive tense. Only the O-NMT and theRBMT systems correctly translate this sentence. The O-PBMT and the DFKI-NMT systemsmake the same mistake regarding the translation of the first verb form is baking: They producea literal translation of the progressive form, treating baking as a noun (ist Backen). The O-PBMT system additionally misplaces the translation of the second verb (isst) at the end of thesentence, while the ED-NMT system does not. The DFKI-NMT also mistranslates the firstverb form, translating both parts of the progressive form as separate verbs. Furthermore, ittranslates is eating simply as is, which is not a word in German. It may be that it simply leaveshalf of the verb form untranslated while omitting the second part.
(16) Source: He was a genie in a small bottle.Reference: Er war ein Dschinn in einer kleinen Flasche.O-PBMT: Er war ein Genie in einer kleinen Flasche.O-NMT: Er war ein Genie in einer kleinen Flasche.RBMT: Er war ein Flaschenteufel in einer kleinen Flasche.DFKI-NMT: Er war ein Genie in einer kleinen Flasche.ED-NMT: Er war ein Genie in einer kleinen Flasche.
Page 46 of 146

Quality Translation 21D3.3: Evaluation metrics and analysis of first annotation round
Example (16) contains the false friend genie: A genie can be translated as Dschinn or Flaschengeist.The German word Genie on the other hand translates into English as genius. Except for theRBMT, all systems generate the same erroneous output, translating genie as Genie. The RBMTtranslates the false friend as Flaschenteufel which is a very uncommon translation but never-theless correct.
(17) Source: Harry’s teacher told him to never look back.Reference: Harrys Lehrer sagte ihm, er solle nie zurückblicken.O-PBMT: Harrys Lehrer sagte ihm, nie wieder zu sehen.O-NMT: Harrys Lehrer sagte ihm, niemals zurückzublicken.RBMT: Harrys Lehrer sagte ihm, niemals zurückzublicken.DFKI-NMT: Harry’s Lehrer erzählte ihm, nie zurückzuschauen.ED-NMT: Harrys Lehrerin sagte ihm, nie zurückzublicken
The sentence in example (17) contains a split infinitive, belonging to the category of LDD &interrogative. In a split infinitive, one or more words are standing between the to and thebare infinitive, in this case look back. Since infinitives in German consist of a single word, thisconstruction does not exist in German which makes it difficult to translate. The constructioncan often be translated with an infinitive clause. The MT systems at hand all translated thesplit infinitive with an infinitive clause, which is ungrammatical in this context.
(18) Source: After dinner, he took a walk.Reference: Nach dem Abendessen machte er einen Spaziergang.O-PBMT: Nach dem Abendessen nahm er einen Spaziergang.O-NMT: Nach dem Abendessen machte er einen Spaziergang.RBMT: Nach Abendessen machte er einen Gang.DFKI-NMT: Nach dem Abendessen machte er einen Spaziergang.ED-NMT: Nach dem Abendessen nahm er einen Spaziergang.
For the category of MWEs, example (18) contains a sentence with a verbal MWE, in this casea light-verb construction (LCV). LCVs consist of a “light verb” (in English e.g., to have, tomake, to do, to take) and a noun, with the verb adding little to the overall meaning, comparedto the noun [41]. The LCV to take a walk in the given example needs to be translated intoGerman as einen Spaziergang machen, thus, while the verb in English is to take (German:nehmen), the German verb in this construction needs to be machen (English: to do/make).Two of the systems (O-PBMT and ED-NMT) give a literal translation with nahm (preteriteof nehmen). Two systems (O-NMT and DFKI-NMT) give a correct output and one system(RBMT) translates the verb correctly, but mistranslates the noun, leaving out one constituentof the compound Spaziergang.
(19) Source: How do I alter the page orientation?Reference: Wie kann ich die Seitenausrichtung ändern?O-PBMT: Wie verändere ich die Seitenausrichtung?O-NMT: Wie ändere ich die Seitenausrichtung?RBMT: Wie verändere ich die Seitenorientierung?DFKI-NMT: Wie ändere ich die Seitenorientierung?ED-NMT: Wie ändere ich die Seitenausrichtung?
For the category NE & terminology, we have extracted a term from the technical domain, namelypage orientation. It needs to be translated as Seitenausrichtung not as the literal translationSeitenorientierung. Two of the systems (RBMT and DFKI-NMT) give the literal translation,the other systems correctly translate the term. The sentence in (19) is taken from a technicalcorpus that was constructed within the QTLeap project. Detailed information on the analysisof technical data will follow in Section D.5.
Page 47 of 146

Quality Translation 21D3.3: Evaluation metrics and analysis of first annotation round
(20) Source: No, he’s not a rat.Reference: Nein, er ist keine Ratte.O-PBMT: Nein, er ist nicht eine Ratte.O-NMT: Nein, er ist keine Ratte.RBMT: Nein ist er eine Ratte.DFKI-NMT: Nein, er ist kein Rrat.ED-NMT: Nein, er ist keine Ratte.
Example (20) contains a negation. The correct translation of he’s not a rat would be er ist keineRatte and not er ist nicht eine Ratte which is the literal but incorrect translation. O-PBMTproduces the literal translation and RBMT does not produce the negation at all. The othersystems correctly translate the negation, even though the declension of the negation particleand the translation of rat by the DFKI-NMT are incorrect, but as usual these facts are ignoredas the focus lies only on the negation itself.
(21) Source: I offered to carry her suitcase for her.Reference: Ich bot an ihren Koffer für sie zu tragen.O-PBMT: Ich bot ihr Koffer für sie tragen.O-NMT: Ich bot an, ihren Koffer für sie zu tragen.RBMT: Ich bot an, ihren Koffer für sie zu tragen.DFKI-NMT: Ich bot, ihren Koffer für sie zu tragen.ED-NMT: Ich habe angeboten, ihre Koffer für sie zu tragen.
Example (21) contains a catenative verb that belongs to the special verb types. Catenativeverbs can be followed by another verb in the same sentence. In the case of example (21),the catenative verb to offer is followed by the verb to carry in the infinitive form. In theGerman translation both verbs have to be present as well and the second verb also has to bein an infinitive construction. The O-PBMT system leaves out the prefix of the first verb andadditionally the zu that marks the infinitive construction of the second verb. The DFKI-NMTsystem leaves out the prefix of the first verb as well. The other systems correctly translate thecatenative verb.
(22) Source: The children playing in the garden enjoy the sun.Reference: Die Kinder, die im Garten spielen, genießen die Sonne.O-PBMT: Die Kinder spielen im Garten genießen Sie die Sonne.O-NMT: Die Kinder, die im Garten spielen, genießen die Sonne.RBMT: Die im Garten spielenden Kinder genießen die Sonne.DFKI-NMT: Die Kinder spielen im Garten die Sonne.ED-NMT: Die Kinder, die im Garten spielen, genießen die Sonne.
The category of subordination is represented by a sentence that contains a contact clause. Acontact clause is a shortened relative clause that does not exhibit a relative pronoun. In example(22) the contact clause is playing in the garden, the full version of the relative clause would bethat are playing in the garden. As this type of shortened relative clause does not exist in German,it might pose difficulties for the MT system. A correct translation can either be realised in afull relative clause (including the obligatory commas before and after the relative clause) or inan extended adjective construction – a construction that in turn does not exist in English, as inGerman an entire phrase can be put in front of a noun in order to modify it. The RBMT systemcorrectly translates the contact clause as an extended adjective construction and the O-NMTand ED-NMT systems correctly translate it as a full relative clause. The O-PBMT system onthe other hand does not produce either of the constructions, nor does the DFKI-NMT system;the latter even leaves out the second verb.
Page 48 of 146
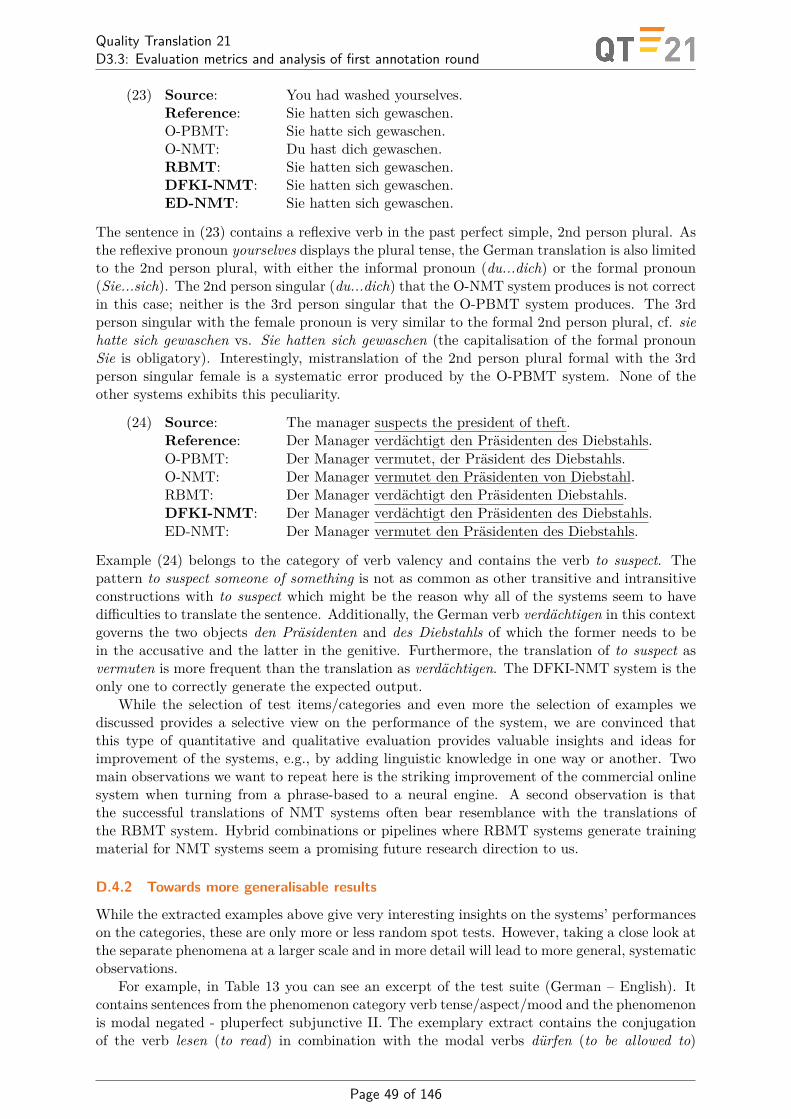
Quality Translation 21D3.3: Evaluation metrics and analysis of first annotation round
(23) Source: You had washed yourselves.Reference: Sie hatten sich gewaschen.O-PBMT: Sie hatte sich gewaschen.O-NMT: Du hast dich gewaschen.RBMT: Sie hatten sich gewaschen.DFKI-NMT: Sie hatten sich gewaschen.ED-NMT: Sie hatten sich gewaschen.
The sentence in (23) contains a reflexive verb in the past perfect simple, 2nd person plural. Asthe reflexive pronoun yourselves displays the plural tense, the German translation is also limitedto the 2nd person plural, with either the informal pronoun (du...dich) or the formal pronoun(Sie...sich). The 2nd person singular (du...dich) that the O-NMT system produces is not correctin this case; neither is the 3rd person singular that the O-PBMT system produces. The 3rdperson singular with the female pronoun is very similar to the formal 2nd person plural, cf. siehatte sich gewaschen vs. Sie hatten sich gewaschen (the capitalisation of the formal pronounSie is obligatory). Interestingly, mistranslation of the 2nd person plural formal with the 3rdperson singular female is a systematic error produced by the O-PBMT system. None of theother systems exhibits this peculiarity.
(24) Source: The manager suspects the president of theft.Reference: Der Manager verdächtigt den Präsidenten des Diebstahls.O-PBMT: Der Manager vermutet, der Präsident des Diebstahls.O-NMT: Der Manager vermutet den Präsidenten von Diebstahl.RBMT: Der Manager verdächtigt den Präsidenten Diebstahls.DFKI-NMT: Der Manager verdächtigt den Präsidenten des Diebstahls.ED-NMT: Der Manager vermutet den Präsidenten des Diebstahls.
Example (24) belongs to the category of verb valency and contains the verb to suspect. Thepattern to suspect someone of something is not as common as other transitive and intransitiveconstructions with to suspect which might be the reason why all of the systems seem to havedifficulties to translate the sentence. Additionally, the German verb verdächtigen in this contextgoverns the two objects den Präsidenten and des Diebstahls of which the former needs to bein the accusative and the latter in the genitive. Furthermore, the translation of to suspect asvermuten is more frequent than the translation as verdächtigen. The DFKI-NMT system is theonly one to correctly generate the expected output.
While the selection of test items/categories and even more the selection of examples wediscussed provides a selective view on the performance of the system, we are convinced thatthis type of quantitative and qualitative evaluation provides valuable insights and ideas forimprovement of the systems, e.g., by adding linguistic knowledge in one way or another. Twomain observations we want to repeat here is the striking improvement of the commercial onlinesystem when turning from a phrase-based to a neural engine. A second observation is thatthe successful translations of NMT systems often bear resemblance with the translations ofthe RBMT system. Hybrid combinations or pipelines where RBMT systems generate trainingmaterial for NMT systems seem a promising future research direction to us.
D.4.2 Towards more generalisable results
While the extracted examples above give very interesting insights on the systems’ performanceson the categories, these are only more or less random spot tests. However, taking a close look atthe separate phenomena at a larger scale and in more detail will lead to more general, systematicobservations.
For example, in Table 13 you can see an excerpt of the test suite (German – English). Itcontains sentences from the phenomenon category verb tense/aspect/mood and the phenomenonis modal negated - pluperfect subjunctive II. The exemplary extract contains the conjugationof the verb lesen (to read) in combination with the modal verbs dürfen (to be allowed to)
Page 49 of 146
Quality Translation 21D3.3: Evaluation metrics and analysis of first annotation round
and müssen (to have to) in the aforementioned tense. The outputs of the commercial onlinetranslation system versions are presented in the last two columns. Cells marked in green containcorrect translations, cells marked in red stand for incorrect translations. As can be seen, only4 of 12 test items are correctly translated by the O-PBMT system, while the O-NMT systemdoes not correctly translate any of the test sentences shown here. In fact, even though the lattersystem gets 80% of sentences in this tense correct, it seems to have problems with the modalverbs (negated and not negated), e.g., it only correctly translates 40% of the modal negatedpluperfect subjunctive II, and 42% of the modal non-negated pluperfect subjunctive II.
Interestingly, certain regularities in the errors can be found, i.e, the errors are sometimessystematic within one system (e.g., Du hättest nicht lesen gedurft. = You should not have read.(O-NMT); Du hättest nicht lesen gemusst. = You should not have read. (O-NMT)).
In this early version of the test suite we had 30 sentences for that particular phenomenon(i.e., 5 different verbs). Within this category there are ca. 50 different phenomena with someof them having 30 test items and others only 6, resulting in more than 500 test items in thecategory verb tense/aspect/mood. In our current version of the test suite however, we have testsentences with 6 different verbs on all the verb paradigms, resulting in almost 4500 test sentencesin the category verb tense/aspect/mood altogether. Thus, the current version more systematicand therefore also allows for more general observations and more quantitative statements infuture experiments.
Page 50 of 146
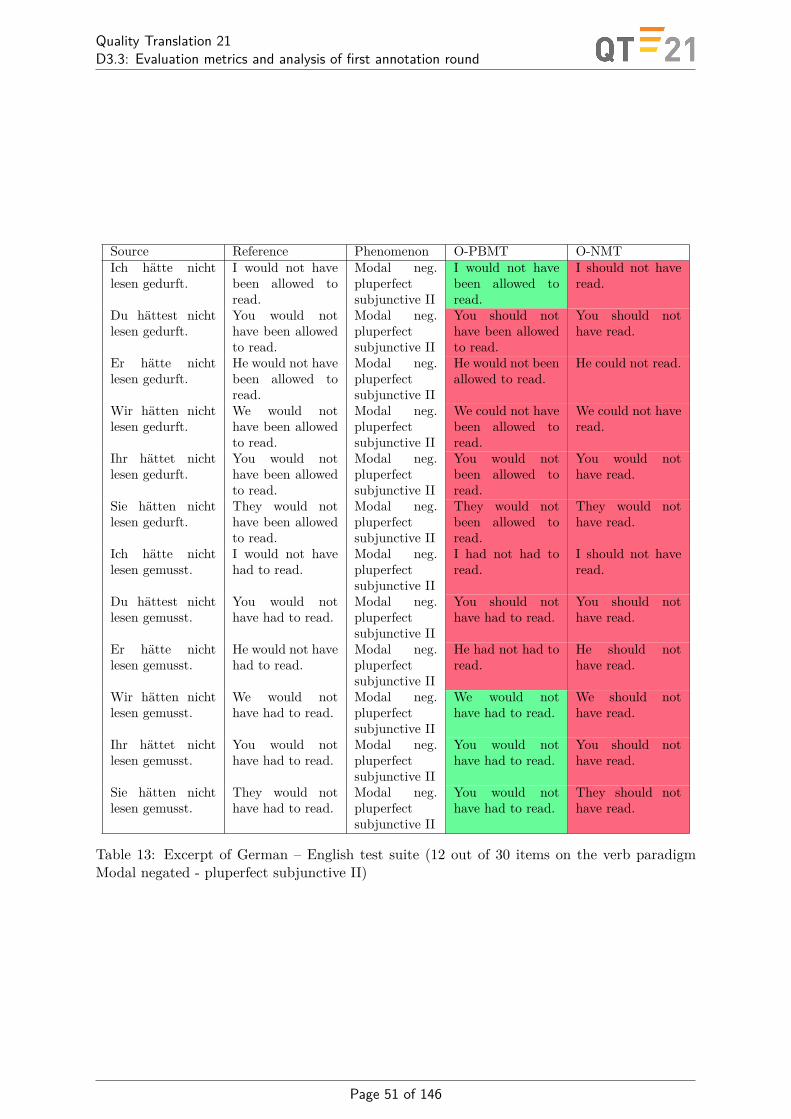
Quality Translation 21D3.3: Evaluation metrics and analysis of first annotation round
Source Reference Phenomenon O-PBMT O-NMTIch hätte nichtlesen gedurft.
I would not havebeen allowed toread.
Modal neg.pluperfectsubjunctive II
I would not havebeen allowed toread.
I should not haveread.
Du hättest nichtlesen gedurft.
You would nothave been allowedto read.
Modal neg.pluperfectsubjunctive II
You should nothave been allowedto read.
You should nothave read.
Er hätte nichtlesen gedurft.
He would not havebeen allowed toread.
Modal neg.pluperfectsubjunctive II
He would not beenallowed to read.
He could not read.
Wir hätten nichtlesen gedurft.
We would nothave been allowedto read.
Modal neg.pluperfectsubjunctive II
We could not havebeen allowed toread.
We could not haveread.
Ihr hättet nichtlesen gedurft.
You would nothave been allowedto read.
Modal neg.pluperfectsubjunctive II
You would notbeen allowed toread.
You would nothave read.
Sie hätten nichtlesen gedurft.
They would nothave been allowedto read.
Modal neg.pluperfectsubjunctive II
They would notbeen allowed toread.
They would nothave read.
Ich hätte nichtlesen gemusst.
I would not havehad to read.
Modal neg.pluperfectsubjunctive II
I had not had toread.
I should not haveread.
Du hättest nichtlesen gemusst.
You would nothave had to read.
Modal neg.pluperfectsubjunctive II
You should nothave had to read.
You should nothave read.
Er hätte nichtlesen gemusst.
He would not havehad to read.
Modal neg.pluperfectsubjunctive II
He had not had toread.
He should nothave read.
Wir hätten nichtlesen gemusst.
We would nothave had to read.
Modal neg.pluperfectsubjunctive II
We would nothave had to read.
We should nothave read.
Ihr hättet nichtlesen gemusst.
You would nothave had to read.
Modal neg.pluperfectsubjunctive II
You would nothave had to read.
You should nothave read.
Sie hätten nichtlesen gemusst.
They would nothave had to read.
Modal neg.pluperfectsubjunctive II
You would nothave had to read.
They should nothave read.
Table 13: Excerpt of German – English test suite (12 out of 30 items on the verb paradigmModal negated - pluperfect subjunctive II)
Page 51 of 146

Quality Translation 21D3.3: Evaluation metrics and analysis of first annotation round
D.5 Technical use case: Evaluating QTLeap WMT enginesInspired by the performance of the systems reported here on the test suite, in cooperation withthe QTLeap project, we have constructed a domain-specific test suite based on examples fromthe QTLeap corpus that represent interesting linguistic phenomena. We have documented therespective evaluation efforts for English – German in [42].
The manual evaluation we performed for the WMT 2016 IT task includes the five systemsdescribed in [43]: a phrase-based SMT system (PB-SMT), a rule-based system (RBMT), animproved version of the RBMT system (RBMT improved), a neural MT system, and an informedselection mechanism combining the PB-SMT, improved RBMT and neural systems (selectionmechanism). In the paper, we also detail the creation of the domain-specific test suite.
As in the case of the general test suite, an occurrence of a phenomenon is not only countedas correctly translated when it matches the reference translation but also when it is for examplerealized in a different structure that correctly translates the meaning. As we are dealing withexamples from a corpus, we often have multiple instances of the phenomenon under consider-ation in one segment. Therefore, we counted the instances per item. The following examplesdemonstrate the manual evaluation technique used here:
(1) Source: Yes, type, for example: 50 miles in km. 1 inst.Reference: Ja, geben Sie, zum Beispiel: 50 Meilen in km ein.PB-SMT: Ja, Typ, zum Beispiel, 50 Meilen in km. 0 inst.neural: Ja, Typ, beispielsweise: 50 Meilen in km. 0 inst.RBMT-imp.:
Tippen Sie zum Beispiel, ja: 50 Meilen in km. 1 inst.
In example (1), the source segment contains one imperative: type. A correct German trans-lation needs to have the right verb from + the personal pronoun Sie in this context. In mostof the cases, the imperative type is mistranslated as the German noun Typ instead of the verbtippen or eingeben, e.g., in the PB-SMT and neural output. The improved RBMT system onthe other hand correctly translates the imperative. Note that the reference translation containsthe phrasal verb eingeben and due to the imperative construction the prefix ein moves to theend of the sentence.
(2) Source: Adjustments > Notification Center > Mail. 2 inst.Reference: Anpassungen > Benachrichtigungszentrum > Post.PB-SMT: Adjustments>-Benachrichtigungszentrale > E-Mail. 1 inst.RBMT: Anpassungs->-Benachrichtigungs-Zentrums->-Post. 0 inst.RBMT-imp.:
Anpassungen > Benachrichtiungs-Zentrum > Post. 2 inst.
Example (2) depicts the analysis of the menu item separators. The source contains twoinstances. The PB-SMT output treats the words before and after the first separator as acompound, adding a hyphen after the separator. Therefore, only the second separator countsas correct. The RBMT system treats the separators similarly, adding hyphens before andbehind the separators, resulting in no correct instances. The improved RBMT version treatsall separators correctly.
D.5.1 Results on technical test suite
The phenomena that we found to be prone to translation errors in this context were imperatives,compounds, menu item separators (separated by “>”), quotation marks, verbs, phrasal verbsand terminology.
For the aforementioned seven linguistic phenomena, 657 source segments were extracted9
from the QTLeap domain corpus. In those 657 source segments, 2105 instances of the different9Despite the goal of collecting 100 segments per category, it was only possible to find 57 segments with phrasal
verbs.
Page 52 of 146

Quality Translation 21D3.3: Evaluation metrics and analysis of first annotation round
phenomena were found overall, as it was often the case that more than one instance occurredper segment.
The results appear in Table 14.
# PB-SMT RBMT RBMT neural sel.improved mech.
Imperatives 247 68% 79% 79% 74% *73%Compounds 219 55% 87% 85% 51% 70%“>” separators 148 99% 39% 83% 93% 80%Quotation marks 431 97% 94% 75% 95% 80%Verbs 505 85% 93% 93% 90% *90%Phrasal verbs 90 22% 68% 77% 38% 53%Terminology 465 64% 50% 53% 55% 54%Sum 2105Average 76% 77% 77% 75% 74%
Table 14: Translation accuracy on manually evaluated sentences focusing on particular phenom-ena. Test-sets consist of hand-picked source sentences that include the respective phenomenon.The percentage of the best system in each category is bold-faced, whereas (*) indicates thatthere is no significant difference (α = 0.05) between the selection mechanism and the bestsystem.
As can be seen in the table, the overall average performance of the components is very similarwith no statistically significant difference. The phrase-based SMT and the RBMT systems havethe highest overall average scores but interestingly their performances on the different linguisticphenomena are quite complimentary:
While the baseline PB-SMT system operates best of all systems on the menu item separa-tors (“>”), the quotation marks and terminology, the baseline RBMT system performs beston the remaining linguistic categories, namely the imperatives, compounds, verbs and phrasalverbs, as well as the quotation marks. The PB-SMT system is furthermore doing well on im-peratives and verbs but it has the lowest score of all systems regarding the phrasal verbs. TheRBMT system on the other hand also reaches a high score for the quotation marks but has thelowest scores for the menu item separators.
The improved version of the RBMT system, namely the RBMT-improved, has the sameperformance in the overall average compared to its base system. Likewise, it ranks amongthe best-performing systems in terms of imperatives, compounds, verbs and phrasal verbs.Furthermore, it significantly improved on the category it was developed for, i.e. the menu itemseparator “>”. At the same time it has visibly lower scores for the quotation marks (as a sideeffect of the improved treatment of menu items, the treatment of quotation marks is much worsethan for the RBMT baseline system).
The neural system reaches a slightly lower score than the other systems. It ranks amongthe best systems regarding the imperatives, quotation marks and verbs. Furthermore it alsoshows high scores for the menu item separators. Its score for the compounds on the other handis the lowest of all systems, close to that of the phrase-based SMT.
The selection mechanism obtains the lowest average value of all systems but this scoreis only three percentage points less than the highest average value. The selection mechanismis one of the best performing systems on imperatives and verbs. For the other phenomena itmostly reaches a score that is lower than the scores of its component systems.
D.6 Towards automationOur ultimate goal is to automate the test suite testing. In this section, we want to briefly reporton respective work in progress. During several meetings involving both linguists and computa-tional linguists, we have designed a method that is using regular expressions for automatically
Page 53 of 146
Quality Translation 21D3.3: Evaluation metrics and analysis of first annotation round
checking the output of engines on the test suite. The idea is to manually provide positive andnegative tokens for each test item:
Positive token: For those items where a particular regex would generally be considered toindicate the “correct” translation, these are included in this field. The automating testingprocess can check to see if the appropriate token(s) are present in the output. If they are,then the translation engine “passes” this particular item. To give a simple example, fora lexical ambiguity, we indicate all paraphrases of the right reading(s) of the respectiveword in the given context.
Negative token: For those items where a particular string or set of strings would generallyindicate an “incorrect” translation, these are included in this field. If the included regexis matched in the target segment, this will typically indicate that the system “fails” onthis item.
Note that the tokens shown in Table 6 are exemplary. If a system output does not matchthe positive token (pass) or the negative token (fail), it is stored in a third class (“can’t tell”)that needs to be manually inspected. In a fully automatic scenario, this would probably beinterpreted as “probable fail”, but this needs to be experimented with. The examples in thethird class can then be inspected and ideally be turned into negative or positive tokens thathave been missing before. This way, the level of automation will raise over time.
We have already started designing the regular expressions. For several cases such as verbparadigms, they are exhaustive listings of all translation variants of the complete (short) inputsentence. We will report on this and future experiments in D3.5.
In parallel to the linguistic work, we have started to design a cockpit that will help withthe testing and reporting procedure, allow to generate reports, help in testing the regularexpressions, etc. This is work has merely begun and will be reported later. Figure 5 shows ascreenshot of the prototype Test Suite Cockpit. We will detail the progress on these efforts infuture report and Deliverables.
Page 54 of 146
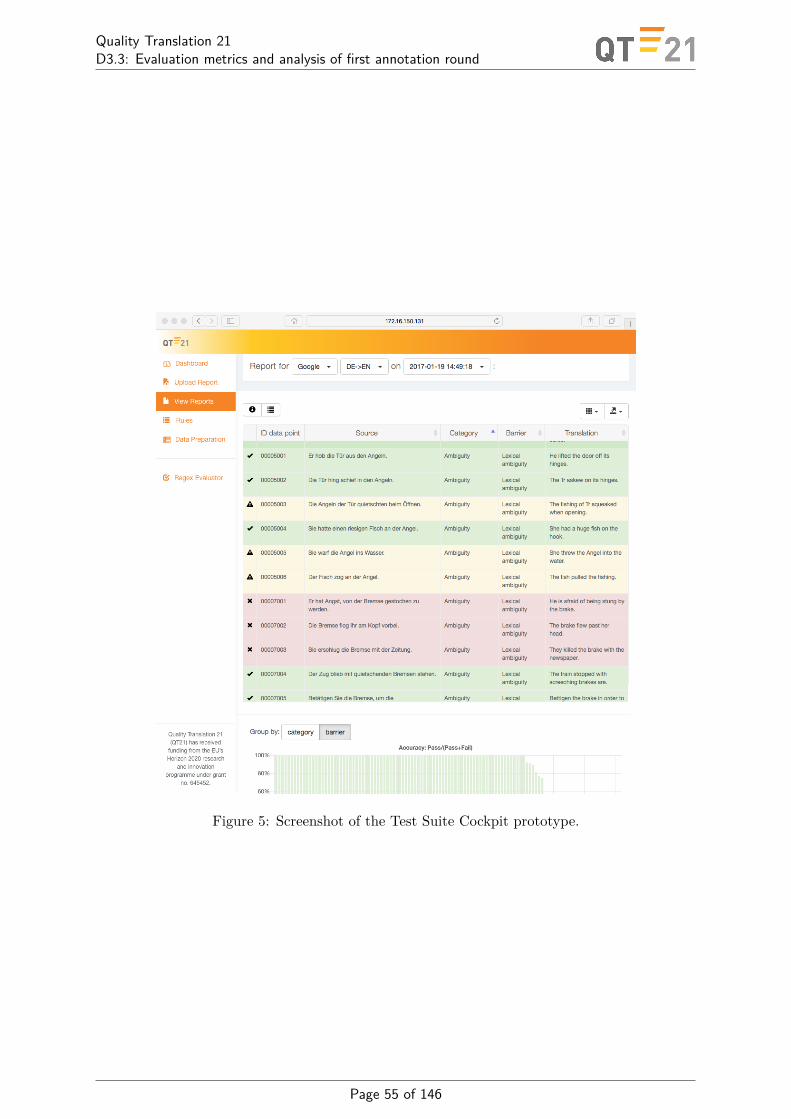
Quality Translation 21D3.3: Evaluation metrics and analysis of first annotation round
Figure 5: Screenshot of the Test Suite Cockpit prototype.
Page 55 of 146
Quality Translation 21D3.3: Evaluation metrics and analysis of first annotation round
E MT Quality Estimation for Computer-assisted Translation: Doesit Really Help?
Proceedings of the 53rd Annual Meeting of the Association for Computational Linguisticsand the 7th International Joint Conference on Natural Language Processing (Short Papers), pages 530–535,
Beijing, China, July 26-31, 2015. c©2015 Association for Computational Linguistics
MT Quality Estimation for Computer-assisted Translation:Does it Really Help?
Marco Turchi, Matteo Negri, Marcello FedericoFBK - Fondazione Bruno Kessler,
Via Sommarive 18, 38123 Trento, Italyturchi,negri,[email protected]
Abstract
The usefulness of translation quality es-timation (QE) to increase productivityin a computer-assisted translation (CAT)framework is a widely held assumption(Specia, 2011; Huang et al., 2014). So far,however, the validity of this assumptionhas not been yet demonstrated throughsound evaluations in realistic settings. Tothis aim, we report on an evaluation in-volving professional translators operatingwith a CAT tool in controlled but naturalconditions. Contrastive experiments arecarried out by measuring post-editing timedifferences when: i) translation sugges-tions are presented together with binaryquality estimates, and ii) the same sug-gestions are presented without quality in-dicators. Translators’ productivity in thetwo conditions is analysed in a principledway, accounting for the main factors (e.g.differences in translators’ behaviour, qual-ity of the suggestions) that directly impacton time measurements. While the gen-eral assumption about the usefulness ofQE is verified, significance testing resultsreveal that real productivity gains can beobserved only under specific conditions.
1 Introduction
Machine translation (MT) quality estimation aimsto automatically predict the expected time (e.g. inseconds) or effort (e.g. number of editing opera-tions) required to correct machine-translated sen-tences into publishable translations (Specia et al.,2009; Mehdad et al., 2012; Turchi et al., 2014a;C. de Souza et al., 2015). In principle, the taskhas a number of practical applications. An intu-itive one is speeding-up the work of human trans-lators operating with a CAT tool, a software de-
signed to support and facilitate the translation pro-cess by proposing suggestions that can be editedby the user. The idea is that, since the suggestionscan be useful (good, hence post-editable) or use-less (poor, hence requiring complete re-writing),reliable quality indicators could help to reduce thetime spent by the user to decide which action totake (to correct or re-translate).
So far, despite the potential practical benefits,the progress in QE research has not been followedby conclusive results that demonstrate whether theuse of quality labels can actually lead to noticeableproductivity gains in the CAT framework. To thebest of our knowledge, most prior works limit theanalysis to the intrinsic evaluation of QE perfor-mance on gold-standard data (Callison-Burch etal., 2012; Bojar et al., 2013; Bojar et al., 2014).On-field evaluation is indeed a complex task, asit requires: i) the availability of a CAT tool ca-pable to integrate MT QE functionalities, ii) pro-fessional translators used to MT post-editing, iii)a sound evaluation protocol to perform between-subject comparisons,1 and iv) robust analysis tech-niques to measure statistical significance undervariable conditions (e.g. differences in users’ post-editing behavior).
To bypass these issues, the works more closelyrelated to our investigation resort to controlled andsimplified evaluation protocols. For instance, in(Specia, 2011) the impact of QE predictions ontranslators’ productivity is analysed by measuringthe number of words that can be post-edited in afixed amount of time. The evaluation, however,only concentrates on the use of QE to rank MToutputs, and the gains in translation speed are mea-sured against the contrastive condition in which noQE-based ranking mechanism is used. In this arti-ficial scenario, the analysis disregards the relation
1Notice that the same sentence cannot be post-editedtwice (e.g. with/without quality labels) by the same translatorwithout introducing a bias in the time measurements.
530
Page 56 of 146

Quality Translation 21D3.3: Evaluation metrics and analysis of first annotation round
between the usefulness of QE and the intrinsic fea-tures of the top-ranked translations (e.g. sentencelength, quality of the MT). More recently, Huanget al. (2014) claimed a 10% productivity increasewhen translation is supported by the estimates ofan adaptive QE model. Their analysis, however,compares a condition in which MT suggestions arepresented with confidence labels (the two factorsare not decoupled) against the contrastive condi-tion in which no MT suggestion is presented at all.Significance testing, moreover, is not performed.
The remainder of this work describes ouron-field evaluation addressing (through objectivemeasurements and robust significance tests) thetwo key questions:
• Does QE really help in the CAT scenario?
• If yes, under what conditions?
2 Experimental Setup
One of the key questions in utilising QE in theCAT scenario is how to relay QE information tothe user. In our experiments, we evaluate a way ofvisualising MT quality estimates that is based on acolor-coded binary classification (green vs. red) asan alternative to real-valued quality labels. In ourcontext, ‘green’ means that post-editing the trans-lation is expected to be faster than translation fromscratch, while ‘red’ means that post-editing thetranslation is expected to take longer than trans-lating from scratch.
This decision rests on the assumption that thetwo-color scheme is more immediate than real-valued scores, which require some interpretationby the user. Analysing the difference between al-ternative visualisation schemes, however, is cer-tainly an aspect that we want to explore in the fu-ture.
2.1 The CAT FrameworkTo keep the experimental conditions as natural aspossible, we analyse the impact of QE labels ontranslators’ productivity in a real CAT environ-ment. To this aim, we use the open-source Mate-Cat tool (Federico et al., 2014), which has beenslightly changed in two ways. First, the tool hasbeen adapted to provide only one single transla-tion suggestion (MT output) per segment, insteadof the usual three (one MT suggestion plus twoTranslation Memory matches). Second, each sug-gestion is presented with a colored flag (green for
good, red for bad), which indicates its expectedquality and usefulness to the post-editor. In thecontrastive condition (no binary QE visualization),grey is used as the neutral and uniform flag color.
2.2 Getting binary quality labels.
The experiment is set up for a between-subjectcomparison on a single long document as follows.
First, the document is split in two parts. Thefirst part serves as the training portion for a bi-nary quality estimator; the second part is re-served for evaluation. The training portion ismachine-translated with a state-of-the-art, phrase-based Moses system (Koehn et al., 2007)2 andpost-edited under standard conditions (i.e. with-out visualising QE information) by the same usersinvolved in the testing phase. Based on their post-edits, the raw MT output samples are then la-beled as ‘good’ or ‘bad’ by considering the HTER(Snover et al., 2006) calculated between raw MToutput and its post-edited version.3 Our labelingcriterion follows the empirical findings of (Turchiet al., 2013; Turchi et al., 2014b), which indicatean HTER value of 0.4 as boundary between post-editable (HTER ≤ 0.4) and useless suggestions(HTER> 0.4).
Then, to model the subjective concept of qual-ity of different subjects, for of each translatorwe train a separate binary QE classifier on thelabeled samples. For this purpose we use theScikit-learn implementation of support vector ma-chines (Pedregosa et al., 2011), training our mod-els with the 17 baseline features proposed by Spe-cia et al. (2009). This feature set mainly takesinto account the complexity of the source sentence(e.g. number of tokens, number of translations persource word) and the fluency of the target trans-lation (e.g. language model probabilities). Thefeatures are extracted from the data available atprediction time (source text and raw MT output)by using an adapted version (Shah et al., 2014)of the open-source QuEst software (Specia et al.,2013). The SVM parameters are optimized bycross-validation on the training set.
With these classifiers, we finally assign qualityflags to the raw segment translations in the test
2The system was trained with 60M running words fromthe same domain (Information Technology) of the input doc-ument.
3HTER measures the minimum edit distance (# word In-sertions + Deletions + Substitutions + Shifts / # ReferenceWords) between the MT output and its manual post-edition.
531
Page 57 of 146
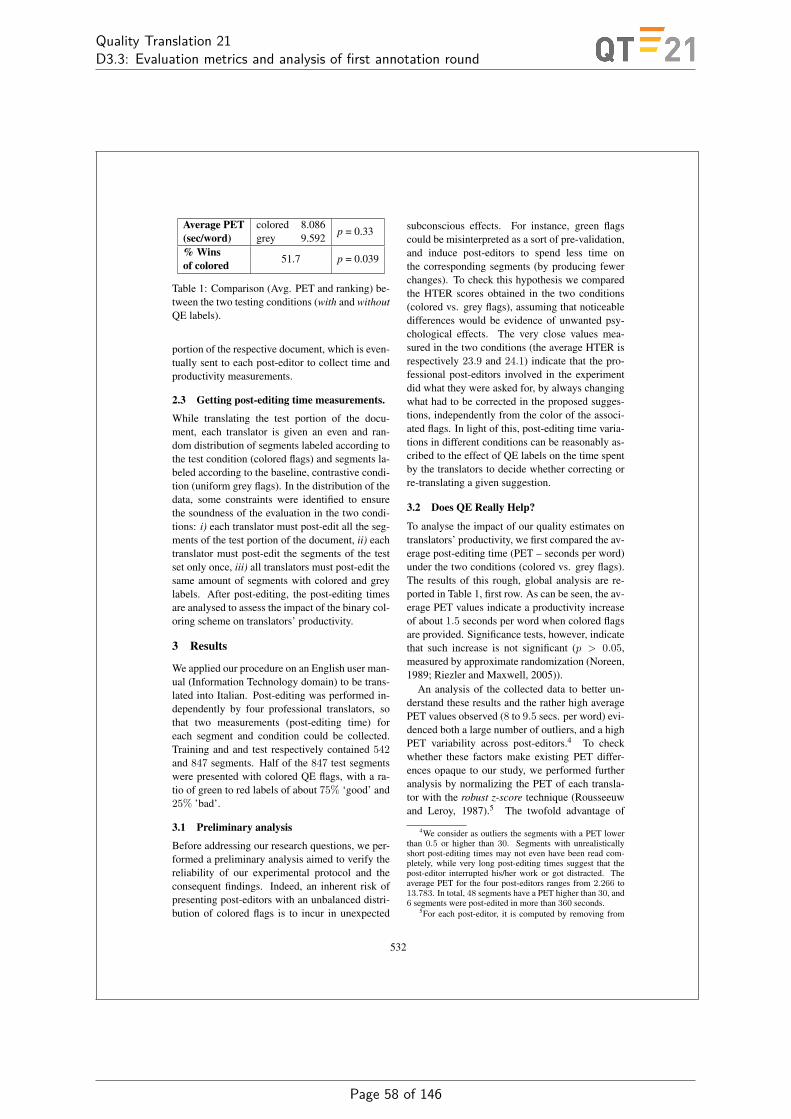
Quality Translation 21D3.3: Evaluation metrics and analysis of first annotation round
Average PET(sec/word)
coloredgrey
8.0869.592
p = 0.33
% Winsof colored 51.7 p = 0.039
Table 1: Comparison (Avg. PET and ranking) be-tween the two testing conditions (with and withoutQE labels).
portion of the respective document, which is even-tually sent to each post-editor to collect time andproductivity measurements.
2.3 Getting post-editing time measurements.
While translating the test portion of the docu-ment, each translator is given an even and ran-dom distribution of segments labeled according tothe test condition (colored flags) and segments la-beled according to the baseline, contrastive condi-tion (uniform grey flags). In the distribution of thedata, some constraints were identified to ensurethe soundness of the evaluation in the two condi-tions: i) each translator must post-edit all the seg-ments of the test portion of the document, ii) eachtranslator must post-edit the segments of the testset only once, iii) all translators must post-edit thesame amount of segments with colored and greylabels. After post-editing, the post-editing timesare analysed to assess the impact of the binary col-oring scheme on translators’ productivity.
3 Results
We applied our procedure on an English user man-ual (Information Technology domain) to be trans-lated into Italian. Post-editing was performed in-dependently by four professional translators, sothat two measurements (post-editing time) foreach segment and condition could be collected.Training and and test respectively contained 542and 847 segments. Half of the 847 test segmentswere presented with colored QE flags, with a ra-tio of green to red labels of about 75% ‘good’ and25% ’bad’.
3.1 Preliminary analysis
Before addressing our research questions, we per-formed a preliminary analysis aimed to verify thereliability of our experimental protocol and theconsequent findings. Indeed, an inherent risk ofpresenting post-editors with an unbalanced distri-bution of colored flags is to incur in unexpected
subconscious effects. For instance, green flagscould be misinterpreted as a sort of pre-validation,and induce post-editors to spend less time onthe corresponding segments (by producing fewerchanges). To check this hypothesis we comparedthe HTER scores obtained in the two conditions(colored vs. grey flags), assuming that noticeabledifferences would be evidence of unwanted psy-chological effects. The very close values mea-sured in the two conditions (the average HTER isrespectively 23.9 and 24.1) indicate that the pro-fessional post-editors involved in the experimentdid what they were asked for, by always changingwhat had to be corrected in the proposed sugges-tions, independently from the color of the associ-ated flags. In light of this, post-editing time varia-tions in different conditions can be reasonably as-cribed to the effect of QE labels on the time spentby the translators to decide whether correcting orre-translating a given suggestion.
3.2 Does QE Really Help?
To analyse the impact of our quality estimates ontranslators’ productivity, we first compared the av-erage post-editing time (PET – seconds per word)under the two conditions (colored vs. grey flags).The results of this rough, global analysis are re-ported in Table 1, first row. As can be seen, the av-erage PET values indicate a productivity increaseof about 1.5 seconds per word when colored flagsare provided. Significance tests, however, indicatethat such increase is not significant (p > 0.05,measured by approximate randomization (Noreen,1989; Riezler and Maxwell, 2005)).
An analysis of the collected data to better un-derstand these results and the rather high averagePET values observed (8 to 9.5 secs. per word) evi-denced both a large number of outliers, and a highPET variability across post-editors.4 To checkwhether these factors make existing PET differ-ences opaque to our study, we performed furtheranalysis by normalizing the PET of each transla-tor with the robust z-score technique (Rousseeuwand Leroy, 1987).5 The twofold advantage of
4We consider as outliers the segments with a PET lowerthan 0.5 or higher than 30. Segments with unrealisticallyshort post-editing times may not even have been read com-pletely, while very long post-editing times suggest that thepost-editor interrupted his/her work or got distracted. Theaverage PET for the four post-editors ranges from 2.266 to13.783. In total, 48 segments have a PET higher than 30, and6 segments were post-edited in more than 360 seconds.
5For each post-editor, it is computed by removing from
532
Page 58 of 146
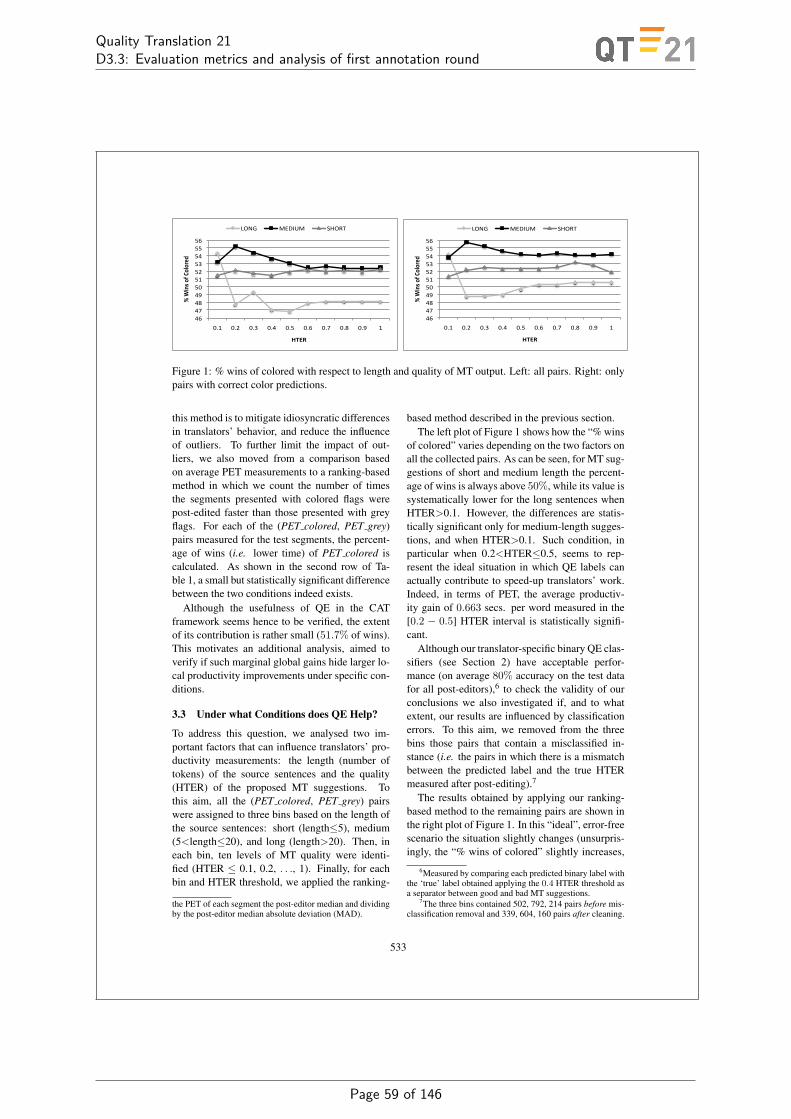
Quality Translation 21D3.3: Evaluation metrics and analysis of first annotation round
46 47 48 49 50 51 52 53 54 55 56
0.1 0.2 0.3 0.4 0.5 0.6 0.7 0.8 0.9 1
% W
ins o
f Colored
HTER
LONG MEDIUM SHORT
46 47 48 49 50 51 52 53 54 55 56
0.1 0.2 0.3 0.4 0.5 0.6 0.7 0.8 0.9 1
% W
ins o
f Colored
HTER
LONG MEDIUM SHORT
Figure 1: % wins of colored with respect to length and quality of MT output. Left: all pairs. Right: onlypairs with correct color predictions.
this method is to mitigate idiosyncratic differencesin translators’ behavior, and reduce the influenceof outliers. To further limit the impact of out-liers, we also moved from a comparison basedon average PET measurements to a ranking-basedmethod in which we count the number of timesthe segments presented with colored flags werepost-edited faster than those presented with greyflags. For each of the (PET colored, PET grey)pairs measured for the test segments, the percent-age of wins (i.e. lower time) of PET colored iscalculated. As shown in the second row of Ta-ble 1, a small but statistically significant differencebetween the two conditions indeed exists.
Although the usefulness of QE in the CATframework seems hence to be verified, the extentof its contribution is rather small (51.7% of wins).This motivates an additional analysis, aimed toverify if such marginal global gains hide larger lo-cal productivity improvements under specific con-ditions.
3.3 Under what Conditions does QE Help?
To address this question, we analysed two im-portant factors that can influence translators’ pro-ductivity measurements: the length (number oftokens) of the source sentences and the quality(HTER) of the proposed MT suggestions. Tothis aim, all the (PET colored, PET grey) pairswere assigned to three bins based on the length ofthe source sentences: short (length≤5), medium(5<length≤20), and long (length>20). Then, ineach bin, ten levels of MT quality were identi-fied (HTER ≤ 0.1, 0.2, . . ., 1). Finally, for eachbin and HTER threshold, we applied the ranking-
the PET of each segment the post-editor median and dividingby the post-editor median absolute deviation (MAD).
based method described in the previous section.The left plot of Figure 1 shows how the “% wins
of colored” varies depending on the two factors onall the collected pairs. As can be seen, for MT sug-gestions of short and medium length the percent-age of wins is always above 50%, while its value issystematically lower for the long sentences whenHTER>0.1. However, the differences are statis-tically significant only for medium-length sugges-tions, and when HTER>0.1. Such condition, inparticular when 0.2<HTER≤0.5, seems to rep-resent the ideal situation in which QE labels canactually contribute to speed-up translators’ work.Indeed, in terms of PET, the average productiv-ity gain of 0.663 secs. per word measured in the[0.2 − 0.5] HTER interval is statistically signifi-cant.
Although our translator-specific binary QE clas-sifiers (see Section 2) have acceptable perfor-mance (on average 80% accuracy on the test datafor all post-editors),6 to check the validity of ourconclusions we also investigated if, and to whatextent, our results are influenced by classificationerrors. To this aim, we removed from the threebins those pairs that contain a misclassified in-stance (i.e. the pairs in which there is a mismatchbetween the predicted label and the true HTERmeasured after post-editing).7
The results obtained by applying our ranking-based method to the remaining pairs are shown inthe right plot of Figure 1. In this “ideal”, error-freescenario the situation slightly changes (unsurpris-ingly, the “% wins of colored” slightly increases,
6Measured by comparing each predicted binary label withthe ‘true’ label obtained applying the 0.4 HTER threshold asa separator between good and bad MT suggestions.
7The three bins contained 502, 792, 214 pairs before mis-classification removal and 339, 604, 160 pairs after cleaning.
533
Page 59 of 146
Quality Translation 21D3.3: Evaluation metrics and analysis of first annotation round
especially for long suggestions for which we havethe highest number of misclassifications), but theoverall conclusions remain the same. In particular,the higher percentage of wins is statistically sig-nificant only for medium-length suggestions withHTER>0.1 and, in the best case (HTER≤0.2) it isabout 56.0%.
4 Conclusion
We presented the results of an on-field evalua-tion aimed to verify the widely held assumptionthat QE information can be useful to speed-upMT post-editing in the CAT scenario. Our resultssuggest that this assumption should be put intoperspective. On one side, global PET measure-ments do not necessarily show statistically signif-icant productivity gains,8 indicating that the con-tribution of QE falls below expectations (our firstcontribution). On the other side, an in-depth anal-ysis abstracting from the presence of outliers andthe high variability across post-editors, indicatesthat the usefulness of QE is verified, at least tosome extent (our second contribution). Indeed,the marginal productivity gains observed with QEat a global level become statistically significant inspecific conditions, depending on the length (be-tween 5 and 20 words) of the source sentences andthe quality (0.2<HTER≤0.5) of the proposed MTsuggestions (our third contribution).
Acknowledgements
This work has been partially supported by the EC-funded projects MateCat (FP7 grant agreementno. 287688) and QT21 (H2020 innovation pro-gramme, grant agreement no. 645452).
ReferencesOndrej Bojar, Christian Buck, Chris Callison-Burch,
Christian Federmann, Barry Haddow, PhilippKoehn, Christof Monz, Matt Post, Radu Soricut, andLucia Specia. 2013. Findings of the 2013 Workshopon Statistical Machine Translation. In Proceedingsof the 8th Workshop on Statistical Machine Transla-tion, WMT-2013, pages 1–44, Sofia, Bulgaria.
Ondrej Bojar, Christian Buck, Christian Federmann,Barry Haddow, Philipp Koehn, Johannes Leveling,Christof Monz, Pavel Pecina, Matt Post, HerveSaint-Amand, Radu Soricut, Lucia Specia, and AlesTamchyna. 2014. Findings of the 2014 workshop
8Unless, for instance, robust and non-arbitrary methods toidentify and remove outliers are applied.
on statistical machine translation. In Proceedings ofthe Ninth Workshop on Statistical Machine Transla-tion, pages 12–58, Baltimore, Maryland, USA.
Jose G. C. de Souza, Matteo Negri, Marco Turchi, andElisa Ricci. 2015. Online Multitask Learning ForMachine Translation Quality Estimation. In Pro-ceedings of the 53rd Annual Meeting of the Associa-tion for Computational Linguistics), Beijing, China.
Chris Callison-Burch, Philipp Koehn, Christof Monz,Matt Post, Radu Soricut, and Lucia Specia. 2012.Findings of the 2012 Workshop on Statistical Ma-chine Translation. In Proceedings of the 7th Work-shop on Statistical Machine Translation (WMT’12),pages 10–51, Montreal, Canada.
Marcello Federico, Nicola Bertoldi, Mauro Cettolo,Matteo Negri, Marco Turchi, Marco Trombetti,Alessandro Cattelan, Antonio Farina, DomenicoLupinetti, Andrea Martines, Alberto Massidda, Hol-ger Schwenk, Loıc Barrault, Frederic Blain, PhilippKoehn, Christian Buck, and Ulrich Germann. 2014.The MateCat tool. In Proceedings of COLING 2014,the 25th International Conference on ComputationalLinguistics: System Demonstrations, pages 129–132, Dublin, Ireland.
Fei Huang, Jian-Ming Xu, Abraham Ittycheriah, andSalim Roukos. 2014. Adaptive HTER Estimationfor Document-Specific MT Post-Editing. In Pro-ceedings of the 52nd Annual Meeting of the Associa-tion for Computational Linguistics (Volume 1: LongPapers), pages 861–870, Baltimore, Maryland.
Philipp Koehn, Hieu Hoang, Alexandra Birch, ChrisCallison-Burch, Marcello Federico, Nicola Bertoldi,Brooke Cowan, Wade Shen, Christine Moran,Richard Zens, Chris Dyer, Ondrej Bojar, AlexandraConstantin, and Evan Herbst. 2007. Moses: OpenSource Toolkit for Statistical Machine Translation.In Proceedings of the 45th Annual Meeting of theACL on Interactive Poster and Demonstration Ses-sions, pages 177–180, Stroudsburg, PA, USA.
Yashar Mehdad, Matteo Negri, and Marcello Fed-erico. 2012. Match without a Referee: EvaluatingMT Adequacy without Reference Translations. InProceedings of the Machine Translation Workshop(WMT2012), pages 171–180, Montreal, Canada.
Eric W. Noreen. 1989. Computer-intensive methodsfor testing hypotheses: an introduction. Wiley Inter-science.
Fabian Pedregosa, Gal Varoquaux, Alexandre Gram-fort, Vincent Michel, Bertrand Thirion, OlivierGrisel, Mathieu Blondel, Peter Prettenhofer, RonWeiss, Vincent Dubourg, Jake Vanderplas, Alexan-dre Passos, David Cournapeau, Matthieu Brucher,Matthieu Perrot, and douard Duchesnay. 2011.Scikit-learn: Machine Learning in Python. Journalof Machine Learning Research, 12:2825–2830.
534
Page 60 of 146

Quality Translation 21D3.3: Evaluation metrics and analysis of first annotation round
Stefan Riezler and John T Maxwell. 2005. Onsome Pitfalls in Automatic Evaluation and Signifi-cance Testing for MT. In Proceedings of the ACLworkshop on intrinsic and extrinsic evaluation mea-sures for machine translation and/or summarization,pages 57–64.
Peter J Rousseeuw and Annick M Leroy. 1987. Robustregression and outlier detection, volume 589. JohnWiley & Sons.
Kashif Shah, Marco Turchi, and Lucia Specia. 2014.An efficient and user-friendly tool for machine trans-lation quality estimation. In Proceedings of theNinth International Conference on Language Re-sources and Evaluation (LREC’14), Reykjavik, Ice-land.
Matthew Snover, Bonnie Dorr, Richard Schwartz, Lin-nea Micciulla, and John Makhoul. 2006. A Studyof Translation Edit Rate with Targeted Human An-notation. In Proceedings of Association for MachineTranslation in the Americas, pages 223–231, Cam-bridge, Massachusetts, USA.
Lucia Specia, Nicola Cancedda, Marc Dymetman,Marco Turchi, and Nello Cristianini. 2009. Es-timating the Sentence-Level Quality of MachineTranslation Systems. In Proceedings of the 13th
Annual Conference of the European Associationfor Machine Translation (EAMT’09), pages 28–35,Barcelona, Spain.
Lucia Specia, Kashif Shah, Jose G.C. de Souza, andTrevor Cohn. 2013. QuEst - A Translation Qual-ity Estimation Framework. In Proceedings of the51st Annual Meeting of the Association for Compu-tational Linguistics: System Demonstrations, ACL-2013, pages 79–84, Sofia, Bulgaria.
Lucia Specia. 2011. Exploiting Objective Annotationsfor Minimising Translation Post-editing Effort. InProceedings of the 15th Conference of the EuropeanAssociation for Machine Translation (EAMT 2011),pages 73–80, Leuven, Belgium.
Marco Turchi, Matteo Negri, and Marcello Federico.2013. Coping with the Subjectivity of HumanJudgements in MT Quality Estimation. In Proceed-ings of the 8th Workshop on Statistical MachineTranslation, pages 240–251, Sofia, Bulgaria.
Marco Turchi, Antonios Anastasopoulos, Jose G. C. deSouza, and Matteo Negri. 2014a. Adaptive Qual-ity Estimation for Machine Translation. In Proceed-ings of the 52nd Annual Meeting of the Associationfor Computational Linguistics (Volume 1: Long Pa-pers), pages 710–720, Baltimore, Maryland, USA.
Marco Turchi, Matteo Negri, and Marcello Federico.2014b. Data-driven Annotation of Binary MTQuality Estimation Corpora Based on Human Post-editions. Machine translation, 28(3-4):281–308.
535
Page 61 of 146
Quality Translation 21D3.3: Evaluation metrics and analysis of first annotation round
F Online Multitask Learning for Machine Translation Quality Esti-mation
Proceedings of the 53rd Annual Meeting of the Association for Computational Linguisticsand the 7th International Joint Conference on Natural Language Processing, pages 219–228,
Beijing, China, July 26-31, 2015. c©2015 Association for Computational Linguistics
Online Multitask Learning for Machine Translation Quality Estimation
Jose G. C. de Souza(1,2), Matteo Negri(1), Elisa Ricci(1), Marco Turchi(1)
(1) FBK - Fondazione Bruno Kessler, Via Sommarive 18, 38123 Trento, Italy(2) University of Trento, Italy
desouza,negri,eliricci,[email protected]
AbstractWe present a method for predicting ma-chine translation output quality geared tothe needs of computer-assisted translation.These include the capability to: i) con-tinuously learn and self-adapt to a streamof data coming from multiple translationjobs, ii) react to data diversity by ex-ploiting human feedback, and iii) leveragedata similarity by learning and transferringknowledge across domains. To achievethese goals, we combine two supervisedmachine learning paradigms, online andmultitask learning, adapting and unifyingthem in a single framework. We showthe effectiveness of our approach in a re-gression task (HTER prediction), in whichonline multitask learning outperforms thecompetitive online single-task and poolingmethods used for comparison. This in-dicates the feasibility of integrating in aCAT tool a single QE component capa-ble to simultaneously serve (and continu-ously learn from) multiple translation jobsinvolving different domains and users.
1 Introduction
Even if not perfect, machine translation (MT) isnow getting reliable enough to support and speed-up human translation. Thanks to this progress,the work of professional translators is graduallyshifting from full translation from scratch to MTpost-editing. Advanced computer-assisted trans-lation (CAT) tools1 provide a natural frameworkfor this activity by proposing, for each segment ina source document, one or more suggestions ob-tained either from a translation memory (TM) orfrom an MT engine. In both cases, accurate mech-anisms to indicate the reliability of a suggestion
1See for instance the open source MateCat tool (Federicoet al., 2014).
are extremely useful to let the user decide whetherto post-edit a given suggestion or ignore it andtranslate the source segment from scratch. How-ever, while scoring TM matches relies on standardmethods based on fuzzy matching, predicting thequality of MT suggestions at run-time and withoutreferences is still an open issue.
This is the goal of MT quality estimation (QE),which aims to predict the quality of an automatictranslation as a function of the estimated numberof editing operations or the time required for man-ual correction (Specia et al., 2009; Soricut andEchihabi, 2010; Bach et al., 2011; Mehdad et al.,2012). So far, QE has been mainly approachedin controlled settings where homogeneous train-ing and test data is used to learn and evaluate staticpredictors. Cast in this way, however, it does notfully reflect (nor exploit) the working conditionsposed by the CAT framework, in which:
1. The QE module is exposed to a continuousstream of data. The amount of such data andthe tight schedule of multiple, simultaneoustranslation jobs prevents from (theoreticallyfeasible but impractical) complete re-trainingprocedures in a batch fashion and advocatefor continuous learning methods.
2. The input data can be diverse in nature. Con-tinuous learning should be sensitive to suchdifferences, in a way that each translation joband user is supported by a reactive model thatis robust to variable working conditions.
3. The input data can show similarities withprevious observations. Continuous learningshould leverage such similarities, so that QEcan capitalize from all the previously pro-cessed segments even if they come from dif-ferent domains, genres or users.
While previous QE research disregarded thesechallenges or addressed them in isolation, our
219
Page 62 of 146

Quality Translation 21D3.3: Evaluation metrics and analysis of first annotation round
work tackles them in a single unifying frameworkbased on the combination of two paradigms: on-line and multitask learning. The former providescontinuous learning capabilities that allow the QEmodel to be robust and self-adapt to a stream ofpotentially diverse data. The latter provides themodel with the capability to exploit the similari-ties between data coming from different sources.Along this direction our contributions are:
• The first application of online multitasklearning to QE, geared to the challengesposed by CAT technology. In this framework,our models are trained to predict MT qualityin terms of HTER (Snover et al., 2006).2
• The extension of current online multitasklearning methods to regression. Prior worksin the machine learning field applied thisparadigm to classification problems, but itsuse for HTER estimation requires real-valuedpredictions. To this aim, we propose a newregression algorithm that, at the same time,handles positive and negative transfer andperforms online weight updates.
• A comparison between online multitask andalternative, state-of-the-art online learningstrategies. Our experiments, carried out in arealistic scenario involving a stream of datafrom four domains, lead to consistent resultsthat prove the effectiveness of our approach.
2 Related Work
In recent years, sentence-level QE has beenmainly investigated in controlled evaluation sce-narios such as those proposed by the shared tasksorganized within the WMT workshop on SMT(Callison-Burch et al., 2012; Bojar et al., 2013;Bojar et al., 2014). In this framework, systemstrained from a collection of (source, target, label)instances are evaluated based on their capabilityto predict the correct label3 for new, unseen testitems. Compared to our application scenario, theshared tasks setting differs in two main aspects.
2The HTER is the minimum edit distance between a trans-lation suggestion and its manually post-edited version in the[0,1] interval. Edit distance is calculated as the number ofedits (word insertions, deletions, substitutions, and shifts) di-vided by the number of words in the reference.
3Possible label types include post-editing effort scores(e.g. 1-5 Likert scores indicating the estimated percentageof MT output that has to be corrected), HTER values, andpost-editing time (e.g. seconds per word).
First, the data used are substantially homogeneous(usually they come from the same domain, and tar-get translations are produced by the same MT sys-tem). Second, training and test are carried out asdistinct, sequential phases. Instead, in the CAT en-vironment, a QE component should ideally serve,adapt to and continuously learn from simultaneoustranslation jobs involving different MT engines,domains, genres and users (Turchi et al., 2013).
These challenges have been separately ad-dressed from different perspectives in few recentworks. Huang et al. (2014) proposed a methodto adaptively train a QE model for document-specific MT post-editing. Adaptability, however,is achieved in a batch fashion, by re-training an adhoc QE component for each document to be trans-lated. The adaptive approach proposed by Turchiet al. (2014) overcomes the limitations of batchmethods by applying an online learning protocolto continuously learn from a stream of (potentiallyheterogeneous) data. Experimental results suggestthe effectiveness of online learning as a way to ex-ploit user feedback to tailor QE predictions to theirquality standards and to cope with the heterogene-ity of data coming from different domains. How-ever, though robust to user and domain changes,the method is solely driven by the distance com-puted between predicted and true labels, and itdoes not exploit any notion of similarity betweentasks (e.g. domains, users, MT engines).
On the other way round, task relatedness is suc-cessfully exploited by Cohn and Specia (2013),who apply multitask learning to jointly learn fromdata obtained from several annotators with differ-ent levels of expertise and reliability. A similar ap-proach is adopted by de Souza et al. (2014a), whoapply multitask learning to cope with situations inwhich a QE model has to be trained with scarcedata from multiple domains/genres, different fromthe actual test domain. The two methods signifi-cantly outperform both individual single-task (in-domain) models and single pooled models. How-ever, operating in batch learning mode, none ofthem provides the continuous learning capabilitiesdesirable in the CAT framework.
The idea that online and multitask learning cancomplement each other if combined is suggestedby (de Souza et al., 2014b), who compared the twolearning paradigms in the same experimental set-ting. So far, however, empirical evidence of thiscomplementarity is still lacking.
220
Page 63 of 146
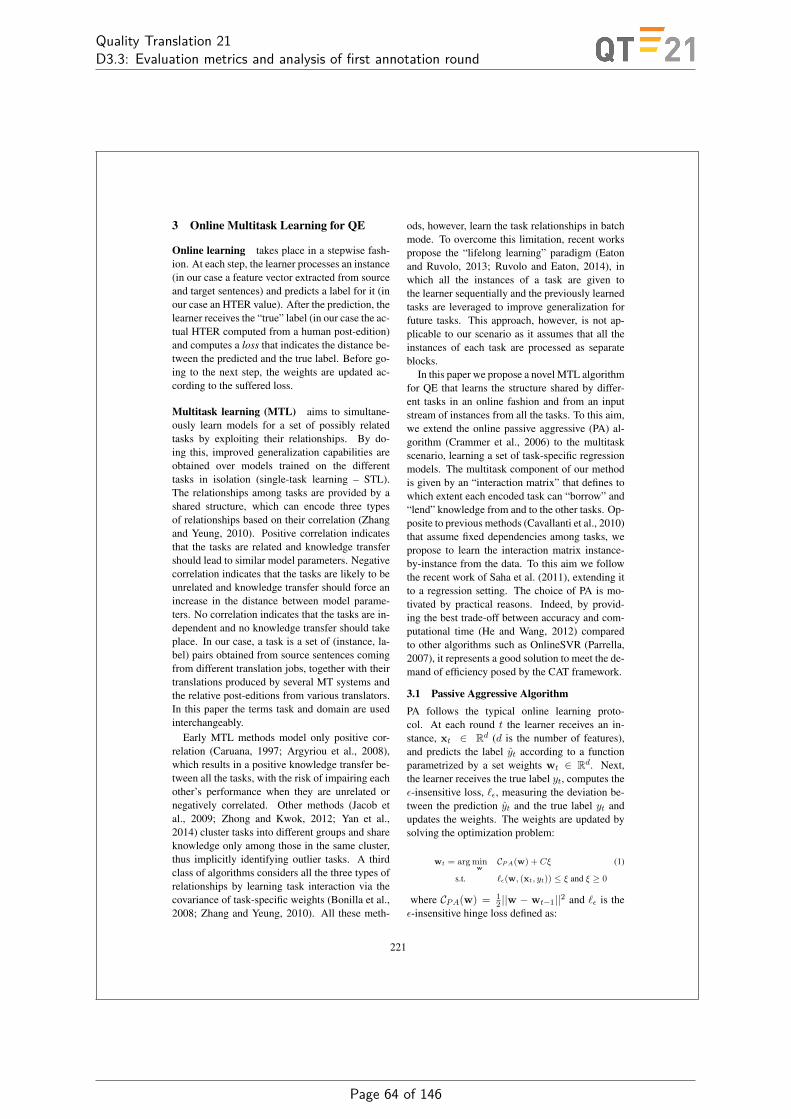
Quality Translation 21D3.3: Evaluation metrics and analysis of first annotation round
3 Online Multitask Learning for QE
Online learning takes place in a stepwise fash-ion. At each step, the learner processes an instance(in our case a feature vector extracted from sourceand target sentences) and predicts a label for it (inour case an HTER value). After the prediction, thelearner receives the “true” label (in our case the ac-tual HTER computed from a human post-edition)and computes a loss that indicates the distance be-tween the predicted and the true label. Before go-ing to the next step, the weights are updated ac-cording to the suffered loss.
Multitask learning (MTL) aims to simultane-ously learn models for a set of possibly relatedtasks by exploiting their relationships. By do-ing this, improved generalization capabilities areobtained over models trained on the differenttasks in isolation (single-task learning – STL).The relationships among tasks are provided by ashared structure, which can encode three typesof relationships based on their correlation (Zhangand Yeung, 2010). Positive correlation indicatesthat the tasks are related and knowledge transfershould lead to similar model parameters. Negativecorrelation indicates that the tasks are likely to beunrelated and knowledge transfer should force anincrease in the distance between model parame-ters. No correlation indicates that the tasks are in-dependent and no knowledge transfer should takeplace. In our case, a task is a set of (instance, la-bel) pairs obtained from source sentences comingfrom different translation jobs, together with theirtranslations produced by several MT systems andthe relative post-editions from various translators.In this paper the terms task and domain are usedinterchangeably.
Early MTL methods model only positive cor-relation (Caruana, 1997; Argyriou et al., 2008),which results in a positive knowledge transfer be-tween all the tasks, with the risk of impairing eachother’s performance when they are unrelated ornegatively correlated. Other methods (Jacob etal., 2009; Zhong and Kwok, 2012; Yan et al.,2014) cluster tasks into different groups and shareknowledge only among those in the same cluster,thus implicitly identifying outlier tasks. A thirdclass of algorithms considers all the three types ofrelationships by learning task interaction via thecovariance of task-specific weights (Bonilla et al.,2008; Zhang and Yeung, 2010). All these meth-
ods, however, learn the task relationships in batchmode. To overcome this limitation, recent workspropose the “lifelong learning” paradigm (Eatonand Ruvolo, 2013; Ruvolo and Eaton, 2014), inwhich all the instances of a task are given tothe learner sequentially and the previously learnedtasks are leveraged to improve generalization forfuture tasks. This approach, however, is not ap-plicable to our scenario as it assumes that all theinstances of each task are processed as separateblocks.
In this paper we propose a novel MTL algorithmfor QE that learns the structure shared by differ-ent tasks in an online fashion and from an inputstream of instances from all the tasks. To this aim,we extend the online passive aggressive (PA) al-gorithm (Crammer et al., 2006) to the multitaskscenario, learning a set of task-specific regressionmodels. The multitask component of our methodis given by an “interaction matrix” that defines towhich extent each encoded task can “borrow” and“lend” knowledge from and to the other tasks. Op-posite to previous methods (Cavallanti et al., 2010)that assume fixed dependencies among tasks, wepropose to learn the interaction matrix instance-by-instance from the data. To this aim we followthe recent work of Saha et al. (2011), extending itto a regression setting. The choice of PA is mo-tivated by practical reasons. Indeed, by provid-ing the best trade-off between accuracy and com-putational time (He and Wang, 2012) comparedto other algorithms such as OnlineSVR (Parrella,2007), it represents a good solution to meet the de-mand of efficiency posed by the CAT framework.
3.1 Passive Aggressive AlgorithmPA follows the typical online learning proto-col. At each round t the learner receives an in-stance, xt ∈ Rd (d is the number of features),and predicts the label yt according to a functionparametrized by a set weights wt ∈ Rd. Next,the learner receives the true label yt, computes theε-insensitive loss, `ε, measuring the deviation be-tween the prediction yt and the true label yt andupdates the weights. The weights are updated bysolving the optimization problem:
wt = arg minw
CPA(w) + Cξ (1)
s.t. `ε(w, (xt, yt)) ≤ ξ and ξ ≥ 0
where CPA(w) = 12 ||w − wt−1||2 and `ε is the
ε-insensitive hinge loss defined as:
221
Page 64 of 146

Quality Translation 21D3.3: Evaluation metrics and analysis of first annotation round
`ε(w, (x, y)) =
0, if |y −w · x| ≤ ε|y −w · x| − ε, otherwise
(2)
The loss is zero when the absolute difference be-tween the prediction and the true label is smalleror equal to ε, and grows linearly with this differ-ence otherwise. The ε parameter is given as inputand regulates the sensitivity to mistakes. The slackvariable ξ acts as an upper-bound to the loss, whilethe C parameter is introduced to control the ag-gressiveness of the weights update. High C valueslead to more aggressive weight updates. However,when the labels present some degree of noise (acommon situation in MT QE), they might causethe learner to drastically change the weight vectorin a wrong direction. In these situations, setting Cto small values is desirable. As shown in (Cram-mer et al., 2006), a closed form solution for theweights update in Eq.1 can be derived as:
wt = wt−1 + sgn(yt − yt)τtxt (3)
with τt = min(C, `t||xt||2 ) and `t = `ε(w, (xt, yt)).
3.2 Passive Aggressive MTL AlgorithmOur Passive Aggressive Multitask Learning(PAMTL) algorithm extends the traditional PA forregression to multitask learning. Our approach isinspired by the Online Task Relationship Learningalgorithm proposed by Saha et al. (2011) which,however, is only defined for classification.
The learning process considers one instance ateach round t. The random sequence of instancesbelongs to a fixed set ofK tasks and the goal of thealgorithm is to learnK linear models, one for eachtask, parametrized by weight vectors wt,k, k ∈1, . . . ,K. Moreover, the algorithm also learnsa positive semidefinite matrix Ω ∈ RK×K , mod-eling the relationship among tasks. Algorithm 1summarizes our approach. At each round t, thelearner receives a pair (xt, it) where xt ∈ Rd is aninstance and it ∈ 1, . . . ,K is the task identifier.Each incoming instance is transformed to a com-pound vector φt = [0, . . . , 0,xt, 0, . . . , 0] ∈ RKd.Then, the algorithm predicts the HTER score cor-responding to the label y by using the weight vec-tor wt. The weight vector is a compound vectorwt = [wt,1, . . . , wt,K ] ∈ RKd, where wt,k ∈Rd , k ∈ 1, . . . ,K. Next, the learner receivesthe true HTER label y and computes the loss `ε(Eq. 2) for round t.
Algorithm 1 PA Multitask Learning (PAMTL)Input: instances from K tasks, number of rounds R > 0,ε > 0, C > 0Output: w and Ω, learned after T rounds
Initialization: Ω = 1K× Ik, w = 0
for t = 1 to T doreceive instance (xt, it)compute φt from xtpredict HTER yt = (wT
t · φt)receive true HTER label ytcompute `t (Eq. 2)compute τt = min(C, `t
||φt||2 )
/* update weights */wt = wt−1 + sgn(yt − yt)τt(Ωt−1 ⊗ Id)
−1φt/* update task matrix */if t > R then
update Ωt with Eq. 6 or Eq. 7end if
end for
We propose to update the weights by solving:
wt,Ωt = argminw,Ω0
CMTL(w,Ω) + Cξ +D(Ω,Ωt−1)
s.t. `ε(w, (xt, yt)) ≤ ξ, ξ ≥ 0 (4)
The first term models the joint dependenciesbetween the task weights and the interactionmatrix and it is defined as CMTL(w,Ω) =12(w − wt)TΩ⊗(w − wt), where Ω⊗ = Ω ⊗Id. The function D(·) represents the diver-gence between a pair of positive definite matri-ces. Similar to (Saha et al., 2011), to defineD(·) we also consider the family of Bregman di-vergences and specifically the LogDet and theVon Neumann divergences. Given two matri-ces X,Y ∈ Rn×n, the LogDet divergence isDLD(X,Y) = tr(XY−1) − log |XY−1| − n,while the Von Neumann divergence is computedasDV N (X,Y) = tr(X log X−Y log Y−X+Y).
The optimization process to solve Eq.4 is per-formed with an alternate scheme: first, with afixed Ω, we compute w; then, given w we opti-mize for Ω. The closed-form solution for updatingw, which we derived similarly to the PA update(Crammer et al., 2006), becomes:
wt = wt−1 + sgn(yt − yt)τt(Ωt−1 ⊗ Id)−1φt (5)
In practice, the interaction matrix works as a learn-ing rate when updating the weights of each task.Similarly, following previous works (Tsuda et al.,2005), the update steps for the interaction matrixΩ can be easily derived. For the Log-Det diver-gence we have:
Ωt = (Ωt−1 + η sym(WTt−1Wt−1))
−1 (6)
222
Page 65 of 146
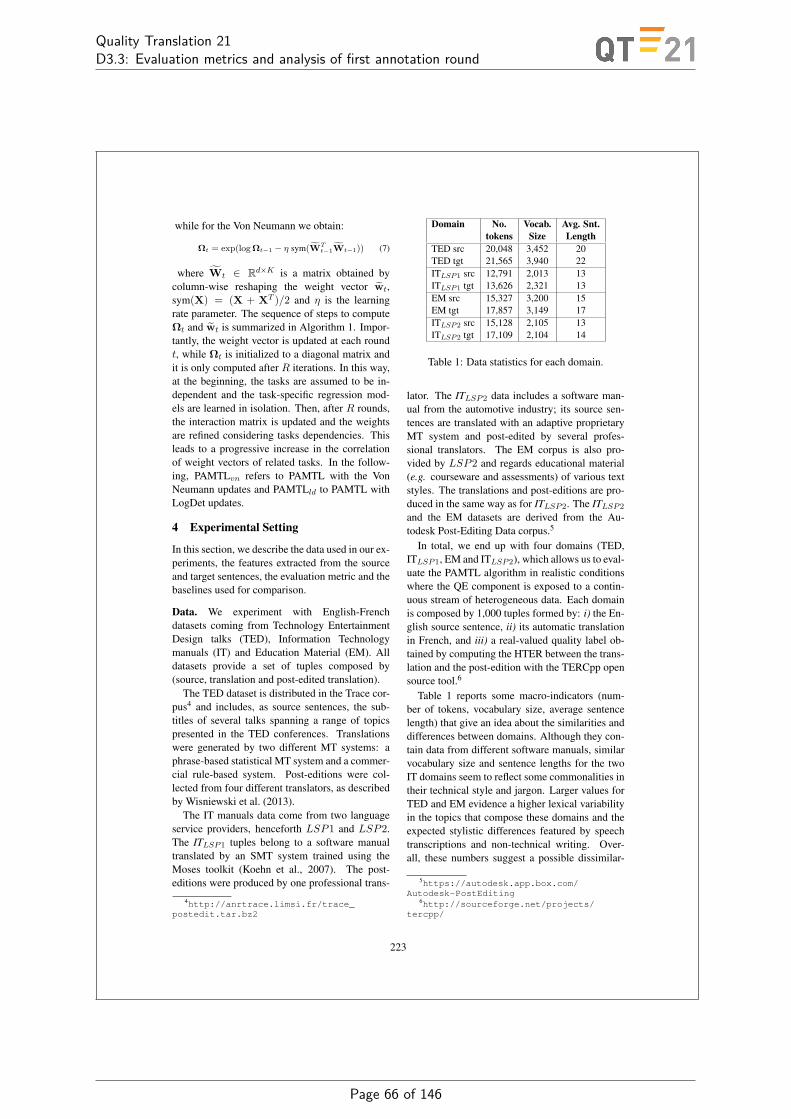
Quality Translation 21D3.3: Evaluation metrics and analysis of first annotation round
while for the Von Neumann we obtain:
Ωt = exp(log Ωt−1 − η sym(WTt−1Wt−1)) (7)
where Wt ∈ Rd×K is a matrix obtained bycolumn-wise reshaping the weight vector wt,sym(X) = (X + XT )/2 and η is the learningrate parameter. The sequence of steps to computeΩt and wt is summarized in Algorithm 1. Impor-tantly, the weight vector is updated at each roundt, while Ωt is initialized to a diagonal matrix andit is only computed after R iterations. In this way,at the beginning, the tasks are assumed to be in-dependent and the task-specific regression mod-els are learned in isolation. Then, after R rounds,the interaction matrix is updated and the weightsare refined considering tasks dependencies. Thisleads to a progressive increase in the correlationof weight vectors of related tasks. In the follow-ing, PAMTLvn refers to PAMTL with the VonNeumann updates and PAMTLld to PAMTL withLogDet updates.
4 Experimental Setting
In this section, we describe the data used in our ex-periments, the features extracted from the sourceand target sentences, the evaluation metric and thebaselines used for comparison.
Data. We experiment with English-Frenchdatasets coming from Technology EntertainmentDesign talks (TED), Information Technologymanuals (IT) and Education Material (EM). Alldatasets provide a set of tuples composed by(source, translation and post-edited translation).
The TED dataset is distributed in the Trace cor-pus4 and includes, as source sentences, the sub-titles of several talks spanning a range of topicspresented in the TED conferences. Translationswere generated by two different MT systems: aphrase-based statistical MT system and a commer-cial rule-based system. Post-editions were col-lected from four different translators, as describedby Wisniewski et al. (2013).
The IT manuals data come from two languageservice providers, henceforth LSP1 and LSP2.The ITLSP1 tuples belong to a software manualtranslated by an SMT system trained using theMoses toolkit (Koehn et al., 2007). The post-editions were produced by one professional trans-
4http://anrtrace.limsi.fr/trace_postedit.tar.bz2
Domain No. Vocab. Avg. Snt.tokens Size Length
TED src 20,048 3,452 20TED tgt 21,565 3,940 22ITLSP1 src 12,791 2,013 13ITLSP1 tgt 13,626 2,321 13EM src 15,327 3,200 15EM tgt 17,857 3,149 17ITLSP2 src 15,128 2,105 13ITLSP2 tgt 17,109 2,104 14
Table 1: Data statistics for each domain.
lator. The ITLSP2 data includes a software man-ual from the automotive industry; its source sen-tences are translated with an adaptive proprietaryMT system and post-edited by several profes-sional translators. The EM corpus is also pro-vided by LSP2 and regards educational material(e.g. courseware and assessments) of various textstyles. The translations and post-editions are pro-duced in the same way as for ITLSP2. The ITLSP2
and the EM datasets are derived from the Au-todesk Post-Editing Data corpus.5
In total, we end up with four domains (TED,ITLSP1, EM and ITLSP2), which allows us to eval-uate the PAMTL algorithm in realistic conditionswhere the QE component is exposed to a contin-uous stream of heterogeneous data. Each domainis composed by 1,000 tuples formed by: i) the En-glish source sentence, ii) its automatic translationin French, and iii) a real-valued quality label ob-tained by computing the HTER between the trans-lation and the post-edition with the TERCpp opensource tool.6
Table 1 reports some macro-indicators (num-ber of tokens, vocabulary size, average sentencelength) that give an idea about the similarities anddifferences between domains. Although they con-tain data from different software manuals, similarvocabulary size and sentence lengths for the twoIT domains seem to reflect some commonalities intheir technical style and jargon. Larger values forTED and EM evidence a higher lexical variabilityin the topics that compose these domains and theexpected stylistic differences featured by speechtranscriptions and non-technical writing. Over-all, these numbers suggest a possible dissimilar-
5https://autodesk.app.box.com/Autodesk-PostEditing
6http://sourceforge.net/projects/tercpp/
223
Page 66 of 146

Quality Translation 21D3.3: Evaluation metrics and analysis of first annotation round
Figure 1: Validation curves for the R parameter.
ity between ITLSP1 and ITLSP2 and the other twodomains, which might make knowledge transferacross them more difficult and QE model reactiv-ity to domain changes particularly important.
Features. Our models are trained using the 17baseline features proposed in (Specia et al., 2009),extracted with the online version of the QuEst fea-ture extractor (Shah et al., 2014). These featurestake into account the complexity of the source sen-tence (e.g. number of tokens, number of transla-tions per source word) and the fluency of the trans-lation (e.g. language model probabilities). Theirdescription is available in (Callison-Burch et al.,2012). The results of previous WMT QE sharedtasks have shown that these features are particu-larly competitive in the HTER prediction task.
Baselines. We compare the performance ofPAMTL against three baselines: i) pooling mean,ii) pooling online single task learning (STLpool)and iii) in-domain online single task learning(STLin). The pooling mean is obtained by assign-ing a fixed prediction value to each test point. Thisvalue is the average HTER computed on the entirepool of training data. Although assigning the sameprediction to each test instance would be uselessin real applications, we compare against the meanbaseline since it is often hard to beat in regressiontasks, especially when dealing with heterogeneousdata distributions (Rubino et al., 2013).
The two online single task baselines implementthe PA algorithm described in Section 3.1. Thechoice of PA is to make them comparable to ourmethod, so that we can isolate more precisely thecontribution of multitask learning. STLpool resultsare obtained by a single model trained on the entire
Figure 2: Learning curves for all the domains,computed by calculating the mean MAE (↓) of thefour domains.
pool of available training data presented in randomorder. STLin results are obtained by separatelytraining one model for each domain. These repre-sent two alternative strategies for the integration ofQE in the CAT framework. The former would al-low a single model to simultaneously support mul-tiple translation jobs in different domains, withoutany notion about their relations. The latter wouldlead to a more complex architecture, organized asa pool of independent, specialized QE modules.
Evaluation metric. The performance of our re-gression models is evaluated in terms of mean ab-solute error (MAE), a standard error measure forregression problems commonly used also for QE(Callison-Burch et al., 2012). The MAE is the av-erage of the absolute errors ei = |yi − yi|, whereyi is the prediction of the model and yi is the truevalue for the ith instance. As it is an error mea-sure, lower values indicate better performance (↓).
5 Results and Discussion
In this Section we evaluate the proposed PAMTLalgorithm. First, by analyzing how the number ofrounds R impacts on the performance of our ap-proach, we empirically find the value that will beused to train the model. Then, the learned modelis run on test data and compared against the base-lines. Performance is analyzed both by averag-ing the MAE results computed on all the domains,and by separately discussing in-domain behavior.Finally, the capability of the algorithm to learntask correlations and, in turn, transfer knowledgeacross them, is analysed by presenting the correla-
224
Page 67 of 146
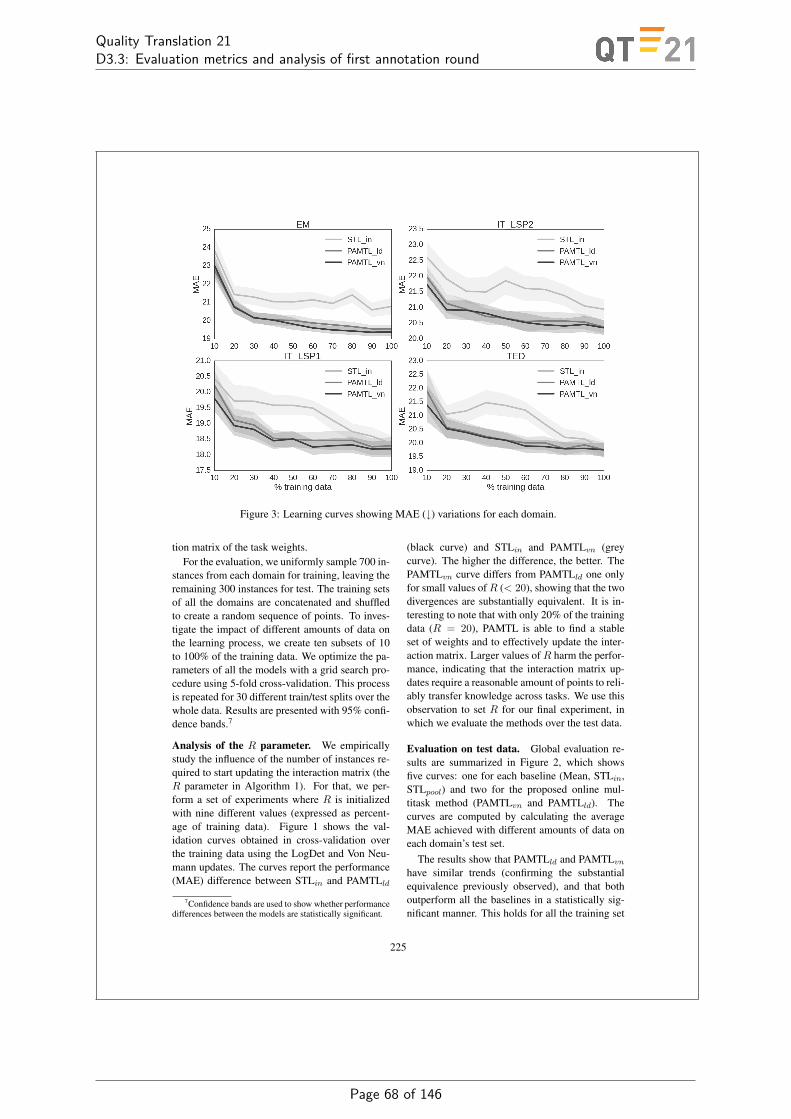
Quality Translation 21D3.3: Evaluation metrics and analysis of first annotation round
Figure 3: Learning curves showing MAE (↓) variations for each domain.
tion matrix of the task weights.For the evaluation, we uniformly sample 700 in-
stances from each domain for training, leaving theremaining 300 instances for test. The training setsof all the domains are concatenated and shuffledto create a random sequence of points. To inves-tigate the impact of different amounts of data onthe learning process, we create ten subsets of 10to 100% of the training data. We optimize the pa-rameters of all the models with a grid search pro-cedure using 5-fold cross-validation. This processis repeated for 30 different train/test splits over thewhole data. Results are presented with 95% confi-dence bands.7
Analysis of the R parameter. We empiricallystudy the influence of the number of instances re-quired to start updating the interaction matrix (theR parameter in Algorithm 1). For that, we per-form a set of experiments where R is initializedwith nine different values (expressed as percent-age of training data). Figure 1 shows the val-idation curves obtained in cross-validation overthe training data using the LogDet and Von Neu-mann updates. The curves report the performance(MAE) difference between STLin and PAMTLld
7Confidence bands are used to show whether performancedifferences between the models are statistically significant.
(black curve) and STLin and PAMTLvn (greycurve). The higher the difference, the better. ThePAMTLvn curve differs from PAMTLld one onlyfor small values ofR (< 20), showing that the twodivergences are substantially equivalent. It is in-teresting to note that with only 20% of the trainingdata (R = 20), PAMTL is able to find a stableset of weights and to effectively update the inter-action matrix. Larger values of R harm the perfor-mance, indicating that the interaction matrix up-dates require a reasonable amount of points to reli-ably transfer knowledge across tasks. We use thisobservation to set R for our final experiment, inwhich we evaluate the methods over the test data.
Evaluation on test data. Global evaluation re-sults are summarized in Figure 2, which showsfive curves: one for each baseline (Mean, STLin,STLpool) and two for the proposed online mul-titask method (PAMTLvn and PAMTLld). Thecurves are computed by calculating the averageMAE achieved with different amounts of data oneach domain’s test set.
The results show that PAMTLld and PAMTLvnhave similar trends (confirming the substantialequivalence previously observed), and that bothoutperform all the baselines in a statistically sig-nificant manner. This holds for all the training set
225
Page 68 of 146
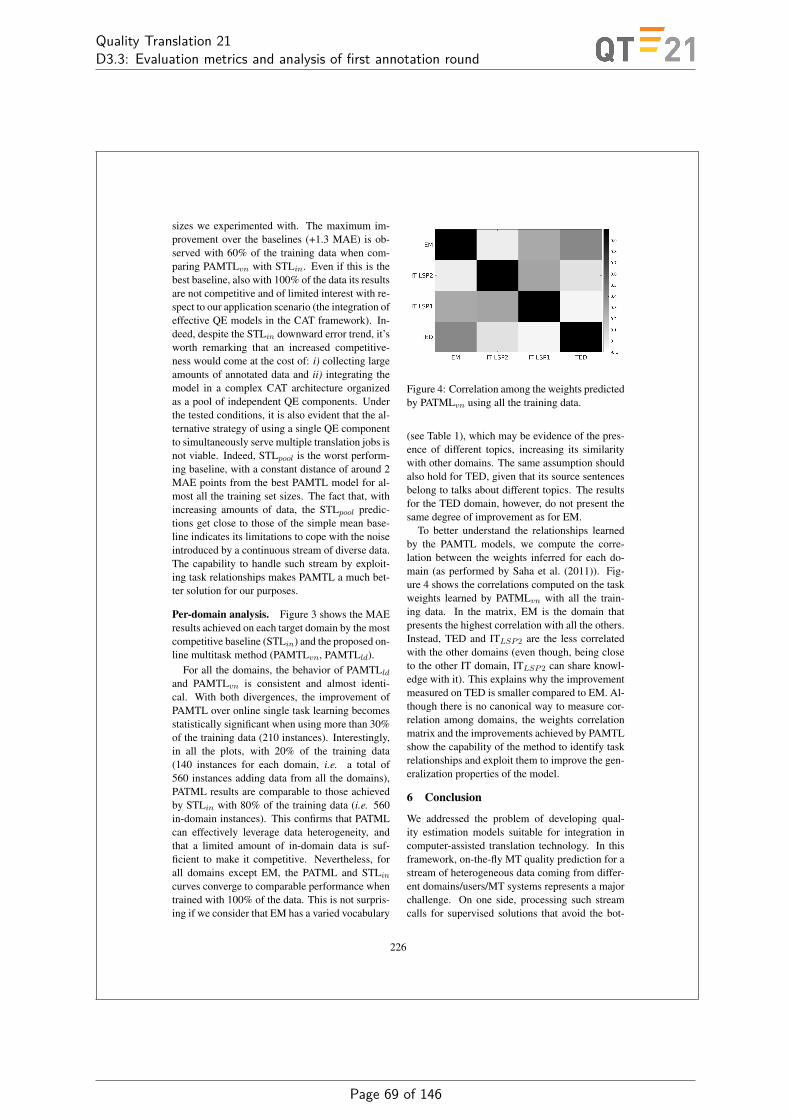
Quality Translation 21D3.3: Evaluation metrics and analysis of first annotation round
sizes we experimented with. The maximum im-provement over the baselines (+1.3 MAE) is ob-served with 60% of the training data when com-paring PAMTLvn with STLin. Even if this is thebest baseline, also with 100% of the data its resultsare not competitive and of limited interest with re-spect to our application scenario (the integration ofeffective QE models in the CAT framework). In-deed, despite the STLin downward error trend, it’sworth remarking that an increased competitive-ness would come at the cost of: i) collecting largeamounts of annotated data and ii) integrating themodel in a complex CAT architecture organizedas a pool of independent QE components. Underthe tested conditions, it is also evident that the al-ternative strategy of using a single QE componentto simultaneously serve multiple translation jobs isnot viable. Indeed, STLpool is the worst perform-ing baseline, with a constant distance of around 2MAE points from the best PAMTL model for al-most all the training set sizes. The fact that, withincreasing amounts of data, the STLpool predic-tions get close to those of the simple mean base-line indicates its limitations to cope with the noiseintroduced by a continuous stream of diverse data.The capability to handle such stream by exploit-ing task relationships makes PAMTL a much bet-ter solution for our purposes.
Per-domain analysis. Figure 3 shows the MAEresults achieved on each target domain by the mostcompetitive baseline (STLin) and the proposed on-line multitask method (PAMTLvn, PAMTLld).
For all the domains, the behavior of PAMTLldand PAMTLvn is consistent and almost identi-cal. With both divergences, the improvement ofPAMTL over online single task learning becomesstatistically significant when using more than 30%of the training data (210 instances). Interestingly,in all the plots, with 20% of the training data(140 instances for each domain, i.e. a total of560 instances adding data from all the domains),PATML results are comparable to those achievedby STLin with 80% of the training data (i.e. 560in-domain instances). This confirms that PATMLcan effectively leverage data heterogeneity, andthat a limited amount of in-domain data is suf-ficient to make it competitive. Nevertheless, forall domains except EM, the PATML and STLincurves converge to comparable performance whentrained with 100% of the data. This is not surpris-ing if we consider that EM has a varied vocabulary
Figure 4: Correlation among the weights predictedby PATMLvn using all the training data.
(see Table 1), which may be evidence of the pres-ence of different topics, increasing its similaritywith other domains. The same assumption shouldalso hold for TED, given that its source sentencesbelong to talks about different topics. The resultsfor the TED domain, however, do not present thesame degree of improvement as for EM.
To better understand the relationships learnedby the PAMTL models, we compute the corre-lation between the weights inferred for each do-main (as performed by Saha et al. (2011)). Fig-ure 4 shows the correlations computed on the taskweights learned by PATMLvn with all the train-ing data. In the matrix, EM is the domain thatpresents the highest correlation with all the others.Instead, TED and ITLSP2 are the less correlatedwith the other domains (even though, being closeto the other IT domain, ITLSP2 can share knowl-edge with it). This explains why the improvementmeasured on TED is smaller compared to EM. Al-though there is no canonical way to measure cor-relation among domains, the weights correlationmatrix and the improvements achieved by PAMTLshow the capability of the method to identify taskrelationships and exploit them to improve the gen-eralization properties of the model.
6 Conclusion
We addressed the problem of developing qual-ity estimation models suitable for integration incomputer-assisted translation technology. In thisframework, on-the-fly MT quality prediction for astream of heterogeneous data coming from differ-ent domains/users/MT systems represents a majorchallenge. On one side, processing such streamcalls for supervised solutions that avoid the bot-
226
Page 69 of 146

Quality Translation 21D3.3: Evaluation metrics and analysis of first annotation round
tleneck of periodically retraining the QE modelsin a batch fashion. On the other side, handlingdata heterogeneity requires the capability to lever-age data similarities and dissimilarities. Whileprevious works addressed these two problems inisolation, by proposing approaches respectivelybased on online and multitask learning, our so-lution unifies the two paradigms in a single on-line multitask approach. To this aim, we devel-oped a novel regression algorithm, filling a gapleft by current online multitask learning methodsthat only operate in classification mode. Our ap-proach, which is based on the passive aggressivealgorithm, has been successfully evaluated againststrong online single-task competitors in a scenarioinvolving four domains. Our future objective isto extend our evaluation to streams of data com-ing from a larger number of domains. Findingreasonably-sized datasets for this purpose is cur-rently difficult. However, we are confident that thegradual shift of the translation industry towardshuman MT post-editing will not only push for fur-ther research on these problems, but also providedata for larger scale evaluations in a short time.
To allow for replicability of our results andpromote further research on QE, the features ex-tracted from our data, the computed labels andthe source code of the method are available athttps://github.com/jsouza/pamtl.
Acknowledgements
This work has been partially supported by the EC-funded H2020 project QT21 (grant agreement no.645452). The authors would like to thank Dr.Ventsislav Zhechev for his support with the Au-todesk Post-Editing Data corpus.
ReferencesAndreas Argyriou, Theodoros Evgeniou, and Massim-
iliano Massimo Pontil. 2008. Convex multi-taskfeature learning. Machine Learning, 73(3):243–272, January.
Nguyen Bach, F. Huang, and Y. Al-Onaizan. 2011.Goodness: A method for measuring machine trans-lation confidence. In 49th Annual Meeting of theAssociation for Computational Linguistics.
Ondrej Bojar, Christian Buck, Chris Callison-Burch,Christian Federmann, Barry Haddow, PhilippKoehn, Christof Monz, Matt Post, Radu Soricut, andLucia Specia. 2013. Findings of the 2013 Work-shop on Statistical Machine Translation. In Eighth
Workshop on Statistical Machine Translation, pages1–44, Sofia, Bulgaria, August.
Ondrej Bojar, Christian Buck, Christian Federmann,Barry Haddow, Philipp Koehn, Johannes Leveling,Christof Monz, Pavel Pecina, Matt Post, HerveSaint-Amand, Radu Soricut, Lucia Specia, and AlesTamchyna. 2014. Findings of the 2014 Workshopon Statistical Machine Translation. In Proceedingsof the Ninth Workshop on Statistical Machine Trans-lation, pages 12–58, Baltimore, USA, June.
Edwin Bonilla, Kian Ming Chai, and ChristopherWilliams. 2008. Multi-task Gaussian Process Pre-diction. In Advances in Neural Information Process-ing Systems 20: NIPS’08.
Chris Callison-Burch, Philipp Koehn, Christof Monz,Matt Post, Radu Soricut, and Lucia Specia. 2012.Findings of the 2012 Workshop on Statistical Ma-chine Translation. In Proceedings of the 7th Work-shop on Statistical Machine Translation, pages 10–51, Montreal, Canada, June.
Rich Caruana. 1997. Multitask learning. In MachineLearning, pages 41–75.
Giovanni Cavallanti, N Cesa-Bianchi, and C Gentile.2010. Linear algorithms for online multitask clas-sification. The Journal of Machine Learning Re-search, 11:2901–2934.
Trevor Cohn and Lucia Specia. 2013. ModellingAnnotator Bias with Multi-task Gaussian Processes:An application to Machine Translation Quality Es-timation. In Proceedings of the 51st Annual Meet-ing of the Association for Computational Linguis-tics, pages 32–42, Sofia, Bulgaria, August.
Koby Crammer, Ofer Dekel, Joseph Keshet, ShaiShalev-Shwartz, and Yoram Singer. 2006. OnlinePassive-Aggressive Algorithms. The Journal of Ma-chine Learning Research, 7:551–585.
Jose G. C. de Souza, Marco Turchi, and Matteo Ne-gri. 2014a. Machine Translation Quality Estima-tion Across Domains. In Proceedings of COLING2014, the 25th International Conference on Compu-tational Linguistics: Technical Papers, pages 409–420, Dublin, Ireland, August.
Jose G. C. de Souza, Marco Turchi, and Matteo Negri.2014b. Towards a Combination of Online and Mul-titask Learning for MT Quality Estimation: a Pre-liminary Study. In Proceedings of Workshop on In-teractive and Adaptive Machine Translation in 2014(IAMT 2014), Vancouver, BC, Canada, October.
Eric Eaton and PL Ruvolo. 2013. ELLA: An efficientlifelong learning algorithm. In Proceedings of the30th International Conference on Machine Learn-ing, pages 507–515, Atlanta, Georgia, USA, June.
Marcello Federico, Nicola Bertoldi, Mauro Cettolo,Matteo Negri, Marco Turchi, Marco Trombetti,Alessandro Cattelan, Antonio Farina, Domenico
227
Page 70 of 146

Quality Translation 21D3.3: Evaluation metrics and analysis of first annotation round
Lupinetti, Andrea Martines, Alberto Massidda, Hol-ger Schwenk, Loıc Barrault, Frederic Blain, PhilippKoehn, Christian Buck, and Ulrich Germann. 2014.THE MATECAT TOOL. In Proceedings of COL-ING 2014, the 25th International Conference onComputational Linguistics: System Demonstrations,pages 129–132, Dublin, Ireland, August.
Fei Huang, Jian-Ming Xu, Abraham Ittycheriah, andSalim Roukos. 2014. Adaptive HTER Estimationfor Document-Specific MT Post-Editing. In Pro-ceedings of the 52nd Annual Meeting of the Asso-ciation for Computational Linguistics (Volume 1:Long Papers), pages 861–870, Baltimore, Maryland,June.
Laurent Jacob, Jean-philippe Vert, Francis R Bach, andJean-philippe Vert. 2009. Clustered Multi-TaskLearning: A Convex Formulation. In D Koller,D Schuurmans, Y Bengio, and L Bottou, editors,Advances in Neural Information Processing Systems21, pages 745–752. Curran Associates, Inc.
Philipp Koehn, Hieu Hoang, Alexandra Birch, ChrisCallison-Burch, Marcello Federico, Nicola Bertoldi,Brooke Cowan, Wade Shen, Christine Moran,Richard Zenz, Chris Dyer, Ondrej Bojar, AlexandraConstantin, and Evan Herbst. 2007. Moses: Opensource toolkit for statistical machine translation. InACL 2007 Demo and Poster Sessions, pages 177–180, Prague, Czech Republic, June.
Yashar Mehdad, Matteo Negri, and Marcello Fed-erico. 2012. Match without a Referee: Eval-uating MT Adequacy without Reference Transla-tions. In Proceedings of the Machine TranslationWorkshop (WMT2012), pages 171–180, Montreal,Canada, June.
Francesco Parrella. 2007. Online support vector re-gression. Master’s Thesis, Department of Informa-tion Science, University of Genoa, Italy.
Raphael Rubino, Jose G. C. de Souza, and Lucia Spe-cia. 2013. Topic Models for Translation QualityEstimation for Gisting Purposes. In Machine Trans-lation Summit XIV, pages 295–302.
Paul Ruvolo and Eric Eaton. 2014. Online Multi-TaskLearning via Sparse Dictionary Optimization. InProceedings of the 28th AAAI Conference on Arti-ficial Intelligence (AAAI-14), Quebec City, Quebec,Canada, July.
Avishek Saha, Piyush Rai, Hal Daume, and SureshVenkatasubramanian. 2011. Online Learning ofMultiple Tasks and their Relationships. In Proceed-ings of the 14th International Conference on Ar-tificial Intelligence and Statistics (AISTATS), FortLauderdale, FL, USA, April.
Kashif Shah, Marco Turchi, and Lucia Specia. 2014.An Efficient and User-friendly Tool for MachineTranslation Quality Estimation. In Proceedings ofthe Ninth International Conference on Language Re-sources and Evaluation, Reykjavik, Iceland, May.
Matthew Snover, Bonnie Dorr, Richard Schwartz, Lin-nea Micciulla, and John Makhoul. 2006. A Studyof Translation Edit Rate with Targeted Human An-notation. In Association for Machine Translation inthe Americas, Cambridge, MA, USA, August.
Radu Soricut and A Echihabi. 2010. Trustrank: In-ducing trust in automatic translations via ranking. InProceedings of the 48th Annual Meeting of the Asso-ciation for Computational Linguistics, number July,pages 612–621.
Lucia Specia, Nicola Cancedda, Marc Dymetman,Marco Turchi, and Nello Cristianini. 2009. Estimat-ing the Sentence-Level Quality of Machine Transla-tion Systems. In Proceedings of the 13th AnnualConference of the EAMT, pages 28–35, Barcelona,Spain, May.
Koji Tsuda, Gunnar Ratsch, and Manfred K Warmuth.2005. Matrix exponentiated gradient updates for on-line learning and bregman projection. In Journal ofMachine Learning Research, pages 995–1018.
Marco Turchi, Matteo Negri, and Marcello Federico.2013. Coping with the Subjectivity of HumanJudgements in MT Quality Estimation. In Proceed-ings of the Eighth Workshop on Statistical MachineTranslation (WMT), pages 240–251, Sofia, Bulgaria,August.
Marco Turchi, Antonios Anastasopoulos, Jose G. C. deSouza, and Matteo Negri. 2014. Adaptive Qual-ity Estimation for Machine Translation. In Proceed-ings of the 52nd Annual Meeting of the Associationfor Computational Linguistics (Volume 1: Long Pa-pers), pages 710–720, Baltimore, Maryland, USA,June.
Guillaume Wisniewski, Anil Kumar Singh, Natalia Se-gal, and Francois Yvon. 2013. Design and Anal-ysis of a Large Corpus of Post-Edited Translations:Quality Estimation, Failure Analysis and the Vari-ability of Post-Edition. In Machine TranslationSummit XIV, pages 117–124.
Yan Yan, Elisa Ricci, Ramanathan Subramanian,Gaowen Liu, and Nicu Sebe. 2014. Multitask lin-ear discriminant analysis for view invariant actionrecognition. IEEE Transactions on Image Process-ing, 23(12):5599–5611.
Yu Zhang and Dit-yan Yeung. 2010. A Convex Formu-lation for Learning Task Relationships in Multi-TaskLearning. In Proceedings of the Twenty-Sixth Con-ference Annual Conference on Uncertainty in Artifi-cial Intelligence (UAI-10), pages 733–742, CatalinaIsland, CA, USA, July.
Leon Wenliang Zhong and James T. Kwok. 2012.Convex multitask learning with flexible task clus-ters. In Proceedings of the 29 th International Con-ference on Machine Learning, Edinburgh, Scotland,June.
228
Page 71 of 146
Quality Translation 21D3.3: Evaluation metrics and analysis of first annotation round
G CobaltF: A Fluent Metric for MT Evaluation
Proceedings of the First Conference on Machine Translation, Volume 2: Shared Task Papers, pages 483–490,Berlin, Germany, August 11-12, 2016. c©2016 Association for Computational Linguistics
CobaltF: A Fluent Metric for MT Evaluation
Marina Fomicheva, Nuria BelIULA, Universitat Pompeu Fabra
Lucia SpeciaUniversity of Sheffield, UK
Iria da CunhaUniv. Nacional de Educacion a Distancia
Anton MalinovskiyNuroa Internet S. L.
Abstract
The vast majority of Machine Transla-tion (MT) evaluation approaches are basedon the idea that the closer the MT out-put is to a human reference translation,the higher its quality. While translationquality has two important aspects, ade-quacy and fluency, the existing reference-based metrics are largely focused on theformer. In this work we combine ourmetric UPF-Cobalt, originally presented atthe WMT15 Metrics Task, with a numberof features intended to capture translationfluency. Experiments show that the inte-gration of fluency-oriented features signif-icantly improves the results, rivalling thebest-performing evaluation metrics on theWMT15 data.
1 Introduction
Automatic evaluation plays an instrumental rolein the development of Machine Translation (MT)systems. It is aimed at providing fast, inexpensive,and objective numerical measurements of trans-lation quality. As a cost-effective alternative tomanual evaluation, the main concern of automaticevaluation metrics is to accurately approximatehuman judgments.
The vast majority of evaluation metrics arebased on the idea that the closer the MT outputis to a human reference translation, the higher itsquality. The evaluation task, therefore, is typicallyapproached by measuring some kind of similar-ity between the MT (also called candidate trans-lation) and a reference translation. The mostwidely used evaluation metrics, such as BLEU(Papineni et al., 2002), follow a simple strategyof counting the number of matching words orword sequences in the candidate and reference
translations. Despite its wide use and practicalutility, automatic evaluation based on a straight-forward candidate-reference comparison has longbeen criticized for its low correlation with humanjudgments at sentence-level (Callison-Burch andOsborne, 2006).
The core aspects of translation quality are fi-delity to the source text (or adequacy, in MT par-lance) and acceptability (also termed fluency) re-garding the target language norms and conventions(Toury, 2012). Depending on the purpose and in-tended use of the MT, manual evaluation can beperformed in a number of different ways. How-ever, in any setting both adequacy and fluencyshape human perception of the overall translationquality.
By contrast, automatic reference-based metricsare largely focused on MT adequacy, as they donot evaluate the appropriateness of the translationin the context of the target language. Translationfluency is thus assessed only indirectly, throughthe comparison with the reference. However,the difference from a particular human translationdoes not imply that the MT output is disfluent(Fomicheva et al., 2015a).
We propose to explicitly model translation flu-ency in reference-based MT evaluation. To thisend, we develop a number of features represent-ing translation fluency and integrate them with ourreference-based metric UPF-Cobalt, which wasoriginally presented at WMT15 (Fomicheva et al.,2015b). Along with the features based on thetarget Language Model (LM) probability of theMT output, which have been widely used in therelated fields of speech recognition (Uhrik andWard, 1997) and quality estimation (Specia et al.,2009), we design a more detailed representation ofMT fluency that takes into account the number ofdisfluent segments observed in the candidate trans-lation. We test our approach with the data avail-
483
Page 72 of 146
Quality Translation 21D3.3: Evaluation metrics and analysis of first annotation round
able from WMT15 Metrics Task and obtain verypromising results, which rival the best-performingsystem submissions. We have also submitted themetric to the WMT16 Metrics Task.
2 Related Work
The recent advances in the field of MT evaluationhave been largely directed to improving the infor-mativeness and accuracy of candidate-referencecomparison. Meteor (Denkowski and Lavie, 2014)allows for stem, synonym and paraphrase matches,thus addressing the problem of acceptable lin-guistic variation at lexical level. Other metricsmeasure syntactic (Liu and Gildea, 2005), seman-tic (Lo et al., 2012) or even discourse similarity(Guzman et al., 2014) between candidate and ref-erence translations. Further improvements havebeen recently achieved by combining these par-tial measurements using different strategies in-cluding machine learning techniques (Comelles etal., 2012; Gimenez and Marquez, 2010b; Guzmanet al., 2014; Yu et al., 2015). However, none of theabove approaches explicitly addresses the fluencyof the MT output.
Predicting MT quality with respect to the targetlanguage norms has been investigated in a differ-ent evaluation scenario, when human translationsare not available as benchmark. This task, referredto as confidence or quality estimation, is aimed atMT systems in use and therefore has no access toreference translations (Specia et al., 2010).
Quality estimation can be performed at differentlevels of granularity. Sentence-level quality esti-mation (Specia et al., 2009; Blatz et al., 2004) isaddressed as a supervised machine learning taskusing a variety of algorithms to induce modelsfrom examples of MT sentences annotated withquality labels. In the word-level variant of thistask, each word in the MT output is to be judgedas correct or incorrect (Luong et al., 2015; Bach etal., 2011), or labelled for a specific error type.
Research in the field of quality estimation is fo-cused on the design of features and the selectionof appropriate learning schemes to predict transla-tion quality, using source sentences, MT outputs,internal MT system information and source andtarget language corpora. In particular, featuresthat measure the probability of the MT outputwith respect to a target LM, thus capturing trans-lation fluency, have demonstrated highly compet-itive performance in a variety of settings (Shah et
al., 2013).Both translation evaluation and quality estima-
tion aim to evaluate MT quality. Surprisingly,there have been very few attempts at joining theinsights from these two related tasks. A notableexception is the work by Specia and Gimenez(2010), who explore the combination of a largeset of quality estimation features extracted fromthe source sentence and the candidate translation,as well as the source-candidate alignment infor-mation, with a set of 52 MT evaluation met-rics from the Asiya Toolkit (Gimenez andMarquez, 2010a). They report a significant im-provement over the reference-based evaluationsystems on the task of predicting human post-editing effort. We follow this line of research byfocusing specifically on integrating fluency infor-mation into reference-based evaluation.
3 UPF-Cobalt Review
UPF-Cobalt1 is an alignment-based evaluationmetric. Following the strategy introduced by thewell known Meteor (Denkowski and Lavie, 2014),UPF-Cobalt’s score is based on the number ofaligned words with different levels of lexical sim-ilarity. The most important feature of the metricis a syntactically informed context penalty aimedat penalizing the matches of similar words thatplay different roles in the candidate and referencesentences. The metric has achieved highly com-petitive results on the data from previous WMTtasks, showing that the context penalty allows tobetter discriminate between acceptable candidate-reference differences and the differences incurredby MT errors (Fomicheva et al., 2015b). Below webriefly review the main components of the metric.For a detailed description of the metric the readeris referred to (Fomicheva and Bel, 2016).
3.1 Alignment
The alignment module of UPF-Cobalt builds onan existing system – Monolingual Word Aligner(MWA), which has been shown to significantlyoutperform state-of-the-art results for monolin-gual alignment (Sultan et al., 2014). We in-crease the coverage of the aligner by compar-ing distributed word representations as an ad-ditional source of lexical similarity information,
1The metric is freely available for download athttps://github.com/amalinovskiy/upf-cobalt.
484
Page 73 of 146

Quality Translation 21D3.3: Evaluation metrics and analysis of first annotation round
which allows to detect cases of quasi-synonyms(Fomicheva and Bel, 2016).
3.2 Scoring
UPF-Cobalt’s sentence-level score is a weightedcombination of precision and recall over the sumof the individual scores computed for each pair ofaligned words. The word-level score for a pair ofaligned words (t, r) in the candidate and referencetranslations is based on their lexical similarity(LexSim) and a context penalty which measuresthe difference in their syntactic contexts (CP ):
score(t, r) = LexSim(t, r)− CP (t, r)
Lexical similarity is defined based on the typeof lexical match (exact match, stem match, syn-onyms, etc.)2 (Denkowski and Lavie, 2014). Thecrucial component of the metric is the contextpenalty, which is applied at word-level to iden-tify the cases where the words are aligned (i.e.lexically similar) but play different roles in thecandidate and reference translations and thereforeshould contribute less to the sentence-level score.Thus, for each pair of aligned words, the wordsthat constitute their syntactic contexts are com-pared. The syntactic context of a word is definedas its head and dependent nodes in a dependencygraph. The context penalty (CP ) is computed asfollows:
CP (t, r) =
∑1..i w(C
∗i )∑
1..i w(Ci)× ln
(∑
1..i
w(Ci) + 1
)
where w refers to the weights that reflect the rel-ative importance of the dependency functions ofthe context words, C refers to the words that be-long to the syntactic context of the word r andC∗i refers to the context words that are not equiv-
alent.3 For the words to be equivalent two con-ditions are required to be met: a) they must bealigned and b) they must be found in the sameor equivalent syntactic relation with the word r.The context penalty is calculated for both candi-date and reference words. The metric computesan average between reference-side context penaltyand candidate-side context penalty for each word
2Specifically, the values for different types of lexical sim-ilarity are: same word forms - 1.0, lemmatizing or stemming- 0.9, WordNet synsets - 0.8, paraphrase database - 0.6 anddistributional similarity - 0.5.
3The weights w are: argument/complement functions -1.0, modifier functions - 0.8 and specifier/auxiliary functions- 0.2.
pair. The sentence-level average can be obtainedin a straightforward way from the word-level val-ues (we use it as a feature in the decomposed ver-sion of the metric below).
4 Approach
In this paper we learn an evaluation metric thatcombines a series of adequacy-oriented featuresextracted from the reference-based metric UPF-Cobalt with various features intended to focus ontranslation fluency. This section first describesthe metric-based features used in our experimentsand then the selection and design of our fluency-oriented features.
4.1 Adequacy-oriented FeaturesUPF-Cobalt incorporates in a single score variousdistinct MT characteristics (lexical choice, wordorder, grammar issues, such as wrong word formsor wrong choice of function words, etc.). Wenote that these components can be related, to acertain extent, to the aspects of translation qual-ity being discussed in this paper. The syntacticcontext penalty of UPF-Cobalt is affected by thewell-formedness of the MT output, and may re-flect, although indirectly, grammaticality and flu-ency, whereas the proportion of aligned words de-pends on the correct lexical choice.
Using the components of the metric instead ofthe scores yields a more fine-grained representa-tion of the MT output. We explore this idea in ourexperiments by designing a decomposed versionof UPF-Cobalt. More specifically, we use 48 fea-tures (grouped below for space reasons):
• Percentage and number of aligned words inthe candidate and reference translations
• Percentage and number of aligned wordswith different levels of lexical similarity inthe candidate and reference translations
• Percentage and number of aligned functionand content words in the candidate and ref-erence translations
• Minimum, maximum and average contextpenalty
• Percentage and number of words with highcontext penalty4
• Number of words in the candidate and refer-ence translations
4These are words with the context penalty value higherthan the average computed on the training set used in ourexperiments.
485
Page 74 of 146

Quality Translation 21D3.3: Evaluation metrics and analysis of first annotation round
4.2 Fluency-oriented FeaturesWe suggest that the fluency aspect of transla-tion quality has been overlooked in the reference-based MT evaluation. Even though syntactically-informed metrics capture structural differencesand are, therefore, assumed to account for gram-matical errors, we note that the distinction be-tween adequacy and fluency is not limited to gram-matical issues and thus exists at all linguistic lev-els. For instance, at lexical level, the choice ofa particular word or expression may be similar inmeaning to the one present in the reference (ad-equacy), but awkward or even erroneous if con-sidered in the context of the norms of the targetlanguage use. Conversely, due to the variabilityof linguistic expression, neither lexical nor syntac-tic differences from a particular human translationimply ill-formedness of the MT output.
Sentence fluency can be described in terms ofthe frequencies of the words with respect to atarget LM. Here, in addition to the LM-basedfeatures that have been shown to perform wellfor sentence-level quality estimation (Shah et al.,2013), we introduce more complex features de-rived from word-level n-gram statistics. Besidesthe word-based representation, we rely on Part-of-Speech (PoS) tags. As suggested by (Felice andSpecia, 2012), morphosyntactic information canbe a good indicator of ill-formedness in MT out-puts.
First, we select 16 simple sentence-level fea-tures from previous work (Felice and Specia,2012; Specia et al., 2010), summarized below.
• Number of words in the candidate translation• LM probability and perplexity of the candi-
date translation• LM probability of the candidate translation
with respect to an LM trained on a corpus ofPoS tags of words
• Percentage and number of content/functionwords
• Percentage and number of verbs, nouns andadjectives
Essentially, these features average LM proba-bilities of the words to obtain a sentence-levelmeasurement. While being indeed predictive ofsentence-level translation fluency, they are not rep-resentative of the number and scale of the disfluentfragments contained in the MT sentence. More-over, if an ill-formed translation contains various
word combinations that have very high probabil-ity according to the LM, the overall sentence-levelLM score may be misleading.
To overcome the above limitations, we useword-level n-gram frequency measurements anddesign various features to extend them to the sen-tence level in a more informative way. We rely onLM backoff behaviour, as defined in (Raybaud etal., 2011). LM backoff behaviour is a score as-signed to the word according to how many timesthe target LM had to back-off in order to assigna probability to the word sequence. The intuitionbehind is that an n-gram not found in the LM canindicate a translation error. Specifically, the back-off behaviour value b(wi) for a wordwi in positioni of a sentence is defined as:
b(wi) =
7, if wi−2, wi−1, wi exists in the model6, if wi−2, wi−1and wi−1, wi both exist
in the model5, if only wi−1, wi exists in the model4, if only wi−2, wi−1and wi exist
separately in the model3, if wi−1and wi both exist
in the model2, if only wi exists in the model1, if wi is an out-of-vocabulary word
We compute this score for each word in the MToutput and then use the mean, median, mode, min-imum and maximum of the backoff behaviour val-ues as separate sentence-level features. Also, wecalculate the percentage and number of words withlow backoff behaviour values (< 5) to approxi-mate the number of fluency errors in the MT out-put.
Furthermore, we introduce a separate featurethat counts the words with a backoff behaviourvalue of 1, i.e. the number of out-of-vocabulary(OOV) words. OOV words are indicative of thecases when source words are left untranslated inthe MT. Intuitively, this should be a strong indica-tor of low MT quality.
Finally, we note that UPF-Cobalt, not unlikethe majority of reference-based metrics, lacks in-formation regarding the MT words that are notaligned or matched to any reference word. Suchfragments do not necessarily constitute an MT er-ror, but may be due to acceptable linguistic varia-tions. Collecting fluency information specificallyfor these fragments may help to distinguish ac-ceptable variation from MT errors. If a candi-date word or phrase is absent from the reference
486
Page 75 of 146
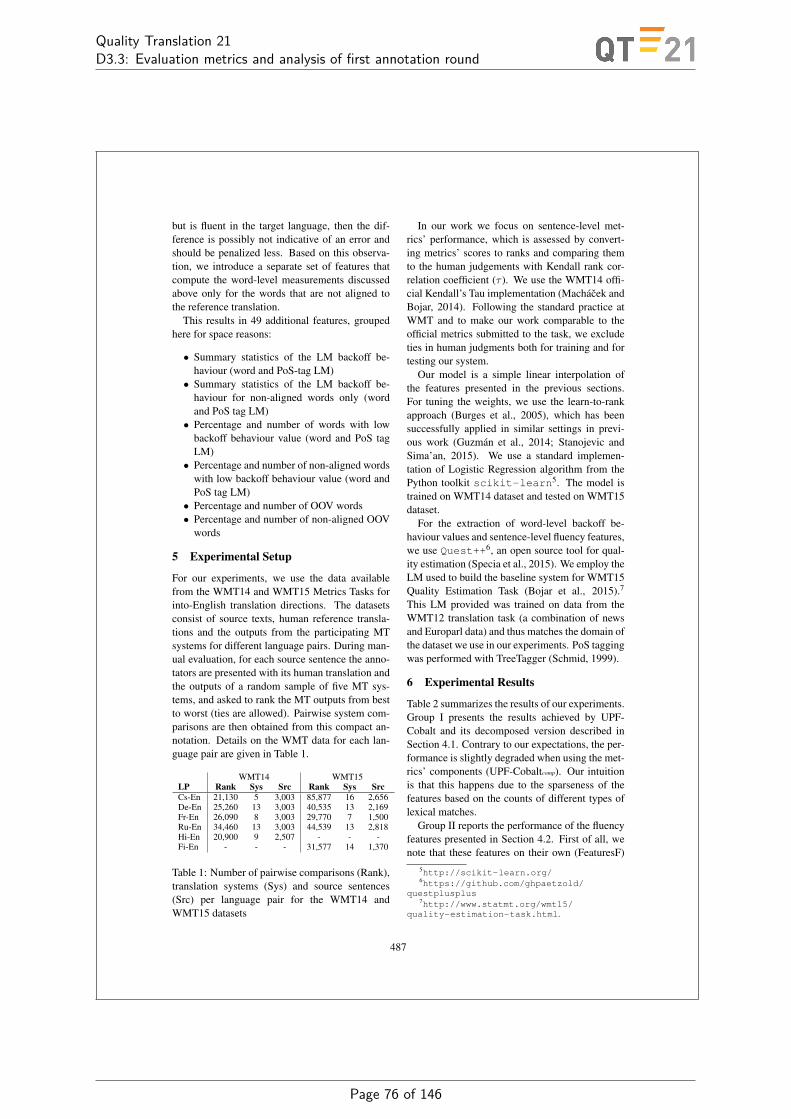
Quality Translation 21D3.3: Evaluation metrics and analysis of first annotation round
but is fluent in the target language, then the dif-ference is possibly not indicative of an error andshould be penalized less. Based on this observa-tion, we introduce a separate set of features thatcompute the word-level measurements discussedabove only for the words that are not aligned tothe reference translation.
This results in 49 additional features, groupedhere for space reasons:
• Summary statistics of the LM backoff be-haviour (word and PoS-tag LM)
• Summary statistics of the LM backoff be-haviour for non-aligned words only (wordand PoS tag LM)
• Percentage and number of words with lowbackoff behaviour value (word and PoS tagLM)
• Percentage and number of non-aligned wordswith low backoff behaviour value (word andPoS tag LM)
• Percentage and number of OOV words• Percentage and number of non-aligned OOV
words
5 Experimental Setup
For our experiments, we use the data availablefrom the WMT14 and WMT15 Metrics Tasks forinto-English translation directions. The datasetsconsist of source texts, human reference transla-tions and the outputs from the participating MTsystems for different language pairs. During man-ual evaluation, for each source sentence the anno-tators are presented with its human translation andthe outputs of a random sample of five MT sys-tems, and asked to rank the MT outputs from bestto worst (ties are allowed). Pairwise system com-parisons are then obtained from this compact an-notation. Details on the WMT data for each lan-guage pair are given in Table 1.
WMT14 WMT15LP Rank Sys Src Rank Sys SrcCs-En 21,130 5 3,003 85,877 16 2,656De-En 25,260 13 3,003 40,535 13 2,169Fr-En 26,090 8 3,003 29,770 7 1,500Ru-En 34,460 13 3,003 44,539 13 2,818Hi-En 20,900 9 2,507 - - -Fi-En - - - 31,577 14 1,370
Table 1: Number of pairwise comparisons (Rank),translation systems (Sys) and source sentences(Src) per language pair for the WMT14 andWMT15 datasets
In our work we focus on sentence-level met-rics’ performance, which is assessed by convert-ing metrics’ scores to ranks and comparing themto the human judgements with Kendall rank cor-relation coefficient (τ ). We use the WMT14 offi-cial Kendall’s Tau implementation (Machacek andBojar, 2014). Following the standard practice atWMT and to make our work comparable to theofficial metrics submitted to the task, we excludeties in human judgments both for training and fortesting our system.
Our model is a simple linear interpolation ofthe features presented in the previous sections.For tuning the weights, we use the learn-to-rankapproach (Burges et al., 2005), which has beensuccessfully applied in similar settings in previ-ous work (Guzman et al., 2014; Stanojevic andSima’an, 2015). We use a standard implemen-tation of Logistic Regression algorithm from thePython toolkit scikit-learn5. The model istrained on WMT14 dataset and tested on WMT15dataset.
For the extraction of word-level backoff be-haviour values and sentence-level fluency features,we use Quest++6, an open source tool for qual-ity estimation (Specia et al., 2015). We employ theLM used to build the baseline system for WMT15Quality Estimation Task (Bojar et al., 2015).7
This LM provided was trained on data from theWMT12 translation task (a combination of newsand Europarl data) and thus matches the domain ofthe dataset we use in our experiments. PoS taggingwas performed with TreeTagger (Schmid, 1999).
6 Experimental Results
Table 2 summarizes the results of our experiments.Group I presents the results achieved by UPF-Cobalt and its decomposed version described inSection 4.1. Contrary to our expectations, the per-formance is slightly degraded when using the met-rics’ components (UPF-Cobaltcomp). Our intuitionis that this happens due to the sparseness of thefeatures based on the counts of different types oflexical matches.
Group II reports the performance of the fluencyfeatures presented in Section 4.2. First of all, wenote that these features on their own (FeaturesF)
5http://scikit-learn.org/6https://github.com/ghpaetzold/
questplusplus7http://www.statmt.org/wmt15/
quality-estimation-task.html.
487
Page 76 of 146

Quality Translation 21D3.3: Evaluation metrics and analysis of first annotation round
Metric cs-en de-en fi-en fr-en ru-en Avg τI UPF-Cobalt .457±.011 .427±.011 .437±.011 .386±.011 .402±.011 .422±.011
UPF-Cobaltcomp .442±.011 .418±.011 .428±.011 .387±.011 .388±.011 .413±.012II FeaturesF .373±.011 .337±.011 .359±.011 .267±.011 .263±.011 .320±.011
CobaltFsimple .487±.011 .445±.011 .455±.011 .401±.011 .395±.011 .437±.012CobaltFcomp .481±.011 .438±.011 .464±.011 .403±.011 .395±.011 .436±.011
MetricsF .502±.011 .457±.011 .450±.011 .413±.011 .410±.011 .447±.011III DPMFcomb .495±.011 .482±.011 .445±.011 .395±.011 .418±.011 .447±.011
BEER Treepel .471±.011 .447±.011 .438±.011 .389±.011 .403±.011 .429±.011RATATOUILLE .472±.011 .441±.011 .421±.011 .398±.011 .393±.011 .425±.010
IV BLEU .391±.011 .360±.011 .308±.011 .358±.011 .329±.011 .349±.011Meteor .439±.011 .422±.011 .406±.011 .380±.011 .386±.011 .407±.012
Table 2: Sentence-level evaluation results for WMT15 dataset in terms of Kendall rank correlation coef-ficient (τ )
achieve a reasonable correlation with human judg-ments, showing that fluency information is oftensufficient to compare the quality of two candidatetranslations. Secondly, fluency features yield asignificant improvement when used together withthe metrics’ score (CobaltFsimple) or with the com-ponents of the metric (CobaltFcomp). We furtherboost the performance by combining the scores ofthe metrics BLEU, Meteor and UPF-Cobalt withour fluency features (MetricsF).
The results demonstrate that fluency featuresprovide useful information regarding the overalltranslation quality, which is not fully capturedby the standard candidate-reference comparison.These features are discriminative when the rela-tionship to the reference does not provide enoughinformation to distinguish between the quality oftwo alternative candidate translations. For exam-ple, it may well be the case that both MT outputsare very different from human reference, but oneconstitutes a valid alternative translation, while theother is totally unacceptable.
Finally, Groups III and VI contain the resultsof the best-performing evaluation systems fromthe WMT15 Metrics Task, as well as the baselineBLEU metric (Papineni et al., 2002) and a strongcompetitor, Meteor (Denkowski and Lavie, 2014),which we reproduce here for the sake of compar-ison. DPMFComb (Yu et al., 2015) and RATA-TOUILLE (Marie and Apidianaki, 2015) use alearnt combination of the scores from differentevaluation metrics, while BEER Treepel (Stanoje-vic and Sima’an, 2015) combines word matching,word order and syntax-level features. We note thatthe number and complexity of the metrics used inthe above approaches is quite high. For instance,DPMFComb is based on 72 separate evaluationsystems, including the resource-heavy linguistic
metrics from the Asiya Toolkit (Gimenez andMarquez, 2010a).
7 Conclusions
The performance of reference-based MT evalua-tion metrics is limited by the fact that dissimilari-ties from a particular human translation do not al-ways indicate bad MT quality. In this paper weproposed to amend this issue by integrating trans-lation fluency in the evaluation. This aspect deter-mines how well a translated text conforms to thelinguistic regularities of the target language andconstitutes a strong predictor of the overall MTquality.
In addition to the LM-based features developedin the field of quality estimation, we designed amore fine-grained representation of translation flu-ency, which in combination with our reference-based evaluation metric UPF-Cobalt yields ahighly competitive performance for the predictionof pairwise preference judgments. The results ofour experiments thus confirm that the integrationof features intended to address translation fluencyimproves reference-based MT evaluation.
In the future we plan to investigate the perfor-mance of fluency features for the modelling ofother types of manual evaluation, such as absolutescoring.
Acknowledgments
This work was partially funded by TUNER(TIN2015-65308-C5-5-R) and MINECO/FEDER,UE. Marina Fomicheva was supported by fundingfrom the FI-DGR grant program of the General-itat de Catalunya. Iria da Cunha was supportedby a Ramon y Cajal contract (RYC-2014-16935).Lucia Specia was supported by the QT21 project(H2020 No. 645452).
488
Page 77 of 146
Quality Translation 21D3.3: Evaluation metrics and analysis of first annotation round
ReferencesNguyen Bach, Fei Huang, and Yaser Al-Onaizan.
2011. Goodness: A Method for Measuring MachineTranslation Confidence. In Proceedings of the 49thAnnual Meeting of the Association for Computa-tional Linguistics: Human Language Technologies-Volume 1, pages 211–219. Association for Compu-tational Linguistics (ACL).
John Blatz, Erin Fitzgerald, George Foster, SimonaGandrabur, Cyril Goutte, Alex Kulesza, AlbertoSanchis, and Nicola Ueffing. 2004. Confidence Es-timation for Machine Translation. In Proceedings ofthe 20th International Conference on ComputationalLinguistics, pages 315–321. ACL.
Ondrej Bojar, Rajen Chatterjee, Christian Federmann,Barry Haddow, Matthias Huck, Chris Hokamp,Philipp Koehn, Varvara Logacheva, Christof Monz,Matteo Negri, Matt Post, Carolina Scarton, LuciaSpecia, and Marco Turchi. 2015. Findings of the2015 Workshop on Statistical Machine Translation.In Proceedings of the Tenth Workshop on StatisticalMachine Translation, pages 1–46, Lisbon, Portugal,September. ACL.
Chris Burges, Tal Shaked, Erin Renshaw, Ari Lazier,Matt Deeds, Nicole Hamilton, and Greg Hullender.2005. Learning to Rank Using Gradient Descent. InProceedings of the 22nd international conference onMachine learning, pages 89–96. ACM.
Chris Callison-Burch and Miles Osborne. 2006. Re-evaluating the Role of BLEU in Machine Transla-tion Research. In In Proceedings of the EuropeanAssociation for Computational Linguistics (EACL),pages 249–256. ACL.
Elisabet Comelles, Jordi Atserias, Victoria Arranz, andIrene Castellon. 2012. VERTa: Linguistic Featuresin MT Evaluation. In Proceedings of the Interna-tional Conference on Language Resources and Eval-uation (LREC), pages 3944–3950.
Michael Denkowski and Alon Lavie. 2014. MeteorUniversal: Language Specific Translation Evalua-tion for any Target Language. In Proceedings of theNinth Workshop on Statistical Machine Translation,pages 376–380.
Mariano Felice and Lucia Specia. 2012. LinguisticFeatures for Quality Estimation. In Proceedings ofthe Seventh Workshop on Statistical Machine Trans-lation, pages 96–103. ACL.
Marina Fomicheva and Nuria Bel. 2016. Using Con-textual Information for Machine Translation Eval-uation. In Proceedings of the Tenth InternationalConference on Language Resources and Evaluation(LREC 2016), pages 2755–2761.
Marina Fomicheva, Nuria Bel, and Iria da Cunha.2015a. Neutralizing the Effect of Translation Shiftson Automatic Machine Translation Evaluation. InComputational Linguistics and Intelligent Text Pro-cessing, pages 596–607.
Marina Fomicheva, Nuria Bel, Iria da Cunha, and An-ton Malinovskiy. 2015b. UPF-Cobalt Submission toWMT15 Metrics Task. In Proceedings of the TenthWorkshop on Statistical Machine Translation, pages373–379.
Jesus Gimenez and Lluıs Marquez. 2010a. Asiya:An Open Toolkit for Automatic Machine Translation(Meta-)Evaluation. The Prague Bulletin of Mathe-matical Linguistics, (94):77–86.
Jesus Gimenez and Lluıs Marquez. 2010b. LinguisticMeasures for Automatic Machine Translation Eval-uation. Machine Translation, 24(3):209–240.
Francisco Guzman, Shafiq Joty, Lluıs Marquez, andPreslav Nakov. 2014. Using Discourse StructureImproves Machine Translation Evaluation. In ACL(1), pages 687–698.
Ding Liu and Daniel Gildea. 2005. Syntactic Featuresfor Evaluation of Machine Translation. In Proceed-ings of the ACL Workshop on Intrinsic and Extrin-sic Evaluation Measures for Machine Translationand/or Summarization, pages 25–32.
Chi-Kiu Lo, Anand Karthik Tumuluru, and Dekai Wu.2012. Fully Automatic Semantic MT Evaluation. InProceedings of the Seventh Workshop on StatisticalMachine Translation, pages 243–252. ACL.
Ngoc-Quang Luong, Laurent Besacier, and BenjaminLecouteux. 2015. Towards Accurate Predictorsof Word Quality for Machine Translation: LessonsLearned on French–English and English–SpanishSystems. Data & Knowledge Engineering, 96:32–42.
Matous Machacek and Ondrej Bojar. 2014. Results ofthe WMT14 Metrics Shared Task. In Proceedings ofthe Ninth Workshop on Statistical Machine Transla-tion, pages 293–301.
Benjamin Marie and Marianna Apidianaki. 2015.Alignment-based Sense Selection in METEOR andthe RATATOUILLE Recipe. In Proceedings of theTenth Workshop on Statistical Machine Translation,pages 385–391.
Kishore Papineni, Salim Roukos, Todd Ward, and Wei-Jing Zhu. 2002. BLEU: a Method for AutomaticEvaluation of Machine Translation. In Proceedingsof the 40th Annual Meeting of the ACL, pages 311–318. ACL.
Sylvain Raybaud, David Langlois, and Kamel Smaıli.2011. this sentence is wrong. detecting errors inmachine-translated sentences. Machine Translation,25(1):1–34.
Helmut Schmid. 1999. Improvements in part-of-speech tagging with an application to german. InNatural language processing using very large cor-pora, pages 13–25. Springer.
489
Page 78 of 146

Quality Translation 21D3.3: Evaluation metrics and analysis of first annotation round
Kashif Shah, Trevor Cohn, and Lucia Specia. 2013.An Investigation on the Effectiveness of Features forTranslation Quality Estimation. In Proceedings ofthe Machine Translation Summit, volume 14, pages167–174.
Lucia Specia and Jesus Gimenez. 2010. CombiningConfidence Estimation and Reference-based Metricsfor Segment-level MT Evaluation. In The NinthConference of the Association for Machine Trans-lation in the Americas.
Lucia Specia, Marco Turchi, Nicola Cancedda, MarcDymetman, and Nello Cristianini. 2009. Estimatingthe Sentence-level Quality of Machine TranslationSystems. In 13th Conference of the European Asso-ciation for Machine Translation, pages 28–37.
Lucia Specia, Dhwaj Raj, and Marco Turchi. 2010.Machine Translation Evaluation versus Quality Es-timation. Machine Translation, 24(1):39–50.
Lucia Specia, Gustavo Paetzold, and Carolina Scar-ton. 2015. Multi-level Translation Quality Predic-tion with QuEst++. In 53rd Annual Meeting of theAssociation for Computational Linguistics and Sev-enth International Joint Conference on Natural Lan-guage Processing of the Asian Federation of Natu-ral Language Processing: System Demonstrations,pages 115–120.
Milos Stanojevic and Khalil Sima’an. 2015. BEER1.1: ILLC UvA Submission to Metrics and TuningTask. In Proceedings of the Tenth Workshop on Sta-tistical Machine Translation, pages 396–401.
Md Arafat Sultan, Steven Bethard, and Tamara Sum-ner. 2014. Back to Basics for Monolingual Align-ment: Exploiting Word Similarity and ContextualEvidence. Transactions of the ACL, 2:219–230.
Gideon Toury. 2012. Descriptive Translation Stud-ies and beyond: Revised edition, volume 100. JohnBenjamins Publishing.
C. Uhrik and W. Ward. 1997. Confidence MetricsBased on N-gram Language Model Backoff Behav-iors. In Proceedings of Fifth European Conferenceon Speech Communication and Technology, pages2771–2774.
Hui Yu, Qingsong Ma, Xiaofeng Wu, and Qun Liu.2015. CASICT-DCU Participation in WMT2015Metrics Task. In Proceedings of the Tenth Workshopon Statistical Machine Translation, pages 417–421.
490
Page 79 of 146
Quality Translation 21D3.3: Evaluation metrics and analysis of first annotation round
H Reference Bias in Monolingual Machine Translation Evaluation
Proceedings of the 54th Annual Meeting of the Association for Computational Linguistics, pages 77–82,Berlin, Germany, August 7-12, 2016. c©2016 Association for Computational Linguistics
Reference Bias in Monolingual Machine Translation Evaluation
Marina FomichevaInstitute for Applied LinguisticsPompeu Fabra University, Spain
Lucia SpeciaDepartment of Computer Science
University of Sheffield, [email protected]
Abstract
In the translation industry, human transla-tions are assessed by comparison with thesource texts. In the Machine Translation(MT) research community, however, it isa common practice to perform quality as-sessment using a reference translation in-stead of the source text. In this paper weshow that this practice has a serious issue– annotators are strongly biased by the ref-erence translation provided, and this canhave a negative impact on the assessmentof MT quality.
1 Introduction
Equivalence to the source text is the defining char-acteristic of translation. One of the fundamentalaspects of translation quality is, therefore, its se-mantic adequacy, which reflects to what extent themeaning of the original text is preserved in thetranslation. In the field of Machine Translation(MT), on the other hand, it has recently becomecommon practice to perform quality assessmentusing a human reference translation instead of thesource text. Reference-based evaluation is an at-tractive practical solution since it does not requirebilingual speakers.
However, we believe this approach has a strongconceptual flaw: the assumption that the task oftranslation has a single correct solution. In real-ity, except for very short sentences or very specifictechnical domains, the same source sentence maybe correctly translated in many different ways.Depending on a broad textual and real-world con-text, the translation can differ from the source textat any linguistic level – lexical, syntactic, seman-tic or even discourse – and still be considered per-fectly correct. Therefore, using a single translationas a proxy for the original text may be unreliable.
In the monolingual, reference-based evaluationscenario, human judges are expected to recognizeacceptable variations between translation optionsand assign a high score to a good MT, even ifit happens to be different from a particular hu-man reference provided. In this paper we arguethat, contrary to this expectation, annotators arestrongly biased by the reference. They inadver-tently favor machine translations (MTs) that makesimilar choices to the ones present in the referencetranslation. To test this hypothesis, we perform anexperiment where the same set of MT outputs ismanually assessed using different reference trans-lations and analyze the discrepancies between theresulting quality scores.
The results confirm that annotators are indeedheavily influenced by the particular human trans-lation that was used for evaluation. We discussthe implications of this finding on the reliabilityof current practices in manual quality assessment.Our general recommendation is that, in order toavoid reference bias, the assessment should be per-formed by comparing the MT output to the origi-nal text, rather than to a reference.
The rest of this paper is organized as follows.In Section 2 we present related work. In Section 3we describe our experimental settings. In Section4 we focus on the effect of reference bias on MTevaluation. In Section 5 we examine the impact ofthe fatigue factor on the results of our experiments.
2 Related Work
It has become widely acceptable in the MT com-munity to use human translation instead of (oralong with) the source segment for MT evalua-tion. In most major evaluation campaigns (ARPA(White et al., 1994), 2008 NIST Metrics forMachine Translation Challenge (Przybocki et al.,2008), and annual Workshops on Statistical Ma-
77
Page 80 of 146

Quality Translation 21D3.3: Evaluation metrics and analysis of first annotation round
chine Translation (Callison-Burch et al., 2007;Bojar et al., 2015)), manual assessment is ex-pected to consider both MT fluency and adequacy,with a human (reference) translation commonlyused as a proxy for the source text to allow foradequacy judgement by monolingual judges.
The reference bias problem has been exten-sively discussed in the context of automatic MTevaluation. Evaluation systems based on string-level comparison, such as the well known BLEUmetric (Papineni et al., 2002) heavily penalize po-tentially acceptable variations between MT andhuman reference. A variety of methods have beenproposed to address this issue, from using multiplereferences (Dreyer and Marcu, 2012) to reference-free evaluation (Specia et al., 2010).
Research in manual evaluation has focused onovercoming annotator bias, i.e. the preferencesand expectations of individual annotators with re-spect to translation quality that lead to low levelsof inter-annotator agreement (Cohn and Specia,2013; Denkowski and Lavie, 2010; Graham et al.,2013; Guzman et al., 2015). The problem of ref-erence bias, however, has not been examined inprevious work. By contrast to automatic MT eval-uation, monolingual quality assessment is consid-ered unproblematic, since human annotators aresupposed to recognize meaning-preserving varia-tions between the MT output and a given humanreference. However, as will be shown in what fol-lows, manual evaluation is also strongly affectedby biases due to specific reference translations.
3 Settings
To show that monolingual quality assessment de-pends on the human translation used as gold-standard, we devised an evaluation task whereannotators were asked to assess the same set ofMT outputs using different references. As controlgroups, we have annotators assessing MT usingthe same reference, and using the source segments.
3.1 Dataset
MT data with multiple references is rare. We usedMTC-P4 Chinese-English dataset, produced byLinguistic Data Consortium (LDC2006T04). Thedataset contains 919 source sentences from newsdomain, 4 reference translations and MT outputsgenerated by 10 translation systems. Human trans-lations were produced by four teams of profes-sional translators and included editor’s proofread-
ing. All teams used the same translation guide-lines, which emphasize faithfulness to the sourcesentence as one of the main requirements.
We note that even in such a scenario, humantranslations differ from each other. We measuredthe average similarity between the four referencesin the dataset using the Meteor evaluation met-ric (Denkowski and Lavie, 2014). Meteor scoresrange between 0 and 1 and reflect the proportionof similar words occurring in similar order. Thismetric is normally used to compare the MT out-put with a human reference, but it can also be ap-plied to measure similarity between any two trans-lations. We computed Meteor for all possible com-binations between the four available referencesand took the average score. Even though Me-teor covers certain amount of acceptable linguis-tic variation by allowing for synonym and para-phrase matching, the resulting score is only 0.33,which shows that, not surprisingly, human transla-tions vary substantially.
To make the annotation process feasible giventhe resources available, we selected a subset of100 source sentences for the experiment. To en-sure variable levels of similarity between the MTand each of the references, we computed sentence-level Meteor scores for the MT outputs using eachof the references and selected the sentences withthe highest standard deviation between the scores.
3.2 Method
We developed a simple online interface to collecthuman judgments. Our evaluation task was basedon the adequacy criterion. Specifically, judgeswere asked to estimate how much of the meaningof the human translation was expressed in the MToutput (see Figure 1). The responses were inter-preted on a five-point scale, with the labels in Fig-ure 1 corresponding to numbers from 1 (“None”)to 5 (“All”).
For the main task, judgments were collected us-ing English native speakers who volunteered toparticipate. They were either professional trans-lators or researchers with a degree in Computa-tional Linguistics, English or Translation Stud-ies. 20 annotators participated in this monolin-gual task. Each of them evaluated the same setof 100 MT outputs. Our estimates showed thatthe task could be completed in approximatelyone hour. The annotators were divided into fourgroups, corresponding to the four available refer-
78
Page 81 of 146
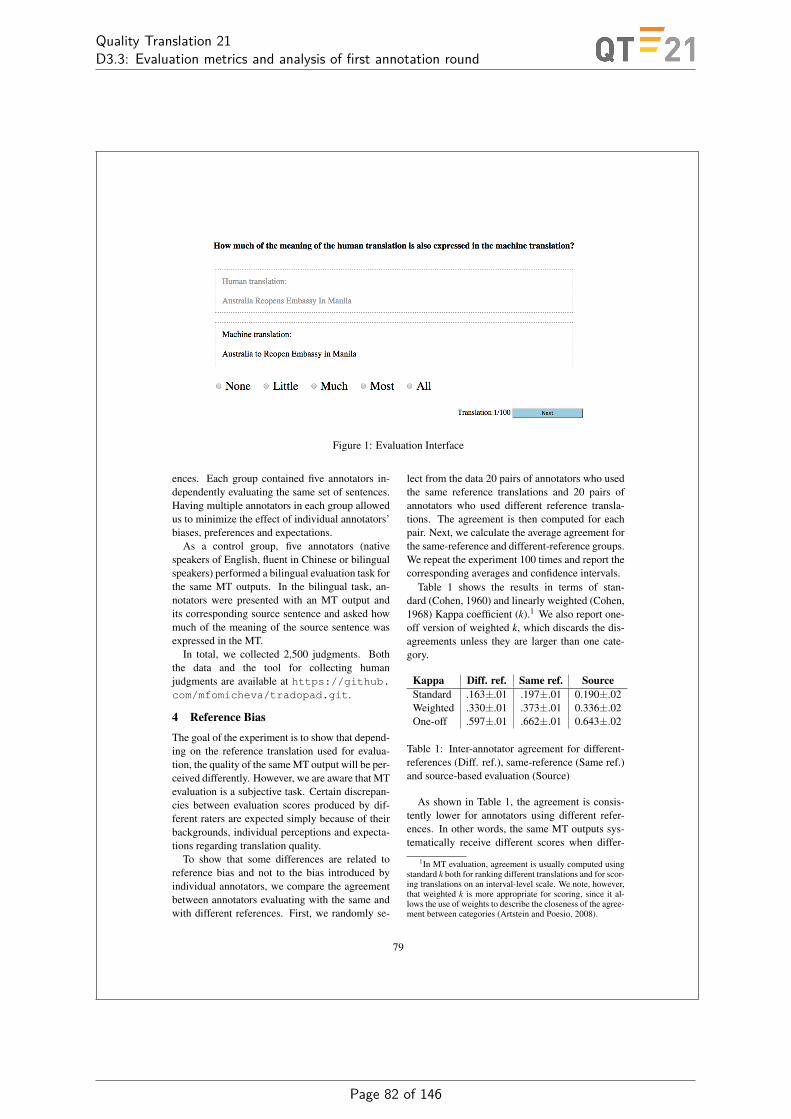
Quality Translation 21D3.3: Evaluation metrics and analysis of first annotation round
Figure 1: Evaluation Interface
ences. Each group contained five annotators in-dependently evaluating the same set of sentences.Having multiple annotators in each group allowedus to minimize the effect of individual annotators’biases, preferences and expectations.
As a control group, five annotators (nativespeakers of English, fluent in Chinese or bilingualspeakers) performed a bilingual evaluation task forthe same MT outputs. In the bilingual task, an-notators were presented with an MT output andits corresponding source sentence and asked howmuch of the meaning of the source sentence wasexpressed in the MT.
In total, we collected 2,500 judgments. Boththe data and the tool for collecting humanjudgments are available at https://github.com/mfomicheva/tradopad.git.
4 Reference Bias
The goal of the experiment is to show that depend-ing on the reference translation used for evalua-tion, the quality of the same MT output will be per-ceived differently. However, we are aware that MTevaluation is a subjective task. Certain discrepan-cies between evaluation scores produced by dif-ferent raters are expected simply because of theirbackgrounds, individual perceptions and expecta-tions regarding translation quality.
To show that some differences are related toreference bias and not to the bias introduced byindividual annotators, we compare the agreementbetween annotators evaluating with the same andwith different references. First, we randomly se-
lect from the data 20 pairs of annotators who usedthe same reference translations and 20 pairs ofannotators who used different reference transla-tions. The agreement is then computed for eachpair. Next, we calculate the average agreement forthe same-reference and different-reference groups.We repeat the experiment 100 times and report thecorresponding averages and confidence intervals.
Table 1 shows the results in terms of stan-dard (Cohen, 1960) and linearly weighted (Cohen,1968) Kappa coefficient (k).1 We also report one-off version of weighted k, which discards the dis-agreements unless they are larger than one cate-gory.
Kappa Diff. ref. Same ref. SourceStandard .163±.01 .197±.01 0.190±.02Weighted .330±.01 .373±.01 0.336±.02One-off .597±.01 .662±.01 0.643±.02
Table 1: Inter-annotator agreement for different-references (Diff. ref.), same-reference (Same ref.)and source-based evaluation (Source)
As shown in Table 1, the agreement is consis-tently lower for annotators using different refer-ences. In other words, the same MT outputs sys-tematically receive different scores when differ-
1In MT evaluation, agreement is usually computed usingstandard k both for ranking different translations and for scor-ing translations on an interval-level scale. We note, however,that weighted k is more appropriate for scoring, since it al-lows the use of weights to describe the closeness of the agree-ment between categories (Artstein and Poesio, 2008).
79
Page 82 of 146
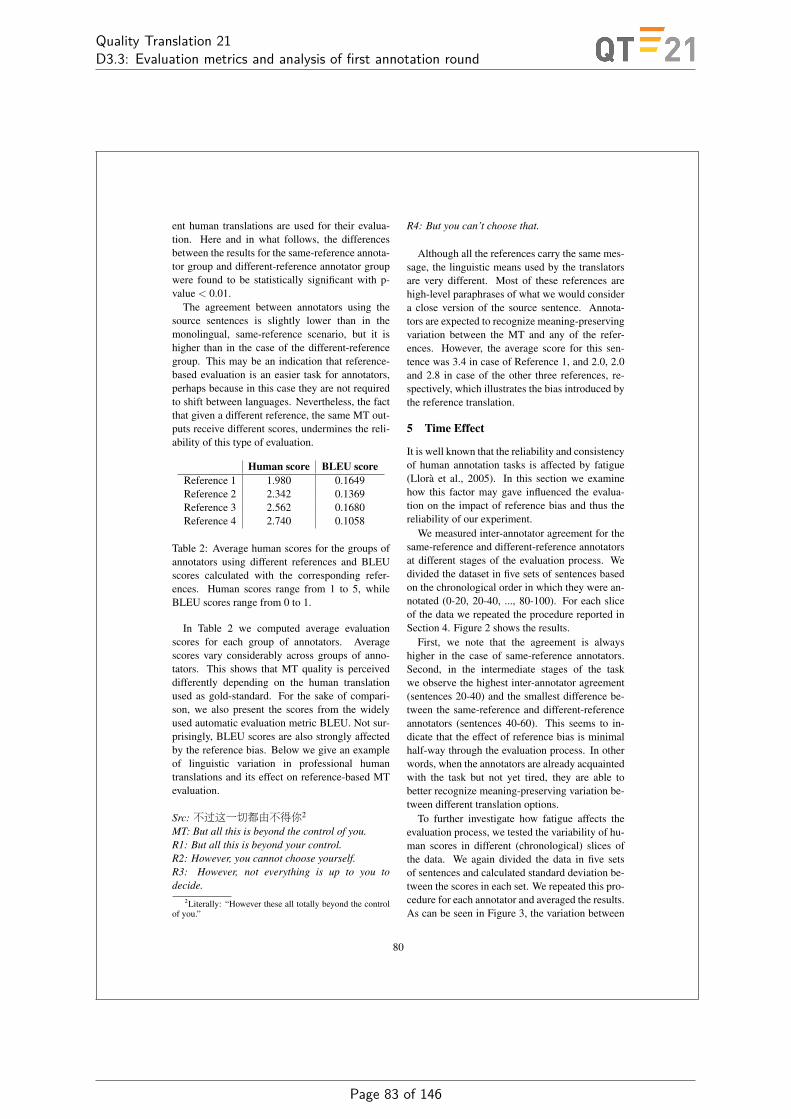
Quality Translation 21D3.3: Evaluation metrics and analysis of first annotation round
ent human translations are used for their evalua-tion. Here and in what follows, the differencesbetween the results for the same-reference annota-tor group and different-reference annotator groupwere found to be statistically significant with p-value < 0.01.
The agreement between annotators using thesource sentences is slightly lower than in themonolingual, same-reference scenario, but it ishigher than in the case of the different-referencegroup. This may be an indication that reference-based evaluation is an easier task for annotators,perhaps because in this case they are not requiredto shift between languages. Nevertheless, the factthat given a different reference, the same MT out-puts receive different scores, undermines the reli-ability of this type of evaluation.
Human score BLEU scoreReference 1 1.980 0.1649Reference 2 2.342 0.1369Reference 3 2.562 0.1680Reference 4 2.740 0.1058
Table 2: Average human scores for the groups ofannotators using different references and BLEUscores calculated with the corresponding refer-ences. Human scores range from 1 to 5, whileBLEU scores range from 0 to 1.
In Table 2 we computed average evaluationscores for each group of annotators. Averagescores vary considerably across groups of anno-tators. This shows that MT quality is perceiveddifferently depending on the human translationused as gold-standard. For the sake of compari-son, we also present the scores from the widelyused automatic evaluation metric BLEU. Not sur-prisingly, BLEU scores are also strongly affectedby the reference bias. Below we give an exampleof linguistic variation in professional humantranslations and its effect on reference-based MTevaluation.
Src: 不过这一切都由不得你2
MT: But all this is beyond the control of you.R1: But all this is beyond your control.R2: However, you cannot choose yourself.R3: However, not everything is up to you todecide.
2Literally: “However these all totally beyond the controlof you.”
R4: But you can’t choose that.
Although all the references carry the same mes-sage, the linguistic means used by the translatorsare very different. Most of these references arehigh-level paraphrases of what we would considera close version of the source sentence. Annota-tors are expected to recognize meaning-preservingvariation between the MT and any of the refer-ences. However, the average score for this sen-tence was 3.4 in case of Reference 1, and 2.0, 2.0and 2.8 in case of the other three references, re-spectively, which illustrates the bias introduced bythe reference translation.
5 Time Effect
It is well known that the reliability and consistencyof human annotation tasks is affected by fatigue(Llora et al., 2005). In this section we examinehow this factor may gave influenced the evalua-tion on the impact of reference bias and thus thereliability of our experiment.
We measured inter-annotator agreement for thesame-reference and different-reference annotatorsat different stages of the evaluation process. Wedivided the dataset in five sets of sentences basedon the chronological order in which they were an-notated (0-20, 20-40, ..., 80-100). For each sliceof the data we repeated the procedure reported inSection 4. Figure 2 shows the results.
First, we note that the agreement is alwayshigher in the case of same-reference annotators.Second, in the intermediate stages of the taskwe observe the highest inter-annotator agreement(sentences 20-40) and the smallest difference be-tween the same-reference and different-referenceannotators (sentences 40-60). This seems to in-dicate that the effect of reference bias is minimalhalf-way through the evaluation process. In otherwords, when the annotators are already acquaintedwith the task but not yet tired, they are able tobetter recognize meaning-preserving variation be-tween different translation options.
To further investigate how fatigue affects theevaluation process, we tested the variability of hu-man scores in different (chronological) slices ofthe data. We again divided the data in five setsof sentences and calculated standard deviation be-tween the scores in each set. We repeated this pro-cedure for each annotator and averaged the results.As can be seen in Figure 3, the variation between
80
Page 83 of 146
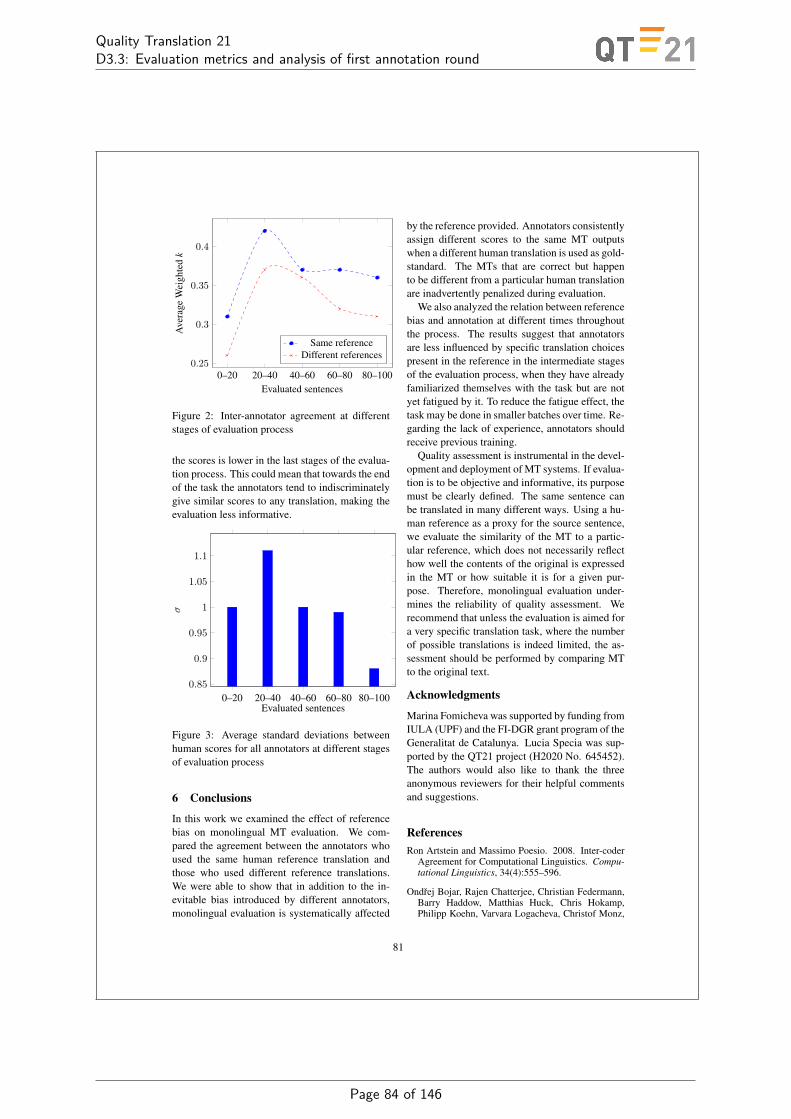
Quality Translation 21D3.3: Evaluation metrics and analysis of first annotation round
0–20 20–40 40–60 60–80 80–1000.25
0.3
0.35
0.4
Evaluated sentences
Ave
rage
Wei
ghte
dk
Same referenceDifferent references
Figure 2: Inter-annotator agreement at differentstages of evaluation process
the scores is lower in the last stages of the evalua-tion process. This could mean that towards the endof the task the annotators tend to indiscriminatelygive similar scores to any translation, making theevaluation less informative.
0–20 20–40 40–60 60–80 80–1000.85
0.9
0.95
1
1.05
1.1
Evaluated sentences
σ
Figure 3: Average standard deviations betweenhuman scores for all annotators at different stagesof evaluation process
6 Conclusions
In this work we examined the effect of referencebias on monolingual MT evaluation. We com-pared the agreement between the annotators whoused the same human reference translation andthose who used different reference translations.We were able to show that in addition to the in-evitable bias introduced by different annotators,monolingual evaluation is systematically affected
by the reference provided. Annotators consistentlyassign different scores to the same MT outputswhen a different human translation is used as gold-standard. The MTs that are correct but happento be different from a particular human translationare inadvertently penalized during evaluation.
We also analyzed the relation between referencebias and annotation at different times throughoutthe process. The results suggest that annotatorsare less influenced by specific translation choicespresent in the reference in the intermediate stagesof the evaluation process, when they have alreadyfamiliarized themselves with the task but are notyet fatigued by it. To reduce the fatigue effect, thetask may be done in smaller batches over time. Re-garding the lack of experience, annotators shouldreceive previous training.
Quality assessment is instrumental in the devel-opment and deployment of MT systems. If evalua-tion is to be objective and informative, its purposemust be clearly defined. The same sentence canbe translated in many different ways. Using a hu-man reference as a proxy for the source sentence,we evaluate the similarity of the MT to a partic-ular reference, which does not necessarily reflecthow well the contents of the original is expressedin the MT or how suitable it is for a given pur-pose. Therefore, monolingual evaluation under-mines the reliability of quality assessment. Werecommend that unless the evaluation is aimed fora very specific translation task, where the numberof possible translations is indeed limited, the as-sessment should be performed by comparing MTto the original text.
Acknowledgments
Marina Fomicheva was supported by funding fromIULA (UPF) and the FI-DGR grant program of theGeneralitat de Catalunya. Lucia Specia was sup-ported by the QT21 project (H2020 No. 645452).The authors would also like to thank the threeanonymous reviewers for their helpful commentsand suggestions.
ReferencesRon Artstein and Massimo Poesio. 2008. Inter-coder
Agreement for Computational Linguistics. Compu-tational Linguistics, 34(4):555–596.
Ondrej Bojar, Rajen Chatterjee, Christian Federmann,Barry Haddow, Matthias Huck, Chris Hokamp,Philipp Koehn, Varvara Logacheva, Christof Monz,
81
Page 84 of 146

Quality Translation 21D3.3: Evaluation metrics and analysis of first annotation round
Matteo Negri, Matt Post, Carolina Scarton, LuciaSpecia, and Marco Turchi. 2015. Findings of the2015 Workshop on Statistical Machine Translation.In Proceedings of the Tenth Workshop on StatisticalMachine Translation, pages 1–46, Lisboa, Portugal.
Chris Callison-Burch, Cameron Fordyce, PhilippKoehn, Christof Monz, and Josh Schroeder. 2007.(meta-) evaluation of machine translation. In Pro-ceedings of the Second Workshop on Statistical Ma-chine Translation, pages 136–158.
Jacob Cohen. 1960. A Coefficient of Agreement forNominal Scales. Educational and PsychologicalMeasurement, 20:37–46.
Jacob Cohen. 1968. Weighted Kappa: Nominal ScaleAgreement Provision for Scaled Disagreement orPartial Credit. Psychological bulletin, 70(4):213–220.
Trevor Cohn and Lucia Specia. 2013. ModellingAnnotator Bias with Multi-task Gaussian Processes:An Application to Machine Translation Quality Es-timation. In Proceedings of 51st Annual Meetingof the Association for Computational Linguistics,pages 32–42.
Michael Denkowski and Alon Lavie. 2010. Choos-ing the Right Evaluation for Machine Translation:an Examination of Annotator and Automatic MetricPerformance on Human Judgment Tasks. In Pro-ceedings of the Ninth Biennal Conference of the As-sociation for Machine Translation in the Americas.
Michael Denkowski and Alon Lavie. 2014. MeteorUniversal: Language Specific Translation Evalua-tion for Any Target Language. In Proceedings of theEACL 2014 Workshop on Statistical Machine Trans-lation, pages 376–380.
Markus Dreyer and Daniel Marcu. 2012. HyTER:Meaning-equivalent Semantics for Translation Eval-uation. In Proceedings of 2012 Conference ofthe North American Chapter of the Association forComputational Linguistics: Human Language Tech-nologies, pages 162–171.
Yvette Graham, Timothy Baldwin, Alistair Moffat,and Justin Zobel. 2013. Continuous MeasurementScales in Human Evaluation of Machine Trans-lation. In Proceedings 7th Linguistic Annota-tion Workshop and Interoperability with Discourse,pages 33–41.
Francisco Guzman, Ahmed Abdelali, Irina Temnikova,Hassan Sajjad, and Stephan Vogel. 2015. How doHumans Evaluate Machine Translation. In Proceed-ings of the Tenth Workshop on Statistical MachineTranslation, pages 457–466.
Xavier Llora, Kumara Sastry, David E Goldberg, Ab-himanyu Gupta, and Lalitha Lakshmi. 2005. Com-bating User Fatigue in iGAs: Partial Ordering, Sup-port Vector Machines, and Synthetic Fitness. In Pro-ceedings of the 7th Annual Conference on Geneticand Evolutionary Computation, pages 1363–1370.
Kishore Papineni, Salim Roukos, Todd Ward, and Wei-Jing Zhu. 2002. BLEU: a Method for AutomaticEvaluation of Machine Translation. In Proceedingsof the 40th Annual Meeting of the ACL, pages 311–318.
Mark Przybocki, Kay Peterson, and Sebastian Bron-sart. 2008. Official Results of the NIST 2008 “Met-rics for MAchine TRanslation” Challenge (Metrics-MATR08). In Proceedings of the AMTA-2008 Work-shop on Metrics for Machine Translation, Honolulu,Hawaii, USA.
Lucia Specia, Dhwaj Raj, and Marco Turchi. 2010.Machine Translation Evaluation versus Quality Es-timation. Machine Translation, 24(1):39–50.
John White, Theresa O’Connell, and Francis O’Mara.1994. The ARPA MT Evaluation Methodologies:Evolution, Lessons, and Future Approaches. In Pro-ceedings of the Association for Machine Transla-tion in the Americas Conference, pages 193–205,Columbia, Maryland, USA.
82
Page 85 of 146

Quality Translation 21D3.3: Evaluation metrics and analysis of first annotation round
I Multi-level Translation Quality Prediction with QuEst++
Proceedings of ACL-IJCNLP 2015 System Demonstrations, pages 115–120,Beijing, China, July 26-31, 2015. c©2015 ACL and AFNLP
Multi-level Translation Quality Prediction with QUEST++
Lucia Specia, Gustavo Henrique Paetzold and Carolina ScartonDepartment of Computer Science
University of Sheffield, UKl.specia,ghpaetzold1,[email protected]
Abstract
This paper presents QUEST++ , an opensource tool for quality estimation whichcan predict quality for texts at word, sen-tence and document level. It also providespipelined processing, whereby predictionsmade at a lower level (e.g. for words) canbe used as input to build models for pre-dictions at a higher level (e.g. sentences).QUEST++ allows the extraction of a va-riety of features, and provides machinelearning algorithms to build and test qual-ity estimation models. Results on recentdatasets show that QUEST++ achievesstate-of-the-art performance.
1 Introduction
Quality Estimation (QE) of Machine Translation(MT) have become increasingly popular over thelast decade. With the goal of providing a predic-tion on the quality of a machine translated text, QEsystems have the potential to make MT more use-ful in a number of scenarios, for example, improv-ing post-editing efficiency (Specia, 2011), select-ing high quality segments (Soricut and Echihabi,2010), selecting the best translation (Shah andSpecia, 2014), and highlighting words or phrasesthat need revision (Bach et al., 2011).
Most recent work focuses on sentence-level QE.This variant is addressed as a supervised machinelearning task using a variety of algorithms to in-duce models from examples of sentence transla-tions annotated with quality labels (e.g. 1-5 likertscores). Sentence-level QE has been covered inshared tasks organised by the Workshop on Statis-tical Machine Translation (WMT) annually since2012. While standard algorithms can be used tobuild prediction models, key to this task is workof feature engineering. Two open source feature
extraction toolkits are available for that: ASIYA1
and QUEST2 (Specia et al., 2013). The latter hasbeen used as the official baseline for the WMTshared tasks and extended by a number of partic-ipants, leading to improved results over the years(Callison-Burch et al., 2012; Bojar et al., 2013;Bojar et al., 2014).
QE at other textual levels have received muchless attention. Word-level QE (Blatz et al., 2004;Luong et al., 2014) is seemingly a more challeng-ing task where a quality label is to be producedfor each target word. An additional challenge isthe acquisition of sizable training sets. Althoughsignificant efforts have been made, there is con-siderable room for improvement. In fact, mostWMT13-14 QE shared task submissions were un-able to beat a trivial baseline.
Document-level QE consists in predicting a sin-gle label for entire documents, be it an absolutescore (Scarton and Specia, 2014) or a relativeranking of translations by one or more MT sys-tems (Soricut and Echihabi, 2010). While certainsentences are perfect in isolation, their combina-tion in context may lead to an incoherent docu-ment. Conversely, while a sentence can be poor inisolation, when put in context, it may benefit frominformation in surrounding sentences, leading toa good quality document. Feature engineering isa challenge given the little availability of tools toextract discourse-wide information. In addition,no datasets with human-created labels are avail-able and thus scores produced by automatic met-rics have to be used as approximation (Scarton etal., 2015).
Some applications require fine-grained, word-level information on quality. For example, onemay want to highlight words that need fixing.Document-level QE is needed particularly for gist-ing purposes where post-editing is not an option.
1http://nlp.lsi.upc.edu/asiya/2http://www.quest.dcs.shef.ac.uk/
115
Page 86 of 146
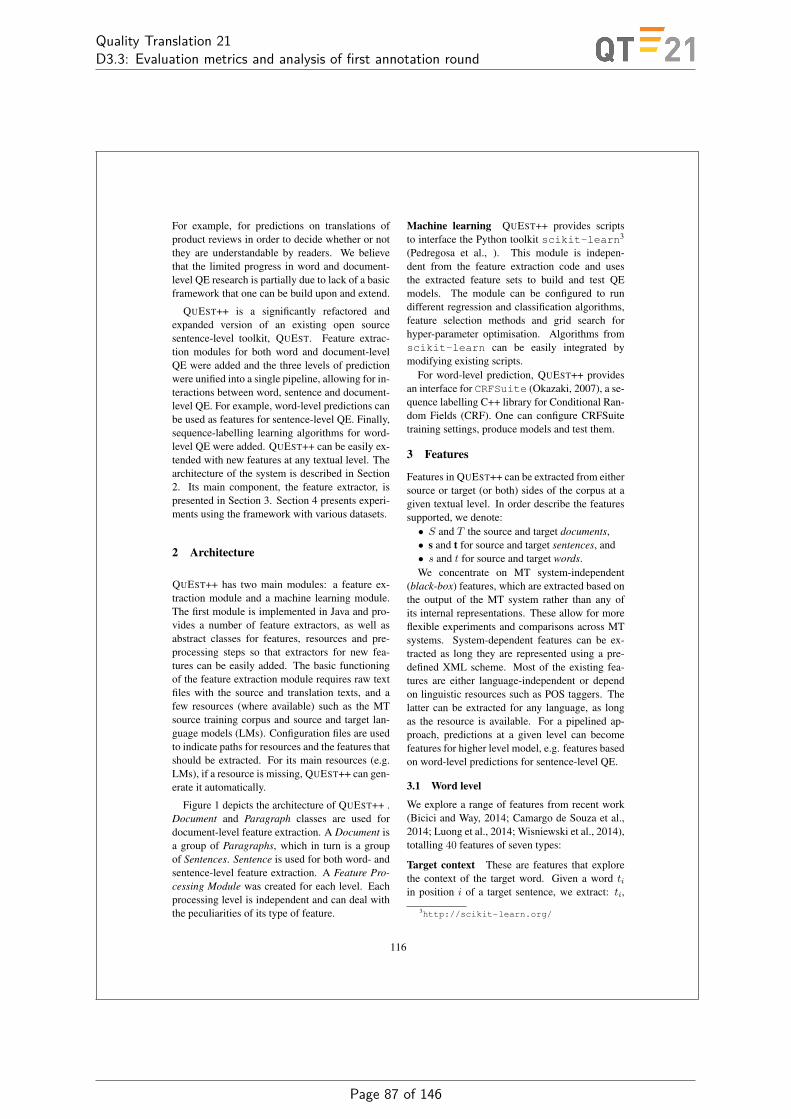
Quality Translation 21D3.3: Evaluation metrics and analysis of first annotation round
For example, for predictions on translations ofproduct reviews in order to decide whether or notthey are understandable by readers. We believethat the limited progress in word and document-level QE research is partially due to lack of a basicframework that one can be build upon and extend.
QUEST++ is a significantly refactored andexpanded version of an existing open sourcesentence-level toolkit, QUEST. Feature extrac-tion modules for both word and document-levelQE were added and the three levels of predictionwere unified into a single pipeline, allowing for in-teractions between word, sentence and document-level QE. For example, word-level predictions canbe used as features for sentence-level QE. Finally,sequence-labelling learning algorithms for word-level QE were added. QUEST++ can be easily ex-tended with new features at any textual level. Thearchitecture of the system is described in Section2. Its main component, the feature extractor, ispresented in Section 3. Section 4 presents experi-ments using the framework with various datasets.
2 Architecture
QUEST++ has two main modules: a feature ex-traction module and a machine learning module.The first module is implemented in Java and pro-vides a number of feature extractors, as well asabstract classes for features, resources and pre-processing steps so that extractors for new fea-tures can be easily added. The basic functioningof the feature extraction module requires raw textfiles with the source and translation texts, and afew resources (where available) such as the MTsource training corpus and source and target lan-guage models (LMs). Configuration files are usedto indicate paths for resources and the features thatshould be extracted. For its main resources (e.g.LMs), if a resource is missing, QUEST++ can gen-erate it automatically.
Figure 1 depicts the architecture of QUEST++ .Document and Paragraph classes are used fordocument-level feature extraction. A Document isa group of Paragraphs, which in turn is a groupof Sentences. Sentence is used for both word- andsentence-level feature extraction. A Feature Pro-cessing Module was created for each level. Eachprocessing level is independent and can deal withthe peculiarities of its type of feature.
Machine learning QUEST++ provides scriptsto interface the Python toolkit scikit-learn3
(Pedregosa et al., ). This module is indepen-dent from the feature extraction code and usesthe extracted feature sets to build and test QEmodels. The module can be configured to rundifferent regression and classification algorithms,feature selection methods and grid search forhyper-parameter optimisation. Algorithms fromscikit-learn can be easily integrated bymodifying existing scripts.
For word-level prediction, QUEST++ providesan interface for CRFSuite (Okazaki, 2007), a se-quence labelling C++ library for Conditional Ran-dom Fields (CRF). One can configure CRFSuitetraining settings, produce models and test them.
3 Features
Features in QUEST++ can be extracted from eithersource or target (or both) sides of the corpus at agiven textual level. In order describe the featuressupported, we denote:• S and T the source and target documents,• s and t for source and target sentences, and• s and t for source and target words.We concentrate on MT system-independent
(black-box) features, which are extracted based onthe output of the MT system rather than any ofits internal representations. These allow for moreflexible experiments and comparisons across MTsystems. System-dependent features can be ex-tracted as long they are represented using a pre-defined XML scheme. Most of the existing fea-tures are either language-independent or dependon linguistic resources such as POS taggers. Thelatter can be extracted for any language, as longas the resource is available. For a pipelined ap-proach, predictions at a given level can becomefeatures for higher level model, e.g. features basedon word-level predictions for sentence-level QE.
3.1 Word level
We explore a range of features from recent work(Bicici and Way, 2014; Camargo de Souza et al.,2014; Luong et al., 2014; Wisniewski et al., 2014),totalling 40 features of seven types:
Target context These are features that explorethe context of the target word. Given a word tiin position i of a target sentence, we extract: ti,
3http://scikit-learn.org/
116
Page 87 of 146
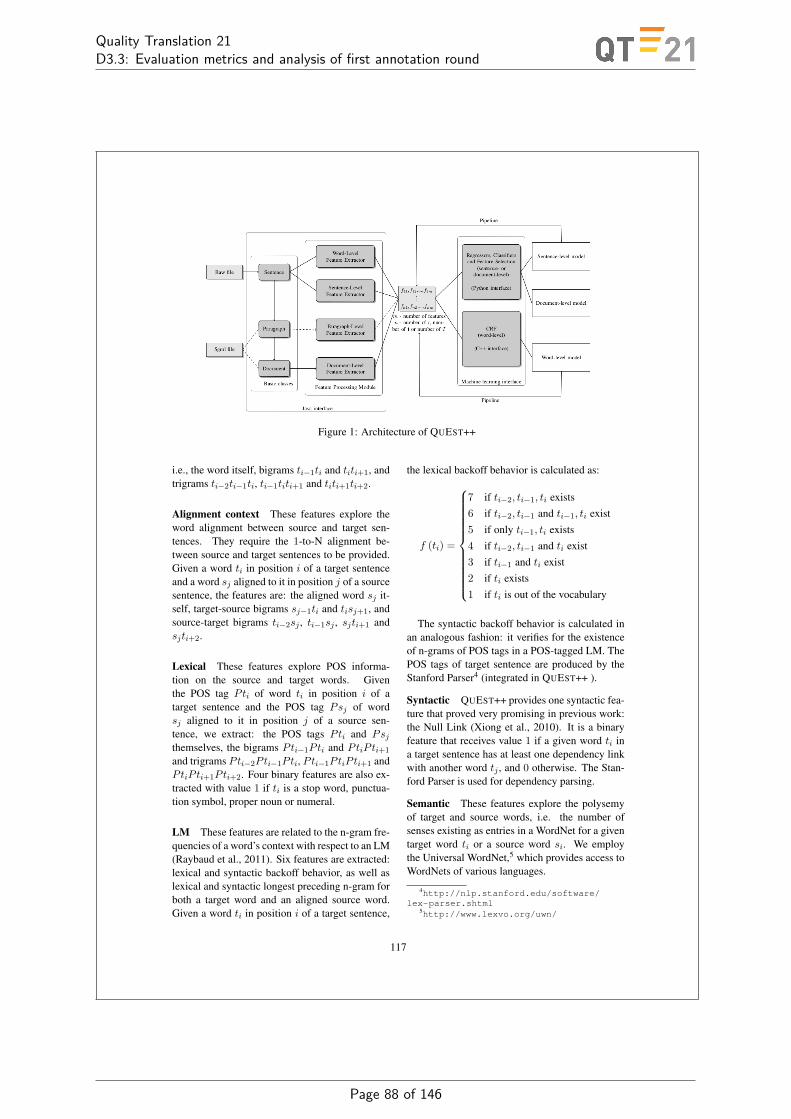
Quality Translation 21D3.3: Evaluation metrics and analysis of first annotation round
Figure 1: Architecture of QUEST++
i.e., the word itself, bigrams ti−1ti and titi+1, andtrigrams ti−2ti−1ti, ti−1titi+1 and titi+1ti+2.
Alignment context These features explore theword alignment between source and target sen-tences. They require the 1-to-N alignment be-tween source and target sentences to be provided.Given a word ti in position i of a target sentenceand a word sj aligned to it in position j of a sourcesentence, the features are: the aligned word sj it-self, target-source bigrams sj−1ti and tisj+1, andsource-target bigrams ti−2sj , ti−1sj , sjti+1 andsjti+2.
Lexical These features explore POS informa-tion on the source and target words. Giventhe POS tag Pti of word ti in position i of atarget sentence and the POS tag Psj of wordsj aligned to it in position j of a source sen-tence, we extract: the POS tags Pti and Psj
themselves, the bigrams Pti−1Pti and PtiPti+1
and trigrams Pti−2Pti−1Pti, Pti−1PtiPti+1 andPtiPti+1Pti+2. Four binary features are also ex-tracted with value 1 if ti is a stop word, punctua-tion symbol, proper noun or numeral.
LM These features are related to the n-gram fre-quencies of a word’s context with respect to an LM(Raybaud et al., 2011). Six features are extracted:lexical and syntactic backoff behavior, as well aslexical and syntactic longest preceding n-gram forboth a target word and an aligned source word.Given a word ti in position i of a target sentence,
the lexical backoff behavior is calculated as:
f (ti) =
7 if ti−2, ti−1, ti exists6 if ti−2, ti−1 and ti−1, ti exist5 if only ti−1, ti exists4 if ti−2, ti−1 and ti exist3 if ti−1 and ti exist2 if ti exists1 if ti is out of the vocabulary
The syntactic backoff behavior is calculated inan analogous fashion: it verifies for the existenceof n-grams of POS tags in a POS-tagged LM. ThePOS tags of target sentence are produced by theStanford Parser4 (integrated in QUEST++ ).
Syntactic QUEST++ provides one syntactic fea-ture that proved very promising in previous work:the Null Link (Xiong et al., 2010). It is a binaryfeature that receives value 1 if a given word ti ina target sentence has at least one dependency linkwith another word tj , and 0 otherwise. The Stan-ford Parser is used for dependency parsing.
Semantic These features explore the polysemyof target and source words, i.e. the number ofsenses existing as entries in a WordNet for a giventarget word ti or a source word si. We employthe Universal WordNet,5 which provides access toWordNets of various languages.
4http://nlp.stanford.edu/software/lex-parser.shtml
5http://www.lexvo.org/uwn/
117
Page 88 of 146
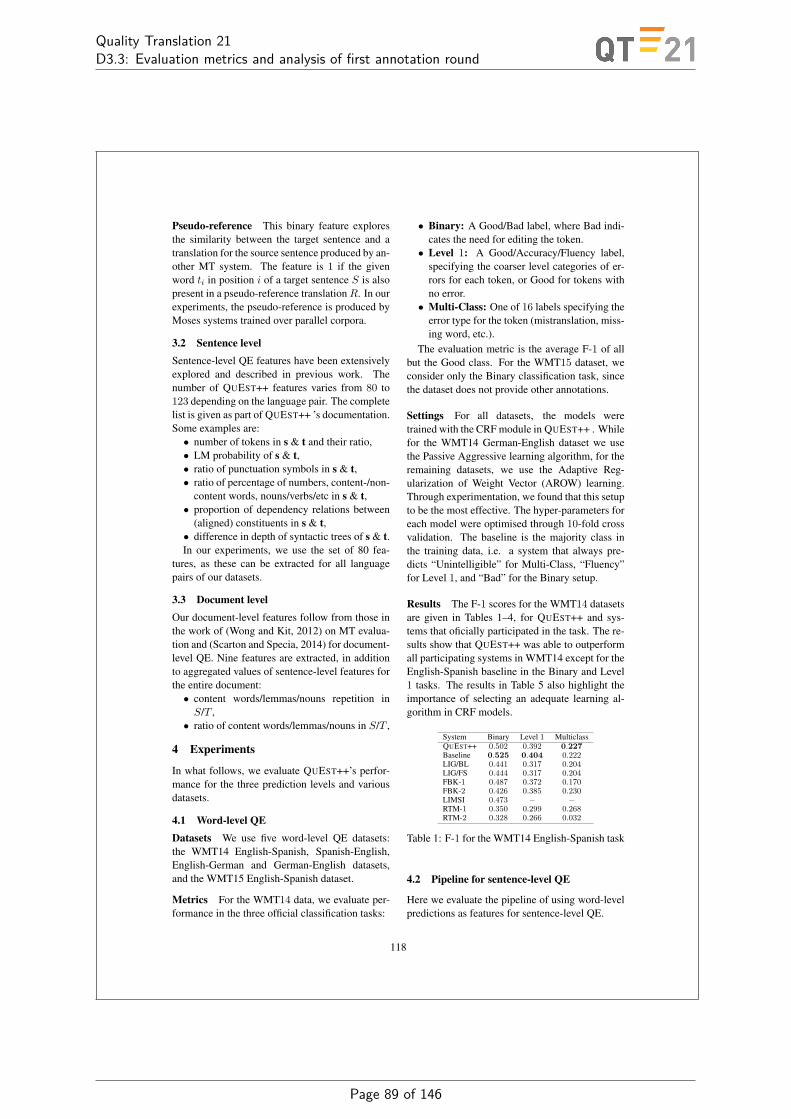
Quality Translation 21D3.3: Evaluation metrics and analysis of first annotation round
Pseudo-reference This binary feature exploresthe similarity between the target sentence and atranslation for the source sentence produced by an-other MT system. The feature is 1 if the givenword ti in position i of a target sentence S is alsopresent in a pseudo-reference translation R. In ourexperiments, the pseudo-reference is produced byMoses systems trained over parallel corpora.
3.2 Sentence levelSentence-level QE features have been extensivelyexplored and described in previous work. Thenumber of QUEST++ features varies from 80 to123 depending on the language pair. The completelist is given as part of QUEST++ ’s documentation.Some examples are:• number of tokens in s & t and their ratio,• LM probability of s & t,• ratio of punctuation symbols in s & t,• ratio of percentage of numbers, content-/non-
content words, nouns/verbs/etc in s & t,• proportion of dependency relations between
(aligned) constituents in s & t,• difference in depth of syntactic trees of s & t.In our experiments, we use the set of 80 fea-
tures, as these can be extracted for all languagepairs of our datasets.
3.3 Document levelOur document-level features follow from those inthe work of (Wong and Kit, 2012) on MT evalua-tion and (Scarton and Specia, 2014) for document-level QE. Nine features are extracted, in additionto aggregated values of sentence-level features forthe entire document:• content words/lemmas/nouns repetition in
S/T ,• ratio of content words/lemmas/nouns in S/T ,
4 Experiments
In what follows, we evaluate QUEST++’s perfor-mance for the three prediction levels and variousdatasets.
4.1 Word-level QEDatasets We use five word-level QE datasets:the WMT14 English-Spanish, Spanish-English,English-German and German-English datasets,and the WMT15 English-Spanish dataset.
Metrics For the WMT14 data, we evaluate per-formance in the three official classification tasks:
• Binary: A Good/Bad label, where Bad indi-cates the need for editing the token.• Level 1: A Good/Accuracy/Fluency label,
specifying the coarser level categories of er-rors for each token, or Good for tokens withno error.• Multi-Class: One of 16 labels specifying the
error type for the token (mistranslation, miss-ing word, etc.).
The evaluation metric is the average F-1 of allbut the Good class. For the WMT15 dataset, weconsider only the Binary classification task, sincethe dataset does not provide other annotations.
Settings For all datasets, the models weretrained with the CRF module in QUEST++ . Whilefor the WMT14 German-English dataset we usethe Passive Aggressive learning algorithm, for theremaining datasets, we use the Adaptive Reg-ularization of Weight Vector (AROW) learning.Through experimentation, we found that this setupto be the most effective. The hyper-parameters foreach model were optimised through 10-fold crossvalidation. The baseline is the majority class inthe training data, i.e. a system that always pre-dicts “Unintelligible” for Multi-Class, “Fluency”for Level 1, and “Bad” for the Binary setup.
Results The F-1 scores for the WMT14 datasetsare given in Tables 1–4, for QUEST++ and sys-tems that oficially participated in the task. The re-sults show that QUEST++ was able to outperformall participating systems in WMT14 except for theEnglish-Spanish baseline in the Binary and Level1 tasks. The results in Table 5 also highlight theimportance of selecting an adequate learning al-gorithm in CRF models.
System Binary Level 1 MulticlassQUEST++ 0.502 0.392 0.227Baseline 0.525 0.404 0.222LIG/BL 0.441 0.317 0.204LIG/FS 0.444 0.317 0.204FBK-1 0.487 0.372 0.170FBK-2 0.426 0.385 0.230LIMSI 0.473 − −RTM-1 0.350 0.299 0.268RTM-2 0.328 0.266 0.032
Table 1: F-1 for the WMT14 English-Spanish task
4.2 Pipeline for sentence-level QE
Here we evaluate the pipeline of using word-levelpredictions as features for sentence-level QE.
118
Page 89 of 146
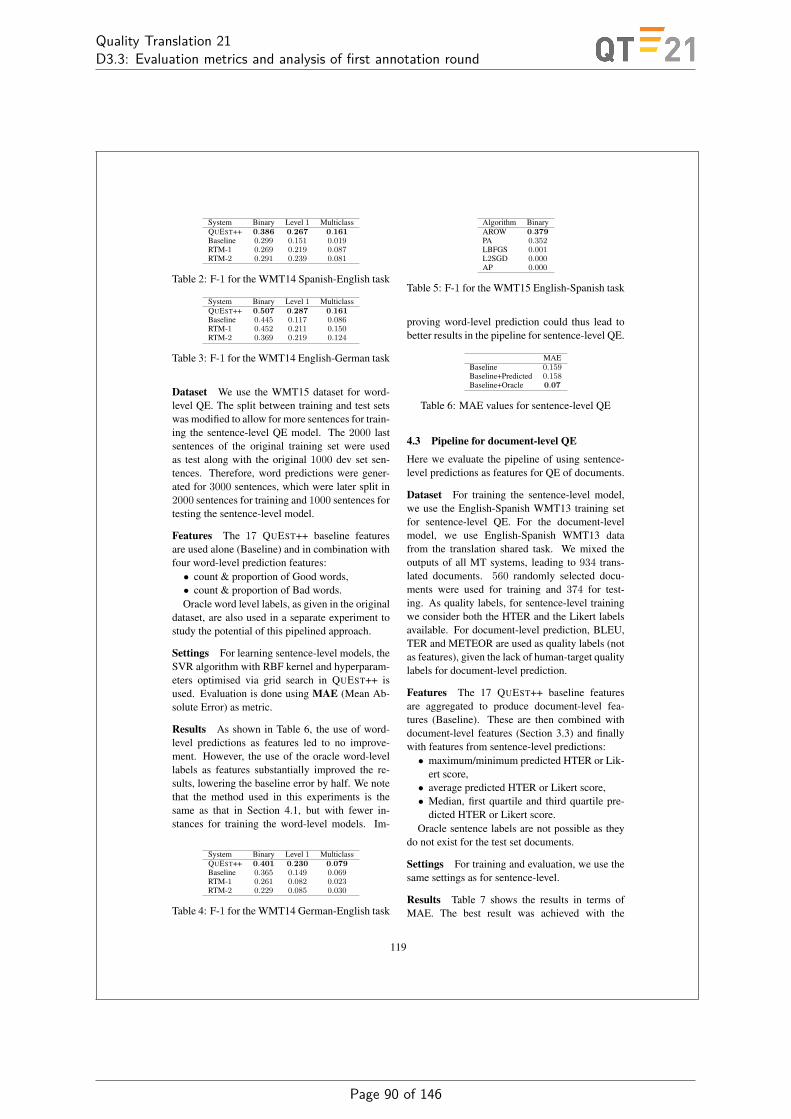
Quality Translation 21D3.3: Evaluation metrics and analysis of first annotation round
System Binary Level 1 MulticlassQUEST++ 0.386 0.267 0.161Baseline 0.299 0.151 0.019RTM-1 0.269 0.219 0.087RTM-2 0.291 0.239 0.081
Table 2: F-1 for the WMT14 Spanish-English task
System Binary Level 1 MulticlassQUEST++ 0.507 0.287 0.161Baseline 0.445 0.117 0.086RTM-1 0.452 0.211 0.150RTM-2 0.369 0.219 0.124
Table 3: F-1 for the WMT14 English-German task
Dataset We use the WMT15 dataset for word-level QE. The split between training and test setswas modified to allow for more sentences for train-ing the sentence-level QE model. The 2000 lastsentences of the original training set were usedas test along with the original 1000 dev set sen-tences. Therefore, word predictions were gener-ated for 3000 sentences, which were later split in2000 sentences for training and 1000 sentences fortesting the sentence-level model.
Features The 17 QUEST++ baseline featuresare used alone (Baseline) and in combination withfour word-level prediction features:• count & proportion of Good words,• count & proportion of Bad words.Oracle word level labels, as given in the original
dataset, are also used in a separate experiment tostudy the potential of this pipelined approach.
Settings For learning sentence-level models, theSVR algorithm with RBF kernel and hyperparam-eters optimised via grid search in QUEST++ isused. Evaluation is done using MAE (Mean Ab-solute Error) as metric.
Results As shown in Table 6, the use of word-level predictions as features led to no improve-ment. However, the use of the oracle word-levellabels as features substantially improved the re-sults, lowering the baseline error by half. We notethat the method used in this experiments is thesame as that in Section 4.1, but with fewer in-stances for training the word-level models. Im-
System Binary Level 1 MulticlassQUEST++ 0.401 0.230 0.079Baseline 0.365 0.149 0.069RTM-1 0.261 0.082 0.023RTM-2 0.229 0.085 0.030
Table 4: F-1 for the WMT14 German-English task
Algorithm BinaryAROW 0.379PA 0.352LBFGS 0.001L2SGD 0.000AP 0.000
Table 5: F-1 for the WMT15 English-Spanish task
proving word-level prediction could thus lead tobetter results in the pipeline for sentence-level QE.
MAEBaseline 0.159Baseline+Predicted 0.158Baseline+Oracle 0.07
Table 6: MAE values for sentence-level QE
4.3 Pipeline for document-level QE
Here we evaluate the pipeline of using sentence-level predictions as features for QE of documents.
Dataset For training the sentence-level model,we use the English-Spanish WMT13 training setfor sentence-level QE. For the document-levelmodel, we use English-Spanish WMT13 datafrom the translation shared task. We mixed theoutputs of all MT systems, leading to 934 trans-lated documents. 560 randomly selected docu-ments were used for training and 374 for test-ing. As quality labels, for sentence-level trainingwe consider both the HTER and the Likert labelsavailable. For document-level prediction, BLEU,TER and METEOR are used as quality labels (notas features), given the lack of human-target qualitylabels for document-level prediction.
Features The 17 QUEST++ baseline featuresare aggregated to produce document-level fea-tures (Baseline). These are then combined withdocument-level features (Section 3.3) and finallywith features from sentence-level predictions:• maximum/minimum predicted HTER or Lik-
ert score,• average predicted HTER or Likert score,• Median, first quartile and third quartile pre-
dicted HTER or Likert score.Oracle sentence labels are not possible as they
do not exist for the test set documents.
Settings For training and evaluation, we use thesame settings as for sentence-level.
Results Table 7 shows the results in terms ofMAE. The best result was achieved with the
119
Page 90 of 146

Quality Translation 21D3.3: Evaluation metrics and analysis of first annotation round
baseline plus HTER features, but no significantimprovements over the baseline were observed.Document-level prediction is a very challengingtask: automatic metric scores used as labels donot seem to reliably distinguish translations of dif-ferent source documents, since they were primar-ily designed to compare alternative translations forthe same source document.
BLEU TER METEORBaseline 0.049 0.050 0.055Baseline+Doc-level 0.053 0.057 0.055Baseline+HTER 0.053 0.048 0.054Baseline+Likert 0.054 0.056 0.054Baseline+Doc-level+HTER 0.053 0.054 0.054Baseline+Doc-level+Likert 0.053 0.056 0.054
Table 7: MAE values for document-level QE
5 Remarks
The source code for the framework, the datasetsand extra resources can be downloaded fromhttps://github.com/ghpaetzold/questplusplus.
The license for the Java code, Python andshell scripts is BSD, a permissive license withno restrictions on the use or extensions of thesoftware for any purposes, including commer-cial. For pre-existing code and resources, e.g.,scikit-learn, their licenses apply.
Acknowledgments
This work was supported by the European Associ-ation for Machine Translation, the QT21 project(H2020 No. 645452) and the EXPERT project(EU Marie Curie ITN No. 317471).
ReferencesN. Bach, F. Huang, and Y. Al-Onaizan. 2011. Good-
ness: a method for measuring MT confidence. InACL11.
E. Bicici and A. Way. 2014. Referential Transla-tion Machines for Predicting Translation Quality. InWMT14.
J. Blatz, E. Fitzgerald, G. Foster, S. Gandrabur,C. Goutte, A. Kulesza, A. Sanchis, and N. Ueffing.2004. Confidence Estimation for Machine Transla-tion. In COLING04.
O. Bojar, C. Buck, C. Callison-Burch, C. Federmann,B. Haddow, P. Koehn, C. Monz, M. Post, R. Soricut,and L. Specia. 2013. Findings of the 2013 Work-shop on SMT. In WMT13.
O. Bojar, C. Buck, C. Federmann, B. Haddow,P. Koehn, J. Leveling, C. Monz, P. Pecina, M. Post,H. Saint-Amand, R. Soricut, L. Specia, and A. Tam-chyna. 2014. Findings of the 2014 Workshop onSMT. In WMT14.
C. Callison-Burch, P. Koehn, C. Monz, M. Post,R. Soricut, and L. Specia. 2012. Findings of the2012 Workshop on SMT. In WMT12.
J. G. Camargo de Souza, J. Gonzalez-Rubio, C. Buck,M. Turchi, and M. Negri. 2014. FBK-UPV-UEdin participation in the WMT14 Quality Estima-tion shared-task. In WMT14.
N. Q. Luong, L. Besacier, and B. Lecouteux. 2014.LIG System for Word Level QE task. In WMT14.
N. Okazaki. 2007. CRFsuite: a fast implementationof Conditional Random Fields. http://www.chokkan.org/software/crfsuite/.
F. Pedregosa, G. Varoquaux, A. Gramfort, V. Michel,B. Thirion, O. Grisel, M. Blondel, P. Pretten-hofer, R. Weiss, V. Dubourg, J. Vanderplas, A. Pas-sos, D. Cournapeau, M. Brucher, M. Perrot, andE. Duchesnay. Scikit-learn: Machine learning inPython. Journal of Machine Learning Research, 12.
S. Raybaud, D. Langlois, and K. Smali. 2011. Thissentence is wrong. Detecting errors in machine-translated sentences. Machine Translation, 25(1).
C. Scarton and L. Specia. 2014. Document-level trans-lation quality estimation: exploring discourse andpseudo-references. In EAMT14.
C. Scarton, M. Zampieri, M. Vela, J. van Genabith, andL. Specia. 2015. Searching for Context: a Studyon Document-Level Labels for Translation QualityEstimation. In EAMT15.
K. Shah and L. Specia. 2014. Quality estimation fortranslation selection. In EAMT14.
R. Soricut and A. Echihabi. 2010. Trustrank: Induc-ing trust in automatic translations via ranking. InACL10.
L. Specia, K. Shah, J. G. C. de Souza, and T. Cohn.2013. Quest - a translation quality estimation frame-work. In ACL13.
L. Specia. 2011. Exploiting objective annotationsfor measuring translation post-editing effort. InEAMT11.
G. Wisniewski, N. Pcheux, A. Allauzen, and F. Yvon.2014. LIMSI Submission for WMT’14 QE Task. InWMT14.
B. T. M. Wong and C. Kit. 2012. Extending machinetranslation evaluation metrics with lexical cohesionto document level. In EMNLP/CONLL.
D. Xiong, M. Zhang, and H. Li. 2010. Error detectionfor SMT using linguistic features. In ACL10.
120
Page 91 of 146
Quality Translation 21D3.3: Evaluation metrics and analysis of first annotation round
J SHEF-MIME: Word-level Quality Estimation Using Imitation Learn-ing
Proceedings of the First Conference on Machine Translation, Volume 2: Shared Task Papers, pages 772–776,Berlin, Germany, August 11-12, 2016. c©2016 Association for Computational Linguistics
SHEF-MIME: Word-level Quality Estimation Using Imitation Learning
Daniel Beck Andreas Vlachos Gustavo H. Paetzold Lucia SpeciaDepartment of Computer Science
University of Sheffield, UKdebeck1,a.vlachos,gpaetzold1,[email protected]
Abstract
We describe University of Sheffield’s sub-mission to the word-level Quality Estima-tion shared task. Our system is based onimitation learning, an approach to struc-tured prediction which relies on a classifiertrained on data generated appropriately toameliorate error propagation. Comparedto other structure prediction approachessuch as conditional random fields, it al-lows the use of arbitrary information fromprevious tag predictions and the use ofnon-decomposable loss functions over thestructure. We explore these two aspectsin our submission while using the baselinefeatures provided by the shared task organ-isers. Our system outperformed the con-ditional random field baseline while usingthe same feature set.
1 Introduction
Quality estimation (QE) models aim at predictingthe quality of machine translated (MT) text (Blatzet al., 2004; Specia et al., 2009). This predictioncan be at several levels, including word-, sentence-and document-level. In this paper we focus onour submission to the word-level QE WMT 2016shared task, where the goal is to assign quality la-bels to each word of the output of an MT system.
Word-level QE is traditionally treated as a struc-tured prediction problem, similar to part-of-speech(POS) tagging. The baseline model used in theshared task employs a Conditional Random Field(CRF) (Lafferty et al., 2001) with a set of baselinefeatures. Our system uses a linear classificationmodel trained with imitation learning (Daume IIIet al., 2009; Ross et al., 2011). Compared to thebaseline approach that uses a CRF, imitation learn-ing has two benefits:
• We can directly use the proposed evaluationmetric as the loss to be minimised duringtraining;• It allows using richer information from pre-
vious label predictions in the sentence.Our primary goal with our submissions was to
examine if the above benefits would result in bet-ter accuracy than that for the CRF. For this reason,we did not perform any feature engineering: wemade use instead of the same features as the base-line model. Both our submissions outperformedthe baseline, showing that there is still room forimprovements in terms of modelling, beyond fea-ture engineering.
2 Imitation Learning
A naive, but simple way to perform word-levelQE (and any word tagging problem) is to use anoff-the-shelf classifier to tag each word extractingfeatures based on the sentence. These usually in-clude features derived from the word being taggedand its context. The main difference between thisapproach and structure prediction methods is thatit treats each tag prediction as independent fromeach other, ignoring the structure behind the fulltag sequence for the sentence.
If we treat the observed sentence as a sequenceof words (from left to right) then we can modifythe above approach to perform a sequence of ac-tions, which in this case are tag predictions. Thissetting allows us to incorporate structural informa-tion in the classifier by using features based onprevious tag predictions. For instance, let us as-sume that we are trying to predict the tag ti forword wi. A simple classifier can use features de-rived from wi and also any other words in the sen-tence. By framing this as a sequence, it can alsouse features extracted from the previously pre-dicted tags t1:i−1.
772
Page 92 of 146
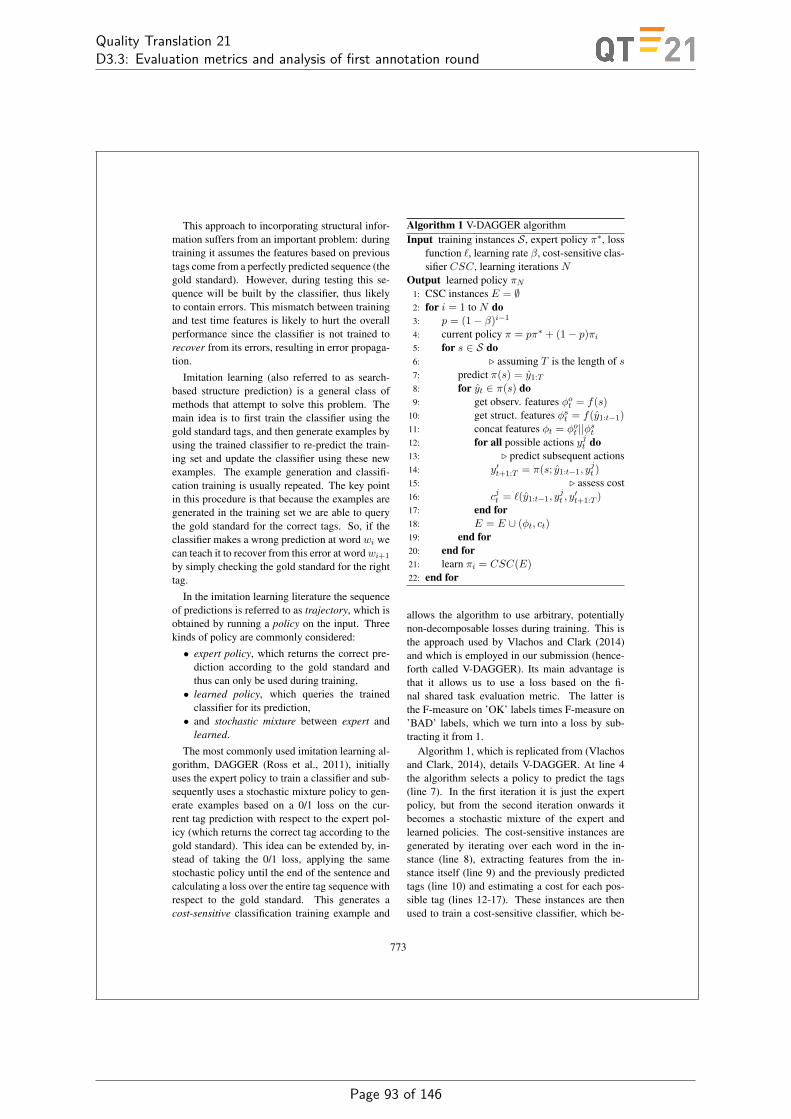
Quality Translation 21D3.3: Evaluation metrics and analysis of first annotation round
This approach to incorporating structural infor-mation suffers from an important problem: duringtraining it assumes the features based on previoustags come from a perfectly predicted sequence (thegold standard). However, during testing this se-quence will be built by the classifier, thus likelyto contain errors. This mismatch between trainingand test time features is likely to hurt the overallperformance since the classifier is not trained torecover from its errors, resulting in error propaga-tion.
Imitation learning (also referred to as search-based structure prediction) is a general class ofmethods that attempt to solve this problem. Themain idea is to first train the classifier using thegold standard tags, and then generate examples byusing the trained classifier to re-predict the train-ing set and update the classifier using these newexamples. The example generation and classifi-cation training is usually repeated. The key pointin this procedure is that because the examples aregenerated in the training set we are able to querythe gold standard for the correct tags. So, if theclassifier makes a wrong prediction at word wi wecan teach it to recover from this error at wordwi+1
by simply checking the gold standard for the righttag.
In the imitation learning literature the sequenceof predictions is referred to as trajectory, which isobtained by running a policy on the input. Threekinds of policy are commonly considered:
• expert policy, which returns the correct pre-diction according to the gold standard andthus can only be used during training,• learned policy, which queries the trained
classifier for its prediction,• and stochastic mixture between expert and
learned.
The most commonly used imitation learning al-gorithm, DAGGER (Ross et al., 2011), initiallyuses the expert policy to train a classifier and sub-sequently uses a stochastic mixture policy to gen-erate examples based on a 0/1 loss on the cur-rent tag prediction with respect to the expert pol-icy (which returns the correct tag according to thegold standard). This idea can be extended by, in-stead of taking the 0/1 loss, applying the samestochastic policy until the end of the sentence andcalculating a loss over the entire tag sequence withrespect to the gold standard. This generates acost-sensitive classification training example and
Algorithm 1 V-DAGGER algorithmInput training instances S , expert policy π∗, loss
function `, learning rate β, cost-sensitive clas-sifier CSC, learning iterations N
Output learned policy πN1: CSC instances E = ∅2: for i = 1 to N do3: p = (1− β)i−14: current policy π = pπ∗ + (1− p)πi5: for s ∈ S do6: . assuming T is the length of s7: predict π(s) = y1:T8: for yt ∈ π(s) do9: get observ. features φot = f(s)
10: get struct. features φst = f(y1:t−1)11: concat features φt = φot ||φst12: for all possible actions yjt do13: . predict subsequent actions14: y′t+1:T = π(s; y1:t−1, y
jt )
15: . assess cost16: cjt = `(y1:t−1, y
jt , y′t+1:T )
17: end for18: E = E ∪ (φt, ct)19: end for20: end for21: learn πi = CSC(E)22: end for
allows the algorithm to use arbitrary, potentiallynon-decomposable losses during training. This isthe approach used by Vlachos and Clark (2014)and which is employed in our submission (hence-forth called V-DAGGER). Its main advantage isthat it allows us to use a loss based on the fi-nal shared task evaluation metric. The latter isthe F-measure on ’OK’ labels times F-measure on’BAD’ labels, which we turn into a loss by sub-tracting it from 1.
Algorithm 1, which is replicated from (Vlachosand Clark, 2014), details V-DAGGER. At line 4the algorithm selects a policy to predict the tags(line 7). In the first iteration it is just the expertpolicy, but from the second iteration onwards itbecomes a stochastic mixture of the expert andlearned policies. The cost-sensitive instances aregenerated by iterating over each word in the in-stance (line 8), extracting features from the in-stance itself (line 9) and the previously predictedtags (line 10) and estimating a cost for each pos-sible tag (lines 12-17). These instances are thenused to train a cost-sensitive classifier, which be-
773
Page 93 of 146
Quality Translation 21D3.3: Evaluation metrics and analysis of first annotation round
comes the new learned policy (line 21). The wholeprocedure is repeated until a desired iteration bud-get N is reached.
The feature extraction step at lines 9 and 10 canbe made in a single step. We chose to split it be-tween observed and structural features to empha-sise the difference between our method and theCRF baseline. While CRFs in theory can employany kind of structural features, they are usually re-stricted to consider only the previous tag for effi-ciency (1st order Markov assumption).
3 Experimental Settings
The shared task dataset consists of 15k sentencestranslated from English to German using an MTsystem and post-edited by professional translators.The post-edited version of each sentence is usedto obtain quality tags for each word in the MToutput. In this shared task version, two tags areemployed: an ’OK’ tag means the word is correctand a ’BAD’ tag corresponds to a word that needsa post-editing action (either deletion, substitutionor the insertion of a new word). The official splitcorresponds to 12k, 1k and 2k for training, devel-opment and test sets.
Model Following (Vlachos and Clark, 2014),we use AROW (Crammer et al., 2009) for cost-sensitive classification learning. The loss functionis based on the official shared task evaluation met-ric: ` = 1− [F (OK)× F (BAD)], where F is thetag F-measure at the sentence level.
We experimented with two values for the learn-ing rate β and we submitted the best model foundfor each value. The first value is 0.3, which is thesame used by Vlachos and Clark (2014). The sec-ond one is 1.0, which essentially means we use theexpert policy only in the first iteration, switchingto using the learned policy afterwards.
For each setting we run up to 10 iterations ofimitation learning on the training set and evaluatethe score on the dev set after each iteration. Weselect our model in each learning rate setting bychoosing the one which performs the best on thedev set. For β = 1.0 this was achieved after 10iterations, but for β = 0.3 the best model was theone obtained after the 6th iteration.
Observed features The features based on theobserved instance are the same 22 used in thebaseline provided by the task organisers. Given
a word wi in the MT output, these features are de-fined below:• Word and context features:
– wi (the word itself)– wi−1– wi+1
– wsrci (the aligned word in the source)
– wsrci−1
– wsrci+1
• Sentence features:– Number of tokens in the source sentence– Number of tokens in the target sentence– Source/target token count ratio
• Binary indicators:– wi is a stopword– wi is a punctuation mark– wi is a proper noun– wi is a digit
• Language model features:– Size of largest n-gram with frequency >
0 starting with wi
– Size of largest n-gram with frequency >0 ending with wi
– Size of largest n-gram with frequency >0 starting with wsrc
i
– Size of largest n-gram with frequency >0 ending with wsrc
i
– Backoff behavior starting from wi
– Backoff behavior starting from wi−1– Backoff behavior starting from wi+1
• POS tag features:– The POS tag of wi
– The POS tag of wsrci
The language model backoff behavior featureswere calculated following the approach in (Ray-baud et al., 2011).
Structural features As explained in Section 2,a key advantage of imitation learning is the abilityto use arbitrary information from previous predic-tions. Our submission explores this by defining aset of features based on this information. Takingti as the tag to be predicted for the current word,these features are defined in the following way:• Previous tags:
– ti−1– ti−2– ti−3
• Previous tag n-grams:– ti−2||ti−1 (tag bigram)– ti−3||ti−2||ti−1 (tag trigram)
• Total number of ’BAD’ tags in t1:t−1
774
Page 94 of 146

Quality Translation 21D3.3: Evaluation metrics and analysis of first annotation round
Results Table 1 shows the official shared task re-sults for the baseline and our systems, in terms ofF1-MULT, the official evaluation metric, and alsoF1 for each of the classes. We report two versionsfor our submissions: the official one, which hadan implementation bug1 and a new version afterthe bug fix.
Both official submissions outperformed thebaseline, which is an encouraging result consid-ering that we used the same set of features as thebaseline. The submission which employed β = 1performed the best between the two. This is in linewith the observations of Ross et al. (2011) in sim-ilar sequential tagging tasks. This setting allowsthe classifier to move away from using the expertpolicy as soon as the first classifier is trained.
F1-BAD F1-OK F1-MULTBaseline (CRF) 0.3682 0.8800 0.3240Official submissionN = 6, β = 0.3 0.3909 0.8450 0.3303N = 10, β = 1.0 0.4029 0.8392 0.3380Fixed versionN = 9, β = 0.3 0.3996 0.8435 0.3370N = 9, β = 1.0 0.4072 0.8415 0.3426
Table 1: Official shared task results.
Analysis To obtain further insights about thebenefits of imitation learning for this task we per-formed additional experiments with different set-tings. In Table 2 we compare our systems witha system trained using a single round of training(called exact imitation), which corresponds to us-ing the same classifier trained only on the goldstandard tags. We can see that imitation learningimproves over this setting substantially.
Table 2 also shows results obtained using theoriginal DAGGER algorithm, which uses a sin-gle 0/1-loss per tag. While DAGGER improvesresults over the exact imitation setting, it is outper-formed by V-DAGGER. This is due to the abilityof V-DAGGER to incorporate the task loss into itstraining procedure2.
In Figure 1 we compare how the F1-MULTscores evolve through the imitation learning iter-ations for both DAGGER and V-DAGGER. Eventhough the performance of V-DAGGER fluctuates
1The structural feature ti−1 was not computed properly.2Formally, our loss is not exactly the same as the official
shared task evaluation metric since the former is measured atthe sentence level and the latter at the corpus level. Never-theless, the loss in V-DAGGER is much closer to the officialmetric than the 0/1-loss used by DAGGER.
F1-BAD F1-OK F1-MULTExact imitation 0.2503 0.8855 0.2217DAGGERN = 10, β = 0.3 0.3322 0.8483 0.2818N = 4, β = 1.0 0.3307 0.8758 0.2897V-DAGGERN = 9, β = 0.3 0.3996 0.8435 0.3370N = 9, β = 1.0 0.4072 0.8415 0.3426
Table 2: Comparison between our systems (V-DAGGER), exact imitation and DAGGER on thetest data.
Figure 1: Metric curves for DAGGER and V-DAGGER over the official development and testsets. Both settings use β = 1.0.
more than that of DAGGER, it is consistently bet-ter for both development and test sets.
Finally, we also compare our systems with sim-pler versions using a smaller set of structural fea-tures. The findings, presented in Table 3, showan interesting trend. The systems do not seem tobenefit from the additional structural informationavailable in imitation learning and even a systemwith no information at all (”None” in Table 3) out-performs the baseline. We speculate that this isbecause the task only deals with a linear chain ofbinary labels, which makes the structure much lessinformative compared to the observed features.
775
Page 95 of 146

Quality Translation 21D3.3: Evaluation metrics and analysis of first annotation round
F1-BAD F1-OK F1-MULTβ = 0.3None 0.3948 0.8536 0.3370ti−1 0.3873 0.8393 0.3251ti−1 + ti−2||ti−1 0.3991 0.8439 0.3368All 0.3996 0.8435 0.3370β = 1.0None 0.3979 0.8530 0.3394ti−1 0.4089 0.8436 0.3449ti−1 + ti−2||ti−1 0.4094 0.8429 0.3451All 0.4072 0.8415 0.3426
Table 3: Comparison between V-DAGGER sys-tems using different structural feature sets. Allmodels use the full set of observed features.
4 Conclusions
We presented the first attempt to use imitationlearning for the word-level QE task. One of themain strengths of our model is its ability to employnon-decomposable loss functions during the train-ing procedure. As our analysis shows, this was akey reason behind the positive results of our sub-missions with respect to the baseline system, sinceit allowed us to define a loss function using the of-ficial shared task evaluation metric. The proposedmethod also allows the use of arbitrary informa-tion from the predicted structure, although its im-pact was much less noticeable for this task.
The framework presented in this paper could beenhanced by going beyond the QE task and ap-plying actions in subsequent tasks, such as auto-matic post-editing. Since this framework allowsfor arbitrary loss functions it could be trained byoptimising MT metrics like BLEU or TER. Thechallenge in this case is how to derive expert poli-cies: unlike simple word tagging, multiple actionsequences could result in the same post-edited sen-tence.
Acknowledgements
This work was supported by CNPq (project SwB237999/2012-9, Daniel Beck), the QT21 project(H2020 No. 645452, Lucia Specia) and the EP-SRC grant Diligent (EP/M005429/1, Andreas Vla-chos).
ReferencesJohn Blatz, Erin Fitzgerald, and George Foster. 2004.
Confidence estimation for machine translation. InProceedings of the 20th Conference on Computa-tional Linguistics, pages 315–321.
Koby Crammer, Alex Kulesza, and Mark Dredze.
2009. Adaptive Regularization of Weight Vectors.In Advances in Neural Information Processing Sys-tems, pages 1–9.
Hal Daume III, John Langford, and Daniel Marcu.2009. Search-based structured prediction.
John D. Lafferty, Andrew McCallum, and FernandoC. N. Pereira. 2001. Conditional random fields:Probabilistic models for segmenting and labeling se-quence data. In Proceedings of the Eighteenth Inter-national Conference on Machine Learning, ICML’01, pages 282–289, San Francisco, CA, USA. Mor-gan Kaufmann Publishers Inc.
Sylvain Raybaud, David Langlois, and Kamel Smali.2011. This sentence is wrong. Detecting errors inmachine-translated sentences. Machine Translation,(1).
Stephane Ross, Geoffrey J. Gordon, and J. AndrewBagnell. 2011. A Reduction of Imitation Learn-ing and Structured Prediction to No-Regret OnlineLearning. In Proceedings of AISTATS, volume 15,pages 627–635.
Lucia Specia, Nicola Cancedda, Marc Dymetman,Marco Turchi, and Nello Cristianini. 2009. Estimat-ing the sentence-level quality of machine translationsystems. In Proceedings of EAMT, pages 28–35.
Andreas Vlachos and Stephen Clark. 2014. A NewCorpus for Context-Dependent Semantic Parsing.Transactions of the Association for ComputationalLinguistics, 2:547–559.
776
Page 96 of 146

Quality Translation 21D3.3: Evaluation metrics and analysis of first annotation round
K SHEF-NN: Translation Quality Estimation with Neural Networks
Proceedings of the Tenth Workshop on Statistical Machine Translation, pages 342–347,Lisboa, Portugal, 17-18 September 2015. c©2015 Association for Computational Linguistics.
SHEF-NN: Translation Quality Estimation with Neural NetworksKashif Shah§, Varvara Logacheva§, Gustavo Henrique Paetzold§, Frederic Blain§
Daniel Beck§, Fethi Bougares†, Lucia Specia§§Department of Computer Science, University of Sheffield, UK
kashif.shah,v.logacheva,ghpaetzold1,f.blain,debeck1,[email protected]
†LIUM, University of Le Mans, [email protected]
Abstract
We describe our systems for Tasks 1 and2 of the WMT15 Shared Task on Qual-ity Estimation. Our submissions use (i)a continuous space language model to ex-tract additional features for Task 1 (SHEF-GP, SHEF-SVM), (ii) a continuous bag-of-words model to produce word embed-dings as features for Task 2 (SHEF-W2V)and (iii) a combination of features pro-duced by QuEst++ and a feature producedwith word embedding models (SHEF-QuEst++). Our systems outperform thebaseline as well as many other submis-sions. The results are especially encour-aging for Task 2, where our best perform-ing system (SHEF-W2V) only uses fea-tures learned in an unsupervised fashion.
1 Introduction
Quality Estimation (QE) aims at measuring thequality of the Machine Translation (MT) outputwithout reference translations. Generally, QE isaddressed with various features indicating fluency,adequacy and complexity of the source-translationtext pair. Such features are then used along withMachine Learning methods in order for models tobe learned.
Features play a key role in QE. A wide rangeof features from the source segments and theirtranslations, often processed using external re-sources and tools, have been proposed. Thesego from simple, language-independent features, toadvanced, linguistically motivated features. Theyinclude features that rely on information from theMT system that generated the translations, andfeatures that are oblivious to the way translationswere produced. This leads to a potential bottle-neck: feature engineering can be time consuming,particularly because the impact of features vary
across datasets and language pairs. Also, mostfeatures in the literature are extracted from seg-ment pairs in isolation, ignoring contextual cluesfrom other segments in the text. The focus of ourcontributions this year is to introduce a new set offeatures which are language-independent, requireminimal resources, and can be extracted in unsu-pervised ways with the use of neural networks.
Word embeddings have shown their poten-tial in modelling long distance dependencies indata, including syntactic and semantic informa-tion. For instance, neural network language mod-els (Bengio et al., 2003) have been success-fully explored in many problems including Au-tomatic Speech Recognition (Schwenk and Gau-vain, 2005; Schwenk, 2007) and Machine Transla-tion (Schwenk, 2012). While neural network lan-guage models predict the next word given a pre-ceding context, (Mikolov et al., 2013b) proposeda neural network framework to predict the wordgiven the left and right contexts, or to predict theword’s left and right contexts in a given sentence.Recently, it has been shown that these distributedvector representations (or word embeddings) canbe exploited across languages to predict transla-tions (Mikolov et al., 2013a). The word represen-tations are learned from large monolingual data in-dependently for source and target languages. Asmall seed dictionary is used to learn mappingfrom the source into the target space. In this paper,we investigate the use of such resources in bothsentence-level (Task 1) and word-level QE (Task2). As we describe in what follows, we extractfeatures from such resources and use them to learnprediction models.
2 Continuous Space Language ModelFeatures for QE
Neural networks model non-linear relationshipsbetween the input features and target outputs.
342
Page 97 of 146
Quality Translation 21D3.3: Evaluation metrics and analysis of first annotation round
They often outperform other techniques in com-plex machine learning tasks. The inputs to theneural network language model used here (calledContinuous Space Language Model (CSLM)) arethe hj context words of the prediction: hj =wj−n+1, ..., wj−2, wj−1, and the outputs are theposterior probabilities of all words of the vocab-ulary: P (wj |hj) ∀i ∈ [1, N ] where N is the vo-cabulary size. CSLM encodes inputs using the socalled one-hot coding, i.e., the ith word in the vo-cabulary is coded by setting all element to 0 exceptthe ith element. Due to the large size of the outputlayer (vocabulary size), the computational com-plexity of a basic neural network language modelis very high. Schwenk et al. (2012) proposed animplementation of the neural network with effi-cient algorithms to reduce the computational com-plexity and speed up the processing using a subsetof the entire vocabulary called short list.
As compared to shallow neural networks, deepneural networks can use more hidden layers andhave been shown to perform better. In all CSLMexperiments described in this paper, we use deepneural networks with four hidden layers: a firstlayer for the word projection (320 units for eachcontext word) and three hidden layers of 1024units for the probability estimation. At the outputlayer, we use a softmax activation function ap-plied to a short list of the 32k most frequent words.The probabilities of the out of the short list wordsare obtained using a standard back-off n-gram lan-guage model. The training of the neural network isdone by the standard back-propagation algorithmand outputs are the posterior probabilities. The pa-rameters of the models are optimised on a held outdevelopment set.
Our CSLM models were trained with the CSLMtoolkit 1. We extracted the probabilities for Task1’s training, development and test sets for bothsource and its translation with their respective op-timised models and used them as features alongwith other available features in a supervised learn-ing algorithm. In Table 1, we report detailedstatistics on the monolingual data used to train theback-off LM and CSLM. The training dataset con-sists of Europarl, News-commentary and News-crawl corpora with the Moore-Lewis data selec-tion method (Moore and Lewis, 2010) to select theCSLM training data with respect to a Task’s devel-opment set. The CSLM models are tuned using a
1http://www-lium.univ-lemans.fr/cslm/
concatenation of newstest2012 and newstest2013of WMT’s translation track.
Lang. Train Dev LM px CSLM pxen 4.3G 137.7k 164.63 116.58es 21.2M 149.4k 145.49 87.14
Table 1: Training and dev datasets size (in numberof tokens) and models perplexity (px).
3 Word Embedding Features for QE
The word embeddings used in our experimentsare learned with the word2vec tool2, introducedby (Mikolov et al., 2013b). The tool pro-duces word embeddings using the DistributedSkip-Gram or Continuous Bag-of-Words (CBOW)models. The models are trained through the useof large amounts of monolingual data with a neu-ral network architecture that aims at predicting theneighbours of a given word. Unlike standard neu-ral network-based language models for predict-ing the next word given the context of precedingwords, a CBOW model predicts the word in themiddle given the representation of the surroundingwords, while the Skip-Gram model learns wordembedding representations that can be used to pre-dict a word’s context in the same sentence. As sug-gested by the authors, CBOW is faster and moreadequate for larger datasets, so we used this modelin our experiments.
We trained 500-dimensional representationswith CBOW for all words in the vocabulary. Weconsider a 10-word context window to either sideof the target word, sub-sampling option to 1e-05,and estimate the probability of a target word withthe negative sampling method, drawing 10 sam-ples from the noise distribution. The data used totrain the models is the same as presented in Ta-ble 1. We then extracted word embeddings forall words in the Task 2 training, development andtest sets from these models to be used as fea-tures. These distributed numerical representationsof words as features aim at locating each word asa point in a 500-dimensional space.
Inspired by the work of (Mikolov et al.,2013a), we extracted another feature by map-ping the source space onto a target space usinga seed dictionary (trained with Europarl + News-commentary + News-crawl). A given word and
2https://code.google.com/p/word2vec/
343
Page 98 of 146
Quality Translation 21D3.3: Evaluation metrics and analysis of first annotation round
its continuous vector representation a could bemapped to the other language space by comput-ing z = Ma, where M is a transformation matrixlearned with stochastic gradient descent. The as-sumption is that the vector representations of sim-ilar words in different languages are related by alinear transformation because of similar geomet-ric arrangements. The words whose representa-tion are closest to a in the target language space,using cosine similarity, are considered as poten-tial translations for a given word in the source lan-guage. Since the goal of QE is not to translatecontent, but to measure the quality of translations,we take the source-to-target similarity scores as afeature itself. To calculate it, we first learn wordalignments (see Section 4.2.2), and then computethe similarity scores between target word and thesource word aligned to it.
4 Experiments
We present experiments on the WMT15 QE Tasks1 and 2, with CSLM features for Task 1, and wordembedding features for Task 2.
4.1 Task 1
4.1.1 DatasetTask 1’s English-Spanish dataset consists respec-tively of a training set and development set with11, 271 and 1, 000 source segments, their ma-chine translations, the post-editions of the lat-ter, and edit distance scores between between theMT and its post-edited version (HTER). The testset consists of 1, 817 English-Spanish source-MTpairs. Translations are produced by a single on-line statistical MT system. Each of the translationswas post-edited by crowdsourced translators, andHTER labels were computed using the TER tool(settings: tokenised, case insensitive, exact match-ing only, with scores capped to 1).
4.1.2 Feature setWe extracted the following features:
• AF: 80 black-box features using the QuEstframework (Specia et al., 2013; Shah et al.,2013a) as described in Shah et al. (2013b).
• CSLM: A feature for each source and targetsentence using CSLM as described in Sec-tion 2.
• FS(AF): Top 20 features selected from theabove 82 features with Gaussian Processes
(GPs) by the procedure described in (Shah etal., 2013b).
4.1.3 Learning algorithmsWe use the Support Vector Machines implemen-tation in the scikit-learn toolkit (Pedregosaet al., 2011) to perform regression (SVR) on eachfeature set with either linear or RBF kernels andparameters optimised using grid search.
We also apply GPs with similar settings to thosein our WMT13 submission (Beck et al., 2013) us-ing GPy toolkit 3. For models with feature selec-tion, we train a GP, select the top 20 features ac-cording to the produced feature ranking, and thenretrain a SparseGP on the full training set usingthese 20 features and 50 inducing points. To eval-uate the prediction models we use Mean AbsoluteError (MAE), its squared version – Root MeanSquared Error (RMSE), and Spearman’s Correla-tion.
4.2 Task 2
4.2.1 DatasetThe data for this is the same as the one providedin Task 1. All segments have been automaticallyannotated for errors with binary word-level labels(“GOOD” and “BAD”) by using the alignmentsprovided by the TER tool (settings: tokenised,case insensitive, exact matching only, disablingshifts by using the ‘-d 0‘ option) between machinetranslations and their post-edited versions. Theedit operations considered as errors (“BAD”) arereplacements and insertions.
4.2.2 Word alignment trainingTo extract word embedding features, as explainedin Section 3, we need word-to-word alignmentsbetween source and target data. As word-levelalignments between the source and target corporawere not made available by WMT, we first alignedthe QE datasets with a bilingual word-level align-ment model trained on the same data used forthe word2vec modelling step, with the help of theGIZA++ toolkit (Och and Ney, 2003). Workingon target side, we refined the resulting n-m target-to-source word alignments to a set of 1-m align-ments by filtering potential spurious source-sidecandidates out. To do so, the decision was basedon the lexical probabilities extracted from the pre-vious alignment training step. Hence, each target-
3http://sheffieldml.github.io/GPy/
344
Page 99 of 146
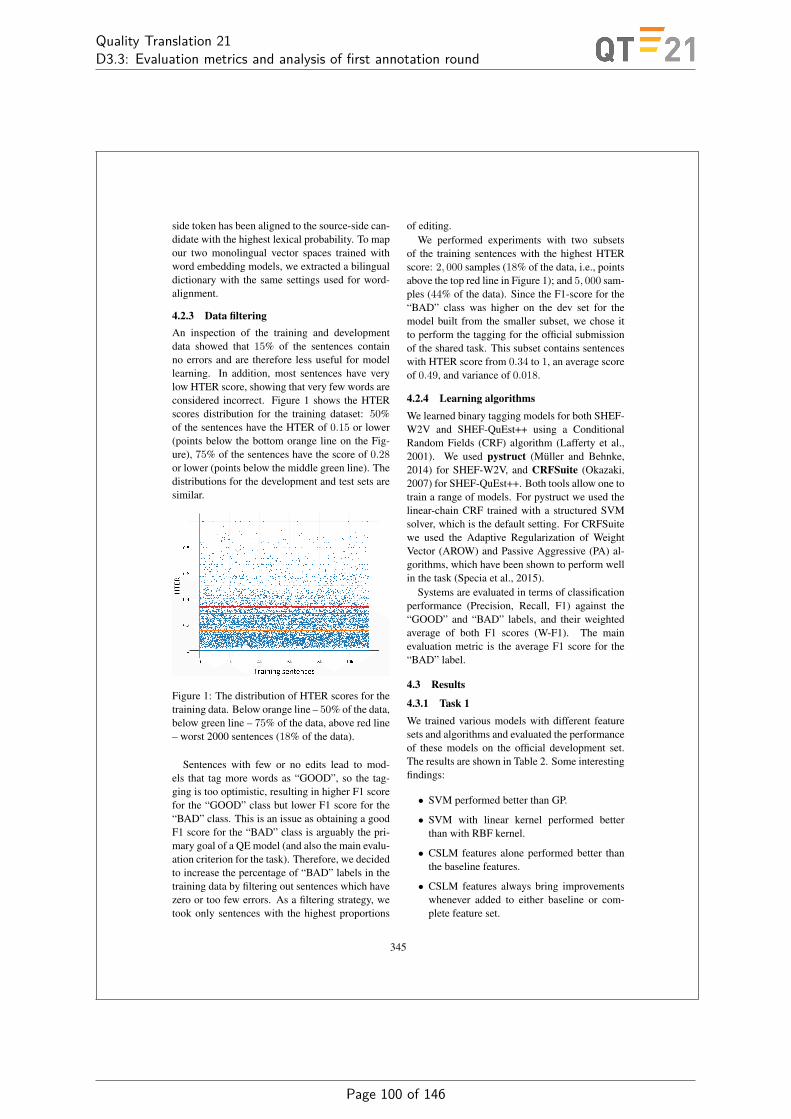
Quality Translation 21D3.3: Evaluation metrics and analysis of first annotation round
side token has been aligned to the source-side can-didate with the highest lexical probability. To mapour two monolingual vector spaces trained withword embedding models, we extracted a bilingualdictionary with the same settings used for word-alignment.
4.2.3 Data filteringAn inspection of the training and developmentdata showed that 15% of the sentences containno errors and are therefore less useful for modellearning. In addition, most sentences have verylow HTER score, showing that very few words areconsidered incorrect. Figure 1 shows the HTERscores distribution for the training dataset: 50%of the sentences have the HTER of 0.15 or lower(points below the bottom orange line on the Fig-ure), 75% of the sentences have the score of 0.28or lower (points below the middle green line). Thedistributions for the development and test sets aresimilar.
Figure 1: The distribution of HTER scores for thetraining data. Below orange line – 50% of the data,below green line – 75% of the data, above red line– worst 2000 sentences (18% of the data).
Sentences with few or no edits lead to mod-els that tag more words as “GOOD”, so the tag-ging is too optimistic, resulting in higher F1 scorefor the “GOOD” class but lower F1 score for the“BAD” class. This is an issue as obtaining a goodF1 score for the “BAD” class is arguably the pri-mary goal of a QE model (and also the main evalu-ation criterion for the task). Therefore, we decidedto increase the percentage of “BAD” labels in thetraining data by filtering out sentences which havezero or too few errors. As a filtering strategy, wetook only sentences with the highest proportions
of editing.We performed experiments with two subsets
of the training sentences with the highest HTERscore: 2, 000 samples (18% of the data, i.e., pointsabove the top red line in Figure 1); and 5, 000 sam-ples (44% of the data). Since the F1-score for the“BAD” class was higher on the dev set for themodel built from the smaller subset, we chose itto perform the tagging for the official submissionof the shared task. This subset contains sentenceswith HTER score from 0.34 to 1, an average scoreof 0.49, and variance of 0.018.
4.2.4 Learning algorithmsWe learned binary tagging models for both SHEF-W2V and SHEF-QuEst++ using a ConditionalRandom Fields (CRF) algorithm (Lafferty et al.,2001). We used pystruct (Muller and Behnke,2014) for SHEF-W2V, and CRFSuite (Okazaki,2007) for SHEF-QuEst++. Both tools allow one totrain a range of models. For pystruct we used thelinear-chain CRF trained with a structured SVMsolver, which is the default setting. For CRFSuitewe used the Adaptive Regularization of WeightVector (AROW) and Passive Aggressive (PA) al-gorithms, which have been shown to perform wellin the task (Specia et al., 2015).
Systems are evaluated in terms of classificationperformance (Precision, Recall, F1) against the“GOOD” and “BAD” labels, and their weightedaverage of both F1 scores (W-F1). The mainevaluation metric is the average F1 score for the“BAD” label.
4.3 Results
4.3.1 Task 1We trained various models with different featuresets and algorithms and evaluated the performanceof these models on the official development set.The results are shown in Table 2. Some interestingfindings:
• SVM performed better than GP.
• SVM with linear kernel performed betterthan with RBF kernel.
• CSLM features alone performed better thanthe baseline features.
• CSLM features always bring improvementswhenever added to either baseline or com-plete feature set.
345
Page 100 of 146
Quality Translation 21D3.3: Evaluation metrics and analysis of first annotation round
System. Kernel Features #. of Feats. MAE RMSE Spear. CorrBaseline (SVM) RBF BL 17 0.1479 0.1965 0.1651
SHEF-SVM RBF CSLM 2 0.1474 0.1959 0.1911SHEF-SVM RBF BL+CSLM 19 0.1464 0.1950 0.1924SHEF-SVM RBF AF 80 0.1497 0.1944 0.2259SHEF-SVM RBF AF+CSLM 82 0.1452 0.1920 0.2325SHEF-SVM Linear AF+CSLM 82 0.1422 0.1889 0.2736SHEF-SVM Linear AF(FS) 20 0.1459 0.1896 0.2465SHEF-GP RBF AF(FS) 20 0.1493 0.1917 0.2187
Table 2: Results on development set of Task 1.
System. MAE RMSE DeltaAvg Spear. CorrBaseline 0.15 0.19 0.22 0.13
SHEF-SVM 0.14 0.18 0.51 0.28SHEF-GP 0.15 0.19 0.31 0.28
Table 3: Official results on test set of Task 1.
• Linear SVM with selected features by GPachieves comparable results to linear SVMwith the full feature set (82).
• Both CSLM features appear in the top 20 se-lected features by GP.
Based on these findings, as official submissionsfor Task 1, we put forward a system with linearSVM using 82 features, and another with GP onthe selected feature set. The official results areshown in Table 3.
4.3.2 Task 2For the SHEF-QuEst++ system, we combined all40 features described in (Specia et al., 2015) withthe source-to-target similarity feature described inSection 3. For the SHEF-W2V system, we triedseveral settings on the development data in orderto define the best-performing set of features anddataset size. We used two feature sets:
• 500-dimensional word embedding vectorsfor the target word only.
• 500-dimensional word embedding vectorsfor the target word and the source wordaligned to it.
In addition, both these feature sets included thesource-to-target similarity feature. We performedthe data filtering technique described in 4.2.3, andtested the systems using:
• The full dataset.
• 5K sentences with the highest HTER score.
• 2K sentences with the highest HTER score.
System W-F1 F1 Bad F1 GoodBaseline 75.48 17.07 89.07
MONO-ALL 72.31 0.35 89.39MONO-5000 74.47 14.82 88.63MONO-2000 65.83 35.38 73.06
MONO-2000-SIM 65.87 35.53 73.07BI-ALL 72.23 0.0 89.38BI-5000 75.37 22.77 87.86BI-2000 64.78 38.64 70.99
BI-2000-SIM 64.56 38.45 70.76QuEst++-AROW-SIM 68.58 38.54 75.72
QuEst++-PA-SIM 26.42 34.86 24.42
Table 4: Results on development set of Task 2.
Results on the development set are outlined inTable 4. The system names are formed as follows:“MONO” or “BI” indicate that the SHEF-W2Vsystem was trained on the target or target+sourceword embeddings feature set. “ALL”, “5000” and“2000” indicate that we used the entire trainingset, 5, 000 sentences or 2, 000 sentences, respec-tively. The prefix “SIM” means that the featuresets were enhanced with the vector similarity fea-ture. Finally, “AROW” and “PA” correspond to thetwo learning algorithms used by SHEF-QuEst++.
Combining the target and source-side word em-bedding vectors was found to improve the per-formance of SHEF-W2V compared to using onlytarget-side vectors. The impact of the similarityfeature is less clear: it slightly improved the per-formance of the monolingual feature set, but de-creased the scores for the bilingual feature set. Wecan also notice that the AROW algorithm is muchmore effective than the PA algorithm for SHEF-QuEst++.
Filtering out sentences that are mostly correctallowed to achieve much higher F1-scores for the“BAD” class. The best results were achieved witha relatively small subset of the data (18%). There-fore, as our official submissions, we chose themodel using bilingual vectors trained on 2,000sentences with the highest HTER score, and thesame model extended with the similarity feature.
346
Page 101 of 146
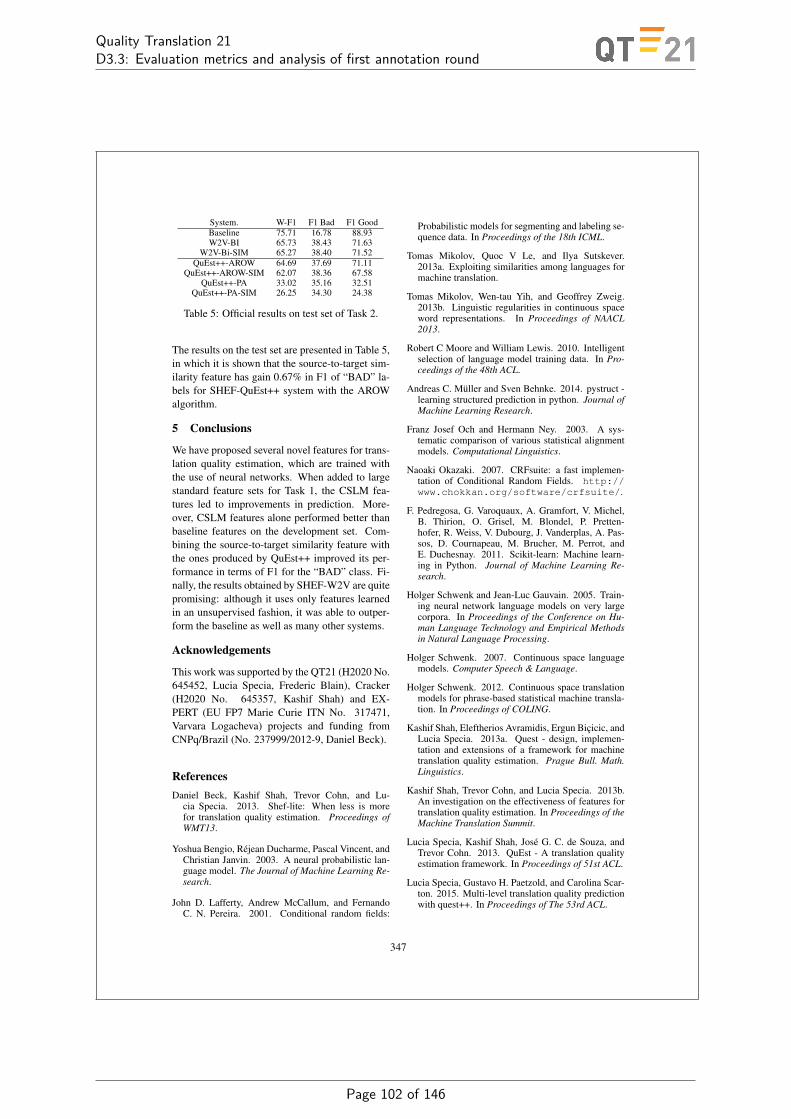
Quality Translation 21D3.3: Evaluation metrics and analysis of first annotation round
System. W-F1 F1 Bad F1 GoodBaseline 75.71 16.78 88.93W2V-BI 65.73 38.43 71.63
W2V-Bi-SIM 65.27 38.40 71.52QuEst++-AROW 64.69 37.69 71.11
QuEst++-AROW-SIM 62.07 38.36 67.58QuEst++-PA 33.02 35.16 32.51
QuEst++-PA-SIM 26.25 34.30 24.38
Table 5: Official results on test set of Task 2.
The results on the test set are presented in Table 5,in which it is shown that the source-to-target sim-ilarity feature has gain 0.67% in F1 of “BAD” la-bels for SHEF-QuEst++ system with the AROWalgorithm.
5 Conclusions
We have proposed several novel features for trans-lation quality estimation, which are trained withthe use of neural networks. When added to largestandard feature sets for Task 1, the CSLM fea-tures led to improvements in prediction. More-over, CSLM features alone performed better thanbaseline features on the development set. Com-bining the source-to-target similarity feature withthe ones produced by QuEst++ improved its per-formance in terms of F1 for the “BAD” class. Fi-nally, the results obtained by SHEF-W2V are quitepromising: although it uses only features learnedin an unsupervised fashion, it was able to outper-form the baseline as well as many other systems.
Acknowledgements
This work was supported by the QT21 (H2020 No.645452, Lucia Specia, Frederic Blain), Cracker(H2020 No. 645357, Kashif Shah) and EX-PERT (EU FP7 Marie Curie ITN No. 317471,Varvara Logacheva) projects and funding fromCNPq/Brazil (No. 237999/2012-9, Daniel Beck).
ReferencesDaniel Beck, Kashif Shah, Trevor Cohn, and Lu-
cia Specia. 2013. Shef-lite: When less is morefor translation quality estimation. Proceedings ofWMT13.
Yoshua Bengio, Rejean Ducharme, Pascal Vincent, andChristian Janvin. 2003. A neural probabilistic lan-guage model. The Journal of Machine Learning Re-search.
John D. Lafferty, Andrew McCallum, and FernandoC. N. Pereira. 2001. Conditional random fields:
Probabilistic models for segmenting and labeling se-quence data. In Proceedings of the 18th ICML.
Tomas Mikolov, Quoc V Le, and Ilya Sutskever.2013a. Exploiting similarities among languages formachine translation.
Tomas Mikolov, Wen-tau Yih, and Geoffrey Zweig.2013b. Linguistic regularities in continuous spaceword representations. In Proceedings of NAACL2013.
Robert C Moore and William Lewis. 2010. Intelligentselection of language model training data. In Pro-ceedings of the 48th ACL.
Andreas C. Muller and Sven Behnke. 2014. pystruct -learning structured prediction in python. Journal ofMachine Learning Research.
Franz Josef Och and Hermann Ney. 2003. A sys-tematic comparison of various statistical alignmentmodels. Computational Linguistics.
Naoaki Okazaki. 2007. CRFsuite: a fast implemen-tation of Conditional Random Fields. http://www.chokkan.org/software/crfsuite/.
F. Pedregosa, G. Varoquaux, A. Gramfort, V. Michel,B. Thirion, O. Grisel, M. Blondel, P. Pretten-hofer, R. Weiss, V. Dubourg, J. Vanderplas, A. Pas-sos, D. Cournapeau, M. Brucher, M. Perrot, andE. Duchesnay. 2011. Scikit-learn: Machine learn-ing in Python. Journal of Machine Learning Re-search.
Holger Schwenk and Jean-Luc Gauvain. 2005. Train-ing neural network language models on very largecorpora. In Proceedings of the Conference on Hu-man Language Technology and Empirical Methodsin Natural Language Processing.
Holger Schwenk. 2007. Continuous space languagemodels. Computer Speech & Language.
Holger Schwenk. 2012. Continuous space translationmodels for phrase-based statistical machine transla-tion. In Proceedings of COLING.
Kashif Shah, Eleftherios Avramidis, Ergun Bicicic, andLucia Specia. 2013a. Quest - design, implemen-tation and extensions of a framework for machinetranslation quality estimation. Prague Bull. Math.Linguistics.
Kashif Shah, Trevor Cohn, and Lucia Specia. 2013b.An investigation on the effectiveness of features fortranslation quality estimation. In Proceedings of theMachine Translation Summit.
Lucia Specia, Kashif Shah, Jose G. C. de Souza, andTrevor Cohn. 2013. QuEst - A translation qualityestimation framework. In Proceedings of 51st ACL.
Lucia Specia, Gustavo H. Paetzold, and Carolina Scar-ton. 2015. Multi-level translation quality predictionwith quest++. In Proceedings of The 53rd ACL.
347
Page 102 of 146
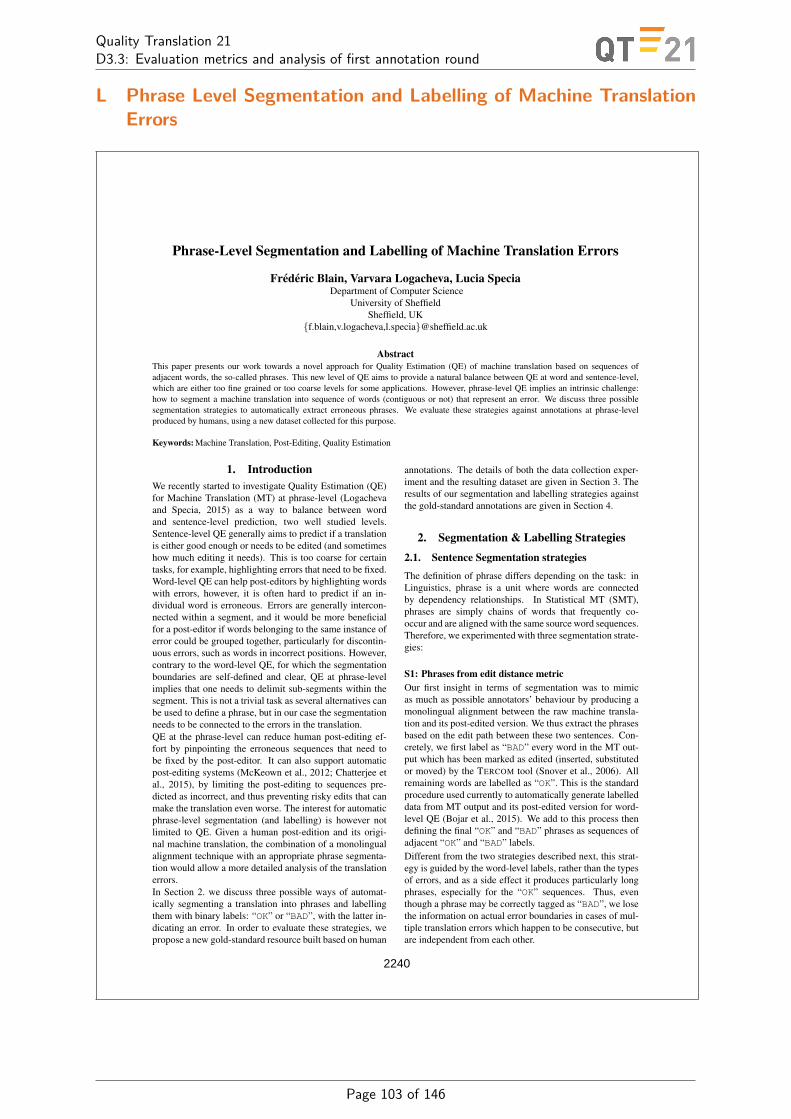
Quality Translation 21D3.3: Evaluation metrics and analysis of first annotation round
L Phrase Level Segmentation and Labelling of Machine TranslationErrors
Phrase-Level Segmentation and Labelling of Machine Translation Errors
Frederic Blain, Varvara Logacheva, Lucia SpeciaDepartment of Computer Science
University of SheffieldSheffield, UK
f.blain,v.logacheva,[email protected]
AbstractThis paper presents our work towards a novel approach for Quality Estimation (QE) of machine translation based on sequences ofadjacent words, the so-called phrases. This new level of QE aims to provide a natural balance between QE at word and sentence-level,which are either too fine grained or too coarse levels for some applications. However, phrase-level QE implies an intrinsic challenge:how to segment a machine translation into sequence of words (contiguous or not) that represent an error. We discuss three possiblesegmentation strategies to automatically extract erroneous phrases. We evaluate these strategies against annotations at phrase-levelproduced by humans, using a new dataset collected for this purpose.
Keywords: Machine Translation, Post-Editing, Quality Estimation
1. IntroductionWe recently started to investigate Quality Estimation (QE)for Machine Translation (MT) at phrase-level (Logachevaand Specia, 2015) as a way to balance between wordand sentence-level prediction, two well studied levels.Sentence-level QE generally aims to predict if a translationis either good enough or needs to be edited (and sometimeshow much editing it needs). This is too coarse for certaintasks, for example, highlighting errors that need to be fixed.Word-level QE can help post-editors by highlighting wordswith errors, however, it is often hard to predict if an in-dividual word is erroneous. Errors are generally intercon-nected within a segment, and it would be more beneficialfor a post-editor if words belonging to the same instance oferror could be grouped together, particularly for discontin-uous errors, such as words in incorrect positions. However,contrary to the word-level QE, for which the segmentationboundaries are self-defined and clear, QE at phrase-levelimplies that one needs to delimit sub-segments within thesegment. This is not a trivial task as several alternatives canbe used to define a phrase, but in our case the segmentationneeds to be connected to the errors in the translation.QE at the phrase-level can reduce human post-editing ef-fort by pinpointing the erroneous sequences that need tobe fixed by the post-editor. It can also support automaticpost-editing systems (McKeown et al., 2012; Chatterjee etal., 2015), by limiting the post-editing to sequences pre-dicted as incorrect, and thus preventing risky edits that canmake the translation even worse. The interest for automaticphrase-level segmentation (and labelling) is however notlimited to QE. Given a human post-edition and its origi-nal machine translation, the combination of a monolingualalignment technique with an appropriate phrase segmenta-tion would allow a more detailed analysis of the translationerrors.In Section 2. we discuss three possible ways of automat-ically segmenting a translation into phrases and labellingthem with binary labels: “OK” or “BAD”, with the latter in-dicating an error. In order to evaluate these strategies, wepropose a new gold-standard resource built based on human
annotations. The details of both the data collection exper-iment and the resulting dataset are given in Section 3. Theresults of our segmentation and labelling strategies againstthe gold-standard annotations are given in Section 4.
2. Segmentation & Labelling Strategies
2.1. Sentence Segmentation strategies
The definition of phrase differs depending on the task: inLinguistics, phrase is a unit where words are connectedby dependency relationships. In Statistical MT (SMT),phrases are simply chains of words that frequently co-occur and are aligned with the same source word sequences.Therefore, we experimented with three segmentation strate-gies:
S1: Phrases from edit distance metricOur first insight in terms of segmentation was to mimicas much as possible annotators’ behaviour by producing amonolingual alignment between the raw machine transla-tion and its post-edited version. We thus extract the phrasesbased on the edit path between these two sentences. Con-cretely, we first label as “BAD” every word in the MT out-put which has been marked as edited (inserted, substitutedor moved) by the TERCOM tool (Snover et al., 2006). Allremaining words are labelled as “OK”. This is the standardprocedure used currently to automatically generate labelleddata from MT output and its post-edited version for word-level QE (Bojar et al., 2015). We add to this process thendefining the final “OK” and “BAD” phrases as sequences ofadjacent “OK” and “BAD” labels.Different from the two strategies described next, this strat-egy is guided by the word-level labels, rather than the typesof errors, and as a side effect it produces particularly longphrases, especially for the “OK” sequences. Thus, eventhough a phrase may be correctly tagged as “BAD”, we losethe information on actual error boundaries in cases of mul-tiple translation errors which happen to be consecutive, butare independent from each other.
2240
Page 103 of 146

Quality Translation 21D3.3: Evaluation metrics and analysis of first annotation round
S2: Linguistically motivated phrasesA key component to make a translation correct in the targetlanguage is the use of words that, when put together, makea coherent sub-sequences of words. This is particularly truefor morphologically rich languages. On this basis, our mo-tivation is to make use of linguistic information to deter-mine the sentence segmentation. Therefore, our phrases areextracted from the shallow syntactic structure of the sen-tence (Constant et al., 2011), the so-called chunks, basedon TreeTagger (Schmid, 1994). In future work, we coulduse dependency structures to assess whether the labellingof a phrase is dependent on or influences other phrases tore-define error boundaries. These error dependencies are awell-known phenomenon in MT, as it has been identifiedin (Blain et al., 2011).
S3: Decoder phrasesThis approach, described in the research on phrase-level QEof (Logacheva and Specia, 2015), considers phrases in theSMT sense: sequences of words which often occur togetherand can be translated as one instance. The idea is to reusethe phrase segmentation produced by the decoder, with twohypotheses: (i) MT errors are usually context-dependent, soby dealing with the whole phrase we provide the local con-text related to the choice of a given word in phrase-basedSMT and can more easily detect a single error which spansover two or more words, (ii) detecting errors at this levelcould be directly useful for using phrase-level quality pre-dictions as additional features in an SMT decoder.Sentences could thus be simply segmented into phrasesbased on the phrases actually used by SMT system decoder.However, since in our case we take an existing corpus, weneed to re-translate the sentences in this corpus to obtainthe phrase segmentation. We suggest two strategies:
• The source sentence is decoded by a source-targetSMT system in a way that the output should be iden-tical to the automatic translation in the corpus (i.e.,“forced decoding”). This yields the segmentation ofboth source and target sentences with a one-to-onecorrespondence of segments.
• The target sentence is decoded by a target-source SMTsystem with no constraints. This decoding generatesonly the target part of the segmentation, the sourcephrases are generated from all source words alignedto words of a given target phrase.
The first scenario has the following drawback: when weperform forced decoding using an phrase table that is notexactly the same as that of the original system, the givenreference translation is likely to be unreachable. In otherwords, the system can lack phrase pairs that translate sourcephrases to the given reference phrases. Therefore, in orderto deliver the phrase segmentations for the given data weuse a phrase table trained on the sentences we are decod-ing. This approach yields translations for the majority ofsentences. However, for some of them (around 20% sen-tences for the considered dataset), the references still can-not be reached. In these cases we consider every word as aseparate phrase.
The second scenario is more flexible: it is able to generatea segmentation for all sentences. However, similarly to thesource-target approach, it depends on the data, in particular,on the training data of the SMT system used for decoding.If the data used for the MT system training and the sen-tences we are going to decode belong to different domains,there will be little intersection between the MT system’sphrase table and the decoded sentences. As a result, thevast majority of identified phrases will be one-word, whichwill reduce the phrase-level QE task to the word-level QE.For the target-source decoding strategy we used an SMTsystem trained on the English-French part of Europarl cor-pus (Koehn, 2005), built based on the Moses toolkit withstandard settings (Koehn et al., 2007). Since our gold-standard sentences come from the LIG corpus, which wasdrawn from WMT test sets of different years (news do-main), the system we used for decoding can be consideredin-domain.
2.2. Phrase LabellingOur labelling strategy is based on comparing the MT sen-tences and their version post-edited by a human, as it isdone for labelling of word-level QE training data. Thisis only possible for labelling datasets at “training time” orfor evaluation / translation quality analysis. Another optionwould be to rely on humans to tag each phrase as “OK” or“BAD”, but this is costly and time consuming for the scaleof datasets necessary for QE (thousands of sentences).As one would expect, except for the phrases based on editdistance between the MT output and its post-edited version,the phrases generated automatically do not often match ex-actly the sequences labelled by the post-editor (i.e. spansof words labelled as “BAD” by the post-editor). So aphrase can contain words with both “BAD” and “OK” la-bels, whereas we need a single label for the entire phrase.Therefore, in cases of ambiguous labelling we use one ofthree heuristics to define a phrase-level label:
• optimistic – if half or more of words have a label “OK”,the phrase has the label “OK” (majority labelling).That labelling was intended to keep the original bal-ance of “OK” and “BAD” tags.
• pessimistic – if 30% words or more have a label“BAD”, the phrase has the label “BAD”. This strat-egy can be used in cases when the number of “BAD”words is not large and/or when the ‘optimistic’ la-belling eliminates too many of them. The percentageof errors was chosen in order to convert three-wordphrases with one “BAD” word into “BAD” phrases.
• super-pessimistic – if any word in the phrase has alabel “BAD”, the whole phrase has the label “BAD”.This strategy is motivated by the possibility of usingphrase-level QE to support phrase-based MT decod-ing. At each step of the search process the decoderchooses a new phrase, and ideally the best candidatephrase should contain only correct words. If one ofthe words does not fit the context, the entire phraseshould be considered unsuitable.
2241
Page 104 of 146
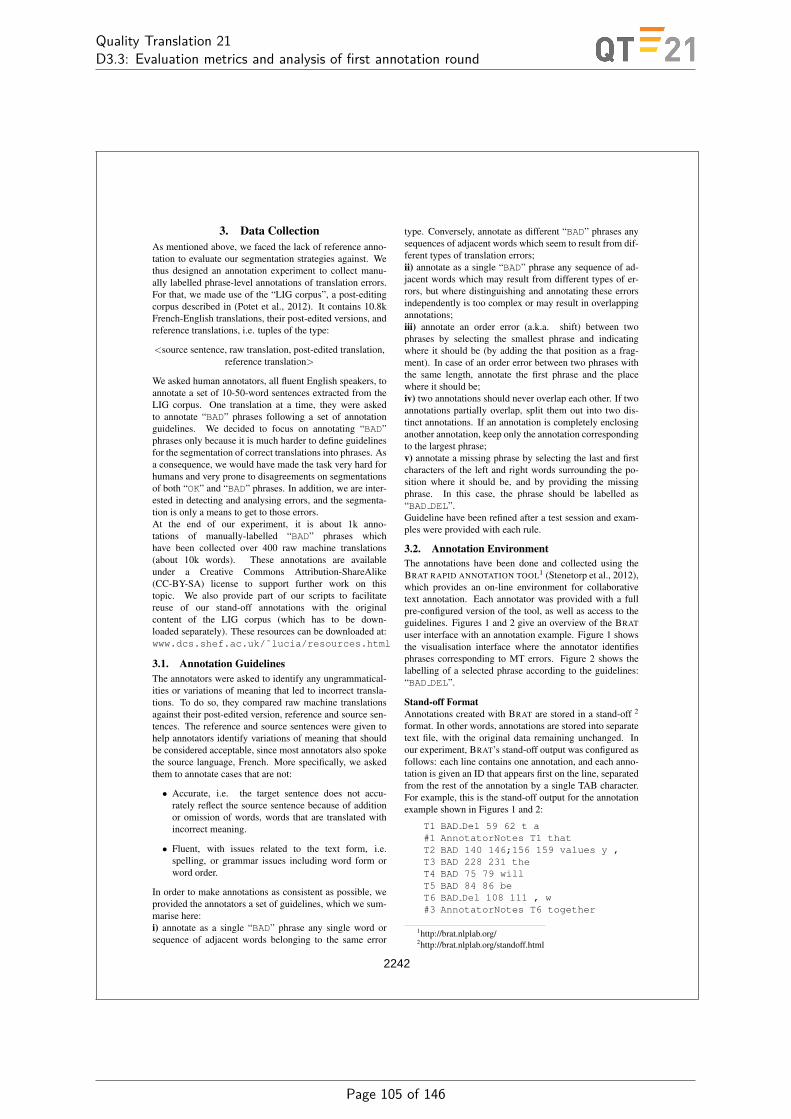
Quality Translation 21D3.3: Evaluation metrics and analysis of first annotation round
3. Data CollectionAs mentioned above, we faced the lack of reference anno-tation to evaluate our segmentation strategies against. Wethus designed an annotation experiment to collect manu-ally labelled phrase-level annotations of translation errors.For that, we made use of the “LIG corpus”, a post-editingcorpus described in (Potet et al., 2012). It contains 10.8kFrench-English translations, their post-edited versions, andreference translations, i.e. tuples of the type:
<source sentence, raw translation, post-edited translation,reference translation>
We asked human annotators, all fluent English speakers, toannotate a set of 10-50-word sentences extracted from theLIG corpus. One translation at a time, they were askedto annotate “BAD” phrases following a set of annotationguidelines. We decided to focus on annotating “BAD”phrases only because it is much harder to define guidelinesfor the segmentation of correct translations into phrases. Asa consequence, we would have made the task very hard forhumans and very prone to disagreements on segmentationsof both “OK” and “BAD” phrases. In addition, we are inter-ested in detecting and analysing errors, and the segmenta-tion is only a means to get to those errors.At the end of our experiment, it is about 1k anno-tations of manually-labelled “BAD” phrases whichhave been collected over 400 raw machine translations(about 10k words). These annotations are availableunder a Creative Commons Attribution-ShareAlike(CC-BY-SA) license to support further work on thistopic. We also provide part of our scripts to facilitatereuse of our stand-off annotations with the originalcontent of the LIG corpus (which has to be down-loaded separately). These resources can be downloaded at:www.dcs.shef.ac.uk/˜lucia/resources.html
3.1. Annotation GuidelinesThe annotators were asked to identify any ungrammatical-ities or variations of meaning that led to incorrect transla-tions. To do so, they compared raw machine translationsagainst their post-edited version, reference and source sen-tences. The reference and source sentences were given tohelp annotators identify variations of meaning that shouldbe considered acceptable, since most annotators also spokethe source language, French. More specifically, we askedthem to annotate cases that are not:
• Accurate, i.e. the target sentence does not accu-rately reflect the source sentence because of additionor omission of words, words that are translated withincorrect meaning.
• Fluent, with issues related to the text form, i.e.spelling, or grammar issues including word form orword order.
In order to make annotations as consistent as possible, weprovided the annotators a set of guidelines, which we sum-marise here:i) annotate as a single “BAD” phrase any single word orsequence of adjacent words belonging to the same error
type. Conversely, annotate as different “BAD” phrases anysequences of adjacent words which seem to result from dif-ferent types of translation errors;ii) annotate as a single “BAD” phrase any sequence of ad-jacent words which may result from different types of er-rors, but where distinguishing and annotating these errorsindependently is too complex or may result in overlappingannotations;iii) annotate an order error (a.k.a. shift) between twophrases by selecting the smallest phrase and indicatingwhere it should be (by adding the that position as a frag-ment). In case of an order error between two phrases withthe same length, annotate the first phrase and the placewhere it should be;iv) two annotations should never overlap each other. If twoannotations partially overlap, split them out into two dis-tinct annotations. If an annotation is completely enclosinganother annotation, keep only the annotation correspondingto the largest phrase;v) annotate a missing phrase by selecting the last and firstcharacters of the left and right words surrounding the po-sition where it should be, and by providing the missingphrase. In this case, the phrase should be labelled as“BAD DEL”.Guideline have been refined after a test session and exam-ples were provided with each rule.
3.2. Annotation EnvironmentThe annotations have been done and collected using theBRAT RAPID ANNOTATION TOOL1 (Stenetorp et al., 2012),which provides an on-line environment for collaborativetext annotation. Each annotator was provided with a fullpre-configured version of the tool, as well as access to theguidelines. Figures 1 and 2 give an overview of the BRATuser interface with an annotation example. Figure 1 showsthe visualisation interface where the annotator identifiesphrases corresponding to MT errors. Figure 2 shows thelabelling of a selected phrase according to the guidelines:“BAD DEL”.
Stand-off FormatAnnotations created with BRAT are stored in a stand-off 2
format. In other words, annotations are stored into separatetext file, with the original data remaining unchanged. Inour experiment, BRAT’s stand-off output was configured asfollows: each line contains one annotation, and each anno-tation is given an ID that appears first on the line, separatedfrom the rest of the annotation by a single TAB character.For example, this is the stand-off output for the annotationexample shown in Figures 1 and 2:
T1 BAD Del 59 62 t a#1 AnnotatorNotes T1 thatT2 BAD 140 146;156 159 values y ,T3 BAD 228 231 theT4 BAD 75 79 willT5 BAD 84 86 beT6 BAD Del 108 111 , w#3 AnnotatorNotes T6 together
1http://brat.nlplab.org/2http://brat.nlplab.org/standoff.html
2242
Page 105 of 146
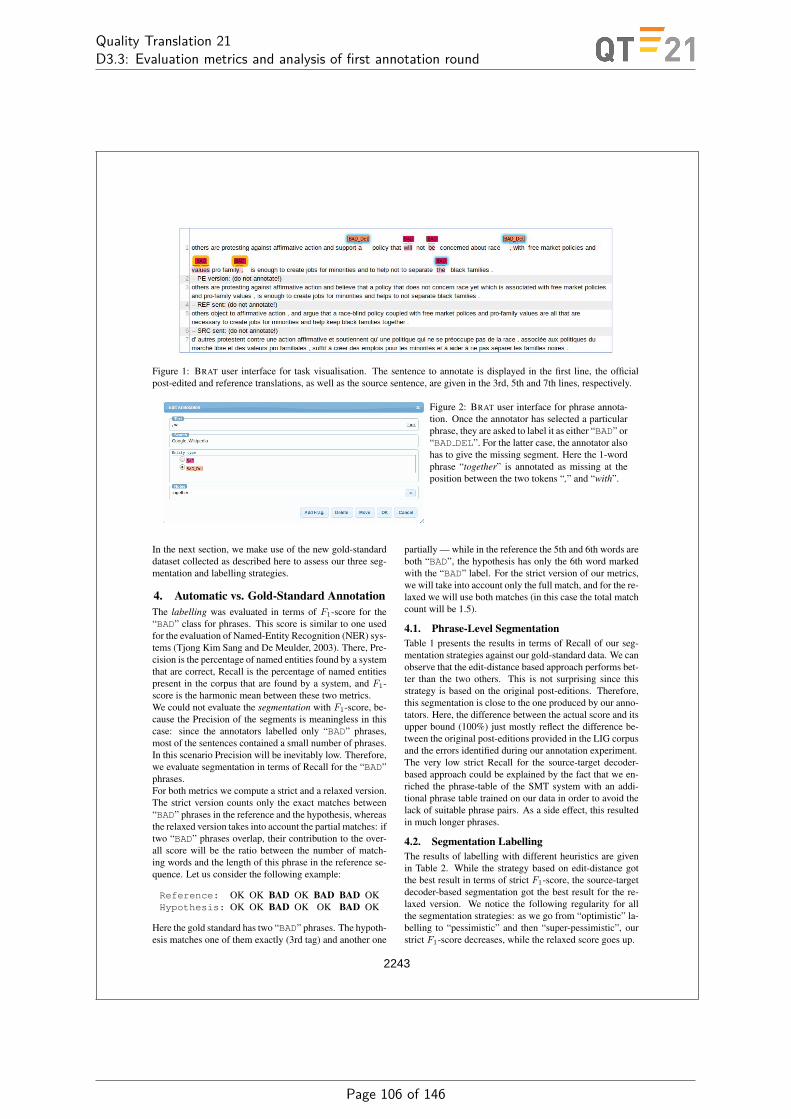
Quality Translation 21D3.3: Evaluation metrics and analysis of first annotation round
Figure 1: BRAT user interface for task visualisation. The sentence to annotate is displayed in the first line, the officialpost-edited and reference translations, as well as the source sentence, are given in the 3rd, 5th and 7th lines, respectively.
Figure 2: BRAT user interface for phrase annota-tion. Once the annotator has selected a particularphrase, they are asked to label it as either “BAD” or“BAD DEL”. For the latter case, the annotator alsohas to give the missing segment. Here the 1-wordphrase “together” is annotated as missing at theposition between the two tokens “,” and “with”.
In the next section, we make use of the new gold-standarddataset collected as described here to assess our three seg-mentation and labelling strategies.
4. Automatic vs. Gold-Standard AnnotationThe labelling was evaluated in terms of F1-score for the“BAD” class for phrases. This score is similar to one usedfor the evaluation of Named-Entity Recognition (NER) sys-tems (Tjong Kim Sang and De Meulder, 2003). There, Pre-cision is the percentage of named entities found by a systemthat are correct, Recall is the percentage of named entitiespresent in the corpus that are found by a system, and F1-score is the harmonic mean between these two metrics.We could not evaluate the segmentation with F1-score, be-cause the Precision of the segments is meaningless in thiscase: since the annotators labelled only “BAD” phrases,most of the sentences contained a small number of phrases.In this scenario Precision will be inevitably low. Therefore,we evaluate segmentation in terms of Recall for the “BAD”phrases.For both metrics we compute a strict and a relaxed version.The strict version counts only the exact matches between“BAD” phrases in the reference and the hypothesis, whereasthe relaxed version takes into account the partial matches: iftwo “BAD” phrases overlap, their contribution to the over-all score will be the ratio between the number of match-ing words and the length of this phrase in the reference se-quence. Let us consider the following example:
Reference: OK OK BAD OK BAD BAD OKHypothesis: OK OK BAD OK OK BAD OK
Here the gold standard has two “BAD” phrases. The hypoth-esis matches one of them exactly (3rd tag) and another one
partially — while in the reference the 5th and 6th words areboth “BAD”, the hypothesis has only the 6th word markedwith the “BAD” label. For the strict version of our metrics,we will take into account only the full match, and for the re-laxed we will use both matches (in this case the total matchcount will be 1.5).
4.1. Phrase-Level SegmentationTable 1 presents the results in terms of Recall of our seg-mentation strategies against our gold-standard data. We canobserve that the edit-distance based approach performs bet-ter than the two others. This is not surprising since thisstrategy is based on the original post-editions. Therefore,this segmentation is close to the one produced by our anno-tators. Here, the difference between the actual score and itsupper bound (100%) just mostly reflect the difference be-tween the original post-editions provided in the LIG corpusand the errors identified during our annotation experiment.The very low strict Recall for the source-target decoder-based approach could be explained by the fact that we en-riched the phrase-table of the SMT system with an addi-tional phrase table trained on our data in order to avoid thelack of suitable phrase pairs. As a side effect, this resultedin much longer phrases.
4.2. Segmentation LabellingThe results of labelling with different heuristics are givenin Table 2. While the strategy based on edit-distance gotthe best result in terms of strict F1-score, the source-targetdecoder-based segmentation got the best result for the re-laxed version. We notice the following regularity for allthe segmentation strategies: as we go from “optimistic” la-belling to “pessimistic” and then “super-pessimistic”, ourstrict F1-score decreases, while the relaxed score goes up.
2243
Page 106 of 146

Quality Translation 21D3.3: Evaluation metrics and analysis of first annotation round
Segmentation Recall (%)Strategy Strict Relaxed
Edit-Distance:phrase length up to 5 42.49 87.84
phrase length unlimited 42.02 84.15
Shallow Syntactic decomposition 33.17 82.79
Decoder-based:source-target SMT 27.12 81.69target-source SMT 25.26 84.61
Table 1: Evaluation of our segmentation strategies in termsof Recall (strict and relaxed) against our gold-standard data.
Segmentation F1-score (%)Strategy Strict Relaxed
Edit-Distance:phrase length up to 5 35.35 53.08
phrase length unlimited 35.64 53.32
– OPTIMISTIC LABELLING:
Shallow Syntactic decomposition 19.88 33.98Decoder-based:
source-target SMT 17.66 32.86target-source SMT 17.60 34.44
– PESSIMISTIC LABELLING:
Shallow Syntactic decomposition 17.09 44.07Decoder-based:
source-target SMT 15.42 41.26target-source SMT 14.56 46.86
– SUPER-PESSIMISTIC LABELLING:
Shallow Syntactic decomposition 16.83 44.47Decoder-based:
source-target SMT 14.15 47.14target-source SMT 14.26 47.25
Table 2: Evaluation of our labelling heuristics on oursegmentations in terms of F1-score for the “BAD” phrasesagainst our gold-standard data.
The inflated relaxed score are explained by the fact that the“optimistic” labelling replaces many original “BAD” labelswith “OK” labels. As we switch to “pessimistic” scheme,the number of “BAD” labels in the data increases which re-sults in more partial matches. However, the strict score doesnot follow this pattern.In order to understand the reason for the difference inscores behaviour, we explore the components which formthe overall F1-score: Precision and Recall. In our case Pre-cision is the ratio between the number of “BAD” phrasesthat match exactly in the reference and hypothesis (TruePositives (TP)) and the overall number of “BAD” phrases inthe hypothesis (True Positives + False Positives (TP+FP)).Table 3 shows how these figures change when we move
Labelling TP TP+FP Prec. Rec. F1-scoreStrategy (#) (#) (%) (%) (%)
optimistic 186 1012 18.37 21.65 19.88
pessimistic 196 1434 13.66 22.81 17.09
super-pessimistic 196 1470 13.33 22.81 16.83
Table 3: The variation in the number of “BAD” phrases fordifferent labelling strategies (for shallow syntactic decom-position segmentation).
to more pessimistic labellings for the shallow syntactic de-composition segmentation strategy (but the same regular-ities hold for other segmentation strategies as well). Aswe decrease the threshold of “BAD” labels percentage (i.e.raise the number of “BAD” phrases in the data), the num-ber of matching phrases goes up slightly, but the increasein the overall number of “BAD” phrases is much more re-markable. Since the number of phrases in the referencedoes not change, the Recall grows marginally, but the dropin Precision is larger, and the final F1-score is dominatedby it.We can notice an overall low F1-score which suggests asignificant disagreement between our automatic segmenta-tions and the human annotators. Part of this gap could beexplained by the fact that post-editors who produced theinitial post-editions in (Potet et al., 2012) had the accessonly to the source sentences and their automatic transla-tions, whereas for our experiments we gave the annotatorsthe access to all the available data: source sentences, auto-matic translations, post-editions and reference translations,so they could decide on the optimal labelling from a rangeof possibilities including existing corrections and their ownknowledge. Thus, where our phrase labelling would con-sider as “BAD” a phrase which has been modified in thepost-edited version of the translation, a human annotatormight consider the meaning as unchanged and thereforewould not label this modification as an MT error.
5. ConclusionsOur experience in Quality Estimation led us to look at anovel approach based on sequences of adjacent words, so-called phrase, as a natural balance between the too finegrained word- and too coarse sentence-levels. However anintrinsic challenge comes along with this new level: how tofind phrases which correspond to actual machine translationerrors. While boundaries for both word- and sentence-levelare self-defined, this is an open question for the intermedi-ate level.In this paper we presented three possible segmentation ap-proaches: based on edit-distance, shallow syntactic de-composition and decoder segmentation. We also presentedthree labelling strategies to automatically extract the erro-neous phrases from a post-editing corpus.Additionally, we introduced a new dataset that we createdfor assessing our automatic strategies against. This datasetis the result of an annotation experiment done with the helpof English speakers. It provides gold-standard phrase-level
2244
Page 107 of 146

Quality Translation 21D3.3: Evaluation metrics and analysis of first annotation round
annotations of machine translations errors. For this firstversion, we collected a set of 1k annotations over 400 sen-tences. In order to support further work, we made it avail-able, as mentioned in Section 3.The results reported in this paper represent the first step ofour work on segmentation and labelling for this new levelfor Quality Estimation. They are promising, even thoughthey show that our segmentation and labelling strategiesneed to be refined in future work.
AcknowledgementsThe authors would like to thanks all the annotators whohelped to create the first version of gold-standard annota-tions at phrase-level. This work was supported by the QT21(H2020 No. 645452, Lucia Specia, Frederic Blain) and EX-PERT (EU FP7 Marie Curie ITN No. 317471, Varvara Lo-gacheva) projects.
ReferencesBlain, F., Senellart, J., Schwenk, H., Plitt, M., Roturier, J.,
and Blain. (2011). Qualitative analysis of post-editingfor high quality machine translation. In Asia-Pacific As-sociation for Machine Translation (AAMT), editor, Ma-chine Translation Summit XIII, Xiamen (China), 19-23sept.
Bojar, O., Chatterjee, R., Federmann, C., Haddow, B.,Huck, M., Hokamp, C., Koehn, P., Logacheva, V., Monz,C., Negri, M., Post, M., Scarton, C., Specia, L., andTurchi, M. (2015). Findings of the 2015 workshopon statistical machine translation. In Proceedings ofthe Tenth Workshop on Statistical Machine Translation,pages 1–46, Lisboa, Portugal.
Chatterjee, R., Weller, M., Negri, M., and Turchi, M.(2015). Exploring the planet of the apes: a comparativestudy of state-of-the-art methods for mt automatic post-editing. In Proceedings of the 53rd Annual Meeting ofthe Association for Computational Linguistics), Beijing,China.
Constant, M., Tellier, I., Duchier, D., Dupont, Y., Sigogne,A., and Billot, S. (2011). Integrer des connaissances lin-guistiques dans un crf: application a l’apprentissage d’unsegmenteur-etiqueteur du francais. In TALN, volume 1,page 321.
Koehn, P., Hoang, H., Birch, A., Callison-burch, C., Fed-erico, M., Bertoldi, N., Cowan, B., Shen, W., Moran,C., Zens, R., Dyer, C., Bojar, O., Constantin, A., andHerbst, E. (2007). Moses: Open Source Toolkit for Sta-tistical Machine Translation. In ACL-2007: 45th AnnualMeeting of the Association for Computational Linguis-tics, Demo and Poster sessions, pages 177–180, Prague,Czech Republic.
Koehn, P. (2005). Europarl: A Parallel Corpus for Statisti-cal Machine Translation. In MT Summit X: 10th MachineTranslation Summit, pages 79–86, Phuket, Thailand.
Logacheva, V. and Specia, L. (2015). Phrase-level qual-ity estimation for machine translation. In Proceedings ofIWSLT-2015.
McKeown, K., Parton, K., Habash, N. Y., Iglesias, G., andde Gispert, A. (2012). Can automatic post-editing makemt more meaningful?
Potet, M., Esperanca-Rodier, E., Besacier, L., and Blan-chon, H. (2012). Collection of a large database offrench-english smt output corrections. In LREC, pages4043–4048. Citeseer.
Schmid, H. (1994). Probabilistic part-of-speech taggingusing decision trees. In Proceedings of the internationalconference on new methods in language processing, vol-ume 12, pages 44–49. Citeseer.
Snover, M., Dorr, B., Schwartz, R., Micciulla, L., andMakhoul, J. (2006). A study of translation edit rate withtargeted human annotation. In Proceedings of the 7thConference of the Association for Machine Translationin the Americas (AMTA), pages 223–231.
Stenetorp, P., Pyysalo, S., Topic, G., Ohta, T., Ananiadou,S., and Tsujii, J. (2012). brat: a web-based tool for NLP-assisted text annotation. In Proceedings of the Demon-strations Session at EACL 2012, Avignon, France, April.Association for Computational Linguistics.
Tjong Kim Sang, E. F. and De Meulder, F. (2003). In-troduction to the conll-2003 shared task: Language-independent named entity recognition. In Proceedingsof CoNLL-2003, pages 142–147.
Language Resource ReferencesMarion Potet and Emmanuelle Esperanca-Rodier and Lau-
rent Besacier and Herve Blanchon. (2012). Collection ofa Large Database of French-English SMT Output Cor-rections.
2245
Page 108 of 146
Quality Translation 21D3.3: Evaluation metrics and analysis of first annotation round
M USFD’s Phrase-level Quality Estimation Systems
Proceedings of the First Conference on Machine Translation, Volume 2: Shared Task Papers, pages 800–805,Berlin, Germany, August 11-12, 2016. c©2016 Association for Computational Linguistics
USFD’s Phrase-level Quality Estimation Systems
Varvara Logacheva, Frederic Blain and Lucia SpeciaDepartment of Computer Science
University of Sheffield, UKv.logacheva, f.blain, [email protected]
Abstract
We describe the submissions of the Uni-versity of Sheffield (USFD) for the phrase-level Quality Estimation (QE) shared taskof WMT16. We test two different ap-proaches for phrase-level QE: (i) we en-rich the provided set of baseline featureswith information about the context of thephrases, and (ii) we exploit predictionsat other granularity levels (word and sen-tence). These approaches perform closelyin terms of multiplication of F1-scores(primary evaluation metric), but are con-siderably different in terms of the F1-scores for individual classes.
1 Introduction
Quality Estimation (QE) of Machine Translation(MT) is the task of determining the quality ofan automatically translated text without compar-ing it to a reference translation. This task hasreceived more attention recently because of thewidespread use of MT systems and the need toevaluate their performance on the fly. The prob-lem has been modelled to estimate the quality oftranslations at the word, sentence and documentlevels (Bojar et al., 2015). Word-level QE canbe particularly useful for post-editing of machine-translated texts: if we know the erroneous words ina sentence, we can highlight them to attract post-editor’s attention, which should improve both pro-ductivity and final translation quality. However,the choice of words in an automatically translatedsentence is motivated by the context, so MT er-rors are also context-dependent. Moreover, as ithas been shown in (Blain et al., 2011), errors inmultiple adjacent words can be caused by a sin-gle incorrect decision — e.g. an incorrect lexicalchoice can result in errors in all its syntactic de-
pendants. The task of estimating quality at thephrase level aims to address these limitations ofword-level models for improved prediction perfor-mance.
The first effort to estimate the quality of trans-lated n-grams (instead of individual words) wasdescribed in (Gandrabur and Foster, 2003), butthere the multi-word nature of predictions wasmotivated by the architecture of the MT systemused in the experiment: an interactive MT systemwhich did not translate entire sentences, but ratherpredicted the next n word translations in a sen-tence. An approach was designed to estimate theconfidence of the MT system about the predictionand was aimed at improving translation predictionquality.
The phrase-level QE in its current formulation– estimation of the quality of phrases in a pre-translated sentence using external features of thesephrases – was first addressed in the work of Lo-gacheva and Specia (2015), where the authorssegmented automatically translated sentences intophrases, labelled these phrases based on word-level labels and trained several phrase-level QEmodels using different feature sets and machinelearning algorithms. The baseline phrase-level QEsystem used in this shared task was based on theresults in (Logacheva and Specia, 2015).
This year’s Conference on Statistical MachineTranslation (WMT16) includes a shared task onphrase-level QE (QE Task 2p) for the first time.This task uses the same training and test data as theone used for the word-level QE task (QE Task 2):the set of English sentences, their automatic trans-lations into German and their manual post-editionsperformed by professional translators. The databelongs to the IT domain. The training set con-tains 12,000 sentences, development and test sets— 1,000 and 2,000 sentences, respectively. Formodel training and evaluation, the words are la-
800
Page 109 of 146
Quality Translation 21D3.3: Evaluation metrics and analysis of first annotation round
belled as “BAD” or “OK” based on labelling gen-erated with the TERcom tool1: if an edit oper-ation (substitution or insertion) was applied to aword, it is labelled as “BAD”; contrarily, if theword was left unchanged, it is considered “OK”.For the phrase-level task, the data was segmentedalso into phrases. The segmentation was given bythe decoder that produced the automatic transla-tions. The segments are labelled at the phrase levelusing the word-level labels: a phrase is labelled as“OK” if it contains only words labelled as “OK”;if one or more words in a phrase are “BAD”’, thephrase is “BAD” itself. The predictions are doneat the phrase level, but evaluated at the word level:for the evaluation phrase-level labels are unrolledback to their word-level versions (i.e. if a three-word phrase is labelled as “BAD”, it is equivalentto three “BAD” word-level labels).
The baseline phrase-level features provided bythe organisers of the task are black-box featuresthat were originally used for sentence-level qualityestimation and extracted using the QuEst toolkit2
(Specia et al., 2015). While this feature set consid-ers many aspects of sentence quality (mostly theones that do not depend on internal MT systeminformation and do not require language-specificresources), it has an important limitation when ap-plied to phrases. Namely, it does not take intoaccount the context of the phrase, i.e. words andphrases in the sentence, either before or after thephrase of interest. In order to advance upon thebaseline results, we enhanced the baseline featureset with contextual information for phrases.
Another approach we experimented with is theuse of predictions made by QE models at otherlevels of granularity: word level and sentencelevel. The motivation here is twofold. On the onehand, we use a wider range of features which areunavailable at the phrase level. On the other hand,the use of word-level and sentence-level predic-tions can help mitigate the uncertainty of phrase-level scores: there, a phrase is labelled as “BAD”if it has any number of “BAD” words, so “BAD”phrases can be of very different quality. We be-lieve that information on the quality of individualwords and the overall quality of a sentence canbe complementary for phrase-level quality predic-tion.
The rest of the paper is organised as follows. We1http://www.cs.umd.edu/˜snover/tercom/2http://www.quest.dcs.shef.ac.uk/
quest_files/features_blackbox
describe our context-based QE strategy in Section2. In Section 3 we explain our approach to buildphrase-level QE models using predictions of otherlevels. Section 4 reports the final results, whileSection 5 outlines directions for future work.
2 Context-based model
The feature set used for the baseline system in theshared task considers various aspects of a phrase.It has features that allow to evaluate the likelihoodof its source and target parts individually (e.g.probabilities of its source and target phrases asgiven by monolingual language models), and alsothe correspondences between the parts (e.g. theratio of numbers of punctuation marks and wordsof particular parts of speech in the source and tar-get sides of the phrase). However, this feature setdoes not take into account the words surroundingan individual phrase. This is explained by the factthat the feature set was originally designed for QEsystems which evaluate the quality of automatictranslations at the sentence level. Sentences inan automatically translated text are generally pro-duced independently from each other, given thatmost MT systems cannot take extra-sentential con-text into account. Therefore, context features arerarely used for sentence-level QE.
2.1 FeaturesIn order to improve the representation of phrases,we use a number of additional features (CON-TEXT) that depend on phrases to the left and rightof the phrase of interest, as well as the phrase it-self. The intuition behind these features is thatthey evaluate how well a phrase fits its context.Here we list the new features and the values theycan take:
• out-of-vocabulary words (binary) — wecheck if the source phrase has words whichdo not occur in a source corpus. The featurehas value 1 if at least one of source words isout-of-vocabulary and 0 otherwise;
• source/target left context (string) — lastword of the previous source/target phrase;
• source/target right context (string) — firstword of the next source/target phrase;
• highest order of n-gram that includes thefirst target word (0 to 5) — we take the n-gram at the border between the current and
801
Page 110 of 146

Quality Translation 21D3.3: Evaluation metrics and analysis of first annotation round
previous phrase and generate the combina-tion of the first target word in the phraseand 1 to 4 words that precede it in the sen-tence. Let us denote the first word fromthe phrase wfirst and the 4-grams from theprevious phrase p−4p−3p−2p−1. If the en-tire 5-gram p−4p−3p−2p−1wfirst exists inthe target LM, the feature value is 5. If itis not in the LM, n-grams of lower order(from p−3p−2p−1wfirst to unigram wfirst)are checked, and the feature value is the or-der of the longest n-gram found in the LM;
• highest order of n-gram that includes thelast target word (0 to 5) — feature thatconsiders the n-gram wlastp1p2p3p4 (wherewlast is the last target word of the currentphrase and p1p2p3p4 is the opening 4-gramof the next feature) analogously to the previ-ous feature;
• backoff behaviour of first/last n-gram (0to 1) — backoff behaviour of n-gramsp−2p−1wfirst and wlastp1p2, computed asdescribed in (Raybaud et al., 2011).
• named entities in the source/target (bi-nary) — we check if the source and targetphrases have tokens which start with capitalletters;
• part of speech of the source/targetleft/right context (string) — we check partsof speech of words that precede or follow thephrase in the sentence.
Some of these features (e.g. highest n-gram or-der, backoff behaviour, contexts) are used becausethey have been shown useful for word-level QE(Luong et al., 2013), others are included becausewe believe they can be relevant for understandingthe quality of phrases.
We compare the performance of the baselinefeature set with the feature set extended with con-text information. The QE models are trained usingCRFSuite toolkit (Okazaki, 2007). We chose totrain a Conditional Random Fields (CRF) modelbecause it has shown high performance in word-level QE (Luong et al., 2013) as well as phrase-level QE (Logacheva and Specia, 2015) tasks.CRFSuite provides five optimisation algorithms:L-BFGS with L1/L2 regularization (lbfgs), SGDwith L2-regularization (l2sgd), Averaged Percep-tron (ap), Passive Aggressive (pa), and Adaptive
Feature setBaseline Extended
lbfgs 0.270 0.332l2sgd 0.238 0.358ap 0.316 0.355pa 0.329 0.357arow 0.292 0.315
Table 1: F1-multiplied scores of models trained onbaseline and extended feature sets using differentoptimisation algorithms for CRFSuite.
Regularization of Weights (arow). Since these al-gorithms could perform differently in our task, wetested all of them on both baseline and extendedfeature sets, using the development set.
Table 1 shows the performance of our CRFmodels trained with different algorithms. We cansee that the extended feature set clearly outper-forms the baseline for all algorithms. Passive-Aggressive scored higher for the baseline featureset and is also one of the best-performing algo-rithms on the extended feature set. Therefore,we used the Passive-Aggressive algorithm for oursubsequent experiments and the final submission.
2.2 Data filtering
Many datasets for word-level QE suffer from theuneven distribution of labels: the “BAD” wordsoccur much less often than those labelled as “OK”.This characteristic stems from the nature of theword-level QE task: we need to identify erro-neous words in an automatically translated text,but the state-of-the-art MT systems allow produc-ing texts of high enough quality, where only a fewwords are incorrect. Since for the shared task datathe phrase-level labels were generated from word-level labels, we run into the same problem at thephrase level. Here the discrepancy is not so large:the “BAD” labels make for 25% of all labels inthe training dataset for the phrase-level task. How-ever, we believe it is still useful to reduce this dis-crepancy.
Previous experiments with word-level QEshowed that the distribution of labels can besmoothed by filtering out sentences with little orno errors (Logacheva et al., 2015). Admittedly,if a sentence has no “BAD” words it lacks infor-mation about one of the classes of the problem,and thus it is less informative. We thus applied thesame strategy to phrase-level QE: we ranked the
802
Page 111 of 146
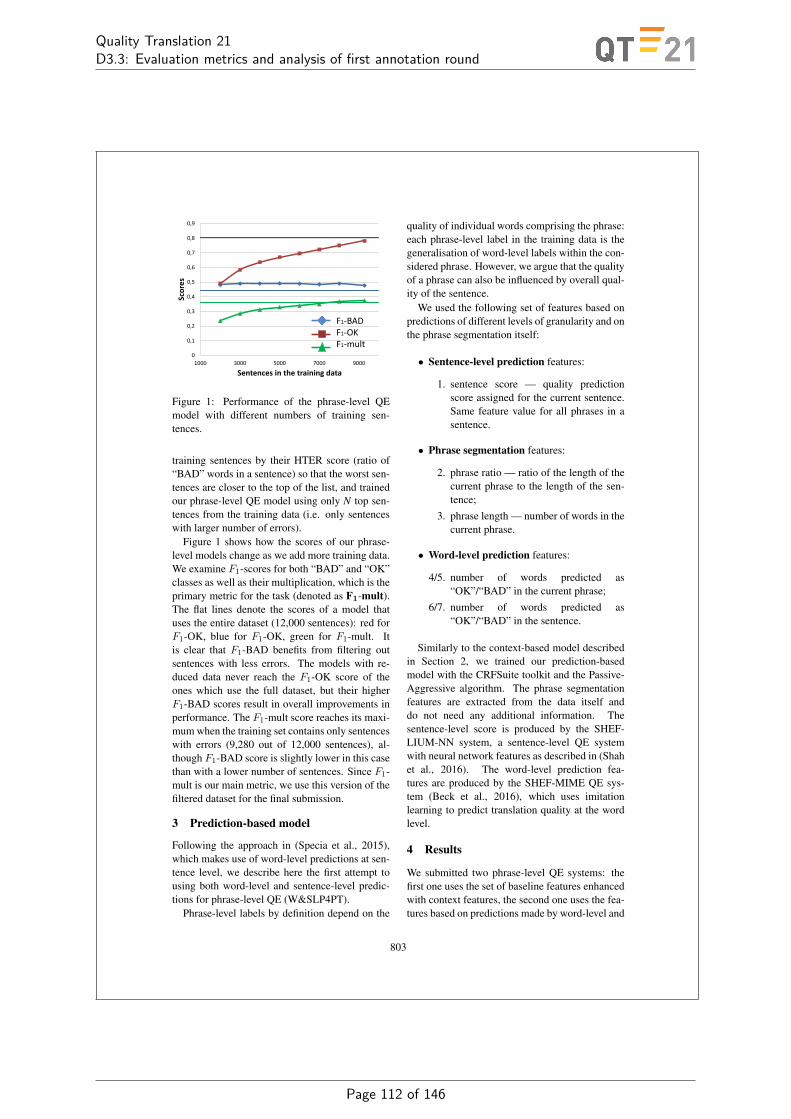
Quality Translation 21D3.3: Evaluation metrics and analysis of first annotation round
0
0,1
0,2
0,3
0,4
0,5
0,6
0,7
0,8
0,9
1000 3000 5000 7000 9000
Sco
res
Sentences in the training data
F1-BAD F1-OK F1-mult
Figure 1: Performance of the phrase-level QEmodel with different numbers of training sen-tences.
training sentences by their HTER score (ratio of“BAD” words in a sentence) so that the worst sen-tences are closer to the top of the list, and trainedour phrase-level QE model using only N top sen-tences from the training data (i.e. only sentenceswith larger number of errors).
Figure 1 shows how the scores of our phrase-level models change as we add more training data.We examine F1-scores for both “BAD” and “OK”classes as well as their multiplication, which is theprimary metric for the task (denoted as F1-mult).The flat lines denote the scores of a model thatuses the entire dataset (12,000 sentences): red forF1-OK, blue for F1-OK, green for F1-mult. Itis clear that F1-BAD benefits from filtering outsentences with less errors. The models with re-duced data never reach the F1-OK score of theones which use the full dataset, but their higherF1-BAD scores result in overall improvements inperformance. The F1-mult score reaches its maxi-mum when the training set contains only sentenceswith errors (9,280 out of 12,000 sentences), al-though F1-BAD score is slightly lower in this casethan with a lower number of sentences. Since F1-mult is our main metric, we use this version of thefiltered dataset for the final submission.
3 Prediction-based model
Following the approach in (Specia et al., 2015),which makes use of word-level predictions at sen-tence level, we describe here the first attempt tousing both word-level and sentence-level predic-tions for phrase-level QE (W&SLP4PT).
Phrase-level labels by definition depend on the
quality of individual words comprising the phrase:each phrase-level label in the training data is thegeneralisation of word-level labels within the con-sidered phrase. However, we argue that the qualityof a phrase can also be influenced by overall qual-ity of the sentence.
We used the following set of features based onpredictions of different levels of granularity and onthe phrase segmentation itself:
• Sentence-level prediction features:
1. sentence score — quality predictionscore assigned for the current sentence.Same feature value for all phrases in asentence.
• Phrase segmentation features:
2. phrase ratio — ratio of the length of thecurrent phrase to the length of the sen-tence;
3. phrase length — number of words in thecurrent phrase.
• Word-level prediction features:
4/5. number of words predicted as“OK”/“BAD” in the current phrase;
6/7. number of words predicted as“OK”/“BAD” in the sentence.
Similarly to the context-based model describedin Section 2, we trained our prediction-basedmodel with the CRFSuite toolkit and the Passive-Aggressive algorithm. The phrase segmentationfeatures are extracted from the data itself anddo not need any additional information. Thesentence-level score is produced by the SHEF-LIUM-NN system, a sentence-level QE systemwith neural network features as described in (Shahet al., 2016). The word-level prediction fea-tures are produced by the SHEF-MIME QE sys-tem (Beck et al., 2016), which uses imitationlearning to predict translation quality at the wordlevel.
4 Results
We submitted two phrase-level QE systems: thefirst one uses the set of baseline features enhancedwith context features, the second one uses the fea-tures based on predictions made by word-level and
803
Page 112 of 146

Quality Translation 21D3.3: Evaluation metrics and analysis of first annotation round
F1-BAD F1-OK F1-multW&SLP4PT 0.486 0.757 0.368CONTEXT 0.470 0.777 0.365BASELINE 0.401 0.800 0.321
Table 2: Performance of our official submissionson the test set.
sentence-level QE models, plus the phrase seg-mentation features. The performance of our of-ficial submissions on the test set is given in Table2.
For the prediction-based model, we used word-level predictions from the MIME system withβ=0.3. While (Beck et al., 2016) reports bet-ter performance with β = 1, we obtained slightlylower performance both on F1-mult = 0.367 andF1-OK = 0.739. Only F1-BAD was better = 0.497.
Even though the two systems are very differ-ent in terms of the features they use, their perfor-mance is very similar. The prediction-based modelis slightly better in terms of F1-BAD, whereas thecontext-based model predicts “OK” labels moreaccurately. Both systems outperform the baseline.
In terms of the F1-multiplied metric, ourprediction-based and context-based systemsranked 4th and 5th (out of 10 systems) in theshared task, respectively.
4.1 Model combination
Since both our models outperform the baselinesystem, we also combined them after the offi-cial submission to check whether further improve-ments could be obtained. Surprisingly, we gotthe exact same prediction performance as ourprediction-based model. This is because two fea-tures of our prediction-based model – the numberof words predicted as “BAD”/“OK” in the currentphrase – have a strong bias and do most of the jobby themselves3. The reason of this behaviour liesin the way both the training and test data have beentagged for the phrase-level task. The labelling wasadapted from the word-level labels by assigningthe “BAD” tag to any phrase that contains at leastone “BAD” word. Consequently, during the train-ing against gold standards labels, our model learnsto tag as “BAD” any phrase that contains at least
3We get the exact same scores either combining theprediction-based features with the baseline features, both thebaseline and context features, or considering the number ofpredicted “BAD” words in the current phrase as the only fea-ture of our model.
F1-BAD F1-OK F1-multW&SLP4PT 0.389 0.727 0.283
+baseline 0.454 0.767 0.349+context 0.473 0.772 0.366
BASELINE 0.401 0.800 0.321
Table 3: Performance for combinations of modelson the test set.
on “BAD” word in a systematic way.After removing the features 4 and 5 from the
feature set, we retrained our prediction-basedmodel and its new performance is given in the firstrow of Table 3. On its own, it performs worse thanthe baseline, but by successively adding the base-line and context features to it (without any datafiltering), it performs as well as our official sub-missions in terms of F1-BAD and F1-multi, andgets higher F1-OK.
5 Conclusion and future work
We presented two different approaches to phrase-level QE: one extends the baseline feature set withcontext information, another combines the scoresof different levels of granularity to model thequality of phrases. Both performed similarly, al-though the prediction-based strategy is more “pes-simistic” regarding the training data. Both outper-formed the baseline.
In future work, we further experiments to gathera better understanding of these approaches. First,additional feature engineering can be performed:we did not check the usefulness of individual con-text features, nor of the additional features used inthe prediction-based model. Secondly, the corre-spondences between labels of different granulari-ties can be further examined: for example, it is in-teresting to see how the use of sentence-level andword-level predictions can influence the predictionof phrase-level scores.
Acknowledgements
This work was supported by the EXPERT (EUFP7 Marie Curie ITN No. 317471, Varvara Lo-gacheva) and the QT21 (H2020 No. 645452, Lu-cia Specia, Frederic Blain) projects.
ReferencesDaniel Beck, Andreas Vlachos, Gustavo H. Paetzold,
and Lucia Specia. 2016. SHEF-MIME: Word-level Quality Estimation Using Imitation Learning.
804
Page 113 of 146
Quality Translation 21D3.3: Evaluation metrics and analysis of first annotation round
In Proceedings of the First Conference on MachineTranslation, Berlin, Germany.
Frederic Blain, Jean Senellart, Holger Schwenk, MirkoPlitt, and Johann Roturier. 2011. Qualitative Analy-sis of Post-Editing for High Quality Machine Trans-lation. In Proceedings of the MT Summit XIII, pages164–171, Xiamen, China.
Ondrej Bojar, Rajen Chatterjee, Christian Federmann,Barry Haddow, Matthias Huck, Chris Hokamp,Philipp Koehn, Varvara Logacheva, Christof Monz,Matteo Negri, Matt Post, Carolina Scarton, LuciaSpecia, and Marco Turchi. 2015. Findings of the2015 workshop on statistical machine translation.In Proceedings of the Tenth Workshop on StatisticalMachine Translation, pages 1–46, Lisbon, Portugal.
Simona Gandrabur and George Foster. 2003. Confi-dence estimation for translation prediction. In Pro-ceedings of Seventh Conference on Natural Lan-guage Learning, pages 95–102, Edmonton, Canada.
Varvara Logacheva and Lucia Specia. 2015. Phrase-level quality estimation for machine translation. InProceedings of the 2015 International Workshop onSpoken Language Translation, Da Nang, Vietnam.
Varvara Logacheva, Chris Hokamp, and Lucia Specia.2015. Data enhancement and selection strategies forthe word-level quality estimation. In Proceedings ofthe Tenth Workshop on Statistical Machine Transla-tion, pages 330–335, Lisbon, Portugal.
Ngoc Quang Luong, Benjamin Lecouteux, and Lau-rent Besacier. 2013. LIG system for WMT13 QEtask: Investigating the usefulness of features in wordconfidence estimation for MT. In Proceedings ofthe Eighth Workshop on Statistical Machine Trans-lation, pages 386–391, Sofia, Bulgaria.
Naoaki Okazaki. 2007. Crfsuite: a fast implementa-tion of conditional random fields (CRFs). Availableat http://www.chokkan.org/software/crfsuite/.
Sylvain Raybaud, David Langlois, and Kamel Smaıli.2011. This sentence is wrong. Detecting errors inmachine-translated sentences. Machine Translation,25(1):1–34.
Kashif Shah, Fethi Bougares, Loic Barrault, and Lu-cia Specia. 2016. Shef-lium-nn: Sentence levelquality estimation with neural network. In Proceed-ings of the First Conference on Machine Translation,Berlin, Germany.
Lucia Specia, G Paetzold, and Carolina Scarton.2015. Multi-level translation quality prediction withquest++. In Proceedings of the 53rd Annual Meet-ing of the Association for Computational Linguisticsand Seventh International Joint Conference on Nat-ural Language Processing of the Asian Federation ofNatural Language Processing: System Demonstra-tions, pages 115–120.
805
Page 114 of 146
Quality Translation 21D3.3: Evaluation metrics and analysis of first annotation round
N Investigating Continuous Space Language Models for MachineTranslation Quality Estimation
Proceedings of the 2015 Conference on Empirical Methods in Natural Language Processing, pages 1073–1078,Lisbon, Portugal, 17-21 September 2015. c©2015 Association for Computational Linguistics.
Investigating Continuous Space Language Models for MachineTranslation Quality Estimation
Kashif Shah§, Raymond W. M. Ng§, Fethi Bougares†, Lucia Specia§§Department of Computer Science, University of Sheffield, UKkashif.shah, wm.ng, [email protected]
†LIUM, University of Le Mans, [email protected]
Abstract
We present novel features designed with adeep neural network for Machine Trans-lation (MT) Quality Estimation (QE). Thefeatures are learned with a ContinuousSpace Language Model to estimate theprobabilities of the source and target seg-ments. These new features, along withstandard MT system-independent features,are benchmarked on a series of datasetswith various quality labels, including post-editing effort, human translation edit rate,post-editing time and METEOR. Resultsshow significant improvements in predic-tion over the baseline, as well as over sys-tems trained on state of the art feature setsfor all datasets. More notably, the additionof the newly proposed features improvesover the best QE systems in WMT12 andWMT14 by a significant margin.
1 Introduction
Quality Estimation (QE) is concerned with pre-dicting the quality of Machine Translation (MT)output without reference translations. QE is ad-dressed with various features indicating fluency,adequacy and complexity of the translation pair.These features are used by a machine learning al-gorithm along with quality labels given by humansto learn models to predict the quality of unseentranslations.
A variety of features play a key role in QE.A wide range of features from source segmentsand their translated segments, extracted with thehelp of external resources and tools, have beenproposed. These go from simple, language-independent features, to advanced, linguisticallymotivated features. They include features thatsummarise how the MT systems generate transla-tions, as well as features that are oblivious to thesystems. The majority of the features in the lit-erature are extracted from each sentence pair in
isolation, ignoring the context of the text. QEperformance usually differs depending on the lan-guage pair, the specific quality score being opti-mised (e.g., post-editing time vs translation ad-equacy) and the feature set. Features based onn-gram language models, despite their simplicity,are among those with the best performance in mostQE tasks (Shah et al., 2013b). However, they maynot generalise well due to the underlying discretenature of words in n-gram modelling.
Continuous Space Language Models (CSLM),on the other hand, have shown their potentialto capture long distance dependencies amongwords (Schwenk, 2012; Mikolov et al., 2013). Theassumption of these models is that semantically orgrammatically related words are mapped to simi-lar geometric locations in a high-dimensional con-tinuous space. The probability distribution is thusmuch smoother and therefore the model has a bet-ter generalisation power on unseen events. Therepresentations are learned in a continuous spaceto estimate the probabilities using neural networkswith single (called shallow networks) or multi-ple (called deep networks) hidden layers. Deepneural networks have been shown to perform bet-ter than shallow ones due to their capability tolearn higher-level, abstract representations of theinput (Arisoy et al., 2012). In this paper, we ex-plore the potential of these models in context ofQE for MT. We obtain more robust features withCSLM and improve the overall prediction powerfor translation quality.
The paper is organised as follows: In Section2 we briefly present the related work. Section 3describes the CSLM model training and its vari-ous settings. In Section 4 we propose the use ofCSLM features for QE. In Section 5 we presentour experiments along with their results.
2 Related Work
For a detailed overview of various features andalgorithms for QE, we refer the reader to the
1073
Page 115 of 146

Quality Translation 21D3.3: Evaluation metrics and analysis of first annotation round
WMT12-14 shared tasks on QE (Callison-Burchet al., 2012; Bojar et al., 2013; Ling et al., 2014).Most of the research work lies on deciding whichaspects of quality are more relevant for a giventask and designing feature extractors for them.While simple features such as counts of tokensand language model scores can be easily extracted,feature engineering for more advanced and usefulinformation can be quite labour-intensive.
Since their introduction in (Bengio et al.,2003), neural network language models havebeen successfully exploited in many speech andlanguage processing problems, including auto-matic speech recognition (Schwenk and Gau-vain, 2005; Schwenk, 2007) and machine trans-lation (Schwenk, 2012).
Recently, (Banchs et al., 2015) used a LatentSemantic Indexing approach to model sentencesas bag-of-words in a continuous space to measurecross language adequacy. (Tan et al., 2015) pro-posed to train models with deep regression for ma-chine translation evaluation in a task to measuresemantic similarity between sentences. They re-ported positive results on simple features; largerfeature sets did not improve these results.
In this paper, we propose to estimate the prob-abilities of source and target segments with con-tinuous space language models based on a deeparchitecture and to use these estimated probabili-ties as features along with standard feature sets ina supervised learning framework. To the best ofour knowledge, such approach has not been stud-ied before in the context of QE for MT. The resultshows significant improvements in many predic-tion tasks, despite its simplicity. Monolingual datafor source and target language is the only resourcerequired to extract these features.
3 Continuous Space Language Models
A key factor for quality inference of a translatedtext is to determine the fluency of such a text andhow well it conforms to the linguistic regularitiesof the target language. It involves grammaticalcorrectness, idiomatic and stylistic word choicesthat can be derived by using n-gram languagemodels. However, in high-order n-grams, the pa-rameter space is sparse and conventional mod-elling is inefficient. Neural networks model thenon-linear relationship between the input featuresand target outputs. They often outperform con-ventional techniques in difficult machine learningtasks. Neural network language models (CSLM)alleviate the curse of dimensionality by projecting
words into a continuous space, and modelling andestimating probabilities in this space.
The architecture of a deep CSLM is illus-trated in Figure 1. The inputs to a CSLMmodel are the (K − 1) left-context words(wi−K+1, . . . , wi−2, wi−1) to predict wi. A one-hot vector encoding scheme is used to repre-sent the input wi−k with an N -dimensional vec-tor. The output of CSLM is a vector of pos-terior probabilities for all words in vocabulary,P (wi|wi−1, wi−2, . . . , wi−K+1). Due to the largeoutput layer (vocabulary size), the complexity of abasic neural network language model is very high.Schwenk (2007) proposed efficient training strate-gies in order to reduce the computational complex-ity and speed up the training time. They processseveral examples at once and use a short-list vo-cabulary V with only the most frequent words.
Figure 1: Deep CSLM architecture.
Following the settings mentioned in (Schwenket al., 2014), all CSLM experiments describedin this paper are performed using deep networkswith four hidden layers: first layer for the projec-tion (320 units for each context word) and threehidden layers of 1024 units with tanh activation.At the output layer, we use a softmax activationfunction applied to a short-list of the 32k mostfrequent words. The probabilities of the out-of-vocabulary words are obtained from a standardback-off n-gram language model. The projectionof the words onto the continuous space and thetraining of the neural network is done by the stan-dard back-propagation algorithm and outputs arethe converged posterior probabilities. The modelparameters are optimised on a development set.
4 CSLM and Quality Estimation
In the context of MT, CSLMs are generally trainedon the target side of a given language pair to ex-
1074
Page 116 of 146

Quality Translation 21D3.3: Evaluation metrics and analysis of first annotation round
press the probability that the generated sentenceis “correct” or “likely”, without looking at thesource sentence. However, QE is also concernedwith how well the source segments can be trans-lated. Therefore, we trained two models, one foreach side of a given language pair. We extractedthe probabilities for QE training and test sets forboth source and its translation with their respec-tive models and used them as features, along withother features, in a supervised learning setting.
Finally, we also used CSLM in a spoken lan-guage translation (SLT) task. In SLT, an auto-matic speech recogniser (ASR) is used to decodethe source language text from audio. This createsan extra source of variability, where different ASRmodels and configurations give different outputs.In this paper, we use QE to exploit different ASRoutputs (i.e. MT inputs) which in turn can lead todifferent MT outputs.
5 Experiments
We focus on experiments with sentence level QEtasks. Our English-Spanish experiments are basedon the WMT QE shared task data from 2012 to2015.1 These tasks are diverse in nature, with dif-ferent sizes and labels such as post-editing effort(PEE), post-editing time (PET) and human trans-lation error rate (HTER). The results reported inSection 5.5 are directly comparable with the of-ficial systems submitted for each of the respec-tive tasks. We also performed experiments on theIWSLT 2014 English-French SLT task 2 to studythe applicability of our models on n-best ASR(MT inputs) comparison.
5.1 QE DatasetsIn Table 1 we summarise the data and tasks for ourexperiments. We refer readers to the WMT andIWSLT websites for detailed descriptions of thesedatasets. All datasets are publicly available.
WMT12: English-Spanish news sentence trans-lations produced by a Moses “baseline” statisti-cal MT (SMT) system, and judged for perceivedpost-editing effort in 1–5 (highest-lowest), takinga weighted average of three annotators (Callison-Burch et al., 2012).
WMT13 (Task-1): English-Spanish sentencetranslations of news texts produced by a Moses
1http://www.statmt.org/wmt[12,13,14,15]/quality-estimation-task.html
2https://sites.google.com/site/iwsltevaluation2014/slt-track
“baseline” SMT system. These were then post-edited by a professional translator and labelledusing HTER. This is a superset of the WMT12dataset, with 500 additional sentences for test, anda different quality label (Bojar et al., 2013).
WMT14 (Task-1.1): English-Spanish newssentence translations. The dataset contains sourcesentences and their human translations, as wellas three versions of machine translations: by anSMT system, a rule-based system system and ahybrid system. Each translation was labelled byprofessional translators with 1-3 (lowest-highest)scores for perceived post-editing effort.
WMT14 (Task-1.3): English-Spanish newssentence translations post-edited by a professionaltranslator, with the post-editing time collected on asentence-basis and used as label (in milliseconds).
WMT15 (Task-1): Large English-Spanish newsdataset containing source sentences, their machinetranslations by an online SMT system, and thepost-editions of the translation by crowdsourcedtranslators, with HTER used as label.
IWSLT14: English-French dataset containingsource language data from the 10-best (sentences)ASR system output. On the target side, the 1-best MT translation is used. The ASR systemleads to different source segments, which in turnlead to different translations. METEOR (Banerjeeand Lavie, 2005) is used to label these alternativetranslations against a reference (human) transla-tion. Both ASR and MT outputs come from a sys-tem submission in IWSLT 2014 (Ng et al., 2014).The ASR system is a multi-pass deep neural net-work tandem system with feature and model adap-tation and rescoring. The MT system is a phrase-based SMT system produced using Moses.
Dataset Lang. Train Test LabelWMT12 en-es 1, 832 422 PEE 1-5WMT13 en-es 2, 254 500 HTER 0-1WMT14task1.1 en-es 3, 816 600 PEE 1-3WMT14task1.3 en-es 650 208 PET (ms)WMT15 en-es 11, 271 1, 817 HTER 0-1IWSLT14 en-fr 8, 180 11, 240 MET. 0-1
Table 1: QE datasets: # sentences and labels.
5.2 CSLM Dataset
The dataset used for CSLM training consists ofEuroparl, News-commentary and News-crawl cor-pus. We used a data selection method (Moore
1075
Page 117 of 146
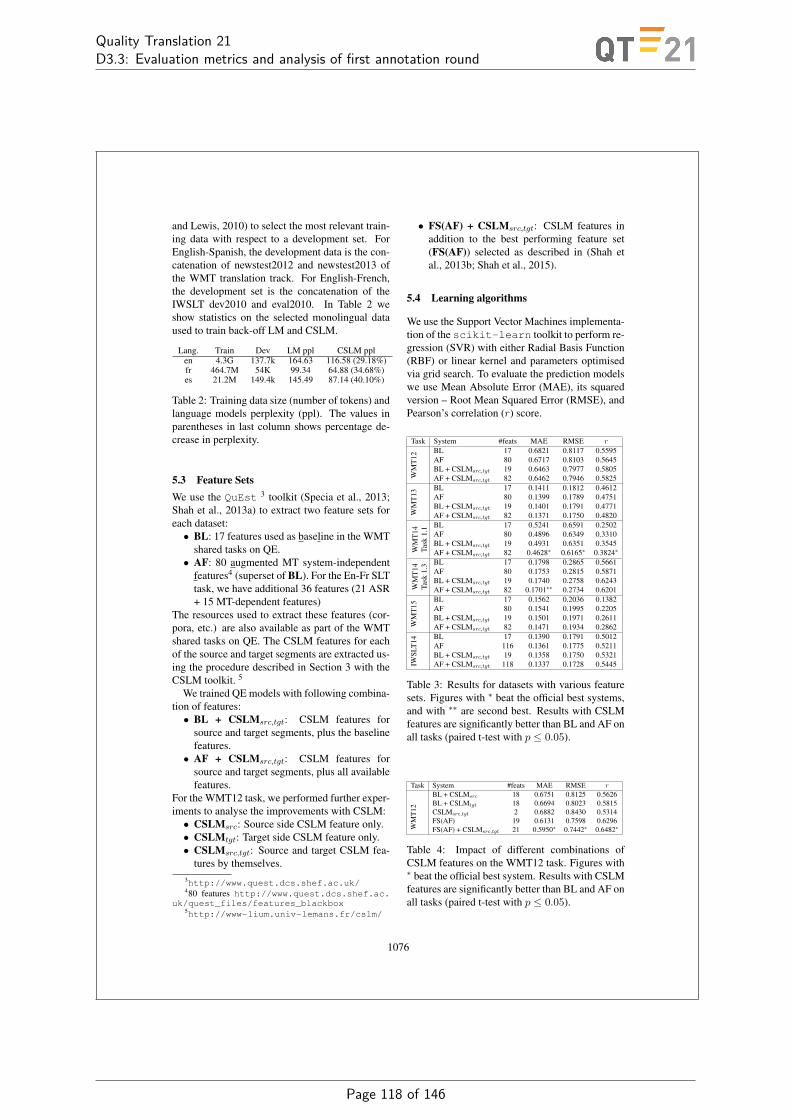
Quality Translation 21D3.3: Evaluation metrics and analysis of first annotation round
and Lewis, 2010) to select the most relevant train-ing data with respect to a development set. ForEnglish-Spanish, the development data is the con-catenation of newstest2012 and newstest2013 ofthe WMT translation track. For English-French,the development set is the concatenation of theIWSLT dev2010 and eval2010. In Table 2 weshow statistics on the selected monolingual dataused to train back-off LM and CSLM.
Lang. Train Dev LM ppl CSLM pplen 4.3G 137.7k 164.63 116.58 (29.18%)fr 464.7M 54K 99.34 64.88 (34.68%)es 21.2M 149.4k 145.49 87.14 (40.10%)
Table 2: Training data size (number of tokens) andlanguage models perplexity (ppl). The values inparentheses in last column shows percentage de-crease in perplexity.
5.3 Feature SetsWe use the QuEst 3 toolkit (Specia et al., 2013;Shah et al., 2013a) to extract two feature sets foreach dataset:• BL: 17 features used as baseline in the WMT
shared tasks on QE.• AF: 80 augmented MT system-independent
features4 (superset of BL). For the En-Fr SLTtask, we have additional 36 features (21 ASR+ 15 MT-dependent features)
The resources used to extract these features (cor-pora, etc.) are also available as part of the WMTshared tasks on QE. The CSLM features for eachof the source and target segments are extracted us-ing the procedure described in Section 3 with theCSLM toolkit. 5
We trained QE models with following combina-tion of features:• BL + CSLMsrc,tgt: CSLM features for
source and target segments, plus the baselinefeatures.• AF + CSLMsrc,tgt: CSLM features for
source and target segments, plus all availablefeatures.
For the WMT12 task, we performed further exper-iments to analyse the improvements with CSLM:• CSLMsrc: Source side CSLM feature only.• CSLMtgt: Target side CSLM feature only.• CSLMsrc,tgt: Source and target CSLM fea-
tures by themselves.3http://www.quest.dcs.shef.ac.uk/480 features http://www.quest.dcs.shef.ac.
uk/quest_files/features_blackbox5http://www-lium.univ-lemans.fr/cslm/
• FS(AF) + CSLMsrc,tgt: CSLM features inaddition to the best performing feature set(FS(AF)) selected as described in (Shah etal., 2013b; Shah et al., 2015).
5.4 Learning algorithms
We use the Support Vector Machines implementa-tion of the scikit-learn toolkit to perform re-gression (SVR) with either Radial Basis Function(RBF) or linear kernel and parameters optimisedvia grid search. To evaluate the prediction modelswe use Mean Absolute Error (MAE), its squaredversion – Root Mean Squared Error (RMSE), andPearson’s correlation (r) score.
Task System #feats MAE RMSE r
WM
T12
BL 17 0.6821 0.8117 0.5595AF 80 0.6717 0.8103 0.5645BL + CSLMsrc,tgt 19 0.6463 0.7977 0.5805AF + CSLMsrc,tgt 82 0.6462 0.7946 0.5825
WM
T13
BL 17 0.1411 0.1812 0.4612AF 80 0.1399 0.1789 0.4751BL + CSLMsrc,tgt 19 0.1401 0.1791 0.4771AF + CSLMsrc,tgt 82 0.1371 0.1750 0.4820
WM
T14
Task
1.1 BL 17 0.5241 0.6591 0.2502
AF 80 0.4896 0.6349 0.3310BL + CSLMsrc,tgt 19 0.4931 0.6351 0.3545AF + CSLMsrc,tgt 82 0.4628∗ 0.6165∗ 0.3824∗
WM
T14
Task
1.3 BL 17 0.1798 0.2865 0.5661
AF 80 0.1753 0.2815 0.5871BL + CSLMsrc,tgt 19 0.1740 0.2758 0.6243AF + CSLMsrc,tgt 82 0.1701∗∗ 0.2734 0.6201
WM
T15
BL 17 0.1562 0.2036 0.1382AF 80 0.1541 0.1995 0.2205BL + CSLMsrc,tgt 19 0.1501 0.1971 0.2611AF + CSLMsrc,tgt 82 0.1471 0.1934 0.2862
IWSL
T14 BL 17 0.1390 0.1791 0.5012
AF 116 0.1361 0.1775 0.5211BL + CSLMsrc,tgt 19 0.1358 0.1750 0.5321AF + CSLMsrc,tgt 118 0.1337 0.1728 0.5445
Table 3: Results for datasets with various featuresets. Figures with ∗ beat the official best systems,and with ∗∗ are second best. Results with CSLMfeatures are significantly better than BL and AF onall tasks (paired t-test with p ≤ 0.05).
Task System #feats MAE RMSE r
WM
T12
BL + CSLMsrc 18 0.6751 0.8125 0.5626BL + CSLMtgt 18 0.6694 0.8023 0.5815CSLMsrc,tgt 2 0.6882 0.8430 0.5314FS(AF) 19 0.6131 0.7598 0.6296FS(AF) + CSLMsrc,tgt 21 0.5950∗ 0.7442∗ 0.6482∗
Table 4: Impact of different combinations ofCSLM features on the WMT12 task. Figures with∗ beat the official best system. Results with CSLMfeatures are significantly better than BL and AF onall tasks (paired t-test with p ≤ 0.05).
1076
Page 118 of 146
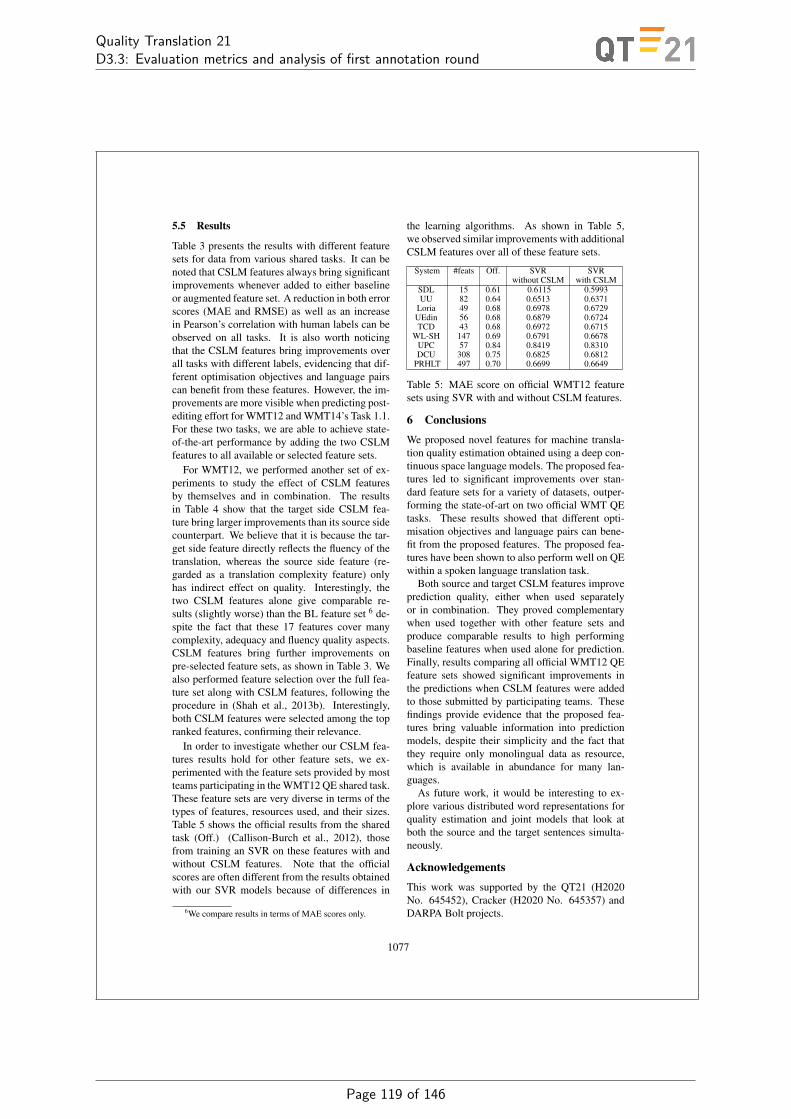
Quality Translation 21D3.3: Evaluation metrics and analysis of first annotation round
5.5 Results
Table 3 presents the results with different featuresets for data from various shared tasks. It can benoted that CSLM features always bring significantimprovements whenever added to either baselineor augmented feature set. A reduction in both errorscores (MAE and RMSE) as well as an increasein Pearson’s correlation with human labels can beobserved on all tasks. It is also worth noticingthat the CSLM features bring improvements overall tasks with different labels, evidencing that dif-ferent optimisation objectives and language pairscan benefit from these features. However, the im-provements are more visible when predicting post-editing effort for WMT12 and WMT14’s Task 1.1.For these two tasks, we are able to achieve state-of-the-art performance by adding the two CSLMfeatures to all available or selected feature sets.
For WMT12, we performed another set of ex-periments to study the effect of CSLM featuresby themselves and in combination. The resultsin Table 4 show that the target side CSLM fea-ture bring larger improvements than its source sidecounterpart. We believe that it is because the tar-get side feature directly reflects the fluency of thetranslation, whereas the source side feature (re-garded as a translation complexity feature) onlyhas indirect effect on quality. Interestingly, thetwo CSLM features alone give comparable re-sults (slightly worse) than the BL feature set 6 de-spite the fact that these 17 features cover manycomplexity, adequacy and fluency quality aspects.CSLM features bring further improvements onpre-selected feature sets, as shown in Table 3. Wealso performed feature selection over the full fea-ture set along with CSLM features, following theprocedure in (Shah et al., 2013b). Interestingly,both CSLM features were selected among the topranked features, confirming their relevance.
In order to investigate whether our CSLM fea-tures results hold for other feature sets, we ex-perimented with the feature sets provided by mostteams participating in the WMT12 QE shared task.These feature sets are very diverse in terms of thetypes of features, resources used, and their sizes.Table 5 shows the official results from the sharedtask (Off.) (Callison-Burch et al., 2012), thosefrom training an SVR on these features with andwithout CSLM features. Note that the officialscores are often different from the results obtainedwith our SVR models because of differences in
6We compare results in terms of MAE scores only.
the learning algorithms. As shown in Table 5,we observed similar improvements with additionalCSLM features over all of these feature sets.
System #feats Off. SVR SVRwithout CSLM with CSLM
SDL 15 0.61 0.6115 0.5993UU 82 0.64 0.6513 0.6371
Loria 49 0.68 0.6978 0.6729UEdin 56 0.68 0.6879 0.6724TCD 43 0.68 0.6972 0.6715
WL-SH 147 0.69 0.6791 0.6678UPC 57 0.84 0.8419 0.8310DCU 308 0.75 0.6825 0.6812
PRHLT 497 0.70 0.6699 0.6649
Table 5: MAE score on official WMT12 featuresets using SVR with and without CSLM features.
6 Conclusions
We proposed novel features for machine transla-tion quality estimation obtained using a deep con-tinuous space language models. The proposed fea-tures led to significant improvements over stan-dard feature sets for a variety of datasets, outper-forming the state-of-art on two official WMT QEtasks. These results showed that different opti-misation objectives and language pairs can bene-fit from the proposed features. The proposed fea-tures have been shown to also perform well on QEwithin a spoken language translation task.
Both source and target CSLM features improveprediction quality, either when used separatelyor in combination. They proved complementarywhen used together with other feature sets andproduce comparable results to high performingbaseline features when used alone for prediction.Finally, results comparing all official WMT12 QEfeature sets showed significant improvements inthe predictions when CSLM features were addedto those submitted by participating teams. Thesefindings provide evidence that the proposed fea-tures bring valuable information into predictionmodels, despite their simplicity and the fact thatthey require only monolingual data as resource,which is available in abundance for many lan-guages.
As future work, it would be interesting to ex-plore various distributed word representations forquality estimation and joint models that look atboth the source and the target sentences simulta-neously.
Acknowledgements
This work was supported by the QT21 (H2020No. 645452), Cracker (H2020 No. 645357) andDARPA Bolt projects.
1077
Page 119 of 146
Quality Translation 21D3.3: Evaluation metrics and analysis of first annotation round
ReferencesEbru Arisoy, Tara N. Sainath, Brian Kingsbury, and
Bhuvana Ramabhadran. 2012. Deep neural networklanguage models. In NAACL-HLT 2012 Workshop:Will We Ever Really Replace the N-gram Model? Onthe Future of Language Modeling for HLT, pages20–28, Montreal, Canada.
Rafael E Banchs, Luis F D’Haro, and Haizhou Li.2015. Adequacy–fluency metrics: Evaluating mtin the continuous space model framework. Au-dio, Speech, and Language Processing, IEEE/ACMTransactions on, 23(3):472–482.
Satanjeev Banerjee and Alon Lavie. 2005. Meteor: Anautomatic metric for mt evaluation with improvedcorrelation with human judgments. In ACL work-shop on intrinsic and extrinsic evaluation measuresfor machine translation and/or summarization, vol-ume 29, pages 65–72.
Yoshua Bengio, Rejean Ducharme, Pascal Vincent, andChristian Janvin. 2003. A neural probabilistic lan-guage model. The Journal of Machine Learning Re-search, 3:1137–1155.
Ondrej Bojar, Christian Buck, Chris Callison-Burch,Christian Federmann, Barry Haddow, PhilippKoehn, Christof Monz, Matt Post, Radu Soricut, andLucia Specia. 2013. Findings of the 2013 Work-shop on Statistical Machine Translation. In EighthWorkshop on Statistical Machine Translation, pages1–44, Sofia, Bulgaria.
Chris Callison-Burch, Philipp Koehn, Christof Monz,Matt Post, Radu Soricut, and Lucia Specia. 2012.Findings of the 2012 WMT. In Seventh Workshopon Statistical Machine Translation, pages 10–51,Montreal, Canada.
Wang Ling, Luis Marujo, Chris Dyer, Alan Black, andIsabel Trancoso. 2014. Crowdsourcing high-qualityparallel data extraction from twitter. In Ninth Work-shop on Statistical Machine Translation, WMT14,pages 426–436, Baltimore, USA.
Tomas Mikolov, Wen-tau Yih, and Geoffrey Zweig.2013. Linguistic regularities in continuous spaceword representations. In HLT-NAACL, pages 746–751.
Robert C. Moore and William Lewis. 2010. Intelli-gent selection of language model training data. InProceedings of the ACL 2010 Conference Short Pa-pers, ACLShort ’10, pages 220–224, Stroudsburg,PA, USA. Association for Computational Linguis-tics.
Raymond W. N. Ng, Mortaza Doulaty, Rama Dod-dipatla, Oscar Saz, Madina Hasan, Thomas Hain,Wilker Aziz, Kashif Shaf, and Lucia Specia. 2014.The USFD spoken language translation system forIWSLT 2014. Proc. IWSLT, pages 86–91.
Holger Schwenk and Jean-Luc Gauvain. 2005. Train-ing neural network language models on very largecorpora. In Conference on Human Language Tech-nology and Empirical Methods in Natural LanguageProcessing, pages 201–208.
Holger Schwenk, Fethi Bougares, and Loic Barrault.2014. Efficient training strategies for deep neuralnetwork language models. In NIPS workshop onDeep Learning and Representation Learning.
Holger Schwenk. 2007. Continuous space languagemodels. Computer Speech & Language, 21(3):492–518.
Holger Schwenk. 2012. Continuous space translationmodels for phrase-based statistical machine transla-tion. In COLING (Posters), pages 1071–1080.
Kashif Shah, Eleftherios Avramidis, Ergun Bicicic, andLucia Specia. 2013a. Quest - design, implemen-tation and extensions of a framework for machinetranslation quality estimation. The Prague Bulletinof Mathematical Linguistics, 100:19–30.
Kashif Shah, Trevor Cohn, and Lucia Specia. 2013b.An investigation on the effectiveness of features fortranslation quality estimation. In Machine Transla-tion Summit, volume 14, pages 167–174.
Kashif Shah, Trevor Cohn, and Lucia Specia. 2015.A bayesian non-linear method for feature selectionin machine translation quality estimation. MachineTranslation, 29(2):101–125.
Lucia Specia, Kashif Shah, Jose G. C. de Souza, andTrevor Cohn. 2013. QuEst - A translation qual-ity estimation framework. In 51st Annual Meetingof the Association for Computational Linguistics:Demo Session, pages 79–84, Sofia, Bulgaria.
Liling Tan, Carolina Scarton, Lucia Specia, and Josefvan Genabith. 2015. Usaar-sheffield: Semantictextual similarity with deep regression and machinetranslation evaluation metrics. In Proceedings of the9th International Workshop on Semantic Evaluation,pages 85–89, Denver, Colorado.
1078
Page 120 of 146
Quality Translation 21D3.3: Evaluation metrics and analysis of first annotation round
O SHEF-LIUM-NN: Sentence level Quality Estimation with NeuralNetwork Features
Proceedings of the First Conference on Machine Translation, Volume 2: Shared Task Papers, pages 838–842,Berlin, Germany, August 11-12, 2016. c©2016 Association for Computational Linguistics
SHEF-LIUM-NN: Sentence-level Quality Estimation with NeuralNetwork Features
Kashif Shah§, Fethi Bougares†, Loıc Barrault† Lucia Specia§§Department of Computer Science, University of Sheffield, UKkashif.shah,[email protected]
†LIUM, University of Le Mans, Francefethi.bougares,loı[email protected]
Abstract
This paper describes our systems forTask 1 of the WMT16 Shared Task onQuality Estimation. Our submissions use(i) a continuous space language model(CSLM) to extract sentence embeddingsand cross-entropy scores, (ii) a neural net-work machine translation (NMT) model,(iii) a set of QuEst features, and (iv) a com-bination of features produced by QuEstand with CSLM and NMT. Our primarysubmission achieved third place in thescoring task and second place in the rank-ing task. Another interesting finding isthe good performance obtained from us-ing as features only CSLM sentence em-beddings, which are learned in an unsuper-vised fashion without any additional hand-crafted features.
1 Introduction
Quality Estimation (QE) aims at measuring thequality of the output of Machine Translation (MT)systems without reference translations. Generally,QE is addressed with various features indicatingfluency, adequacy and complexity of the sourceand translation texts. Such features are used alongwith Machine Learning methods in order to learnprediction models.
Features play a key role in QE. A wide rangeof features from the source segments and theirtranslations, often processed using external re-sources and tools, have been proposed. Thesego from simple, language-independent features, toadvanced, linguistically motivated features. Theyinclude features that rely on information from theMT system that generated the translations, andfeatures that are oblivious to the way translationswere produced. This leads to a potential bottle-
neck: feature engineering can be time consuming,particularly because the impact of features varyacross datasets and language pairs. Also, mostfeatures in the literature are extracted from seg-ment pairs in isolation, ignoring contextual cluesfrom other segments in the text. The focus of ourcontributions this year is to explore a new set offeatures which are language-independent, requireminimal resources, and can be extracted in unsu-pervised ways with the use of neural networks.
Word embeddings have shown their poten-tial in modelling long distance dependencies indata, including syntactic and semantic informa-tion. For instance, neural network language mod-els (Bengio et al., 2003) have been success-fully explored in many problems including Au-tomatic Speech Recognition (Schwenk and Gau-vain, 2005; Schwenk, 2007) and Machine Trans-lation (Schwenk, 2012).
In this paper, we extend our previous work(Shah et al., 2015a; Shah et al., 2015b) to inves-tigate the use of sentence embeddings extractedfrom a neural network language model along withcross entropy scores as features for QE. We alsoinvestigate the use of a neural machine translationmodel to extract the log likelihood of sentencesas QE features. The features extracted from suchresources are used in isolation or combined withhand-crafted features from QuEst to learn predic-tion models.
2 Continuous Space Language ModelFeatures
Neural networks model non-linear relationshipsbetween the input features and target outputs.They often outperform other techniques in com-plex machine learning tasks. The inputs to theneural network language model used here (calledContinuous Space Language Model (CSLM)) are
838
Page 121 of 146
Quality Translation 21D3.3: Evaluation metrics and analysis of first annotation round
the hj context words of the prediction: hj =wj−n+1, ..., wj−2, wj−1, and the outputs are theposterior probabilities of all words of the vocab-ulary: P (wj |hj) ∀i ∈ [1, N ] where N is the vo-cabulary size. A CSLM encodes inputs using theso called one-hot coding, i.e., the ith word in thevocabulary is coded by setting all elements to 0except the ith element. Due to the large size ofthe output layer (vocabulary size), the computa-tional complexity of a basic neural network lan-guage model is very high. Schwenk (2012) pro-posed an implementation of the neural networkwith efficient algorithms to reduce the computa-tional complexity and speed up the processing us-ing a subset of the entire vocabulary called shortlist.
As compared to shallow neural networks, deepneural networks can use more hidden layers andhave been shown to perform better (Schwenk etal., 2014). In all CSLM experiments described inthis paper, we use 40-gram deep neural networkswith four hidden layers: a first layer for the wordprojection (320 units for each context word) andthree hidden layers of 1024 units for the proba-bility estimation. At the output layer, we use asoftmax activation function applied to a short listof the 32k most frequent words. The probabilitiesof the out of the short list words are obtained us-ing a standard back-off n-gram language model.The training of the neural network is done by thestandard back-propagation algorithm and outputsare the posterior probabilities. The parameters ofthe models are optimised on a held out develop-ment set. Our CSLM models were trained with theCSLM toolkit 1 and used to extract the followingfeatures:
• source sentence cross-entropy
• source sentence embeddings
• translation output cross-entropy
• translation output embeddings.
Table 1, reports detailed statistics on the mono-lingual data used to train the back-off LM andCSLM. The training dataset consists of WMT16translation task monolingual corpora with theMoore-Lewis data selection method (Moore andLewis, 2010) to select the CSLM training datawith respect to the task’s development set. The
1http://www-lium.univ-lemans.fr/cslm/
CSLM models are tuned using the WMT16 Qual-ity Estimation development corpus.
Lang. Train Dev 4-g LM px CSLM pxen 84G 17.8 k 61.30 50.69de 79G 19.7 k 64.99 54.45
Table 1: Training and dev datasets size (in numberof tokens) and models perplexity (px).
3 Neural Machine Translation Features
In addition to the monolingual features learned us-ing the neural network language model, we exper-iment with bilingual features derived from a neu-ral machine translation system (NMT). Our NMTsystem is developed based on a framework in-spired from the dl4mt-material project2. The sys-tem is an end-to-end sequence to sequence modeltuned to minimise the negative log-likelihood us-ing a stochastic gradient descent. In our experi-ments we trained two NMT systems (EN ↔ DE)with an attention mechanism similar to the one de-scribed in (Bahdanau et al., 2014).
Let X and Y be a source sentence of length Txand a target sentence of length Ty respectively:
X = (x1, x2, ..., xTx) (1)
Y = (y1, y2, ..., yTy) (2)
Each source and target word is represented with arandomly initialised embedding vector of size Es
and Et respectively. A bidirectional recurrent en-coder reads an input sequence X in forward andbackward directions to produce two sets of hiddenstates. At the end of the encoding step, we ob-tain a bidirectional annotation vector ht for eachsource position by concatenating the forward andbackward annotations:
ht =
[~ht~ht
](3)
A Gated Recurrent Unit (GRU) (Chung et al.,2014) is used for the encoder and decoder. Theyhave 1000 hidden units each, leading to an anno-tation vector ht ∈ R2000.
The attention mechanism, implemented as asimple fully-connected feed-forward neural net-work, accepts the hidden state ht of the decoder’srecurrent layer and one input annotation at a time,
2github.com/kyunghyuncho/dl4mt-material
839
Page 122 of 146

Quality Translation 21D3.3: Evaluation metrics and analysis of first annotation round
to produce the attention coefficients. A softmaxactivation is applied on those attention coefficientsto obtain the attention weights used to generate theweighted annotation vector for time t.
Both NMT systems are trained with WMT16Quality Estimation English-German datasets (weused post-editions on the German side) and tunedon the official development set. Table 2 reports thestatistics of NMT training data and BLEU scoreson the QE development set.
Trans. Direction Train Dev BLEUDE-to-EN 21k-20k 17.8 k 35.38EN-to-DE 20k-21k 19.7 k 37.51
Table 2: Training and development datasets sizes(number of tokens) and development set BLEUscores.
4 Experiments
In what follows we present our experiments on theWMT16 QE Task 1 with CSLM and NMT fea-tures.
4.1 Dataset
Task 1’s English-German dataset consists respec-tively of a training set and development set with12, 000 and 1, 000 source segments, their machinetranslations, the post-editions of the latter, and theedit distance scores between the MT and its post-edited version (HTER). The test set consists of2, 000 English-German source-MT pairs. Eachof the translations was post-edited by professionaltranslators, and HTER labels were computed us-ing the TER tool (settings: tokenised, case insensi-tive, exact matching only, with scores capped to 1).
4.2 Features
We extracted the following features:
• QuEst: 79 black-box features usingthe QuEst framework (Specia et al.,2013; Shah et al., 2013a) as describedin Shah et al. (2013b). The full setof features can be found on http://www.quest.dcs.shef.ac.uk/quest_files/features_blackbox.
• CSLMce: A cross-entropy feature for eachsource and target sentence using CSLM asdescribed in Section 2.
• NMTll: A log likelihood feature for eachsource and target sentence using NMT as de-scribed in Section 3.
• CSLMemb: Sentence features extracted bytaking the mean of 320-dimension word vec-tors trained using CSLM for both source andtarget. We also experimented with taking themin or the max of the embeddings, but em-pirically it was found that the mean performsbetter. Therefore, all our results are reportedusing the mean of word embeddings.
4.3 Learning algorithm
We use the Support Vector Machines implemen-tation in the scikit-learn toolkit (Pedregosaet al., 2011) to perform regression (SVR) on eachfeature set with either RBF kernels and parametersoptimised using grid search.
To evaluate the prediction models we use allevaluation metrics in the task: Pearson’s correla-tion r, Mean Absolute Error (MAE), Root MeanSquared Error (RMSE), Spearman’s correlation ρand Delta Average (DeltaAvg).
4.4 Results
We trained various models with different featuresets and algorithms and evaluated the performanceof these models on the official development set.The results are shown in Table 3. Based on thesefindings, as official submissions for Task 1, wesubmitted two systems:
• SHEF-SVM-CSLMce-NMTll-CSLMboth−emb
• SHEF-SVM-QuEst-CSLMce-NMTll-CSLMboth−emb
These systems contain all of our CSLM andNMT features either with or without QuEst: 719and 644 features in total, respectively. Wenamed them SVM-NN-both-emb and SVM-NN-both-emb-QuEst in the official submissions. Theofficial results are shown in Table 4. Our systemsshow promising performance across all of the met-rics used for evaluation in both scoring and rank-ing task variants. Our best system was ranked:
• Third place in the scoring task variant accord-ing to Pearson r (official scoring metric), andsecond place according MAE and RMSE.
• Second place in the ranking task variant ac-cording to Spearman ρ (official ranking met-ric) and first place according to DeltaAvg.
840
Page 123 of 146

Quality Translation 21D3.3: Evaluation metrics and analysis of first annotation round
System. # of Feats. MAE RMSE Pearson rBaseline (SVM) 17 13.97 19.65 0.359SHEF-SVM-QuEst 79 13.94 19.71 0.386SHEF-SVM-QuEst-CSLMce-NMTll 83 14.27 19.92 0.460SHEF-SVM-CSLMsrc−emb 320 13.97 18.87 0.416SHEF-SVM-CSLMtgt−emb 320 13.70 18.60 0.422SHEF-SVM-CSLMboth−emb 640 13.74 18.10 0.425SHEF-SVM-CSLMce-NMTll-CSLMboth−emb 644 13.48 17.94 0.500SHEF-SVM-QuEst-CSLMce-NMTll-CSLMtgt−emb 383 13.49 17.99 0.500SHEF-SVM-QuEst-CSLMce-NMTll-CSLMboth−emb 719 13.46 17.92 0.501
Table 3: Results on the development set of Task 1. Systems in bold are used as official submissions.
System. MAE RMSE Pearson r DeltaAvg Spearman ρBaseline 13.53 18.39 0.351 62.981 0.390
SVM-NN-both-emb 12.973 17.333 0.4305 78.861 0.4522
SVM-NN-both-emb-QuEst 12.882 17.032 0.4513 81.301 0.4742
Table 4: Official results on the test set of Task 1. The superscript shows the overall ranking of the systemagainst various official evaluation metrics.
Some of the interesting findings are:
• The mean of word embeddings extracted foreach sentence performs much better than themax or min.
• Sentence features extracted from CSLM em-beddings bring the largest improvements.
• Target embeddings produce better predic-tions than source embeddings, which is in-line with our previous findings (Shah et al.,2015b).
• CSLM cross entropy and NMT log likelihoodfeatures bring further improvements on top ofembedding features.
• QuEst features bring improvements when-ever added to either CSLM embeddings orcross entropy and NMT likelihood features.
• Neural Network features alone perform verywell. This is a very encouraging finding sincefor many language pairs it can be difficultto find appropriate resources to extract hand-crafted features.
5 Conclusions
In this paper we have explored novel features fortranslation Quality Estimation which are obtainedwith the use of Neural Networks. When added toQuEst standard feature sets for the WMT16 QETask 1, the CSLM sentence embedding features
along with cross entropy and NMT likelihood ledto large improvements in prediction. Moreover,CSLM and NMT features alone performed verywell. Combining all CSLM and NMT featureswith the ones produced by QuEst improved theperformance and led to very competitive systemsaccording to the task’s official results.
In the future work, we plan to explore bilin-gual embeddings extracted from our NMT models.Compared to the CSLM embeddings, NMT mod-els generate embeddings (with the bidirectionalNeural Network as presented in Section 3) of thewhole sentence with a focus on the current word.In addition, we plan to train a Neural Networkmodel to directly predict the QE scores.
Acknowledgements
This work was supported by the QT21 (H2020No. 645452, Lucia Specia), Cracker (H2020 No.645357, Kashif Shah) and the Chist-ERA M2CR3
(Fethi Bougares and Loıc Barrault) projects.
References
Dzmitry Bahdanau, Kyunghyun Cho, and YoshuaBengio. 2014. Neural machine translation byjointly learning to align and translate. CoRR,abs/1409.0473.
3m2cr.univ-lemans.fr
841
Page 124 of 146
Quality Translation 21D3.3: Evaluation metrics and analysis of first annotation round
Yoshua Bengio, Rejean Ducharme, Pascal Vincent, andChristian Janvin. 2003. A neural probabilistic lan-guage model. The Journal of Machine Learning Re-search.
Junyoung Chung, Caglar Gulcehre, KyungHyun Cho,and Yoshua Bengio. 2014. Empirical evaluation ofgated recurrent neural networks on sequence model-ing. CoRR, abs/1412.3555.
Robert C Moore and William Lewis. 2010. Intelligentselection of language model training data. In Pro-ceedings of the 48th ACL.
F. Pedregosa, G. Varoquaux, A. Gramfort, V. Michel,B. Thirion, O. Grisel, M. Blondel, P. Pretten-hofer, R. Weiss, V. Dubourg, J. Vanderplas, A. Pas-sos, D. Cournapeau, M. Brucher, M. Perrot, andE. Duchesnay. 2011. Scikit-learn: Machine learn-ing in Python. Journal of Machine Learning Re-search.
Holger Schwenk and Jean-Luc Gauvain. 2005. Train-ing neural network language models on very largecorpora. In Proceedings of the Conference on Hu-man Language Technology and Empirical Methodsin Natural Language Processing.
Holger Schwenk, Fethi Bougares, and Loic Barrault.2014. Efficient training strategies for deep neuralnetwork language models. Proceedings of NIPS.
Holger Schwenk. 2007. Continuous space languagemodels. Computer Speech & Language.
Holger Schwenk. 2012. Continuous space translationmodels for phrase-based statistical machine transla-tion. In Proceedings of COLING.
Kashif Shah, Eleftherios Avramidis, Ergun Bicicic, andLucia Specia. 2013a. Quest - design, implemen-tation and extensions of a framework for machinetranslation quality estimation. Prague Bull. Math.Linguistics.
Kashif Shah, Trevor Cohn, and Lucia Specia. 2013b.An investigation on the effectiveness of features fortranslation quality estimation. In Proceedings of theMachine Translation Summit.
Kashif Shah, Varvara Logacheva, Gustavo Paetzold,Frederic Blain, Daniel Beck, Fethi Bougares, andLucia Specia. 2015a. Shef-nn: Translation qualityestimation with neural networks. In Tenth Workshopon Statistical Machine Translation, pages 338–343,Lisboa, Portugal.
Kashif Shah, Raymond W.M. Ng, Fethi Bougares, andLucia Specia. 2015b. Investigating continuousspace language models for machine translation qual-ity estimation. In Conference on Empirical Methodsin Natural Language Processing, EMNLP, Lisboa,Portugal.
Lucia Specia, Kashif Shah, Jose G. C. de Souza, andTrevor Cohn. 2013. QuEst - A translation qualityestimation framework. In Proceedings of 51st ACL.
842
Page 125 of 146
Quality Translation 21D3.3: Evaluation metrics and analysis of first annotation round
P Exploring Prediction Uncertainty in Machine Translation QualityEstimation
Proceedings of the 20th SIGNLL Conference on Computational Natural Language Learning (CoNLL), pages 208–218,Berlin, Germany, August 7-12, 2016. c©2016 Association for Computational Linguistics
Exploring Prediction Uncertainty in Machine TranslationQuality Estimation
Daniel Beck† Lucia Specia† Trevor Cohn‡†Department of Computer Science
University of Sheffield, United Kingdom‡Computing and Information Systems
University of Melbourne, Australiadebeck1,[email protected], [email protected]
Abstract
Machine Translation Quality Estimation isa notoriously difficult task, which lessensits usefulness in real-world translation en-vironments. Such scenarios can be im-proved if quality predictions are accompa-nied by a measure of uncertainty. How-ever, models in this task are tradition-ally evaluated only in terms of point es-timate metrics, which do not take predic-tion uncertainty into account. We investi-gate probabilistic methods for Quality Es-timation that can provide well-calibrateduncertainty estimates and evaluate them interms of their full posterior predictive dis-tributions. We also show how this poste-rior information can be useful in an asym-metric risk scenario, which aims to capturetypical situations in translation workflows.
1 Introduction
Quality Estimation (QE) (Blatz et al., 2004; Spe-cia et al., 2009) models aim at predicting thequality of automatically translated text segments.Traditionally, these models provide point esti-mates and are evaluated using metrics like MeanAbsolute Error (MAE), Root-Mean-Square Error(RMSE) and Pearson’s r correlation coefficient.However, in practice QE models are built for usein decision making in large workflows involvingMachine Translation (MT). In these settings, rely-ing on point estimates would mean that only veryaccurate prediction models can be useful in prac-tice.
A way to improve decision making based onquality predictions is to explore uncertainty esti-mates. Consider for example a post-editing sce-nario where professional translators use MT in aneffort to speed-up the translation process. A QE
model can be used to determine if an MT seg-ment is good enough for post-editing or should bediscarded and translated from scratch. But sinceQE models are not perfect they can end up al-lowing bad MT segments to go through for post-editing because of a prediction error. In such a sce-nario, having an uncertainty estimate for the pre-diction can provide additional information for thefiltering decision. For instance, in order to ensuregood user experience for the human translator andmaximise translation productivity, an MT segmentcould be forwarded for post-editing only if a QEmodel assigns a high quality score with low uncer-tainty (high confidence). Such a decision processis not possible with point estimates only.
Good uncertainty estimates can be acquiredfrom well-calibrated probability distributions overthe quality predictions. In QE, arguably the mostsuccessful probabilistic models are Gaussian Pro-cesses (GPs) since they considered the state-of-the-art for regression (Cohn and Specia, 2013;Hensman et al., 2013), especially in the low-dataregimes typical for this task. We focus our anal-ysis in this paper on GPs since other commonmodels used in QE can only provide point esti-mates as predictions. Another reason why we fo-cus on probabilistic models is because this lets usemploy the ideas proposed by Quinonero-Candelaet al. (2006), which defined new evaluation met-rics that take into account probability distributionsover predictions.
The remaining of this paper is organised as fol-lows:
• In Section 2 we further motivate the use ofGPs for uncertainty modelling in QE and re-visit their underlying theory. We also proposesome model extensions previously developedin the GP literature and argue they are moreappropriate for the task.
208
Page 126 of 146

Quality Translation 21D3.3: Evaluation metrics and analysis of first annotation round
• We intrinsically evaluate our proposed mod-els in terms of their posterior distributions ontraining and test data in Section 3. Specifi-cally, we show that differences in uncertaintymodelling are not captured by the usual pointestimate metrics commonly used for this task.
• As an example of an application for predici-tive distributions, in Section 4 we show howthey can be useful in scenarios with asym-metric risk and how the proposed models canprovide better performance in this case.
We discuss related work in Section 5 and give con-clusions and avenues for future work in Section 6.
While we focus on QE as application, the meth-ods we explore in this paper can be applied toany text regression task where modelling predic-tive uncertainty is useful, either in human decisionmaking or by propagating this information for fur-ther computational processing.
2 Probabilistic Models for QE
Traditionally, QE is treated as a regression taskwith hand-crafted features. Kernel methods arearguably the state-of-the-art in QE since they caneasily model non-linearities in the data. Further-more, the scalability issues that arise in kernelmethods do not tend to affect QE in practice sincethe datasets are usually small, in the order of thou-sands of instances.
The most popular method for QE is SupportVector Regression (SVR), as shown in the multipleinstances of the WMT QE shared tasks (Callison-burch et al., 2012; Bojar et al., 2013; Bojar etal., 2014; Bojar et al., 2015). While SVR mod-els can generate competitive predictions for thistask, they lack a probabilistic interpretation, whichmakes it hard to extract uncertainty estimates us-ing them. Bootstrapping approaches like bagging(Abe and Mamitsuka, 1998) can be applied, butthis requires setting and optimising hyperparame-ters like bag size and number of bootstraps. Thereis also no guarantee these estimates come from awell-calibrated probabilistic distribution.
Gaussian Processes (GPs) (Rasmussen andWilliams, 2006) is an alternative kernel-basedframework that gives competitive results for pointestimates (Cohn and Specia, 2013; Shah et al.,2013; Beck et al., 2014b). Unlike SVR, they ex-plicitly model uncertainty in the data and in thepredictions. This makes GPs very applicable when
well-calibrated uncertainty estimates are required.Furthermore, they are very flexible in terms ofmodelling decisions by allowing the use of a vari-ety of kernels and likelihoods while providing effi-cient ways of doing model selection. Therefore, inthis work we focus on GPs for probabilistic mod-elling of QE. In what follows we briefly describethe GPs framework for regression.
2.1 Gaussian Process RegressionHere we follow closely the definition of GPsgiven by Rasmussen and Williams (2006). LetX = (x1, y1), (x2, y2), . . . , (xn, yn) be ourdata, where each x ∈ RD is a D-dimensional in-put and y is its corresponding response variable. AGP is defined as a stochastic model over the latentfunction f that generates the data X :
f(x) ∼ GP(m(x), k(x,x′)),
where m(x) is the mean function, which is usu-ally the 0 constant, and k(x,x′) is the kernel orcovariance function, which describes the covari-ance between values of f at the different locationsof x and x′.
The prior is combined with a likelihood viaBayes’ rule to obtain a posterior over the latentfunction:
p(f |X ) =p(y|X, f)p(f)
p(y|X),
where X and y are the training inputs and re-sponse variables, respectively. For regression, weassume that each yi = f(xi) + η, where η ∼N (0, σ2
n) is added white noise. Having a Gaussianlikelihood results in a closed form solution for theposterior.
Training a GP involves the optimisation ofmodel hyperparameters, which is done by max-imising the marginal likelihood p(y|X) via gra-dient ascent. Predictive posteriors for unseen x∗are obtained by integrating over the latent functionevaluations at x∗.
GPs can be extended in many different ways byapplying different kernels, likelihoods and modi-fying the posterior, for instance. In the next Sec-tions, we explain in detail some sensible mod-elling choices in applying GPs for QE.
2.2 Matern KernelsChoosing an appropriate kernel is a crucial stepin defining a GP model (and any other kernel
209
Page 127 of 146

Quality Translation 21D3.3: Evaluation metrics and analysis of first annotation round
method). A common choice is to employ the ex-ponentiated quadratic (EQ) kernel1:
kEQ(x,x′) = σv exp(−r2
2) ,
where r2 =D∑
i=1
(xi − x′i)2l2i
is the scaled distance between the two inputs, σv isa scale hyperparameter and l is a vector of length-scales. Most kernel methods tie all lengthscaleto a single value, resulting in an isotropic kernel.However, since in GPs hyperparameter optimisa-tion can be done efficiently, it is common to em-ploy one lengthscale per feature, a method calledAutomatic Relevance Determination (ARD).
The EQ kernel allows the modelling of non-linearities between the inputs and the responsevariables but it makes a strong assumption: itgenerates smooth, infinitely differentiable func-tions. This assumption can be too strong for noisydata. An alternative is the Matern class of kernels,which relax the smoothness assumption by mod-elling functions which are ν-times differentiableonly. Common values for ν are the half-integers3/2 and 5/2, resulting in the following Maternkernels:
kM32 = σv(1 +√
3r2) exp(−√
3r2)
kM52 = σv
(1 +√
5r2 +5r2
3
)exp(−
√5r2) ,
where we have omitted the dependence of kM32and kM52 on the inputs (x,x′) for brevity. Highervalues for ν are usually not very useful since theresulting behaviour is hard to distinguish fromlimit case ν → ∞, which retrieves the EQ kernel(Rasmussen and Williams, 2006, Sec. 4.2).
The relaxed smoothness assumptions from theMatern kernels makes them promising candidatesfor QE datasets, which tend to be very noisy. Weexpect that employing them will result in a bettermodels for this application.
2.3 Warped Gaussian Processes
The Gaussian likelihood of standard GPs has sup-port over the entire real number line. However,common quality scores are strictly positive val-ues, which means that the Gaussian assumption
1Also known as Radial Basis Function (RBF) kernel.
is not ideal. A usual way to deal with this prob-lem is model the logarithm of the response vari-ables, since this transformation maps strictly pos-itive values to the real line. However, there is noreason to believe this is the best possible mapping:a better idea would be to learn it from the data.
Warped GPs (Snelson et al., 2004) are an ex-tension of GPs that allows the learning of arbi-trary mappings. It does that by placing a mono-tonic warping function over the observations andmodelling the warped values inside a standard GP.The posterior distribution is obtained by applyinga change of variables:
p(y∗|x∗) =f ′(y∗)√
2πσ2∗exp
(f(y∗)− µ∗
2σ∗
),
where µ∗ and σ∗ are the mean and standard devia-tion of the latent (warped) response variable and fand f ′ are the warping function and its derivative.
Point predictions from this model depend on theloss function to be minimised. For absolute error,the median is the optimal value while for squarederror it is the mean of the posterior. In standardGPs, since the posterior is Gaussian the medianand mean coincide but this in general is not thecase for a Warped GP posterior. The median canbe easily obtained by applying the inverse warpingfunction to the latent median:
ymed∗ = f−1(µ∗).
While the inverse of the warping function is usu-ally not available in closed form, we can use itsgradient to have a numerical estimate.
The mean is obtained by integrating y∗ over thelatent density:
E[y∗] =∫f−1(z)Nz(µ∗, σ2
∗)dz,
where z is the latent variable. This can be eas-ily approximated using Gauss-Hermite quadraturesince it is a one dimensional integral over a Gaus-sian density.
The warping function should be flexible enoughto allow the learning of complex mappings, butit needs to be monotonic. Snelson et al. (2004)proposes a parametric form composed of a sum oftanh functions, similar to a neural network layer:
f(y) = y +I∑
i=1
ai tanh(bi(y + ci)),
210
Page 128 of 146
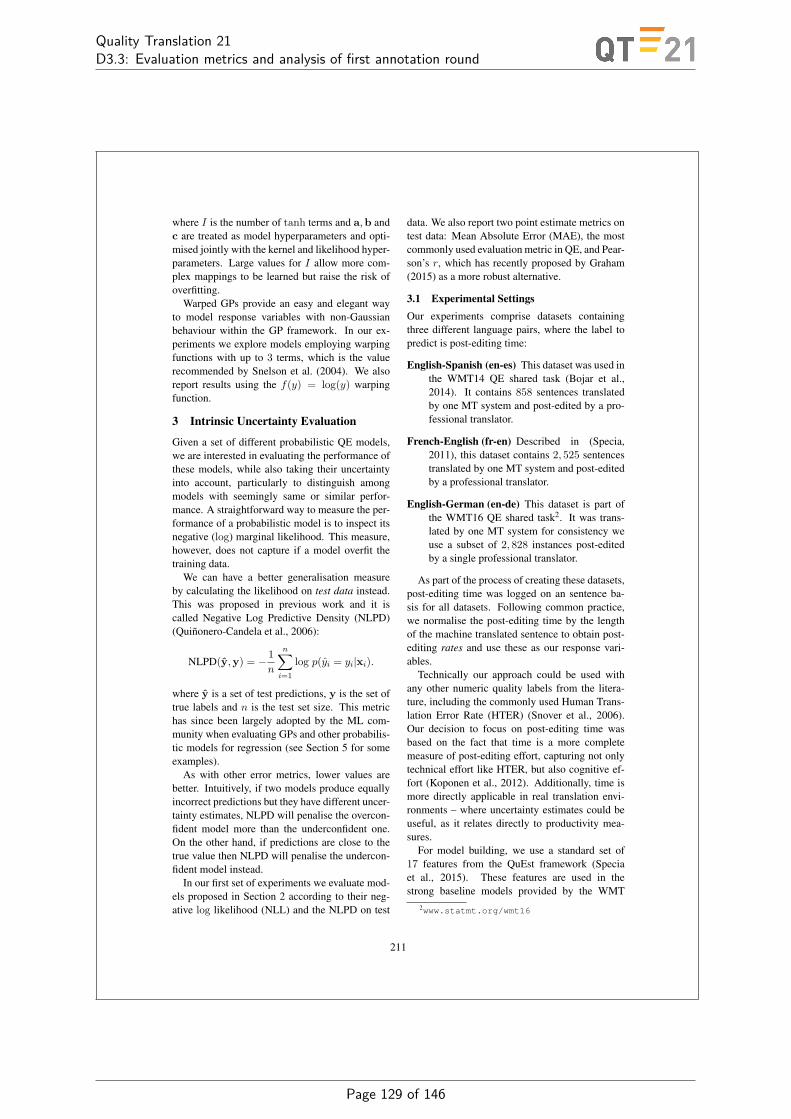
Quality Translation 21D3.3: Evaluation metrics and analysis of first annotation round
where I is the number of tanh terms and a,b andc are treated as model hyperparameters and opti-mised jointly with the kernel and likelihood hyper-parameters. Large values for I allow more com-plex mappings to be learned but raise the risk ofoverfitting.
Warped GPs provide an easy and elegant wayto model response variables with non-Gaussianbehaviour within the GP framework. In our ex-periments we explore models employing warpingfunctions with up to 3 terms, which is the valuerecommended by Snelson et al. (2004). We alsoreport results using the f(y) = log(y) warpingfunction.
3 Intrinsic Uncertainty Evaluation
Given a set of different probabilistic QE models,we are interested in evaluating the performance ofthese models, while also taking their uncertaintyinto account, particularly to distinguish amongmodels with seemingly same or similar perfor-mance. A straightforward way to measure the per-formance of a probabilistic model is to inspect itsnegative (log) marginal likelihood. This measure,however, does not capture if a model overfit thetraining data.
We can have a better generalisation measureby calculating the likelihood on test data instead.This was proposed in previous work and it iscalled Negative Log Predictive Density (NLPD)(Quinonero-Candela et al., 2006):
NLPD(y,y) = − 1n
n∑i=1
log p(yi = yi|xi).
where y is a set of test predictions, y is the set oftrue labels and n is the test set size. This metrichas since been largely adopted by the ML com-munity when evaluating GPs and other probabilis-tic models for regression (see Section 5 for someexamples).
As with other error metrics, lower values arebetter. Intuitively, if two models produce equallyincorrect predictions but they have different uncer-tainty estimates, NLPD will penalise the overcon-fident model more than the underconfident one.On the other hand, if predictions are close to thetrue value then NLPD will penalise the undercon-fident model instead.
In our first set of experiments we evaluate mod-els proposed in Section 2 according to their neg-ative log likelihood (NLL) and the NLPD on test
data. We also report two point estimate metrics ontest data: Mean Absolute Error (MAE), the mostcommonly used evaluation metric in QE, and Pear-son’s r, which has recently proposed by Graham(2015) as a more robust alternative.
3.1 Experimental SettingsOur experiments comprise datasets containingthree different language pairs, where the label topredict is post-editing time:
English-Spanish (en-es) This dataset was used inthe WMT14 QE shared task (Bojar et al.,2014). It contains 858 sentences translatedby one MT system and post-edited by a pro-fessional translator.
French-English (fr-en) Described in (Specia,2011), this dataset contains 2, 525 sentencestranslated by one MT system and post-editedby a professional translator.
English-German (en-de) This dataset is part ofthe WMT16 QE shared task2. It was trans-lated by one MT system for consistency weuse a subset of 2, 828 instances post-editedby a single professional translator.
As part of the process of creating these datasets,post-editing time was logged on an sentence ba-sis for all datasets. Following common practice,we normalise the post-editing time by the lengthof the machine translated sentence to obtain post-editing rates and use these as our response vari-ables.
Technically our approach could be used withany other numeric quality labels from the litera-ture, including the commonly used Human Trans-lation Error Rate (HTER) (Snover et al., 2006).Our decision to focus on post-editing time wasbased on the fact that time is a more completemeasure of post-editing effort, capturing not onlytechnical effort like HTER, but also cognitive ef-fort (Koponen et al., 2012). Additionally, time ismore directly applicable in real translation envi-ronments – where uncertainty estimates could beuseful, as it relates directly to productivity mea-sures.
For model building, we use a standard set of17 features from the QuEst framework (Speciaet al., 2015). These features are used in thestrong baseline models provided by the WMT
2www.statmt.org/wmt16
211
Page 129 of 146
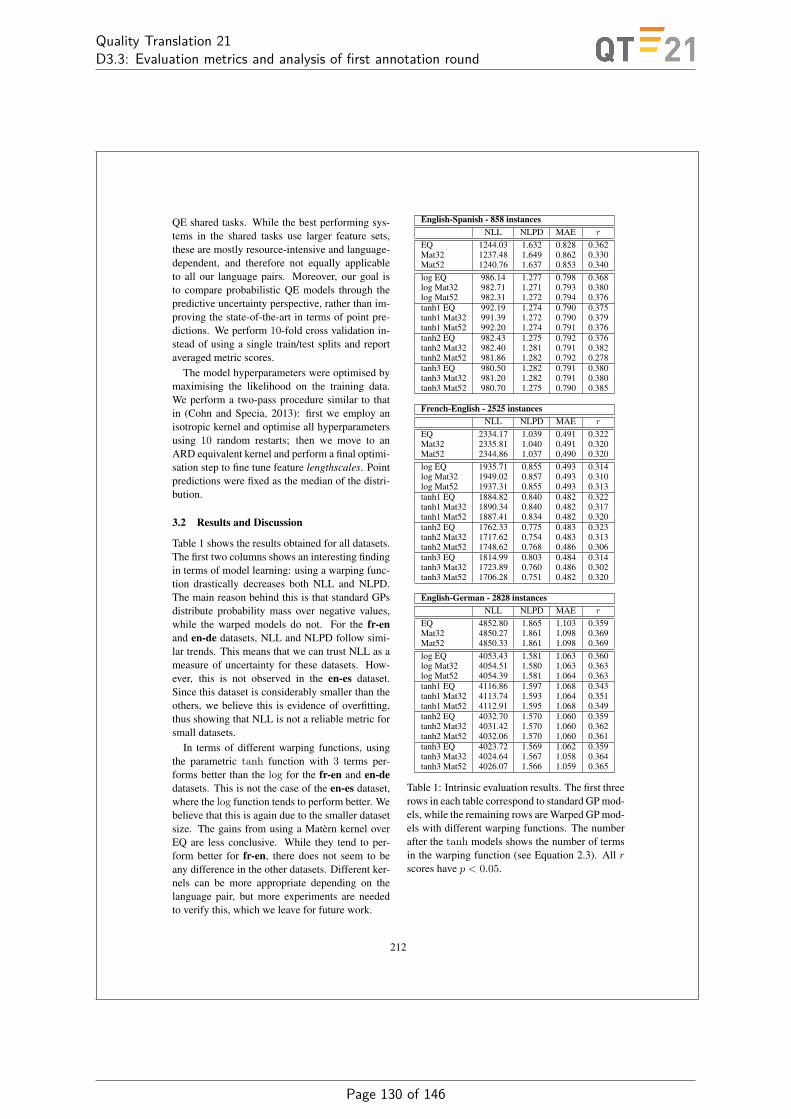
Quality Translation 21D3.3: Evaluation metrics and analysis of first annotation round
QE shared tasks. While the best performing sys-tems in the shared tasks use larger feature sets,these are mostly resource-intensive and language-dependent, and therefore not equally applicableto all our language pairs. Moreover, our goal isto compare probabilistic QE models through thepredictive uncertainty perspective, rather than im-proving the state-of-the-art in terms of point pre-dictions. We perform 10-fold cross validation in-stead of using a single train/test splits and reportaveraged metric scores.
The model hyperparameters were optimised bymaximising the likelihood on the training data.We perform a two-pass procedure similar to thatin (Cohn and Specia, 2013): first we employ anisotropic kernel and optimise all hyperparametersusing 10 random restarts; then we move to anARD equivalent kernel and perform a final optimi-sation step to fine tune feature lengthscales. Pointpredictions were fixed as the median of the distri-bution.
3.2 Results and Discussion
Table 1 shows the results obtained for all datasets.The first two columns shows an interesting findingin terms of model learning: using a warping func-tion drastically decreases both NLL and NLPD.The main reason behind this is that standard GPsdistribute probability mass over negative values,while the warped models do not. For the fr-enand en-de datasets, NLL and NLPD follow simi-lar trends. This means that we can trust NLL as ameasure of uncertainty for these datasets. How-ever, this is not observed in the en-es dataset.Since this dataset is considerably smaller than theothers, we believe this is evidence of overfitting,thus showing that NLL is not a reliable metric forsmall datasets.
In terms of different warping functions, usingthe parametric tanh function with 3 terms per-forms better than the log for the fr-en and en-dedatasets. This is not the case of the en-es dataset,where the log function tends to perform better. Webelieve that this is again due to the smaller datasetsize. The gains from using a Matern kernel overEQ are less conclusive. While they tend to per-form better for fr-en, there does not seem to beany difference in the other datasets. Different ker-nels can be more appropriate depending on thelanguage pair, but more experiments are neededto verify this, which we leave for future work.
English-Spanish - 858 instancesNLL NLPD MAE r
EQ 1244.03 1.632 0.828 0.362Mat32 1237.48 1.649 0.862 0.330Mat52 1240.76 1.637 0.853 0.340log EQ 986.14 1.277 0.798 0.368log Mat32 982.71 1.271 0.793 0.380log Mat52 982.31 1.272 0.794 0.376tanh1 EQ 992.19 1.274 0.790 0.375tanh1 Mat32 991.39 1.272 0.790 0.379tanh1 Mat52 992.20 1.274 0.791 0.376tanh2 EQ 982.43 1.275 0.792 0.376tanh2 Mat32 982.40 1.281 0.791 0.382tanh2 Mat52 981.86 1.282 0.792 0.278tanh3 EQ 980.50 1.282 0.791 0.380tanh3 Mat32 981.20 1.282 0.791 0.380tanh3 Mat52 980.70 1.275 0.790 0.385
French-English - 2525 instancesNLL NLPD MAE r
EQ 2334.17 1.039 0.491 0.322Mat32 2335.81 1.040 0.491 0.320Mat52 2344.86 1.037 0.490 0.320log EQ 1935.71 0.855 0.493 0.314log Mat32 1949.02 0.857 0.493 0.310log Mat52 1937.31 0.855 0.493 0.313tanh1 EQ 1884.82 0.840 0.482 0.322tanh1 Mat32 1890.34 0.840 0.482 0.317tanh1 Mat52 1887.41 0.834 0.482 0.320tanh2 EQ 1762.33 0.775 0.483 0.323tanh2 Mat32 1717.62 0.754 0.483 0.313tanh2 Mat52 1748.62 0.768 0.486 0.306tanh3 EQ 1814.99 0.803 0.484 0.314tanh3 Mat32 1723.89 0.760 0.486 0.302tanh3 Mat52 1706.28 0.751 0.482 0.320
English-German - 2828 instancesNLL NLPD MAE r
EQ 4852.80 1.865 1.103 0.359Mat32 4850.27 1.861 1.098 0.369Mat52 4850.33 1.861 1.098 0.369log EQ 4053.43 1.581 1.063 0.360log Mat32 4054.51 1.580 1.063 0.363log Mat52 4054.39 1.581 1.064 0.363tanh1 EQ 4116.86 1.597 1.068 0.343tanh1 Mat32 4113.74 1.593 1.064 0.351tanh1 Mat52 4112.91 1.595 1.068 0.349tanh2 EQ 4032.70 1.570 1.060 0.359tanh2 Mat32 4031.42 1.570 1.060 0.362tanh2 Mat52 4032.06 1.570 1.060 0.361tanh3 EQ 4023.72 1.569 1.062 0.359tanh3 Mat32 4024.64 1.567 1.058 0.364tanh3 Mat52 4026.07 1.566 1.059 0.365
Table 1: Intrinsic evaluation results. The first threerows in each table correspond to standard GP mod-els, while the remaining rows are Warped GP mod-els with different warping functions. The numberafter the tanh models shows the number of termsin the warping function (see Equation 2.3). All rscores have p < 0.05.
212
Page 130 of 146

Quality Translation 21D3.3: Evaluation metrics and analysis of first annotation round
The differences in uncertainty modelling are byand large not captured by the point estimate met-rics. While MAE does show gains from standardto Warped GPs, it does not reflect the differencefound between warping functions for fr-en. Pear-son’s r is also quite inconclusive in this sense,except for some observed gains for en-es. Thisshows that NLPD indeed should be preferred asa evaluation metric when proper prediction uncer-tainty estimates are required by a QE model.
3.3 Qualitative Analysis
To obtain more insights about the performance inuncertainty modelling we inspected the predictivedistributions for two sentence pairs in the fr-endataset. We show the distributions for a standardGP and a Warped GP with a tanh3 function in Fig-ure 1. In the first case, where both models giveaccurate predictions, we see that the Warped GPdistribution is peaked around the predicted value,as it should be. It also gives more probability massto positive values, showing that the model is ableto learn that the label is non-negative. In the sec-ond case we analyse the distributions when bothmodels make inaccurate predictions. We can seethat the Warped GP is able to give a broader distri-bution in this case, while still keeping most of themass outside the negative range.
We also report above each plot in Figure 1 theNLPD for each prediction. Comparing only theWarped GP predictions, we can see that their val-ues reflect the fact that we prefer sharp distribu-tions when predictions are accurate and broaderones when predictions are not accurate. However,it is interesting to see that the metric also penalisespredictions when their distributions are too broad,as it is the case with the standard GPs since theycan not discriminate between positive and negativevalues as well as the Warped GPs.
Inspecting the resulting warping functions canbring additional modelling insights. In Figure 2we show instances of tanh3 warping functionslearned from the three datasets and compare themwith the log warping function. We can see thatthe parametric tanh3 model is able to learn non-trivial mappings. For instance, in the en-es casethe learned function is roughly logarithmic in thelow scales but it switches to a linear mapping aftery = 4. Notice also the difference in the scales,which means that the optimal model uses a latentGaussian with a larger variance.
Figure 1: Predictive distributions for two fr-en in-stances under a Standard GP and a Warped GP.The top two plots correspond to a prediction withlow absolute error, while the bottom two plotsshow the behaviour when the absolute error ishigh.
4 Asymmetric Risk Scenarios
Evaluation metrics for QE, including those used inthe WMT QE shared tasks, are assumed to be sym-metric, i.e., they penalise over and underestimatesequally. This assumption is however too simplisticfor many possible applications of QE. For exam-ple:
• In a post-editing scenario, a project managermay have translators with limited expertise inpost-editing. In this case, automatic transla-tions should not be provided to the transla-tor unless they are highly likely to have verygood quality. This can be enforced this by in-creasing the penalisation weight for underes-timates. We call this the pessimistic scenario.
• In a gisting scenario, a company wants to au-tomatically translate their product reviews so
213
Page 131 of 146

Quality Translation 21D3.3: Evaluation metrics and analysis of first annotation round
Figure 2: Warping function instances from thethree datasets. The vertical axis correspond to thelatent warped values. The horizontal axis showthe observed response variables, which are alwayspositive in our case since they are post-editingtimes.
that they can be published in a foreign lan-guage without human intervention. The com-pany would prefer to publish only the reviewstranslated well enough, but having more re-views published will increase the chances ofselling products. In this case, having bet-ter recall is more important and thus onlyreviews with very poor translation qualityshould be discarded. We can accomplish thisby heavier penalisation on overestimates, ascenario we call optimistic.
In this Section we show how these scenarios canbe addressed by well-calibrated predictive distri-butions and by employing asymmetric loss func-tions. An example of such a function is the asym-metric linear (henceforth, AL) loss, which is ageneralisation of the absolute error:
L(y, y) =
w(y − y) if y > y
y − y if y ≤ y,where w > 0 is the weight given to overestimates.If w > 1 we have the pessimistic scenario, and theoptimistic one can be obtained using 0 < w < 1.For w = 1 we retrieve the original absolute errorloss.
Another asymmetric loss is the linear exponen-tial or linex loss (Zellner, 1986):
L(y, y) = exp[w(y − y)]− (y − y)− 1
where w ∈ R is the weight. This loss attempts tokeep a linear penalty in lesser risk regions, while
imposing an exponential penalty in the higher riskones. Negative values for w will result in a pes-simistic setting, while positive values will resultin the optimistic one. For w = 0, the loss approx-imates a squared error loss. Usual values for wtend to be close to 1 or−1 since for higher weightsthe loss can quickly reach very large scores. Bothlosses are shown on Figure 3.
Figure 3: Asymmetric losses. These curves cor-respond to the pessimistic scenario since they im-pose larger penalties when the prediction is lowerthan the true label. In the optimistic scenario thecurves would be reflected with respect to the ver-tical axis.
4.1 Bayes Risk for Asymmetric LossesThe losses introduced above can be incorporateddirectly into learning algorithms to obtain modelsfor a given scenario. In the context of the AL lossthis is called quantile regression (Koenker, 2005),since optimal estimators for this loss are posteriorquantiles. However, in a production environmentthe loss can change over time. For instance, in thegisting scenario discussed above the parameter wcould be changed based on feedback from indica-tors of sales revenue or user experience. If the lossis attached to the underlying learning algorithms,a change in w would require full model retraining,which can be costly.
Instead of retraining the model every time thereis a different loss, we can train a single probabilis-tic model and derive Bayes risk estimators for theloss we are interested in. This allows estimates tobe obtained without having to retrain models whenthe loss changes. Additionally, this allows differ-ent losses/scenarios to be employed at the sametime using the same model.
Minimum Bayes risk estimators for asymmet-ric losses were proposed by Christoffersen and
214
Page 132 of 146
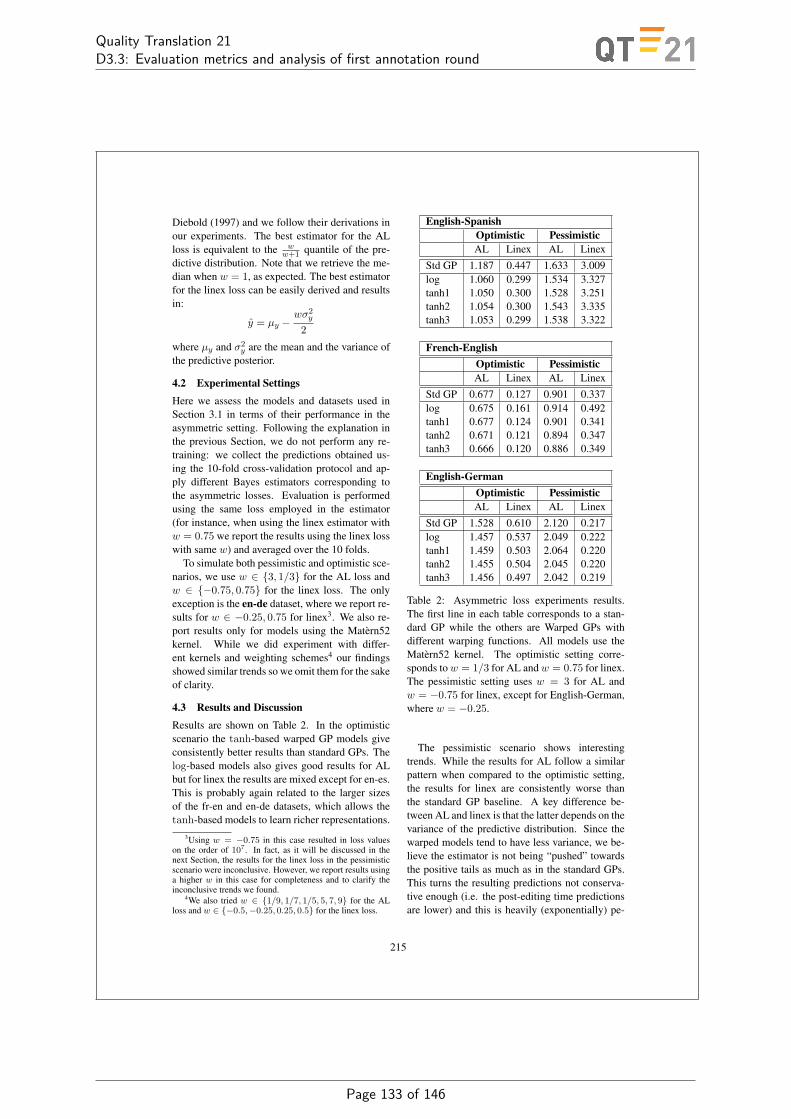
Quality Translation 21D3.3: Evaluation metrics and analysis of first annotation round
Diebold (1997) and we follow their derivations inour experiments. The best estimator for the ALloss is equivalent to the w
w+1 quantile of the pre-dictive distribution. Note that we retrieve the me-dian when w = 1, as expected. The best estimatorfor the linex loss can be easily derived and resultsin:
y = µy −wσ2
y
2
where µy and σ2y are the mean and the variance of
the predictive posterior.
4.2 Experimental SettingsHere we assess the models and datasets used inSection 3.1 in terms of their performance in theasymmetric setting. Following the explanation inthe previous Section, we do not perform any re-training: we collect the predictions obtained us-ing the 10-fold cross-validation protocol and ap-ply different Bayes estimators corresponding tothe asymmetric losses. Evaluation is performedusing the same loss employed in the estimator(for instance, when using the linex estimator withw = 0.75 we report the results using the linex losswith same w) and averaged over the 10 folds.
To simulate both pessimistic and optimistic sce-narios, we use w ∈ 3, 1/3 for the AL loss andw ∈ −0.75, 0.75 for the linex loss. The onlyexception is the en-de dataset, where we report re-sults for w ∈ −0.25, 0.75 for linex3. We also re-port results only for models using the Matern52kernel. While we did experiment with differ-ent kernels and weighting schemes4 our findingsshowed similar trends so we omit them for the sakeof clarity.
4.3 Results and DiscussionResults are shown on Table 2. In the optimisticscenario the tanh-based warped GP models giveconsistently better results than standard GPs. Thelog-based models also gives good results for ALbut for linex the results are mixed except for en-es.This is probably again related to the larger sizesof the fr-en and en-de datasets, which allows thetanh-based models to learn richer representations.
3Using w = −0.75 in this case resulted in loss valueson the order of 107. In fact, as it will be discussed in thenext Section, the results for the linex loss in the pessimisticscenario were inconclusive. However, we report results usinga higher w in this case for completeness and to clarify theinconclusive trends we found.
4We also tried w ∈ 1/9, 1/7, 1/5, 5, 7, 9 for the ALloss and w ∈ −0.5,−0.25, 0.25, 0.5 for the linex loss.
English-SpanishOptimistic PessimisticAL Linex AL Linex
Std GP 1.187 0.447 1.633 3.009log 1.060 0.299 1.534 3.327tanh1 1.050 0.300 1.528 3.251tanh2 1.054 0.300 1.543 3.335tanh3 1.053 0.299 1.538 3.322
French-EnglishOptimistic PessimisticAL Linex AL Linex
Std GP 0.677 0.127 0.901 0.337log 0.675 0.161 0.914 0.492tanh1 0.677 0.124 0.901 0.341tanh2 0.671 0.121 0.894 0.347tanh3 0.666 0.120 0.886 0.349
English-GermanOptimistic PessimisticAL Linex AL Linex
Std GP 1.528 0.610 2.120 0.217log 1.457 0.537 2.049 0.222tanh1 1.459 0.503 2.064 0.220tanh2 1.455 0.504 2.045 0.220tanh3 1.456 0.497 2.042 0.219
Table 2: Asymmetric loss experiments results.The first line in each table corresponds to a stan-dard GP while the others are Warped GPs withdifferent warping functions. All models use theMatern52 kernel. The optimistic setting corre-sponds tow = 1/3 for AL andw = 0.75 for linex.The pessimistic setting uses w = 3 for AL andw = −0.75 for linex, except for English-German,where w = −0.25.
The pessimistic scenario shows interestingtrends. While the results for AL follow a similarpattern when compared to the optimistic setting,the results for linex are consistently worse thanthe standard GP baseline. A key difference be-tween AL and linex is that the latter depends on thevariance of the predictive distribution. Since thewarped models tend to have less variance, we be-lieve the estimator is not being “pushed” towardsthe positive tails as much as in the standard GPs.This turns the resulting predictions not conserva-tive enough (i.e. the post-editing time predictionsare lower) and this is heavily (exponentially) pe-
215
Page 133 of 146
Quality Translation 21D3.3: Evaluation metrics and analysis of first annotation round
nalised by the loss. This might be a case wherea standard GP is preferred but can also indicatethat this loss is biased towards models with highvariance, even if it does that by assigning probabil-ity mass to nonsensical values (like negative time).We leave further investigation of this phenomenonfor future work.
5 Related Work
Quality Estimation is generally framed as text re-gression task, similarly to many other applicationssuch as movie revenue forecasting based on re-views (Joshi et al., 2010; Bitvai and Cohn, 2015)and detection of emotion strength in news head-lines (Strapparava and Mihalcea, 2008; Beck et al.,2014a) and song lyrics (Mihalcea and Strapparava,2012). In general, these applications are evalu-ated in terms of their point estimate predictions,arguably because not all of them employ proba-bilistic models.
The NLPD is common and established met-ric used in the GP literature to evaluate new ap-proaches. Examples include the original work onWarped GPs (Snelson et al., 2004), but also oth-ers like Lazaro-Gredilla (2012) and Chalupka etal. (2013). It has also been used to evaluate re-cent work on uncertainty propagation methods forneural networks (Hernandez-Lobato and Adams,2015).
Asymmetric loss functions are common in theeconometrics literature and were studied by Zell-ner (1986) and Koenker (2005), among others. Be-sides the AL and the linex, another well studiedloss is the asymmetric quadratic, which in turnrelates to the concept of expectiles (Newey andPowell, 1987). This loss generalises the com-monly used squared error loss. In terms of applica-tions, Cain and Janssen (1995) gives an example inreal estate assessment, where the consequences ofunder- and over-assessment are usually differentdepending on the specific scenario. An engineer-ing example is given by Zellner (1986) in the con-text of dam construction, where an underestimateof peak water level is much more serious than anoverestimate. Such real-world applications guidedmany developments in this field: we believe thattranslation and other language processing scenar-ios which rely on NLP technologies can heavilybenefit from these advancements.
6 Conclusions
This work explored new probabilistic models formachine translation QE that allow better uncer-tainty estimates. We proposed the use of NLPD,which can capture information on the whole pre-dictive distribution, unlike usual point estimate-based metrics. By assessing models using NLPDwe can make better informed decisions aboutwhich model to employ for different settings. Fur-thermore, we showed how information in the pre-dictive distribution can be used in asymmetric lossscenarios and how the proposed models can bebeneficial in these settings.
Uncertainty estimates can be useful in manyother settings beyond the ones explored in thiswork. Active Learning can benefit from vari-ance information in their query methods and it hasshown to be useful for QE (Beck et al., 2013).Exploratory analysis is another avenue for futurework, where error bars can provide further insightsabout the task, as shown in recent work (Nguyenand O’Connor, 2015). This kind of analysis can beuseful for tracking post-editor behaviour and as-sessing cost estimates for translation projects, forinstance.
Our main goal in this paper was to raise aware-ness about how different modelling aspects shouldbe taken into account when building QE models.Decision making can be risky using simple pointestimates and we believe that uncertainty informa-tion can be beneficial in such scenarios by provid-ing more informed solutions. These ideas are notrestricted to QE and we hope to see similar studiesin other natural language applications in the fu-ture.
Acknowledgements
Daniel Beck was supported by funding fromCNPq/Brazil (No. 237999/2012-9). Lucia Spe-cia was supported by the QT21 project (H2020No. 645452). Trevor Cohn is the recipient ofan Australian Research Council Future Fellow-ship (project number FT130101105). The authorswould like to thank James Hensman for his adviceon Warped GPs and the three anonymous review-ers for their comments.
ReferencesNaoki Abe and Hiroshi Mamitsuka. 1998. Query
learning strategies using boosting and bagging. In
216
Page 134 of 146
Quality Translation 21D3.3: Evaluation metrics and analysis of first annotation round
Proceedings of the Fifteenth International Confer-ence on Machine Learning, pages 1–9.
Daniel Beck, Lucia Specia, and Trevor Cohn. 2013.Reducing Annotation Effort for Quality Estimationvia Active Learning. In Proceedings of ACL.
Daniel Beck, Trevor Cohn, and Lucia Specia. 2014a.Joint Emotion Analysis via Multi-task Gaussian Pro-cesses. In Proceedings of EMNLP, pages 1798–1803.
Daniel Beck, Kashif Shah, and Lucia Specia. 2014b.SHEF-Lite 2.0 : Sparse Multi-task Gaussian Pro-cesses for Translation Quality Estimation. In Pro-ceedings of WMT14, pages 307–312.
Zsolt Bitvai and Trevor Cohn. 2015. Non-Linear TextRegression with a Deep Convolutional Neural Net-work. In Proceedings of ACL.
John Blatz, Erin Fitzgerald, and George Foster. 2004.Confidence estimation for machine translation. InProceedings of the 20th Conference on Computa-tional Linguistics, pages 315–321.
Ondej Bojar, Christian Buck, Chris Callison-Burch,Christian Federmann, Barry Haddow, PhilippKoehn, Christof Monz, Matt Post, Radu Soricut, andLucia Specia. 2013. Findings of the 2013 Workshopon Statistical Machine Translation. In Proceedingsof WMT13, pages 1–44.
Ondej Bojar, Christian Buck, Christian Federmann,Barry Haddow, Philipp Koehn, Johannes Leveling,Christof Monz, Pavel Pecina, Matt Post, HerveSaint-amand, Radu Soricut, Lucia Specia, and AlesTamchyna. 2014. Findings of the 2014 Workshopon Statistical Machine Translation. In Proceedingsof WMT14, pages 12–58.
Ondej Bojar, Rajen Chatterjee, Christian Federmann,Barry Haddow, Matthias Huck, Chris Hokamp,Philipp Koehn, Varvara Logacheva, Christof Monz,Matteo Negri, Matt Post, Carolina Scarton, LuciaSpecia, and Marco Turchi. 2015. Findings of the2015 Workshop on Statistical Machine Translation.In Proceedings of WMT15, pages 22–64.
Michael Cain and Christian Janssen. 1995. Real Es-tate Price Prediction under Asymmetric Loss. An-nals of the Institute of Statististical Mathematics,47(3):401–414.
Chris Callison-burch, Philipp Koehn, Christof Monz,Matt Post, Radu Soricut, and Lucia Specia. 2012.Findings of the 2012 Workshop on Statistical Ma-chine Translation. In Proceedings of WMT12.
Krzysztof Chalupka, Christopher K. I. Williams, andIain Murray. 2013. A Framework for EvaluatingApproximation Methods for Gaussian Process Re-gression. Journal of Machine Learning Research,14:333–350.
Peter F. Christoffersen and Francis X. Diebold.1997. Optimal Prediction Under Asymmetric Loss.Econometric Theory, 13(06):808–817.
Trevor Cohn and Lucia Specia. 2013. ModellingAnnotator Bias with Multi-task Gaussian Processes:An Application to Machine Translation Quality Es-timation. In Proceedings of ACL, pages 32–42.
Yvette Graham. 2015. Improving Evaluation of Ma-chine Translation Quality Estimation. In Proceed-ings of ACL.
James Hensman, Nicolo Fusi, and Neil D. Lawrence.2013. Gaussian Processes for Big Data. In Pro-ceedings of UAI, pages 282–290.
Jose Miguel Hernandez-Lobato and Ryan P. Adams.2015. Probabilistic Backpropagation for ScalableLearning of Bayesian Neural Networks. In Proceed-ings of ICML.
Mahesh Joshi, Dipanjan Das, Kevin Gimpel, andNoah A. Smith. 2010. Movie Reviews and Rev-enues: An Experiment in Text Regression. In Pro-ceedings of NAACL.
Roger Koenker. 2005. Quantile Regression. Cam-bridge University Press.
Maarit Koponen, Wilker Aziz, Luciana Ramos, andLucia Specia. 2012. Post-editing time as a measureof cognitive effort. In Proceedings of WPTP.
Miguel Lazaro-Gredilla. 2012. Bayesian WarpedGaussian Processes. In Proceedings of NIPS, pages1–9.
Rada Mihalcea and Carlo Strapparava. 2012. Lyrics,Music, and Emotions. In Proceedings of the JointConference on Empirical Methods in Natural Lan-guage Processing and Computational Natural Lan-guage Learning, pages 590–599.
Whitney K. Newey and James L. Powell. 1987.Asymmetric Least Squares Estimation and Testing.Econometrica, 55(4).
Khanh Nguyen and Brendan O’Connor. 2015. Poste-rior Calibration and Exploratory Analysis for Natu-ral Language Processing Models. In Proceedings ofEMNLP, number September, page 15.
Joaquin Quinonero-Candela, Carl Edward Rasmussen,Fabian Sinz, Olivier Bousquet, and BernhardScholkopf. 2006. Evaluating Predictive UncertaintyChallenge. MLCW 2005, Lecture Notes in Com-puter Science, 3944:1–27.
Carl Edward Rasmussen and Christopher K. I.Williams. 2006. Gaussian processes for machinelearning, volume 1. MIT Press Cambridge.
Kashif Shah, Trevor Cohn, and Lucia Specia. 2013.An Investigation on the Effectiveness of Features forTranslation Quality Estimation. In Proceedings ofMT Summit XIV.
217
Page 135 of 146

Quality Translation 21D3.3: Evaluation metrics and analysis of first annotation round
Edward Snelson, Carl Edward Rasmussen, and ZoubinGhahramani. 2004. Warped Gaussian Processes. InProceedings of NIPS.
Matthew Snover, Bonnie Dorr, Richard Schwartz, Lin-nea Micciulla, and John Makhoul. 2006. A study oftranslation edit rate with targeted human annotation.In Proceedings of AMTA.
Lucia Specia, Nicola Cancedda, Marc Dymetman,Marco Turchi, and Nello Cristianini. 2009. Estimat-ing the sentence-level quality of machine translationsystems. In Proceedings of EAMT, pages 28–35.
Lucia Specia, Gustavo Henrique Paetzold, and Car-olina Scarton. 2015. Multi-level Translation Qual-ity Prediction with QUEST++. In Proceedings ofACL Demo Session, pages 850–850.
Lucia Specia. 2011. Exploiting Objective Annotationsfor Measuring Translation Post-editing Effort. InProceedings of EAMT, pages 73–80.
Carlo Strapparava and Rada Mihalcea. 2008. Learn-ing to identify emotions in text. In Proceedings ofthe 2008 ACM Symposium on Applied Computing,pages 1556–1560.
Arnold Zellner. 1986. Bayesian Estimationand Prediction Using Asymmetric Loss Functions.Journal of the American Statistical Association,81(394):446–451.
218
Page 136 of 146
Quality Translation 21D3.3: Evaluation metrics and analysis of first annotation round
Q Large-scale Multitask Learning for Machine Translation QualityEstimation
Proceedings of NAACL-HLT 2016, pages 558–567,San Diego, California, June 12-17, 2016. c©2016 Association for Computational Linguistics
Large-scale Multitask Learning for Machine Translation Quality Estimation
Kashif Shah and Lucia SpeciaDepartment of Computer Science
University of Sheffield, UKkashif.shah,[email protected]
Abstract
Multitask learning has been proven a usefultechnique in a number of Natural LanguageProcessing applications where data is scarceand naturally diverse. Examples include learn-ing from data of different domains and learn-ing from labels provided by multiple annota-tors. Tasks in these scenarios would be thedomains or the annotators. When faced withlimited data for each task, a framework forthe learning of tasks in parallel while using ashared representation is clearly helpful: whatis learned for a given task can be transferredto other tasks while the peculiarities of eachtask are still modelled. Focusing on machinetranslation quality estimation as application,in this paper we show that multitask learningis also useful in cases where data is abundant.Based on two large-scale datasets, we exploremodels with multiple annotators and multiplelanguages and show that state-of-the-art mul-titask learning algorithms lead to improved re-sults in all settings.
1 Introduction
Quality Estimation (QE) models predict the qual-ity of Machine Translation (MT) output based onthe source and target texts only, without referencetranslations. This task is often framed as a super-vised machine learning problem using various fea-tures indicating fluency, adequacy and complexityof the source-target text pair, and annotations ontranslation quality given by human translators. Var-ious kernel-based regression and classification algo-rithms have been explored to learn prediction mod-els.
The application of QE we focus on here is thatof guiding professional translators during the post-editing of MT output. QE models can provide trans-lators with information on how much editing/timewill be necessary to fix a given segment, or onwhether it is worth editing it at all, as opposed totranslating it from scratch. For this application,models are learnt from quality annotations that re-flect post-editing effort, for instance, 1-5 judgementson estimated post-editing effort (Callison-Burch etal., 2012) or actual post-editing effort measured aspost-editing time (Bojar et al., 2013) or edit distancebetween the MT output and its post-edited version(Bojar et al., 2014; Bojar et al., 2015).
One of the biggest challenges in this field is todeal with the inherent subjectivity of quality labelsgiven by humans. Explicit judgements (e.g. the1-5 point scale) are affected the most, with pre-vious work showing that translators’ perception ofpost-editing effort differs from actual effort (Kopo-nen, 2012). However, even objective annotationsof actual post-editing effort are subject to naturalvariance. Take, for example, post-editing time asa label: Different annotators have different typingspeeds and may require more or less time to dealwith the same edits depending on their level of expe-rience, familiarity with the domain, etc. Post-editingdistance also varies across translators as there are of-ten multiple ways of producing a good quality trans-lation from an MT output, even when strict guide-lines are given.
In order to address variance among multiple trans-lators, three strategies have been applied: (i) mod-els are built by averaging annotations from multiple
558
Page 137 of 146

Quality Translation 21D3.3: Evaluation metrics and analysis of first annotation round
translators on the same data points, as was done inthe first shared task on the topic (Callison-Burch etal., 2012); (ii) models are built for individual trans-lators by collecting labelled data for each translator(Shah and Specia, 2014); and (iii) models are builtusing multitask learning techniques (Caruana, 1997)to put together annotations from multiple translatorswhile keeping track of the translators’ identificationto account for their individual biases (Cohn and Spe-cia, 2013; de Souza et al., 2015).
The first approach is sensible because, in the limit,the models built should reflect the “average” strate-gies/preferences of translators. However, its costmakes it prohibitive. The second approach can leadto very accurate models but it requires sufficienttraining data for each translator, and that all trans-lators are known at model building time. The lastapproach is very attractive. It is a transfer learn-ing (a.k.a. domain-adaptation) approach that allowsthe modelling of data from each individual translatorwhile also modelling correlations between transla-tors such that “similar” translators can mutually in-form one another. As such, it does not require mul-tiple annotations of the same data points and can beeffective even if only a few data points are availablefor each translator. In fact, previous work on multi-task learning for quality estimation has concentratedon the problem of learning prediction models fromlittle data provided by different annotators.
In this paper we take a step further to investigatemultitask learning for quality estimation in settingswhere data may be abundant for some or most an-notators. We explore a multitask learning approachthat provides a general, scalable and robust solutionregardless of the amount of data available. By test-ing models on single translator data, we show thatwhile building models for individual translators isa sensible decision when large amounts of data areavailable, the multitask learning approach can out-perform these models by learning from data by mul-tiple annotators. Additionally, besides having trans-lators as “tasks”, we address the problem of learningfrom data for multiple language pairs.
We devise our multitaslk approach within theBayesian non-parametric machine learning frame-work of Gaussian Processes (Rasmussen andWilliams, 2006). Gaussian Processes have shownvery good results for quality estimation in previous
work (Cohn and Specia, 2013; Beck et al., 2013;Shah et al., 2013). Our datasets – annotated for post-editing distance – contain nearly 100K data points,two orders of magnitude larger than those used inprevious work. To cope with scalability issues re-sulting from the size of these datasets, we apply asparse version of Gaussian Processes. We performextensive experiments on this large-scale data aim-ing to answer the following research questions:
• What is the best approach to build models tobe used by individual translators? How muchdata is necessary to build independent models(one per translator) that can be as accurate as(or better than) models using data from multi-ple translators?
• When large amounts of data are available, canwe still improve over independent and pooledmodels by learning from metadata to exploittransfer across translators?
• Can crosslingual data help improve model per-formance by exploiting transfer across lan-guage pairs?
In the remainder of the paper we start with anoverview on related work in the area of multitasklearning for quality estimation (Section 2), to thendescribe our approach to multitask learning in thecontext of Gaussian Processes (Section 3). In Sec-tion 4 we introduce our data and experimental set-tings. Finally in Sections 5 and 6 we present theresults of our experiments to answer the above men-tioned questions for cross-annotator and crosslin-gual transfer, respectively.
2 Related Work
As was discussed in Section 1, the problem of vari-ance among multiple translators in QE has recentlybeen approached in three ways. The first two ap-proaches essentially refer to preparation of the data.At WMT12, the first shared task on QE (Callison-Burch et al., 2012), the official dataset was createdby collecting three 1-5 (worst-best) discrete judge-ments on “perceived” post-editing effort for eachtranslated segment. The final score was a scaled av-erage of the three scores, and about 15% of the la-belled data was discarded as annotators diverged in
559
Page 138 of 146
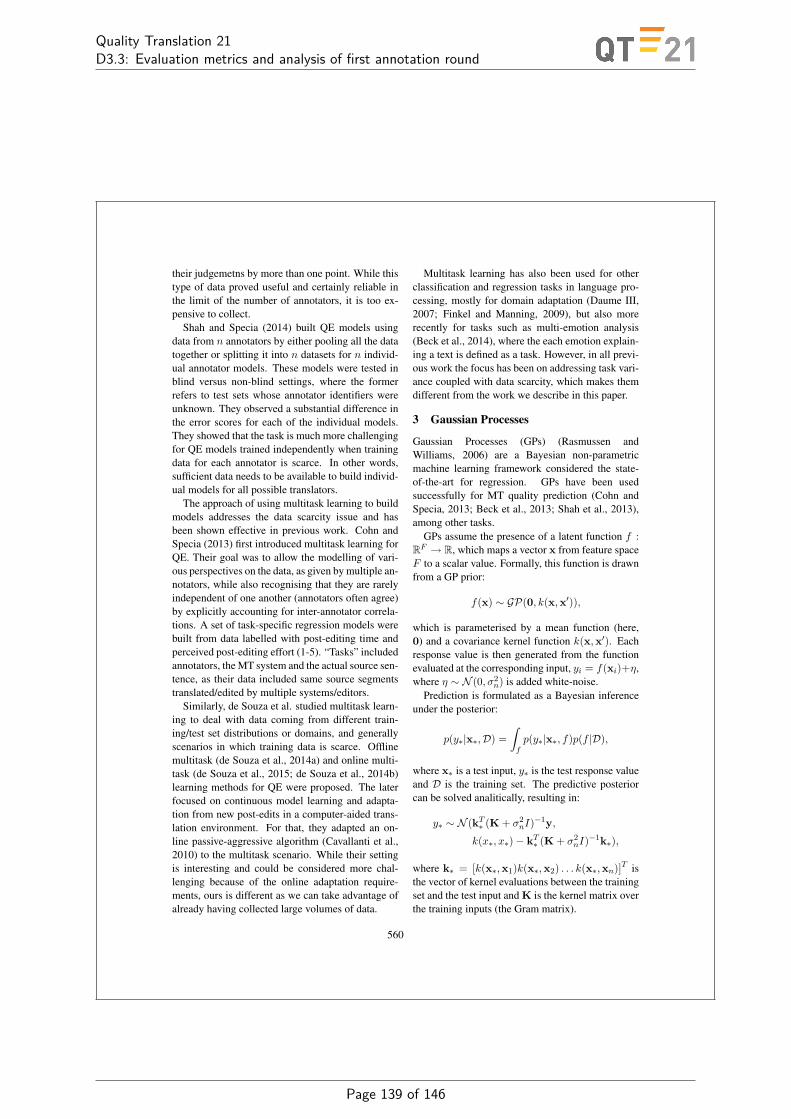
Quality Translation 21D3.3: Evaluation metrics and analysis of first annotation round
their judgemetns by more than one point. While thistype of data proved useful and certainly reliable inthe limit of the number of annotators, it is too ex-pensive to collect.
Shah and Specia (2014) built QE models usingdata from n annotators by either pooling all the datatogether or splitting it into n datasets for n individ-ual annotator models. These models were tested inblind versus non-blind settings, where the formerrefers to test sets whose annotator identifiers wereunknown. They observed a substantial difference inthe error scores for each of the individual models.They showed that the task is much more challengingfor QE models trained independently when trainingdata for each annotator is scarce. In other words,sufficient data needs to be available to build individ-ual models for all possible translators.
The approach of using multitask learning to buildmodels addresses the data scarcity issue and hasbeen shown effective in previous work. Cohn andSpecia (2013) first introduced multitask learning forQE. Their goal was to allow the modelling of vari-ous perspectives on the data, as given by multiple an-notators, while also recognising that they are rarelyindependent of one another (annotators often agree)by explicitly accounting for inter-annotator correla-tions. A set of task-specific regression models werebuilt from data labelled with post-editing time andperceived post-editing effort (1-5). “Tasks” includedannotators, the MT system and the actual source sen-tence, as their data included same source segmentstranslated/edited by multiple systems/editors.
Similarly, de Souza et al. studied multitask learn-ing to deal with data coming from different train-ing/test set distributions or domains, and generallyscenarios in which training data is scarce. Offlinemultitask (de Souza et al., 2014a) and online multi-task (de Souza et al., 2015; de Souza et al., 2014b)learning methods for QE were proposed. The laterfocused on continuous model learning and adapta-tion from new post-edits in a computer-aided trans-lation environment. For that, they adapted an on-line passive-aggressive algorithm (Cavallanti et al.,2010) to the multitask scenario. While their settingis interesting and could be considered more chal-lenging because of the online adaptation require-ments, ours is different as we can take advantage ofalready having collected large volumes of data.
Multitask learning has also been used for otherclassification and regression tasks in language pro-cessing, mostly for domain adaptation (Daume III,2007; Finkel and Manning, 2009), but also morerecently for tasks such as multi-emotion analysis(Beck et al., 2014), where the each emotion explain-ing a text is defined as a task. However, in all previ-ous work the focus has been on addressing task vari-ance coupled with data scarcity, which makes themdifferent from the work we describe in this paper.
3 Gaussian Processes
Gaussian Processes (GPs) (Rasmussen andWilliams, 2006) are a Bayesian non-parametricmachine learning framework considered the state-of-the-art for regression. GPs have been usedsuccessfully for MT quality prediction (Cohn andSpecia, 2013; Beck et al., 2013; Shah et al., 2013),among other tasks.
GPs assume the presence of a latent function f :RF → R, which maps a vector x from feature spaceF to a scalar value. Formally, this function is drawnfrom a GP prior:
f(x) ∼ GP(0, k(x,x′)),
which is parameterised by a mean function (here,0) and a covariance kernel function k(x,x′). Eachresponse value is then generated from the functionevaluated at the corresponding input, yi = f(xi)+η,where η ∼ N (0, σ2
n) is added white-noise.Prediction is formulated as a Bayesian inference
under the posterior:
p(y∗|x∗,D) =∫
fp(y∗|x∗, f)p(f |D),
where x∗ is a test input, y∗ is the test response valueand D is the training set. The predictive posteriorcan be solved analitically, resulting in:
y∗ ∼ N (kT∗ (K + σ2
nI)−1y,
k(x∗, x∗)− kT∗ (K + σ2
nI)−1k∗),
where k∗ = [k(x∗,x1)k(x∗,x2) . . . k(x∗,xn)]T isthe vector of kernel evaluations between the trainingset and the test input and K is the kernel matrix overthe training inputs (the Gram matrix).
560
Page 139 of 146
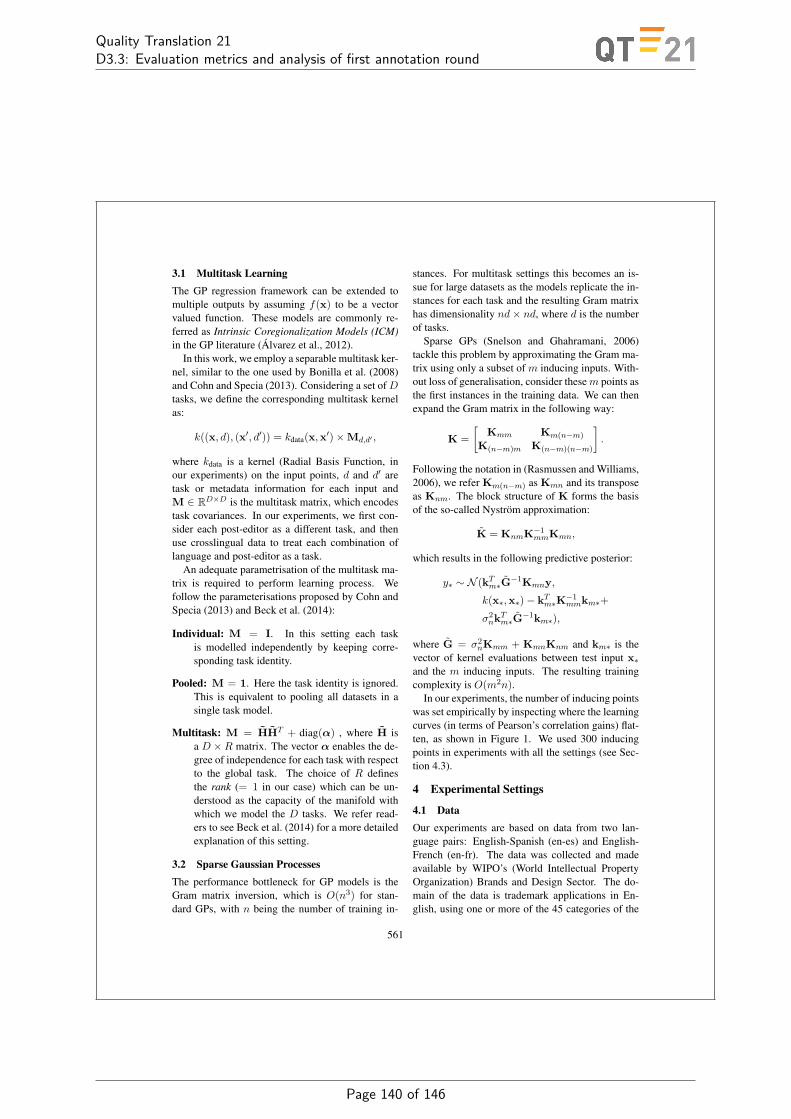
Quality Translation 21D3.3: Evaluation metrics and analysis of first annotation round
3.1 Multitask LearningThe GP regression framework can be extended tomultiple outputs by assuming f(x) to be a vectorvalued function. These models are commonly re-ferred as Intrinsic Coregionalization Models (ICM)in the GP literature (Alvarez et al., 2012).
In this work, we employ a separable multitask ker-nel, similar to the one used by Bonilla et al. (2008)and Cohn and Specia (2013). Considering a set ofDtasks, we define the corresponding multitask kernelas:
k((x, d), (x′, d′)) = kdata(x,x′)×Md,d′ ,
where kdata is a kernel (Radial Basis Function, inour experiments) on the input points, d and d′ aretask or metadata information for each input andM ∈ RD×D is the multitask matrix, which encodestask covariances. In our experiments, we first con-sider each post-editor as a different task, and thenuse crosslingual data to treat each combination oflanguage and post-editor as a task.
An adequate parametrisation of the multitask ma-trix is required to perform learning process. Wefollow the parameterisations proposed by Cohn andSpecia (2013) and Beck et al. (2014):
Individual: M = I. In this setting each taskis modelled independently by keeping corre-sponding task identity.
Pooled: M = 1. Here the task identity is ignored.This is equivalent to pooling all datasets in asingle task model.
Multitask: M = HHT + diag(α) , where H isa D ×R matrix. The vector α enables the de-gree of independence for each task with respectto the global task. The choice of R definesthe rank (= 1 in our case) which can be un-derstood as the capacity of the manifold withwhich we model the D tasks. We refer read-ers to see Beck et al. (2014) for a more detailedexplanation of this setting.
3.2 Sparse Gaussian ProcessesThe performance bottleneck for GP models is theGram matrix inversion, which is O(n3) for stan-dard GPs, with n being the number of training in-
stances. For multitask settings this becomes an is-sue for large datasets as the models replicate the in-stances for each task and the resulting Gram matrixhas dimensionality nd × nd, where d is the numberof tasks.
Sparse GPs (Snelson and Ghahramani, 2006)tackle this problem by approximating the Gram ma-trix using only a subset of m inducing inputs. With-out loss of generalisation, consider thesem points asthe first instances in the training data. We can thenexpand the Gram matrix in the following way:
K =[
Kmm Km(n−m)
K(n−m)m K(n−m)(n−m)
].
Following the notation in (Rasmussen and Williams,2006), we refer Km(n−m) as Kmn and its transposeas Knm. The block structure of K forms the basisof the so-called Nystrom approximation:
K = KnmK−1mmKmn,
which results in the following predictive posterior:
y∗ ∼ N (kTm∗G
−1Kmny,
k(x∗,x∗)− kTm∗K
−1mmkm∗+
σ2nk
Tm∗G
−1km∗),
where G = σ2nKmm + KmnKnm and km∗ is the
vector of kernel evaluations between test input x∗and the m inducing inputs. The resulting trainingcomplexity is O(m2n).
In our experiments, the number of inducing pointswas set empirically by inspecting where the learningcurves (in terms of Pearson’s correlation gains) flat-ten, as shown in Figure 1. We used 300 inducingpoints in experiments with all the settings (see Sec-tion 4.3).
4 Experimental Settings
4.1 DataOur experiments are based on data from two lan-guage pairs: English-Spanish (en-es) and English-French (en-fr). The data was collected and madeavailable by WIPO’s (World Intellectual PropertyOrganization) Brands and Design Sector. The do-main of the data is trademark applications in En-glish, using one or more of the 45 categories of the
561
Page 140 of 146

Quality Translation 21D3.3: Evaluation metrics and analysis of first annotation round
0.45%
0.46%
0.47%
0.48%
0.49%
0.5%
0.51%
0.52%
0% 200% 400% 600% 800% 1000% 1200%
r"
inducing"points"
Figure 1: Number of inducing points versus Pear-son’s correlation
NICE1 goods and services (e.g. furniture, clothing),and their translations into one of the two languages.
An in-house phrase-based statistical MT systemwas built by WIPO (Pouliquen et al., 2011), trainedon domain-specific data, to translate the English seg-ments. The quality of the translations produced isconsidered high, with BLEU scores on a 1K-singlereference test set reaching 0.71. This is partly at-tributed to the short length and relative simplicityof the segments in the sub-domains of goods andservices. The post-editing was done mostly inter-nally and systematically collected between Novem-ber 2014 and August 2015. The quality label foreach segment is post-editing distance, calculated asthe HTER (Snover et al., 2006) between the tar-get segment and its post-edition using the TERCOMtool.2
The data was split into 75% for training and 25%for test, with each split maintaining the original datadistribution by post-editor. The number of trainingand test <source, MT output, post-edited MT, HTERscore> tuples for each of the post-editors (ID) andlanguage pair is given in Table 1. There are 63,763overlapping English source segments out of 77,656entries for en-fr and 98,663 entries for en-es. Thisinformation is relevant for the crosslingual data ex-periments, as we discuss in Section 6.
It should be noted that the total number of seg-ments as well as the number of segments per post-editor is significantly higher than those used in pre-
1http://www.wipo.int/classifications/nice/en/
2http://www.cs.umd.edu/˜snover/tercom/
Lang. Pair ID Total Train Test
en-es
1 28,423 21,317 7,1052 12,904 9,678 3,2263 3,939 2,954 9844 16,518 12,388 4,1295 14,187 10,640 3,5466 9,395 7,046 2,3487 402 301 1008 9,294 6,970 2,3239 845 633 211
10 2,756 2,067 689All 98,663 73,997 24,665
en-fr
1 65,280 48,960 16,3202 6,336 4,752 1,5843 769 576 1924 5,271 3,953 1,317
All 77,656 58,241 19,413
Table 1: Number of en-es and en-fr segments
vious work. For example, (Cohn and Specia, 2013)used datasets of 6,762 instances (2,254 for each ofthree translator) and 1,624 instances (299 for each ofeight translators), while (Beck et al., 2014) had ac-cess to 1000 instances annotated with six emotions.
4.2 Algorithms
For all tasks we used the QuEst framework (Speciaet al., 2013) to extract a set of 17 baseline black-boxfeatures3 (Shah et al., 2013) for which we had all thenecessary resources for the WIPO domain. Thesebaseline features have shown to perform well inthe WMT shared tasks on QE. They include simplecounts, e.g. number of tokens in source and targetsegments, source and target language model prob-abilities and perplexities, average number of possi-ble translations for source words, number of punc-tuation marks in source and target segments, amongother features reflecting the complexity of the sourcesegment and the fluency of the target segment.
All our models were trained using the GPy4
toolkit, an open source implementation of GPs writ-ten in Python.
4.3 Settings
We built and tested models in the following condi-tions:
3http://www.quest.dcs.shef.ac.uk/quest_files/features_blackbox_baseline_17
4http://sheffieldml.github.io/GPy/
562
Page 141 of 146

Quality Translation 21D3.3: Evaluation metrics and analysis of first annotation round
One language Setting-1 Setting-2 Setting-3 Setting-4 Setting-5 Setting-6ind trn-ind tst pol trn-ind tst mtl trn-ind tst ind trn-pol tst pol trn-pol tst mtl trn-pol tst
Model Individual Pooled Multitask Individual Pooled MultitaskTest Individual Individual Individual Pooled Pooled PooledCrosslingual (cl) Setting-7 Setting-8 Setting-9 Setting-10
cl pol trn-ind tst cl mtl trn-ind tst cl pol trn-pol tst cl mtl trn-pol tstModel Pooled Multitask Pooled MultitaskTest Individual Individual Pooled PooledNon-overlapping (no) Setting-11 Setting-12 Setting-13
no cl pol trn-pol tst no mtl trn-pol tst no cl mtl trn-pol tstModel Pooled Multitask MultitaskTest Pooled Pooled Pooled
Table 2: Various models and test settings in our experiments
• Setting-1: Individual models on individual testsets: each model is trained with data from anindividual post-editor and tested on the test setfor the same individual post-editor.
• Setting-2: Pooled model on individual testsets: model trained with data concatenatedfrom all post-editors and tested on test sets ofindividual post-editors.
• Setting-3: Multitask model on individual testsets: multitask models trained with data fromall post-editors and tested on test sets of indi-vidual post-editors.
• Setting-4: Individual models tested on pooledtest set: each model is trained with data froman individual post-editor and tested on a test setwith data from all post-editors. This setup aimsto find out the performance of individual mod-els when the identifier of the post-editor is notknown (e.g. in crowdsourcing settings).
• Setting-5: Pooled model on pooled test set:model trained with data concatenated from allpost-editors and tested on test set of all post-editors.
• Setting-6: Multitask model on pooled test set:Multitask model trained with data from allpost-editors and tested on test set from all post-editors together.
• Setting-7 to 10: Similar to setting-2, 3, 5, 6 butwith additional crosslingual data where pooledand multitask models are trained with both en-es and en-fr datasets together.
• Setting-11-13: Similar to setting-9, 6, 10 re-spectively, but with non-overlapping crosslin-gual data only.
5 Results with Multiple Annotators
We report results in terms of Pearson’s correlationbetween predicted and true quality labels, as wasdone in the WMT QE shared tasks (Bojar et al.,2015). The multitask learning models consistentlyled to improvement over pooled models, and overindividual models in most cases. We present thecomparisons of the models for various settings inthe following. The bars marked with * in each com-parison are significantly better than all others withp < 0.01 according to the Williams significancetest (Williams, 1959).
Individual, pooled and multitask models on in-dividual test sets Results for both language pairsare shown in Figure 2. As expected, in cases wherea large number of instances is available from an in-dividual post-editor, individual models tested on in-dividual test sets perform better than pooled mod-els. Overall, multitask learning models show im-provement over both individual and pooled mod-els, or the same performance in cases where largeamounts of data are available for an individual post-editor. For example, in en-es, for post-editors 9 and3, which have 845 and 3,939 instances in total, re-spectively, multitask learning models are consider-ably better. The same goes for post-editor 3 in en-fr,which has only 769 instances. For very few post-editors with a large number of instances (1,2 and4 in en-es) multitask learning models perform thesame as individual or even pooled models. For allother post-editors, multitask models further improvecorrelation with humans. These results emphasize
563
Page 142 of 146

Quality Translation 21D3.3: Evaluation metrics and analysis of first annotation round
1" 2" 3" 4" 5" 6" 7" 8" 9" 10"ind_trn2ind_tst" 0.4379" 0.4412" 0.3211" 0.4487" 0.3802" 0.3519" 0.3310" 0.4410" 0.2513" 0.3310"pol_trn2ind_tst" 0.4234" 0.4324" 0.3684" 0.4489" 0.3717" 0.3520" 0.3510" 0.4109" 0.3022" 0.3902"mtl_trn2ind_tst" 0.4435" 0.4409" 0.4009" 0.4491" 0.3903" 0.3902" 0.3622" 0.4496" 0.3411" 0.4040"
*" *" *"*"
*"
*"
*"
0.00"0.05"0.10"0.15"0.20"0.25"0.30"0.35"0.40"0.45"0.50"
r"
(a) en-es
1" 2" 3" 4"ind_trn,ind_tst" 0.4512" 0.4212" 0.1023" 0.4265"pol_trn,ind_tst" 0.4412" 0.4211" 0.1511" 0.4301"mtl_trn,ind_tst" 0.4610" 0.4320" 0.1712" 0.4411"
*"*"
*"
*"
0.00"0.05"0.10"0.15"0.20"0.25"0.30"0.35"0.40"0.45"0.50"
r"
(b) en-frFigure 2: Pearson’s correlation with various modelson individual test sets
the advantages of multitask learning models, even incases where the post-editors that will use the mod-els are known in advance (first research question):Clearly, the models for post-editors with fewer in-stances benefit from the sharing of information fromthe larger post-editor data sets. As for post-editorswith large numbers of instances, in the worst casethe performance remains the same.
Individual, pooled and multitask models onpooled test set Here we focus on cases wheremodels are built to be used by any post-editor(second research question). Results in Figure 3show that when test sets for all post-editors areput together, individual models perform distinctivelyworse than pooled and multitask learning models.Multitask learning models are significantly betterthan pooled models for both languages (0.511 vs0.469 for en-es, and 0.481 vs 0.441 for en-fr). Inthe case of post-editor 3 for en-fr, the correlation isnegative for individual models given the very lownumber of instances for this post-editor, which is notsufficient to build a general enough model that also
1" 2" 3" 4" 5" 6" 7" 8" 9" 10"ind_trn2pol_tst" 0.4131" 0.4268" 0.3445" 0.4323" 0.3508" 0.3560" 0.3269" 0.4020" 0.2876" 0.3705"pol_trn2pol_tst" 0.4694" 0.4694" 0.4694" 0.4694" 0.4694" 0.4694" 0.4694" 0.4694" 0.4694" 0.4694"mtl_trn2pol_tst" 0.5115" 0.5115" 0.5115" 0.5115" 0.5115" 0.5115" 0.5115" 0.5115" 0.5115" 0.5115"
*"
0.00"
0.10"
0.20"
0.30"
0.40"
0.50"
0.60"
r"
(a) en-es
1" 2" 3" 4"ind_trn,pol_tst" 0.4366" 0.3912" ,0.0847" 0.4063"pol_trn,pol_tst" 0.4412" 0.4412" 0.4412" 0.4412"mtl_trn,pol_tst" 0.4812" 0.4812" 0.4812" 0.4812"
*"
,0.20"
,0.10"
0.00"
0.10"
0.20"
0.30"
0.40"
0.50"
0.60"r"
(b) en-frFigure 3: Pearson’s correlation with various modelson pooled test set
works for other post-editors.
Relationship among post-editors In order to gaina better insight into the strength of the relationshipsamong various post-editors and thus into the ex-pected benefits from joint modelling, we plot thelearned Corregionalisation matrix for all against allpost-editors in Figure 4.5 It can be observed thatthere exist various degrees of mutual interdepen-dences among post-editors. For instance, in the caseof en-es, post-editor 4 shows a strong relationshipwith post-editors 6 and 7, a relatively weaker rela-tionship with post-editors 1 and 9, and close to non-existing with post-editors 3, 8 and 10. In the caseof en-fr, post-editor 3 shows very weak relationshipwith all other post-editors, especially 4. This mightexplain the low Pearson’s correlation with individualmodels for post-editor 3 on pooled test sets.
5We note that the Corregionalisation matrix cannot be inter-preted as a correlation matrix. Rather, it shows the covariancebetween tasks.
564
Page 143 of 146
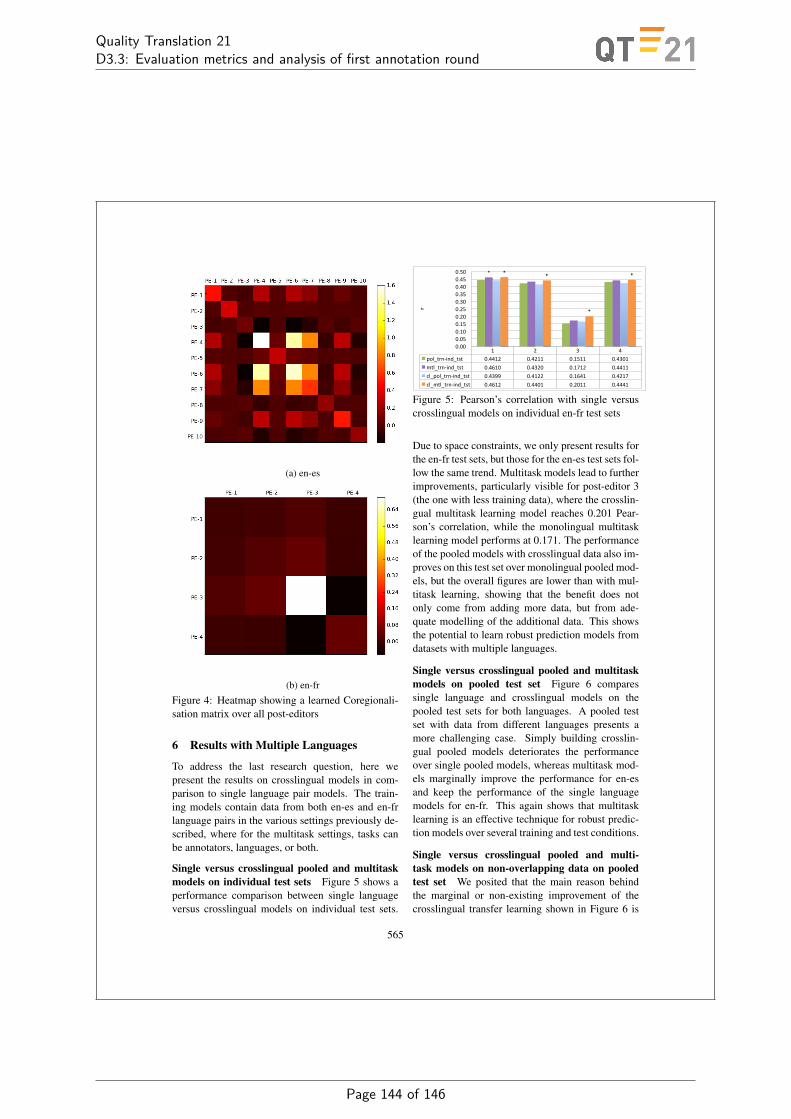
Quality Translation 21D3.3: Evaluation metrics and analysis of first annotation round
(a) en-es
(b) en-fr
Figure 4: Heatmap showing a learned Coregionali-sation matrix over all post-editors
6 Results with Multiple Languages
To address the last research question, here wepresent the results on crosslingual models in com-parison to single language pair models. The train-ing models contain data from both en-es and en-frlanguage pairs in the various settings previously de-scribed, where for the multitask settings, tasks canbe annotators, languages, or both.
Single versus crosslingual pooled and multitaskmodels on individual test sets Figure 5 shows aperformance comparison between single languageversus crosslingual models on individual test sets.
1" 2" 3" 4"pol_trn-ind_tst" 0.4412" 0.4211" 0.1511" 0.4301"mtl_trn-ind_tst" 0.4610" 0.4320" 0.1712" 0.4411"cl_pol_trn-ind_tst" 0.4399" 0.4122" 0.1641" 0.4217"cl_mtl_trn-ind_tst" 0.4612" 0.4401" 0.2011" 0.4441"
*" *" *"
*"
*"
0.00"0.05"0.10"0.15"0.20"0.25"0.30"0.35"0.40"0.45"0.50"
r"
Figure 5: Pearson’s correlation with single versuscrosslingual models on individual en-fr test sets
Due to space constraints, we only present results forthe en-fr test sets, but those for the en-es test sets fol-low the same trend. Multitask models lead to furtherimprovements, particularly visible for post-editor 3(the one with less training data), where the crosslin-gual multitask learning model reaches 0.201 Pear-son’s correlation, while the monolingual multitasklearning model performs at 0.171. The performanceof the pooled models with crosslingual data also im-proves on this test set over monolingual pooled mod-els, but the overall figures are lower than with mul-titask learning, showing that the benefit does notonly come from adding more data, but from ade-quate modelling of the additional data. This showsthe potential to learn robust prediction models fromdatasets with multiple languages.
Single versus crosslingual pooled and multitaskmodels on pooled test set Figure 6 comparessingle language and crosslingual models on thepooled test sets for both languages. A pooled testset with data from different languages presents amore challenging case. Simply building crosslin-gual pooled models deteriorates the performanceover single pooled models, whereas multitask mod-els marginally improve the performance for en-esand keep the performance of the single languagemodels for en-fr. This again shows that multitasklearning is an effective technique for robust predic-tion models over several training and test conditions.
Single versus crosslingual pooled and multi-task models on non-overlapping data on pooledtest set We posited that the main reason behindthe marginal or non-existing improvement of thecrosslingual transfer learning shown in Figure 6 is
565
Page 144 of 146

Quality Translation 21D3.3: Evaluation metrics and analysis of first annotation round
en#es% en#fr%pol_trn#pol_tst% 0.4694% 0.4412%mtl_trn#pol_tst% 0.5115% 0.4812%cl_pol_trn#pol_tst% 0.4411% 0.4389%cl_mtl_trn#pol_tst% 0.5201% 0.4821%
*%*%
*%
0.30%
0.40%
0.50%
0.60%
r"
Figure 6: Pearson’s correlation with single vscrosslingual models: en-es and en-fr pooled test sets
en#es% en#fr%no_cl_pol_trn#pol_tst% 0.3801% 0.2901%no_mtl_trn#pol_tst% 0.4167% 0.3512%no_cl_mtl_trn#pol_tst% 0.4477% 0.3701%
*"
*"
0.00%
0.10%
0.20%
0.30%
0.40%
0.50%
r"
Figure 7: Pearson’s correlation with non-overlapping language data: single vs crosslingualmodels on en-es and en-fr on pooled test sets
the large overlap between the source segments in thedatasets for the two language pairs, as mentioned inSection 4: 63,763 instances, which comprise 82% ofthe en-fr instances, and 65% of the en-es instances.This becomes an issue because nearly half of thequality estimation features are based on the sourcesegments. Therefore, we conducted an experimentwith only 41,930 non-overlapping segments in thetwo languages. This experiment is only possiblewith pooled test sets, as otherwise too few (if any)instances are left for some post-editors. The re-sults, shown in Figure 7, are much more promising.The Figure compares single language and crosslin-gual multitask and pooled models on the polled testsets for both languages. It is interesting to notethat, while the absolute figures are lower when com-pared to models trained on all data (Figures 5 and6), the relative improvements of multitask crosslin-gual models over multitask single language modelsare much larger.
7 Conclusions
We investigated multitask learning with GP for QEbased on large datasets with multiple annotators andlanguage pairs. The experiments were performedwith various settings for training QE models to studythe cases where data is available in abundance, ver-sus cases with less data. Our results show that mul-titask learning leads to improved results in all set-tings against individual and pooled models. Individ-ual models perform reasonably well in cases wherea large amount of training data for individual anno-tators is available. Yet, by learning from data bymultiple annotators, multitask learning models stillperform better (in most cases) or at least the same asthese models. Testing models on data for individualannotators is a novel experimental setting that weexplored in this paper. Another novel finding wasthe advantage of multitask models in crosslingualsettings, where individual models performed poorlyand pooled models brought little gain.
Acknowledgments
This work was supported by the QT21 (H2020 No.645452) and Cracker (H2020 No. 645357). Wewould like to thank Bruno Pouliquen and PeterBaker for providing the WIPO data, resources andrevising the details in Section 4.1.
References
Mauricio A. Alvarez, Lorenzo Rosasco, and Neil D.Lawrence. 2012. Kernels for Vector-Valued Func-tions: a Review. Foundations and Trends in MachineLearning, pages 1–37.
Daniel Beck, Kashif Shah, Trevor Cohn, and Lucia Spe-cia. 2013. SHEF-Lite: When less is more for trans-lation quality estimation. In Eighth Workshop on Sta-tistical Machine Translation, WMT, pages 337–342,Sofia, Bulgaria.
Daniel Beck, Trevor Cohn, and Lucia Specia. 2014. Jointemotion analysis via multi-task gaussian processes.In Conference on Empirical Methods in Natural Lan-guage Processing, EMNLP, pages 1798–1803, Doha,Qatar.
Ondej Bojar, Christian Buck, Chris Callison-Burch,Christian Federmann, Barry Haddow, Philipp Koehn,Christof Monz, Matt Post, Radu Soricut, and LuciaSpecia. 2013. Findings of the 2013 Workshop on Sta-
566
Page 145 of 146
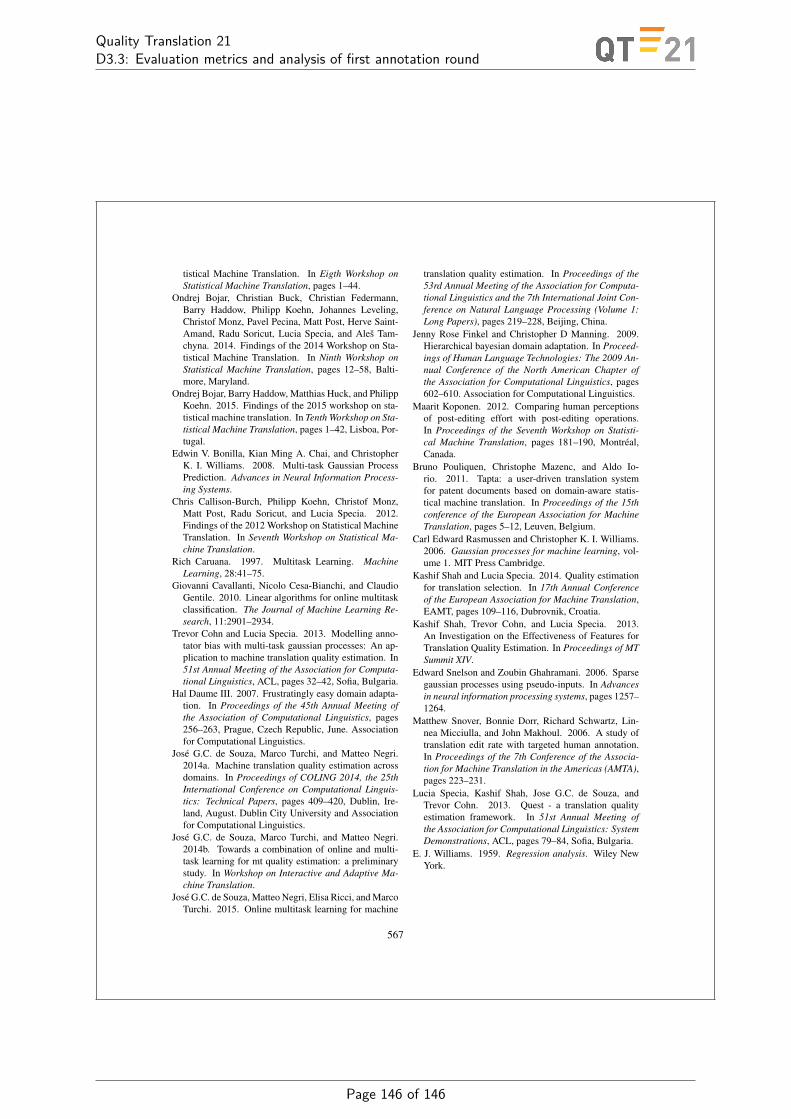
Quality Translation 21D3.3: Evaluation metrics and analysis of first annotation round
tistical Machine Translation. In Eigth Workshop onStatistical Machine Translation, pages 1–44.
Ondrej Bojar, Christian Buck, Christian Federmann,Barry Haddow, Philipp Koehn, Johannes Leveling,Christof Monz, Pavel Pecina, Matt Post, Herve Saint-Amand, Radu Soricut, Lucia Specia, and Ales Tam-chyna. 2014. Findings of the 2014 Workshop on Sta-tistical Machine Translation. In Ninth Workshop onStatistical Machine Translation, pages 12–58, Balti-more, Maryland.
Ondrej Bojar, Barry Haddow, Matthias Huck, and PhilippKoehn. 2015. Findings of the 2015 workshop on sta-tistical machine translation. In Tenth Workshop on Sta-tistical Machine Translation, pages 1–42, Lisboa, Por-tugal.
Edwin V. Bonilla, Kian Ming A. Chai, and ChristopherK. I. Williams. 2008. Multi-task Gaussian ProcessPrediction. Advances in Neural Information Process-ing Systems.
Chris Callison-Burch, Philipp Koehn, Christof Monz,Matt Post, Radu Soricut, and Lucia Specia. 2012.Findings of the 2012 Workshop on Statistical MachineTranslation. In Seventh Workshop on Statistical Ma-chine Translation.
Rich Caruana. 1997. Multitask Learning. MachineLearning, 28:41–75.
Giovanni Cavallanti, Nicolo Cesa-Bianchi, and ClaudioGentile. 2010. Linear algorithms for online multitaskclassification. The Journal of Machine Learning Re-search, 11:2901–2934.
Trevor Cohn and Lucia Specia. 2013. Modelling anno-tator bias with multi-task gaussian processes: An ap-plication to machine translation quality estimation. In51st Annual Meeting of the Association for Computa-tional Linguistics, ACL, pages 32–42, Sofia, Bulgaria.
Hal Daume III. 2007. Frustratingly easy domain adapta-tion. In Proceedings of the 45th Annual Meeting ofthe Association of Computational Linguistics, pages256–263, Prague, Czech Republic, June. Associationfor Computational Linguistics.
Jose G.C. de Souza, Marco Turchi, and Matteo Negri.2014a. Machine translation quality estimation acrossdomains. In Proceedings of COLING 2014, the 25thInternational Conference on Computational Linguis-tics: Technical Papers, pages 409–420, Dublin, Ire-land, August. Dublin City University and Associationfor Computational Linguistics.
Jose G.C. de Souza, Marco Turchi, and Matteo Negri.2014b. Towards a combination of online and multi-task learning for mt quality estimation: a preliminarystudy. In Workshop on Interactive and Adaptive Ma-chine Translation.
Jose G.C. de Souza, Matteo Negri, Elisa Ricci, and MarcoTurchi. 2015. Online multitask learning for machine
translation quality estimation. In Proceedings of the53rd Annual Meeting of the Association for Computa-tional Linguistics and the 7th International Joint Con-ference on Natural Language Processing (Volume 1:Long Papers), pages 219–228, Beijing, China.
Jenny Rose Finkel and Christopher D Manning. 2009.Hierarchical bayesian domain adaptation. In Proceed-ings of Human Language Technologies: The 2009 An-nual Conference of the North American Chapter ofthe Association for Computational Linguistics, pages602–610. Association for Computational Linguistics.
Maarit Koponen. 2012. Comparing human perceptionsof post-editing effort with post-editing operations.In Proceedings of the Seventh Workshop on Statisti-cal Machine Translation, pages 181–190, Montreal,Canada.
Bruno Pouliquen, Christophe Mazenc, and Aldo Io-rio. 2011. Tapta: a user-driven translation systemfor patent documents based on domain-aware statis-tical machine translation. In Proceedings of the 15thconference of the European Association for MachineTranslation, pages 5–12, Leuven, Belgium.
Carl Edward Rasmussen and Christopher K. I. Williams.2006. Gaussian processes for machine learning, vol-ume 1. MIT Press Cambridge.
Kashif Shah and Lucia Specia. 2014. Quality estimationfor translation selection. In 17th Annual Conferenceof the European Association for Machine Translation,EAMT, pages 109–116, Dubrovnik, Croatia.
Kashif Shah, Trevor Cohn, and Lucia Specia. 2013.An Investigation on the Effectiveness of Features forTranslation Quality Estimation. In Proceedings of MTSummit XIV.
Edward Snelson and Zoubin Ghahramani. 2006. Sparsegaussian processes using pseudo-inputs. In Advancesin neural information processing systems, pages 1257–1264.
Matthew Snover, Bonnie Dorr, Richard Schwartz, Lin-nea Micciulla, and John Makhoul. 2006. A study oftranslation edit rate with targeted human annotation.In Proceedings of the 7th Conference of the Associa-tion for Machine Translation in the Americas (AMTA),pages 223–231.
Lucia Specia, Kashif Shah, Jose G.C. de Souza, andTrevor Cohn. 2013. Quest - a translation qualityestimation framework. In 51st Annual Meeting ofthe Association for Computational Linguistics: SystemDemonstrations, ACL, pages 79–84, Sofia, Bulgaria.
E. J. Williams. 1959. Regression analysis. Wiley NewYork.
567
Page 146 of 146