evaluation: bus cost allocation · pdf fileevaluation: bus cost allocation model ... a cost...
TRANSCRIPT

Evaluation: Bus Cost Allocation Model Regional Transportation District Denver, Colorado On Target Performance Group Submitted to the Colorado Office of the State Auditor January 2011


LEGISLATIVE AUDIT COMMITTEE 2011 MEMBERS
Senator Lois Tochtrop Chair
Representative Cindy Acree Vice-Chair
Senator Morgan Carroll Senator Steve King Representative Deb Gardner Representative Joe Miklosi Representative Jim Kerr Senator Scott Renfroe
OFFICE OF THE STATE AUDITOR
Sally Symanski State Auditor
Cindi Stetson
Deputy State Auditor
Greg Fugate
Legislative Audit Manager
Christopher Harless Legislative Auditor
On Target Performance Group, LLC Contract Consultant

This page intentionally left blank.


This page intentionally left blank.

i
TABLE OF CONTENTS PAGE
Purpose and Scope ................................................................................................... 1 Summary of Findings............................................................................................... 2 Overview of the Regional Transportation District ............................................... 2 The Bus Cost Allocation Model .............................................................................. 3 Cost Model Design and Execution .......................................................................... 4 Cost Estimates for Privatization ........................................................................... 12 Additional Opportunities ...................................................................................... 18 APPENDIX A ...................................................................................................... A-1 APPENDIX B ....................................................................................................... B-1 APPENDIX C ...................................................................................................... C-1

ii
Glossary of Terms and Abbreviations Actual service miles – The miles that vehicles travel while delivering service, changing routes, or leaving or returning to a storage facility. Actual service miles exclude miles for charter and school bus service, operator training, and maintenance testing. Bus cost model – A cost allocation model used by the Regional Transportation District to allocate bus costs by bus type, service class, or route. Cost allocation model (cost model) – A conceptual framework composed of financial and operational information, data relationships, equations, and assumptions that permits translation of expense data into per-unit costs for an organization’s activities, products, or services. Cost driver – Factors developed from operational and/or financial data that closely approximate the way costs are consumed over time by an organization and used as the basis for allocating costs within a cost model. District – Regional Transportation District. A special district and political subdivision of the State of Colorado statutorily charged with developing, maintaining, and operating a mass transportation system whose service area includes all of Denver, Boulder, Broomfield, and Jefferson counties, and portions of Adams, Arapahoe, Douglas, and Weld counties. FasTracks – The Regional Transportation District’s comprehensive transit expansion plan to provide additional commuter rail, light rail, bus, and parking services. Revenue hours – The hours that vehicles are scheduled to be in service or are actually in service, generating revenue by carrying passengers. Revenue hours include layover and recovery time but exclude time for changing routes, leaving or returning to a storage facility, operator training, maintenance testing, and school bus and charter services. Scheduled service miles – The miles that vehicles are scheduled to travel while delivering service, changing routes, or leaving or returning to a storage facility. Scheduled service miles exclude miles for charter and school bus service, operator training, and maintenance testing. Sourcing – The process of selecting a supplier for materials or services needed by an organization.
Colorado Office of the State Auditor Evaluation of the Regional Transportation District’s Bus Cost Allocation Model
1
The Regional Transportation District’s Bus Cost Allocation Model
Purpose and Scope The purpose of this evaluation was to determine whether the bus cost allocation model (bus cost model) used by the Regional Transportation District (District) provides valid and reliable cost information for use in decisionmaking. The District uses the bus cost model, as well as analyses performed using the model’s outputs, to evaluate the cost-effectiveness of services provided and also to support decisionmaking in many areas of the District’s operations, including the privatization of bus services and long-term planning. Our evaluation included analyzing data, reviewing documents, and interviewing District managers and staff. We followed a risk-based approach, which means that we first targeted our work to understand and evaluate the basic methodology and assumptions used in the District’s model and corresponding analyses. We then used this understanding to direct a more detailed examination of the underlying calculations and source data used in the model and corresponding analyses. For example, we verified calculations and reviewed cost drivers that are used in the model to allocate large portions of the District’s costs. Our evaluation focused specifically on the District’s 2008 cost model because, when we began our evaluation, the District had not yet completed its compilation of the 2009 cost data. To understand how the cost model is used, we also reviewed a cost projection that District staff prepared based on the 2008 cost model’s outputs and presented to the District’s Board of Directors in July 2010. This July 2010 cost projection estimated the costs the District would incur by providing bus services for a group of routes that, at the time of the cost projection, were being operated by a private contractor. The purpose of our evaluation was not to determine whether the District has made the “right” decisions with respect to the privatization of bus transportation services, or whether privatization has saved the District money. Rather, we used best practices in cost system design, construction, and evaluation to assess the validity and reliability of the information produced by the cost model and corresponding analyses and used by the District as the basis for decisionmaking. Specifically, we examined how the District uses the cost model to help calculate and compare the public versus private costs of providing transportation services. On Target Performance Group, LLC, conducted this evaluation under contract with the Colorado Office of the State Auditor. We performed evaluation work from July

Colorado Office of the State Auditor Evaluation of the Regional Transportation District’s Bus Cost Allocation Model
2
through November 2010. We gratefully acknowledge the assistance and cooperation extended by District management and staff throughout this project.
Summary of Findings Overall, on the basis of our analysis of key factors affecting the bus cost model and its outputs, we found problems with the model’s design and application that indicate the information derived from the model is inaccurate and unreliable and may ultimately impair decisionmaking. The problems we found are grouped into three major areas, as discussed in the remainder of this report. First, the District’s cost model does not adhere to basic principles of cost model design and execution, thereby introducing inaccuracies that call into question the validity and reliability of the cost information produced by the model. Second, we identified significant methodological problems and errors in the District’s use of cost model data to produce cost projections for sourcing decisions. Finally, we found that the District has not maintained or updated the cost model’s design to keep pace with current and future cost-analysis needs created by significant changes in the District’s operations and services.
Overview of the Regional Transportation District Created in 1969, the District is a political subdivision of the State of Colorado and, like other local government entities, operates separate from Colorado State Government. The District is statutorily charged with developing, maintaining, and operating a mass transportation system for the benefit of the District’s inhabitants [Section 32-9-107, C.R.S.]. The District’s service area covers approximately 2,300 square miles, including all of Denver, Boulder, and Jefferson counties, and portions of Adams, Arapahoe, Broomfield, Douglas, and Weld counties. The District is governed and overseen by a 15-member, publicly elected Board of Directors (Board). The Board hires a general manager who serves as the District’s chief executive officer. As of January 2011, the District operates approximately 148 regular fixed bus routes and five light rail lines in the Denver metropolitan area. The District also provides services for the disabled (i.e., access-a-Ride) and areas lacking fixed-route service (i.e., call-n-Ride), as well as special bus service for major sporting and other events. The District’s active bus fleet totals approximately 1,025 vehicles—590 are owned and operated by the District; 435 are owned by the District and operated by private carriers. The District’s FasTracks project, currently underway, is a multibillion-dollar, comprehensive transit expansion plan to provide additional commuter rail, light rail, bus, and parking services in the District. District operations are divided into 11 departments: administration; Board office; bus operations; capital programs; communications; executive office; finance; general

Colorado Office of the State Auditor Evaluation of the Regional Transportation District’s Bus Cost Allocation Model
3
counsel; light rail operations; planning; and safety, security, and facilities. According to the District’s most recent audited financial statements, the District had total operating and nonoperating revenues of about $705 million for the District’s fiscal year ended December 31, 2009. The District’s primary revenue source is a 1-percent sales and use tax levied within the District—0.6 percent is used to fund the District’s base operations; 0.4 percent is used to fund the District’s FasTracks program. In Fiscal Year 2009, the District’s sales and use tax revenues totaled approximately $371 million, or 53 percent of total revenues. Passenger fares accounted for an additional $97 million, or 14 percent of total revenues. The remaining $232 million in revenues (33 percent) came from federal grants, local contributions, interest income, and other miscellaneous sources. The District had total operating expenses, including depreciation, of approximately $551 million in Fiscal Year 2009.
The Bus Cost Allocation Model In today’s challenging and ever-changing business environment, it is important that managers have valid and reliable information to make operational and strategic decisions regarding their organizations. In many cases, the information required to make these decisions is cost-related. Cost allocation models, or cost models, are tools that help managers gain insight into an organization’s cost structure, which can be vital to informed decisionmaking. For example, cost models provide organizations with a historical “snapshot” of the costs of providing products or services over a specific time period. Organizations can use such information to conduct profitability analyses, develop operating budgets, and project costs for future business undertakings, such as offering new products or services, changing sourcing strategies, or expanding operations. Information from a cost model can also be used to identify opportunities for cost savings and to improve operational efficiencies. Each year, after the District’s annual financial and compliance audit is completed, District staff input financial data and other information into the District’s cost allocation model to help answer the following question: How much did it cost the District to operate each of its bus routes for that year? Although this is a straightforward question, it is a complicated one to answer because bus routes consume costs in different proportions. For example, bus routes differ in terms of the total distance covered, the frequency of service, the average distance between stops, and the types of buses assigned to service the route. The District’s bus cost model attempts to account for these and many other differences by combining expenditure and operational data to create unique cost profiles for each of the District’s bus routes. The District’s bus cost model is complex and currently consists of 17 separate workbook files that together contain nearly 100 different spreadsheets. One important group of outputs from the bus cost model is the direct costs of bus operations expressed as dollars per unit (e.g., cost per operator, cost per hour, cost per mile). For example, since the amount of diesel fuel that the District consumes is largely a function of how many miles the buses are driven, the model combines diesel fuel costs

Colorado Office of the State Auditor Evaluation of the Regional Transportation District’s Bus Cost Allocation Model
4
with other costs—such as the cost of oil and tires—that also accrue on a per-mile basis. The model then divides these costs by the total number of miles that the buses were scheduled to operate throughout the year to arrive at a ratio expressing the total cost for consumables per scheduled mile of service. Appendix A provides a highly summarized conceptual diagram and description of the District’s bus cost model.
Cost Model Design and Execution The manner in which a cost model is designed and executed plays a fundamental role in ensuring the accuracy and reliability of the cost information the model produces. Cost models can be very complicated and sophisticated, and there are different schools of thought on how to design and execute a cost model. Yet, regardless of a cost model’s complexity and level of sophistication, there are best practices and core principles that should be followed:
Cost models should use valid and complete source data. For example, all data should pertain to the same time period (e.g., January through December of a given year), and financial cost data should be pulled from the organization’s general ledger.
Cost models should use the best available cost drivers. For example, costs
should be allocated or assigned in a manner that most closely approximates the way the costs are being consumed in the organization and for which source data are available.
Cost models should be validated. For example, the total costs input into a
cost model should be reconciled with the total costs output from the model. Cost model outputs should also be tracked and compared from year to year to identify any significant changes that require further investigation.
By adhering to these core principles, organizations can reduce the risk of inaccuracies, inconsistencies, and other errors occurring within a cost model. However, as described in the following sections, we found the District did not always adhere to core principles of cost model design and execution for its 2008 bus cost model. As a result, the District’s 2008 cost model did not properly allocate about $5.6 million in bus costs, or about 3 percent of the total cost for bus operations in 2008. Of this amount, about $3.2 million was misallocated due to invalid source data, about $672,000 was misallocated due to inaccuracies in cost drivers, and about $1.7 million was misallocated due to computational errors that might have been detected had the District fully validated the model. Consequently, the District lacks assurance that the cost model’s results are accurate and reliable for further cost analysis and decisionmaking.

Colorado Office of the State Auditor Evaluation of the Regional Transportation District’s Bus Cost Allocation Model
5
Source Data Cost models should use valid and complete source data. However, during our evaluation we identified two areas in which the District did not use valid and complete source data when running the 2008 cost model. Consequently, the cost model did not properly identify or allocate a total of about $3.2 million to bus operations. First, the District used data from its maintenance management system, known as “Maximus,” to update costs for bus parts instead of extracting these costs from the general ledger. Pulling costs from Maximus raises validity concerns because Maximus is not the official accounting record for the District’s expenses. Additionally, the Maximus data were incomplete because they did not include costs for certain shared maintenance items, such as windshield washer fluid and wiper blades. Costs for these shared maintenance items are tracked in the District’s general ledger. This data substitution caused the 2008 cost model to understate the total cost of bus operations by about $2.1 million. Second, the District used 2007 data for bus operator wages, scheduled hours of bus operations by service class, and the number of union employees to support calculations within the 2008 cost model. However, it is not valid to substitute prior-year data for current-year data in a cost model. By using data from an earlier period, the District reduced the 2008 cost model’s accuracy. Specifically, these data substitutions caused the 2008 cost model to understate the total cost of bus operations by about $1.1 million. We noted that one of the data substitutions in the 2008 cost model (i.e., number of union employees) was subsequently corrected in the 2009 cost model, which became available during our review. The remaining two data substitutions in the 2008 cost model (i.e., bus operator wages and scheduled hours of bus operations by service class) were not subsequently corrected in the 2009 cost model. District staff reported that many of the data substitutions in the 2008 bus cost model were made to compensate for missing reports that are no longer produced following implementation of the District’s new financial management system in 2007. In the past, staff would use a computer program to download financial and operational data used in the cost model directly from the District’s various electronic systems. However, when the District replaced its legacy financial system in 2007, the new system was not programmed to produce all the reports and data tables needed to run the cost model. Consequently, staff lost automated access to some sources of current operational data and had to develop workarounds. In the three years since the new financial system’s implementation, the staff person running the cost model has had to expend additional effort to obtain and import all the relevant source data, which in some instances includes manually keying the source data into the cost model spreadsheets.

Colorado Office of the State Auditor Evaluation of the Regional Transportation District’s Bus Cost Allocation Model
6
Cost Drivers Cost models should use the best available “cost drivers.” Cost drivers establish the basis upon which costs are allocated and, therefore, are fundamental to any cost model. The best available cost driver is one that most closely approximates the way the cost is consumed (i.e., what factors “drive” costs) and for which source data are available. For example, as discussed previously, the District’s total cost for bus diesel fuel is largely a function of how many miles the buses are driven. Because of this relationship between fuel costs and miles, the District’s cost model uses scheduled miles of bus service as the cost driver for allocating the District’s bus fuel costs. That is, the cost model allocates a percentage of the District’s total fuel costs to each bus route based on each route’s percentage share of the total number of scheduled miles for all bus routes in the year. We evaluated the cost drivers used in the District’s 2008 bus cost model and identified two areas where we believe the cost driver used was not the best one available, either because the driver was inappropriate for measuring the way associated costs are consumed in the District, or because a better driver now exists due to the availability of data that may not have been available when the model was initially developed. Specifically, we found problems with (1) the cost driver that is used to allocate the District’s administrative costs and (2) cost drivers that are based on scheduled service miles for bus operations.
Cost driver for administrative costs. The cost driver used to allocate administrative costs in the 2008 model did not appropriately measure how administrative costs are being consumed in the District. Administrative costs include salaries and benefits for staff who manage or direct various aspects of the District’s operations, such as human resources, finance, legal counsel, and purchasing. In 2008, administrative costs totaled approximately $67.2 million, or 15 percent of the total costs being allocated by the model. The cost model used a cost driver based on “revenue hours” to allocate 75 percent of the District’s administrative costs to bus operations and the remaining 25 percent to light rail operations. Revenue hours represent the total hours that a bus or train car is in service, generating revenue by carrying passengers. However, we question whether using revenue hours as the basis for this 75/25 split was reasonable and appropriate. For example, although the District’s buses may produce a larger share of revenue hours relative to light rail trains, it is not necessarily the case that bus operations consume the District’s administrative costs in the same proportion. Without a cost driver that more closely approximates how administrative costs are being consumed, the District lacks assurance that the cost model produces an accurate allocation of administrative costs.
Additionally, during our evaluation we interviewed numerous administrative staff who reported spending considerable portions of their time on FasTracks.

Colorado Office of the State Auditor Evaluation of the Regional Transportation District’s Bus Cost Allocation Model
7
However, the cost model allocates all of the costs for these administrative staff either to bus or to light rail operations. In other words, the cost driver used to allocate the District’s administrative costs does not recognize FasTracks as an additional component of the District’s operations that consumes administrative costs. Consequently, the cost model overstates the administrative costs for bus and light rail operations. In order to provide a more accurate snapshot of costs, the portion of administrative costs for staff who support FasTracks should not be allocated to either bus or light rail operations, as the bus cost model currently does.
Finally, in addition to being an inappropriate cost driver for administrative costs, we found that the data for revenue hours in 2008 supported a slightly different split—76 percent for bus operations and 24 percent for light rail operations—than the 75/25 split used in the 2008 cost model. Although this 1 percent difference may seem small, the 2008 bus cost model did not allocate about $672,000 in administrative costs to bus operations as a result.
Cost drivers based on scheduled service miles. The District’s bus cost
model allocates several costs (e.g., maintenance parts, diesel fuel, tires, and running repairs) using scheduled service miles for bus operations, as opposed to using actual service miles. However, the actual service miles driven by buses more closely approximates the way these costs are consumed and, therefore, would be a more appropriate cost driver to use in the model. We found significant differences between the amount of actual and scheduled miles for certain bus types in 2008. For example, we found that transit-type buses (i.e., 40-foot coaches) were driven about 1.2 million miles more than they were scheduled, whereas medium-type buses (i.e., 30-foot coaches) were driven about 1.2 million miles less. These differences are due to the fact that bus operations staff do not always assign the type of bus that had originally been scheduled to service a given route. In 2008, medium-type buses were in short supply, and staff routinely substituted transit-type buses to fill the gap. Consequently, using scheduled miles in the cost model rather than actual miles skews the model’s results and does not produce an accurate cost profile for those routes that were originally scheduled to use either medium- or transit-type buses.
We recognize that the District may not have had data on actual service miles available in an accessible format at the time the cost model was initially developed in 1994; therefore, using scheduled service miles was an appropriate proxy. However, the District now maintains data on actual miles driven by bus type in its maintenance management system, Maximus, which became operational in 2007. The District could use these new data in the bus cost model to more accurately allocate those costs that accrue on a per-mile basis.

Colorado Office of the State Auditor Evaluation of the Regional Transportation District’s Bus Cost Allocation Model
8
Model Validation Cost models should be validated to ensure they produce results that are as accurate and reliable as possible. Depending on the model’s architecture, supporting software, and uses, the specific validation procedures may vary. However, at a minimum, model validation should include two basic steps. First, the total of all costs input into the model should be reconciled against the total of all costs output from the model to ensure that all costs have been included in the output. Second, the model outputs should be compared to those from prior years to identify significant changes. Any significant changes should be further investigated for reasonableness. During our evaluation, we found no evidence that the District validates the outputs of the bus cost model by reconciling costs input to costs output or conducting year-to-year comparisons. Staff compare cost totals at an early stage while running the cost model; however, staff do not follow regular procedures to reconcile the model’s inputs with final outputs. This lack of validation procedures increases the risk of error and reduces the level of confidence that can be placed in the accuracy of the cost model’s results. We conducted our own validation procedures on the District’s 2008 and 2009 cost models, the latter of which became available during our evaluation, and found several problems that might have been detected had the District fully validated the model. First, we compared the 2008 bus cost model’s cost inputs from the general ledger to the cost model’s outputs and identified several categories of bus costs that did not reconcile. In total, our reconciliation demonstrated that more than $4.9 million in bus costs that were part of the costs input into the model were inappropriately dropped from the model’s output. About $3.2 million in costs—primarily composed of costs for operator wages, bus parts, and union employees—did not reconcile because the District used data from 2007 rather than 2008. We discussed issues regarding the validity and completeness of source data and the associated $3.2 million misallocation earlier in this section. An additional $1.7 million in costs did not reconcile because some automated formulas and functions that were built into the model’s supporting spreadsheets were not operating properly. The table in Appendix B shows the detailed results of our reconciliation. Second, after the District finalized its bus cost model for 2009, we conducted a year-to-year comparison of final outputs from the 2008 and 2009 cost models, paying particular attention to differences in costs per unit. We identified seven categories of bus costs for which the cost models’ outputs changed by 10 percent or more between 2008 and 2009. One cost category showed a 73 percent increase. The table in Appendix C shows the detailed results of our year-to-year comparison for all cost categories. For example, in 2008 the District spent about $6 million on vehicle parts to maintain its buses. The 2008 cost model allocated these costs to each bus route on the basis of the number of scheduled service miles, yielding a total parts cost equal to $0.241 per scheduled mile. However, the 2009 cost model’s output showed a total

Colorado Office of the State Auditor Evaluation of the Regional Transportation District’s Bus Cost Allocation Model
9
parts cost equal to $0.266 per scheduled mile, which is an increase of 10 percent over the prior year. In our view, changes of 10 percent or more over a one-year period should warrant further investigation by District staff to determine whether the difference represents a true change in costs or, alternatively, is the result of problems with the cost model’s underlying formulas and functions. During our evaluation, District staff reported that they review and compare total costs per route on a year-by-year basis to identify inconsistencies and anomalies. However, these costs are compared at a later stage of analysis, after the cost model’s output has already been generated. Thus, staff risk missing valuable insights that may be gained by investigating and validating the cost model’s output at an earlier stage, before using the output for further analyses.
Improvements Overall, the inaccuracies, inconsistencies, and other errors we identified within the District’s bus cost model are rooted in a lack of adherence to some core principles in cost model design and execution. These include ensuring that valid and complete source data are used, cost drivers are appropriate and are the best available, and proactive steps are taken to validate the model’s output. The District needs to make a number of improvements to ensure the accuracy and reliability of the cost information the cost model produces. First, the District should ensure that the source data used in the cost model are valid and complete. Specifically, all data used in the model should represent the same time period (e.g., January through December of a given year). Additionally, financial cost data should be pulled from the District’s general ledger, since this is the official record for the District’s expenses. Second, the District should develop new automated reports within its electronic data systems to routinely compile the financial and operational data used by the cost model, thereby minimizing the need for manual compilation and entry of source data or workarounds when needed data are not available. The District should also review and update source data and related cost drivers on a routine basis to reflect the availability of new data and recent systems changes. We recognize that when an organization as large and complex as the District adopts a new financial management system, it often takes time to reassess and, when necessary, replace reports produced previously by the old system. However, it is important that the District prioritize its efforts to ensure that the District’s new financial management system can supply the information needed for the bus cost model to function properly. Third, the District should ensure that cost drivers used in the model approximate the way that costs are being consumed and for which actual source data are available. At a minimum, the District should develop a more appropriate cost driver to allocate administrative costs across the District’s service modes, including FasTracks. Modern costing methodologies suggest using an activity-based approach, whereby the District

Colorado Office of the State Auditor Evaluation of the Regional Transportation District’s Bus Cost Allocation Model
10
would conduct periodic surveys of administrative staff to establish the amount of work time spent on specific modes of transportation or segments of the District’s operations. These survey results would then be used as the basis for developing a cost driver to allocate administrative costs in the model. The District should also replace cost drivers currently based on scheduled service miles with cost drivers that are based on actual service miles. As discussed previously, actual service miles by bus type can now be obtained from the District’s maintenance management system, Maximus. Fourth, the District should develop and implement procedures to validate the cost model’s output. At a minimum, such validation procedures should include reconciling total costs input into the model with total costs output from the model. Without performing a reconciliation, the District lacks assurance that all costs input into the model are captured and allocated in the output. As discussed previously, some of the unreconciled costs we identified were the result of malfunctioning formulas and functions in the model’s core spreadsheets. As part of its validation procedures, the District should also routinely review the automated formulas and functions to ensure they retain their integrity. The District could consider redesigning the model’s core spreadsheets or adopting a new tool with enhanced application controls to minimize the potential for calculation and formula errors. The District’s validation procedures should also include a review of changes in the cost model’s output from one year to the next, and the District should investigate any significant differences. By obtaining a basic understanding of the causes for major cost shifts from one year to the next, the District can rule out potential problems with the model and gain additional insight into potentially meaningful cost trends. Finally, the procedural documentation for executing the cost model should be reviewed and updated on an annual basis. During our evaluation, we found that the cost model documentation was outdated and did not reflect current bus cost model practices and procedures. Maintaining current procedural documentation is important for keeping a record of changes and ensuring that the cost model is executed properly from one year to the next. Good procedural documentation also facilitates supervisory review, as well as the transfer of knowledge about the cost model. Transfer of knowledge is critical since currently only one staff person is primarily responsible for maintaining and executing the bus cost model each year.
Recommendation No. 1: The Regional Transportation District should ensure that the bus cost model produces accurate and reliable information by adhering to core principles in cost model design and execution. Specifically, the District should:
a. Ensure that all source data used in the model are valid and complete. At a minimum, all data used in the model should pertain to the same time period, and financial cost data should be pulled from the District’s general ledger.

Colorado Office of the State Auditor Evaluation of the Regional Transportation District’s Bus Cost Allocation Model
11
b. Develop new automated reports within its electronic data systems to routinely compile the financial and operational data used by the cost model. Source data and related cost drivers should be reviewed and updated on a routine basis to reflect the availability of new data and recent operational and system changes.
c. Ensure that cost drivers used in the model most closely approximate how costs
are being consumed and for which source data are available. At a minimum, the District should develop a more appropriate cost driver to allocate administrative costs across the District’s service modes, including FasTracks, and replace cost drivers currently based on scheduled service miles with cost drivers based on actual service miles.
d. Develop and implement procedures to validate the cost model’s output. At a
minimum, the District should reconcile total costs input into the model with total costs output from the model, review the automated formulas and functions in the model’s core spreadsheets to ensure that they retain their integrity, and review and seek explanations for any significant differences in the cost model’s output from one year to the next.
e. Review and update the procedural documentation for executing the cost model
on an annual basis.
Regional Transportation District Response: a. Agree. Implementation date: August 2011.
Much of the timing issue with the source data was an isolated exception related to the one-time computer conversion. The District constantly strives to identify and use accurate and complete information with regard to the source data used in the cost model, as with all decisions throughout the District. The District will continue to ensure accurate data is identified and used.
b. Agree. Implementation date: As resources allow. The District has reorganized the IT staff to better utilize the capabilities of the new Enterprise Resource Planning (ERP) system. In addition, consultants have been contracted to review best practices as related to Oracle and to define user needs, prioritize those needs, and recommend solutions. New reports will be developed to better identify and quantify data to be used for the cost modeling process. These process changes will be reviewed periodically to ensure they continue to meet the needs of the District.

Colorado Office of the State Auditor Evaluation of the Regional Transportation District’s Bus Cost Allocation Model
12
c. Disagree. The District believes all the cost drivers currently associated with this cost allocation model are generally appropriate. Drivers relating to scheduled versus actual service miles, as well as the allocation of administrative costs, have been reviewed and are believed to be appropriate to the model at this time. District management will periodically review these issues and will continue to make decisions in the best interests of the District.
d. Agree. Implementation date: August 2011. The District will review its policies and develop procedures to improve the validation methodology. This will include a reconciliation of the model to ensure the cost allocation formulas and functions are operating correctly. Any significant differences will be researched and explained or corrected.
e. Agree. Implementation date: August 2011. In conjunction with Recommendation No. 1d, the District will update and review the training and procedural documentation on an ongoing basis.
Cost Estimates for Privatization Generally speaking, District managers and the Board do not see the outputs of the bus cost model. Rather, staff use the model’s outputs to conduct additional analyses, the results of which are routinely provided to decisionmakers. One key area of decisionmaking where District managers use outputs from the bus cost model is in sourcing decisions. That is, the District uses outputs from the bus cost model when evaluating bids submitted by private contractors to operate a set of bus routes the District has selected for privatization. State statute permits, but does not require, the District to provide up to 58 percent of its vehicular services (i.e., bus services, not including light rail), as measured in vehicle hours, through qualified private businesses under competitively negotiated contracts [Section 32-9-119.5(2)(a), C.R.S.]. According to the District, private contractors provided about 57 percent of the District’s vehicular services in 2009. When evaluating bids submitted by private contractors, the District uses data from the bus cost model to prepare cost projections that estimate the total costs the District (1) would no longer incur if specific bus routes currently operated in-house by the District were to be operated by a private contractor, or (2) would incur if bus routes currently operated by a private contractor were to be operated in-house by the District.

Colorado Office of the State Auditor Evaluation of the Regional Transportation District’s Bus Cost Allocation Model
13
Generally speaking, the services provided by private contractors are relatively similar to those that would be provided by the District. For example, private contractors are typically responsible for hiring and training vehicle operators, mechanics, and other support staff; maintaining the vehicles, which they lease from the District; and providing their own maintenance and storage facilities. Private contractors are also required to abide by the same safety and performance standards that apply to the District’s in-house operations. Although the services being provided are relatively similar, the District uses a different approach to its cost projections, depending on whether the bus routes are currently being operated in-house, by a private contractor, or are mixed. For example, in a situation in which the District plans to outsource routes that are currently being operated in-house, the District identifies those costs it would no longer incur by contracting with a private contractor to operate the routes. Alternatively, when the District offers a re-bid for routes that are already being operated by a private contractor, the District estimates how much it would cost to bring those routes back in-house. The more fully the District identifies and analyzes the specific details of these different sourcing scenarios, the more accurate and reliable its cost projections will be—and, consequently, the more confidence District managers and Board members can place in the cost information used for decisionmaking. During our evaluation, we conducted an in-depth review of a July 2010 cost projection that the District prepared using outputs from the 2008 bus cost model. Specifically, the District used 2008 cost data and projected these data forward to estimate costs for future years. The purpose of the District’s cost projection was to estimate the in-house cost for operating a group of 21 bus routes in the Boulder/Longmont area. This group of routes was operated by a private contractor from 2006 through 2010, and the District re-bid these routes for a new three-year contract starting in January 2011 with two, one-year options to renew (five years total). Since this was a re-bid of an expiring contract, in considering this sourcing decision the District had to estimate what it would cost to bring these bus routes back in-house and operate them over the five-year period of the contract (i.e., 2011 through 2015). The District then compared this cost with the proposals submitted by the private contractors. In July 2010, the District awarded a new contract to the same private contractor that had been operating the bus routes under the expiring contract. The contractor’s winning bid for the contract was $67.5 million, including the cost of fuel. The District estimated that its cost to bring the routes back under in-house operations would be $70.0 million, including the cost of fuel, or approximately $2.5 million more than the contractor’s costs. As described in the following bullet points, we identified problems with the cost projection prepared by the District for the group of bus routes that was re-bid in 2010. These problems illustrate the lack of a well-defined and consistently applied methodology and process for preparing the District’s cost estimates. We found problems in four areas:

Colorado Office of the State Auditor Evaluation of the Regional Transportation District’s Bus Cost Allocation Model
14
Wages and benefits for new hires. The District did not accurately estimate wages for new hires in its 2010 cost projection. Since this was a re-bid of an existing contract, the District’s cost projection should have estimated the cost of new employees (e.g., bus operators, mechanics, and other hourly support personnel) that the District would need to hire if the bus routes were brought back under in-house operations. The District’s collective bargaining agreement with the Amalgamated Transit Union, Local #1001, establishes a standard progression for wages for bus operators, mechanics, and other hourly support personnel. According to this agreement, for example, a newly hired bus operator will be paid a starting wage of $15.49 per hour, which will gradually increase to a maximum of $20.00 per hour after 4½ years on the job. However, the District did not use this wage progression schedule when estimating the cost of new employees in its 2010 cost projection. Rather, the District used the average wages for its current employees as represented by the 2008 bus cost model. This is problematic because many of the District’s current employees were already earning the highest pay in the wage progression schedule. Thus, the average wages in 2008 were significantly higher than the wages that would be paid to new hires in accordance with the agreed-upon wage progression schedule. As a result, the District’s 2010 cost projection overstated the District’s costs. We re-calculated the cost projection and found that factoring in wage progression for bus operators alone would have lowered the District’s projected costs by approximately $5 million, or 7 percent of the District’s $70.0 million cost estimate.
In response to our analysis, the District reported that when wage progression is used in a cost projection, it is also necessary to factor in the cost of fringe benefits for additional staff required to fill in for emergencies, sick leave, and vacations. This is because the District’s projection handles the cost for fringe benefits separately from the cost of wages. District staff reported that the additional fringe benefits would have added about $643,000 to the District’s costs. Therefore, according to the District, the net effect of using wage progression and factoring in the additional fringe benefits would only have been a reduction to the District’s projected cost for these bus routes of about $4.4 million, or 6 percent of the District’s $70.0 million cost estimate.
Fixed costs for tires. The District did not consider how it should treat fixed
costs associated with a contract for tires in its 2010 cost projection. When projecting costs for sourcing decisions, it is necessary to identify and exclude from further analysis those costs that the District would incur regardless of whether the routes are operated in-house or by a private contractor. The District’s contract with its tire provider includes both a fixed monthly service charge of $37,000 and variable charges that accrue on a per-tire, per-mile basis. The District reported that the contract also includes a provision allowing the monthly service charge to be renegotiated if the number of buses or miles covered by the contract increases or decreases by 5 percent or greater. Such an

Colorado Office of the State Auditor Evaluation of the Regional Transportation District’s Bus Cost Allocation Model
15
increase could potentially occur if currently privatized routes were brought back under District operations.
We found that the District correctly included the per-mile charges (i.e., variable costs) from the tire contract in its 2010 cost projection, since these costs would increase if the District were to operate additional routes in-house. However, the District also included the monthly service charge (i.e., fixed costs) in its 2010 cost projection without first determining whether bringing the contracted routes under in-house operations would have triggered the renegotiation provision in the tire contract. This is an important consideration, since it affects how the monthly service charge should be treated in the cost projection. For example, if the tire contract did not have to be renegotiated, then the District should have treated the monthly service charge as a fixed cost and excluded it from the projection. We estimate that failing to exclude these costs would overstate the District’s costs by as much as $265,000. If, on the other hand, the tire contract had to be renegotiated, then only the increase in the monthly service charge should have been included in the cost projection as an additional cost to the District as a result of bringing the routes in-house. This example illustrates the importance of recognizing, in advance, key provisions of contracts that affect the cost of providing bus services and ensuring that such provisions are appropriately factored into the District’s cost projections.
Facilities and support personnel capacity. The District did not sufficiently
analyze its current facilities and support personnel capacity before assuming certain costs in its 2010 cost projection. If the District were to bring a group of bus routes that had previously been operated by a private contractor back under in-house operations, the District would need to find space to store and maintain the vehicles. Extra space may be found either by making use of unused capacity in existing facilities and associated support personnel, or by acquiring a new facility and staffing it with the necessary managers, administrative staff, and maintenance workers. In some scenarios, it may be more cost-effective to acquire and staff a new facility located close to the bus routes, even though existing facilities that are farther away may have sufficient capacity to accommodate the additional vehicles. In other scenarios, it may be more cost-effective to pursue a mixed approach—absorbing some of the additional vehicles in existing facilities while also acquiring a smaller facility to handle the remainder.
In the cost projection we reviewed, the District assumed that it would need to acquire additional facility space and hire new support personnel in the Boulder/Longmont area. The District estimated that this would cost about $9.9 million over the five-year contract period, which is about 14 percent of the District’s total $70.0 million cost projection. However, before making this assumption and including these costs in its 2010 cost projection, the District

Colorado Office of the State Auditor Evaluation of the Regional Transportation District’s Bus Cost Allocation Model
16
did not conduct a capacity analysis to determine whether the District could have absorbed some of these costs within its existing facility and support personnel resources. We interviewed managers and staff at two of the District’s existing facilities, some of whom reported that the District had unused capacity in its facilities that could have accommodated the additional buses.
Facilities and support personnel capacity are important considerations any time the District estimates the cost of bringing bus routes back under in-house operations. The District’s senior management reported that they made these considerations when re-bidding this contract and concluded that further detailed analysis was unnecessary. We recognize that it may not be necessary to conduct a detailed capacity analysis for every cost projection. However, in this case, we believe the assumption that the District would need to acquire additional facility space and hire new support personnel was material to the cost projection (i.e., it resulted in an increase in the District’s costs by $9.9 million) and, therefore, should have been based on a more detailed capacity analysis and evaluation of costs.
Contract management costs. The District did not estimate and exclude
contract management costs from its 2010 cost projection. Since the District was estimating the in-house cost of operating certain bus routes that had previously been operated by a private contractor, any costs that would no longer be incurred should have been removed from the cost projection. Specifically, costs associated with managing the contract with the private contractor should have been excluded, since the District would no longer expend time and resources to manage a private contract once the routes were brought back under in-house operation. However, the District did not identify or exclude any contract management costs from its projection. As a result, the District’s cost projection overstated the District’s costs. Because the District did not estimate its contract monitoring costs, however, the exact amount of the overstatement cannot be quantified.
After being provided the results of our analysis, the District separately identified an additional calculation error in its original cost projection. Specifically, the District found that it erroneously multiplied its projected hourly rate for direct service costs by the wrong factor at one of the final stages of its analysis. As a result, the District reports that its 2010 cost projection for the group of bus routes being re-bid understated the District’s costs by about $4.8 million. The problems identified with the District’s 2010 cost projection resulted in over- and understatements of the District’s costs. As noted previously, our review focused only on certain high-risk aspects of the cost projection; errors could be present in other areas of the analysis that we did not examine in depth. Thus, we cannot conclude on what the final dollar amount of the District’s cost projection would have been without

Colorado Office of the State Auditor Evaluation of the Regional Transportation District’s Bus Cost Allocation Model
17
having performed a comprehensive review of the model that identified and corrected all problems. However, the magnitude of the cost over- and understatements we identified are sufficient to conclude that the District’s cost projection is inaccurate and leads us to question its reliability and usefulness for evaluating bids from private contractors. For example, when taken individually, some of the errors in the 2010 cost projection raised the District’s costs by about $5 million; other errors lowered the District’s costs by about $5 million. The fact that these cost over- and understatements were nearly double in absolute value when compared with the $2.5 million difference between the District’s cost projection and the winning bidder’s proposal means that the District cannot reliably use this cost estimate to determine whether contracting with the private contractor would result in cost savings or additional costs to the District. The cost projections the District prepares are complex and must account for many different variables. Each sourcing decision requires an understanding of how the District’s costs will be affected throughout the life of a contract, as well as how these costs might differ depending on the nature of the sourcing scenario being considered. For example, the District may need to treat costs differently depending on whether the routes in question are being newly outsourced or whether they are being offered for re-bid following an expiring contract. The problems we found in the District’s 2010 cost projection were caused by a lack of a well-defined and consistently applied methodology to generate cost projections for evaluating bids from private contractors. We encountered difficulties verifying many of the basic assumptions underlying the District’s cost projection and, as discussed previously, identified cost treatments in the District’s analysis that were inappropriate or inconsistent with a re-bid of an existing contract. The District should take action to formalize the application of its cost projection methodology into a management tool, such as a decision tree or checklist, to explicitly identify and verify the assumptions underlying the analysis and ensure that costs are accounted for properly and in a consistent manner, based on the nature of the sourcing decision being considered. For example, staff could use a decision tree or checklist to determine whether it is appropriate to use wage progression for projecting labor costs and how this should be done based on agreed-upon wage progression schedules. The management tool could also help staff identify whether certain fixed costs or contract management costs should be excluded from the analysis. Additionally, the management tool can ensure that key provisions of contracts affecting the cost of bus services are identified and that such provisions are appropriately factored into the District’s cost projections. Once the management tool is developed, the District’s senior managers should review and update the tool on a routine basis. By using a formal decision tree or checklist to identify the known variables and assumptions that need to be considered when preparing a particular cost projection, the District can reduce the risk that any one significant cost component will be handled inappropriately in the analysis and, therefore, skew the cost information being provided to decisionmakers.

Colorado Office of the State Auditor Evaluation of the Regional Transportation District’s Bus Cost Allocation Model
18
Recommendation No. 2: The Regional Transportation District should ensure that cost projections used for evaluating bids from private contractors are based on a well-defined and consistently applied methodology. Specifically, the District should formalize the application of its cost projection methodology into a management tool, such as a decision tree or checklist, to explicitly identify and verify the assumptions underlying the analysis and ensure that costs are accounted for properly and in a consistent manner, based on the nature of the sourcing decision being considered. Once the management tool is developed, the District’s senior managers should review and update the tool on a routine basis.
Regional Transportation District Response Agree. Implementation date: August 2011. The District will review and identify the cost projections used in the cost allocation model. The District will develop a reasonable tool to more formally document the various cost projections. These projections, as well as the associated assumptions, will be reviewed and analyzed on a periodic basis by the appropriate management to ensure their continued accuracy and viability.
Additional Opportunities Cost allocation models provide organizations such as the District with data on the historical cost of their products and services. Organizations then use these data to perform further cost analyses and inform forward-looking decisionmaking. As a decision support tool, the District’s cost model should provide cost information that is relevant to the District’s current services and business processes. Ideally, the District’s cost model should also have the flexibility and adaptability to meet future cost-analysis needs. The District initially developed its bus cost model in 1994 at a time when the District primarily provided bus transportation services. The District has since evolved into a multimodal transportation agency whose operations are significantly different and more complex than they were 16 years ago. For example, the District has expanded its bus services, added light rail operations, and undertaken the FasTracks transit expansion program to build new commuter rail, light rail, and bus rapid transit lines; further expand local bus services; and enhance park-n-Ride facilities. These activities have fundamentally altered the District’s operations and introduced new needs for analyzing costs that the District’s bus cost model was not originally designed to handle.

Colorado Office of the State Auditor Evaluation of the Regional Transportation District’s Bus Cost Allocation Model
19
In 1996, the District received a final report from a consultant that the District hired to review its bus cost model. As part of that review, the District’s consultant was complimentary of the District’s efforts to develop a then state-of-the-art approach to costing the District’s bus services. The District’s consultant recommended that the District commit the in-house resources necessary to continue to update the cost model and its applications to be of the greatest possible usefulness to management and the Board. However, the District has not performed a comprehensive update of its bus cost model in the 16 years since the model was first created. In addition to making the necessary structural and procedural improvements to its bus cost model (see Recommendation Nos. 1 and 2), the District has an opportunity to develop a more comprehensive cost allocation model that supports the type of analysis needed for ongoing cost reduction efforts in bus operations and addresses all modes of transportation provided by the District.
Cost Reduction Strategies The 1-percent sales and use tax levied in the District is a primary source of the District’s total revenues. In Fiscal Year 2009, the District’s sales and use tax revenues totaled approximately $371 million, or 53 percent of total revenues. However, the recent economic downturn over the past several years has caused dramatic reductions in the District’s tax revenues. For example, the District is projecting a budget shortfall of $18 million in 2011 and has adopted a fiscal action plan aimed at controlling costs and increasing fare revenues. A well-designed cost model provides detailed information that an organization can use to improve operational efficiencies and ultimately realize cost savings. The District could use more detailed cost information than is currently provided by the bus cost model to support its ongoing cost reduction strategies for bus services. For example, different bus routes have unique cost components, such as operator costs, bus parts, tires, maintenance support, route support, and administrative support. Using the cost model to facilitate a more detailed cost analysis by route could help highlight those cost components that significantly affect route profitability, thereby helping the District identify viable cost reduction opportunities. The District already conducts analyses of costs per bus route to identify those routes that are more or less “profitable” (i.e., routes that are subsidized more or less with sales tax revenues versus passenger fares) and adjusts route schedules accordingly. However, during our evaluation, District staff reported they could improve performance in service delivery, and therefore better control costs, if they had access to more sophisticated costing reports than are currently available. For example, some managers said they could better plan service schedules and the assignment of buses to routes if they could see how various classes of bus costs were broken down by route, as well as by peak versus non-peak periods of operation. Other managers said they could better plan the purchasing of materials if they could see how parts costs compared across the various bus types. However, conducting these types of analyses would require the ability to “drill down” within the cost model data to generate more refined presentations of

Colorado Office of the State Auditor Evaluation of the Regional Transportation District’s Bus Cost Allocation Model
20
costs, or to regroup costs along different relationships. This detailed level of cost reporting, tracking, and analysis is not currently supported by the District’s bus cost model.
Multiple Transportation Modes By design, the District’s bus cost model only allocates those costs associated with fixed-route bus service. As discussed previously, at the time the model was developed, the District’s costs were primarily related to the provision of bus services. However, since this is no longer the case, the bus cost model no longer provides a comprehensive picture of the District’s cost structure. In the 2008 cost model, less than half (44 percent) of the $434 million in total costs from the District’s general ledger was allocated to fixed-route bus service via the bus cost model. We recognize that the District conducts separate cost analyses for its light rail services and the FasTracks project. Examining these other analyses in-depth was not part of the scope of this evaluation. Nonetheless, given the complexity of the District’s costs and operations, we believe the District would be better positioned for analyzing and controlling its costs by pursuing a more comprehensive cost model that is inclusive of the District’s multiple transportation modes. For example, a comprehensive redesign could provide the District the opportunity to integrate some of its cost analyses, thereby ensuring consistency of assumptions and treatment of costs across different transportation modes. Additionally, a redesign could allow the District to take advantage of detailed financial and operational data that is now available, as well as the many advances in cost modeling techniques and technologies that have occurred since the model was first created. By pursuing a more comprehensive design, the District could enhance its ability to fully leverage the cost model as a tool to support decisionmaking now and into the future.
Recommendation No. 3: The Regional Transportation District should consider a comprehensive redesign of its cost allocation model to support the level of cost reporting, tracking, and analysis needed for ongoing cost reduction efforts in bus operations and to make the model more inclusive of the different transportation services provided by the District.
Regional Transportation District Response: Partially Agree. Implementation date: August 2011. The scope of this review was to evaluate the bus cost model. The District utilizes other cost allocation methods for other transportation services that were not reviewed which better meet the needs of the District. The District

Colorado Office of the State Auditor Evaluation of the Regional Transportation District’s Bus Cost Allocation Model
21
will investigate the potential to more fully use the existing cost allocation model after it has been reviewed and updated. The District will leverage the cost allocation model as a tool to support decisionmaking and will consider redesigning the model as resources become available.

This page intentionally left blank.

Appendices

This page intentionally left blank.
A-1
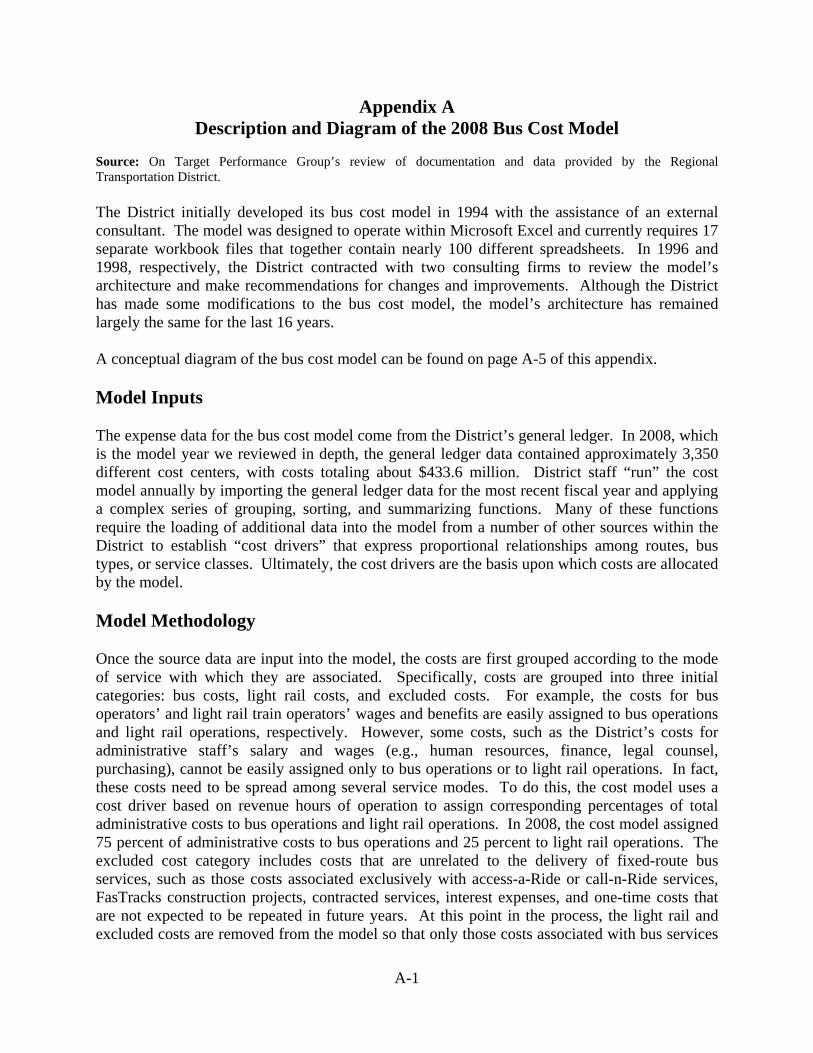
Appendix A Description and Diagram of the 2008 Bus Cost Model
Source: On Target Performance Group’s review of documentation and data provided by the Regional Transportation District. The District initially developed its bus cost model in 1994 with the assistance of an external consultant. The model was designed to operate within Microsoft Excel and currently requires 17 separate workbook files that together contain nearly 100 different spreadsheets. In 1996 and 1998, respectively, the District contracted with two consulting firms to review the model’s architecture and make recommendations for changes and improvements. Although the District has made some modifications to the bus cost model, the model’s architecture has remained largely the same for the last 16 years. A conceptual diagram of the bus cost model can be found on page A-5 of this appendix. Model Inputs The expense data for the bus cost model come from the District’s general ledger. In 2008, which is the model year we reviewed in depth, the general ledger data contained approximately 3,350 different cost centers, with costs totaling about $433.6 million. District staff “run” the cost model annually by importing the general ledger data for the most recent fiscal year and applying a complex series of grouping, sorting, and summarizing functions. Many of these functions require the loading of additional data into the model from a number of other sources within the District to establish “cost drivers” that express proportional relationships among routes, bus types, or service classes. Ultimately, the cost drivers are the basis upon which costs are allocated by the model. Model Methodology Once the source data are input into the model, the costs are first grouped according to the mode of service with which they are associated. Specifically, costs are grouped into three initial categories: bus costs, light rail costs, and excluded costs. For example, the costs for bus operators’ and light rail train operators’ wages and benefits are easily assigned to bus operations and light rail operations, respectively. However, some costs, such as the District’s costs for administrative staff’s salary and wages (e.g., human resources, finance, legal counsel, purchasing), cannot be easily assigned only to bus operations or to light rail operations. In fact, these costs need to be spread among several service modes. To do this, the cost model uses a cost driver based on revenue hours of operation to assign corresponding percentages of total administrative costs to bus operations and light rail operations. In 2008, the cost model assigned 75 percent of administrative costs to bus operations and 25 percent to light rail operations. The excluded cost category includes costs that are unrelated to the delivery of fixed-route bus services, such as those costs associated exclusively with access-a-Ride or call-n-Ride services, FasTracks construction projects, contracted services, interest expenses, and one-time costs that are not expected to be repeated in future years. At this point in the process, the light rail and excluded costs are removed from the model so that only those costs associated with bus services

A-2
will be allocated and reflected in the model’s final outputs. As represented in the diagram on page A-5, in 2008 the bus cost model allocated approximately $189.4 million (44 percent of the District’s total costs) to bus operations. Second, the bus cost model identifies both “non-retained” and “retained” costs, which is an important segregation for the purpose of conducting cost analyses related to the privatization of bus service routes. Non-retained costs are those costs the District (1) would no longer incur if an in-house route were operated by a private contractor or an in-house route were eliminated, or (2) will not incur as long as routes currently operated by a private contractor remain so. Examples of non-retained costs include those for consumables, such as fuel, vehicle parts, and any costs associated with a bus maintenance facility. Retained costs are those costs the District would continue to bear regardless of whether a route is operated by a private contractor. Examples of retained costs include those associated with service planning, scheduling, accounting, and human resource functions. As represented in the diagram on page A-5, in 2008 the bus cost model allocated approximately $141.6 million (75 percent of the total bus costs) to non-retained costs. Finally, the cost model includes other categorizations of costs. For example, non-retained costs are further classified as “direct” or “indirect.” Direct costs are those the District incurs directly as a result of providing transit services. For example, operator wages and costs for bus maintenance and parts are classified as direct costs. Indirect costs are overhead costs that are not directly related to the delivery of services but are necessary for continuing operations. Examples include costs for bus storage facilities and administration. As represented in the diagram on page A-5, in 2008 the bus cost model allocated approximately $112.5 million (79 percent of the total non-retained bus costs) as a direct cost and $29.1 million (21 percent of the total non-retained bus costs) as an indirect cost. Cost Drivers Cost drivers are the key operational component of the cost model because they establish the basis upon which costs are allocated. For example, some costs are allocated to routes according to how many scheduled service hours each route was assigned in relation to the total scheduled service hours for all routes. Cost drivers are based on operational data obtained from multiple sources within the District. The specific cost drivers used in the model include the following:
Hours – the total number of scheduled hours of bus service provided on a route. Examples of costs allocated based on this driver include training, service planning, and service monitoring.
Miles – the total number of scheduled miles of bus service provided on a route.
Examples of costs allocated based on this driver include liability and related legal costs, body shop, central warehouse, and accounts payable.
Peak Vehicles – the number of scheduled buses needed to operate a route during
evening peak hours. Examples of costs allocated based on this driver include service cleaning, farebox maintenance, and radio maintenance.

A-3
Union Employees – the average number of full-time, part-time, and trainee union employees employed by the District to service a route. Examples of costs allocated based on this driver include workers compensation and related legal costs, safety, payroll, and human resources.
Divisions – facilities used to store and maintain buses for day-to-day operations, not
including District Shops. Examples of costs allocated based on this driver include maintenance of garages, supervision of Operations Department union employees, and division-based materials handling.
Facilities – all operating divisions, administrative facilities, and District Shops.
Examples of costs allocated based on this driver include office services and environmental mitigation.
park-n-Rides – District-owned or leased bus park-n-Rides where the District is
responsible for maintenance of the facility. Examples of costs allocated based on this driver include park-n-Ride maintenance, cleaning, and utilities.
Passengers – the number of passengers using bus service on each route. Examples of
costs allocated based on this driver include passes, tokens, and timetable production. Shelters – District-owned and maintained passenger shelters at bus stops. Examples of
costs allocated based on this driver include shelter cleaning and maintenance. Stations – District bus passenger stations, such as Market Street and Civic Center
Stations. Examples of costs allocated based on this driver include station security, maintenance, cleaning, and utilities.
Fixed – any item whose cost is not dependent on service levels. Examples of costs
allocated based on this driver include maintenance of District Shops, Board of Directors, General Manager’s office, street supervision and dispatch, communications, market research, and long-term planning.
Four of the District’s largest cost items are allocated separately to account for differences in service class or the type of vehicles used on the routes. These special allocations are as follows:
Operators – an allocation of operator wages and fringe benefit costs using the distribution of scheduled service hours by service type and run type to approximate the split of full-time and part-time operators by service type.
Consumables – allocation based on mileage and fuel consumption by vehicle type and
used to forecast costs for tires, diesel fuel, oil, and similar items used in revenue bus service.
Parts – allocation based on mileage and parts usage by vehicle type and used to forecast
costs for parts needed in vehicle maintenance.

A-4
Running Repair – allocation based on mileage and running repair mechanic hours by vehicle type and used to forecast labor costs for routine vehicle maintenance.
Model Outputs The bus cost model is designed to produce outputs to support decisionmaking related to sourcing for fixed-route bus services and budgeting and planning. The model’s outputs are expressed as costs per unit. Examples include consumable costs per scheduled mile, operator wages and benefits per revenue hour, and facility costs per facility. Each model output is designated as either retained or non-retained. The non-retained costs are further designated as direct or indirect. These designations determine which of the cost-per-unit outputs should be used for particular types of analysis. For example, the non-retained, direct cost-per-unit outputs form the basis for marginal cost analyses, which are analyses of how costs would change under different operational scenarios, such as increases or decreases in service delivery or the number of routes. Such analyses are used to project costs for fixed-route sourcing decisions. All three model output designations (i.e., non-retained direct, non-retained indirect, and retained) form the basis for total cost analyses, which are used for budgeting and planning purposes.

Appendix A Regional Transportation District 2008 Bus Cost Allocation Model
Bus Cost Allocation Model (2008 costs are in parentheses)
Union Employee
Operator
Hour
Mile
Consumable
Bus Parts
Peak Vehicle
Running Repair
Model Outputs $ Cost Per
Model Inputs External Analysis and Use of Cost Model
Information
Planning and Budgeting
Variable and Total Cost by Route Indirect Costs
($29.1 million)
Direct Costs ($112.5 million)
Sourcing Decisions Marginal Cost by
Service Class
Cost Data from the District’s General
Ledger ($433.6 million)
Bus Costs ($189.4 million)
Light Rail Costs ($44.9 million)
Excluded Costs ($199.3 million)
Non-Retained Costs ($141.6 million)
Retained Costs ($47.8 million)
Source: On Target Performance Group’s analysis of documentation and data provided by the Regional Transportation District.
A-5
Legend Symbolizes the flow of costs through the model to support sourcing decisions. Symbolizes the flow of costs through the model to support planning and budgeting decisions. Symbolizes a cost driver, which is an allocation factor based on percentages and/or other operational data that is used to segregate costs into specific categories.

This page intentionally left blank.

B-1
Appendix B
This appendix provides the detailed results of our analysis, as discussed on page 8 of the report.
Regional Transportation District 2008 Bus Cost Allocation Model
Reconciliation of Model Inputs and Outputs
Cost Pool
Input from General Ledger
Output from Cost Model Difference
Non-retained Bus Costs1
Operator Wages per Scheduled Hour $55,488,074 $54,562,746 ($925,328)5
Consumables per Scheduled Mile 21,161,304 21,161,304 - Parts per Scheduled Mile 8,177,745 6,078,583 (2,099,162)5
Running Repairs per Scheduled Mile 10,095,183 10,095,183 - Per Union Employee 2,273,724 2,085,480 (188,244)5
Per Hour 1,547,409 1,547,409 - Per Mile 8,404,009 8,404,009 - Per Peak Vehicle 5,348,543 5,348,543 - Indirect Costs 29,126,244 28,172,965 (953,279)6
Other 1,162 - (1,162)Total Non-retained Bus Costs $141,623,397 $137,456,222 ($4,167,175)
Retained Bus Costs2 47,825,777 47,058,525 (767,252)6
Total Bus Costs $189,449,174 $184,514,747 ($4,934,427)
Excluded Costs3 199,316,163 199,316,163 -
Light Rail Costs4 44,922,832 44,922,832 -
Total Costs $433,688,169 $428,753,742 ($4,934,427)Source: On Target Performance Group’s analysis of the Regional Transportation District’s 2008 bus cost allocation model. 1 Non-retained costs are costs the District would not incur if a route were either operated by a private
contractor or eliminated. 2 Retained costs are those costs the District would continue to incur regardless of whether a route is operated
by a private contractor or kept in-house. 3 Excluded costs are unrelated to the regular delivery of bus or light rail services, such as costs associated
with access-a-Ride or call-n-Ride services, FasTracks capital construction costs, contracted transportation services, interest expenses, and one-time costs that are not expected to be repeated in future years.
4 Light rail costs include all costs associated with current light rail operations. 5 Differences in the non-retained cost pools for operator wages, parts, and union employees ($3,212,734
total) were due to the use of invalid source data. 6 Differences in the non-retained, indirect bus cost pool and the retained bus cost pool ($1,720,531 total)
were due to computational errors in the bus cost model’s supporting spreadsheets.

This page intentionally left blank.

Appendix C This appendix provides the detailed results of our analysis, as discussed on page 8 of the report.
Total Dollars
Allocated Units Cost per Unit
Total Dollars
Allocated Units Cost per Unit
Operator Wages per Scheduled Hour $54,562,746 1,680,735 $32.46 $54,254,267 1,622,556 $33.44 3%
Consumables per Scheduled Mile $21,161,304 25,218,507 $0.839 $20,108,951 25,000,502 $0.804 -4%
Parts per Scheduled Mile $6,078,583 25,218,507 $0.241 $6,649,144 25,000,502 $0.266 10%
Running Repairs per Scheduled Mile $10,095,183 25,218,507 $0.400 $10,446,451 25,000,502 $0.418 5%
Per Union Employee $2,085,480 1,551 $1,345 $2,032,672 1,602 $1,269 -6%
Per Hour $1,547,409 1,701,485 $0.909 $1,316,955 1,622,556 $0.812 -11%
Per Mile $8,404,009 26,241,282 $0.320 $7,992,234 25,000,502 $0.320 0%
Per Peak Vehicle $5,348,543 555 $9,637 $5,639,359 535 $10,541 9%
Per Division $14,724,348 3 $4,908,116 $13,761,594 3 $4,587,198 -7%
Per Facility $754,158 5 $150,832 $651,553 5 $130,311 -14%
Fixed Costs $10,383,005 1 $10,383,005 $11,012,925 1 $11,012,925 6%
Step-calculated Costs $2,311,454 N/A N/A $2,762,838 N/A N/A N/A
$137,456,222 N/A N/A $136,628,943 N/A N/A N/A
Per Hour $786,319 3,230,219 $0.243 $784,730 3,156,651 $0.249 2%
Per Facility $4,441,849 5 $888,370 $5,140,330 5 $1,028,066 16%
Per Passenger $753,981 81,404,499 $0.00926 $839,168 77,039,553 $0.01089 18%
Per Park-n-Ride $5,626,342 74 $76,032 $6,198,780 74 $83,767 10%
Per Shelter $990,200 509 $1,945 $1,713,638 509 $3,367 73%
Per Station $2,384,776 2 $1,192,388 $2,419,057 2 $1,209,529 1%
Fixed Costs $31,593,332 1 $31,593,332 $29,408,791 1 $29,408,791 -7%
Step-calculated Costs $481,726 N/A N/A $1,224,885 N/A N/A N/A
$47,058,525 N/A N/A $47,729,379 N/A N/A N/A
$184,514,747 N/A N/A $184,358,322 N/A N/A N/A
Total Non-retained Bus Costs
Retained Bus Costs3
Total Retained Bus Costs
Total Bus Costs
Source: On Target Performance Group's analysis of the Regional Transportation District's 2008 and 2009 bus cost allocation models.1 Shaded values indicate increases or decreases of at least 10 percent.
2 Non-retained bus costs are costs the District would not incur if a route were either operated by a private contractor or eliminated.
3 Retained bus costs are those costs the District would continue to incur regardless of whether a route is operated by a private contractor.
Ind
irec
tRegional Transportation District
2008 and 2009 Bus Cost Allocation Models
Year-to-Year Comparison
2008 2009
Non-retained Bus Costs2
Dir
ect
Cost Pool
Percent Change
in Cost per Unit
2008–20091
C-1

This page intentionally left blank.

The electronic version of this report is available on the website of the
Office of the State Auditor
www.state.co.us/auditor
A bound report may be obtained by calling the
Office of the State Auditor
303.869.2800
Please refer to the Report Control Number below when requesting this report.
Report Control Number 2057

Report Control Number 2057