evaluation and development of cardiovascular risk screening tool
TRANSCRIPT

Manuscript 1
Evaluation and Development of Cardiovascular Risk Screening Tool in Rural Tamilnadu IKP Centre for Technologies in Public Health
A2, LP Amsavalli Illam,
7th
Cross Street,
Arulananda Nagar,
Thanjavur – 613 007
Tamil Nadu, India
04362 – 231373
Manuscript 2
1. Introduction
1.1. The Cardiovascular Diseases Epidemic While communicable diseases have been a robust and vibrant sphere of research, outreach, and policy changes in the past century (Sen), only in the past few decades have noncommunicable diseases (NCDs) received similarly significant attention, with a 2008 update on the Global Burden of Disease displayed that 53.8% of all deaths internationally are due to NCDs (Lopez). Many noncommunicable diseases have been linked to lifestyle factors including diet, activity, tobacco and alcohol consumption,
3including cardiovascular disease, cancers, and diabetes
(WHO). The most troubling aspects of the NCD epidemic lies in these factors, each of which are often linked to sociopolitical and personal aspects of individual lifestyles and therefore alterable, unlike the majority of genetic diseases or communicable diseases. Beyond mortality, the World Health Organization reports that the disability adjusted life years (DALYs), or years of life lost due to death from disease and years of productivity lost due to disease-caused disability will be 153 million, where one DALY equals one year of life lost, by 2010 because of cardiovascular diseases and represent 10.4% of all DALYs globally (McKay). In India, this number is significantly higher than developed countries and is projected to rise from less than 25 million in 1990 to approximately 35 million by 2020 (Mirzaei). The burden of NCDs is exacerbated by the observation that the peak prevalence of NCDs occurs at a younger age in Indian populations than in developed countries (Joshi). This takes a huge socioeconomic toll, as these deaths predominantly affect the primary income earners or caregivers in a household. NCDs also impose a huge economic burden on the country. In 2004, Indians spent nearly INR 846 billion out of pocket on healthcare expenses, with NCDs contributing to 47.3% of this cost. The authors report that assuming that all caregivers and sick individuals above the age of 15 years were productive yielded an annual income loss of INR one trillion, one third of which were due to cardiovascular diseases. If NCDs were completely eliminated, the estimated GDP increase in such a year would be between 4 – 10% (Mahal). Of these NCDs, cardiovascular disease has risen to be the largest cause of death internationally first in developed countries from the 1990s onwards and second, in the developing world by 2001 with a 50% of deaths in developed countries and 28% of deaths in developing nations traced back to cardiovascular disease (Mathers). These cost of NCDs is immense both in terms of international economies and in lifestyle changes: a 2007 study published in the Lancet estimates the financial cost of implementing and scaling prevention and treatment regimens for cardiovascular disease to avert approximately 17.9 million deaths and cost approximately 47 million USD, broken down into $1.08 per head ($0.43-0.90 in low income countries) (Lim). Much of this is linked to the stage of development that countries are in, as those countries in the earliest stages have nutritional deficiency and infectious disease related disorders listed as very high and regions at a later stage of development listed as displaying higher rates of heart disease and stroke at a young age, a phenomenon linked to altered diets and lifestyles in more developed countries (Yusuf). The cardiovascular disease epidemic in India is stark and present. In so far as the three largest risk factors are concerned—hypertension, hyperlipidemia, and diabetes, India has massive prevalence of these disorders in both urban and rural communities. A cumulative projected underestimate of hypertension predicts that hypertension affects 25% of urban and 10% of rural individuals in India, with 31.5 million hypertensive individuals in rural communities and 34 million in urban (Gupta). No such comprehensive study exists to predict the prevalence for hyperlipidemia, though an urban study reports increased levels of cholesterol values, particularly for hyperlipidemia (Gupta, Guptha). Finally, for diabetes, India has been termed the “diabetes capital of the world” and has the largest number of diabetic patients internationally, where phenotypic differences in the Indian population including “insulin resistance, greater abdominal adiposity, or higher waist circumference despite lower body mass index” place Indians at high risk for type 2 diabetes (Mohan). This phenomenon has been seen even in South Asians in the diaspora who display similarly high rates of cardiovascular disease in comparison to their Caucasian counterparts (Goyal). Together, these create a cardiovascular disease nightmare, where millions are at a massive risk for days lost due to disability (DALYS) due to
Manuscript 3
this disease. Indeed, approximately 30% of deaths and 13% of DALYs in India are projected to be caused by cardiovascular diseases and diabetes and where onset in India of CVD is significantly lower by an estimated 10 years (Reddy). Early detection through low-cost screenings to identify disease onset and risk factor prevalence is crucial to put vulnerable populations on a treatment plan as quickly as possible and in a cost-effective way both for low and middle-income communities and for the individuals affected by such diseases. 1.2. Risk Screening for CVD
In 2008, the World Health Organization introduced the STEPS manual for chronic disease screening in the wake of NCD prevalence rising internationally at such a high rate. The STEPS manual is designed to offer a clear methodology for how to implement “chronic disease risk factor surveillance” in a region and for a specific disease (WHO Steps). In this, the main chronic diseases that can be traced to common risk factors have been identified as heart disease, stroke, cancer, chronic respiratory diseases, and diabetes and can be distinguished from other diseases due to their long-term treatment regimen, possibilities for highly effective prevention regiments, and the great time involved in disease onset. More disturbing is as discussed above, the predicted rates of chronic disease burden specific to low and middle-income countries was 60% of deaths in 2005 and is expected to rise to 73% by 2020, with 80% of total international chronic disease deaths from low and middle-income countries. The Manual defines a risk factor to be an “attribute, characteristic, or exposure of an individual which increases the likelihood of developing a chronic noncommunicable disease”. Major behavioral risk factors include physical activity, diet, and alcohol and tobacco consumption while biological factors include obesity, hypertension, hyperglycemia, and hyperlipidemia. Each of these has a powerful correlation to decreased quality of life, disability and decreased life expectancy, and ultimately, mortality due to NCD. Furthermore, many of these habits offer significant socioeconomic costs to patients, particularly in low and middle income countries.
The STEP-wise paradigm for chronic disease management emerges in three separate phases, or steps, as shown through Figure 1. Each step has a specific series of parameters encapsulated in its module, where the instrument’s three modules should be implemented in chronological manner. Step 1’s core items include biometrics about tobacco and alcohol consumption, fruit and vegetable consumption, and levels of physical activity and can be described as a questionnaire. This often will include medical history of blood pressure and diabetes and can be expanded to include demographic information. The World Health Organization has categorized this as information that most countries should collect in a “questionnaire” style; this questionnaire can be delivered by data collection staff. Simultaneously, the WHO suggests that countries simultaneously collect measurements and biodata in the Step 2 module with the same data collection workers, including parameters of height, weight, waist and hip circumference, blood pressure, and heart rate, where heart rate and hip circumference will provide meaningful data about obesity and physical fitness. Ideally, both of these will be implemented by most countries and by data collection workers that will be trained in
accumulating such data reliably. As these are noninvasive, these two modules of screening represent the most financially accessible and so powerful for screening individuals at high risk out of the general population.
The third step involves a measure of biochemical parameters, but as a result, also has within it significant cost if screening is to be implemented on a national level. In addition, the collection of biochemical parameters both requires significant human resources investment and is suggested only for countries that would need to “detect the prevalence of diabetes and raised cholesterol levels” for blood glucose and total cholesterol levels, while countries that would require further information about “lipid profiles as a risk factor for cardiovascular disease” will include triglycerides and LDL cholesterol levels in their level three screening. The manual advises this protocol be implemented primarily for individuals who have been filtered out by steps 1 and 2 as at risk to lower costs and
Figure 1. WHO STEPwise approach to risk surveillance

Manuscript 4
participant burden. Indeed, the addition of this third step to surveys often means that the “cost of collection, analysis, and presentation of the information escalates” and “Step 3 core generally doubles the cost of the survey”. In addition, as Steps 1 and 2 are both recommended to be implemented in a household and informal setting, they present lower costs for sites, while Step 3 is recommended to be in a clinical environment because of hygienic considerations, quality of test results, and accuracy of diagnostics. Such a screening mechanism has been utilized internationally to craft various risk scores for diseases across the world. For cardiovascular disease, specifically, there has been no risk tool crafted to date. For diabetes, one of the largest risk factors for CVD, there has been a robust international effort to craft and implement risk tools that have been tested in various populations. Most powerful of these tools have been the Cambridge Risk Score and the Finnish Risk Score, both scores developed in a Western European context to evaluate and weight different risk factors for diabetes (Lindstrom) and has been validated in a variety of contexts, with the Finnish Risk Score having been validated both in Europe and Australia (Griffin). Of these and other tools, a study was done to calibrate the Finnish Risk Tool against tools present in Canada and the United States to conclude that there indeed the Finnish Risk Tool currently appears most suitable for Caucasian populations (Schwarz). A similar score was developed and validated in Indian populations at Dr. Mohan’s Diabetes Research Facility (Mohan) in Chennai (India); a description of the risk factors included in each risk score to evaluate diabetes risk are described below in Table 1. Individuals who qualified as positive based on these risk scores are referred for further biochemical testing. However, diabetes presents as one of the largest noncommunicable diseases that then also has a strong correlation to CVD prevalence; no such screening tool has been created or validated with such efficacy for hyperlipidemia and cholesterol, and so no united tool to address the CVD epidemic exists, but is sorely needed in low to middle-income countries where the disease burden has massive consequences. Though various diabetes scores have been developed both within a western context and then through the Indian Diabetes Risk Score for an Indian context, our work on development of risk score for CVD represents an immensely unique method for identifying and then eventually treating patients who are at risk for different risk factors for CVDs. In addition, it presents a community-based initiative that utilizes local talent through training local women to collect Step 1 and Step 2 data.
2. Methods ICTPH in collaboration with Sughavazhvu Healthcare, a local health care provider in Thanjavur, Tamil Nadu, has rolled out its healthcare delivery model to field-test it and to eventually demonstrate its effectiveness in a rural Indian context. In the IKP Centre for Technologies in Public Health (ICTPH) model of primary care, implemented in collaboration with SughaVazhu Healthcare (SV), a well-trained and legally qualified physician, assisted by a locally-hired health extension worker (HEW), provides the broadest possible range of healthcare services taking the disease burden into account (Johar). In addition to treatment for acute conditions, these include dental fillings and scaling, cervical cancer screening, vision screening and dispensation of glasses, and management of chronic diseases. Prior to establishment of each of these village-based health centers, the entire catchment population is geo-mapped, and each household issued a bar-coded enrolment ID containing all family details.
Risk Score Age BMI Waist Circumference
Medical History
Family History
Diet Physical Activity
Sex Smoker
Finland X X X X X X
Cambridge Risk Score
X X X X X X
Indian Risk Score
X X X X
Table 1: Risk Factors Included in Three Diabetes Risk Scores

Manuscript 5
2.1. CVD Screening at ICTPH A key focus area of the work at ICTPH is opportunistic and proactive screening for CVDs of the entire adult population served by its clinics. The screening process at ICTPH has been designed based on the WHO Stepwise approach of risk surveillance. The step 1 comprises of a administering a questionnaire which include the demography, current tobacco consumption status and current medication status of the individual. Step 2 comprises of administering physical measurements which include the Blood Pressure, Height, Weight, Hip and Waist Circumference of the individual (Table 2). Those who are at risk based on a filtering criteria (described later), calculated as per the data captured on the risk factors are then recommended to undergo a fasting blood test (Step 3) which comprises measurement of the following bio-chemical parameters – Fasting Blood Sugar Test, Fasting LDL, HDL, Total Cholesterol and Triglycerdes. These parameters are then utilized by the physician to identify an individual at a confirmed risk for Diabetes Mellitus and / or Hyperlipidemia. Two approaches are utilized by ICTPH to perform screening for CVDs. The first approach is opportunistic screening of all adults that visit the clinic for any form of treatment. In this case screening is performed by the Health Extension Worker (HEW) who is well trained through an in-house training program conducted by ICTPH. The HEW collects the data and updates the health records (Reference to HMIS document) of the individual. The data entered by them is monitored by an in-house audit team who check for data discrepancy in the backend. Based on the data entered by the HEW, the system generates a risk score and gives the risk status of the individual to the HEW. If the risk status of the individual indicates that the adult should undergo the blood test, then he or she is recommended a blood test and requested to visit the clinic the next day in the morning with 8 hours fasting. In the second approach a Community Health Worker (CHW) visits all households located in the villages that are served by the clinic and administers the screening at the household level. All CHWs are also trained through a 2 week training program conducted by ICTPH. Each CHW carries a mobile handset and captures the risk data against an individual record. Similar the previous case, the risk status and score and generated and individuals at risk are recommended to come to the clinic for a blood test.
2.2. CVD Risk Score at ICTPH
As depicted in Table 2 the following risk factors are included in the screening process – (1) Blood pressure, (2) Personal History, (3) Body-Mass index, (4) Waist to Hip ratio, (5) Tobacco Consumption, and (6) Age. Note that the physical inactivity, family history and alcohol consumption have been left out as they are were identified to be very difficult to accurately capture on the field for rural populations. The risk filtering criteria currently followed by ICTPH is the following: (1) If the risk status based on either of the first two (Blood Pressure, SBP>=140 or DBP >=90; and Personal History reported Yes for either Diabetes, Blood Pressure or High Cholesterol) are positive, individuals are considered eligible to undergo step 3. (2) Of the
Table 2. Risk Assessment Activity at ICTPH based on WHO STEPwise approach to risk surveillance
Step 1: Questionnaire
Demography Age, Sex
Tobacco Consumption Current Chewing / Smoking status
Personal History of CVD or Diabetes Current medication status
Step 2: Physical Measurements
Blood Pressure Systolic and Diastolic BP
Obesity Height, Weight, Waist Circumference, Hip Circumference
Step 3: Biochemical Parameters
Diabetes Fasting Blood Sugar
Blood Lipids LDL, HDL, Triglycerides, Total Cholesterol

Manuscript 6
remaining four risk factors (Age > 40 years, BMI > 23 kg/m2,WHR > 0.81 for women, >0.88 for men, Tobacco
consumption status – Yes), the presence of two risk factors makes the individual eligible to undergo step 3. An individual is considered be diseased for Diabetes or Hyperlipidemia if either the Fasting Blood Glucose Value >=126 mg / dl or the Fasting LDL value >=160 mg/dl. As evident, the above is a linear risk score which assigns equal weight to multiple risk factors and there is no gradation while considering the same risk factor (that is people with age 40 are considered at an equal risk to people with age 60). This prompted us to do a thorough study of the efficacy of the current risk score and look at development of alternate risk scores. We have analyzed the current risk score by conducting a regressions study based on the data on risk factors and corresponding biochemical parameter values. 2.3. Evaluation of ICTPH’s Risk Score
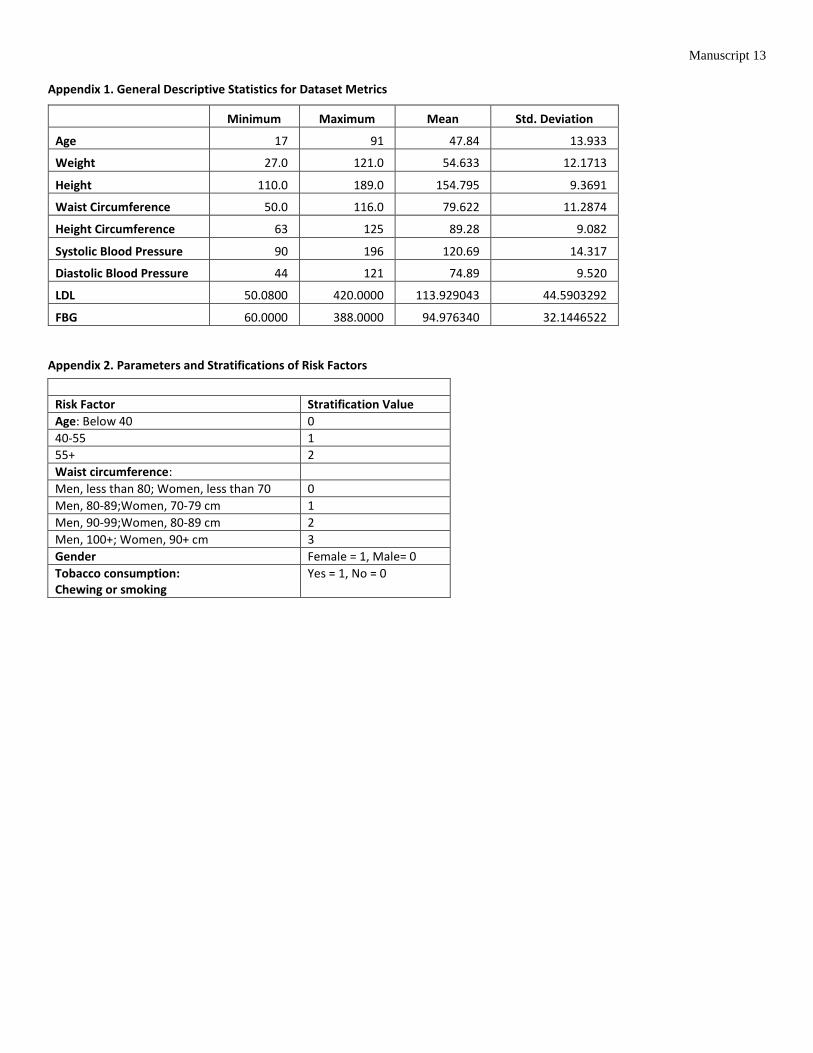
The total samples considered in the analysis are 1011. Our dataset comprises of two sources – (1) Data collected from opportunistic screening performed at the seven clinics from 2010 to 2013 and the corresponding biochemical parameters (660), (2) The data from Rapid Risk Assessment Exercise conducted in 2013 in Andipatti clinic (351) as shown in Table 3. The total initial sample set was 1313. 188 individuals with blood pressures, weights, or measurements below medically acceptable parameters as defined by the World Health Organization were dropped as unreliable and incorrect data that the minimums and maximums for all measurable values are defined in Appendix 1. 114 people had reported a previous history of Daibetes, which were further excluded from the sample set.
Data Sources Sample Set
Risk Assessment Exercise 351
Opportunistic Screening at the Clinics 660
Total 1011
Table 3. Sources of the data used to conduct evaluation ICTPH risk screening tool for CVD.
The parameters used for evaluation of risk screening tools are the following – sensitivity, specificity, positive predictive value, negative predictive value and accuracy. Sensitivity represents the number of diseased individuals the test correctly predicts and can be calculated by dividing the number of true positives by total number of diseased individuals, or the sum of true positives and false negatives. Specificity represents the number of non-diseased individuals the test correctly predicts, or true negatives divided by the sum of true negatives and false positives. Positive predictive value identifies how many diseased individuals are correctly predicted out of those screened as positive by the screening test, while the negative predictive value identifies how many healthy individuals are correctly predicted out of those screened as negative. Accuracy is the total number of correctly identified patients by the screening test divided by the sum total of patients in the dataset (Cheatham). An ideal risk screening tool has a high sensitivity and specificity which is as close to 1 as possible. Based on ICTPH dataset, the above metrics for the current risk tool have been depicted in Table 4.The current tool has a low specificity (23%), reflecting a high number of false positives and hence a loose filtering criteria. The tool only positively predicted 23.5% of people as accurately at risk, and therefore with an immensely high number people undergoing unnecessary blood tests. The tool has a high sensitivity (88%) and is able to identify a high percentage of people who are diseased at risk correctly.
Sensitivity 88%
Specificity 23%
Positive Predictive Value 23.5%
Negative Predictive Value 87.4%
Accuracy 37.0%
Table 4. Evaluation metrics for the current CVD risk score by ICTPH

Manuscript 7
2.4. Alternate Risk Score Table 5 lists the dependent and independent variables used for performing a regression study for development of alternative risk scores. Logistic regression analysis was run upon each variable against disease status, where individuals were considered diseased if tested positive for diabetes or high cholesterol, or with a fasting blood glucose level greater than or equal to 126 mg/dl or low-density lipid level greater than or equal to 160 mg/dl. A variety of variables were tested both as continuous numerical or stratified values as in Appendix 2, with the predicted risk score from each regression then utilized with disease status to calculate a receiver operating curve, which measures a variety of thresholds for risk scores by plotting true positives against false positives, or sensitivity versus 1- specificity (Kumar) . A maximum area underneath the curve, or an area as close to 1 as possible, reflects that both sensitivity and specificity have been maximized for this specific risk score at a specific threshold of disease risk. The algorithm for the risk score is displayed in Figure 1, where each coefficient is assigned to a parameter and variable for n number variables.
Independent Variables Dependent Variables
BMI Disease Condition Status
Waist Circumference
Diabetes Mellitus (Based on FBG Values) Waist / Hip Circumference Ratio
BP (Systolic / Diastolic)
Diabetes History
BP History Hyperlipidemia (Based on Fasting LDL Values) Tobacco Consumption Status
Age
Table 5. Independent and Dependent Variables used in the regression analysis for development of a risk score for diabetes and hyperlipidemia.
3. Results The final calculated ICTPH cardiovascular disease risk score is described below, where each variable has been given a specific weight as calculated by the multivariate regression model; the risk score was selected where the regression maximized the area under the ROC curve and therefore test sensitivity and specificity for risk screening, as seen below in Figure 2. A positive beta coefficient reflects that the factor in case is correlated to an incidence of the disease, while a negative beta coefficient reflects that the factor may indeed protect for the disease. As such, the beta coefficient for each of these is positive, reflecting incidence of disease is indeed correlated to presence of the risk factor. For age, the beta coefficient for age from 40 to 54 years of age was 0.528, and above 55 was 0.773; for waist circumference, the first category of abdominal adiposity had a beta coefficient of 0.519, second of 0.614, and third of 0.734, displaying a clear trend that as age and abdominal adiposity increases, so too does risk for hyperlipidemia and hyperglycemia and correspondingly, cardiovascular disease risk. The odds ratios for each of these categories are higher than one and do not include 1 in their confidence intervals, which reflects a higher likelihood or odds of each individual in these categories of cultivating cardiovascular disease.

Manuscript 8
Beta Coefficient
Odds ratio
95% Confidence Interval
Lower Upper
Gender (1= Female) .103 1.108 .773 1.588
Waist circumference (cm)
Men, 80-89;Women, 70-79
.519 1.681 1.054 2.681
Men, 90-99;Women, 80-89
.614 1.848 1.138 3.001
Men, 100+; Women, 90+
.734 2.084 1.141 3.805
Tobacco Consumption .182 1.200 .835 1.722
Age (years)
40-54 years old .528 1.695 1.077 2.668
55+ years old .773 2.166 1.352 3.469
Constant -2.673 .069
Area under ROC Curve 0.611 -- 0.567 0.655
Table 5. Regression Statistics for ICTPH Revised CVD Risk Score
Unlike these, tobacco consumption, though with a positive beta coefficient, has a statistically insignificant odds ratio; however, including tobacco consumption shows a statistically significant change in the score’s efficacy. Similarly, being female appears to correlate to a higher disease incidence, but has a statistically insignificant odds ratio and still shows a dramatic change in the score’s efficacy and so was retained.
The final risk score and beta coefficient shave been detailed in Table 6 and Figure 3.
Figure 2. ROC Curve for ICTPH CVD Revised Score
Manuscript 9
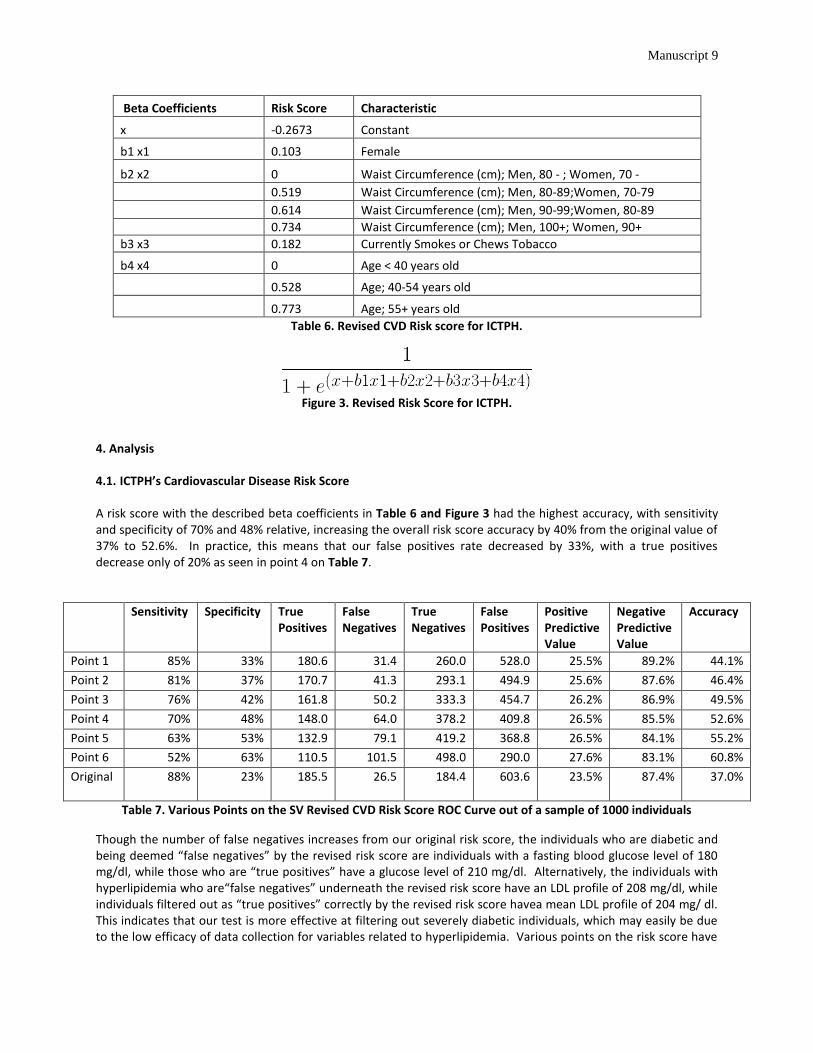
Beta Coefficients Risk Score Characteristic
x -0.2673 Constant
b1 x1 0.103 Female
b2 x2 0 Waist Circumference (cm); Men, 80 - ; Women, 70 -
0.519 Waist Circumference (cm); Men, 80-89;Women, 70-79
0.614 Waist Circumference (cm); Men, 90-99;Women, 80-89
0.734 Waist Circumference (cm); Men, 100+; Women, 90+
b3 x3 0.182 Currently Smokes or Chews Tobacco
b4 x4 0 Age < 40 years old
0.528 Age; 40-54 years old
0.773 Age; 55+ years old
Table 6. Revised CVD Risk score for ICTPH.
Figure 3. Revised Risk Score for ICTPH.
4. Analysis 4.1. ICTPH’s Cardiovascular Disease Risk Score
A risk score with the described beta coefficients in Table 6 and Figure 3 had the highest accuracy, with sensitivity and specificity of 70% and 48% relative, increasing the overall risk score accuracy by 40% from the original value of 37% to 52.6%. In practice, this means that our false positives rate decreased by 33%, with a true positives decrease only of 20% as seen in point 4 on Table 7.
Sensitivity Specificity True Positives
False Negatives
True Negatives
False Positives
Positive Predictive Value
Negative Predictive Value
Accuracy
Point 1 85% 33% 180.6 31.4 260.0 528.0 25.5% 89.2% 44.1%
Point 2 81% 37% 170.7 41.3 293.1 494.9 25.6% 87.6% 46.4%
Point 3 76% 42% 161.8 50.2 333.3 454.7 26.2% 86.9% 49.5%
Point 4 70% 48% 148.0 64.0 378.2 409.8 26.5% 85.5% 52.6%
Point 5 63% 53% 132.9 79.1 419.2 368.8 26.5% 84.1% 55.2%
Point 6 52% 63% 110.5 101.5 498.0 290.0 27.6% 83.1% 60.8%
Original
88% 23% 185.5 26.5 184.4 603.6 23.5% 87.4% 37.0%
Table 7. Various Points on the SV Revised CVD Risk Score ROC Curve out of a sample of 1000 individuals
Though the number of false negatives increases from our original risk score, the individuals who are diabetic and being deemed “false negatives” by the revised risk score are individuals with a fasting blood glucose level of 180 mg/dl, while those who are “true positives” have a glucose level of 210 mg/dl. Alternatively, the individuals with hyperlipidemia who are“false negatives” underneath the revised risk score have an LDL profile of 208 mg/dl, while individuals filtered out as “true positives” correctly by the revised risk score havea mean LDL profile of 204 mg/ dl. This indicates that our test is more effective at filtering out severely diabetic individuals, which may easily be due to the low efficacy of data collection for variables related to hyperlipidemia. Various points on the risk score have
Manuscript 10
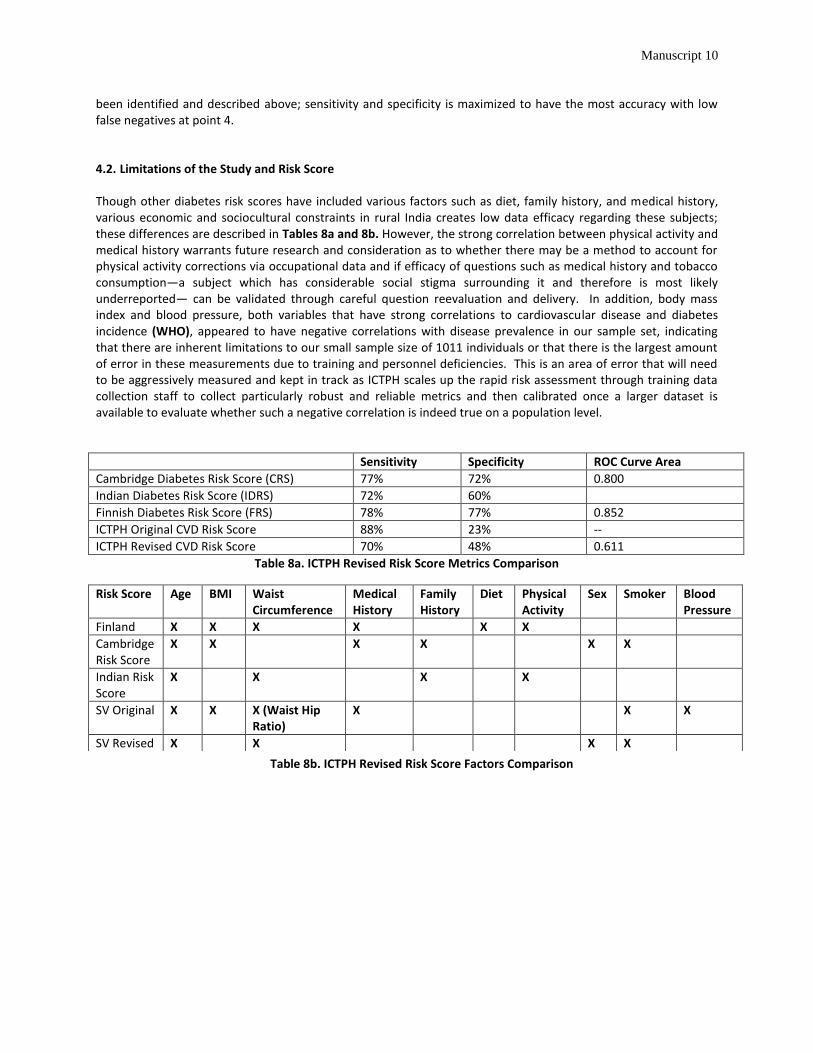
been identified and described above; sensitivity and specificity is maximized to have the most accuracy with low false negatives at point 4. 4.2. Limitations of the Study and Risk Score Though other diabetes risk scores have included various factors such as diet, family history, and medical history, various economic and sociocultural constraints in rural India creates low data efficacy regarding these subjects; these differences are described in Tables 8a and 8b. However, the strong correlation between physical activity and medical history warrants future research and consideration as to whether there may be a method to account for physical activity corrections via occupational data and if efficacy of questions such as medical history and tobacco consumption—a subject which has considerable social stigma surrounding it and therefore is most likely underreported— can be validated through careful question reevaluation and delivery. In addition, body mass index and blood pressure, both variables that have strong correlations to cardiovascular disease and diabetes incidence (WHO), appeared to have negative correlations with disease prevalence in our sample set, indicating that there are inherent limitations to our small sample size of 1011 individuals or that there is the largest amount of error in these measurements due to training and personnel deficiencies. This is an area of error that will need to be aggressively measured and kept in track as ICTPH scales up the rapid risk assessment through training data collection staff to collect particularly robust and reliable metrics and then calibrated once a larger dataset is available to evaluate whether such a negative correlation is indeed true on a population level.
Sensitivity Specificity ROC Curve Area
Cambridge Diabetes Risk Score (CRS) 77% 72% 0.800
Indian Diabetes Risk Score (IDRS) 72% 60%
Finnish Diabetes Risk Score (FRS) 78% 77% 0.852
ICTPH Original CVD Risk Score 88% 23% --
ICTPH Revised CVD Risk Score 70% 48% 0.611
Table 8a. ICTPH Revised Risk Score Metrics Comparison
Risk Score Age BMI Waist Circumference
Medical History
Family History
Diet Physical Activity
Sex Smoker Blood Pressure
Finland X X X X X X
Cambridge Risk Score
X X X X X X
Indian Risk Score
X X X X
SV Original X X X (Waist Hip Ratio)
X X X
SV Revised X X X X
Table 8b. ICTPH Revised Risk Score Factors Comparison
Manuscript 11
5. Conclusions
This study represents the only study of its kind to address the massive problem of cardiovascular disease through a stratified and methodical risk score and screening method. Its merits lie in the fact that it effectively screens out individuals who have a high propensity to either condition and place them on a treatment regimen to reduce both their current disease symptoms and any possible future cardiovascular disease. In addition, through focusing on a low-cost implementation of Steps 1 and 2, it represents a grassroots sustainable community-based effort through training local villagers to take ownership over their community’s health outcomes and has significantly less costs involved than a large-scale Step 3 screening may require and more significantly, the possible health and DALYs costs to local populations were CVD and diabetes to remain untreated. Indeed, the most crucial aspect of this study is the fact that it identifies undiagnosed hyperlipidemia, hypertension through repeated blood pressure tests and a successive blood test, and diabetes mellitus in populations who lack reliable access to both screening and treatment regiments but are often the groups most hard hit if struck with illness of this severity at a cost that is sustainable if it were to be implemented on a larger scale. ICTPH’s next steps will be to scale up this current risk score through their current clinics and ultimately launch a longitudinal validation study to create an even more nuanced and honed risk tool over many years and with a larger dataset to screen rural South Indian populations for cardiovascular disease, and then to develop a plan of treatment regiments that will be effective interventions to lower the disease burden of affected individuals once they have been diagnosed by clinicians as at risk for CVD due to their status as diseased with either hyperlipidemia, hypertension, or diabetes.
Manuscript 12
References 1. Cheatham, M. A Practical Guide to Biostatistics. Chapter 4. Orlando Healthcare Network, 2010,
surgicalcriticalcare.net. 2. Goyal A, Yusuf S. The burden of cardiovascular disease in the Indian subcontinent. Indian J Med Res. 2006
Sep;124(3):235-44. Review. PubMed PMID: 17085827. 3. Gupta R, Guptha S, Agrawal A, Kaul V, Gaur K, Gupta VP. Secular trends in cholesterol lipoproteins and
triglycerides and prevalence of dyslipidemias in an urban Indian population. Lipids Health Dis. 2008 Oct 24;7:40. doi: 10.1186/1476-511X-7-40. PubMed PMID: 18950504; PubMed Central PMCID: PMC2579290.
4. Gupta R. Trends in hypertension epidemiology in India. J Hum Hypertens. 2004 Feb;18(2):73-8. Review. PubMed PMID: 14730320.
5. Gupta, R. P. (1997). Cholesterol lipoproteins, triglycerides, rural-urban differences and prevalence of dyslipidaemia among males in Rajasthan. Journal of Association Physicians India 45(4), (pp. 275-279).
6. Joshi, R. C. (2006). Chronic diseases now a leading cause of death in rural India—mortality data from the Andhra Pradesh Rural Health Initiative. . (pp. 1522-1529). International Journal of Epedimiology 35.
7. Kumar, R and Indrayan, A. “Receiver Operating Characteristic Curves for Medical Researchers.” Indian Pediatrics. Volume 48, April 17
th, 2011.
8. Lim SS, Gaziano TA, Gakidou E, Reddy KS, Farzadfar F, Lozano R, Rodgers A. Prevention of cardiovascular disease in high-risk individuals in low-income and middle-income countries: health effects and costs. Lancet. 2007 Dec 15;370(9604):2054-62. Epub 2007 Dec 11. Review. PubMed PMID: 18063025.
9. Lopez AD, Mathers CD, Ezzati M, Jamison DT, Murray CJL. Measuring the Global Burden of Disease and Risk Factors, 1990–2001. In: Lopez AD, Mathers CD, Ezzati M, Jamison DT, Murray CJL, editors. Global Burden of Disease and Risk Factors. Washington (DC): World Bank; 2006. Chapter 1. PubMed PMID: 21250376.
10. MacKay J, Mensah GA. The Atlas of Heart Disease and Stroke. Mensah editor. Geneva, Switzerland: World Health Organization; 2011. Chapter 25, The Future of CVD; p.74-5.
11. Mahal, A. K. (2010). The economic implications of non-commmunicable disease for India. Health, Nutrition, and Population (HNP) Discussion Paper. . Washington DC: World Bank .
12. Mathers CD, Lopez A, Stein C. Deaths and Disease Burden by Cause: Global Burden of Disease Estimates for 2001 by World Bank Country Groups. Disease Control Priorities Project Working Paper 18. 2001 ; Bethesda, MD.
13. Mohan V, Venkatraman JV, Pradeepa R. Epidemiology of cardiovascular disease in type 2 diabetes: the Indian scenario. J Diabetes Sci Technol. 2010 Jan 1;4(1):158-70. Review. PubMed PMID: 20167181; PubMed Central PMCID: PMC2825638.
14. Schwarz PE, Li J, Lindstrom J, Tuomilehto J. Tools for predicting the risk of type 2 diabetes in daily practice. HormMetab Res. 2009 Feb;41(2):86-97. doi: 10.1055/s-0028-1087203. Epub 2008 Nov 19. Review. PubMed PMID: 19021089.
15. Sen K, Bonita R. Global health status: two steps forward, one step back. Lancet. 2000 Aug 12;356(9229):577-82. PubMed PMID: 10950247.
16. Srinath Reddy K, Shah B, Varghese C, Ramadoss A. Responding to the threat of chronic diseases in India. Lancet. 2005 Nov 12;366(9498):1744-9. PubMed PMID: 16291069.
17. WHO. The World Health Report: Making a Difference. 1999 18. World Health Organization (2006). WHO STEPS Stroke Manual: The WHO STEPwise approach to stroke
surveillance. 19. Yusuf S, Reddy S, Ounpuu S, Anand S. Global burden of cardiovascular diseases: part I: general considerations,
the epidemiologic transition, risk factors, and impact of urbanization. Circulation. 2001 Nov 27;104(22):2746-53. Review. PubMed PMID: 11723030.
20. Z Johar, N. M. (2012). Reimagining Health Systems (An Overview Note). Retrieved from http://ictph.org.in/blog/from-the-president-zeenas-note/ictph-%E2%80%93-reimagining-health-systems-an-overview-note/
Manuscript 13
Appendix 1. General Descriptive Statistics for Dataset Metrics
Appendix 2. Parameters and Stratifications of Risk Factors
Minimum Maximum Mean Std. Deviation
Age 17 91 47.84 13.933
Weight 27.0 121.0 54.633 12.1713
Height 110.0 189.0 154.795 9.3691
Waist Circumference 50.0 116.0 79.622 11.2874
Height Circumference 63 125 89.28 9.082
Systolic Blood Pressure 90 196 120.69 14.317
Diastolic Blood Pressure 44 121 74.89 9.520
LDL 50.0800 420.0000 113.929043 44.5903292
FBG 60.0000 388.0000 94.976340 32.1446522
Risk Factor Stratification Value
Age: Below 40 0
40-55 1
55+ 2
Waist circumference:
Men, less than 80; Women, less than 70 0
Men, 80-89;Women, 70-79 cm 1
Men, 90-99;Women, 80-89 cm 2
Men, 100+; Women, 90+ cm 3
Gender Female = 1, Male= 0
Tobacco consumption: Chewing or smoking
Yes = 1, No = 0