evaluation and control of occupational health risks from nanoparticles
TRANSCRIPT


TemaNord 2007:581
Evaluation and control of occupational health risks from nanoparticles Thomas Schneider et al.
Evaluation and control of occupational health risks from nanoparticles TemaNord 2007:581 © Nordic Council of Ministers, Copenhagen 2007
ISBN 978-92-893-1563-0
Print: Ekspressen Tryk & Kopicenter Printed on environmentally friendly paper This publication can be ordered on www.norden.org/order. Other Nordic publications are available at www.norden.org/publications Printed in Denmark Nordic Council of Ministers Nordic Council Store Strandstræde 18 Store Strandstræde 18 DK-1255 Copenhagen K DK-1255 Copenhagen K Phone (+45) 3396 0200 Phone (+45) 3396 0400 Fax (+45) 3396 0202 Fax (+45) 3311 1870 www.norden.org
Nordic co-operation
Nordic cooperation is one of the world’s most extensive forms of regional collaboration, involving Denmark, Finland, Iceland, Norway, Sweden, and three autonomous areas: the Faroe Islands, Green-land, and Åland.
Nordic cooperation has firm traditions in politics, the economy, and culture. It plays an important rolein European and international collaboration, and aims at creating a strong Nordic community in a strong Europe.
Nordic cooperation seeks to safeguard Nordic and regional interests and principles in the global community. Common Nordic values help the region solidify its position as one of the world’s most innovative and competitive.

Content
Preface................................................................................................................................ 7 Summary ............................................................................................................................ 9 1. Introduction .................................................................................................................. 13
1.1 Terminology......................................................................................................... 14 1.2 The many shapes and structures of nanoparticles................................................. 15 1.3 Nanomaterials ...................................................................................................... 16
2. Manufacturing and uses of nanoparticles in the Nordic countries ................................ 23 2.1 Introduction .......................................................................................................... 23 2.2 Denmark............................................................................................................... 23 2.3 Finland ................................................................................................................. 24 2.4 Iceland.................................................................................................................. 29 2.5 Norway................................................................................................................. 30 2.6 Sweden ................................................................................................................. 33
3. Physical characterization .............................................................................................. 39 3.1 Introduction .......................................................................................................... 39 3.2 Characterization of pigment grade and ultrafine TiO2 and fumed silica............... 41 3.3 Dustiness of powdered, granular or pelletized nanomaterials .............................. 43
4. Assessment of exposure and control measures ............................................................. 49 4.1 Introduction .......................................................................................................... 49 4.2 The COSHH Essentials concept ........................................................................... 50 4.3 REACH scenarios ................................................................................................ 51 4.4 Modelling ............................................................................................................. 52 4.5 Dose ..................................................................................................................... 54 4.6 Control approaches............................................................................................... 55 4.7 Some specific points............................................................................................. 59
5. Workplace exposure data.............................................................................................. 63 5.1 Introduction .......................................................................................................... 63 5.2 Ultrafine particles ................................................................................................. 64 5.3 Engineered nanoparticles...................................................................................... 67 5.4 Background concentration.................................................................................... 68
6. Specific exposure scenarios.......................................................................................... 69 6.1 Introduction .......................................................................................................... 69 6.2 Welding................................................................................................................ 69 6.3 Exposure to amorphous SiO2 fume in smelters .................................................... 70 6.4 Paint manufacturing ............................................................................................. 71 6.5 Paint and lacquer sanding..................................................................................... 71 6.6 Textile manufacturing .......................................................................................... 72 6.7 Spraying (surface treatments)............................................................................... 73 6.8 Nanoscale surface coating .................................................................................... 74 6.9 Production of metal oxide nanoparticles (laboratory scale).................................. 74 6.10 Handling of carbon nanotubes............................................................................ 75 6.11 Laboratory handling of nanopowders ................................................................. 75 6.12 Failure testing and demolition of carbon nanotube-doped concrete ................... 75 6.13 Ski waxing.......................................................................................................... 77 6.14 “Consumers” exposed to sprays ......................................................................... 78
7. Occupational exposure during entire life cycle............................................................. 81 8. Quality of information in MSDS .................................................................................. 83

6 Evaluation and control of occupational health risks from nanoparticles
8.1 Introduction...........................................................................................................83 8.2 The MSDS ............................................................................................................84 8.3 Results in brief ......................................................................................................84 8.4 Discussion.............................................................................................................85
9. Trends in uses of nanoparticles .....................................................................................87 References.........................................................................................................................89 Resume .............................................................................................................................93

Preface
Rapid growth in the nanoparticle industry is anticipated in the Nordic countries owing to highly focused national research and investment initia-tives. This technological development should not compromise health and safety of workers and the general public, but national research initiatives are lagging behind. All Nordic countries have targeted research and de-velopment programs on nanoparticles, nanosurfaces and nanostructures in industry or at universities and other research laboratories. Only a minor part of this research addresses health risks.
This report presents data for evaluation and control of occupational health risks from nanoparticles that has been obtained in the Nordic Council of Ministers project No. 411050-60091. Focus has been on expo-sure by inhalation. Working environment researchers from all Nordic countries have worked together to produce this report. The contributors have been
Thomas Schneider, National Research Centre for the Working Environ-ment, Copenhagen. Editor Anders Jansson, Department of Applied Environmental Science, Stock-holm University Keld Alstrup Jensen, National Research Centre for the Working Envi-ronment, Copenhagen Vidir Kristjansson, Administration of Occupational Safety and Health, Reykjavik Marita Luotamo, Finnish Institute of Occupational Health, Helsinki Olle Nygren, National Institute for Working Life, Umeå Kai Savolainen, Finnish Institute of Occupational Health, Helsinki Vidar Skaug, National Institute of Occupational health, Oslo Yngvar Thomassen, National Institute of Occupational health, Oslo Antti Tossavainen, Finnish Institute of Occupational Health, Helsinki Timo Tuomi, Finnish Institute of Occupational Health, Helsinki Håkan Wallin, National Research Centre for the Working Environment, Copenhagen Thomas Schneider Copenhagen, July 2007


Summary
Applications of engineered nanoparticles are expected to enable huge economic and technological possibilities. Some of these special proper-ties, in particular reactivity, have raised concerns regarding human health. Due to these concerns scientists, regulators, and the industry have initi-ated efforts to gain knowledge about worker exposure and to define safe uses of the different engineered nanoparticles.
The report presents a general overview of nanoparticles and the indus-trial production and uses of nanoparticles in the Nordic countries. A dis-tinction is made between
• Engineered nanoparticles, i.e. particles having a diameter between 1
and 100 nm and intentionally engineered and produced with specific properties, including shape, size, surface properties, and chemistry and
• Utrafine particles, a term that has been used to describe airborne particles smaller than 100 nm. The term “ultrafine” has been in existence longer than “nano”. The term is frequently used for particles that have not been intentionally produced but are incidental products of processes such as combustion and welding. Also several intentionally produced particles with primary particle sizes in the nanosize range (e.g. carbon black, silica fume, and titanium dioxide TiO2) are often called “ultrafine”.
A range of material technologies involve processes that transform con-ventional materials into nanosized particles. As an example thermal sur-face coating by e.g. plasma spraying applies nanoparticles to obtain coat-ings with nanoproperties. Significant number concentrations of nanosized particles are also generated as by-products of conventional processes that involve evaporation/condensation. Welding and laser ablation are such processes.
Engineered nanoparticles include metallic and ceramic nanoparticles, Fullerenes, one of the most well-known nanoparticles, nanotubes, of which the most well-known are the carbon nanotubes, nanofibres, nano-clays, nanocapsules, dendrimers, quantum dots, and nanoclusters. Some high-lights of research, manufacturing, and use of nanoparticles in each Nordic country are presented.
Both granulometry (size distribution) of the powder as is and the abil-ity of the powder to generate airborne dust (dustiness) when handled are essential data for use in risk assessment both for new and existing sub-stances. Annex V of Dir 67/548/EEC does not yet sufficiently cover these testing requirements. In the absence of formal requirements, the project

10 Evaluation and control of occupational health risks from nanoparticles
group has proposed that a first step physical characterization should in-clude particle size, particle morphology, agglomeration state, specific surface area, crystallinity, and elemental composition. Three powders
• an uncoated anatase titanium dioxide pigment • an alumina treated ultrafine rutile titanium dioxide • dry silica fume were characterized according to this scheme. As an example the surface areas were 5.5 m2 g-1 for titanium dioxide pigment, 112 m2 g-1 for ul-trafine rutile titanium dioxide, and 12 m2 g-1 for silica fume.
The very few existing dustiness tests have shown that handling of nano-sized powders tend to generate particles with a size mode below 1 µm, typically 100-300 nm, and one or several size modes above 1 µm. Carbon nanotube powders have been found to generate low number con-centrations.
To further explore dustiness, a new dustiness test was developed that used minimal amount of material and that in a simple manner could bridge the two test principles given in the EN 15051 standard for dusti-ness testing. Tests were performed for the powders ultrafine and pigment grade TiO2 , fumed silica, bentonite, yttrium stabilized zirconia, goethite, two grades of corundum (aloxite F800 and F1200), and talc. All materials generated dust having two size modes above 0.9 µm. All materials except pigment grade TiO2 and aloxite F1200, also generated a size mode in the range from ~100 to ~220 nm. TiO2 pigment grade had the lowest dusti-ness and TiO2 ultrafine the highest dustiness as measured by particle number for both the single drop and rotation test and as measured by mass for both tests combined. The difference was a factor of ~300. A similar large difference in exposure potential can be expected. This would imply that preventive measures would have to be much stricter if pigment grade TiO2 were to be replaced by the ultrafine version. Since aggregates of ultrafine TiO2 can brake up in the lung fluid and assuming particle number matters, the potential risk would even be larger. The results indi-cated also that when handling nanosized powders, the generated airborne particles are not single nanoparticles but agglomerates.
There is a wide gap in information on the risks to specify which levels of control are required and thus to provide guidance on choice of proper control measures. However, several approaches developed for conven-tional materials provide a conceptual framework for describing and ana-lysing exposure scenarios and specific control approaches for nanomate-rials. These include control banding and exposure modelling. These con-cepts are described. The project group is of the opinion that the engineering control techniques of nanoparticle exposure can build on the knowledge and experience from current exposure control of aerosols which already today has been applied to aerosols containing ultrafine

Evaluation and control of occupational health risks from nanoparticles 11
particles such as e.g. welding fume, carbon black, or viruses. Effective techniques can be obtained by adaptation and redesign of current tech-nology. This applies to techniques for general ventilation, industrial ven-tilation, local and process ventilation, containments and enclosures, and filtration.
Also occupational hygiene assessment of workplaces can follow exist-ing methods. One exeption is that even extremely high concentrations of nanoparticles may not be visible to the naked eye, and thus sensitive par-ticle detectors, such as condensation particles may have to be used.
There are currently no national or international consensus standards on measurement techniques for nanoparticles at the work place. This has constrained generation of exposure data and existing data on occupational exposure to engineered nanoparticles are very limited. Monitoring expo-sure by inhalation to nanoparticles presents some unique challenges. Most exposures will be in the form of aggregates. No simple measure-ment approach is at hand for assessing the degree of agglomeration of airborne particles and the potential break up into many smaller units in the lung fluids after inhalation
High background concentrations of ultrafine particles are ubiquitous. At present there are only two approaches available for separating between engineered nanoparticles and background particles of the same size range for use outside the research laboratories. One is by intelligent design of sampling strategies. The other is to collect particles on suitable substrates for later analysis in the laboratory using time consuming electron micros-copy.
In order to put exposure to engineered nanoparticles into perspective, exposures to ultrafine particles for some selected scenarios is presented. Particle number concentrations can range from over 10 000 000 particles cm-3 for laser welding to concentrations of the order 1 000 to 10 000 par-ticles cm-3 for bagging ultrafine powders.
One aim of the project was to collect examples of specific engineered nanoparticle exposure scenarios. However, very few scenarios were available for study, an experience also gained by colleagues in other European countries. The presented data for characterizing exposure sce-narios is thus variable and limited in extent. General conclusions regard-ing exposure risk thus cannot be drawn.
Due to lack of existing information, the project group could not mean-ingfully assign likelihood and intensity of occupational nanoparticle ex-posure for representative exposure scenarios during a life cycle.
The quality of information provided in Material Safety Data Sheets for nanoparticles was investigated. Materials were chosen with primary par-ticle sizes as small as possible, to reflect a range of properties. The mate-rials categories (number) were: silica (8), titanium dioxide (4), zirconium dioxide (2), carbon nanotubes (11), C60 Fullerenes (2), and cadmium-based quantum dots (3).

12 Evaluation and control of occupational health risks from nanoparticles
In general the identification of the substance and the identification of the company were satisfying. Within the groups there was inconsistency in listing of R-phrases. Classification and labelling were many times missing from the MSDS, because there were no test results available for the substance or compound in question. In some cases “nano” was indi-cated in the commercial name of the material. Most of the carbon nano-tube materials were identified as graphite.
The quality of the proposed handling, storage and exposure controls varied much between the MSDS even for materials of the same character. Also the descriptions of physical and chemical properties, conditions and materials to avoid were very different between the MSDS. Some MSDS had well described lists of exposure limit values and toxicity tests. Even for similar materials however the described toxicological properties var-ied. There was very little ecological information in the MSDS.
In general the compounds/materials were practically not tested, and if so, many times for acute toxicity only.
Finally, some information on future trends in production and uses of nanoparticles is presented.

1. Introduction
Engineered nanoparticles have attained marked attention due to their revolutionary properties. Applications of engineered nanoparticles are expected to enable huge economic and technological possibilities. Some of these special properties, in particular reactivity, have raised concerns regarding human health. Due to these concerns scientists, regulators, and the industry have initiated efforts to gain knowledge about worker expo-sure and to define safe uses of the different engineered nanoparticles.
This report begins with a general overview of nanoparticles and the industrial production and uses of nanoparticles in the Nordic countries. The risk of inhalation exposure to potentially highly toxic or high-volume engineered nanoparticles with potentially wide ranges of application dur-ing production and industrial is characterized based on a very limited set of specific exposure scenarios. Contrary to the expectations at the outset of the project, only few industries in the Nordic countries were available for that part of the study. The results of an investigation into the quality of information provided in Material Safety Data Sheets for nanoparticles are reported and the need for revision of safety information is identified. Finally, some information on future trends in production and uses of nanoparticles is presented.
The role of dermal exposure is unclear. It is very likely that systemic exposure will be much less via the dermal than via the inhalation route (Hoet et al., 2004). For local effects little is known whether size in addi-tion to composition is a risk determinant. Dermal exposure thus has not been considered in this report.
The project group decided to not either include the following nano-particles in the report:
• Nanoparticles for pharmaceutical and medical purposes • Use of nanoparticles in the food container industry because this is
subject to special regulation • Nanoparticles used or generated in relation to electronic chip manu-
facturing because workers are well protected in this industry with its production-induced extreme requirements on “particle-free” air.

14 Evaluation and control of occupational health risks from nanoparticles
1.1 Terminology
In this report, the following terms and definitions have been adopted based on NIOSH (2007), SCENIHR (2007), and others: • Nanoscale. Having one or more dimensions of the order of 100 nm or
less. • Nanomaterial. Material with one or more external dimensions, or an
internal structure of 100 nm or less, which could exhibit novel charac-teristics compared to the same material without nanoscale features.
• Nanoparticle. Particles having a diameter between 1 and 100 nm. Na-noparticles may be suspended in a gas (as a nanoaerosol), suspendded in a liquid (as a colloid or nanohydrosol) or embedded in a matrix (as a nanocomposite). The precise definition of particle diameter depends on particle shape as well as how the diameter is measured. For in-stance, carbon fullerenes represent nanoparticles with identical dimen-sions in all directions (spherical), whereas single-walled carbon nano-tubes (SWCNTs) typically form convoluted, fibre-like nanoparticles with a diameter below 100 nm.
• Nanocomposite. Composite in which at least one of the phases has at least one dimension on the nanoscale.
• Nanotechnology. The manipulation of matter on a near-atomic scale to produce new structures, materials, and devices.
• Agglomerate. A group of particles held together by relatively weak forces, including van der Waal forces, electrostatic forces and surface tension.
• Aggregate. A group of particles bonded together by relatively strong forces and thus not easily broken apart.
• Engineered nanoparticle. A nanoparticle intentionally engineered and produced with specific properties, including shape, size, surface pro-perties, and chemistry.
• Ultrafine particle. This term has been used to describe airborne par-ticles smaller than 100 nm. The term “ultrafine” has been in existence longer than “nano”. The term is frequently used for particles that have not been intentionally produced but are incidental products of pro-cesses involving combustion, welding, or diesel engines. Also several intentionally-produced particles with primary particle sizes in the na-nosize range (e.g. TiO2) are often called “ultrafine”.
• Nanoaerosol. A collection of nanoparticles suspended in a gas. The particles may be present as discrete nanoparticles, or as assemblies (aggregates or agglomerates) of nanoparticles. These assemblies may have diameters larger than 100 nm. In the case of an aerosol consis-ting of micrometer-diameter particles formed as agglomerates of na-noparticles, the definition of nanoaerosol is open to interpretation. It is generally accepted that if the nanostructure associated with the nano-

Evaluation and control of occupational health risks from nanoparticles 15
particles is accessible (through physical, chemical, or biological inter-actions), then the aerosol may be considered a nanoaerosol. However, if the nanostructure within individual micrometer-diameter particles does not directly influence particle behaviour (for instance, if the na-noparticles were inaccessibly embedded in a solid matrix), the aerosol would not be considered a nanoaerosol.
• Colloids. A colloid consists of two separate phases: a dispersed phase and a continuous phase. The dispersed phase is made of tiny particles or droplets that are distributed evenly throughout the continuous phase. The size of the dispersed phase particles are between 1nm and 1000 nm in at least one dimension. Homogeneous mixtures with a dispersed phase in this size range may be called colloidal aerosols, colloidal emulsions, colloidal foams, or colloidal dispersions.
1.2 The many shapes and structures of nanoparticles
Specification of particle size in nanomaterials is often given in terms of particle size or specific surface area or both. For spherical particles the specific surface area, A, is given by A=6/(dρ) [cm2 g-1] where d is diameter [cm] and ρ density [g cm-3]. For unit density parti-cles the values in Table 1 are obtained.
Table 1. Small in size, large in number and surface
Size, nm Specific surface area, m2 g-1
Mass concentration, µg m-3
Number concentra-tion, cm-3
Surface concentration, m2 m-3
5 1200 1 15 000 000 12
50 120 1 15 000 1.2
500 12 1 15 0.12 5000 1.2 1 0.015 0.012
There are different approaches for classification of nanoparticles. Table 2 reproduces a proposal given in Luther (2004).
Geometrical particle structure is not an invariant. Some nanoparticle based powders may be designed to contain aggregates of primary nanoparticles, while others are purposely coated to prevent agglomera-tion. Nanoparticles may agglomerate when collected in bulk, and they may de-agglomerate following mechanical impact. It has been hypothe-sized (Maynard, 2002) that some manufacturing processes lead to the formation of primary aggregates (defined as clusters of primary particles held together by partial sintering) that represent the limit of de-agglomeration.

16 Evaluation and control of occupational health risks from nanoparticles
Table 2. Classification of nanomaterials according to Luther (2004).
Classification Examples
Dimension 3 dim < 100 nm 2 dim < 100 nm 1 dim < 100 nm
Particles, quantum dots, hollow spheres Tubes, wires, platelets Films, coatings, multi-layer
Phase composition Single-phase solid Multi-phase solid Multi-phase system
Crystalline, amorphous particles, layers Matrix composites, coated particles Colloids, aerogels, ferrofluids
Manufacturing process Gas phase reaction Liquid phase react. Mechanical
Flame synthesis, condensation, CVD Sol-gel. Precipitation, hydrothermal Ball milling, plastic deformation
Engineered nanoparticles can be manufactured with different coating to obtain specific properties, and this could potentially affect toxicological properties. As an example, TiO2 in sunscreens are coated to suppress the radical formation by photocatalytic action (Moloney et al., 2002). This is a further example illustrating the diversity and complexity of nanoparticle based materials, and thereby the challenges in their proper characteriza-tion for health risk assessment.
1.3 Nanomaterials
Particles in the nanosize range have been generated in vast amounts by established technologies, such as paint pigments, carbon black and silica fume. Such intentionally-produced particles with primary particle sizes in the nanosize range are often called “ultrafine”. Manufacturing of ultrafine TiO2 started in the 1990’ies (Hext et al., 2005). Nanomaterials also in-clude materials manufactured by new methods designed to reduce or better control size relative to the conventional product.
1.3.1 Carbon Black
Carbon blacks are manufactured by thermal oxidative dissociation of hydrocarbons such as mineral oils or natural gases. They consist of ele-mental carbon, but there is a wide variety of products available, depend-ent on the starting materials and method of manufacture. The primary particle size ranges from around 10 nm and upwards.
Carbon blacks are classified according to an internationally recognised system, which signifies the manufacturing process and the jetness (degree of blackness).
• Channel blacks are produced by burning petroleum gases in an
atmosphere deficient in oxygen. This process is not very used because it has disastrous consequences on the environment.

Evaluation and control of occupational health risks from nanoparticles 17
• Furnace blacks are produced by the thermal oxidative process in which hydrocarbon oils are burned in a limited supply of air.
The rubber industry is by far the biggest user of carbon blacks. In com-parison, the paint industry is only a modest user. The printing inks indus-try also uses significant quantities. Finer particle blacks are used for high-quality finishes such as in automotive paints on account of their higher jetness. Medium size blacks are used for intermediate quality paints, whereas the coarser pigments are used for decorative paints.
1.3.2 Silica fumes (SiO2)
Silica fumes (SiO2) is a by-product of the reduction of high-purity quartz during the production of silicon metal or ferrosilicon alloys. The fume, which is condensed from gases escaping from the furnaces, has a very high content of amorphous silicon dioxide (> 99 %), and is made of spherical particles with typical median particle size of 120-150 nm. Originally, it was considered a waste. In Norway recovery began in the 1960’ies (Elkem Materials, 2007). To meet present demands, silica fume is produced on purpose worldwide.
1.3.3 TiO2
The production process for nano TiO2 is cool vaporization while normal TiO2 is produced chemically by the sulphate or the chloride process. Nano TiO2 has a particle size typically of less than 100 nm, while normal TiO2
used as a paint pigment has a median particle size of approx. 300 nm. As the size of the particles reduces to the nanometre scale, new photo-
chemical characteristics occur in the particles. For example, the rutile nano TiO2 particle can block UV light while visible light can pass through. On the other hand, anatase nano TiO2 may have a strong photo-catalytic effect. Supplied with energy by UV-light, electron-cavities can emerge on the surface of the particle, which can oxidize big organic molecules attached to the particle. Therefore, nano TiO2 is applicable in such fields as UV-block sunscreen, UV-block paint, environmental treatment, and in liquids for treatment of transparent wood surfaces. It is also used for self-cleaning material, as an anti-microbial agent, and thus being used in a broad range of traditional industries.
1.3.4 Consumer products
Nanoscale materials are used in consumer products including electronic, cosmetic, automotive, and medical products. It is difficult to determine how many "nano" consumer products are on the market and which mer-chandise could be called "nano". The Woodrow Wilson International

18 Evaluation and control of occupational health risks from nanoparticles
Centre for Scholars (2007) has published an inventory that gives the pub-lic the best available look at the 450+ nanotechnology-based consumer products currently on the market.
1.3.5 Technologies based on nanoparticles
A range of material technologies involve processes that transform con-ventional materials into nanosized particles. As an example thermal sur-face coating by e.g. plasma spraying applies nanoparticles to obtain coat-ings with nanoproperties.
1.3.6 Unintentional production
Significant number concentrations of nanosized particles are generated as by-products of conventional processes that involve evapora-tion/condensation. Welding and laser ablation are such processes. The trend in welding techniques causes the generated fume particles to be-come ever smaller. Also use of metal working fluids can generate consid-erable number concentrations of nanosized particles (Peters et al., 2006). Combustion processes (e.g. in diesel engines and gas burners) are signifi-cant sources of nanosized particles (Kuhlbusch et al., 2004; Kuhlbusch and Fissan, 2006).
1.3.7 Engineered nanoparticles
A broad range of engineered nanoparticles are manufactured on indus-trial, pilot, or experimental scales.
Metallic and ceramic nanoparticles. Metallic nanoparticles consist of single metals while the ceramic nanoparticles include metal oxides, sili-cates, carbides etc. Examples of metal oxides are e.g. pigment (TiO2, ZnO, Fe2O3), sunscreen (TiO2), magnetic storage media (Fe2O3), fillers, coatings, catalysts. The clay mineral montmorillonite (Ca0.5,Na) 0.7(Al,Mg)4[(Si,Al)8O20].nH2O] is an example of a nanosilicate.
Fullerenes. Fullerenes are one of the most well-known nanoparticles. They are hollow constructs of pentagon and hexagon units of carbon at-oms. The first to be described was buckminsterfullerene C-60, named after the architect Buckminster Fuller (Figure 1). Since its discovery in 1985, larger spherical fullerenes have been produced, such as C-70, C-76, C-78 and C-84, and closed tubes based on the fullerene structure. Examples of use: catalysis, pyrolysis, fillers in e.g. tires and building materials, lubricants, solar cells, electrolytic membranes and proton-exchange membranes in fuel cells, oxygen and methane storage materials, drug delivery.

Evaluation and control of occupational health risks from nanoparticles 19
Figure 1. Buckminsterfullerene, C-60 Nanotubes. The most well-known nanotubes are the carbon nanotubes (CNT) being different variations over the fullerene structure. Nanotubes can also be made of boron-nitride, cyclic peptides and proteins. Nano-tubes are produced as long, short, single walled (SWNT), multi walled (MWNT), open, closed, spiral shaped, etc. CNT’s have a tensile strength more than 100 times that of steel, are better thermal conductors than dia-monds, and their electrical conductivity equals that of copper. The theo-retical lower diameter limit for SWNT is 0.4 nm, while the typical diame-ter is 1.2 nm. MWNT have larger diameters, such as about 10 nm for 8-15 walled MWNT (Figure 2).
Examples of use: electron field emitters, hydrogen storage in fuel cells, chemical sensors, biosensors, electromagnetic shielding, super capacitors, lighting technology, polymer composites, fillers, super strong cables, light-weight parts for cars, planes, and space vehicles, and textiles.

20 Evaluation and control of occupational health risks from nanoparticles
Figure 2. Single-walled (top left) and multi-walled (top right) carbon nanotube structures. Multiwalled carbon nanotubes (bottom). Bar length 1000 nm.
Nanofibres. Carbon nanofibres can be either hollow or massive. Their length is typically a few micrometers, and with range from 10 nm to 200 nm. Carbon nanofibres differ from carbon nanotubes by not having a penetrative ordered fullerene structure. Nanofibres can also be made of a wide variety of polymeric materials and with a broad range of chemical composition and fibre diameter and length. Nanofibres made of cellulose polymers or polyurethane can be used for drug delivery. Carbon nanofi-bres are produced in large scale in the USA and the Far East.
Examples of use: drug delivery, filler in technical and construction material, super-strong cables, light-weight automotive parts, and textiles.
Nanoclays. Nanostructured organically modified layer silicates have been used for some time as fillers in polymers, as flame-retardants, and as mechanical reinforcement. They are also used to decrease gas diffusion through foils for packaging and for tennis balls. If used in material for car tyres they may be used in large quantities.
Nanocapsules. Nanocapsules are defined as a nanoparticle that con-sists of a shell and a cavity. The desired substance can be placed in the cavity. Previously, nanocapsules usually consisted of organic substances - phospholipids (the same substance our cell walls are made of) and lipo-somes (fatty tissue), but are increasingly produced from synthetic poly-

Evaluation and control of occupational health risks from nanoparticles 21
mers. Nanocapsules have been produced for many years for medical ap-plication.
Examples of use: medical application, drug delivery. Dendrimers. Dendrimers are controlled-structure multi-branched
polymers with nanoscale dimensions. They can display both hydrophilic and hydrophobic characteristics and can accommodate a wide variety of functional groups for medical applications. They are expected to be used in the medical and biomedical field.
Quantum dots and nanoclusters. These materials represent high vol-ume or soon-to-be high volume materials. Very small metallic nanoparti-cles can also be classified as quantum dots. Normally, quantum dots are inorganic nanocrystals with specific fluorescing, magnetic or electrical properties. There are two types on the market: core dots or core-shell dots. Core dots consist e.g. of CdSe and PbSe, while CdSe/ZnS, CdTe/CdS, HgSe/Fe, and InAs/GaAs are examples of core-shell dots. The slash distinguishes the composition of core and shell. Quantum dots can be made from most semiconductors and pure metals (e.g. Au, Ag, Ni, Co). Quantum tubes and quantum wires are under development.
Examples of use: medical and biological image analysis, energy con-version in solar cells, semiconductor technology, catalysts, magnetic storage.


2. Manufacturing and uses of nanoparticles in the Nordic countries
2.1 Introduction
This section presents some high-lights of manufacturing and use of nanoparticles in the Nordic countries and does not intend to be compre-hensive.
2.2 Denmark
More than 50 enterprises are in the process of developing or establishing production based on nanotechnology. Nanomaterials with new functional properties is one of seven prioritized R&D areas in Denmark (Danish Ministry of Research, Technology, and Development, 2004). Large com-panies, being international leaders in their respective fields are already using nanotechnology. These industries are food, product ingredients, measuring equipment, catalysis, medicine, medico-technology, and ad-vanced engineering and electronics.
An inventory has been made of consumer products on the Danish market that contain nanoparticles or are based on nanotechnology (Stuer-Lauridsen et al., 2007). With the exception of the Association of Danish Cosmetics, Toiletries, Soap and Detergent Industries in Denmark other trade associations (textiles, paint and lacquer, chemical products) re-ported, that there is still limited activity regarding production, formula-tion or import of such consumer products. 243 consumer products were identified and were mainly from the surface treatment, cosmetics, and sports gear markets. 154 of the products were for surface treatment. It had only for 41 of the products been possible to identify the nanomaterial used: cosmetics (zinc oxide 6, titanium dioxide 13, antibacterial silver (textiles and household machines 10), CNT (sports gear 7), and Fullere-nes (cosmetics 5). A corresponding inventory on industrial production and use in Denmark is ongoing.
Haldor Topsoe A/S is a leading manufacturer of catalysts. According to Haldor Topsoe (2007) catalysts are today the most important group of commercial nanomaterials. They will continue to be an important area of nanotechnology enabling solutions to many important resource, energy and environmental problems by tailor-made nanostructured catalysts.

24 Evaluation and control of occupational health risks from nanoparticles
The Danish High Technology Fund supports a major four-year project aimed at developing ”nano-nonwovens”. The project is carried out jointly by the only Danish nonwovens manufacturer, Fibertex A/S based in Aal-borg, and the iNANO centre (Interdisciplinary Nanoscience Centre) based at the University of Aarhus and Aalborg University (Fibertex, 2005). The goal is to employ nanoparticles into so-called nonwovens, which are used for a wide range of purposes such as raw materials for diapers, the furniture and bedding industry, the automotive industry as well as for geotextiles for use in road and harbour construction. The high-technology project will utilise nanotechnology and nanoparticles to give the nonwovens new and unique properties that open entirely new applica-tions. Examples are use of nanoparticles to improve the mechanical and functional properties of the fibres to produce environmentally friendly and fire-retardant materials.
NanoCover Scandinavia is a Danish company established in 2005. It develops and produces a series of products for surface treatment using nanoparticles and other nanotechnologies.
2.3 Finland
The Finnish Institute of Occupational Health, FIOH, has been very active in nanotechnology and related research projects within the last few years. FIOH participates in the NANOSH EU-project as well as the national NANOHEALTH project within the national Finnish Academy funded research-program. Nanotechnology is a very active industrial sector in Finland with more than 100 companies involved in nanotechnology. However, there is still a limited amount of commercial application in Finnish nanotechnology industry. In the report “Nanotechnology in Fin-nish Industry” by Spinverse Consulting Oy, the applications and stages of development shown in Figure 3 were identified. This report will be up-dated later in 2007.
The next sections present a few examples of already existing products and/or strong research activities in Finnish nanotechnology.
Kemira Oy is a premier supplier of TiO2 pigments that provide the best opacity and dispersion for packaging inks, decorative paints and industrial coatings, as well as plastics and paper applications (Figure 4 left, Figure 5 left). The AFDC product range comprises white, opaque, and extra pure Kemira specialty TiO2 for food, drugs and cosmetics ap-plications. Kemira supplies also a UV-TITAN product range comprising several grades of ultrafine, transparent rutile TiO2 used in cosmetics, plastics and coatings applications (Figure 4 right, Figure 5 right).

Evaluation and control of occupational health risks from nanoparticles 25
Figure 3. Nanotechnology in Finnish Industry.
Figure 4. SEM image of AFDC range TiO2-pigment (left) and UV-TITAN range ultrafine TiO2 (right), measure bar is 500nm.

26 Evaluation and control of occupational health risks from nanoparticles
Figure 5. TEM images on AFDC range TiO2-pigment (left) with average particle size of 170nm and UV-TITAN range ultrafine TiO2 (right) with average particle size of 4 nm, measure bar in the images is 50 nm. Montreal Sports Oy manufactures advanced hockey sticks for profes-sional and amateur players. They use low-cost carbon nanotubes, CNT, in epoxy matrix (Figure 6) in large quantities. Amroy Europe Inc. (Finland) is responsible for development of the CNT-epoxy resin.
Figure 6. The basic idea of Hyptonite nano epoxy material (From Antti Valtakari, presen-tation at Nanotech Northern Europe conference in March 2007, Helsinki). The Ecocat company is focused on the development and production of substrates and catalytic converters for petrol and diesel vehicles, small engines, aftermarkets and industrial applications. Ecocat manages the whole process from designing and manufacturing the substrate to active coatings and the assembly of the catalyst or the filters. In addition to ready-coated catalyst solutions, Ecocat also delivers substrates for cus-tomers to be coated. Washcoat characteristics play a major role in con-version efficiency. By modifying the washcoat, catalyst selectivity can be adjusted based on requirements and raw emissions. This enables maxi-mum conversions with minimum use of precious metals. The functioning

Evaluation and control of occupational health risks from nanoparticles 27
of catalytic coatings is based on reactions of precious metals (platinum, palladium, and rhodium) with emissions (Figure 7). As an outcome, car-bon monoxide CO and hydrocarbons HC oxidise into CO2 and water while reducing NOx to nitrogen. Ecocat has fitted the catalytic coatings into three-way, oxidation, and deNOx catalysts for different types of en-gines, fuels and emission limits. Besides diesel, petrol, gas and bio-fuel, Ecocat has tailored its own coating solution for small engines.
Figure 7 TEM-image of air-aged (1000°C) catalyst model material: gamma-alumina washcoat powder with palladium particles (Image taken by M.Vippola).
At Tampere University of Technology there has already for years been active research on developing the manufacturing process for nanopow-ders with liquid flame spray method. In the LFS process, the liquid pre-cursor is atomized into micron-sized droplets, which are introduced into a turbulent H2–O2 flame. Evaporation of the liquid solvent droplets in the flame, followed by decomposition and re-condensation of product spe-cies, finally generates a well-defined, nearly monodisperse nanoparticle material, to be sprayed on a surface or to be collected (Figure 8 and 9). In the process the liquid precursor is fed into the spray gun atomizer with a manually controlled infusion pump. A certain mass flow of precursor can be achieved with several combinations of precursor concentration in liq-uid and liquid feed rate. For producing multicomponent nanoparticles from micron-sized precursor droplets using LFS, in the ideal case, most of the material should be vaporized and, subsequently (either directly or via chemical reactions), nucleated and re-condensed. With this method various different nanopowders can be produced, such as Al2O3, TiO2, Ag-Pd, Fe2O3, Ag, Pd, and ZrO2. This same LFS process with different modi-fications is used also in some Finnish nanotechnology companies: Beneq

28 Evaluation and control of occupational health risks from nanoparticles
Oy uses it mainly for applying functional coatings on glass and ceramic tiles. It is also used for multi-component nanoparticle synthesis. Liekki instead has developed a fibre production technology, Direct Nanoparticle Deposition (DND). The DND technology deposits directly and simulta-neously nanometre sized particles containing both the waveguiding ele-ments and the active ions. This technology avoids the slow and limited process of conventional solution doping. DND technology enables pro-duction of state-of-the-art highly doped fibres that minimize required fibre length, provide strong amplification with broad and flat gain profile, have high efficiency and excellent beam quality as well as reduced photo-darkening and reduced nonlinear effects. Nanoparticle doped fibres have very good usability in terms of splicing properties, temperature and bend-ing characteristics.
Figure 8. Picture taken from the LFS process while producing ZrO2 nanopowder.

Evaluation and control of occupational health risks from nanoparticles 29
Figure 9. TEM-image of ZrO2 nanopowder, measure bar in TEM-image is 50 nm.
Nanoharju is a cluster of Finnish companies using nanotechnology. The companies are particularly experienced in the manufacturing, use and characterisation of nanomaterials and products utilizing these materials. The products that these companies provide include e.g. Atomic Layer Deposition (ALD) equipment and process know-how, real-time particle measurement equipment, industrial equipment for the production of nanomaterials (including nanocoatings), high-purity chemicals as well as high-power active fibres for fibre lasers.1
2.4 Iceland
The Icelandic Alloys Ltd (Íslenska járnblendifélagið EHF) has since 1978 produced ferrosilicon. The production is now about 105 000 tonnes per year. The gases from the furnaces are led through cooling towers and then through a filter system where silicon dioxide dust (SiO2) is collected. The first years the dust was treated as waste. In the late 1980’ies the Icelandic Cement Production Plant (Sementsverksmiðja ríkisins) started to mix SiO2 to the cement to control the pH-value. Later it has been used to strengthen the concrete. Now all the SiO2 produced as by-product is used, a small part in Iceland but most of it is exported. The amount that is pro-duced as by-product is about 18 000 tonnes per year.
• 1 http://www.nanoharju.fi/

30 Evaluation and control of occupational health risks from nanoparticles
2.5 Norway
2.5.1 Engineered nanomaterials
In 2002, the Norwegian Research Council made nanomaterials and nanotechnology a priority through the NANOMAT programme. The pro-ject is one of the three foresight programmes recently undertaken by the Research Council to enhance the expertise in some of the most important future technologies. The project also focuses on how Norway's funding of R&D in materials technology can attain traditional materials. During the project, several future analyses will be carried out, describing the major challenges in the field of materials technology towards 2020. These analyses will form a knowledge base for the Research Council's strategic work with materials technology and nanotechnology.
NANOMAT began in 2002, but the firm n-TEC had already been formed the year before to develop a process for the mass production of carbon nanotubes on a carbon-carbon arc process. Today a small scale commercial production has been established, and research carried on in near collaboration with the IFE (Institute for Energy Technology), situ-ated at Lillestrøm outside Oslo, and this nuclear facility is already well known for its hydrogen storage systems used in alternative fuel systems for motor vehicles. The IFE nano-laboratory houses the region's first pro-duction reactor for nanomaterial, and the research deals with the unique physical, chemical and electrical properties of carbon nanotubes of im-portance for future industrial applications of nanotubes.
FUNMAT (Functional Materials and Nanotechnology) is another high-level nano research project that coordinates cross-disciplinary inves-tigation at the University of Oslo, NTNU (Norwegian University of Sci-ence and Technology), IFE (Institute for Energy Technology), and the industrial and technical research foundation SINTEF.
The modest commercial production of carbon nanotubes at n-TEC/IFE is the only commercial engineered nanoparticle production facility in Norway for the time being. They are exclusively multi–wall nanotubes generated by the arc method which gives the highest quality material. They have diameters ranging ca. 2 - 50 nm and typical length 2 µm (Fig-ure 10 left). N-TEC also collaborates with SINTEF in Trondheim Nor-way for production of Conic Carbon nanoparticles with various shapes, through a plasma process, developed in collaboration with SINTEF. These structures are delivered with maximum base diameter: ca. 1-2 µm and wall thickness: ca. 20 – 50 nm (Figure 10 right).2
• 2 http://www.n-tec.no/

Evaluation and control of occupational health risks from nanoparticles 31
Figure 10. TEM picture of MWCNT (left) and SEM pictures of carbon cones and carbon discs (right). From http://www.n-tec.no
For research and development Nanotubes are also produced at NTNU by a catalytic process basically from CO or CH4. At some industrial research sites in Norway carbon nanofibres are also produced from gas
2.5.2 Ultrafine materials
SiO2 Annually the recovery of this formerly waste fume in the Norwegian sili-con and ferrosilicon industry is around 100 000 tons3. It is now sold as Elkem Microsilica ® as an important reinforcement component mixed in cement. Microsilica is a pozzolana – a term derived from the ancient Italian town of Pozzuli, where volcanic ash was mixed with burnt lime to make cement. This means that it will react with the calcium hydroxide given off by the cement hydration and form more of the calcium silicate hydrate crystal structure that binds concrete together. Because the microsilica is typically over 90% SiO2, the reactive component, it is a very powerful pozzolana. The large surface area and the high content of amorphous sili-con dioxide gives Elkem Microsilica superior pozzolanic properties.
Microsilica has been called the industry's most important new product in the 1990's, and has given civil engineers another tool in the design and construction of structures for the future, due to the durable infrastructure of this cement. Bridge construction (e.g. the Öresund Bridge), marine structures, parking structures, water supply and sewage facilities all bene-fit from the use of microsilica. Likewise, the addition of microsilica gives benefits in fresh concrete properties, improving the rheology for better pumping and stability of the concrete mix. Special concretes like high strength, self-compacting, light weight, shotcrete and low permeability concretes are better made with microsilica4.
• 3 Information obtained from Elkem Materials Sale Department, 2006 • 4 Source: http://www.materials.elkem.com

32 Evaluation and control of occupational health risks from nanoparticles
Elkem Microsilica® is also a key ingredient in advanced low, ultra-low and cement-free castables. It is highly reactive during sintering, which leads to improved ceramic bonding at reduced firing temperatures, and is also employed in mortars, gunning mixes and other unshaped ma-terial. Typical areas of application are within the steel, foundry, cement, glass and ceramic industry. Other areas for use of Elkem Microsilica® are as a grout cement additive and for production of special oil well-drilling reagents, and as an additive in the plastic and rubber industry (PP/PE).
Mn3O4 Fumes during production of Mn-alloys are also recovered to prevent en-vironmental pollution. This fume contains ultrafine particles (median size approx 200 nm) and bulk composition similar to Mn3O4. In two Norwe-gian Mn-alloy smelters approx. 10 000 tons of this fume is recovered and used as an additive to feeds and oil well reagents and as a pigment in brick and ceramic production.
Other At NTNU in Trondheim the Institute of Material Science has installed a spray pyrolysis production unit for nanocrystalline ceramic powders (Figure 11). The production capacity is 1-10 kg powder per day. Of spe-cial interest are the patented LaNbO4, Li2ZrO3 and La2NiO4 powders (Tor Grande, NTNU).
Figure 11. Spray pyrolysis production unit for nanocrystalline ceramic powders at Trondheim the Institute of Material Science.

Evaluation and control of occupational health risks from nanoparticles 33
2.6 Sweden
2.6.1 Introduction
A report from the Swedish Governmental Agency for Innovation Systems states that Sweden has relatively few nanotechnology enterprises in an international perspective (Perez and Sandgren, 2007). In Sweden 85 enter-prises applying nanotechnology to some degree have been identified. Of these 34 may be classified as genuine nanotechnology enterprises with their operation based on nanotechnology. The remaining 51 are enterprises applying nanotechnology to a varying extent to support their operations.
None of the enterprises produce engineered free nanoparticles even if nanoparticles may be present in closed production processes. For instance at the Nanotec Forum, Expo and conference in Stockholm in October 2006 none of the 28 exhibitors or 26 presentations dealt with free engi-neered nanoparticles (including carbon nanotubes).
The Royal Swedish Academy of Engineering Sciences (IVA, 2006) states that Sweden, unlike most developed countries, lacks a national program; in an international perspective Swedish research in nanoscience is ranked relatively high, but the number of nanopatents is relatively low and Swedish research is not commercialized to any considerable degree; and that a proper public debate of the risks of nanotechnology is missing.
In general Sweden has a considerable activity in nanotechnology mostly represented in surface coatings (industry and research), nano-scaled external and internal structures for electronics (mainly research), biotechnology (research and industry). There is no production of engi-neered nanoparticles and it may be speculated that most nanoparticles to be applied in production in the near future will be imported in prepara-tions and other matrices or semi-manufactured products.
2.6.2 Carbon nanotubes
SAAB AB has extensive experience of carbon fibre reinforced epoxy structural composites. SAAB is now performing research on and devel-opment of the application of carbon nanotubes in composites. Of interest, besides increasing the structural strength, is the possibility to design other properties, such as electrical or thermal properties. Carbon nanotubes may be dispersed in the epoxy or integrated into carbon fibre bundles.
The aim of SAAB is to develop applications and to define criteria for composite resins incorporating the carbon nanotubes. The resins with integral carbon nanotubes will be bought from external suppliers and thus no handling of free carbon nanotubes is planned for the production at SAAB. SAAB is concerned about potential risks from the use of raw materials and composites with incorporated nanotubes in production

34 Evaluation and control of occupational health risks from nanoparticles
processes and desires more information on occupational health risks and their control.
Nordic Sport is one of the worlds leading producers in advanced sport equipment. They have specialised in equipment in composite materials. For producing elite javelins they use imported resin impregnated carbon fibre. The material has been stated to be ”nanoscale carbon fibre reinforced”. However, as far as Nordic Sport knows there are no carbon nanotubes in the material. The producer of the material is Garbolino, France, and no mentioning of carbon nanotubes has been found on their site (www.garbolino.fr). The javelins are formed and cured by Nordic Sport and after finishing a steel tip is mounted and a surface lining is applied.
2.6.3 Photo catalytic concrete
A European Community Eureka-project “Nanocrete” has the aim to de-velop functional concrete with photo catalytic properties, antibacterial surfaces and the capability to react with and remove nitrogen oxides from the air. Within the project, photo catalytic reactions in cement-based ma-terials containing photoactive titanium dioxide will be studied to see how they can be utilized to obtain clean and functional concrete surfaces. Fur-ther technology for production of functional concrete surfaces will be developed.
The project is performed in collaboration between Finnish Kemira, producer of TiO2 nanoparticles, Swedish construction companies and Swedish research institutes. The Swedish participants are Cementa AB, Skanska AB, Betongindustri AB, Abetong, the Cement and Concrete Research Institute, and the Institute for Surface Chemistry.
2.6.4 Colours, inks and coatings
Svenska Färgfabrikanters Branschförening (The Swedish Paint and Print-ing Ink Makers Association) believes it is unusual with nanoparticles in products of their members. They are not aware of any nanoparticle pro-duction in Sweden.
Heidelberg Maxit Airfresh is an indoor plaster sold in Sweden. It is stated to have a photo catalytic action. It is delivered as powder in paper bags. It “is a gypsum-based plaster that incorporates nano particles of a specially-modified Titanium Dioxide (Ti02) catalyst”5.
2.6.5 Cosmetics
According to Kemisk-tekniska Leverantörförbundet (The Swedish Cos-metic, Toiletry & Detergent Association) there are few developed appli-cations of nanoparticles in their trade marketed in Sweden. Internation- • 5 www.maxitlwa.co.uk/media/43/pdfs/airfresh/airfresh%5Freport.pdf

Evaluation and control of occupational health risks from nanoparticles 35
ally there are a large number of new patents comprising nanoparticles, so possibly there may be an increase of cosmetic nanoproducts marketed. No nanoparticles for cosmetics etc. are produced in Sweden.
2.6.6 Nanoscale surface coating
Impact Coatings develops processes, production technology and applica-tions for thin film coating as well as providing production for customers. The Swedish FunMat program at Linköping University6 aims at develop-ing processes for ceramic high-temperature and chemically stable thin film materials.
Pilkington Float Glas AB is a supplier of self cleaning glass panes. The active layer has erroneously been considered to be based on nano TiO2 particles. In fact a TiO2 layer is deposited by a high-temperature gas-phase process which gives a nanoscale structure. There is no produc-tion in Sweden.
2.6.7 Surface protection consumer products
Some consumer products for surface protection or treatment of among others car windshields, car and boat bodies, ceramics and textiles are marketed as “nano”. Such products are sold but not known to be pro-duced in Sweden.
It is not clear to what extent these products contain nanoparticles or form nanostructures and to what extent it is a marketing phenomena. The year 2005 a fair number of consumer products in Sweden were promoted as “nano” and two years later considerably fewer.
2.6.8 Textiles
There is likely to be some import of nanostructured or nanoparticle treated textiles.
2.6.9 Metal powders
Höganäs AB and Carpenter Powder Products AB manufacture metal and metal oxide powders by gas atomization. Typical size range is from some 10 µm to a few 100 µm. The term “fine powders” seems to be used for powders of particle sizes less than about 50 µm. However, considerable nanoparticle generation emanates from gas atomization processes posing a risk of unintentional nanoparticle exposure. Höganäs AB states that they are not at present heading for nanoparticle production, since with present applications of their powders smaller particles will rather cause
• 6 www.liu.se/funmat

36 Evaluation and control of occupational health risks from nanoparticles
handling problems than better performance. However, they are employ-ing and developing powder particle surface modifications on a nanoscale.
2.6.10 Steel
Sandvik AB provides a steel Nanoflex® Alloy. It has been stated or in-terpreted to contain nanoparticles. The fact is that the steel has an internal nanoscale grain structure due to choice of alloy and processing.
Sandvik Hard Materials AB is reported to have no current plans to ap-ply nanoparticles in production of ceramics coatings for carbide cutting tools.
2.6.11 Colloid silica
EKA Chemical AB produces colloidal silica (amorphous SiO2). The process is performed in solutions and the products are colloidal silica sols with particle sizes from 5 nm to 100 nm and with around 30 % particles by weight. The colloid silica comes in a variety of grades, covering both mono-dispersed and poly-dispersed types and can be delivered with vary-ing pH, concentration or charge, as required.
There have been thoughts on developing also dry products but these thoughts have for one thing been hampered by the lack of data on poten-tial nanoparticle risks. EKA desires more information on potential occu-pational health risks.
2.6.12 Perfluorooctanesulfonate (PFOS)
PFOS compounds have been used for decades and have had a variety of applications from industrial processes to components in consumer prod-ucts. The main reason for using them is their surface active properties, i.e., hydrophobicity, low friction and low surface adhesion. These are properties at the nanoscale of the final product although the compounds are liquid. PFOS is not produced in Sweden.
PFOS compounds are used as pure compounds or as structures in de-rivatives and polymer products and can be found in e. g.: fire extinguish-ing products, cleaning agents, impregnation agents for textile, paper and leather, and additives to paint and lacquers. Environmental risk concerns have lead to a reduction during recent years of the use of PFOS which still however may be found in older products. Today the use is mainly in: fumigants for electrolytic chromium-plating, the semiconductor industry, and hydraulic oils for aviation industry.

Evaluation and control of occupational health risks from nanoparticles 37
2.6.13 Fluoropolymer ski waxes
Ski waxes are often based on polymers of fluorocarbons. Many of these waxes are powders with particles with nanoscale surface structures. There is no commercial production of this type of ski waxes in Sweden.


3. Physical characterization
3.1 Introduction
For full notification of a new substance which may be marketed in a form which gives rise to the danger of exposure by the inhalatory route Dir 67/548/EEC, Annex VII A establishes that a test should be conducted to determine the particle size distribution of the substance as it will be mar-keted. Accordingly, the notification dossier should include a particle dis-tribution measurement. Annex V of Dir 67/548/EEC does not yet suffi-ciently cover these testing requirements. Accordingly new or revised methods need to be continuously developed. At present, testing methods are currently under development or revision. This includes the Draft Guidance Document on the Determination of Particle Size Distribution, Fibre Length and Diameter Distribution of Chemical Substances7. It in-cludes e.g. use of SEM/TEM for determination of particle size distribu-tion of the material as it is.
Also the determination of the ability of the material to generate air-borne dust (dustiness) during handling is essential data for use in an ap-propriate risk assessment both for new and existing substances. The draft guidance document also includes a dustiness test that is based on the ro-tating drum test principle, see also section 3.2).
OECD has currently established several working parties for reaching agreement on definitions as well as recommended measures for engi-neered nanoparticle characterization. The working parties include the following steering groups: • SG1 - Development of an OECD database on EHS research • SG2 - EHS Research strategies on Manufactured Nanomaterials • SG3 - Safety Testing of a Representative Set of Manufactured
Nanomaterials • SG4 - Manufactured Nanomaterials and Test Guidelines • SG5 - Co-operation on Voluntary Schemes and Regulatory Pro-
grammes • SG6 - Co-operation on Risk Assessment. At this point, the working document from SG3 proposes the following input parameters for engineered nanoparticle characterization:
• 7 http://ecb.jrc.it/documents/Testing-Methods/GDoc-Granulometry-draft-web.pdf

40 Evaluation and control of occupational health risks from nanoparticles
Characterization (primary end-points)
Technical name
Commercial name
Chemical composition
Molecular structure
Crystal structure
Physical form at room temperature
Pressure at room temperature
Surface area
Particle size distribution and average
diameter
Solubility in water and biologically active
fluids
Bulk density
Agglomeration state
Porosity
Surface charge sites
Particle density and dispersability
Persistence
Ready biodegradability
Agglomeration
Persistence of nano-property
Base Set of Safety Hazard Data
Flammability
Explosivity
Incompatibility
Reactivity
Corrosivity
Additional Safety Hazard Data
Stability
Decomposition
Polymerization
Photoactivity
Thermal/light stability As the OECD parameters originate from a working document, some items may possibly be merged and others added.
The analyses proposed by OECD are presently limited to a small number of laboratories. For a first step physical characterization, the pro-ject group recommends to follow Table 3.
Table 3. Physical characterization of nanomaterials
Parameter Bulk material Aerosol (dispersed state)
Particle size TEM/FEGSEM SMPS, TEM
Particle morphology TEM/FEGSEM TEM/FEGSEM
Agglomeration state Dynamic light scattering or tracking analysis
SMPS, TEM
Specific surface area BET Surface concentration based on diffusion charging
Crystallinity XRD TEM/SAED
Elemental composition TEM/EDX TEM/EDX
Nanoaerosols are dynamic entities. Once formed and released as an aero-sol, nanoparticles may undergo significant changes in size distribution and concentration, surface chemistry, and surface charge depending on the local environment and primary properties (SCENIHR, 2007). During aerosol sampling and subsequent sample preparation further changes may be introduced. According to the experience by members of the group, some types of nanoparticle suspensions agglomerate during mild sonica-tion and strong sonication is used e.g. in some industrial process to break agglomerates. Dust generated when handling a specific ultrafine TiO2 having a primary particle size of about 20 nm generated agglomerates of

Evaluation and control of occupational health risks from nanoparticles 41
the order 300nm. When suspended in a liquid simulating lung fluids they de-agglomerated, but not down to the primary particles (Maynard, 2002).
Meticulous registration of test conditions and of sampling and analyti-cal methods thus is indispensable. The project group noted that state of agglomeration and how to quantify this was a key problem.
3.2 Characterization of pigment grade and ultrafine TiO2 and fumed silica
The three powders • Kemira AFDC (an uncoated anatase titanium dioxide pigment) • Kemira UV-TITAN M111 (an alumina treated ultrafine rutile titanium
dioxide) • Elkem Microsilica Grade 920 (dry silica fume) were characterized. The methods used for characterization were: • X-ray diffractometry for phase analysis • BET-analysis for specific surface area determination • Electron microscopy for imaging and elemental analysis. Samples were
prepared by dispersing the powder into distilled water and then placing a droplet of the powder dispersion onto a holey-carbon Cu-grid.
The results are presented in Table 4 and Figure 12-14.
Table 4. Physical characteristics of pigment grade and ultrafine TiO2 and fumed silica.
Material
Parameter Kemira AFDC (an uncoated titanium dioxide pigment)
Kemira UV-TITAN M111 (an alumina treated ultrafine rutile titanium dioxide)
Elkem Microsilica 920
Particle size Crystallite size ~170 nma
Crystallite size ~14 nma ~150 nma 80 w% <5 µm
Particle mor-phology
Round-shaped form-ing agglomerates of several particles
Needle-shaped, forming agglomerates of size 10 and more
Spherical, forming agglomerates of several particles
Dispersion state NA NA NA
Specific surface area
5.5 m2 g-1
(~10 m2 g-1 a)
112 m2 g-1
(ca. 100 m2 g-1 a)
12 m2 g-1
(> 15 m2 g-1 a)
Crystallinity Anatase Rutile Amorphous
Elemental composition
Ti, O Ti, 3%w/w Al Si, O, traces of Ca, Na
aFrom manufacturer. NA: not available.

42 Evaluation and control of occupational health risks from nanoparticles
Figure 12 Kemira AFDC. Electron diffraction from the particles showing the crystallinity
of particles.
Figure 13 Kemira UV-TITAN M111. Electron diffraction from the powder shows the
crystallinity of nanoparticles.
Figure 14. TEM of Elkem micro silica.
50 nm 50 nm50 nm50 nm50 nm50 nm50 nm 50 nm50 nm50 nm50 nm50 nm
50 nm50 nm 20 nm20 nm20 nm 50 nm50 nm50 nm 20 nm20 nm20 nm
50 nm 50 nm50 nm50 nm 50 nm50 nm50 nm 50 nm50 nm50 nm50 nm50 nm

Evaluation and control of occupational health risks from nanoparticles 43
3.3 Dustiness of powdered, granular or pelletized nano-materials
Handling of nanomaterials generates dust. The amount and size distribu-tion of generated particles will depend on the handling scenario and on the material properties. Many dustiness tests have been developed using many different approaches for simulating real handling scenarios (Gill et al., 2006). For testing e.g. pigments the Heubach Dust meter (DIN 55992-1 part 1, 1997) has been widely used. It is based on a small rotat-ing drum.
Recently, the European standard EN 15051 (CEN, 2006) on dustiness testing in relation to workplace exposure (Liden, 2006) has been pub-lished. It defines a dustiness index as the mass ratio of generated dust in mg to the mass of test sample in kg. The dustiness index may be obtained by two methods: one based on a rotating drum and another based on a continuous single drop principle. Users of this standard should choose the one of the two methods that is most appropriate for the material and han-dling process they wish to simulate. The EN 15051 also defines a classi-fication according to the dustiness index as obtained with the two meth-ods, and for both the respirable, thoracic (rotating drum only), and inhal-able size fractions of the generated dust, respectively. The two testing principles lead to different classification and different ranking within each class (CEN 2006). This problem needs to be resolved before a dusti-ness test can be implemented in legislation.
3.3.1 Existing dustiness tests
Simulation of pigment handling (Aerosil, nominal particle size 7 nm) as performed in the dye industry has been reported by Bohgard et al. (1994). They found a source strength of 4×10⁵ particles s-1 for particles in the size range 20-1000 nm with a mode around 120 nm and another mode at about 1.3 µm in the size range 1-10 µm with a source strength 5×10⁵ particles s-1.
Aerosil 200 (a hydrophilic fumed silica having a specific surface area of 200 m2/g BET or median diameter 12 nm) has been tested using the Heubach Dustmeter as standardized by DIN 55992. The measured dust value corresponded to a dustiness of 1% (Hamelmann and Schmidt, 2004). It was also found that a specific single drop method ranked the dustiness of limestone, aluminium oxide and fumed silica differently than the Heubach Dustmeter.
Maynard (2002) and Maynard et al. (2004) developed a dustiness test for nanosized powders based on fluidization. Fluidization was obtained by placing milligram amounts of material with or without 70 µm bronze beads in a centrifuge tube agitated by a vortex shaker. By this technique the dustiness as a function of the force applied to the powder can be stud-

44 Evaluation and control of occupational health risks from nanoparticles
ied. (Maynard, 2002) tested an ultrafine TiO2 powder (Degussa Aeroxide P 25, 50±15 m2/g) using the fluidization principle (material and 70 µm bronze beads in a centrifuge tube placed on a vortex mixer). The particles were quantified using an SMPS and APS. A bimodal size distribution was found with number modes 330nm and 1.8 µm, the latter mode being about 0.4 times the first.
Maynard et al. (2004) also tested SWCNT using a fluidization princi-ple by placing a small quantity (40 mg material and 70µm bronze beads or 15 mg without beads) in a centrifuge tube agitated by a vortex shaker. During actual handling of carbon nanotubes, low concentrations of parti-cles were generated. The authors concluded that nanotubes do not readily become airborne during handling.
3.3.2 Development of dustiness test for small amounts of powder and results
In connection with the present project, a new dustiness test was devel-oped. The design and the results of dustiness tests are given in Schneider et al. (submitted). The following is a brief summary. The purpose of de-veloping the new dustiness test was to obtain a method that used minimal amount of material and that in a simple manner could bridge the two test principles given in EN 15051. The test apparatus is based on a down-scaled version of the EN 15051 rotating drum, while maintaining impor-tant test parameters (Figure 15). The test begins with a single drop chal-lenge and then continues with a 60 sec rotation of the drum performed on the same sample. Since the time dependent dust emission rate is another important aspect of powder dustiness the instantaneous dust concentra-tion was monitored using the TSI Fast Mobility Particle Sizer and the TSI Aerodynamic Particle Sizer, both with one-second time resolution. The measurement range was 0.52-19.8 µm for the APS and 6.04 to 523 nm for the FMPS. The total mass of particles generated for the total duration of the test was determined by collecting the particles on a filter and de-termining the weight gain of the filter. This test uses 6g of material per run, as compared to the 200 g or more in the EN 15051 methods. This makes the apparatus suitable for testing costly materials. Its small size allows easy placement in a fume cupboard and thus potentially very toxic materials can be tested.

Evaluation and control of occupational health risks from nanoparticles 45
Supply air
To FMPS
9 lpm
Membrane filterA
B
Cut A-B
1 lpm
1 lpm
To APS
Figure 15. Rotating drum dustiness tester
Tests were completed on the materials shown in Table 5. Characteristics of the pigment grade and ultrafine TiO2 and fumed silica can also be found in section 3.1. Micrographs of the yttrium stabilized zirconia gran-ules used in the dustiness test are shown in Figure 16. Notice that the material was granulated, with granule diameter about 50µm.
Table 5. Specifications of the test materials.
Material XRD crystallite size, nm Specific surface areaa, m2 g-1
Bulk density major component, g cm-3
TiO2 ultrafine, rutile 18.6 (14a) 100 Fumed silica Amorphous 15–30 2.2a
Bentonite (montmoril-lonite)
8.2 c,d NA 2-3b
Yttrium stabilized zirconia
27 15.4 6.05a
Goethite 38 18–21 4.3b Corundum, aloxite F1200
92 NA 3.96b
Corundum, aloxite F800
127 NA 3.96b
Talc 147d NA 2.58–2.83b TiO2 pigment grade, anatase
170a 10 4.23–5.50b
NA: Not available. a Data from manufacturer, b Deer et al . (1985), c Mean for samples from Jonas and Oliver (1967), d Height of tabular-shaped crystallites size along the crystallographic (001).
Figure 16 Yttrium stabilized zirconia. SEM picture (left) shows a granule (length of bar 10 µm). TEM picture (right) shows the aggregated primary particles (length of bar 100 nm). From http://www.tosoh.com/Products/basic_grades.htm

46 Evaluation and control of occupational health risks from nanoparticles
The size distributions of the generated aerosol had two size modes above 0.9 µm and all materials except TiO2 pigment grade and aloxite F1200, generated a size mode in the range from ~100 to ~220 nm. Examples are shown in Figure 17. This figure should be contrasted to Figure 18 show-ing the corresponding volume-weighted size distribution. The large dif-ference in fraction of sub-micron particle numbers and sub-micron parti-cle volume (or mass) should be noticed. Notice also the log-scale.
TiO2 pigment grade had the lowest dustiness and TiO2 ultrafine the highest dustiness as measured by particle number for both the single drop and rotation test and as measured by mass for both tests combined. The difference was a factor of ~300. A similar large difference in exposure potential can be expected. This would imply that preventive measures would have to be much stricter if the pigment grade TiO2 were to be re-placed by the ultrafine version. Since aggregates of ultrafine TiO2 can brake up in the lung fluid and assuming particle number matters, the po-tential risk would even be larger. An increasing trend in dustiness was found for decreasing crystallite size. A ratio, R, defined as
rot sd
sd
D DDR+
=
was determined, where Dsd is dustiness index determined from the single drop, and Drot is dustiness index determined from rotation test. It was found that R varied within a factor of 40 for the tested materials. When analysing the time dependent particle generation rate during the test, it was found that there were three types of time profiles: i) a brief initial burst (talc, both grades of corundum), ii) a decaying rate during rotation period (fumed silica, TiO2 ultrafine and pigment grade, bentonite), iii) a constant rate (Y-zirconia, goethite). As could be expected, materials with a burst profile had a large R, and those with a constant profile had a small R. Such large differences in particle generation time profiles or equiva-lently differences between a single drop and a rotation dustiness test has implications when having to choose which of the two dustiness test prin-ciples given in EN 15051 are best suited in a given exposure scenario.

Evaluation and control of occupational health risks from nanoparticles 47
100
1000
10000
100000
1000000
10 100 1000 10000Diameter, nm
TiO2 ultrafine
Fumed silica
TiO2 pigment
Figure 17 Size distribution by number for ultrafine and pigment grade TiO2, and
fumed silica.
0.00001
0.0001
0.001
0.01
0.1
1
10
10 100 1000 10000
Diameter, nm
TiO2 ultrafine
Fumed silica
TiO2 pigment
Figure 18. Size distribution by volume of ultrafine and pigment grade TiO2, and
fumed silica The results indicated also that aerosolization of nanoparticles from a bulk powder results in agglomerates, a fact also noted by Wake et al. (2002). Nanoparticles have a natural tendency to aggregate due to the significant attractive forces between particles at nanosize. Processing of nanosized powders by fluidization can be used to modify their properties and large, spherical aggregates are formed when intra-aggregate forces are stronger than inter-aggregate forces (Hakim et al., 2005).


4. Assessment of exposure and control measures
4.1 Introduction
Among the many workplace factors that may increase the potential for exposure to nanoaerosols, NIOSH (2007) has listed the following: • Generating nanoparticles in the gas phase in non-enclosed systems
will increase the chances of aerosol release to the workplace • Collecting, handling and conditioning nanostructured powders will
lead to the possibility of aerosolization • Working with nanomaterials in liquid media during pouring or mixing
operations, or where a high degree of agitation is involved, will lead to an increased likelihood of inhalable and respirable droplets being formed
• Maintenance on equipment and processes used to produce or fabricate nanomaterials will pose a potential exposure risk to workers perfor-ming these tasks
• Cleaning of e.g. dust collection systems used to capture nanoparticles.
In addition several down-stream uses and final product utilizations may result in potential exposure such as use of polishing compounds, cutting and grinding/sanding of nanocomposites, and degradation of nanosur-faces.
Accidental releases can occur during nanoparticle generation using high pressure or high energy mechanical forces could occur in case of failure of the sealing of the reactor or the mills. In such situations large amounts of nanoparticles could be released in short bursts. For laser processes, break-ing of reactor laser windows is a possible source (Luther 2004).
Collection of nanoparticles in liquid suspensions reduces dust emis-sion (Luther, 2004). Master batches are increasingly used by downstream users thereby concentrating the dust problems at few up-stream suppliers. Silica fumes are mostly supplied to down-stream users as slurries.
There is a wide gap in information on the risks to specify which levels of control are required and thus to provide guidance on choice of proper control measures. However, several approaches developed for conven-tional materials provide a conceptual framework for describing and ana-lysing exposure scenarios and specific control approaches for nanomate-rials. These will be described in the following.

50 Evaluation and control of occupational health risks from nanoparticles
4.2 The COSHH Essentials concept
A useful concept for defining appropriate control levels in relation to conventional powders and materials is control banding. COSHH Essen-tials8 is such a control banding tool. It is intended for helping small and medium-sized enterprises doing risk assessments for chemicals and mix-tures of chemicals. COSHH stands for Control of Substances Hazardous to Health. This tool requires four pieces of information, which in the case of particles are: 1. The type of task (e.g. mixing, sack filling, manually cleaning
surfaces) 2. The hazard group from the material safety data sheet, or SDS, part 15
(one of groups A to E, with E the most hazardous and group S repre-senting substances which can cause harm as a result of skin contact ). These are based on the risk phrases for the chemical, which are given in Section 15 of the SDS obtained from the chemical manufacturer or supplier
3. The dustiness of the material or product (low, medium or high, based on simple descriptors)9.
4. The amount used in the task (small quantities = grams; medium quan-tities = kilograms; large quantities = tons)
The system then 1. Identifies the control band (control approach). There are four control
approaches: a) general ventilation b) engineering control c) containment d) users are directed to seek specialist advice for the most
hazardous chemicals and tasks 2. Produces advice on controlling risk from the chemical used in the
specified task 3. Provides written guidance and documentation as a result of the
assessment. Similar schemes are used in the practical guidance given by the The German Federal Institute for Occupational Safety and Health (BAuA, 2006). The Stoffenmanager Dutch (van der Schaaf et al., 2006) represents a further development, see section 4.3.
• 8 http://www.coshh-essentials.org.uk • 9 Mark (2004) has proposed to replace the descriptive terms in COSHH Essentials by a the
dustiness index of the material
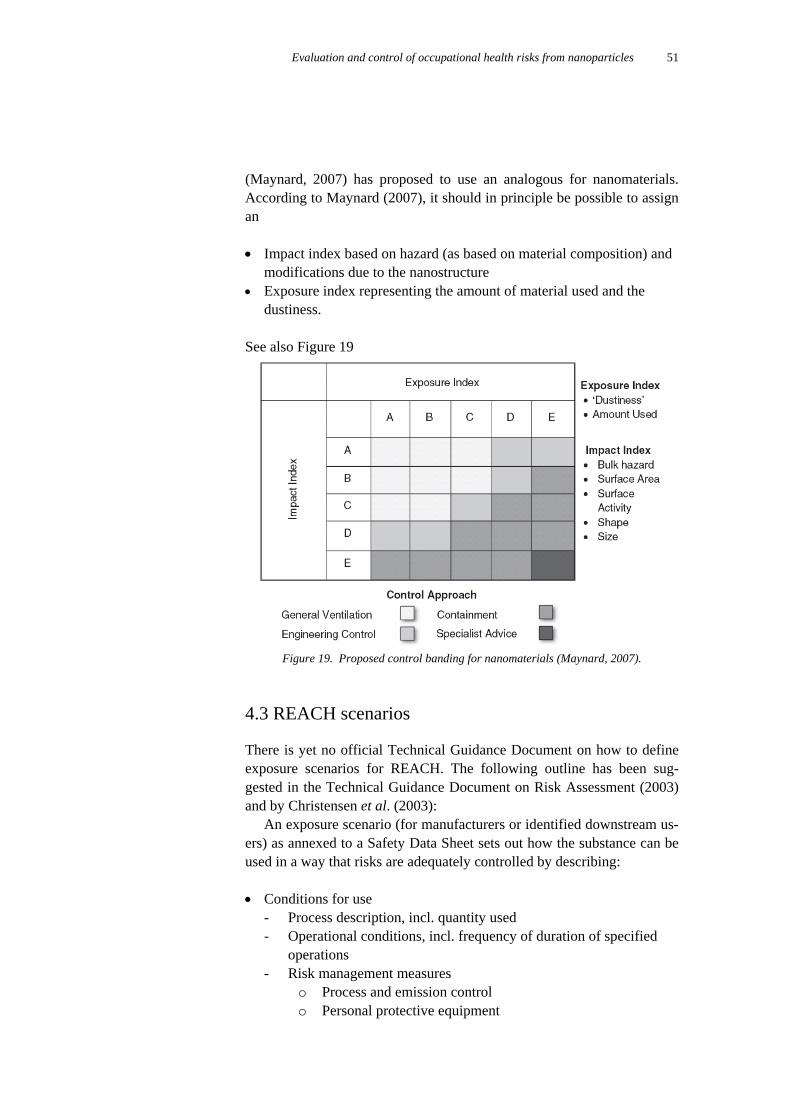
Evaluation and control of occupational health risks from nanoparticles 51
(Maynard, 2007) has proposed to use an analogous for nanomaterials. According to Maynard (2007), it should in principle be possible to assign an • Impact index based on hazard (as based on material composition) and
modifications due to the nanostructure • Exposure index representing the amount of material used and the
dustiness. See also Figure 19
Figure 19. Proposed control banding for nanomaterials (Maynard, 2007).
4.3 REACH scenarios
There is yet no official Technical Guidance Document on how to define exposure scenarios for REACH. The following outline has been sug-gested in the Technical Guidance Document on Risk Assessment (2003) and by Christensen et al. (2003):
An exposure scenario (for manufacturers or identified downstream us-ers) as annexed to a Safety Data Sheet sets out how the substance can be used in a way that risks are adequately controlled by describing:
• Conditions for use
- Process description, incl. quantity used - Operational conditions, incl. frequency of duration of specified
operations - Risk management measures
o Process and emission control o Personal protective equipment

52 Evaluation and control of occupational health risks from nanoparticles
o Good hygiene o Etc.
• Other relevant information • Exposure level associated with the described scenario • Exposure scenario shall cover
- Manufacture and all identified uses, incl. maintenance related exposures
- All life cycle stages resulting from manufacture and identified uses
For each defined scenario the most relevant moments of exposure should be described. Figure 20 illustrates a hypothetical exposure scenario for the downstream use of a substance in paint.
Figure 20. Hypothetical exposure scenario, from Christensen et al . (2003).
4.4 Modelling
The European REACH Implementation Project RIP 3.2 initiated by the Commission has proposed a tiered approach in which the first tier should provide a conservative (i.e. protective) system that can discriminate be-tween substances in scenarios of some concern and those which are not (RIP 3.2, 2005). The Stoffenmanager (van der Schaaf et al., 2006) may be a good candidate for this first tier because a preliminary validation exercise has shown that for dusts, the Stoffenmanager could explain 65% of the variability of measured dust concentrations ranging over six orders of magnitude (Tielemans, 2007). It is based on the deterministic model

Evaluation and control of occupational health risks from nanoparticles 53
developed by Schneider et al. (1991), Cherrie et al. (1996), Cherrie (1999), Semple et al. (2001), and Cherrie et al. (2004). This original model comprises an air contaminant source term which is dependent on intrinsic properties of the contaminant (εi) (e.g. dustiness), the way the contaminant is handled (h) and finally, the effectiveness of any local con-trol (ηlv). The parameters are combined to provide the active emission of the source (εa). Three further parameters are incorporated in the basic model. These are the passive or fugitive emission (εp), the fractional time the source is active (ta) and the efficiency of any respiratory protection (ηppe). So for a single source close to a worker, the exposure level, C, would be
)1())1(( ppepalvi thC ηεηε −×+×−××=
The passive emission term is included as an additive term unrelated to the active source.
The full model distinguishes between contribution from sources close to and far from the worker and the role of general ventilation. There is insufficient nanoparticle specific data to allow such a distinction.
Exposure for each individual task is calculated separately and time weighted to calculate the time-weighted average exposure.
Intrinsic emission is the potential for the substance to become air-borne. For the convenience of the assessor using the model, intrinsic emission is generally expressed in relation to a “target value”, often cho-sen to be the occupational exposure limit (OEL)10.
Handling represents the methods by which the substance is handled and also the amount of energy being put into the substance while handling.
If there is no local exhaust this parameter should be set to 1. If local exhaust is installed or other controls are in use this parameter may be set to 0.3. If the local ventilation is very well designed and maintained or there are other efficient controls, this may be set to 0.1.
Passive emission is the amount of substance released from fugitive emissions or passive sources e.g. dust from conveyors. It may also be released from sources not directly associated with the process e.g. resus-pension of settled dust. It is therefore affected by the cleanliness of the workplace, with cleaner workplace having a lower passive emission. Pas-sive emission is generally much less than active emission. Although, passive emission relates to intrinsic emission in that a more dusty mate-rial is likely to have a higher passive emission than a less dusty one, it also depends on the cleanliness of the workplace.
• 10 For NP materials such target values are not yet available and will have to be based on future
systematic workplace measurements performed using generally recognized sampling and ana-lytical methods.

54 Evaluation and control of occupational health risks from nanoparticles
Use of the model will increase standardisation of exposure data collec-tion and assessment and provide a framework for analyses of exposure data (Tielemans et al., 2007). The model elements should be seen as pro-viding “building blocks” for development of exposure models for specific scenarios.
4.5 Dose
Respirable dust is defined as the fraction of the inhaled dust that pene-trates to the alveoli. It does not address what fraction deposits in the alve-oli. This was no severe limitation when studying traditional aerosols be-cause the ratio of respirable mass to mass deposited in the alveoli was fairly constant. However, when the focus is on nanosized particles and in particular if particle number or surface area, rather than particle mass is a potential risk measure, this is not so. The alveolar deposition is shown in Figure 21 (Hinds, 1999). It is seen that there are two deposition maxima and it is of relevance for risk assessment, to determine these two size fractions separately. At present this is only possible by determining the size distribution and then to numerically extract this information.
Ingestion of engineered nanoparticles is of concern. Let it be assumed that the particles are chemically stable, that growth due to hygroscopicity can be neglected, and that all particles deposited in head and tracheo-bronchial region are cleared and swallowed. The ratio of particles reach-ing the gastro-intestinal tract to particles depositing in the alveoli can then be calculated as the ratio of number of particles deposited in the head and tracheo-bronchial region to the number deposited in the alveoli. The re-sult is shown in Figure 21. The tracheo-bronchial and head deposition fractions given by Hinds (1999) were used. It is seen, that below 10 nm and above 10 µm a larger fraction of inhaled particles end up in the gas-tro-intestinal tract than in the alveoli.
1 10 100 1 .103 1 .104 1 .1050
20
40
60
Diameter, nm
Alv
eola
r dep
ositi
on, %
1 10 100 1 .103 1 .104 1 .1050.01
0.1
1
10
100
Diameter, nm
GI/A
lveo
lar d
epos
ition
Figure 21 Alveolar deposition fraction, % (left). Ratio of GI deposition to alveolar depo-
sition (right). Airway deposition fractions are from Hinds (1999)

Evaluation and control of occupational health risks from nanoparticles 55
4.6 Control approaches
4.6.1 General
Nanoparticles possess some characteristics that may make them behave somewhat differently from larger particles in workplace environments. However, the differences are not so great as to be of a fundamental impor-tance as seen from an engineering control perspective. A NIOSH report (NIOSH, 2007) states in the executive summary: “For most processes and job tasks, the control of airborne exposure to nanoparticles can most likely be accomplished using a wide range of engineering control techniques similar to those used in reducing exposures to general aerosols”.
The engineering control techniques of nanoparticle exposure can build on the knowledge and experience from current exposure control of aero-sols which already today has been applied to aerosols containing ultrafine particles such as e.g. welding fume, carbon black, or viruses. Radical shifts are not needed in general, but rather adaptation and redesign of current technology to deal with certain characteristics of nanoparticles. This applies to techniques for general ventilation, industrial ventilation, local and process ventilation, containments and enclosures, and filtration.
The size and mass of nanoparticles have some related implications for their transport with air flow, their deposition, and their agglomeration as compared with larger particles. They will follow air flow and even turbu-lent flows well and to a considerably higher degree than µm-sized parti-cles. The particle relaxation time, which is one measure of how rapidly particles follow changes in flow velocities are one to two orders of mag-nitude smaller for less than 100 nm particles than for 1 µm particles. The practical aspect is that they at large behave in air less like airborne parti-cles and more like heavy molecules, apart from not rebounding from surfaces. Nanoparticles do not exhibit gravitational settling and surface deposition is due to Brownian and turbulent diffusion, static electrical fields, and thermophoresis (transport towards a surface having considera-bly lower temperature than the surrounding air. This deposition is inde-pendent of orientation, see also Figure 25. Coagulation, the process of particles forming agglomerates, leads to a decrease of number concentra-tions with time, but unchanged mass concentrations. In some circum-stances with high number concentrations (of the order of 106 cm-3 or more) coagulation may lead to significant effects from an industrial hy-giene point of view, see also section 4.7.3.
Current practices worldwide in the nanotechnology industry have been surveyed by ICON (2006a). The reported environmental health and safety practices did not significantly depart from conventional safety practices for handling chemicals. Most organizations reported that the biggest im-

56 Evaluation and control of occupational health risks from nanoparticles
pediment to improving their nano-specific environmental health and safety program was lack of information. Thus, a strong demand for indus-trial and governmental guidance in environmental health and safety prac-tices was identified. It was noted that very few of the guidelines for “best practices” and frameworks for nanomaterial risk management were based on empirical research. Rather, they were based on current knowledge and expert consultation. Figure 22 presents a summary of the designs and engineering controls used (ICON, 2006b). The ICON study only included research laboratory and manufacturing facilities and not e.g. consumer and waste management practices.
Figure 22. Reported nano-specific facility design and engineering controls. Copied from
ICON (2006b). A very pragmatic approach to risk management adapted from Peters (2005) could be: • Like for traditional exposure scenarios, most exposures occur due to
short peaks originating from point sources. Point sources can be de-tected by using qualitative exposure assessment based on observation and professional judgement. Potential sources can be identified and their frequency and relative magnitude of release be determined using conventional aerosol photometers. For suspected more toxic particles, an instrument having a suitable sensitivity such as a condensation par-ticles counter should be used. Combining these measurements with visualization of individual execution of work tasks, such as using the PIMEX method (Rosén, 2002) can provide very useful information regarding reduction of emission
• Many commercial receipts are sold in slurry form in order to stabilize the material against aggregation with the added benefit of reducing exposure. Not much is however known of resuspension of nanopar-ticles from dried spills of slurry from e.g. floors, tools, and clothing.
• Safe practices - Laboratory settings. Using a condensation particle counter it
should be confirmed that containment is effective. - Industrial settings. Existing qualitative exposure assessment me-
thods can provide a sound starting point. This would include

Evaluation and control of occupational health risks from nanoparticles 57
visual inspection supported by suitable aerosol detectors, dis-cussion with operators to assess location and frequency of sour-ces. Also observation of dust build up can provide clues for un-controlled sources.
The need for increasing the effectiveness of technical control measures can be estimated on a relative scale • If going from micron to nanosized materials, even if there is no
change in toxicity of bulk materials and in order to keep the same exposure a decision tree could be
- If mass effect – do nothing more - If surface area effect– reduce exposure four times every time
diameter is halved - If number effect – reduce exposures eight times every time
diameter is halved • If nanoparticles are to be added to an existing process and if the exis-
ting process is highly enclosed and serviced with engineering controls it may be easy in practice to meet a lower exposure limit
• Risk of explosion11
4.6.2 Filtration of nanoparticles
Filtering performance of conventional porous filtration media of various design have a similar behaviour regardless of filter media characteristics and of air flow rate. For large enough (larger than some µm) particles the penetration is close to 0 % and dictated by deposition due to interception and impaction. With decreasing particle size the penetration increases and displays a maximum at a “most penetrating size” and then, for further decrease in particle size, the penetration will begin to decrease. This de-crease is due to deposition by diffusion.
• 11 While important, risk of explosion was not investigated in the present project.

58 Evaluation and control of occupational health risks from nanoparticles
0,001
0,01
0,1
1
1 10 100 1 000 10 000
particle size, nm
penetration
Figure 23. General qualitative penetration behaviour through fibrous filters. The absolute level of maximum penetration may vary with some orders of magnitude depending on filter quality.
This qualitative behaviour (Figure 23) is general for porous filter media and may be well described quantitatively by classical filtration theory. For conventional fibrous filtration media the most penetrating particle size lies around 300 nm, principally depending on air flow rate and fibre diameter. This has resulted in filter classification standards being based on filtration efficiency at this particle size, based on the philosophy that the penetration is lower for all other particle sizes. Recently it has been found that pre-charged filter media, as commonly used in protective fil-tering face-piece respirators, may have a most penetrating size at 30-70 nm (Balazy et al., 2006). In practice this may lead to an overestima-tion of the protection with filter masks when the estimate is based on filtration data for 300 nm particles given that particle number exposure is a more significant health risk parameter than particle mass exposure.
Another aspect of interest is that as particles get smaller they behave more and more like molecules and the filtration efficiency will decrease to zero. It is not well known when this behaviour begins and as a conse-quence there have been speculations on and results indicating that this might begin to occur for nanoparticle diameters of 10-20 nm (Balazy et al., 2004). Later, more elaborated and sophisticated measurements have not shown deviations from classical fibre theory down to 2-3 nm particles (Heim et al., 2005; Kim et al., 2007).
One effect of particle size may be that filter pressure drop will in-crease faster than for the same mass of larger particles. One theoretical approach predicts a proportionality of (particle size)-2 (Endo and Alonso, 2001). It was the experience of the project group that sampling sub-micrometer particles on filters results in higher pressure drops than sam-pling larger particles. This may support this effect.
Some conclusions can be drawn at large. For nanoparticles the filtra-tion will be better the smaller the particles at least down to some nm par-ticle size. Successful filtration of nanoparticles does not require develop-ment of new filtration techniques, albeit new designs may be adapted, and there is a wide range of commercially available filtration media that may be applied in industrial hygiene contexts. Filtration performance may be

Evaluation and control of occupational health risks from nanoparticles 59
dimensioned, controlled, and predicted by existing filtration theories. The filtration performance of pre-charged filter media seems to be overesti-mated in ratings based on standard test methods.
4.6.2 Personal protective equipment, PPE
According to ICON (2006b), a little over half of the organizations indi-cated that employees used respiratory protection. Reasons for not using respiratory protection could be that engineering controls were effective, no free nanoparticles were handled, the amount handled was very small, or nanoparticles were only handled in closed processes. Use of recom-mended clothing is shown in Figure 24.
Figure 24. Recommended clothing when working with nanomaterials. From ICON
(2006b).
4.7 Some specific points
4.7.1 Visibility
It is well known that dust concentrations cannot be estimated visually. The visibility depends on illumination intensity and geometry, on the background, and on the particle size and concentration. If visible, respir-able particles are only seen as a “haze”, not as individual particles. As the particles get smaller, the concentrations need to be higher to be visible, other factors remaining the same. It has been reported12 that a particle cloud of gram (!) per cubic metre concentrations of alumina nanoparticles is transparent. Exposure assessors therefore cannot assume that even massive leaks will be visible during a walk-thru investigation. Thus suit-able particle detectors are indispensable during any exposure assessment exercise.
• 12 Personal information, Morten Berntsen, Institute of Technology, Oslo, Norway

60 Evaluation and control of occupational health risks from nanoparticles
4.7.2 Surface deposition
Surface deposition will build up secondary sources of dermal, and if agi-tated, airborne particle exposure. To get an order of magnitude estimate of the importance of this potential exposure route a model calculation has been made. Using the semi-empirical model by Schneider et al. (1999) the deposition velocity to a vertical surface the velocities shown in Figure 25, have been calculated. U* is the friction velocity. U* scales the air turbulence intensity, the larger, the more turbulent the air. The full drawn lines are for zero electric fields, the dashed lines are for field strength at the surface of 10 kV m-1. An aged aerosol (Boltzmann charge distribu-tion) has been assumed. For particles below about 300 nm deposition velocities will be independent of surface orientation.
0.0001
0.001
0.01
0.1
10 100 1000
Diameter, nm
Dep
ositi
on v
eloc
ity, c
m/s
u*=20 cm/s
u*=7.5 cm/s
u*= 2 cm/s
Figure 25. Deposition velocities for different friction velocities u* and for electrical fields 0 kV m-1 (solid) and 10 kV m-1 (dashed).
The accumulation of particles per 8 hours is given in Table 6, both as number and area coverage.
Table 6. Surface accumulation rates
Concentration particles cm-3
Diameter Deposition velocity cm s-1
Accumulation, # cm-
2 per 8h % surface area covered per 8h
0.008 2.3 ×10⁷ 0.0018% 10 nm 0.08 2.3 ×10⁸ 0.018%
0.0008 2.3 ×10⁶ 0.018%
105
100 nm 0.01 2.9 ×10⁷ 0.16%

Evaluation and control of occupational health risks from nanoparticles 61
4.7.3 Coagulation
Coagulation of nanosized particles can be extremely fast. The time (T½) it takes for halving the concentration of the original size monodisperse parti-cles are given in Table 7 for unit density particles and concentration 1 mg m-3 (Preining, 1992). T½ is inversely proportional to particle concentration
Table 7. Coagulation time constant for particle concentration 1 mg m-3 according to Preining (1992).
Particle size, nm 0.5 1 2 5 10 T½ , s 3.0×10⁻⁴ 2.2×10⁻³ 1.2×10⁻² 0.12 0.7


5. Workplace exposure data
5.1 Introduction
There are currently no national or international consensus standards on measurement techniques for nanoparticles at the work place. Thus, the occupational hygiene community has been hesitant initiating comprehen-sive monitoring. Hitherto, most ultrafine particles have been quantified by one or several of the methods condensation particles counters (meas-ures total particle concentration in a size range of typically 10-1000 nm), electrical mobility analyzers, electrical low-pressure impactor, and others.
Researchers from several European research institutes have proposed a measurement convention (BGIA, 2007) stating that
• Ultrafine particles should be quantified by number concentration and
size distribution. This allows estimation of surface and volume distri-bution
• Mobility spectrometers and condensation particle counters can be re-garded as reference instruments
• Single particle analysis can be performed by thermophoretic or elec-trostatic particle collection techniques for subsequent analysis e.g. by TEM/EDX.
Monitoring exposure by inhalation to nanoparticles presents some unique challenges. • Most exposures will be in the form of aggregates. Size as measured by
e.g. impactors or mobility analyzers cannot reveal the agglomeration state, and thus to which degree an agglomerate can break up into ma-ny smaller units in the lung fluids. Thus results of such measurements cannot be directly related to risk if particle number is a relevant mea-sure of this risk. No simple measurement approach to meet this chal-lenge is at hand
• High background concentrations of ultrafine particles are ubiquitous. Measurement methods thus must be able to distinguish between the nanoparticles in question and the background of nanosized particles. At present there are only two approaches available for separating be-tween engineered nanoparticles and other particles of the same size range for use outside the research laboratories. One is by intelligent design of sampling strategies. The other is to collect particles on suit-able substrates for later analysis in the laboratory using time consu-ming electron microscopy.

64 Evaluation and control of occupational health risks from nanoparticles
5.2 Ultrafine particles
In order to put exposure to engineered nanoparticles into perspective, exposures to ultrafine particles for some selected scenarios is presented.
In an engine machining and assembly facility 98% of the particles smaller than 1 µm were below 100 nm as estimated by using an optical particle counter in combination with a condensation particle counter. Ultrafine particle concentrations possibly attributable to metalworking operations ranged 250 000 to 750 000 particles cm-3 (Peters et al., 2006). On the other hand only about 10% of the mass was found in particles below 100 nm in bronze foundry and welding (Schimberg and Ukkonen, 2003).
Kuhlbusch et al. (2004) found that bag filling in a carbon black produc-ing facility was not a source of ultrafine particles. In the work areas of the reactor and pelletizer of three carbon black production plants Kuhlbusch and Fissan (2006) found that elevated ultrafine particle number concentra-tions with respect to ambient were related to nearby traffic emissions or to grease and oil fumes from maintenance activities, or in one of the plants to leaks in the production line, which allowed particulate matter to escape to the surrounding areas. The authors concluded that no carbon black is re-leased in the reactor and pelletizing areas (as ultrafine or PM10) from the closed production lines under normal operating conditions.
Thomassen et al. (2006) measured particle concentrations in an alu-minium smelter. During anode change they found a strong number mode below 10 nm as well as a mode in the range 50-100 nm. The smallest mode could not be detected by transmission electron microscopy (TEM), and the authors hypothesized the particles were not stable under sampling or the vacuum in the TEM.
Concentrations measured by Ukkonen et al. (2005), Riediger (per-sonal communication), and Möhlmann (2005) are summarized in Table 8. The measurements by (Wake et al., 2002) during handling of high spe-cific surface area carbon black, precious metal black and nickel powder, ultrafine TiO2, and of unwanted ultrafine particles (metal spraying and coating, welding, soldering, foundry fumes) are reproduced in Table 9. Figure 26 summarizes the results.
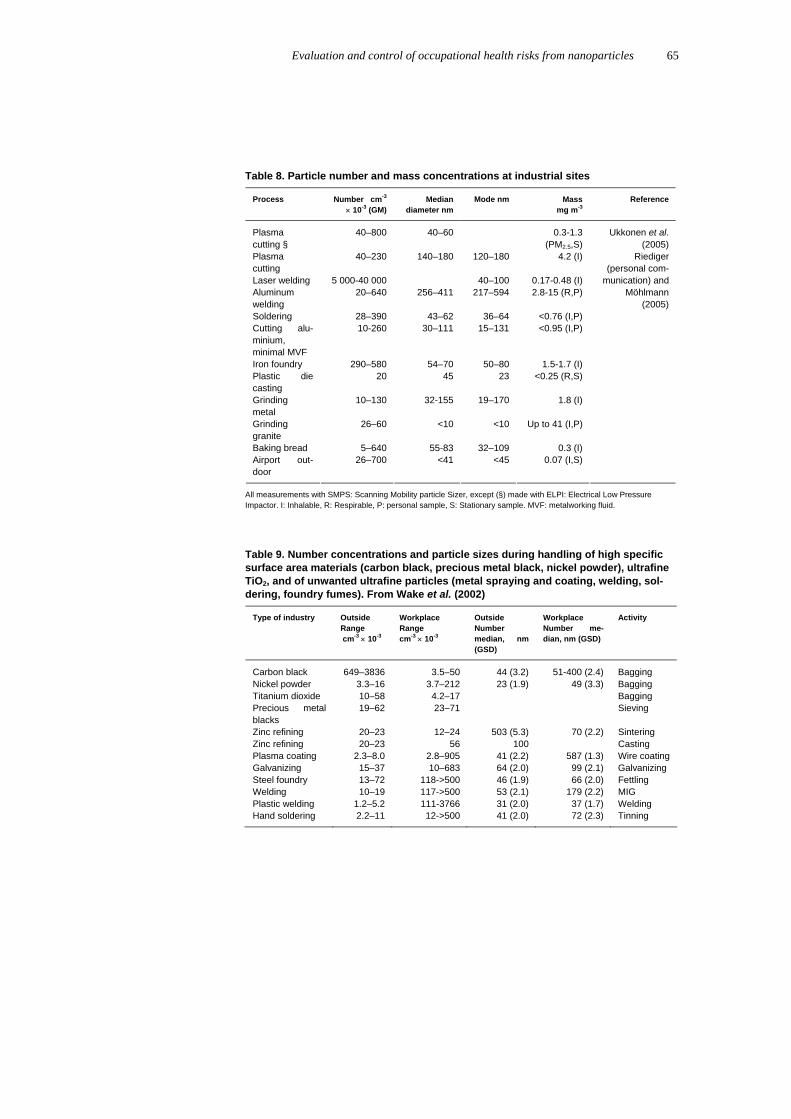
Evaluation and control of occupational health risks from nanoparticles 65
Table 8. Particle number and mass concentrations at industrial sites
Process Number cm-3 × 10⁻³ (GM)
Median diameter nm
Mode nm Mass mg m-3
Reference
Plasma cutting §
40–800 40–60 0.3-1.3 (PM2.5,S)
Ukkonen et al. (2005)
Plasma cutting
40–230 140–180 120–180 4.2 (I)
Laser welding 5 000-40 000 40–100 0.17-0.48 (I) Aluminum welding
20–640 256–411 217–594 2.8-15 (R,P)
Soldering 28–390 43–62 36–64 <0.76 (I,P) Cutting alu-minium, minimal MVF
10-260 30–111 15–131 <0.95 (I,P)
Iron foundry 290–580 54–70 50–80 1.5-1.7 (I) Plastic die casting
20 45 23 <0.25 (R,S)
Grinding metal
10–130 32-155 19–170 1.8 (I)
Grinding granite
26–60 <10 <10 Up to 41 (I,P)
Baking bread 5–640 55-83 32–109 0.3 (I) Airport out-door
26–700 <41 <45 0.07 (I,S)
Riediger (personal com-
munication) and Möhlmann
(2005)
All measurements with SMPS: Scanning Mobility particle Sizer, except (§) made with ELPI: Electrical Low Pressure Impactor. I: Inhalable, R: Respirable, P: personal sample, S: Stationary sample. MVF: metalworking fluid.
Table 9. Number concentrations and particle sizes during handling of high specific surface area materials (carbon black, precious metal black, nickel powder), ultrafine TiO2, and of unwanted ultrafine particles (metal spraying and coating, welding, sol-dering, foundry fumes). From Wake et al. (2002)
Type of industry Outside Range cm-3 × 10⁻³
Workplace Range cm-3 × 10⁻³
Outside Number median, nm (GSD)
Workplace Number me-dian, nm (GSD)
Activity
Carbon black 649–3836 3.5–50 44 (3.2) 51-400 (2.4) Bagging Nickel powder 3.3–16 3.7–212 23 (1.9) 49 (3.3) Bagging Titanium dioxide 10–58 4.2–17 Bagging Precious metal blacks
19–62 23–71 Sieving
Zinc refining 20–23 12–24 503 (5.3) 70 (2.2) Sintering Zinc refining 20–23 56 100 Casting Plasma coating 2.3–8.0 2.8–905 41 (2.2) 587 (1.3) Wire coating Galvanizing 15–37 10–683 64 (2.0) 99 (2.1) Galvanizing Steel foundry 13–72 118->500 46 (1.9) 66 (2.0) Fettling Welding 10–19 117->500 53 (2.1) 179 (2.2) MIG Plastic welding 1.2–5.2 111-3766 31 (2.0) 37 (1.7) Welding Hand soldering 2.2–11 12->500 41 (2.0) 72 (2.3) Tinning

66 Evaluation and control of occupational health risks from nanoparticles
Figure 26. Concentration ranges. For explanations see text.
1.E+
03
1.E+
04
1.E+
05
1.E+
06
1.E+
07
1.E+
08
Lase
r weld
ing
Plastic
weld
ing
Plasma c
oating
of w
ire
Plasma c
utting
Airport
outdo
orGalv
anizin
g
Aluminu
m weld
ingBak
ing br
ead
Iron f
ound
ry
Fettlin
g stee
l foun
dry MIG w
elding
Hand so
lderin
g Solderin
gPlas
ma cuttin
g
Bagging n
ickel p
owder
Metal g
rindin
g
Sieving
prec
ious m
etal bl
acks
Cutting
alum
ina
Granite
grindin
g
Baggin
g carbo
n black
Zink si
nterin
gBagg
ing TiO
2
Particles/cm3

Evaluation and control of occupational health risks from nanoparticles 67
5.3 Engineered nanoparticles
5.3.1 Production and handling
Plitzko et al. (2006) have reported preliminary results from measure-ments in Germany under laboratory scale and small-scale industrial pro-duction and handling. They found that these activities did not signifi-cantly increase particle concentration above background.
The US National Institute of Occupational Safety and Health (NIOSH, 2005) has published a Health Hazard Evaluation Report on employee exposure to carbon nanofibres during various handling operations in labo-ratories of a university. The tasks monitored were chopping, transferring about ½ kilo of carbon nanofibres from outside a laboratory hood to a beaker for weighing inside the hood, transfer, and manually mixing car-bon nanofibres with acetone. Measurements were made by stationary instruments, usually within less than one metre of any potential source of emission. Concentration of nanosized particles in the indoor background was less than outdoors. In terms of number (as measured by the Electrical Low Pressure Impactor) a slight increase was found for mixing above 400 nm, and above 500 nm for measurements made above the mixing vessel during mixing. A TEM analysis showed that the majority of fibres ap-peared as loosely bundled agglomerates.
5.3.2 Machining, wear, and degradation
One central question is if and to which degree machining, wear, and deg-radation sets free nanoaerosols or aerosols that, if deposited in the air-ways, have toxicological properties differing from those of the bulk mate-rials they were made of. Data are virtually absent and only the following could be retrieved. NIOSH (2005) studied sawing operations in laborato-ries of a university. The tasks monitored were cutting carbon nanofibre composite materials with a water-cooled table saw. Measurements were made by stationary instruments, usually within less than one metre of any potential source of emission. In terms of number (as measured by the Electrical Low Pressure Impactor) a slight increase was found for wet saw cutting for particles above 400 nm.
In a diploma work at Chalmers University of Technology (Li, 2006) nanoparticle release from abrasive wear of a nanocomposite was studied. The nanocomposite was polypropylene with nanoclay (montmorillonite). The author concluded that there was no nano particle release from the composite from abrasive wear. However the level of detection was un-clear. Combustion tests showed ten times higher particle number concen-trations found for the nanocomposites than for the pure propylene mate-rial and for all particle sizes from 10 nm to 2500 nm. The author specu-

68 Evaluation and control of occupational health risks from nanoparticles
lated that this might be more due to the incomplete combustion of the nanocomposite than to the release of nanoclay particles.
5.4 Background concentration
One of the great challenges in assessing exposures to engineered nanoparticles is that the ubiquitous combustion and evapora-tion/condensation processes can generate high background concentra-tions. This often occurs in synchrony with activation of the potential nanoparticle sources. An example of the importance of keeping track of other sources is given by Kuhlbusch et al. (2004) who showed that a bu-tane gas fork lift can be a dominating source of ultrafine particles during bag filling in a carbon black producing facility. Peters et al. (2006) found that while ultrafine particle concentrations in an engine machining and assembly facility possibly attributable to metalworking operations ranged from 250 000 to 750 000 particles cm-3, the concentrations in supply air heated by direct heating natural gas burners were above 1 000 000 parti-cles cm-3.

6. Specific exposure scenarios
6.1 Introduction
Production of engineered nanoparticles is a highly sophisticated process. It is likely that air contamination will be low and many materials will only be manufactured in kilogram quantities in the nearest future. Ex-perimental and pilot-scale production are considered important scenarios and exposure assessment can assist the pioneer enterprises in identifying and managing their exposure risks. It is possible that some pioneer manu-facturers are unaware of, or have limited data on health risks.
One aim of the project thus was to collect examples of specific nanoparticle exposure scenarios. The project group has had contact to several enterprises judged to be of potential relevance to the project. It was realized that while there are many enterprises on the lists of those interested in engineered nanoparticle technology, few industries actually manufacture or use engineered nanoparticles. This has greatly reduced the number of exposure scenarios that could be collected. This is not unique for the Nordic countries. According to colleagues in other Euro-pean countries their situation is similar. Some potential candidate enter-prises were taking part in the NANOSAFE 2 project13. As a consequence, they preferred to publish exposure relevant information in future NANO-SAFE 2 reports. As anticipated at the formulation of the present project, other enterprises were reluctant to disclose exposure related information in a form useful for the project. The available data for characterizing ex-posure scenarios is thus variable and limited in extent. General conclu-sions regarding exposure risk thus cannot be drawn.
6.2 Welding
The welding industry is a major player in worldwide manufacturing and encompasses a vast number of different welding processes. Many of these are similar to the thermal processes used for production of engineered nanoparticles. Welders are exposed to aerosols which are formed primar-ily through homogeneous nucleation of element vapour followed by competing growth mechanisms such as coagulation and condensation. Individual particles freshly formed near the welding arc are mainly spherical with diameters ranging from few nm to more than one μm de-pendent on welding methods. At National Institute of Occupational
• 13 http://www.nanosafe.org/

70 Evaluation and control of occupational health risks from nanoparticles
Health in Oslo, some preliminary particle size distribution measurements using a TSI SMPS instrument have been made for some common welding methods (see Figure 27, results supplied by Yngvar Thomassen). It is obvious from these preliminary data that the welding fume generated be considered as a nanoparticle containing aerosol.
Peak particle concentrations of different welding methods
0,00E+00
2,00E+05
4,00E+05
6,00E+05
8,00E+05
1,00E+06
1,20E+06
1,40E+06
1,60E+06
1,80E+06
0 100 200 300 400 500
mobility diameter [nm]
dN/d
log(
dmob
)[1/c
m3]
TIG (stainless steel)
MIG
Mixed TIG&MIG
TIG (aluminum)
TIG&MMA
MMA
Mixed TIG&MMA(simultaneous)
Figure 27 Peak particle concentration of different welding methods (results supplied by Yngvar Thomassen).
6.3 Exposure to amorphous SiO2 fume in smelters
In collaboration with National Institute of Occupational Health, Oslo, Elkem ASA has performed an exposure assessment of workers in 7 smelters producing silicon, ferrosilicon and micro silica14. In total 49 personal full-shift respirable air samples have been analysed by FTIR for amorphous SiO2. The highest arithmetic average concentration was found among the furnace tapping operators (3.5 mg m-3, n=27) in comparison to the micro silica recovery department (0.35 mg m-3, n=5). Although the average individual particle diameter in the freshly formed fume is about 150 nm, the fine particles tend to agglomerate in the recovery process to much coarser particles. Thus the highest exposure levels among workers are found in the furnace department and not during handling of the recov-ered fume.
• 14 Siri Hetland, STAMI-report-2005

Evaluation and control of occupational health risks from nanoparticles 71
6.4 Paint manufacturing
Conventional paint was manufactured by mixing solid and liquid ingredi-ents in large (5 m3) tanks (dissolvers). The solid materials were added manually from “big bags” handled with a crane or from bags that were emptied into the dissolver manually. In the future engineered nanoparti-cles may replace some of the fillers, pigments, and binders. If they were to be added as dry powders or granules and with unchanged technical controls, nanoparticle exposure may occur during bag emptying and dis-carding, during cleaning operations, and during inspection e.g. manual temperature control (Figure 28).
Figure 28. Temperature reading in dissolver.
6.5 Paint and lacquer sanding
The paint and lacquer industry has no regular production using engi-neered nanoparticles as raw materials. To insure the safety of potential future products using engineered nanoparticles the Danish National Re-search Centre for the Working Environment is conducting a research project in cooperation with the Danish paint and lacquer industry. The project will provide quantitative data on emission rate, size distribution, and toxicological properties of aerosols generated during sanding with electrical hand tools of paints, UV hardened lacquers, and fillers contain-ing nanoparticles.

72 Evaluation and control of occupational health risks from nanoparticles
6.6 Textile manufacturing
Through a high-technology project Fibertex A/S will utilise nanotechnol-ogy and nanoparticles for manufacturing nonwovens. Currently the pro-ject has not yet resulted in large-scale test productions and particle expo-sure data during production of non-woven textiles were not available. However, the materials are planned to be produced using the established spunmelt (Figure 29) and/or non-woven “felt” (Figure 30) production technologies (personal communication Fibertex). The production line is not enclosed. In both systems, the textile is produced from granules. In-corporation of the nanoparticles is anticipated to occur by adding them in functionalized form from a liquid master mix. The spunbond-meltblown technology is an integrated one-step process ranging from resin extrusion to lightweight fabric production.15
Figure 29. General production line for spun melt non-woven textiles.16
• 15 http://www.fibertex.com/da-DK/technology/spunmelt/Pages/default.aspx • 16http://www.fibertex.com/en-GB/technology/Spunmelt/PublishingImages/Spunbond.swf

Evaluation and control of occupational health risks from nanoparticles 73
The dry-laid needlepunch production technology is based on a two-step process. First, polypropylene resin is extruded into fibres. Secondly, these fibres are carded and needlepunched and then bonded thermally to form nonwovens. 17
Figure 30. General production line for non-woven needlepunch.18
The production technologies employ elevated temperatures to produce the polymer melt. Even though production occurs in non-enclosed envi-ronments direct exposure during production is expected to be low. The melt-technology is thought to retard liberation of the engineered particles during production. Elevated particle exposures are apparently not ob-served during production using conventional pigments.
There is no information on potential exposure to nanoparticles during use of nanoparticle-doped nonwovens and during waste treatment.
6.7 Spraying (surface treatments)
Currently nanoparticle-based nanofilm products or penetrative surface treatments (particles and chemicals that enter at least the outer surface layer of a material) receive increased attention in industry. Most of the current products are applied using pumps or pressurized cans or alterna-tively applying the chemicals with a soaked cloth. When scaling up the use of these products for application in e.g., the textile, paint and lacquer treatment or construction industries, these dispensing methods are no longer applicable. Professional application of large amounts of surface treatment products for building walls is currently conducted using com-pressed air dispersion or electro-spraying (Figure 31). Application of the
• 17http://www.fibertex.com/en-GB/technology/Needlepunch/Pages/default.aspx • 18http://www.fibertex.com/en-B/technology/Needlepunch/PublishingImages/pptofibers.swf

74 Evaluation and control of occupational health risks from nanoparticles
chemicals to horizontal surfaces may be by mobile units spraying or dis-pensing the chemicals directly onto the surface or vehicles (Figure 31). However, choice of method for industrial scale dispensing of the nano-particle doped or nanoparticle forming chemicals will depend on the effi-ciency of the treatment obtainable with a given method of application. Currently such information and consequently corresponding exposure data do not exist.
enarios for large scale applications of sur- treatments.
sical vapour deposition and similar may po-wever, such processes are generally with high vacuum preventing release
6scale)
aboratory to generated particles were colleted
particle counter and electrical low-pressure impactor. The results showed that concentrations could exceed 106 particles cm-3 during spraying, up to 10 mg m-3.
Figure 31 Two potential surface treatment sc
face
6.8 Nanoscale surface coating
Surface coating such as phytentially generate nanoparticles. Hoperformed in closed chambers and of particles.
.9 Production of metal oxide nanoparticles (laboratory
The liquid flame spray (LFS) method was used in a research lproduce metal oxide nanoparticles. Theas a powder. Production lasted 1 hour per day, during which period about100 mg powder was produced. Potential inhalation risks were identified to be in the production room and during handling and collecting the pow-der from the collector device. Air concentrations were measured using a condensation

Evaluation and control of occupational health risks from nanoparticles 75
6.10 Handling of carbon nanotubes
Handling of carbon nanotubes at SAAB, Sweden (and Bodycote Värme-
6.11 Laboratory handling of nanopowders
f laboratory technicians was Sizer. No increase relative to
e was not due to the resuspended particles, but was generated by the release of pressurized CO2.
6.12 Failure testing and demolition of carbon nanotube-
g) of CNT-doped Portland cement concrete (PCC) specimens. Figure 32 shows the laboratory-scale production and testing of the CNT-doped mortar sam-ples. Dispersion of the CNT in water before mixing was considered to result in the lowest exposure risk during CNT-PCC production. Even though some research groups successfully have worked with dry pow-ders, the traditional dry-mixing method was considered to be inadequate
behandling AB) is on a research and laboratory scale. In lack of toxico-logical, and occupational and industrial hygiene data the precautionary measures taken are to handle the fibres as asbestos. It was found that carbon nanotubes as dry powders from different suppliers differ in their properties, for example apart from size distributions their state of ag-glomeration and bundling differs. This may have significance from an occupational exposure perspective.
Particle concentration in the breathing zone omonitored using a TSI Fast Mobility Particle background was discernible during weighing or sonication. When cyclones that had been charged with goethite or bentonite were cleaned in a fume cupboard using pressurized CO2 a short (5 s) peak was detected in the breathing zone. The peak concentration of nanosized particles was about 106 particles cm-3 and about 30 times less for particles above 100 nm. In a later aerosol chamber test the pressurized CO2 was activated, and a similar peak was observed. It thus is likely that the peak of nanosized particles observed during cleaning of the cyclon
doped concrete
One of the potential uses of the extraordinary tensile strength of carbon nanotubes (CNT) is in reinforced concrete This suggests future occupa-tional CNT exposure scenarios such as during drilling and cutting con-crete and during demolition. In research laboratories developing these new types of concrete, potential exposure can take place during prepara-tion of concrete and e.g. failure testing.
The National Research Institute has in collaboration with Lawrence Technical University (MI, USA) initiated a feasibility study of the pro-duction and particle release during failure (mechanical testin

76 Evaluation and control of occupational health risks from nanoparticles
for application of CNT’s in the cement/concrete industry. The risk frodry mixing of CNT iglomeration of CNT is not well understood.
m s difficult to assess, because the dustiness and ag-
particles cm as measured wi
Analysis of the particle release from CNT-doped PCC is relevant for estimating the potential secondary exposure to workers during demolition and recycling as well as accidental mechanical failure of structures. De-structive testing was completed in a closed particle sampling and moni-toring chamber built around the mechanical compression test facility, Figure 32.
Preliminary results from the study have shown that both CNT-doped PCC and control PCC may release particles below 30-40 nm, during me-chanical failure. However most of the sub-micrometer particles released during the mechanical failure occurred in a size mode around 200 nm, Figure 33. The results suggest that release of particles in both size ranges during testing of CNT-doped PCC may be a higher than for the control PCC. Noteworthy, the total number concentration immediately after specimen failure was generally about 10 times higher (104 particles cm-3) when testing the CNT-doped PCC in the chamber than the PCC controls (103 particles cm-3).
Relatively large quantities of coarse particles were also released in the mechanical tests occasionally exceeding 500 -3
th the Aerosol Particle Sizer 3321 (TSI Inc.). These coarse particles have a typical peak mode around 1 μm and a geometric mean aerody-namic diameter around 1.3 μm (not shown).
Figure 32. Images from the CNT-PCC feasibility study showing top left) the production of the cement mortar based on liquid dispersed CNT, top right) molding and bottom left) the chamber for analysis of mechanical performance and bottom right) illustration of the de-formed mortar cube at the end of studies of mechanical strength and associated particle
release.

Evaluation and control of occupational health risks from nanoparticles 77
Even though it is a tempting conclusion that the higher particle concentra-tions generated during tests with CNT-doped PCC may be caused by release of individual CNT’s or bundles thereof during fracturing, this may not be the case. It may be caused by several other factors such as a poten-tial lower cement hydration or micro- to nano-structural heterogeneity. This will be further investigated during the project.
These findings could suggest that nanoparticles will be released at worksites, during drilling or cutting concrete and during demolition and recycling.
6.13 Ski waxing
Ski waxes are often based on polymers of fluorocarbons. Many of these waxes are powders with particles with nanoscale surface structures. These ski waxes are extensively and increasingly used and exposure to these products does occur. Professional ski waxers both in cross country and down hill skiing are occupationally exposed to these compounds. Their workplace is ambulating from place to place and the work is often carried out in provisional workplaces that are not adapted for this kind of work. There also is a large group of ski waxers who work as volunteers in non-profit sports clubs for youngsters. Many amateur skiers wax their skis themselves and can therefore also be exposed.
10Con
cent
ratio
n, d
N
Figure 33. Examples of particle number size distributions at peak concentrations for
particles generated during mechanical compressive failure testing of normal Portland clinker cement (Control PCC) and PCC doped with 0.15vol% CNT. Samples were cured for 7 days at 20°C. Data were corrected for background concentrations measured before
onset of failure.
11.00 10.00 100.00 1000.00
Size [nm]
100
1000
10000
100000
/dLo
gDp
[n/c
m3 ]
0.15vol% CNT PCC@20C-7day
Control PCC@20C 7day

78 Evaluation and control of occupational health risks from nanoparticles
6.14 “Consumers” exposed to sprays
tile, and lacquering retail and ompanies. Funded by Nano-Cover A/S the National Research Centre for the Working Environment is
products. Preliminary data have sts in a 0.2 m3 stirred aerosol chamber. Application
of a surface treatment product using a spray generated a particle size dis-
“Nanofilm”-producing pumps and spray cans are primarily intended forthe consumer market, but can also find application in e.g. furniture, tex-
production c
conducting a risk assessment of selected been obtained from te
tribution with one mode at 10-15 nm and another at 75 nm. Slightly lar-ger nanoparticles with a mode at 34 to 49 nm were generated using the pump version. Concentrations for a single ~1 sec spray resulted in up to 2.5x10⁵ particles cm-3. Using the pump, one stroke generated a total con-centration of about 103 particles cm-3 (Figure 34).
0.01
0.1
1
10
100
1 10 100 1000 10000
Diameter, nm
Con
cent
ratio
n, d
N
1000
10000
100000
1000000
/dlo
g(D
p) [n
/cm
3 ]
Product 1(Pump)Product 2(Spray)
icle size concentra-tions were measured using a Fast Mobility Particle Sizer Model 3091
Figure 34. Size distribution of aerosol generated during application of two different surface treatment products. Part
(5.6–560 nm) and a time-of-flight Aerosol Particle Sizer Model 3321 (520–20.000 nm), both from TSI.
In both product types only a small fraction of the particles were larger than 200 nm showing that these products are truly based on nanoparticle technology. The preliminary results show that application of spray-on surface treatment products generates aerosols in the nanoparticle range. They also show that the method of application (and possibly also the type

Evaluation and control of occupational health risks from nanoparticles 79
of product) has a large effect on particle concentration. The true number of nanoparticles may be higher as a fraction of the generated droplets may contain several individual nanoparticles. This will result in agglom-erates of nanoparticles after the liquid has evaporated and complicates evaluation of the exposure. It should be noted that these experiments
ere conducted in an aerosol chamber and therefore that the concentra-tions may not be indicative of personal exposures during use.
w


7. Occupational exposure during entire life cycle
Nanotechnology and Life Cycle Assessment was the topic of a workshop organized by the US Environmental Protection Agency/Woodrow Wilson International Centre for Scholars and the European Commission (Karn and Aguar, 2007). The workshop quoted a literature search by Lekas (2005) to document that due to the newness of the field, only seven life cycle assessments involving nanotechnologies had been published. These were: • Automotive application
- Clay polypropylene nanocomposite for light-weight construction - Nanoscale platinum-group metal for catalysts
• Chemical application - Nano-varnish - Powder-coating technology
• Electronics - Semiconductor crystals and carbon nanotubes for displays - Desk-top computer displays
• Energy - Quantum dots and semiconductor crystals in light-emitting
diodes The project group could not meaningfully assign likelihood and intensity of occupational nanoparticle exposure for representative exposure scenar-ios during a life cycle. The reasons were • The present project has demonstrated that the amount of information
on occupational exposure scenarios and quantitative exposure infor-mation for engineered nanoparticles in the air is very limited
• The combined set of all conceivable occupational exposure scenarios during a life cycle is immensely broad
• There will be fundamental differences between exposure scenarios where engineered nanoparticles are manufactured by workers trained in handling engineered nanoparticles and final product utilization, where users may not be aware of any special requirements for dust control.
• Unknown changes in societal behaviour in using nanoproducts

82 Evaluation and control of occupational health risks from nanoparticles
As a consequence, the group only prepared a list of some “interesting scenarios”.
Surface treatment of textiles with engineered nanoparticles leads to reduced need for washing, reducing use and environmental discharge of detergents. On the other hand, there will be a constant need for maintain-ing the surface treatment with engineered nanoparticles. This task will probably be carried out by specialized workers, thereby increasing poten-tial exposure but for a limited group of persons. Similarly for glass treat-ment where durability is low, needing frequent re-application.
Engineered nanoparticles in paints will increase the life time of the painted surface, reducing paint consumption and causing fewer man-hours of exposure.
Recycling and handling of problem waste could become as complex as for to-days electronic equipment.
Some engineered nanoparticles are designed to react with the matrix thereby loosing their original properties. Demolition of concrete • Nanosilica based. While nanosilica particles have reacted with the ma-
trix, the problem will probably not be liberation of these nanoparticles, but the increased strength which will render constructions harder to pull down.
• CNT enforced. The results presented in section 6.12 could suggest that generation of nanosized particles should be evaluated for such scenarios.
Engineered nanoparticle reinforced composites. If the materials are or-ganic, they can be incinerated.
Use of wear resistant surfaces in e.g. machine and pump units will re-duce the amount of e.g. hard metals and prolong life-time of the product. This will have implications for the number of workers (normalized to number of units) exposed during manufacturing of the traditional units, while posing potential new exposures during manufacture of the surfaces and later maintenance, repair and recycling.
Car catalysts: there is a potential for releasing nanoparticles into the environment upon heating.
Waste handling and sorting
• If materials or products containing engineered nanoparticles are hand-led as ordinary waste special attention should be paid to situations where nanosized particulate material becomes concentrated such when collecting batteries and electronics.
• Car catalysts will probably be treated as toxic metals corresponding to the elemental composition of the catalyst.

8. Quality of information in MSDS
8.1 Introduction
Material safety data sheets (MSDS) are important for safe handling of chemicals at the work place. The EU has legislated the requirements and instructions for MSDS in Commission directive 91/155/EEC of 5 March 1991 which was amended in 2001 (Com. Dir. 2001/58/EC). The design of MSDS is similar, although not identical, in countries outside the EU. Classification and labelling as “hazardous” has many consequences for the compound in question, e.g. regarding exposure control, first aid measures, storage, and transportation requirements.
Within the EU classification and labelling is regulated (Dir. 67/548/EC and 1999/45/EC). A UN initiative, together with OECD and EU, has resulted in a Globally Harmonised Classification System (GHS), which contains harmonised criteria and hazard communication elements.
The responsibility for the information in the MSDS lies on the sup-plier who places the product on market and there is no public notification or requirements of quality control. It may therefore be expected that the accuracy and quality of the information varies. A few reports have warned about deficiencies in the information in MSDS (Bernstein, 2002; Kopstein, 2006; Frazier et al. 2001; Welsh et al. 2000). Also at the 1st International Symposium on Nanotechnology and Occupational Health, in Buxton, UK, October a workshop on regulatory implications Kuempel and Aitken (2004) concluded that the adequacy of labelling and of MSDS should be considered, in particular whether data on particles of larger size or different form or composition is relevant to the nanomaterial.
There is incomplete information of the toxicity of nanoparticles and major gaps in the knowledge necessary for risk assessment (SCENIHR, 2006). These gaps include nanoparticle characterisation, the detection and measurement of nanoparticles, the dose-response, fate, and persistence of nanoparticles in humans and in the environment, and all aspects of toxi-cology and environmental toxicology related to nanoparticles.
As part of the project the quality of MSDS for products available on the market was thus examined. The MSDS to be studied were selected from a range of nanomaterials within five categories.

84 Evaluation and control of occupational health risks from nanoparticles
8.2 The MSDS
Some of the MSDS were obtained from producers of nanomaterials in the Nordic countries that were known to us. Other materials and suppliers were identified by the Google search engine and the MSDS were usually downloaded from the suppliers’ websites. The MSDS were retrieved between June 2006 and January 2007. Materials were chosen with pri-mary particles sizes as small as possible, to reflect a range of properties. Some of the MSDS were provided primarily for the marketing in the USA and Canada. The materials categories were: • Silica (8) • Titanium dioxide (4) • Zirconium dioxide (2) • Carbon nanotubes (11) • C60 Fullerenes (2) • Cadmium-based quantum dots (3) A check list was constructed based on the instructions “Guide to the compilation of safety data sheets” in the annex of the EU Commission Directive 2001/58/EC. Each MSDS was evaluated by three toxicologists following this check list. Published data on toxicology was used to evalu-ate the toxicological information.
8.3 Results in brief
In general the identification of the substance and the identification of the company were satisfying. Many MSDS however lacked emergency tele-phone number. In general, the compositions were well described, as far as the toxicologists could judge. However for many materials the EINECS number was missing, mainly in MSDS that appear were designed primar-ily for non-EU countries. R-phrases should be given in under the identifi-cation. Only in few cases the R-phrases were stated in this section al-though in other cases they were listed under the heading “Toxicology”. Within the groups there was inconsistency in listing of R-phrases. For instance for carbon nanotubes a few MSDS indicated labelling symbol “Xi” for irritant or “T” for toxic and R-phrases R36/37 and R36/37/40 but in most instances there were no R-phrases listed in the MSDS.
Classification and labelling were many times missing from the MSDS, because there were no test results available for the substance or com-pound in question. Toxicological testing results were in few cases avail-able and mainly concerning acute toxicity and irritancy (e.g. for silica and titanium dioxide, car MSDSs), but the references were missing. One rea-son could be that
Evaluation and control of occupational health risks from nanoparticles 85
• particle size is not one of the characteristic which needs to be provided • a substance/compound does not need to be retested if the particle size
changes to nano level or if the material contained nanoparticles. In some cases “nano” was indicated in the commercial name of the mate-rial. Most of the carbon nanotube materials were identified as graphite.
First aid and fire-fighting measures were provided. In some cases the toxicologists were uncertain about the efficacy of the recommended first aid measures, due to the lack of information in the toxicity testing results and classification.
The quality of the proposed handling, storage and exposure con-trols/personal protection varied much between the MSDS even for mate-rials of the same character. In some there was detailed recommendation on engineering controls, personal protection. E.g. some MSDS recom-mended respiratory protection with specific (standard) filter types that are effective for protection against ultra-fine aerosols. In other MSDS the instructions for recommendations for handling, storage and exposure controls/personal protection were very brief.
Also the descriptions of physical and chemical properties, conditions and materials to avoid were very different between the MSDS. Some MSDS had a description with one or two statements, whereas others had many properties described. For the carbon-based materials the possibili-ties of fire, reaction with strong oxidants and generation of carbon di- and monoxide were described. In the instructions in the EU commission di-rective there is no recommendation for giving a dustiness value and in no MSDS was dustiness described, although sometimes other information in the MSDS indicated that the materials were dusty.
Some MSDS had well described lists of exposure limit values and tox-icity tests. Even for similar materials however the described toxicological properties varied.
There was very little ecological information in the MSDS. For some materials it was recommended that the materials should be disposed of by incineration under local regulations.
8.4 Discussion
Only a few of the MSDS were available in the Nordic languages. The identification was generally satisfying, although quite many were not identified as nanomaterials. However such identification is not required by current legislation. In some instances the CAS number was missing and in many instances the EINECS identification. C60 fullerenes have a unique CAS number but are not listed in the European chemical sub-stances information system and do therefore not have an EINECS num-

86 Evaluation and control of occupational health risks from nanoparticles
ber. A cautious approach might suggest C60 fullerenes be treated as new chemicals.
Usually the carbon nanotubes were described as graphite. Recent data demonstrate that carbon nanotubes are inflammatory when deposited in the lung, and cause persistent pathological changes of granulomas and fibrosis (Lam et al., 2006; Donaldson et al., 2006). The potency for the toxic effects appears to be greater than quarts in several investigations. It may therefore be misleading to describe the toxicity of carbon nanotubes as the same as graphite in view of current scientific data.
Also for nanomaterials made of nanocrystals containing cadmium, se-lenium or tellurium components, the toxicity in the MSDS was based on data from larger particles containing these elements, and not on these nanosized homologues. In some cases the MSDS states that the toxicity may be more or less compared to the larger corresponding particles, thus caution is encouraged when working with these materials.
In general the compounds/materials were practically not tested, and if so, many times for acute toxicity only. Irritancy was referred to in some. When there are no tests available, this means no classification and there-fore no consequences for e.g. transportation and one could ask, if the “First aid” measures are OK. On the other hand, if one reads the “First aid” instructions one could come to a conclusion, that some hazardous properties are suspected.
It is suggested in the EU commission directive 2001/58/EC that it may be necessary to mention hazards, such as dustiness, which do not result in the classification, but may contribute to the overall hazards of the mate-rial. Because even high number concentrations of nanoparticle aerosols are invisible and the particles have the potency of being effectively de-posited in the lower respiratory tract it could be argued that dustiness is an important parameter similar to the vapour pressure which is commonly described in MSDS for volatile organic compounds. A description of dustiness would be an important instrument in work place risk manage-ment. It was not described in the MSDS that nanoaerosols may have unique sedimentation and diffusion properties. However in some in-stances the recommendations on exposure control and personal protection were satisfying for nanoaerosols.

9. Trends in uses of nanoparticles
The global manufacturing output of nanoenabled products will raise from 30 billion US$ in 2005 to 2.6 trillion US$ in 2015. Large production vol-umes can be expected in cosmetics, textiles, coatings, and paints. Over the next five years a growth in use of nanoparticles is foreseen in relation to production of fuel cells, solar cells, and smart surfaces (Friedrichs and Schulte, 2007).
The Danish Ministry of Research, Technology, and Development (2004) has identified seven prioritized areas for development and applica-tion nanotechnology. One area is “nanomaterials with new functional properties”. Some examples are listed in Figure 35.
Figure 35. Examples of development and application nanotechnology, from Danish Min-istry of Research, Technology, and Development (2004).
Traditional producers of bulk powders are likely to manufacture products with ever decreasing mean particles size, i.e. having an increasing frac-tion of particles in the ultrafine size region. Major uses of engineered nanoparticles can be expected for enhancement of “old” materials, such

88 Evaluation and control of occupational health risks from nanoparticles
as use of carbon nanotubes in producing high performance sports gear and scratch resistant paints.
Engineered nanoparticle production in the Nordic countries is ex-pected to remain small on a global scale. However, there can be niche production of functional nanoparticles, e.g. in relation to fuel cells and osmotic membranes.
The trend in the construction industry is particularly interesting be-cause of its size both in number of employed persons and consumption of raw materials, the large crowd of do-it-your-self persons. A report on nanotechnology and construction (Mann, 2006) has identified the follow-ing nanoparticle based raw materials
• Silica. It is already in general use for improving mechanical properties
and durability of concrete, see also section 2.5.2. • TiO2 (anatase). Introduced either in the building matrix or surface
coatings the photo (solar-UV) catalytic action breaks down contami-nants thereby potentially facilitating de-contaminating e.g. soiled facades by rain and reducing gaseous polluting indoors or in nearby air-spaces outdoors.19
• Carbon nanotubes. Improves the mechanical properties of concrete, see also section 6.13.
The paint and lacquer industry, already using ultrafine particle based raw materials expects a large increase in use of engineered nanoparticles.
Many future methods for production of engineered nanoparticles are expected to be based on production in liquids. The technological advan-tage will be e.g. better control of the properties, such as reproducible size distribution and agglomeration/aggregation. From a health point of view the advantage will be elimination of the need for down-stream users to handle dry materials.
• 19 Project supported by European Commission, see http://www.picada-project.com

References
BAuA. (2006) Easy-to-use workplace
control scheme for hazardous sub-stances. http://www.baua.de/nn-_18306/en/Topics-from-A-to-Z/Hazardous-Substances/workplace-control-scheme.pdf
Balazy A, Podgorsky A, Gradon L. (2004). Filtration of nanosized aero-sol particles in fibrous filters. I Ex-perimental results. Journal of Aerosol Science, 35(Supplement 2): 967-968.
Balazy A, Toivola M, Reponen T, Podgorski A, Zimmer A, Grinshpun SA. (2006). Manikin-Based Perform-ance Evaluation of N95 Filtering-Facepiece Respirators Challenged with Nanoparticles. Ann Occup Hyg, 50(3): 259-269.
Bernstein JA. (2002) Material safety data sheets: are they reliable in identi-fying human hazards? J Allergy Clin Immunol;110:35-38.
BGIA. (2007) Ultrafine (Aerosol)-Teilchen und deren Agglomerate und Aggregate.
http://www.bgiaarbeitsmappedigital.de/schnupperdokument.php?download=1
Bohgard M, Anderber MT, Ekholm A.-K. (1994) Source characteristics of emitted aerosol in the size range 0.02 to 10µm at pigment handling in dye manufacturing. J Aerosol Sci 25 (Suppl.1): S461-S462
CEN (2006). EN 15051 Workplace atmospheres – Measurement of the dustiness of bulk materials – Re-quirements and reference test meth-ods. European Committee for Stan-dardization. Brussels.
Cherrie JW, Schneider T, Spankie S, Quinn M. (1996) A new method for structured, subjective assessments of past concentrations. Occupational Hygiene 3:75-83.
Cherrie JW, Soutar A, Tran L, Cowie H. (2004)Variability and uncertainty in chemical exposures for regulatory assessments. IOM Report TM/04/04. http://www.iom-
world.org/research/iomreports.php#I OMREsearchReports
Christensen FM, de Bruijn JHM, Han-sen BG, Munn, SJ, Sokull-Klüttgen B, Pedersen F. (2003) Assessment tools under the new European Union chemicals policy. GMI 41. 2003;1-19.
Commission directive 2001/58/EC, Official Journal L 212/24 2001, P. 24–33.
Commission directive 91/155/EEC, Official Journal L 076, 22/03/1991 P. 0035-0041
Danish Ministry of Research, Technol-ogy, and Development (2004) Teknologisk fremsyn om dansk nano-videnskab og nanoteknologi http://teknologiskfremsyn.dk/download/91.pdf .
Deer WA, Howie RA and Zussman JU. (1966) An introduction to rock-forming minerals. Longman Scien-tific&Technical, England.
DIN (2006). DIN 55992-1. Determina-tion of a parameter for the dust forma-tion of pigments and extenders – Part 1: Rotation method (in German). DIN Deutsches Institut für Normung. Beuth Verlag, Berlin.
Donaldson K, Aitken R, Tran L, Stone V, Duffin R, Forrest G, Alexander A. (2006) Carbon nanotubes: a review of their properties in relation to pulmo-nary toxicology and workplace safety. Toxicol Sci 92:5-22.
Elkem Materials (2007) http://www.concrete.elkem.com/hits/internet.nsf/framesettopmenu?read-form&id=materialseng&full=full&lo=konsern_ny
Endo Y, Alonso M. (2001) Physical Meaning of Specific Cake Resistance and Effects of Cake Properties in Compressible Cake Filtration. Filtra-tion & Separation 38(7):42-46.
Fibertex (2007). http://www.fibertex.com/en-GB/-news-and-events/Press/News/Pages-/DanishHighTechnologyFund.aspx

90 Evaluation and control of occupational health risks from nanoparticles
Frazier LM, Beasley BW, Sharma GK, Mohyuddin AA (2001). Health in-formation in material safety data sheets for a chemical which causes asthma. J Gen Intern Med 16:89-93.
Friedrichs S, Schulte J. (2007) Envi-ronmental, health and safety aspects of nanotechnology—implications for the R&D in (small) companies. Sci-ence and Technology of Advanced Materials 8:12–18.
Hakim LF, Portman JL, Casper MD, Weimer AW. (2005) Aggregation be-haviour of nanoparticles in fluidized beds. Powder Technol 16:149–160.
Haldor Topsoe (2007) http://www.topsoe.com/site.nsf/all/BBNN-5PFJAE?OpenDocument Ac-cessed 2007-07-05 .
Hamelmann F, Schmidt E. (2004) Methods for Characterizing the Dustiness Estimation of Powders. Chemical Engineering & Technology 27(8):844-847.
Heim M, Mullins BJ, Wild M, Meyer J, Kasper G. (2005). Filtration effi-ciency of aerosol particles below 20 nanometers. Aerosol Science and Technology 39(8):782-789.
Hext PM, Tomenson JA, Thompson P. (2005) Titanium dioxide: inhalation toxicology and epidemiology. Ann Occup Hyg 49:461-472.
Hinds, WC, 1999. Aerosol Technology. 2nd ed John Wiley & Sons, Inc., New York.
Hoet PHM, Brüske-Hohlfeld I, Salata OV. (2004) Nanoparticles – known and unknown health risks. Journal of Nanobiotechnology 2:12.
ICON (2006a). http://cohesion.rice.edu/CentersAndInst/ICON/emplibrary/Phase%20I%20Report_UCSB_ICON%20Final.pdf Accessed 2007-06-06
ICON (2006b) http://cohesion.rice.edu/CentersAndInst/ICON/emplibrary/ICONNanotechSurveyFullReduced.pdf Accessed 2007-06-06
IVA (2006). En nanostrategi för Sveri-ge - ett förslag från IVA (A nanostra-tegy for Sweden - a proposal from IVA). IVA-M 363, IVA (The Royal Swedish Academy of Sciences), Stockholm.
Jonas EC, Oliver RM. (1967) Size and shape of montmorillonite crystallites. Clays Clay Miner. 15:27–33.
Karn B, Aguar P (2007) Nanotechnol-ogy and Life Cycle Assessment. Syn-thesis of Results Obtained at a Work-shop. Washington DC, 2-3 October 2006.http://www.nanotechproject.org/111/32007-life-cycle-assessment-essential-to-nanotech-commercial-development
Kim S, Harrington M, Pui D. (2007) Experimental study of nanoparticles penetration through commercial filter media. Journal of Nanoparticle Re-search 9(1):117-125.
Kopstein M.(2006) Potential uses of petrochemical products can result in significant benzene exposures: MSDSs must list benzene as an in-gredient. J Occup Environ Hyg 3:1-8.
Kuempel E, Aitken R. (2004) Work-shop group G. Regulatory implica-tions. First International Symposium on Occupational Health Implications of Nanomaterials. Buxton, 2004 http://www.hsl.gov.uk/capabilities/nanosymrep_final.pdf#search=%-22buxton%20hsl%20niosh%20nano%20%22 Accessed 2006-09-18
Kuhlbusch TA, Fissan H. (2006) Particle characteristics in the reactor and pellet-izing areas of carbon black production. J Occup Environ Hyg 3:558–567.
Kuhlbusch TAJ, Neumann S, Fissan H. (2004) Number size distribution, mass concentration, and particle composi-tion of PM1, PM2.5, and PM10 in bag filling areas of carbon black produc-tion. Journal of Occupational and En-vironmental Hygiene 1:660–671.
Lam CW, James JT, McCluskey R, Arepalli S, Hunter RL. (2006) A re-view of carbon nanotube toxicity and assessment of potential occupational and environmental health risks. Crit Rev Toxicol 36:189-217.
Lekas D. (2005) Analysis of Nanotech-nology from an industrial ecology perspective. Part I: Inventory and evaluation of life cycle assessments of nanotechnologies, revised draft, Yale School of Forestry & Environ-mental Studies.
Liden G. (2006) Dustiness testing of materials handled at workplaces. Ann Occup Hyg;50:437-439.

Evaluation and control of occupational health risks from nanoparticles 91
Li P. (2006) Development of Analyses Methodology for Optimum Charac-terization of Nanoclay and Evaluation of Nano Particle Release from PNC. Diploma work, Dep. Materials and Manufacturing Technology, Chalmers University of Technology, Göteborg.
Mann S. (2006) Nanotechnology and Construction. Institute of Nanaotech-nology. http://www.nanoforum.org/dateien/temp/Nanotech%20and%20Construction%20Nanoforum%20report.pdf-?17072007111038
Mark D. (2004) Session 3: Exposure and control issues. First International Symposium on Occupational Health Implications of Nanomaterials. Bux-ton, 2004 http://www.hsl.gov.uk/capabilities/nanosymrep_final.pdf#search-=%22buxton%20hsl%20niosh%20nano%20%22
Maynard AD, Baron PA, Foley M, Shvedova AA, Kisin ER, Castranova V. (2004) Exposure to carbon nano-tube material: aerosol release during the handling of unrefined single-walled carbon nanotube material. J Toxicol Environ Health A 67:87-107.
Maynard AD. (2002) Experimental determination of ultrafine TiO2 deag-glomeration in a surrogate pulmonary surfactant: Preliminary results. Ann Occup Hyg 46(Suppl. 1):197-202.
Maynard AD. (2007) Nanotechnology: The Next Big Thing, or Much Ado about Nothing? Ann Occup Hyg 51:1–12.
Moloney FJ, Collins S, Murphy GM..(2002) Sunscreens: Safety, Effi-cacy and Appropriate Use. American Journal of Clinical Dermatology 3(3):185-191.
Möhlmann C. (2005) Vorkommen ultrafeiner Aerosole an Arbeits-plätzen. Gefahrstoffe – Reinhalting der Luft 65(11/12):469-471.
Nanosafe 2 newsletter http://www.nanosafe.org/node/815
NIOSH (2005) Health Hazard Evalua-tion Report. http://www.cdc.gov/-niosh/hhe/reports/pdfs/2005-0291-3025.pdf .
NIOSH (2007). Progress Toward Safe Nanotechnology in the Workplace. No. 2007-123, NIOSH, Cincinatti
http://www.cdc.gov/niosh/docs/2007-123/pdfs/2007-123.pdf
Perez E, Sandgren P. (2007). Nanotek-nikens innovationssystem (The Inno-vation system of nanotechnology). VA 2007:01, VINNOVA (The Swed-ish Governmental Agency for Innova-tion Systems), Stockholm.
Peters G (2004). Risk evaluation & control: Current perspective. Nano-materials a risk to health at work? First International Symposium on Oc-cupational Health Implications of Nanomaterials. Buxton, 2004 http://www.hsl.gov.uk/capabilities/nanosymrep_final.pdf#search=%2-2buxton%20hsl%20niosh%20nano%20%22
.Peters TM, Heitbrink WA, Evans DE, Slavin TJ, Maynard AD. (2006) The mapping of fine and ultrafine particle concentrations in an engine machin-ing and assembly facility. Ann Occup Hyg 50:249-257.
Plitzko S, Gierke E, Gernert U. (2006) Syntetische Nanopartikel and Ar-beitsplätzen. http://www.baua.de/nn_43190/sid_7468EAEA66E55E01C29EA014515D674B/nsc_true/de/Themen-von-A-Z/Gefahrstoffe/Nano-technologie/pdf/Vortrag-Plitzko02.pdf See also http://www.baua.de/nn_43190/sid_663CE4A3CB8D08E4118C6371F5A70CD2/nsc_true/de/Themen-von-A-Z/Gefahrstoffe/Nanotechnologie/pdf/Vortrag-Plitzko-03.pdf
Preining O (1992). The science of ultrafine aerosols. Pure & Appl Chem 64(11):1679-1684.
RIP 3.2 (2005) Technical Guidance Document on preparing the Chemical Safety Report under REACH – Scop-ing Study – Phase 1 A (REACH Im-plementation Project 3.2-1A http://ecb.jrc.it/documents/REACH/RIP_FINAL_REPORTS/RIP_3.2-1_CSA-CSR_SCOPING/EXPO-SURE_SCENARIOS/RIP3.2-1_WP_1_ES_Final_28072005.doc
Rosén G. (2002). Seeing is Believing. Ann Occup Hyg 46(1):3-4.
SCENIHR (2006) Modified opinion (after public consultation) on the ap-propriateness of existing methodolo-gies to assess the potential risks asso-ciated with engineered and adventi-

92 Evaluation and control of occupational health risks from nanoparticles
tious products of nanotechnologies. http://ec.europa.eu/health/ph_risk/committees/04_scenihr/docs/scen-ihr_o_003b.pdf
SCENIHR (2007). Opinion on the appropriateness of the risk assessment methodology in accordance with the technical guidance documents for new and existing substances for as-sessing the risk of nanomaterials. http://ec.europa.eu/health/ph_risk/committees/04_scenihr/docs/scen-ihr_o_004c.pdf
Schimberg RW, Ukkonen A. (2003) Ultrafeine und feine partikeln in Gi-essereien (Bronze) und beim Schweissen. BIA_Report 7/2003, pp 163-173. http://www.hvbg.de/d/-bia/pub/rep/rep04/bia0703.html Ac-cessed 2006-09-19
Schneider T, Kildesø J, Breum NO. (1999) A two compartment model for determining the contribution of sources, surface deposition and resus-pension to air and surface dust con-centration levels in occupied rooms. Build Environ 34:583-595.
Schneider T, Olsen I, Jørgensen O, Laursen B. (1991) Evaluation of ex-posure information. Appl Occup En-viron Hyg 6:475-481.
Schaaf van der D, HeussenH, Wijk van M., Feber le M., Noy D, Tielemans E. (2006) The “Substance Manager”, a generic tool for SMEs to control chemical risks at work. Part 1: Back-ground, capabilities and future devel-opments. BOHS Conference 2006, Book of Abstracts.
Semple SE, Proud LA, Tannahill SN, Tindall ME, Cherrie JW (2001) A training exercise in subjectively esti-mating inhalation exposures. Scand J Work Environ Health 27:395-401.
Stuer-Lauridsen F, Kamper A, Borling P, Petersen GI, Hansen SF, Baun A. (2007). Kortlægning af produkter der indeholder nanopartikler eller er base-ret på nanoteknologi. Kortlægning af kemiske stoffer i forbrugerprodukter Nr 81. Danish Environmental Protec-
tion Agency. http://www2.mst.dk/Udgiv/publikationer/2007/978-87-7052-468-1/pdf/978-87-7052-468-1.pdf
Technical Guidance Document on Risk Assessment, Part 1, 2.2.2.4. (2003) http://ecb.jrc.it/Documents/TECHNICAL_GUIDANCE_DOCUMENT/EDITION_2/tgdpart1_2ed.pdf)
Thomassen Y, Koch W, Dunkhorst W,Ellingsen DG, Skaugset NP, Jord-bekken L, Drabløs A, Weinbruch S (2006) Ultrafine particles at work-places of a primary aluminium smelter. J Environ Monit 8:127-133.
Tielemans E. (2007) Evaluation of the Stoffenmanager. http://www.bohsorg/resources/res.aspx/Resource/filename/734/Session-_9b__Evaluation_of_the__Stoffenmanager__Eric_Tielemans__TNO.pdf
Tielemans E, Warren N, Schneider T, Tischer M, Ritchie P, Goede H, Kromhout H van Hemmen J, Cherrie J. Tools for regulatory assessment of occupational exposure: -development and challenges. Journal of Exposure Science and Environmental Epidemi-ology. Accepted.
Ukkonen A, Lamminen E, Kasurinen H. (2005) Measuring the size distribu-tiion and concentration of particles formed in plasma arc cutting. NOSA Aerosol Symposium, Göteborg, Swe-den 2005. http://www.fysik.lth.se/eriksw/NOSA2005/nosa2005proceedings.pdf
Wake D, Mark D, Northage C. (2002) Ultrafine aerosols at the workplace. Ann Occup Hyg 46(Suppl 1):235-238.
Welsh MS, Lamesse M, Karpinski E. (2000) The verification of hazardous ingredients disclosures in selected material safety data sheets. Appl Oc-cup Environ Hyg 15:409-20.
Woodrow Wilson International Center for Scholars (2007) A nanotechnolo-gical consumer products inventory. http://www.nanotechproject.org/index.php?id=44&action=intro . Acsessed June 2007

Resume
Anvendelse af tekniske nanopartikler byder på store økonomiske og tek-niske muligheder. Nogle af disse muligheder skyldes partiklernes speciel-le egenskaber, herunder at de kan fremstilles med særlige reaktive egen-skaber. På grund af de mulige sundhedsrisici forbundet hermed har for-skere, administratorer og industrien igangsat initiativer for at fremskaffe viden om arbejdsbetinget eksponering og at fastlægge, hvad der er sikker brug af de forskellige tekniske nanopartikler.
Rapporten giver et generelt overblik over nanopartikler og hvordan de fremstilles og anvendes i industrien i de nordiske lande. Der skelnes mellem
• Tekniske nanopartikler, dvs. partikler der har en diameter på mellem 1
og 100 nm og som er fremstillet med det formål at give dem specifikke egenskaber som form, størrelse, overfladeegenskaber og kemiske egenskaber.
• Ultrafine partikler, et udtryk der har været brugt til at beskrive luft-bårne partikler som er mindre end 100 nm. Betegnelsen “ultrafine” har været i brug længere end “nano”. Betegnelsen “ultrafine” bruges ofte for partikler der er opstået som (uønsket) biprodukt ved fx forbræn-ding og svejsning. Også flere partikler fremstillet med vilje med stør-relse i nanoområdet (fx carbon black, silicarøg, og titandioxid TiO2) benævnes ofte “ultrafine”.
Flere materialeteknologier involverer processer som transformere kon-ventionelle materialer til partikler i nanostørrelse. Fx anvender termisk overfladecoating med plasmaspray nanopartikler for at opnå en coatning med nanoegenskaber. Høje koncentrationer af partikler af nanostørrelse dannes også som biprodukt ved konventionelle processer hvor der indgår fordampning/kondensation.
Tekniske nanopartikler omfatter metalliske og keramiske nanopar-tikler, fullerener, en af de mest kendte nanopartikler, nanorør, hvor de mest kendte er nanorør af kulstof, nanofibre, nanoler, nanokapsler, dendrimerer og kvanteprikker.
Nogle eksempler på forskning, fremstilling og anvendelse af nanopar-tikler præsenteres for hvert af de nordiske lande.
Både partiklernes størrelsesfordeling og deres tilbøjelighed til at afgi-ve støv når de håndteres er vigtige data for en risikovurdering, både for eksisterende og nye stoffer. Annex V af Dir 67/548/EEC dækker endnu ikke i tilstrækkelig grad over dette testbehov. I mangel af formelle krav har projektgruppen foreslået, at et første trin i en karakterisering bør om-

94 Evaluation and control of occupational health risks from nanoparticles
fatte partikelstørrelse, form, agglomereringstilstand, specifikke overfla-deareal, krystallinitet samt grundstofsammensætning. Tre pulverprøver blev karakteriseret efter dette skema.:
• Ikke-coatet titan dioxid pigment (anatas) • Aluminium behandlet ultrafin titan dioxid (rutil) • Tør silica røg Som eksempel blev der fundet følgende specifikke overflade arealer: 5.5 m2 g-1 for titandioxid pigment, 112 m2 g-1 for ultrafin titan dioxid og 12 m2
g-1 for silicarøg. De få støvningstest der er publiceret viser at håndtering af nanopulver
har en tilbøjelighed til at afgive partikler der har en størrelsesmode under 1 µm, typisk 100-300 nm, samt en eller flere modes over 1 µm. Håndte-ring af kulstof nanorør pulver har vist sig at kun at resultere i lave antals-koncentrationer.
For at kunne udforske støvningsegenskaberne yderligere blev en ny støvningstest udviklet. Den bruger kun lidt materiale og kan på en enkel måde bygge bro mellem de to forskellige testprincipper der er specificeret i EN 15051 standarden for støvningstest. Støvningstest blev udført for ultrafin og pigment grade TiO2, silica røg, bentonite, yttrium stabiliseret zirconia, goethit, to finhedsgrader af korund (aloxite F800 og F1200), samt talk. Alle materialer dannede støv, der havde to størrelsesmodes over 0.9 µm. Alle materialer, med undtagelse af pigment grade TiO2 og aloxite F1200, havde også en størrelsesmode i området fra ~100 til ~220 nm. TiO2 pigment grade støvede mindst og TiO2 ultrafin mest af alle undersøgte materialer. Forskellen var en faktor ~300. En tilsvarende for-skel i eksponeringspotentiale kan forventes. Det betyder, at de forebyg-gende foranstaltninger må gøres meget strengere hvis pigment grade TiO2 erstattes med den ultrafine version. Siden aggregater af ultrafin TiO2 kan brydes i lungevæskerne og under antagelse af, at partikelantal er en risi-kofaktor, vil forøgelsen af den potentielle risiko blive endnu større. Re-sultaterne viste, at når man håndterer nanopulver, vil de dannede luftbår-ne partikler være agglomerater, ikke enkelte primære nanopartikler.
Der er for lidt viden om risici til at kunne specificere hvilket kontrol-niveau der kræves og dermed at kunne vejlede om valg af egnede kon-trolforanstaltninger. Der er udviklet flere fremgangsmåder for konventio-nelle materialer og de kan udgøre et begrebsapparat til beskrivelse og analyse af eksponeringsscenarier for nanomaterialer. Til dem hører ”control banding” og eksponeringsmodellering. Disse begreber beskrives. Projektgruppen er af den opfattelse at metoder til teknisk kontrol af eks-ponering for nanopartikler kan bygge på viden og erfaring fra ekspone-ringskontrol for konventionelle partikler. Det bør bemærkes, at der alle-rede i dag anvendes tekniske foranstaltninger til kontrol af eksponering for ultrafine partikler som fx svejserøg, carbon black og vira. Effektive

Evaluation and control of occupational health risks from nanoparticles 95
metoder kan opnås ved at tilpasse og omdesigne eksisterende teknologi. Det vedrører teknikker for almen ventilation, industriel ventilation, lokal- og procesudsugning, indkapsling og filtrering.
Også arbejdshygiejniske vurderinger af arbejdspladser kan følge eksi-sterende metoder. En undtagelse er, at selv ekstremt høje koncentrationer af nanopartikler ikke nødvendigvis er synlige for det blotte øje. Derfor vil anvendelse af tilstrækkeligt følsomme måleinstrumenter for nanopartikler som fx kondensation partikeltæller komme på tale.
Der findes endnu ingen nationale eller internationale standarder for målemetoder for nanopartikler på arbejdspladser. Dette har begrænset omfanget af eksponeringsmålinger, hvorfor der kun findes et meget be-grænset antal eksponeringsdata. Måling af eksponering for nanopartikler byder på nogle store udfordringer:
• Eksponeringen vil oftest være i form af aggregater. Der findes ingen
simple målemetoder til bestemmelse af agglomereringsgrad og i hvil-ken grad de brydes op i mange flere mindre enheder i lungevæsken efter deponering i luftvejene.
• Der er på de fleste arbejdspladser en høj baggrundskoncentration af partikler i nanostørrelse. I dag findes kun to feltmetoder til at skelne baggrund fra tekniske nanopartikler i samme størrelsesområde. Den ene er intelligent designet målestrategi. Den anden er at opsamle partiklerne på et passende substrat for efterfølgende laboratorieanalyse med tidskrævende elektronmikroskopi.
For at sætte eksponering for tekniske nanopartikler i perspektiv præsente-res udvalgte eksponeringsscenarier for ultrafine partikler. Koncentratio-nen målt i antal partikler var fra over 10 000 000 partikler cm-3 for laser-svejsning til koncentrationer på omring 1 000 til 10 000 partikler cm-3 for afsækning af ultrafine pulvere.
Et af projektets formål var at indsamle eksempler på specifikke scena-rier for eksponering for tekniske nanopartikler. Det måtte konstateres, at der kun var få scenarier tilgængelige for nærmere undersøgelse. Denne erfaring deles med kolleger i andre europæiske lande. De data, der kan præsenteres, er derfor af meget varierende detaljeringsgrad og omfang. Det er derfor heller ikke muligt at drage almene konklusioner om ekspo-neringsrisiko.
På grund af disse begrænsede data var det ikke meningsfuldt at forsø-ge at vurdere sandsynlighed og intensitet for arbejdsbetinget eksponering for tekniske nanopartikler i hele livscyklus forløb.
Kvaliteten af den information, der gives i sikkerhedsdatablade (SDS), blev undersøgt. Der blev udvalgt materialer med primær partikelstørrelse så lille som mulig, og for at afspejle en bred vifte af egenskaber. Materia-lerne kom fra følgende stofgrupper (antal i parentes): silica (8), titandio-

96 Evaluation and control of occupational health risks from nanoparticles
xid (4), zircondioxid (2), kulstof nanorør (11), C60 fullerener (2) og cad-mium-baserede kvanteprikker (3).
Generelt var identifikation af stoffet og af virksomheden tilfredsstil-lende. Inden for stofgrupperne var opregning af R-sætninger inkonsistent. I mange tilfælde manglede angivelse af klassificering og mærkning i SDS, fordi der ikke fandtes testresultater. I nogle tilfælde var “nano” anført i materialets kommercielle navn. De fleste af kulstof nanorør mate-rialerne var identificeret som grafit.
Kvaliteten af de foreslåede forskrifter for håndtering, opbevaring og eksponeringskontrol varierede meget mellem de forskellige SDS, selv for materialer af samme karakter. Også beskrivelsen af de fysiske og kemiske egenskaber samt forhold, der skulle undgås, var meget forskellig for de forskellige SDS. Nogle SDS havde en velbeskrevet liste af grænseværdier og toksicitetstest. Imidlertid varierede beskrivelsen af de toksiske egen-skaber selv for sammenlignelige stoffer. Der var meget lidt information om økologiske forhold i SDS.
Generelt blev stofferne/materialerne så godt som ikke testet, og hvis de blev, så var det kun for akut toksicitet.
Afslutningsvis anføres nogle betragtninger om den nærmeste tids ud-viklingstendenser for produktion og anvendelse af tekniske nanopartikler.