evaluating your students- blackboard learn built-in...
TRANSCRIPT
Evaluating Your Students- Blackboard Learn Built-in Reports - Part 1 Posted on March 12, 2013 by Chris Callahan
Who viewed this item? What did students look at before test day? Are any of my students utilizing the resources I’ve posted? If you are the type of instructor who is asking these questions – it could be that you teach a large lecture course, maybe an online course with students all over the nation and world, or you simply want to know if the hours you spent uploading lecture notes to your course are actually being consumed regularly. You’re in luck, as a cure to this issue has been found- really it has. Blackboard Learn has filled the void of LMS’s being able to accurately and in-detail track the activity of students in a course.
So before we dive into the technical how-to’s, it’s important to examine the benefits of activity tracking and the amount of effort you will have to expend to maximize its usefulness. This way you can determine if this is a feature you want to employ now or in the future.
Question: Should I tell my students I’m tracking their activity or should I keep it a secret? #Thoughts: Simply put, it depends. You could tell your students at the start of the semester and immediately see increased activity in your course. However, you might run into the problem where students only click on items to register their activity, while not actually engaging with the content. Alternatively, you could keep the tracking a secret and be able to view the level of dedication each one of your students possesses. However, you might run into the issue that your students aren’t motivated to view your course, which wastes the time you spent uploading materials. If you do pull a student aside for not being involved, they might be upset that you didn’t notify them that the tracking was potentially negatively impacting their standing in a course. !Solution: It’s better to let your students know you are using the activity tracking. Even if some of your students abuse the feature simply to avoid participation point deduction, you can be rest assured that many students will understand that you are serious about them utilizing the content regularly and will honestly get more involved with reading the things you post. Ultimately, you know your time is not being wasted using Blackboard,
and students will interact more with the content (and hopefully get more out of the course too) - sounds like a win-win right? Lastly, it would a good idea to address students on what you plan on using your Blackboard course for and what you expect from your students when they access it. Question: How accurate are the reports and to what degree should I use the reports to judge online course participation? #Thoughts: While Evaluation Reports may not be as robust or detailed as let’s say Google Analytics, it is indeed accurate. Blackboard explains that a hit is tracked every time a request is sent to Blackboard. Now to the second aspect of this question is, what emphasis should you place on the statistics generated by the reports to actual student performance/grades? Well, it’s entirely up to you. For a class that meets entirely in-person, the reports may be most useful for viewing what students find valuable in the way of content and possibly seeing why exceptional and poorly-performing students differ in how much they access your course and the materials in it. Now, for a class that meets mainly or exclusively online, judging attendance might be a bit harder. Depending on how your class meets, whether through Adobe Connect, Google Hangout, or a similar tool, it may be hard to provide an adequate environment for student engagement. A lot of factors such as time constraint, lack of video/audio equipment from students, etc. can minimize the chances to conduct class in the same way that is done in-person. For Syracuse online courses, the online Blackboard course space can contain the class’ entire framework: handouts, exams, readings, the list goes on and on. Thus, to ensure students are engaging with all of these elements, it may be best to give the course reports feature a closer look. !Solution: As stated in the thoughts, the helpfulness of the course reports depends on what you expect out of your students, which in turn allows you to judge how their activity in your course affects their grade. It is recommended to monitor the course reports regularly for student activity, which could explain their dedication to accessing course materials. As mentioned in the thoughts area, participation grades for online courses should rely more on the course reports’ findings, while the regular courses should use it more as a guideline for students’ attentiveness and dedication to using a Blackboard course.
Question: Am I breaking any policy, Syracuse and/or otherwise, by using this feature and what should I avoid when running reports? #Thoughts: Running reports out of Blackboard Learn is enabled for any instructor/assistant role, thus you can use them at your discretion. Since reports display students’ first name, last name, and username, along with their activity inside your course - it’s best to keep this information confidential. You can run a report for any duration in the course and for one or more students. !Solution: To avoid violating FERPA, keep your course reports saved onto a password protected computer, device, and/or drive to avoid any loss of confidentiality. Also, printed versions should be kept in a protected environment as well. If you plan to share your course reports with students to let them know of their activity levels in your class, only select their name when producing a report. Also, if you want to share the report findings with your whole class, keep the statistics very general and do not point out any student or students when explaining activity levels.
Your first Course Report- All User Activity inside Content Areas Now we are ready to discuss the actual creation of report, which takes just a few steps in Blackboard to produce. To get started, login into Blackboard and go to a course where you have Instructor access.
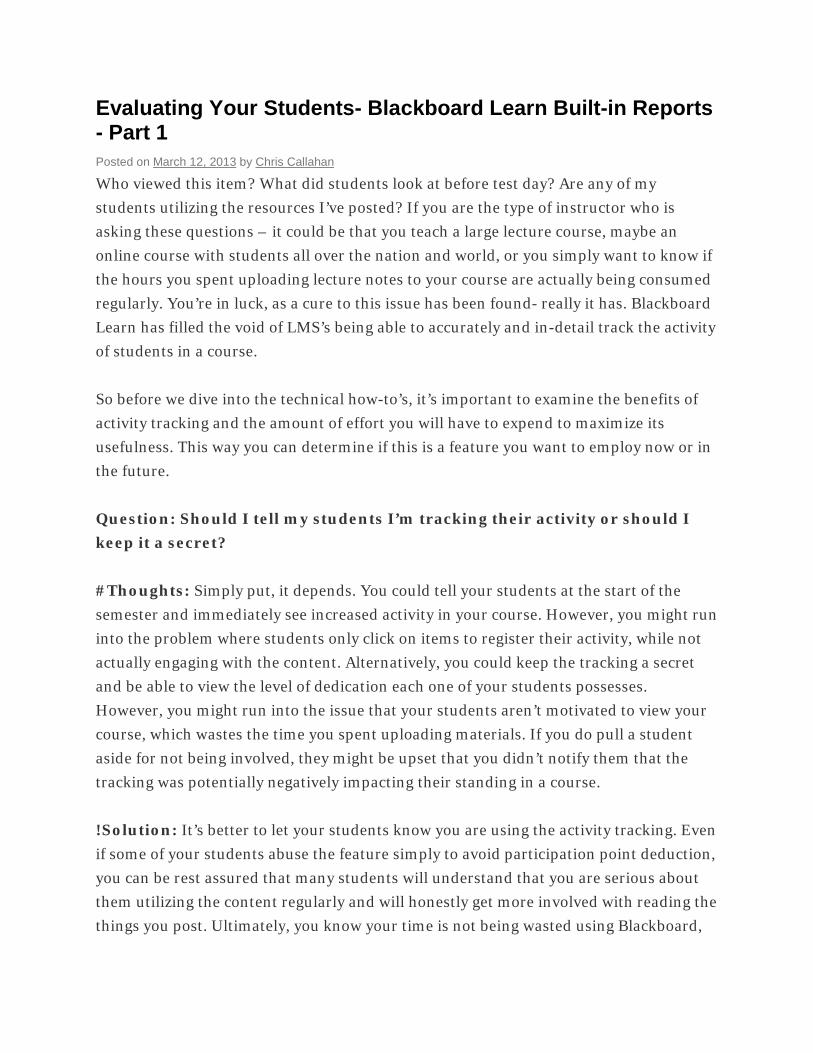
Locate and click on the Evaluation link in the Course Management navigation bar, then when the menu expands click on the Course Reports link.
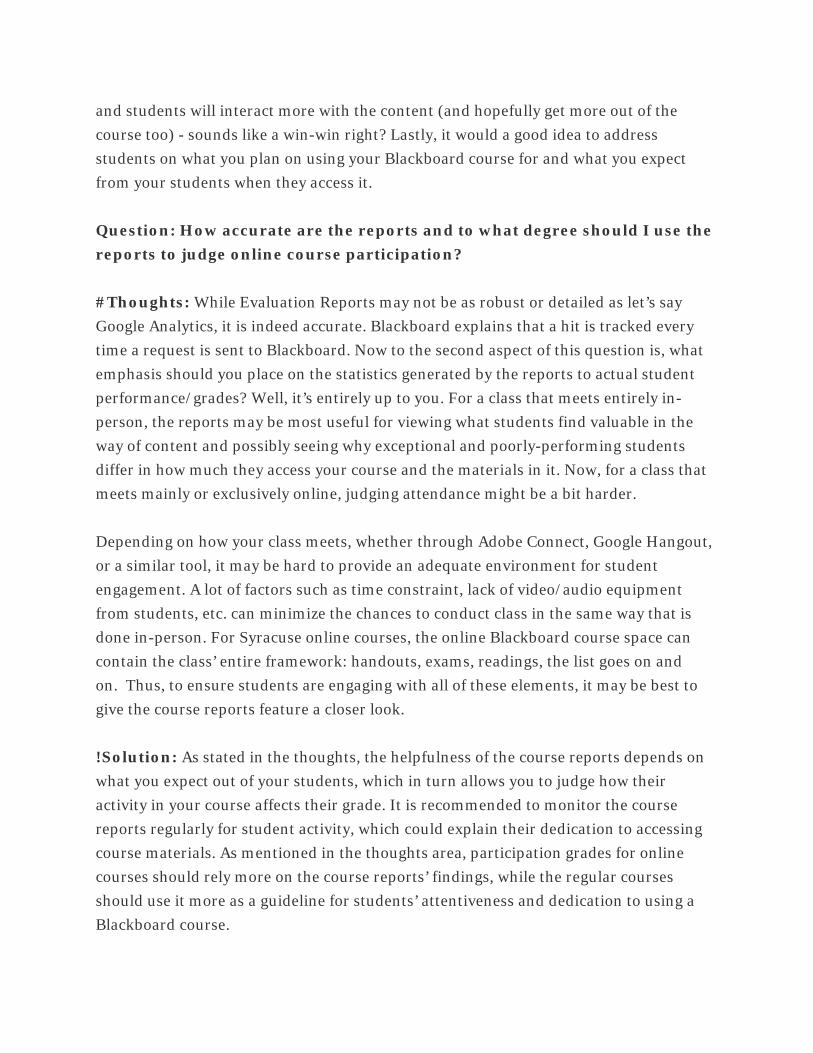
The Course Reports page will appear. There are 9 reports to choose from and we’ll stick with the top most, “All User Activity inside Content Areas”. To get started running the report, hover over the name of the report and an option button will appear.
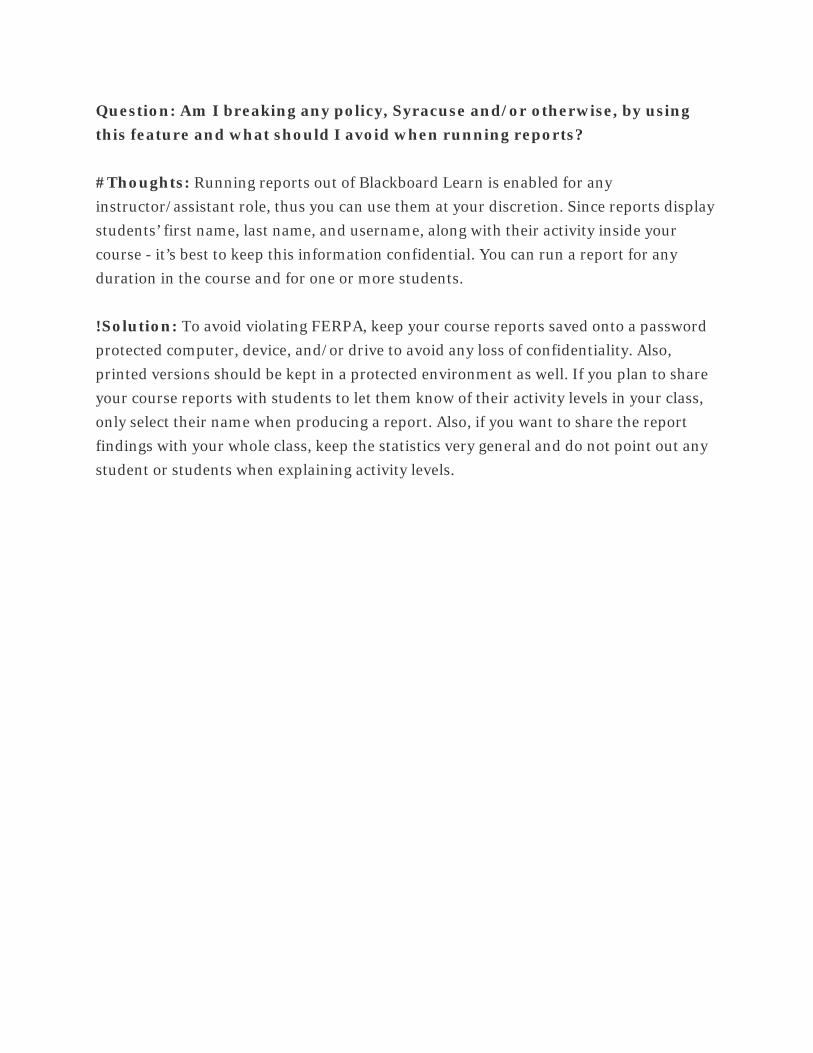
Click on the option button and a menu with a single link will appear. Click the Run link.
The Run Reports page will appear. Review the report information to confirm this is correct report to run. Interestingly, the Elapsed Time of Last Run data gives you information on how long this type of report took to create last time it was ran. This amount of time will vary depending on the start/end date, the amount of students in the course and the amount of activity they have produced.
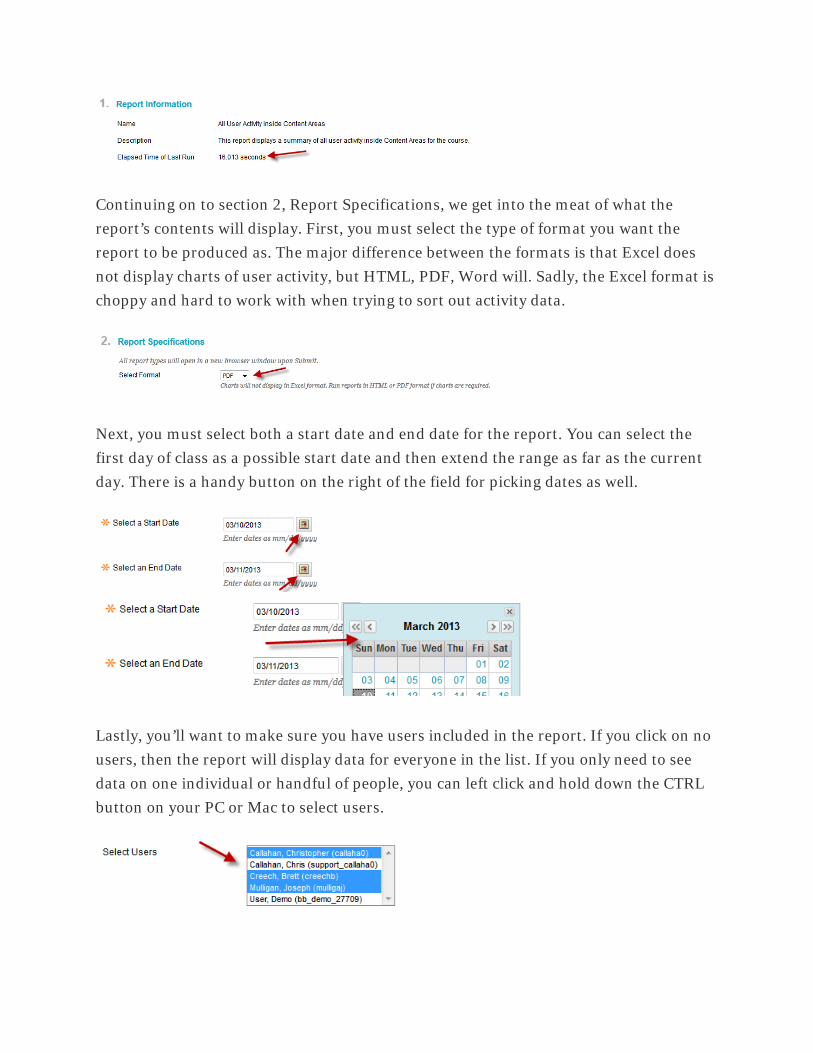
Continuing on to section 2, Report Specifications, we get into the meat of what the report’s contents will display. First, you must select the type of format you want the report to be produced as. The major difference between the formats is that Excel does not display charts of user activity, but HTML, PDF, Word will. Sadly, the Excel format is choppy and hard to work with when trying to sort out activity data.
Next, you must select both a start date and end date for the report. You can select the first day of class as a possible start date and then extend the range as far as the current day. There is a handy button on the right of the field for picking dates as well.
Lastly, you’ll want to make sure you have users included in the report. If you click on no users, then the report will display data for everyone in the list. If you only need to see data on one individual or handful of people, you can left click and hold down the CTRL button on your PC or Mac to select users.
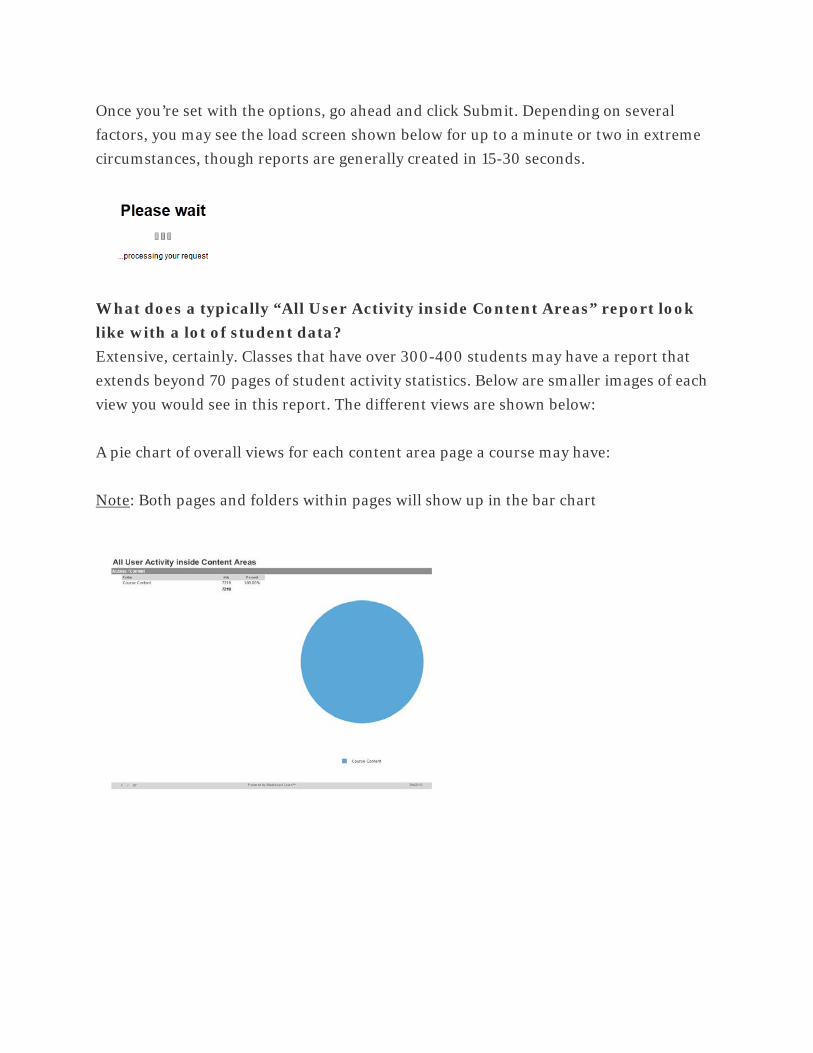
Once you’re set with the options, go ahead and click Submit. Depending on several factors, you may see the load screen shown below for up to a minute or two in extreme circumstances, though reports are generally created in 15-30 seconds.
What does a typically “All User Activity inside Content Areas” report look like with a lot of student data? Extensive, certainly. Classes that have over 300-400 students may have a report that extends beyond 70 pages of student activity statistics. Below are smaller images of each view you would see in this report. The different views are shown below:
A pie chart of overall views for each content area page a course may have:
Note: Both pages and folders within pages will show up in the bar chart
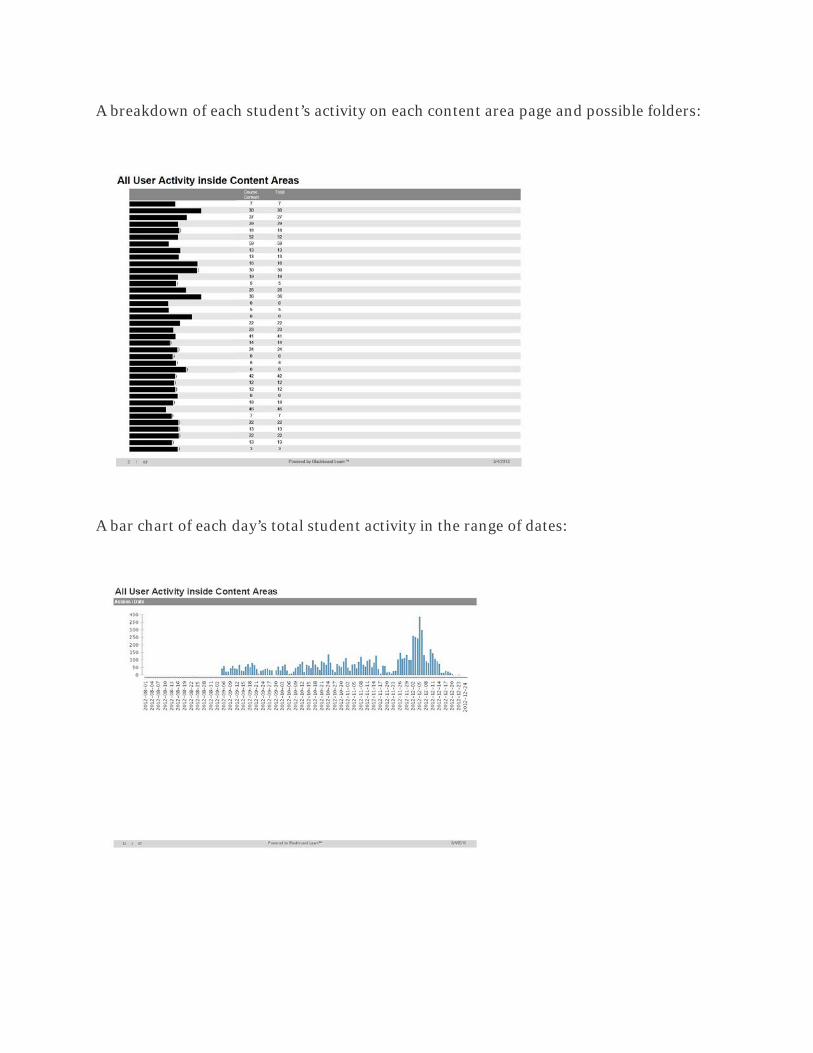
A breakdown of each student’s activity on each content area page and possible folders:
A bar chart of each day’s total student activity in the range of dates:
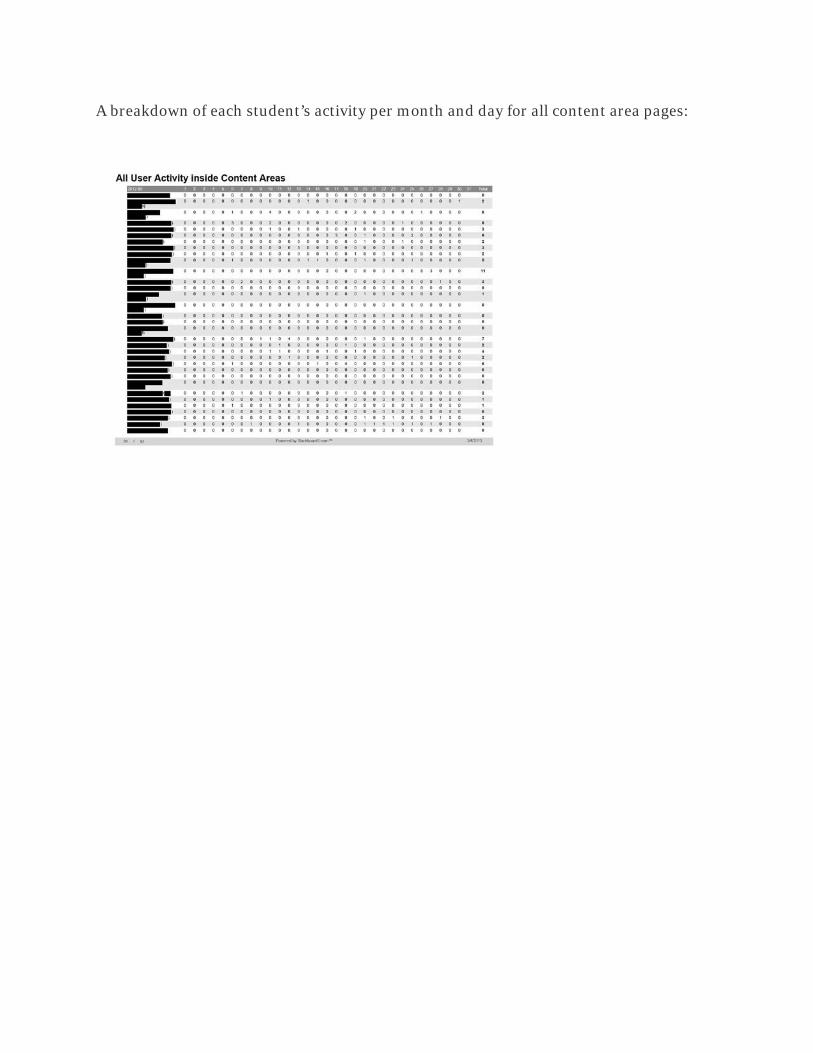
A breakdown of each student’s activity per month and day for all content area pages:
Evaluating Your Students - Blackboard Learn Built-in Reports - Part 2
The reports that will be covered in this entry are: Course Activity Overview, Overall Summary of User Activity, and Student Overview for Single Course. The information displayed comes from a large enrollment course, and all student names/usernames are blacked out for confidentiality reasons.
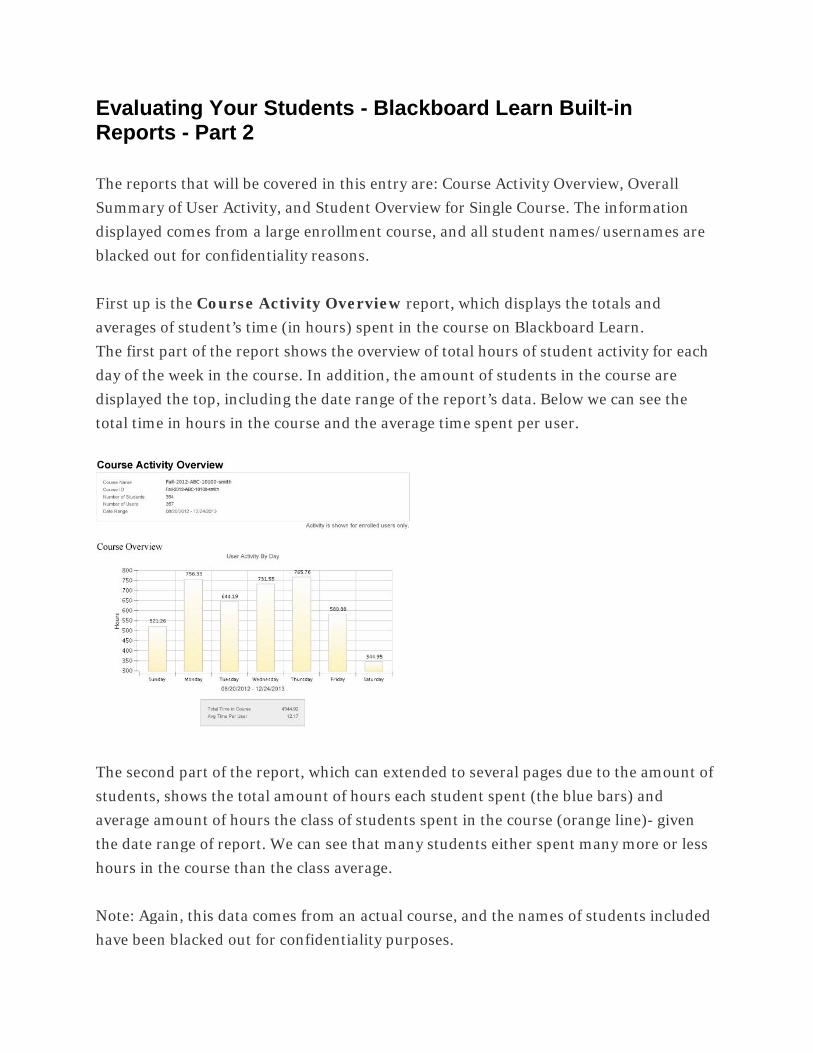
First up is the Course Activity Overview report, which displays the totals and averages of student’s time (in hours) spent in the course on Blackboard Learn. The first part of the report shows the overview of total hours of student activity for each day of the week in the course. In addition, the amount of students in the course are displayed the top, including the date range of the report’s data. Below we can see the total time in hours in the course and the average time spent per user.
The second part of the report, which can extended to several pages due to the amount of students, shows the total amount of hours each student spent (the blue bars) and average amount of hours the class of students spent in the course (orange line)- given the date range of report. We can see that many students either spent many more or less hours in the course than the class average.
Note: Again, this data comes from an actual course, and the names of students included have been blacked out for confidentiality purposes.
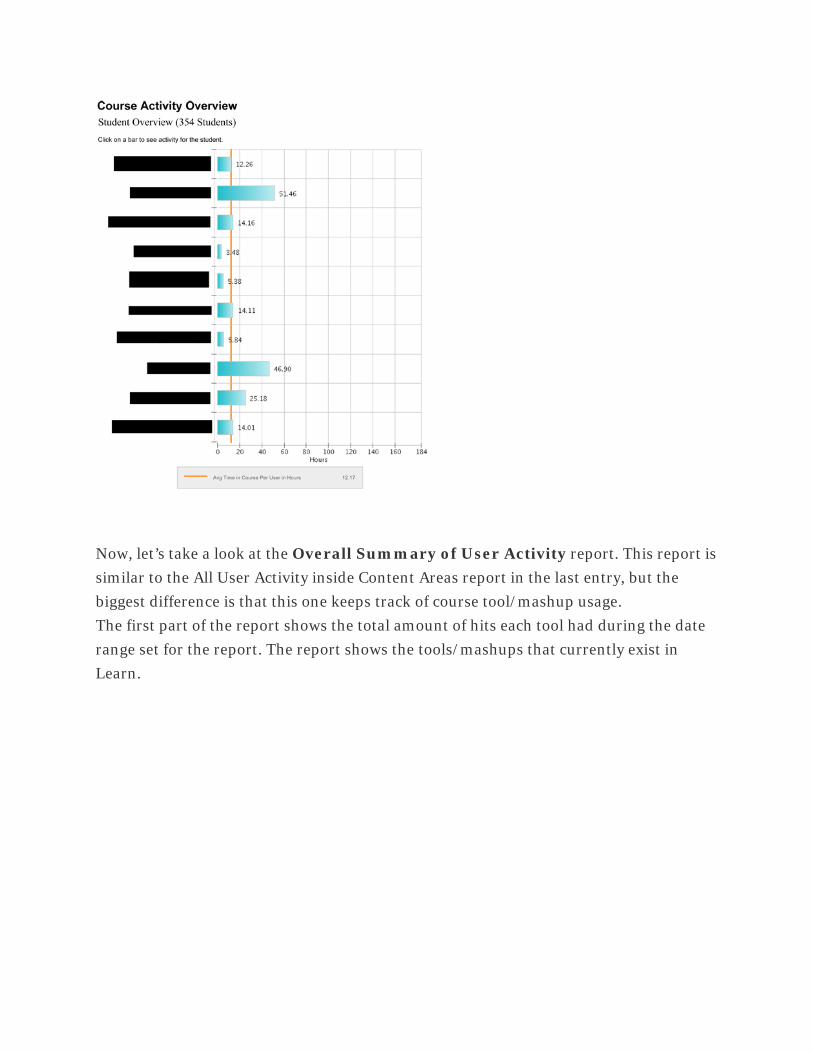
Now, let’s take a look at the Overall Summary of User Activity report. This report is similar to the All User Activity inside Content Areas report in the last entry, but the biggest difference is that this one keeps track of course tool/mashup usage. The first part of the report shows the total amount of hits each tool had during the date range set for the report. The report shows the tools/mashups that currently exist in Learn.
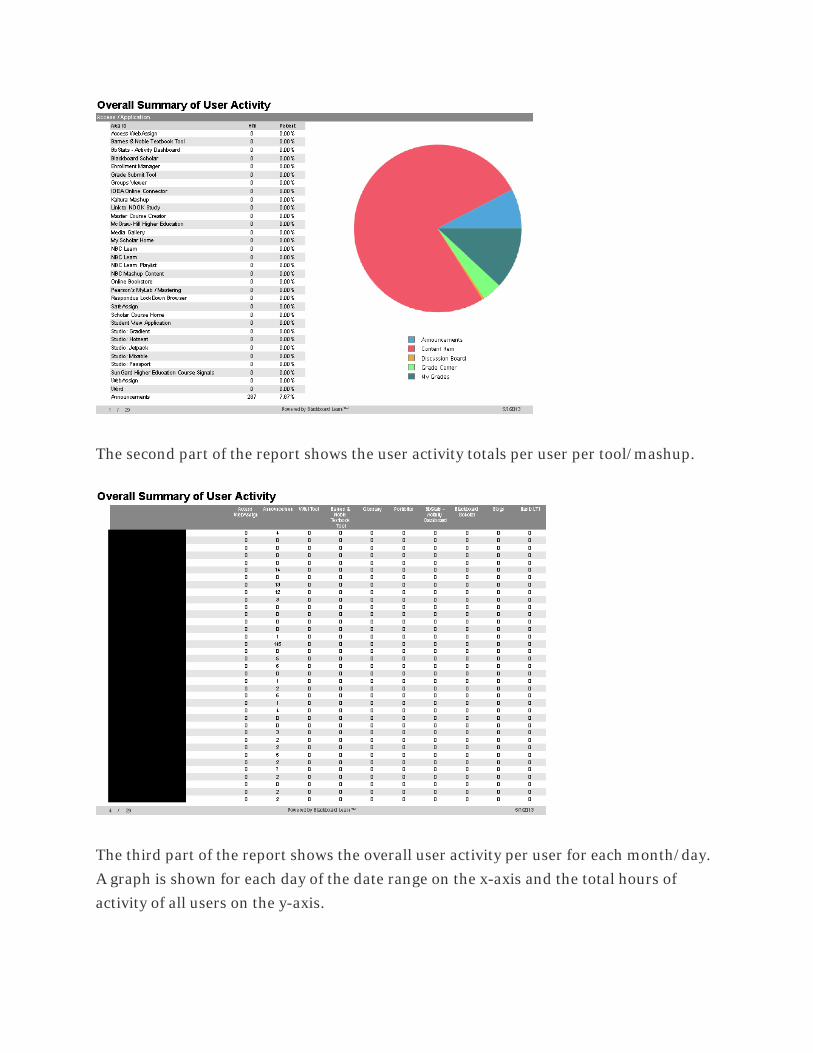
The second part of the report shows the user activity totals per user per tool/mashup.
The third part of the report shows the overall user activity per user for each month/day. A graph is shown for each day of the date range on the x-axis and the total hours of activity of all users on the y-axis.
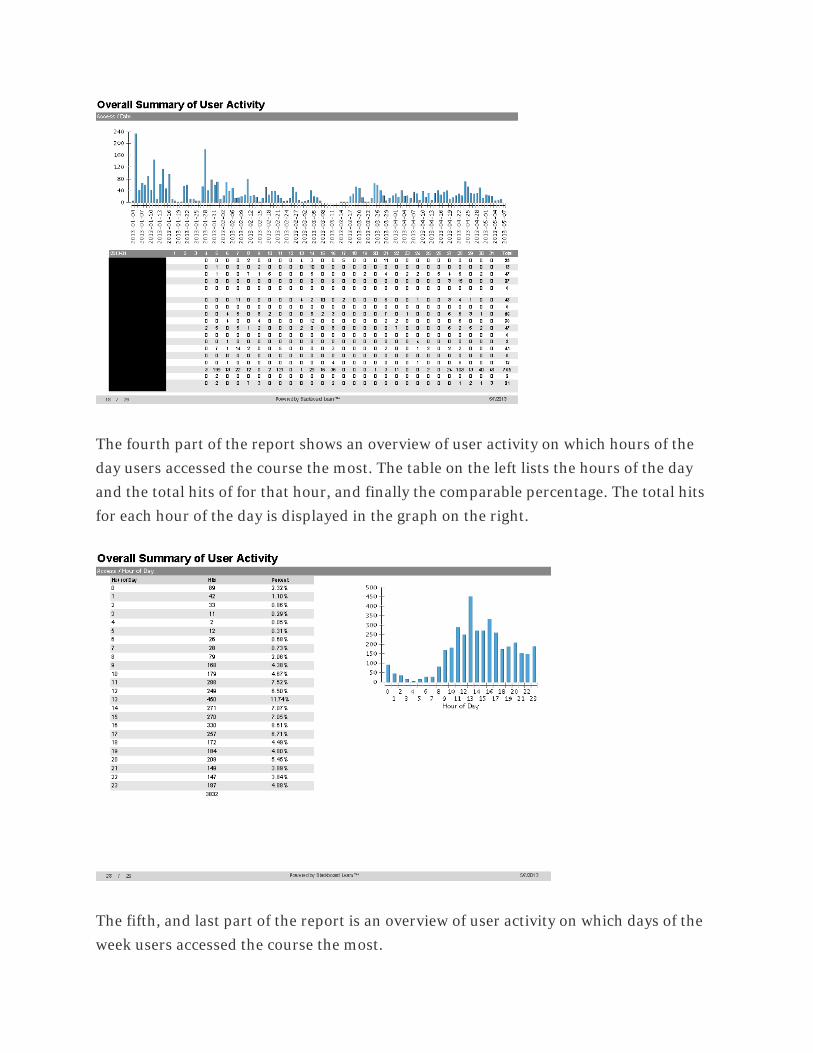
The fourth part of the report shows an overview of user activity on which hours of the day users accessed the course the most. The table on the left lists the hours of the day and the total hits of for that hour, and finally the comparable percentage. The total hits for each hour of the day is displayed in the graph on the right.
The fifth, and last part of the report is an overview of user activity on which days of the week users accessed the course the most.
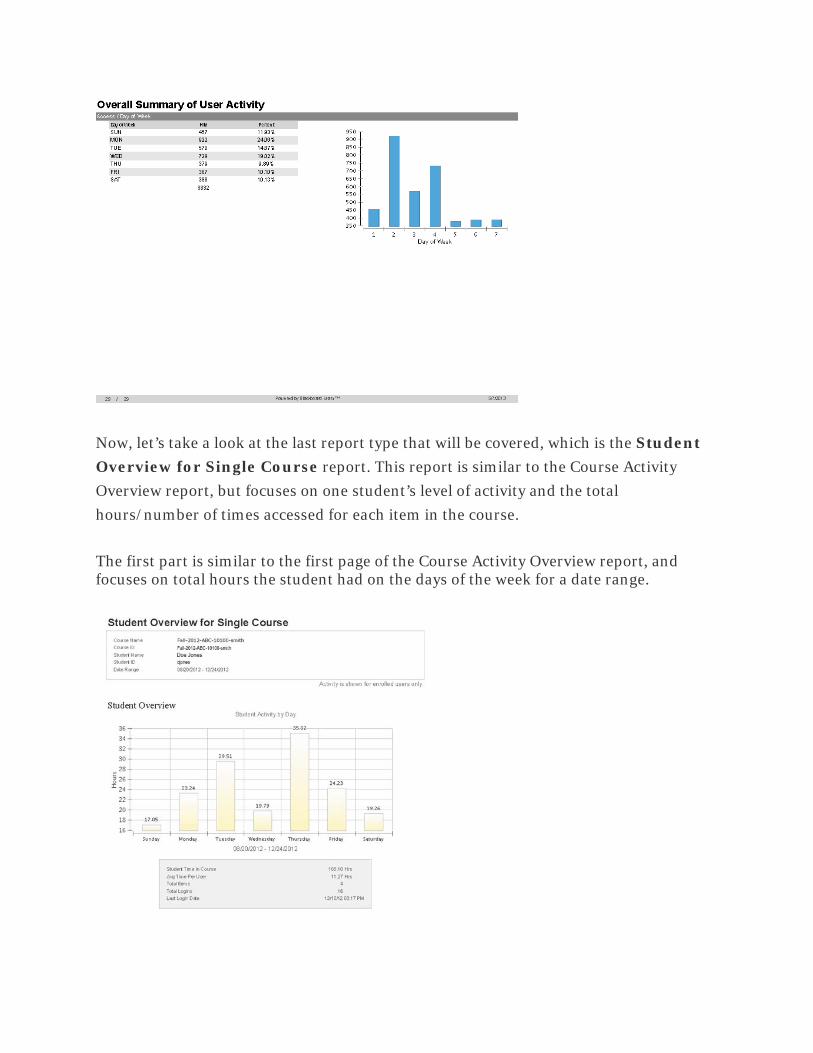
Now, let’s take a look at the last report type that will be covered, which is the Student Overview for Single Course report. This report is similar to the Course Activity Overview report, but focuses on one student’s level of activity and the total hours/number of times accessed for each item in the course.
The first part is similar to the first page of the Course Activity Overview report, and focuses on total hours the student had on the days of the week for a date range.
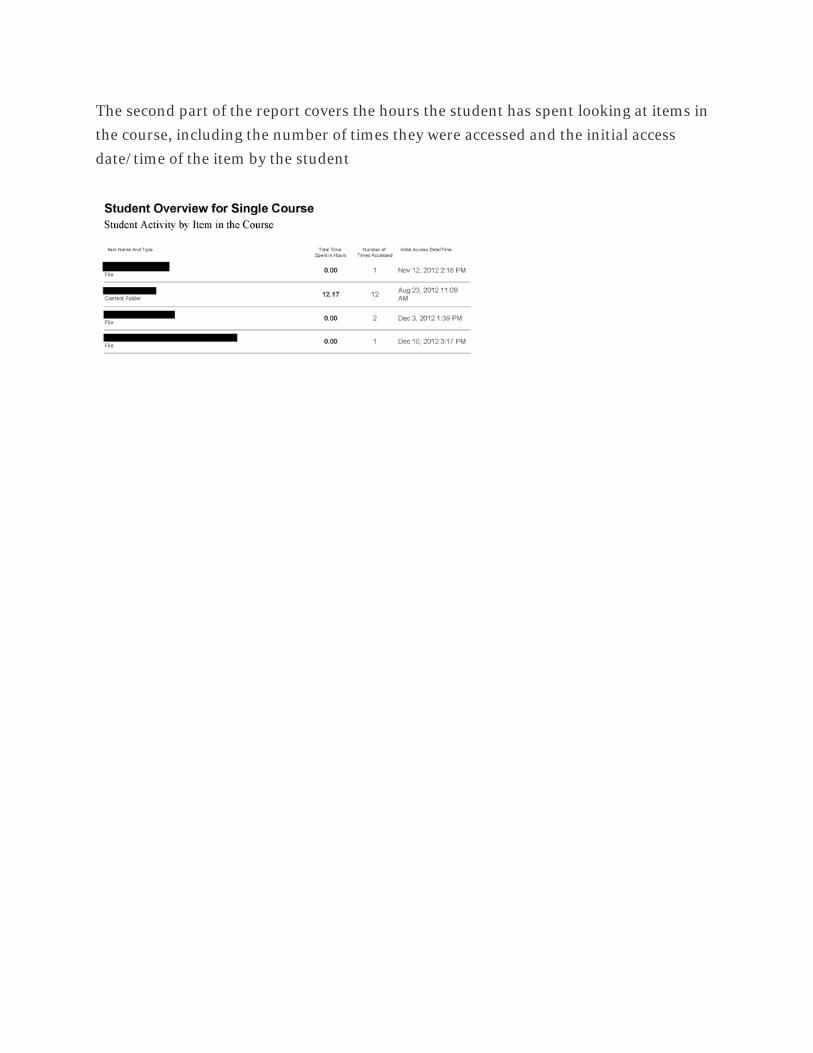
The second part of the report covers the hours the student has spent looking at items in the course, including the number of times they were accessed and the initial access date/time of the item by the student