evaluating vapor cloud explosions using a flame acceleration method 7 42
TRANSCRIPT

October 2012Page 1 of 24
EVALUATING VAPOR CLOUD EXPLOSIONSUSING A FLAME ACCELERATION METHOD
Table of ContentsPage
1.0 SCOPE ..................................................................................................................................................... 31.1 Changes ........................................................................................................................................... 3
2.0 LOSS PREVENTION RECOMMENDATIONS ........................................................................................ 32.1 Human Element ............................................................................................................................... 32.2 Construction and Location ............................................................................................................... 4
3.0 SUPPORT FOR RECOMMENDATIONS ................................................................................................. 43.1 Vapor Cloud Explosion Principles .................................................................................................... 5
3.1.1. Laminar Burning Velocity (LBV) ............................................................................................ 53.1.2 Flame acceleration .................................................................................................................. 53.1.3 Blast Effect .............................................................................................................................. 7
3.2 Estimating the Vapor Cloud Explosion Hazard ................................................................................ 73.2.1 Source Materials ...................................................................................................................... 73.2.2 Release .................................................................................................................................. 93.2.3 Dispersion and Drifting of Released Vapor Clouds ............................................................... 113.2.4 Accumulation Area ................................................................................................................. 113.2.5 Ignition Sources ................................................................................................................... 153.2.6 PES Volume Threshold ......................................................................................................... 163.2.7 Energy Release .................................................................................................................... 173.2.8 Blast Effects and Ensuing Fire Damage ............................................................................... 17
3.3 Loss History .................................................................................................................................... 173.3.1 Overview and Statistics ......................................................................................................... 173.3.2 Process incidents ................................................................................................................. 183.3.3 High-Pressure Transmission Pipeline Incidents .................................................................... 193.3.4 Fixed Storage Tank Incidents ................................................................................................ 203.3.5 Mobile Transportation Incidents ............................................................................................ 21
3.4 Prevention and Control of Consequences ...................................................................................... 224.0 REFERENCES ....................................................................................................................................... 22
4.1 FM Global ........................................................................................................................................ 224.2 Other ................................................................................................................................................ 22
APPENDIX A GLOSSARY OF TERMS ....................................................................................................... 23APPENDIX B DOCUMENT REVISION HISTORY ....................................................................................... 24
List of FiguresFig. 1. Simplified VCE mechanism ................................................................................................................. 5Fig. 1a. Sketch of flame propagation causing expansion and flow ahead of the flame ................................ 6Fig. 2. Flame acceleration in obstructed channel caused by flame area increase and
turbulence generation ahead of the flame ......................................................................................... 6Fig. 3. Examples of experimental pressure and impulse profiles from VCEs .............................................. 7Fig. 4. Decision tree to determine need for a vapor cloud explosion study ................................................. 8Fig. 5. No confinement ................................................................................................................................. 13Fig. 6a and 6b. Partial single-surface confinement ..................................................................................... 13Fig. 7a and 7b. Single-surface confinement ................................................................................................ 14Fig. 8a and 8b. Multi-surface confinement .................................................................................................. 14Fig. 9a and 9b. Low congestion .................................................................................................................. 15Fig. 10a and 10b. Medium congestion ........................................................................................................ 15
FM GlobalProperty Loss Prevention Data Sheets 7-42
©2012 Factory Mutual Insurance Company. All rights reserved. No part of this document may be reproduced,stored in a retrieval system, or transmitted, in whole or in part, in any form or by any means, electronic, mechanical,photocopying, recording, or otherwise, without written permission of Factory Mutual Insurance Company.

Fig. 11a and 11b. High congestion .............................................................................................................. 16Fig. 12. Process area damage at Flixborough .......................................................................................... 18Fig. 13. Damage to Phillips plant following the VCE ................................................................................... 19Fig. 14. Blow-down drum at BP, Texas City (photo from the U.S. CSB final report) ................................... 20Fig. 15. Buncefield terminal; fire following VCE ........................................................................................... 21
List of TablesTable 1. Threshold Matrix (PES Volume and Mass Released)* ................................................................... 17
7-42 Evaluating Vapor Cloud ExplosionsPage 2 FM Global Property Loss Prevention Data Sheets
©2012 Factory Mutual Insurance Company. All rights reserved.

1.0 SCOPE
This loss prevention data sheet describes the theory and practice of a flame acceleration methodology (FAM)to evaluate the effects of a vapor cloud explosion (VCE) as well as basic approaches that can be taken tominimize the chance of such an event.
This data sheet includes rules and thresholds that produce VCE in occupancies that present the greatestlikelihood of occurrence, such as confined, congested outdoor process areas. One exception is pyrophoricgases, where open area releases may create significant blast effects. Events in forests and rural areas areexcluded.
Flammable vapor releases with accumulation and delayed ignition inside a building will likely have widespreaddamaging effects in the building and possibly impact the nearby area. Refer to Data Sheet 1-44, DamageLimiting Construction, for information on protection against this exposure, and Data Sheet 7-32, IgnitableLiquid Operations, for information on identifying the potential for building explosion hazards.
1.1 Changes
October 2012. This document has been completely rewritten to reflect the use of a flame acceleration method(FAM) rather than a TNT equivalency method to predict a VCE.
FAM analysis uses the flammable cloud outside the release structure and pressure-impulse analysis, ratherthan overpressure only, to determine damage.
The only major change in excluded materials is natural gas, which is now recognized as a possible VCEsource; however, large amounts are needed and this is reflected in the release amount thresholds given inSection 3.2.6.
Threshold quantities for completing a study have been revised.
2.0 LOSS PREVENTION RECOMMENDATIONS
The following recommendations are directed at methods to maintain the integrity of the chemical processwith the goal of preventing uncontrolled releases of flammable vapors that could result in a VCE.
2.1 Human Element
2.1.1 Implement inherently safer design strategies. Refer to Data Sheet 7-43, Loss Prevention in ChemicalPlants, for guidance on inherently safer design.
2.1.2 Operate chemical process industry (CPI) facilities under principles of process safety management(PSM). Refer to Data Sheet 7-43, Loss Prevention in Chemical Plants, for guidance on PSM. In particular,address the following:
A. Conduct process hazard analysis (PHA) on any operation involving processing or handling of flammableor reactive chemicals. The PHA needs to consider the effects of the chemicals used and both normaland abnormal operating conditions as well as the impact of organizational and staffing changes.
B. Implement a comprehensive management of change (MOC) program. Specifically address temporarymodifications and clearly define “replacement-in-kind.”
C. Conduct pre-startup safety reviews (PSSR) after implementing process changes, the addition of anynew equipment, and after extended operational outage to ensure all equipment is ready for operation asexpected.
D. Train operators to handle normal, upset, and startup procedures.
E. Investigate and analyze all process upsets and near-misses to determine their root causes and todevelop and implement procedures to prevent reoccurrence.
2.1.3 Provide additional operators and supervision during startup and other nonstandard operations.
2.1.4 Limit and strictly control the ability to disable or bypass process safety control systems and interlocksas follows:
2.1.4.1 Use a written tag-out procedure that is authorized at management level and tracked by aresponsible person with follow-up to ensure the disabled or bypassed device is cleared.
Evaluating Vapor Cloud Explosions 7-42FM Global Property Loss Prevention Data Sheets Page 3
©2012 Factory Mutual Insurance Company. All rights reserved.
2.1.4.2 Attach warning tags to the disabled or bypassed device where possible.
2.1.4.3 Post a follow-up card or other reminder where readily visible to remind operators and staff of theimpaired device and the importance of return to service; for example, in the control room of the affectedsystem.
2.1.5 Implement a positive material identification (PMI) program as a key component of a mechanical integrity(MI) program to ensure materials suitable for the service are installed in vessels, equipment. and piping.
2.1.6 Implement preventive and/or predictive maintenance programs in accordance with Data Sheet 9-0,Maintenance and Inspection. In particular, for piping and equipment handling ignitable liquid and flammablegas, address the following:
A. Maintain an inspection, testing, and repair database.
B. Implement proper bolting procedures to ensure all required bolts are in place, properly tightened, andwith gaskets suitable for the service.
C. Eliminate open-ended piping wherever possible by installing blind flanges or other reliable sealingmechanisms. A single closed valve is not a suitable mechanism.
D. Implement a program to ensure the integrity of the piping and hangers, to evaluate the security of allconnections, and to assess physical conditions with respect to erosion, corrosion, and leakage.
E. Label or color-code all piping to ensure recognition of the hazardous contents and reduce the chanceof introducing incompatible materials (see ANSI/ASME A13.1, Scheme for Identification of PipingSystems).
F. Analyze repair records for trends with a view to inhibiting long-term deterioration, or repairing or replacingsuspect equipment.
G. Require repair of malfunctioning equipment before permitting a return to operation.
2.1.7 Prepare written emergency response plans for unexpected releases of ignitable liquid or flammablevapor or gas; train operating personal in their expected actions, and hold emergency drills to see that theactions can be performed effectively and accurately.
2.2 Construction and Location
The rules for developing the VCE event should not be used to establish space requirements for chemicalprocess units. Such spacing could only reasonably be applied in new construction and should be establishedby conducting a risk analysis. Additional guidance on space separation can be found in Data Sheet 7-44,Spacing of Facilities in Outdoor Chemical Plants. The Center for Chemical Process Safety (CCPS) alsopublishes guidelines for spacing and design of important process and utility buildings in chemical plants (seeSection 4.2).
3.0 SUPPORT FOR RECOMMENDATIONS
The TNT methodology was based on the results of testing on high explosives conducted by military agenciesto predict blast effects with different masses of explosive. It was then applied to vapor cloud explosions, adifferent type of event, as the simple way to predict consequences. In the TNT equivalency method, a massof flammable gas is related to an equivalent mass of TNT by comparing heats of combustion and assigningan efficiency factor. However, there are several major drawbacks to the TNT methodology. The efficiencyfactor can only be estimated. TNT produces a point source detonation, while a vapor cloud usually coversa large area and begins as a deflagration. TNT produces a sharp rise in overpressure and has a very shortduration, while a VCE produces a more gradual rise in pressure over a longer period of time. As a result,the TNT methodology over-predicts VCE pressure in the near field (within a few hundred feet [meters] of theepicenter), and under-predicts it in the far field.
7-42 Evaluating Vapor Cloud ExplosionsPage 4 FM Global Property Loss Prevention Data Sheets
©2012 Factory Mutual Insurance Company. All rights reserved.

3.1 Vapor Cloud Explosion Principles
Flame speed in a vapor cloud enhanced by confinement and/or congestion and the expansion of the burnedgases determine the pressure-impulse (P-I) effects that can be produced during a VCE. In a vapor clouddeflagration (most common), the flame propagates through the unburned fuel-air mixture at subsonic speed.A flame accelerated to a speed greater than about 0.2 times the speed of sound (approximately 70 m/sec)is generally needed to produce damaging P-I effects.
At flame speeds lower than this, the vapor cloud will usually burn as a flash fire. Flash fire effects are directflame and thermal radiation heat transfer, without significant P-I effects. In a vapor cloud detonation (rare),the flame propagates through the unburned fuel-air mixture at supersonic speed.
Figure 1 provides an overview of the steps leading up to a VCE.
3.1.1. Laminar Burning Velocity (LBV)
Flammable gases and vapors have a physical property known as the laminar burning velocity (LBV). It isthe speed at which a flame moves through an unburned fuel-air mixture and is measured in a quiescent,non-turbulent state. The maximum LBV occurs at an optimum fuel concentration, which is close to thestoichiometric concentration for most fuels. While LBV is a fundamental property of a fuel of specificcomposition, flame propagation in an unintended release is influenced by many factors.
3.1.2 Flame acceleration
Propagating flames are inherently unstable and accelerate due to expansion of combustion products andflame instabilities. Common fuel-air combustion reactions expand the mixture volume by about a factor ofeight. Flame instabilities (e.g., hydrodynamic, thermo-diffusive, acoustic, Richtmyer-Meshkov, andRayleigh-Taylor) can be seen as flame surface area wrinkle effects. See Figure 1a.
Confinement and congestion (see Sections 3.2.4.3 and 3.2.4.4) are the most important factors whenconsidering flame acceleration and VCE potential. This is due to the following mechanism (see Figure 2):
• Flame speed increase depends on the expansion ratio, burning velocity, flame area, and flow cross-section.
• Interactions of the flame with obstacles result in strong increase of the flame area and acceleration of gasflow ahead of the flame.
Fig. 1. Simplified VCE mechanism
Release
Dispersion
Delayed ignition
Flame acceleration
Weak Strong
DetonationDDTHigh speed
deflagrationLow speeddeflagration
Flash FireDirect flame and radiationthermal effect
Vapor Cloud ExplosionPressure-Impulse (P-I) effectsDirect flame and radiation thermal effect
Very strongignition
Evaluating Vapor Cloud Explosions 7-42FM Global Property Loss Prevention Data Sheets Page 5
©2012 Factory Mutual Insurance Company. All rights reserved.

• Interaction of the gas flow with obstacles also creates turbulence in the flow due to shear instabilities.
• Turbulence increases burning velocity and gas flow velocity ahead of the flame.
• The gas flow ahead of the flame and obstacle-induced turbulence are due to the expansion of thecombustion products.
• This creates the positive feedback loop and results in continuous flame acceleration and pressure rise.
• Any confinement that prevents the combustion products’ expansion in directions other than that of the flamepropagation promotes further flame acceleration.
Flame accelerating turbulence can also be directly initiated from a very high-pressure fuel release, which isknown as pre-existing turbulence. In rare cases, flame acceleration can even occur without obstacles orpreexisting turbulence due to hydrodynamic flame instabilities that are relatively weak. This process requireslong run-up distances for a flame to accelerate to speeds that can produce measurable overpressures. Suchrun-up distances are impractically large for most source materials.
Fig. 1a. Sketch of flame propagation causing expansion and flow ahead of the flame
Expansion
Burningvelocity, ST
Flowspeed, U
Flamespeed, Vflame
Fig. 2. Flame acceleration in obstructed channel caused by flame area increase and turbulence generation ahead of theflame
Turbulence
FlowFlame
7-42 Evaluating Vapor Cloud ExplosionsPage 6 FM Global Property Loss Prevention Data Sheets
©2012 Factory Mutual Insurance Company. All rights reserved.

3.1.3 Blast Effect
A blast effect is created when the chemical energy in the fuel-air mixture is released as the flame movesthrough the cloud from the ignition source. This energy is released in the form of thermal energy of thecombustion products, mechanical energy of expanding gas movement and thermal radiation.
The gas movement, if sufficiently intense, generates a blast effect that can be damaging to process structures,buildings, and equipment. The mechanical energy generated during combustion is highly dependent on flameacceleration within the cloud as described previously.
A pressure wave of finite amplitude is generated in air by a rapid release of energy. Usually, the initial pressurewave from a vapor cloud explosion has a smooth pressure rise with time, which is followed by pressuredecrease (see Figure 3, example on left). Under some conditions of confinement, congestion, and turbulence,the pressure wave builds sharply until a shock front is formed (see Figure 3, example on right). The twoparameters of the blast wave that are of primary importance for evaluation of its damage potential are themaximum overpressure (Pmax) and the impulse (I) of the positive phase of the pressure-time curve.
3.2 Estimating the Vapor Cloud Explosion Hazard
For a VCE with damaging overpressures to occur, the following conditions need to be present:
• Inventory of a sufficient amount of source material (fuel) in a pipeline, process, storage, or transportationsystem (see Section 3.2.1)
• Release of the source material from its containment, vaporization if the source material is liquefied, andmixing of the source material with air forming a vapor cloud with some part of the cloud in the flammablerange (see Section 3.2.2)
• Dispersion or drifting of the vapor cloud into a potential explosion site (PES) (see Section 3.2.3)
• Delayed ignition of the cloud followed by flame acceleration through the PES and the cloud; importantconditions within an ignited vapor cloud that must be present for flames to accelerate are spatialconfinement and congestion (see Section 3.2.4)
Use Figure 4 to decide whether the fundamental criteria that create a potential for a VCE are present at aspecific site.
Where the preliminary analysis indicates the potential for a vapor cloud is present, further evaluation shouldbe conducted to determine if there is the potential to release a sufficient amount of that source material.
3.2.1 Source Materials
A source material is an ignitable liquid or flammable gas and could be a chemical process feedstock,intermediate, product or by-product, or used in a support system.
The following materials should be considered to present a VCE exposure unless specifically excluded inSection 3.2.1.1:
Fig. 3. Examples of experimental pressure and impulse profiles from VCEs
Pmax
Pmax
t t
l l
p p
Evaluating Vapor Cloud Explosions 7-42FM Global Property Loss Prevention Data Sheets Page 7
©2012 Factory Mutual Insurance Company. All rights reserved.
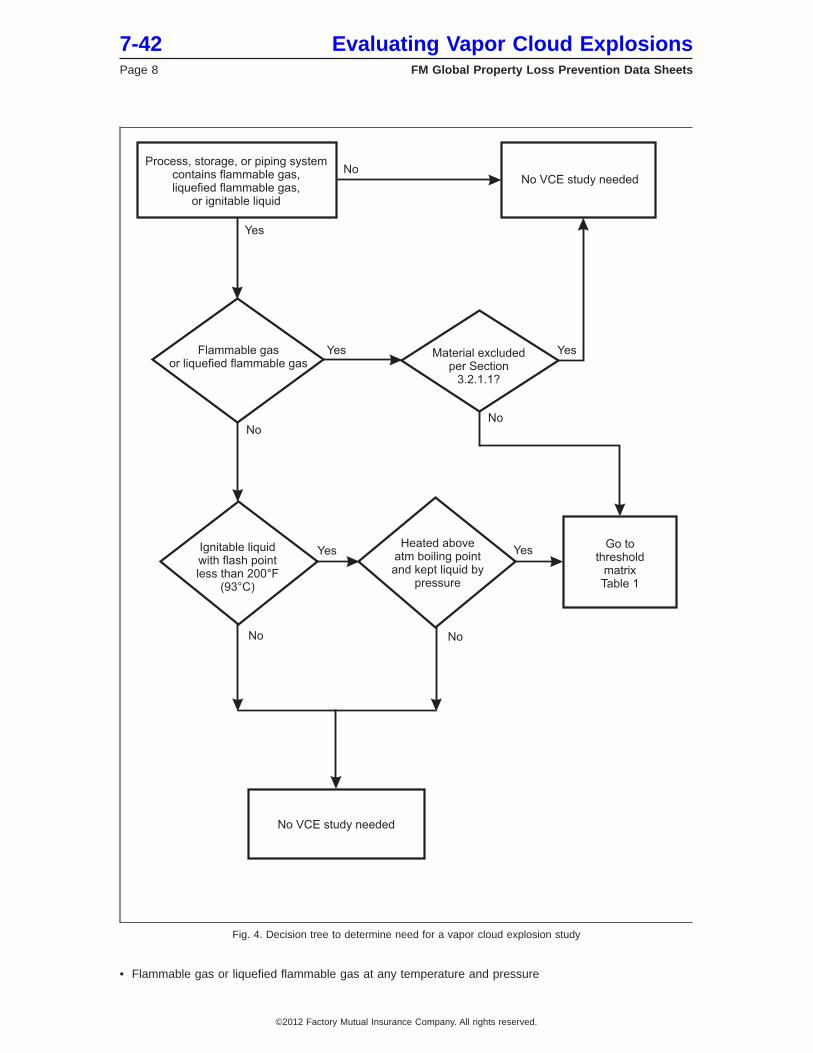
• Flammable gas or liquefied flammable gas at any temperature and pressure
Fig. 4. Decision tree to determine need for a vapor cloud explosion study
Process, storage, or piping systemcontains flammable gas,liquefied flammable gas,
or ignitable liquid
Flammable gasor liquefied flammable gas
Ignitable liquidwith flash pointless than 200 F
(93 C)°
°
Material excludedper Section
3.2.1.1?
Heated aboveatm boiling pointand kept liquid by
pressure
Go tothreshold
matrixTable 1
No VCE study neededNo
No
No
No
No
No VCE study needed
Yes
Yes Yes
Yes Yes
7-42 Evaluating Vapor Cloud ExplosionsPage 8 FM Global Property Loss Prevention Data Sheets
©2012 Factory Mutual Insurance Company. All rights reserved.
• Ignitable liquids with flash points below 200°F (93°C) processed above their atmospheric boiling point andmaintained as a liquid by pressure
Mixtures of two or more liquid or gaseous materials may be present. There is no easy solution for dealingwith mixtures, and judgment must be used. Generally, the more hazardous material should be selected as ifit were the entire volume.
Material reactivity is determined by fundamental properties of mixtures of flammable gases and vapors withair. The most important of these properties include the LBV, heat of combustion, ratio of densities betweenreactants and products, and flammability limits. For the purposes of qualitative comparison of variousmaterials, one can approximately attribute materials to low, medium, high, and very high ranges of reactivity.
• Low reactivity materials (20 cm/sec ≤ LBV < 40 cm/sec) include flammable gases such as methane andethylamine.
• Medium reactivity materials (40 cm/sec ≤ LBV < 60 cm/sec) include flammable gases such as propane,propylene, butane, and vapors of boiling ignitable liquids such as cyclohexane, naphtha, and gasoline.
• High reactivity materials (60 cm/sec ≤ LBV < 100 cm/sec) include ethylene, ethylene oxide, propyleneoxide, and vinyl acetylene.
• Very high reactivity materials (LBV ≥ 100 cm/sec) include hydrogen, silane, and acetylene.
3.2.1.1 Excluded Materials
FM Global has interpreted that the following materials do not present a significant or credible outdoor VCEexposure. These exclusions are based on many factors including heat of combustion, LBV, and loss history.
• Materials with an LBV less than 20 cm/sec, which includes ammonia, carbon monoxide, coke/coal gas andblast furnace gas
• Synthesis gas used as feed for ammonia, methanol, and other processes
• Gaseous hydrogen at any temperature and pressure
• Materials processed above their auto-ignition temperature
• Ignitable liquids with a viscosity greater than 1 x 10⁵ centipoise (100 Pa-s) (e.g., bitumen, pitch)
3.2.1.2 Hydrogen: Liquid
Hydrogen is highly reactive and should be considered a VCE source material when stored or used as a liquid.
3.2.1.3 Silane and Other Pyrophoric Gases
Pyrophoric gases commonly ignite immediately upon release, but small-scale incidents and research havedemonstrated that delayed ignition can occur with an uncontrolled release of high purity gas.
3.2.1.4 Hybrid Mixtures
VCEs have occurred in hybrid systems (mixture of solids/powders in a flammable gas), notably at polyolefinmanufacturing plants (Phillips, Texas City, TX, 1989). While it is possible that the suspended dust enhancesthe explosion effect, there is no model to account for this. The flammable gas is the major component ofthe release and the VCE should be evaluated assuming a pure gas is released.
3.2.2 Release
The release phase of the scenario is dependent on the duration of the release, the size of the release opening,the physical properties of the source material, operating pressure and temperature and, to a small degree,the outside environment.
In determining the release source, primary emphasis should be on looking for release points within a PES.Only when these obvious sources in the PES don’t exist should one look for piping or large tanks outsidethe PES where drift and dispersion are needed to get to a PES.
While there are many scenarios that can result in a release of a VCE source material, there is no attemptto consider or quantify them all. Historically, most VCEs are from a release through an existing pipe connection
Evaluating Vapor Cloud Explosions 7-42FM Global Property Loss Prevention Data Sheets Page 9
©2012 Factory Mutual Insurance Company. All rights reserved.

to a vessel or transport system (vehicles, pipelines, etc.). For the purpose of considering the worst crediblecase, only releases from piping will be analyzed as defined below.
3.2.2.1 Process System (Vessel and Piping) or Fixed Storage Tank
Assume rupture of the largest interconnecting pipe or pipe connection that will allow the most discharge fromthe largest vessel/tank or train of interconnected vessels. Where there is a possibility of release from a liquidor a vapor space, in almost all cases an opening in the liquid space will create the largest mass of releasedmaterial. (See Section 3.2.2.5 to determine if credit may be taken for flow-limiting devices and/or block valves.)
3.2.2.2 Supply Pipelines
Supply pipelines are those that carry flammable gas or ignitable liquids from remote sources to supply oneor multiple customers.
Aboveground pipelines containing flammable gas or ignitable liquids can be considered as a release source.Assume the pipeline is completely severed (full-bore break with flow from both ends). Do not credit anyautomatic or manual block valve with limiting this flow.
Buried flammable gas pipelines should be considered as a release source only when the pipeline pressureis greater than 250 psig (17 barg). While there is significant history of failures of buried pipelines allowingfor a massive release of material, ignition of the release is usually prompt.
3.2.2.3 Mobile Transportation Vehicles
When considering the release from mobile vessels such as railcars, trucks, ships, and barges assumebreakage of the largest connected line during transfer operations with gravity and storage pressure as thedriving force. (See Section 3.2.2.5 to determine if credit may be taken for flow-limiting devices and/or blockvalves.)
3.2.2.4 Release Duration
The release duration is modified depending on the PES congestion. This modification is based on studiesconducted to determine the likelihood of ignition for ordinary spills and releases of gas and ignitable liquid inchemical and petroleum plants.
For the purposes of this document, the release duration should be considered 10 minutes for low congestionPES, and 5 minutes for medium and high congestion PES.
Cryogenic (liquid) hydrogen should be considered as a normal release with duration based on the congestionof the PES as noted above.
For liquid or gaseous silane and pyrophoric gases the duration should be 30 seconds.
3.2.2.5 Flow-Limiting Devices and Block Valves
Flow-limiting devices, such as orifice plates, pipe reducers, and excess flow valves (EFVs), may be creditedto limit the amount of material released if they are reliably installed and protected against mechanicaldamage.
Excess flow valves rely on moving parts to achieve shutoff and there are a number of failure modes thatwould result in discharge at a reduced rate without shutoff. This may occur due to blockage by foreign objects,mechanical failure, or simply piping that limits the flow to less than the closing capacity. Use the maximumopening inside the EFV body (i.e., opening acts as an orifice) when developing the discharge rate.
Credit can be given for either internal or external devices. To credit an external EFV it should be welded tothe vessel or bolted to the first flange of any pipe connection on the vessel
In order to credit flow-limiting devices, all connections to the vessel should be provided with flow-limitingdevices EXCEPT those with pressure-relief devices.
Generally, the presence of emergency shutoff valves in a chemical process system, even if automatic, cannotbe credited for limiting the flow from a multi-vessel system. Considerable judgment is needed on very largesystems with redundant automatic block valves.
7-42 Evaluating Vapor Cloud ExplosionsPage 10 FM Global Property Loss Prevention Data Sheets
©2012 Factory Mutual Insurance Company. All rights reserved.

3.2.2.6 Partially Full Systems and Vessels
Process systems and tanks may not be used or filled to capacity due to process or safety considerations.When it can be reliably concluded that this is a normal condition, as verified by operating records, standardoperating procedures, etc., and where management systems are in place to ensure changes are not madewithout awareness of plant safety professionals, then the actual amount in the vessel or system may beused for determining maximum release, rather than the nominal (full capacity) amount.
When solid material (e.g., catalyst) represents a significant portion of the volume of a reaction system, thenthe volume occupied by the solid should be excluded in the calculation of the liquid release volume.
In many polymerization processes, the polymerization begins very quickly after catalyst introduction. Theliquid or gaseous monomers and co-monomers are usually unreacted in the process system for only a shorttime prior to reaction initiation. At these times, pressures and temperatures may be substantially lower andconditions less severe than under normal operating conditions. Judgment must be used when developinga worst-case scenario. Usually the partially full operating conditions are a more reasonable choice for worstcase.
3.2.3 Dispersion and Drifting of Released Vapor Clouds
For the purposes of this standard, a hazardous cloud is one that reaches the LEL and enters the flammablerange, as opposed to a cloud at ppm levels that presents a hazard to people or the environment.
Dispersion of the released cloud is highly dependent on the physical properties of the source material,including the force and direction of the release, weather conditions, surrounding terrain, and physical plantlayout.
High momentum releases, such as from an opening in a pressurized pipe or vessel, that do not directly impactthe ground or other solid surface, will create an extended cloud in the flammable range. The flammableenvelope develops in a matter of seconds after the release starts and then becomes reasonably stable insize for the duration of the release.
Low momentum clouds, such as those coming from a pool of released liquid or from a pressurized jet release,impacting directly on the ground may form large clouds over hundreds of ft (meters) from the release. Theseclouds take longer to develop due to the action of wind and mixing with air.
The portion of a hot liquid not flashed on release can be included in the cloud volume by estimating the poolvaporization, but this portion is usually small compared to the original release and flash.
Instead of the prior technique of a table providing fixed drift distances depending on the mass released,numerical computing methods are recommended to estimate the size of flammable clouds from releases ofgas/vapor, atomized liquid, and vaporizing pools, but are not part of this standard.
Assume the release of a source material within a PES is capable of filling the PES with a uniformstoichiometric mixture. The effect of piping, small platforms, and vessels is not considered to have an impacton the distribution of this cloud within the PES. Drift calculations are unnecessary when a release can occurwithin a PES. (This also assumes the pipe is capable of releasing the necessary quantity of material in thedefined duration.)
Where there is no feed pipe or vessel in the process area (PES) that can be a source of a release materialfor a vapor cloud, drift from large fixed or mobile storage vessels should be considered.
For the purpose of these studies, atmospheric conditions (in particular, normal or prevailing wind direction)should not be considered as a deciding factor on the cloud drift direction. Where cloud drift must be consideredto reach a PES, assume whatever direction is necessary to move across open areas from the release pointto the PES. Do not artificially force the cloud around or through buildings or through other areas containingprocess pads that could break up or impede the drift.
3.2.4 Accumulation Area
3.2.4.1 Potential Explosion Site (PES)
The PES is a defined volume with sufficient confinement and/or congestion to create flame acceleration. Avapor cloud generally needs confinement and/or congestion to transit from a slow flame (flash fire) to a fastdeflagration or detonation. Confined, congested, elongated outdoor process structures provide the best
Evaluating Vapor Cloud Explosions 7-42FM Global Property Loss Prevention Data Sheets Page 11
©2012 Factory Mutual Insurance Company. All rights reserved.

conditions to produce these results. A PES could also be an open or partially open process structure, anopen equipment pad, or heavily-loaded, multi-level pipe racks where the multiple layers of pipes can createthe effect of a solid roof/confinement.
Another way for the vapor cloud to transit from slow flame to a fast deflagration is with long run-up distancesthat can be achieved with a very large cloud and limited congestion or confinement or a small cloud of highlyreactive fuel. With low-reactivity fuels, a very large cloud is needed to achieve the same blast effect as acloud in a relatively small PES.
Where the PES has a volume of less than approximately 35,000 ft3 (1,000 m3), the VCE potential need notbe evaluated unless a large cloud of source material can be released (see Section 3.2.6). This is not anindicator that a VCE cannot occur; only that severe damage is unlikely to extend beyond the unit initiallyinvolved with damage, similar to an uncontrolled fire event.
Because material releases are typically located near ground level, for the purposes of this document, structureand equipment over 40 ft (12 m) will not be included in the PES volume. Often very tall process structureshave very low congestion at the higher levels, contributing little to flame acceleration.
In evaluating the effects of a VCE, the epicenter of the explosion will be considered as the approximate centerof the congested PES. Damage rings will be determined based on this epicenter. Epicenter locations innon-congested areas will not be considered.
3.2.4.2 Selecting a PES
Where there is more than one PES on a plant site, it may be necessary to analyze more than one scenarioto determine which presents the worst case.
Because confinement and congestion can cause effective flame acceleration, plant layout can directly affectthe potential for a VCE.
A plant with mostly open space and minimal or small process structures generally does not have the rightconditions for effective flame speed acceleration. An example is a tank farm with no pipe racks. Even thoughsuitable amounts of source materials may be present and a vapor cloud release could occur, the layout wouldlikely not support flame acceleration that contributes to overpressure. If the spaces between tanks orroadways were covered with canopies or dense pipe racks, the layout might have the conditions needed fora VCE.
3.2.4.3 Confinement
Spatial confinement defines how a flame accelerates within the process structure. The greater the restrictionon the ability of the combustion products to expand out of the PES during flame acceleration, the greaterthe potential pressures generated by the PES.
Most outdoor chemical process structures are limited to confining horizontal surfaces such as platforms,solid or grated floors, roofs, and substantial pipe racks. Where there are substantial vertical surfaces, theseshould also be considered as affecting the degree of confinement.
Confinement can be measured as the percentage of the PES external surface (excluding the ground) thatis confined with rigid surfaces that can restrict the ability of combustion products to expand during flameacceleration.
FM Global will consider three levels of confinement in evaluating the impact on flame acceleration:
1. None or partial single-surface confinement
2. Single-surface confinement
3. Multi-surface confinement
3.2.4.3.1 None or Partial Single-Surface Confinement
An open process pad with only equipment and structural framing has very little or no confinement. An exampleis a pad with no solid roof or horizontal obstacles and no intermediate grated floors or a tank farm with wellspaced vertical tanks (see Figure 5).
Partial single-surface confinement is characterized by partial, but not complete horizontal blockage thatprevents the flame front from expanding through the partially closed surface. Examples include pipe racks,
7-42 Evaluating Vapor Cloud ExplosionsPage 12 FM Global Property Loss Prevention Data Sheets
©2012 Factory Mutual Insurance Company. All rights reserved.
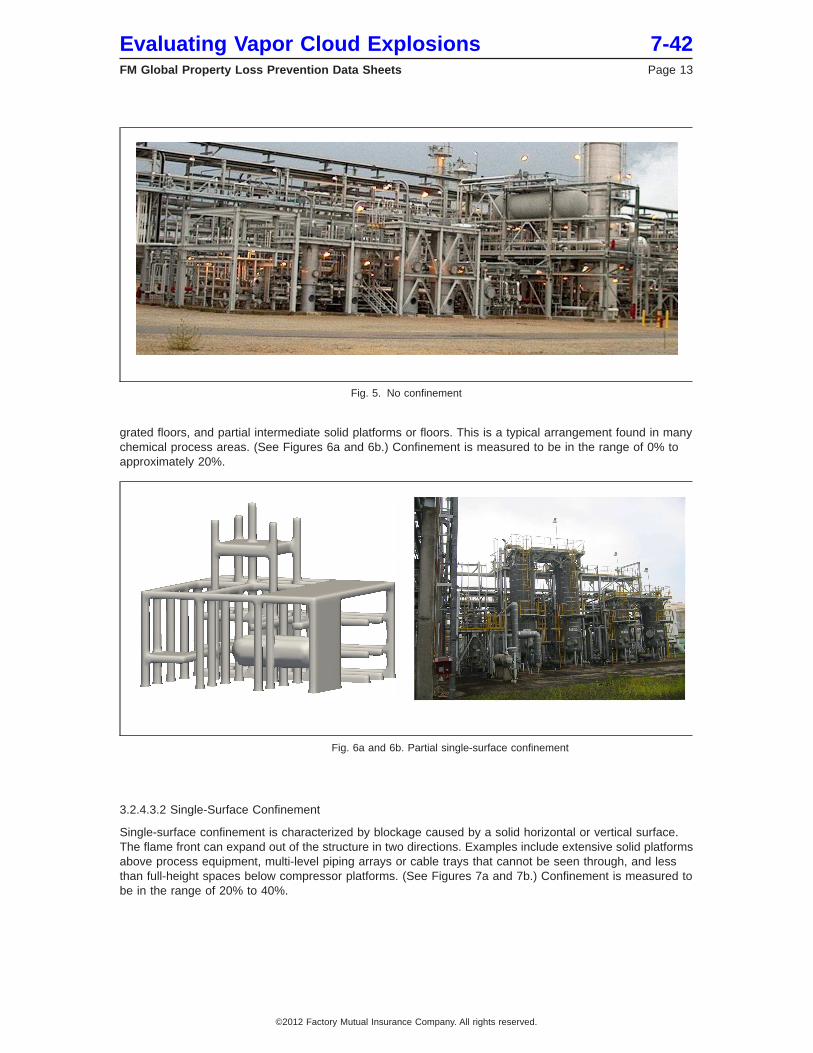
grated floors, and partial intermediate solid platforms or floors. This is a typical arrangement found in manychemical process areas. (See Figures 6a and 6b.) Confinement is measured to be in the range of 0% toapproximately 20%.
3.2.4.3.2 Single-Surface Confinement
Single-surface confinement is characterized by blockage caused by a solid horizontal or vertical surface.The flame front can expand out of the structure in two directions. Examples include extensive solid platformsabove process equipment, multi-level piping arrays or cable trays that cannot be seen through, and lessthan full-height spaces below compressor platforms. (See Figures 7a and 7b.) Confinement is measured tobe in the range of 20% to 40%.
Fig. 5. No confinement
Fig. 6a and 6b. Partial single-surface confinement
Evaluating Vapor Cloud Explosions 7-42FM Global Property Loss Prevention Data Sheets Page 13
©2012 Factory Mutual Insurance Company. All rights reserved.

3.2.4.3.3 Multi-Surface Confinement
Multi-surface confinement is characterized by confinement with horizontal and vertical planes. There aremany and extensive solid platforms and walls on the sides of process equipment. (See Figures 8a and 8b.)Tunnels are included in this category. This is a worst-case situation and flame can accelerate to detonationspeeds. The confinement is measured to be in the range of 40% to 80%.
3.2.4.4 Congestion
Congestion is defined by obstacle density through which the flame must move. Repeated and closely spacedobstacles, such as piping, structural columns or beams, vessels, and pumps, in the center of a cloud canprovide very efficient geometry for flame acceleration. Generally, a high obstacle density will produceincreased flame acceleration. There is some data to indicate that small obstacles such as pipes, columns,beams, and pumps are more effective at accelerating flame than are large process vessels (Cleaver and Shale1999).
Low congestion/obstacle density is defined as less than 2% of volume blockage and more than 6.5 ft (2 m)between obstacles. If you can walk through an area relatively unimpeded, it is likely one with low congestion.(See Figures 9a and 9b.)
Fig. 7a and 7b. Single-surface confinement
Fig. 8a and 8b. Multi-surface confinement
7-42 Evaluating Vapor Cloud ExplosionsPage 14 FM Global Property Loss Prevention Data Sheets
©2012 Factory Mutual Insurance Company. All rights reserved.

Medium congestion/obstacle density is defined as between 2%and 6% of volume blockage, and from 1.5to 6.5 ft (0.5 to 2 m) between obstacles. If you can walk though an area by taking an indirect path but it isawkward to do so, it is likely one with medium congestion. (See Figures 10a and 10b.)
High congestion/obstacle density is defined as more than 6% of volume blockage and less than 1.5 ft(0.5 m) between obstacles. If you cannot walk through an area, or if little light penetrates into it, then it islikely one with high congestion. (See Figures 11a and 11b.)
3.2.5 Ignition Sources
The presence or lack of ignition sources should not be considered when calculating material release. For acredible worst-case scenario, the total amount that might be spilled in the specified duration should be usedin estimating the cloud size. Loss experience has shown that wind patterns may allow the formation of largeclouds without their being ignited by nearby ignition sources.
Fig. 9a and 9b. Low congestion
Fig. 10a and 10b. Medium congestion
Evaluating Vapor Cloud Explosions 7-42FM Global Property Loss Prevention Data Sheets Page 15
©2012 Factory Mutual Insurance Company. All rights reserved.

3.2.6 PES Volume Threshold
Incident history has demonstrated that most damaging VCEs have been the result of large congested areas(PES) and release of a large fuel cloud. Minimum PES volumes and/or threshold amounts of source materialsubject to release are assigned by most practitioners of VCE analysis to ensure that only credible eventsare considered. However, just because threshold limits are met does not imply that a VCE cannot occur froma smaller PES and/or smaller source material release. At a minimum, there should be enough mass of sourcematerial released to achieve at least an average of the stoichiometric concentration throughout the PES.
After determining whether a VCE prone material is available as detailed in the criteria in 3.2.1, threshold PESvolumes have been set which identify credible cases for study of potential consequence from a VCE. Afterdetermining the release amount as directed in Section 3.2.2, use the following criteria (or Table 1) to determinethe need for a VCE consequences study:
1. Where the PES is over 250,000 ft3 (7,000 m3), a VCE consequences study is needed for any congestionlevel or fuel reactivity.
2. Where the PES is between 35,000 ft3 and 250,000 ft3 (1,000 and 7,000 m3), a VCE consequencesstudy is needed for any fuel reactivity and high or medium congestion level.
3. Where the PES is between 35,000 ft3 and 250,000 ft3 (1,000 and 7,000 m3), a VCE consequencesstudy is needed where the congestion level is low and the fuel reactivity is high or very high.
4. Where the PES is between 35,000 ft3 and 250,000 ft3 (1,000 and 7,000 m3), a VCE consequencesstudy is needed where the congestion level is low and the total release amount meets the followingcriteria:
a. 60 tons (54 tonnes) or more with low reactivity (20 cm/sec ≤ LBV < 40 cm/sec)Examples: methane/natural gas, butane
b. 7 tons (6.4 tonnes) or more for materials with medium reactivity (40 ≤ LBV < 60 cm/sec)Examples: propane, butadiene and cyclohexane
5. Where the PES volume is less than 35,000 ft3 (1000 m3) with any congestion level, a VCE consequencesstudy is needed where the total release meets the following criteria:
a. 60 tons (54 tonnes) or more with low reactivity (20 cm/sec ≤ LBV < 40 cm/sec)Examples: methane/natural gas, butane
b. 7 tons (6.4 tonnes) or more for materials with medium reactivity (40 ≤ LBV < 60 cm/sec)Examples: propane, butadiene and cyclohexane
c. 1200 lb (540 Kg) or more for materials with high reactivity (60 cm/sec ≤ LBV < 100 cm/sec)Examples: ethylene, ethylene oxide and propylene oxide
Fig. 11a and 11b. High congestion
7-42 Evaluating Vapor Cloud ExplosionsPage 16 FM Global Property Loss Prevention Data Sheets
©2012 Factory Mutual Insurance Company. All rights reserved.
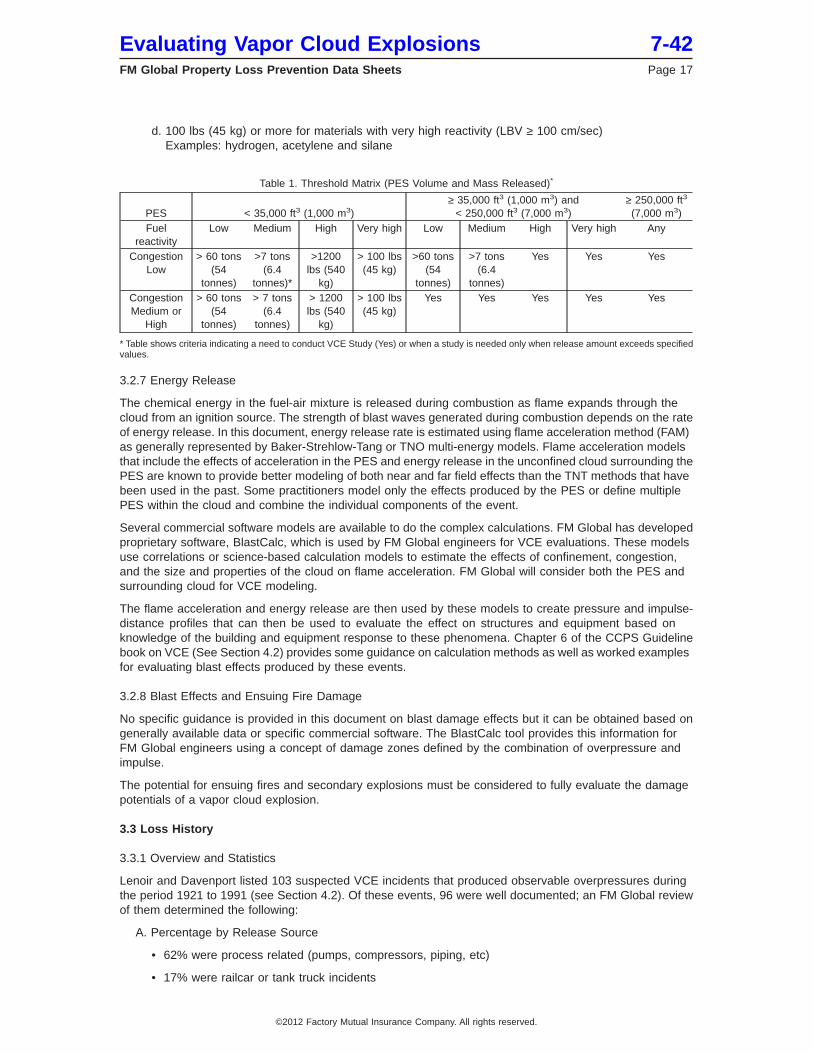
d. 100 lbs (45 kg) or more for materials with very high reactivity (LBV ≥ 100 cm/sec)Examples: hydrogen, acetylene and silane
Table 1. Threshold Matrix (PES Volume and Mass Released)*
PES < 35,000 ft3 (1,000 m3)≥ 35,000 ft3 (1,000 m3) and
< 250,000 ft3 (7,000 m3)≥ 250,000 ft3
(7,000 m3)Fuel
reactivityLow Medium High Very high Low Medium High Very high Any
CongestionLow
> 60 tons(54
tonnes)
>7 tons(6.4
tonnes)*
>1200lbs (540
kg)
> 100 lbs(45 kg)
>60 tons(54
tonnes)
>7 tons(6.4
tonnes)
Yes Yes Yes
CongestionMedium or
High
> 60 tons(54
tonnes)
> 7 tons(6.4
tonnes)
> 1200lbs (540
kg)
> 100 lbs(45 kg)
Yes Yes Yes Yes Yes
* Table shows criteria indicating a need to conduct VCE Study (Yes) or when a study is needed only when release amount exceeds specifiedvalues.
3.2.7 Energy Release
The chemical energy in the fuel-air mixture is released during combustion as flame expands through thecloud from an ignition source. The strength of blast waves generated during combustion depends on the rateof energy release. In this document, energy release rate is estimated using flame acceleration method (FAM)as generally represented by Baker-Strehlow-Tang or TNO multi-energy models. Flame acceleration modelsthat include the effects of acceleration in the PES and energy release in the unconfined cloud surrounding thePES are known to provide better modeling of both near and far field effects than the TNT methods that havebeen used in the past. Some practitioners model only the effects produced by the PES or define multiplePES within the cloud and combine the individual components of the event.
Several commercial software models are available to do the complex calculations. FM Global has developedproprietary software, BlastCalc, which is used by FM Global engineers for VCE evaluations. These modelsuse correlations or science-based calculation models to estimate the effects of confinement, congestion,and the size and properties of the cloud on flame acceleration. FM Global will consider both the PES andsurrounding cloud for VCE modeling.
The flame acceleration and energy release are then used by these models to create pressure and impulse-distance profiles that can then be used to evaluate the effect on structures and equipment based onknowledge of the building and equipment response to these phenomena. Chapter 6 of the CCPS Guidelinebook on VCE (See Section 4.2) provides some guidance on calculation methods as well as worked examplesfor evaluating blast effects produced by these events.
3.2.8 Blast Effects and Ensuing Fire Damage
No specific guidance is provided in this document on blast damage effects but it can be obtained based ongenerally available data or specific commercial software. The BlastCalc tool provides this information forFM Global engineers using a concept of damage zones defined by the combination of overpressure andimpulse.
The potential for ensuing fires and secondary explosions must be considered to fully evaluate the damagepotentials of a vapor cloud explosion.
3.3 Loss History
3.3.1 Overview and Statistics
Lenoir and Davenport listed 103 suspected VCE incidents that produced observable overpressures duringthe period 1921 to 1991 (see Section 4.2). Of these events, 96 were well documented; an FM Global reviewof them determined the following:
A. Percentage by Release Source
• 62% were process related (pumps, compressors, piping, etc)
• 17% were railcar or tank truck incidents
Evaluating Vapor Cloud Explosions 7-42FM Global Property Loss Prevention Data Sheets Page 17
©2012 Factory Mutual Insurance Company. All rights reserved.
• 11% were high pressure pipeline failures
• 10% were storage tank incidents
B. Percentage by Material Released
• 28% involved liquefied petroleum gases other than ethylene
• 14% involved ethylene (liquid or gas)
• 11% involved ignitable liquids
• 5% involved methane/natural gas
• 3% involved hydrogen or synthesis gas
• 39% involved various other gases
3.3.2 Process incidents
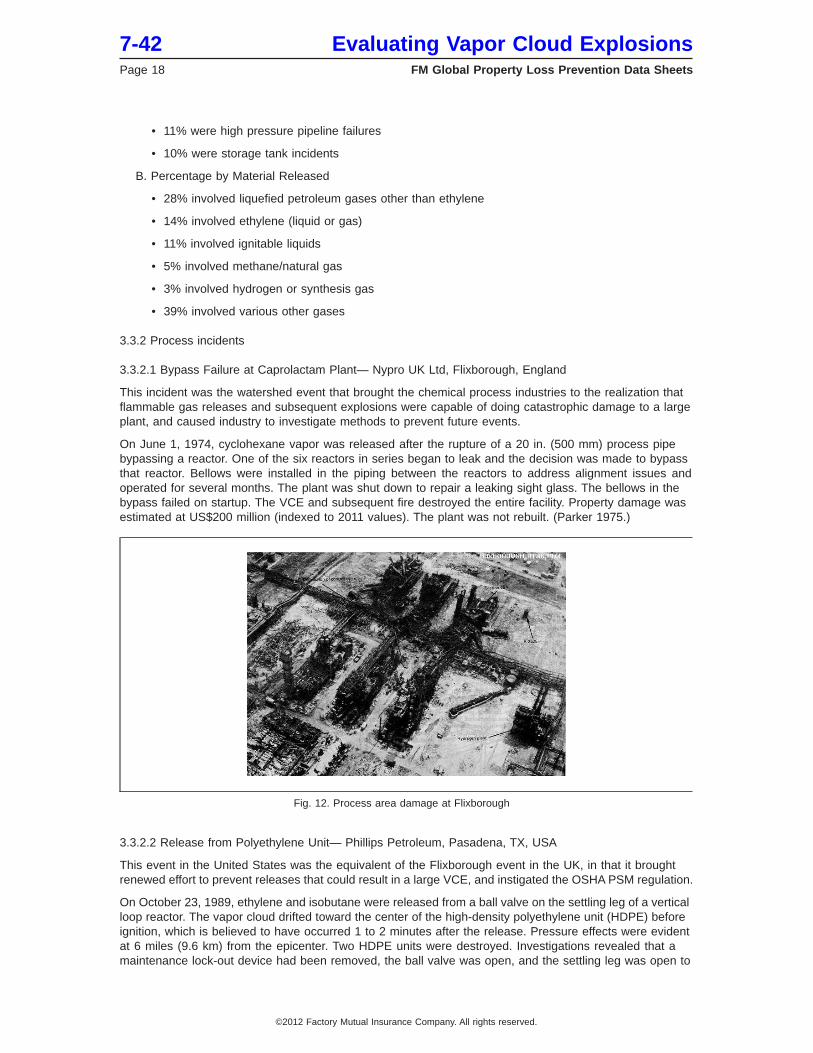
3.3.2.1 Bypass Failure at Caprolactam Plant— Nypro UK Ltd, Flixborough, England
This incident was the watershed event that brought the chemical process industries to the realization thatflammable gas releases and subsequent explosions were capable of doing catastrophic damage to a largeplant, and caused industry to investigate methods to prevent future events.
On June 1, 1974, cyclohexane vapor was released after the rupture of a 20 in. (500 mm) process pipebypassing a reactor. One of the six reactors in series began to leak and the decision was made to bypassthat reactor. Bellows were installed in the piping between the reactors to address alignment issues andoperated for several months. The plant was shut down to repair a leaking sight glass. The bellows in thebypass failed on startup. The VCE and subsequent fire destroyed the entire facility. Property damage wasestimated at US$200 million (indexed to 2011 values). The plant was not rebuilt. (Parker 1975.)
3.3.2.2 Release from Polyethylene Unit— Phillips Petroleum, Pasadena, TX, USA
This event in the United States was the equivalent of the Flixborough event in the UK, in that it broughtrenewed effort to prevent releases that could result in a large VCE, and instigated the OSHA PSM regulation.
On October 23, 1989, ethylene and isobutane were released from a ball valve on the settling leg of a verticalloop reactor. The vapor cloud drifted toward the center of the high-density polyethylene unit (HDPE) beforeignition, which is believed to have occurred 1 to 2 minutes after the release. Pressure effects were evidentat 6 miles (9.6 km) from the epicenter. Two HDPE units were destroyed. Investigations revealed that amaintenance lock-out device had been removed, the ball valve was open, and the settling leg was open to
Fig. 12. Process area damage at Flixborough
7-42 Evaluating Vapor Cloud ExplosionsPage 18 FM Global Property Loss Prevention Data Sheets
©2012 Factory Mutual Insurance Company. All rights reserved.

atmosphere where a spool leading to the product take-off valve should have been connected. Propertydamage was about US$1 billion (indexed to 2011 values). It took almost two years to restore full HDPEproduction capacity. (U.S. OSHA 1990.)
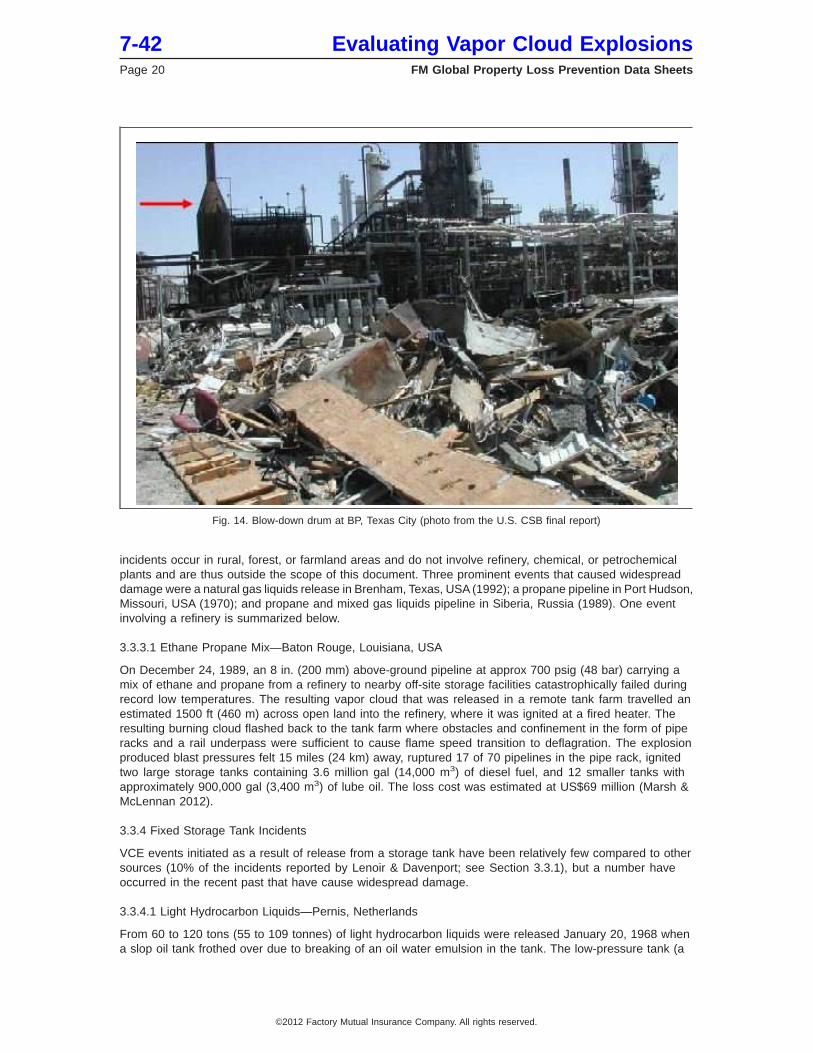
3.3.2.3. Discharge from Atmospheric Vent—BP, Texas City, TX, USA
This incident was a leading factor in the revision of API 521 (ISO 23251) in 2007, which put new restrictionsand limits on the use of blow-down drums and added guidance on recognizing the way systems can presenta vapor cloud hazard. (See Section 4.2.)
On the morning of March 23, 2005, the raffinate splitter tower (mix of C5-C8 hydrocarbons) in the refinery’sisomerization unit was restarted after a maintenance outage. During the startup, operations personnelpumped liquid hydrocarbons into the tower for over three hours without any liquid being removed, which wascontrary to startup procedure instructions. Critical alarms and control instrumentation provided falseindications that failed to alert operators of the high level in the tower. The 170 ft (52 m) tall tower was overfilledand liquid overflowed into the overhead pipe at the top of the tower. The overhead pipe ran down the sideof the tower to pressure-relief valves located 148 ft (45 m) below. As the pipe filled with liquid, the pressureat the bottom rose rapidly from about 21 psi to 64 psi. The three pressure-relief valves opened for six minutes,discharging a large quantity of hydrocarbon liquid to a blow-down drum (Figure 14) with a vent stack opento the atmosphere. The blow-down drum and stack overfilled, which led to a geyser-like release out the113 ft (34 m) tall stack. According to the CSB investigation, this blow-down system was an antiquated andunsafe design originally installed in the 1950s that had never been connected to a flare system to safelycontain liquids and burn flammable vapors released from the process.
Severe damage occurred to the isomerization unit, resulting in more than US$1.5 billion in gross loss costs.
3.3.3 High-Pressure Transmission Pipeline Incidents
Rupture of high-pressure transmission pipelines for petroleum gases and liquids is a potential VCE exposurethat should be considered in chemical plants (11% of the incidents reported by Lenoir & Davenport; seeSection 3.3.1). They happen on a regular basis; there have been 10 major incidents with detailed investigationreports posted on the US National Transportation Safety Board website since 2004. In most cases these
Fig. 13. Damage to Phillips plant following the VCE
Evaluating Vapor Cloud Explosions 7-42FM Global Property Loss Prevention Data Sheets Page 19
©2012 Factory Mutual Insurance Company. All rights reserved.
incidents occur in rural, forest, or farmland areas and do not involve refinery, chemical, or petrochemicalplants and are thus outside the scope of this document. Three prominent events that caused widespreaddamage were a natural gas liquids release in Brenham, Texas, USA (1992); a propane pipeline in Port Hudson,Missouri, USA (1970); and propane and mixed gas liquids pipeline in Siberia, Russia (1989). One eventinvolving a refinery is summarized below.
3.3.3.1 Ethane Propane Mix—Baton Rouge, Louisiana, USA
On December 24, 1989, an 8 in. (200 mm) above-ground pipeline at approx 700 psig (48 bar) carrying amix of ethane and propane from a refinery to nearby off-site storage facilities catastrophically failed duringrecord low temperatures. The resulting vapor cloud that was released in a remote tank farm travelled anestimated 1500 ft (460 m) across open land into the refinery, where it was ignited at a fired heater. Theresulting burning cloud flashed back to the tank farm where obstacles and confinement in the form of piperacks and a rail underpass were sufficient to cause flame speed transition to deflagration. The explosionproduced blast pressures felt 15 miles (24 km) away, ruptured 17 of 70 pipelines in the pipe rack, ignitedtwo large storage tanks containing 3.6 million gal (14,000 m3) of diesel fuel, and 12 smaller tanks withapproximately 900,000 gal (3,400 m3) of lube oil. The loss cost was estimated at US$69 million (Marsh &McLennan 2012).
3.3.4 Fixed Storage Tank Incidents
VCE events initiated as a result of release from a storage tank have been relatively few compared to othersources (10% of the incidents reported by Lenoir & Davenport; see Section 3.3.1), but a number haveoccurred in the recent past that have cause widespread damage.
3.3.4.1 Light Hydrocarbon Liquids—Pernis, Netherlands
From 60 to 120 tons (55 to 109 tonnes) of light hydrocarbon liquids were released January 20, 1968 whena slop oil tank frothed over due to breaking of an oil water emulsion in the tank. The low-pressure tank (a
Fig. 14. Blow-down drum at BP, Texas City (photo from the U.S. CSB final report)
7-42 Evaluating Vapor Cloud ExplosionsPage 20 FM Global Property Loss Prevention Data Sheets
©2012 Factory Mutual Insurance Company. All rights reserved.

few inches [cm] above atmospheric) failed at the seam due to the frothing action. The resulting cloud diameterwas 450 ft (140 m). The explosive yield was estimated to be 22 tons (20 tonnes) TNT equivalent. The lossexceeded US$100 million in property damage.
3.3.4.2 Winter Grade Gasoline—Buncefield, Hertfordshire, UK
The Hertfordshire Oil Storage Terminal supplied 8% of the oil and fuel supplies of the UK, including about40% of the aviation fuel to London’s Heathrow and Gatwick airports. It covered 50 acres (20 hectares) andwas supplied by three pipelines from a number of refineries in the UK.
Starting at approximately 7 p.m. on December 10, 2005, Tank 912 began receiving gasoline by pipeline ata rate of about 2400 gpm (550 m3/hr). From approximately 3 a.m. on December 11, the tank level gauge wasunchanged but fuel continued to be received. Calculations indicate the tank began to overflow at about 5:20a.m., and CCTV showed a vapor cloud that had spread to an adjoining commercial property and reachedalmost 6.6 ft (2 m) deep shortly before the 6:01 a.m. explosion.
The release was estimated to be approximately 300 tons (272 tonnes) of gasoline. Official accident reportsestimate that approximately 10% of this fuel vaporized. The explosion caused widespread damage in thesurrounding office and residential areas (windows broken as much as 1 mile [1.6 km] away), and thesubsequent fires destroyed much of the tank farm. (See Figure 15.)
3.3.5 Mobile Transportation Incidents
VCE incidents causing damage to industrial facilities that have involved transportation vehicles, such asrailcars, tank trucks, or waterway vessels, are not unusual (17% of the incidents reported by Lenoir &Davenport; see Section 3.3.1).
3.3.5.1 Railcar, Liquefied Petroleum Gas—East St. Louis, Illinois, USA
On January 22, 1972, a railcar full of liquefied petroleum gas (LPG) (primarily propylene) rolled into anotherrailcar during rail yard switching operations. The collision occurred at approximately 15 mph (24 kph), roughly10 mph (16 kph) faster than normal practice. The coupling on a stationary car punctured the moving LPG
Fig. 15. Buncefield terminal; fire following VCE
Evaluating Vapor Cloud Explosions 7-42FM Global Property Loss Prevention Data Sheets Page 21
©2012 Factory Mutual Insurance Company. All rights reserved.
car and released 24,300 lbs (53,500 kg) of vapor at 220 psig (15 barg) into the rail yard. The vapor cloudcovered an area of more than 215,000 ft2 (20,000 m2) and reportedly ignited in two different locations. Theexplosion was enhanced by the tightly congested arrangement of railcars throughout the large rail yard. Anestimated 1,000 buildings were damaged to various degrees. The property damage was estimated at US$45million (U.S. NTSB 1973).
3.4 Prevention and Control of Consequences
Many features of chemical process plants control the occurrence of vapor cloud releases and explosions,but complete elimination of the hazard potential is not possible. The recommendations in this document focuson the key human element features and a mechanical integrity program to prevent the release, limit or controlthe size of the release, prevent ignition, and respond promptly to any unexpected events. Some additionalfactors that could be considered are in a number of other FM Global data sheets.
Limiting quantities of hazardous materials in the operation, and locating hazardous operations remotely withrespect to lower hazard ones, is usually not possible with an existing facility; new construction, however,should consider these features. A few documents and significant factors are highlighted below.
• Data Sheet 7-32 describes the proper location of ignitable liquid operations and safeguards for properoperation.
• Data Sheet 7-43 is directed at chemical process plants and includes information on PSM and inherentsafety.
• Data Sheet 7-49 provides guidance on the proper sizing of overpressure protection systems, includingproper control of the releases. Overpressure protection and process pressure control systems presentan opportunity to limit the release of hazardous liquid or vapor; however, these systems can be theunplanned source of the vapor cloud release if improperly designed or operated. The incident describedin Section 3.3.2.3 is an example of such an occurrence. Additional guidance on these systems can be foundin CCPS guideline books on process vents and emission control systems or pressure-relief effluenthandling systems (see Section 4.2).
4.0 REFERENCES
4.1 FM Global
Data Sheet 7-0, Causes and Effects of Fires and ExplosionsData Sheet 7-14, Fire Protection for Chemical PlantsData Sheet 7-32, Ignitable Liquid OperationsData Sheet 7-43, Loss Prevention in Chemical PlantsData Sheet 7-44, Spacing of Facilities in Outdoor Chemical PlantsData Sheet 7-49, Emergency Venting of Vessels
4.2 Other
American Petroleum Institute (API). Guide for Pressure-Relieving and Depressuring Systems. API 521. FifthEdition, 2007. (Identical to ISO 23251, Petroleum Petrochemical and Natural Gas Industries PressureRelieving and Depressuring Systems. First Edition, 2006.)
American Society of Mechanical Engineers (ASME). Scheme for Identification of Piping Systems. ANSI/ASMEA13.1.
Buncefield Major Incident Investigation Board. The Buncefield Incident, 11 December 2005: The Final Reportof the Major Incident Investigation Board. Volume 1. December 2008.
Center for Chemical Process Safety (CCPS). Guidelines for Evaluating Process Plant Buildings for ExternalExplosions and Fires. 2010.
Center for Chemical Process Safety (CCPS). Guidelines for Facility Siting and Layout. 2003.
Center for Chemical Process Safety (CCPS). Guidelines for Pressure Relief and Effluent Handling Systems.1998.
Center for Chemical Process Safety (CCPS). Guidelines for Vapor Cloud Explosion, Pressure Vessel Burst,BLEVE and Flash Fire Hazards. Second Edition, 2010.
7-42 Evaluating Vapor Cloud ExplosionsPage 22 FM Global Property Loss Prevention Data Sheets
©2012 Factory Mutual Insurance Company. All rights reserved.

Center for Chemical Process Safety (CCPS). Safe Design and Operation of Process Vents and EmissionControl Systems. 2006.
Cleaver, R. P., and G. A. Shale. “Mathematical Models for Gas Explosions on Industrial Sites.” Proceedingsof the International Conference and Workshop on Modeling the Consequences of Accidental Releases ofHazardous Materials. American Institute of Chemical Engineers (AIChE). 1999.
Daycock, J.H., and P.J Rew. Development of a Method for the Determination of On-Site Ignition Probabilities.Health and Safety Executive. RR226. 2004.
Dorofeev, S. B. “A Flame Speed Correlation for Unconfined Gaseous Explosions.” Process Safety Progress.26:2 (June 2007): p. 140-149.
Lenoir, E. M., and John A. Davenport. “A Survey of Vapor Cloud Explosions: Second Update.” Process SafetyProgress. 12:1 (January 1993): p. 12-33.
Marsh & McLennan. 100 Largest Losses, 1972-2011 (in the Hydrocarbon Industry). 22nd Edition. 2012.
Parker, R. J. The Flixborough Disaster: Report of the Court of Inquiry. H.M. Stationary Office,1975.
U.S. Chemical Safety and Hazard Investigation Board. “Statements of CSB Chairman John Bresland andCSB Investigations Supervisor Don Holmstrom Updating the Public on the Investigation of the Nov. 4Explosion at the Silver Eagle Refinery in Woods Cross, Utah, November 17, 2009.”www.csb.gov/newsroom/detail.aspx?nid=296 (accessed August 13, 2012).
U.S. Chemical Safety and Hazard Investigation Board. Refinery Explosion and Fire, BP, Texas City, Texas,March 23, 2005. Report No. 2005-04-I-TX. March 2007.
U.S. National Transportation Safety Board (NTSB). Highly Volatile Release from Underground Storage Cavernand Explosion, Mapco Natural Gas Liquids, Inc., Nov. 4, 1993. PAR-93-01.
U.S. National Transportation Safety Board (NTSB). Railroad Accident Report: Hazardous Materials RailroadAccident in the Alton and Southern Gateway Yard in East St. Louis, Ill., January 22, 1972. NTSB-RAR-1.1973.
U.S. Occupational Safety and Health Administration (OSHA). The Phillips 66 Company Houston ChemicalComplex Explosion and Fire: A Report to the President. April 1990.
APPENDIX A GLOSSARY OF TERMS
Blast: A transient change in the gas density, pressure and velocity of the air surrounding an explosion. Adiscontinuous change is known as a shock wave. A gradual change is known as a pressure wave.
Deflagration: A propagating chemical reaction of a substance in which the reaction front advances into theunreacted substance rapidly, but at less than sonic velocity in the unreacted material.
Detonation: A propagating chemical reaction of a substance in which the reaction front advances into theunreacted substance at or greater than sonic velocity in the unreacted material.
Explosion: A release of energy that causes a blast.
Flash Fire: The combustion of a flammable gas or vapor and air mixture in which the flame propagates throughthat mixture in a manner such that negligible or no damaging overpressure is generated.
Ignitable Liquid: Any liquid or liquid mixture that is capable of fueling a fire, including flammable liquids,combustible liquids, inflammable liquids, or any other reference to a liquid that will burn. An ignitable liquidmust have a fire point.
Impulse: A measure that can be used to define the ability of a blast wave to do damage. It is calculated bythe integration of the pressure-time curve.
Overpressure: Any pressure above atmospheric caused by a blast.
Potential Explosion Site (PES): An open process structure with congestion and confinement that is the locationof a vapor cloud release and the epicenter of the blast effects once the cloud is ignited
Turbulence: A random-flow motion of a fluid superimposed on its mean flow.
Evaluating Vapor Cloud Explosions 7-42FM Global Property Loss Prevention Data Sheets Page 23
©2012 Factory Mutual Insurance Company. All rights reserved.

Vapor cloud explosion: The explosion resulting from the ignition of a cloud of flammable vapor, gas or mistin which flame speeds accelerate to sufficiently high velocities to produce significant overpressures.
APPENDIX B DOCUMENT REVISION HISTORY
October 2012. This document has been completely rewritten to reflect the use of a flame acceleration method(FAM) rather than a TNT equivalency method to predict a VCE. FAM analysis uses the flammable cloudoutside the release structure and pressure-impulse analysis, rather than overpressure only, to determinedamage.
The only major change in excluded materials is natural gas, which is now recognized as a possible VCEsource; however, large amounts are needed and this is reflected in the release amount thresholds given inSection 3.2.6.
Threshold quantities for completing a study have been revised.
January 2012. Terminology related to ignitable liquids has been revised to provide increased clarity andconsistency with regard to FM Global’s loss prevention recommendations for ignitable liquid hazards.
May 2008. Minor editorial changes
May 2005. Editorial corrections to Table 7B
January 2001. Editorial corrections to Figure 2, Table 1 added to compounds.
September 1998. Minor reformatting and re-issue as Data Sheet 7-42.
January 1998. Editorial corrections
September 1997. Editorial corrections to Table 1
April 1994. Initial issue as Data Sheet 7-0S and 7-0SC
7-42 Evaluating Vapor Cloud ExplosionsPage 24 FM Global Property Loss Prevention Data Sheets
©2012 Factory Mutual Insurance Company. All rights reserved.