evaluating tunable lighting in classrooms...the led lighting system was installed in august 2017,...
TRANSCRIPT
Evaluating Tunable Lighting in Classrooms: Trial LED lighting systems in three classrooms in the Folsom Cordova Unified School District
September 2018 Supplemental Report, April 2019

(This page intentionally left blank)

Evaluating Tunable Lighting in Classrooms: Trial LED lighting systems in three classrooms in the Folsom Cordova Unified School District
Study Participants:
Pacific Northwest National Laboratory U.S. Department of Energy Folsom Cordova Unified School District Sacramento Municipal Utility District Finelite, Inc. Cadmus
Sarah F. Safranek Robert G. Davis
September 2018
Sarah F. Safranek Anne C. Irvin Supplemental Report, April 2019
Pacific Northwest National Laboratory Richland, Washington 99352

PNNL-27806

Evaluating Tunable Lighting in Classrooms
iii
Preface The U.S. Department of Energy’s Solid-State Lighting program documents the performance of SSL products and systems based on standardized laboratory test results, additional specialized testing, mock-up studies, and real-world field evaluations. This information is provided publicly for several purposes: 1) to track SSL technology performance improvement over time; 2) to identify technology challenges that impact performance and application of SSL; 3) to spur continued advancements in SSL technology, product design, and application; and 4) to maximize energy efficiency and decrease U.S. energy use, while improving lighting quality. DOE does not endorse any commercial product or in any way provide assurance that other users will achieve similar results through use of these products. SSL technology continues to evolve quickly, so evaluation results should always be understood in the context of the timeframe in which products were acquired, tested, installed, and operated. Especially given the rapid development cycle for SSL products, specifiers and purchasers should always seek current information from manufacturers when evaluating such products. The two programs primarily involved in product evaluations are CALiPER and GATEWAY.
CALiPER When CALiPER was launched its role was largely to test products and compare actual performance to manufacturer claims and to benchmark technologies. Early CALiPER testing also contributed fundamentally to the development of standardized photometric test methods specifically for SSL and the associated accreditation of testing laboratories. As the SSL market has matured, CALiPER has transitioned its evaluations to new products and functions, such as OLED-based luminaires and color tunable products, as well as long-term product performance. CALiPER continues to support the development of new test procedures and application guidance, with DOE investigations providing data that is essential for understanding the most current issues facing the SSL industry. Data are gathered primarily through laboratory testing and mock-up installations.
GATEWAY GATEWAY conducts field evaluations of high-performance SSL products to collect empirical data and document experience with field installations. GATEWAY provides independent, third-party data for use in decision-making by lighting manufacturers, users, and other professionals. Real-world installations often reveal product limitations and application issues that are not apparent from laboratory testing. GATEWAY typically documents pre- and post-installation light levels, color characteristics, energy intensity, and other performance attributes, and addresses application and maintenance of SSL products. In some cases, GATEWAY returns to projects after months or years of operation to take additional site measurements or remove luminaires and send to accredited laboratories for testing. While not possible for every project, such follow-up measurements have yielded useful data on dirt depreciation, color shift, luminous intensity distribution changes, and lumen depreciation over time.
For more information on the DOE SSL program, please visit energy.gov/eere/ssl/solid-state-lighting.

Evaluating Tunable Lighting in Classrooms
iv
Acknowledgments This project would not have been possible without the full collaboration and cooperation of the following individuals from each of the participating organizations. They were generous with their time and information, and they were always very responsive to our inquiries and requests. We are very grateful for their contributions.
Folsom Cordova Unified School District: David Frankel, Mike Hammond, Bethanee Hunnicutt, Kevin Smith
Sacramento Municipal Utility District: David Bisbee, Connie Samla
Finelite, Inc.: Stephen Radovich, Aaron Smith
Cadmus: Emily Shackleton, Sepideh Shahinfard, John Walcyzk

Evaluating Tunable Lighting in Classrooms
v
Executive Summary This report summarizes the results from a trial installation of light-emitting diode (LED) lighting systems installed in three classrooms at Gold Ridge Elementary (GRE) School in the Folsom Cordova Unified School District (FCUSD) in Folsom, CA. FCUSD asked the Sacramento Municipal Utility District (SMUD) to help them explore potential benefits of tunable-white lighting systems for children with autism spectrum disorder (ASD). SMUD responded by implementing a research project and invited Pacific Northwest National Laboratory (PNNL) to document the performance of the LED lighting systems as part of a GATEWAY evaluation. SMUD and FCUSD staff coordinated and completed the design and installation of the LED systems, and coordinated the collection of data from teachers, students, and parents, while PNNL evaluated the energy and photometric performance of the systems.
The predominant incumbent classroom lighting system consisted of 2 ft by 4 ft recessed luminaires with two T8 fluorescent lamps with an electronic ballast, resulting in a rated wattage of 56 W per luminaire. The typical classroom used 24 luminaires, with 22 arranged in a square around the outer perimeter of the room and two located in the room’s center. The LED lighting system was installed in August 2017, before the beginning of the 2017-2018 school year. Of the three classrooms that received the LED lighting system, one was a general education fifth-grade classroom and two were used for educating students diagnosed with ASD. For those three classrooms, 24 incumbent fluorescent luminaires were replaced with 11 to 12 recessed 2 ft by 2 ft Finelite white-tunable LED troffer luminaires. Additionally, one 12 ft Finelite white-tunable LED wall wash surface-mounted luminaire was installed above the whiteboard in each classroom. The maximum power values for the troffers and whiteboard luminaires were 43 and 40 W per luminaire, respectively. Implementation of dimming controls further reduced the power requirements of the LED luminaires.
A wall-mounted, touch-sensitive Finelite controller was fixed at the front of the classroom, adjacent to the whiteboard. The controller uses a DMX512 protocol to communicate with the LED driver onboard each luminaire. The touch-sensitive control pad offers five preset lighting condition buttons and three slide-bars. Depending on the activity in each specific classroom, teachers can select from three preset scenes which deliver varying levels of light intensity to different parts of the classroom. Similarly, the two additional presets adjust the luminaire intensity as well as the spectral power distribution (SPD) to offer a wider range of apparent warmth or coolness of light. At any time, teachers can depart from the preset scenes and fine-tune the classroom’s light color and intensity through three slide-bars. Two slide-bars are dedicated to continuous 0-100% dimming, one for the general luminaires and one for the whiteboard luminaire. The third slide-bar allows for 2700 to 6500 K color tuning across all luminaires. Additionally, on/off power buttons are available on the touchpad for the entire system or the general and whiteboard luminaires separately.
Several monitoring procedures were implemented to evaluate the energy performance, user interaction, and occupant response to the LED lighting system during the 2017-2018 school year. Energy metering began while the classrooms were operating under the fluorescent lighting system and continued throughout the 2017-2018 school year. Student surveys were administered twice per day during part of the 2017-2018 school year and were aimed at capturing self-reported performance evaluations before and after the color-tuning capabilities of the LED system were enabled. After the color-tuning capabilities were enabled, user interactions with the touch-pad lighting controller were recorded with logging device, custom-built by Finelite, and saved to a remote laptop.
Key results from the trial installation at GRE included the following:
• For the same operational hours while both operated at maximum intensity, the replacement white-tunable LED system is estimated to offer a potential energy savings of 46% relative to the incumbent fluorescent system. However, the preset lighting settings of the LED system allow increased savings by operating all luminaires at 80% intensity or less. Actual energy metered data for a typical school day before and after the LED lighting installation show a 48% to 69% reduction in daily energy use for the three classrooms.

Evaluating Tunable Lighting in Classrooms
vi
This savings comes from the increased efficacy of the LED luminaires relative to fluorescent luminaires, and from the reduced illuminances provided by the LED systems. Annual estimates, which include weekends and academic holidays/breaks, suggest the reduction in energy use is closer to 26% to 57% per classroom due to the baseline electrical load of the control system during the off-hours.
• The DMX-based control system installed in this pilot study produced over 3 W of electrical load per luminaire even when the luminaires were switched off. This load, sometimes referred to as phantom or baseline load, accounted for over 25% of the annual energy use of the system. Because classrooms have extended periods when the lighting is off, the importance of the baseline load and its effect on annual energy use may be elevated relative to other applications with fewer off hours. Baseline power draw with active controls such as DMX, digital addressable lighting interface (DALI), power over Ethernet (PoE), and others is an important concern that needs to be addressed to maximize the energy savings potential of tunable LED systems in classrooms. Turning power off completely to the driver would save energy by minimizing the phantom load, but the tradeoff might be less control flexibility, more controllers, or limitations on deep dimming.
• The illuminance levels produced by the incumbent fluorescent systems exceeded those recommended by the IES for this application. The measured average illuminances in the LED classrooms were roughly 50% of the measured average illuminance in the fluorescent classroom, for the General control setting. At this control setting, the LED systems were operating at 52% and 58% intensity based on individual teacher preference, while still meeting IES recommendations. The ability to tune the intensity to meet the illuminance needs resulted in significant energy reductions for the lighting.
• The measured color characteristics of the LED systems were very consistent, both between different luminaires and over the range of dimming.
• Calculated metrics related to non-visual responses, based on SPD measurements at eye locations, demonstrate important differences between the equivalent melanopic lux (EML) and circadian stimulus (CS) metrics that have been proposed for use in lighting applications. The data from this project also demonstrates that the photopic illuminances typically provided in classrooms are not sufficient to meet common recommended levels of CS or EML, although neither of those metrics has been adopted by recognized standards organizations. While the tunable lighting system in this project could provide a wide range of CS or EML levels, the illuminances and associated energy use would need to be increased to satisfy the existing recommendations for these non-visual metrics.
• The three teachers whose classrooms were included in this pilot study had unique preferences when using the lighting system. One teacher typically used the default functionality of the lighting system and two teachers used the preset buttons and customizable slide-bars on the controller daily. In particular, the Calm setting (low light levels with warm color temperature) was often used at specific times of the day, suggesting that it acted as a schedule cue for students.
• When asked to give feedback on the LED lighting systems, all three teachers included in this pilot study felt that the LED lighting system offered an improved working and learning environment for themselves and their students. Being able to dim the lighting system was seen as particularly valuable, and the ability to change the color of the light was considered a secondary benefit.
The monitoring procedures implemented in this project offered valuable insight into how the LED lighting system was utilized in terms of typical occupancy, operation, and load patterns. In particular, the metered energy data was used to substantiate energy savings estimates hypothesized early in the FCUSD project timeline. Comparing the net energy consumption of a typical 24 hour school day in one classroom before and after the LED lighting installation (represented graphically in Figure ES-1) shows significant energy savings between the two systems. Prior to the installation, the fluorescent lighting system was typically operated at maximum intensity, with occasional use of the bi-level switching. After installation of the LED lighting

Evaluating Tunable Lighting in Classrooms
vii
system, the classroom typically operated under the default 52% intensity setting of the system and the teacher often used the preset scene buttons to reduce the lighting intensity below 20%. For this example classroom, the LED lighting system offers around 69% daily energy savings compared to the energy use of the fluorescent system.
Figure ES-1. Lighting energy use for a 24 hour period in Classroom L2. The gray and blue bars show the intensity setting of
the system at different times for the fluorescent and LED systems respectively (left axis), while the orange and blue lines show the cumulative energy use of the fluorescent and LED systems respectively (right axis).

Evaluating Tunable Lighting in Classrooms
viii
Table of Contents Preface ............................................................................................................................................................... iii
CALiPER............................................................................................................................................... iii GATEWAY ........................................................................................................................................... iii
Acknowledgments ............................................................................................................................................ iv
Executive Summary ........................................................................................................................................... v
1 Introduction .................................................................................................................................................. 1
2 Classroom Lighting System Evaluations ................................................................................................. 3 2.1 Incumbent Systems ......................................................................................................................... 3 2.2 LED Systems .................................................................................................................................. 3
3 Trial Installation: Results and Discussion ............................................................................................... 6 3.1 Illuminance ..................................................................................................................................... 6 3.2 Energy Savings Analysis ................................................................................................................ 7
3.2.1 Overview of Energy Savings ............................................................................................... 7 3.2.2 Additional Savings of a Tunable LED Lighting System ...................................................... 8 3.2.3 Analyses of Specific Lighting Scenarios ........................................................................... 10
3.3 Color Performance and Circadian Metric Calculation ................................................................. 13 3.3.1 Comparisons of Installed Fluorescent and LED Luminaires ............................................. 13 3.3.2 Color Consistency over the Dimming Range for one LED Luminaire .............................. 14 3.3.3 Vertical Illuminance and SPD Metrics ............................................................................... 15
4 Conclusion ................................................................................................................................................. 19 4.1 Key Results ................................................................................................................................... 19 4.2 Summary ....................................................................................................................................... 19
5 Supplemental Report .............................................................................................................................. 21 5.1 Introduction .................................................................................................................................. 21 5.2 Trial Installation Update: Results and Discussion ........................................................................ 22
5.2.1 Energy Usage Update ......................................................................................................... 22 5.2.2 Controller Monitoring ........................................................................................................ 23 5.2.3 Student Surveys .................................................................................................................. 29 5.2.4 Teacher Feedback .............................................................................................................. 30
5.3 Conclusion .................................................................................................................................... 30

Evaluating Tunable Lighting in Classrooms
1
1 Introduction This report summarizes the results from a trial installation of light-emitting diode (LED) lighting systems installed in three classrooms at Gold Ridge Elementary (GRE) School in the Folsom Cordova Unified School District (FCUSD) in Folsom, CA. FCUSD asked the Sacramento Municipal Utility District (SMUD) to help them explore potential benefits of tunable-white lighting systems for children with autism spectrum disorder (ASD). SMUD responded by implementing a research project and invited Pacific Northwest National Laboratory (PNNL) to document the performance of the LED lighting systems as part of a GATEWAY evaluation. PNNL conducts GATEWAY evaluations in its support for the U.S. Department of Energy (DOE) Solid State Lighting (SSL) program. SMUD and FCUSD staff coordinated and completed the design and installation of the LED systems, and coordinated the collection of data from teachers, students, and parents, while PNNL evaluated the energy and photometric performance of the systems.
The evaluation detailed in this report builds on previous work by PNNL documenting the performance of the LED lighting systems in three classrooms from the Carrollton-Farmers Branch Independent School District (CFB) in Carrollton, TX.1 The CFB report offered several recommendations for improvements in tunable classroom lighting systems, including the need to present lighting controls in an intuitive and flexible manner for teachers. The GRE installation consisted of a tunable white LED lighting system specifically designed for educational settings developed through a DOE-funded research and development collaboration between RTI International and Finelite. This system, capable of tunable spectral and intensity settings, was developed with a goal of providing a lighting system that prioritizes user friendliness while maintaining energy efficiency and cost-effectiveness.
As documented in the CFB report and in several other GATEWAY reports, tunable LED lighting systems offer significant energy savings potential relative to fluorescent lighting systems and to static (non-dimmable) LED lighting systems. For example, energy savings for the CFB classroom lighting was estimated to be 58% relative to the incumbent fluorescent system, before accounting for additional savings from dimming. For the corridors at the ACC Care Center in Sacramento, the savings were estimated to be 68%2 relative to the incumbent fluorescent lighting system. For the Behavioral Health Unit at Swedish Medical Center in Seattle, the savings were estimated to be 41%3 relative to a non-dimmable LED system with the same number of luminaires. These savings are attributed to the combination of the higher efficacy of LED systems compared to fluorescent systems and to the dimming capability provided by tunable lighting. However, the ability to tune the color appearance of the light did not provide further energy savings, while typically increasing the initial system cost. The growing interest in and use of tunable LED systems that provide the ability to vary both intensity and spectrum is being driven by both energy and non-energy benefits.
The non-energy benefits often attributed to tunable spectrum lighting relate to possible effects of different lighting spectra on human circadian system and behavioral responses. In classroom settings, possible acute behavioral effects such as increasing student alertness and concentration have been demonstrated in several studies.4 Circadian response considerations include providing lighting that may support the suppression of melatonin during morning hours, which may ultimately improve occupant sleep cycles, especially for building occupants in climates and circumstances where they may not receive much morning exposure to light before starting school. Beyond these possible physiological effects, a tunable lighting system also provides teachers
1 GATEWAY Report: Tuning the Light in Classrooms: Evaluating Trial LED Lighting Systems in Three Classrooms at the Carrollton-Farmers Branch Independent School District in Carrollton, TX. U.S. Department of Energy, Office of Energy Efficiency and Renewable Energy, Washington, DC. 2 GATEWAY Report: Tuning the Light in Senior Care: Evaluating a Trial LED Lighting System at the ACC Care Center in Sacramento, CA. U.S. Department of Energy, Office of Energy Efficiency and Renewable Energy, Washington, DC. 3 GATEWAY Report: Tuning Hospital Lighting: Evaluating Tunable LED Lighting at the Swedish Hospital Behavioral Health Unit in Seattle. U.S. Department of Energy, Office of Energy Efficiency and Renewable Energy, Washington, DC. 4 For example, see Wessolowski et al., “The effect of variable light on the fidgetiness and social behavior of pupils in school,” Journal of Environmental Psychology 39 (2014); Sleegers et al., “Lighting affects students’ concentration positively,” Lighting Research & Technology (2012); Mott et al., “Illuminating the effects of dynamic lighting on student learning,” SAGE Open (2012); and Barkmann et al., “Applicability and efficacy of variable light in schools,” Physiology & Behavior 105 (2012).

Evaluating Tunable Lighting in Classrooms
2
with an additional tool for promoting learning and student engagement by enabling visual cues to reinforce desired student behaviors. While all the collaborators on this project were interested in documenting the non-energy benefits of tunable lighting in classrooms, the evaluation included in this report also aims to ensure that energy efficiency and photometric performance of LED tunable lighting systems remains a high priority, even as the focus on lighting for human circadian and behavioral benefits continues to build.
Of the three classrooms considered for this report, one was a general education fifth-grade classroom and two were used for educating students diagnosed with ASD. One notable review5 ties the identified sleep problems of autistic children with a possible underlying impairment of their circadian timing system. Again, a better understanding of the non-visual effects of light on humans is still needed, but the potential to improve student health and academic performance, especially in ASD classrooms, was one of the motivating factors that prompted FCUSD to install the tunable lighting system in the ASD classrooms. Additionally, FCUSD and SMUD wanted to gain first-hand experience with tunable LED lighting systems in case future evidence confirms the positive effects on student achievement.
This report focuses on the technical performance of the LED classroom lighting systems installed in this pilot study, in terms of the illuminances, estimated energy use, and spectral power distributions (SPDs) and related human response metrics for the three classrooms. Analysis of data regarding the teachers’ use of the systems, teacher and student responses to the lighting, and measured power during different times of day is ongoing, and may be included in a future update to this report.
5For example, see Glickman, G. “Circadian rhythms and sleep in children with autism,” Neuroscience and Biobehavioral Reviews 35 (2009).
Evaluating Tunable Lighting in Classrooms
3
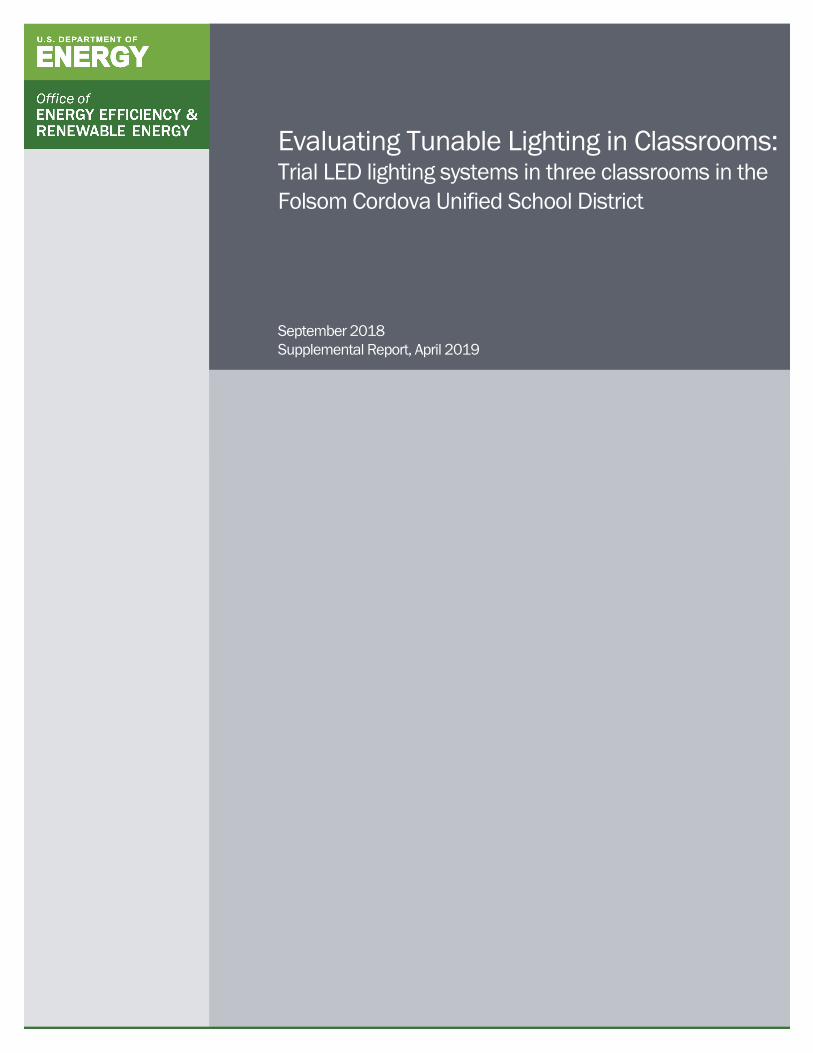
2 Classroom Lighting System Evaluations 2.1 Incumbent Systems Prior to the LED lighting system installation, the lighting in the GRE classrooms consisted of 2 ft by 4 ft recessed luminaires with two T8 fluorescent lamps with an electronic ballast, resulting in a rated wattage of 56 W6 per luminaire. The typical classroom, shown in Figure 1, used 24 luminaires, with 22 arranged in a square around the outer perimeter of the room and two located in the room’s center. Two switches at the entrance of the classroom were used for bi-level switching where each switch was responsible for half of the luminaires in an alternating pattern.
Figure 1. Image (left) and reflected ceiling plan (right) of the incumbent fluorescent classroom, F1. Switches a and b are each responsible for controlling half of the luminaires in the room.
The school’s campus contains several different buildings with a cluster of classrooms in each. This allows for every classroom to have an entrance directly outside and access to daylight through perimeter windows. More often than not, blinds are used on classroom windows to minimize any potential distraction to students. While the students spend the majority of the school day in their assigned classroom, it is common for them to move throughout the campus during school hours to access spaces such as the restrooms or the lunchroom.
2.2 LED Systems Three classrooms were selected for the installation of the LED lighting system. The first classroom, L1, was occupied by 31 general education fifth-grade students and their teacher. The second and third classrooms, L2 and L3, each contained six children diagnosed with ASD as well as a teacher and several aides. Two of the classrooms (L1 and L2) had floorplans identical to the incumbent fluorescent base classroom, pictured in Figure 2, while the third classroom (L3) varied slightly in size and layout.
Working in collaboration with SMUD, FCUSD selected a Finelite LED classroom lighting system from several alternative systems that were considered. The system selected was initially developed in part through a project that received research funding from DOE, through a competitive SSL funding opportunity. A critical part of that funded research included several phases of input from K-12 educators and administrators. Although PNNL was not part of the FCUSD system selection process, the installation at GRE provided an opportunity for PNNL to evaluate the system in a real-world setting.
6 Based on manufacturer-rated system data for a two-lamp electronic ballast with normal ballast factor of 0.87 driving two 32 W T8 fluorescent lamps.
Evaluating Tunable Lighting in Classrooms
4
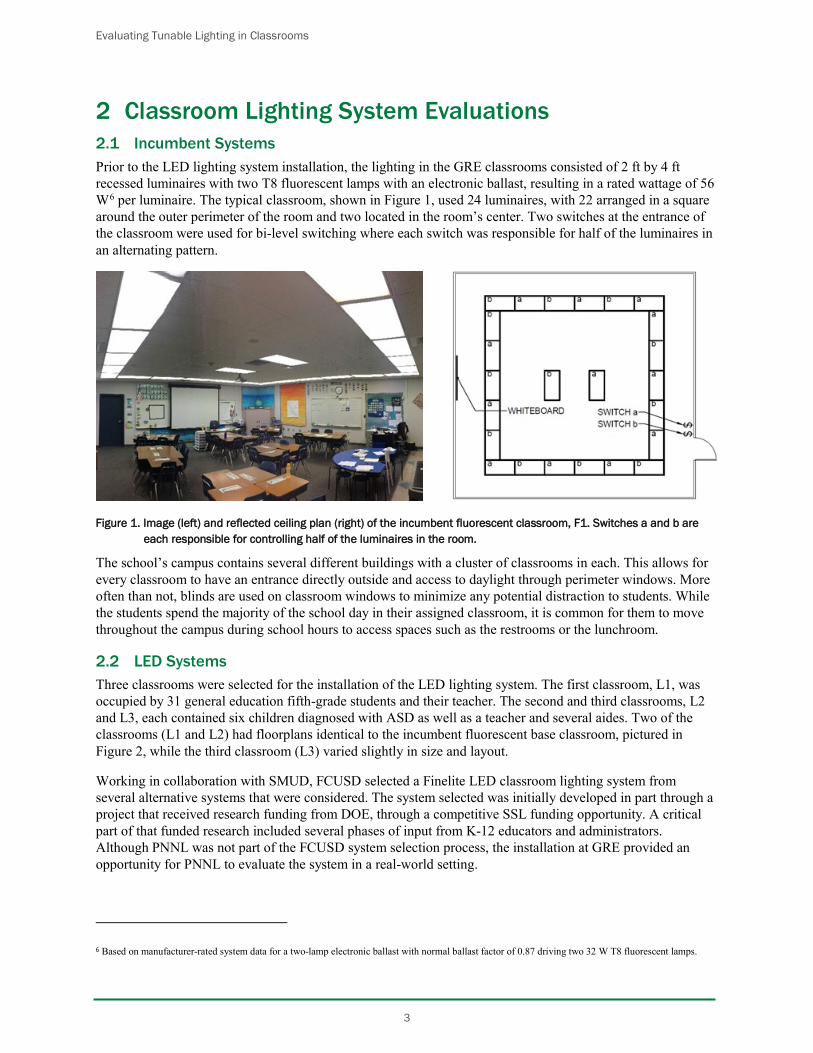
The LED lighting system was installed in August 2017, before the beginning of the 2017-2018 school year. For the three classrooms, the 24 incumbent fluorescent luminaires were replaced with 12 recessed 2 ft by 2 ft Finelite white-tunable LED luminaires7 (11 luminaires in the case of classroom L3). Additionally, one 12 ft Finelite white-tunable LED wall wash surface-mounted luminaire8 was installed above the whiteboard in each classroom. A wall-mounted, touch-sensitive Finelite controller was fixed at the front of the classroom, adjacent to the whiteboard. The controller uses a DMX512 protocol to communicate with the LED driver onboard each luminaire.
Figure 2. Image (left) and reflected ceiling plan (right) of the classrooms L1 and L2 with the installed LED lighting system. For these classrooms, one switch was located at the entry door for full on/off control of the lighting system. All tunable lighting control was managed through the wall-mounted controller adjacent to the whiteboard.
During the first 5 months after installation, the room controls were limited such that teachers only had access to on/off and dimming control capabilities. In early February 2018, the SPD control capability was activated and, after a brief training session, teachers were encouraged to use all the capabilities of the lighting system as they felt were appropriate for their classrooms.
The user interface (Figure 3) provides color and intensity control with the intent to be intuitive and flexible for teachers. The touch-sensitive control pad offers five preset lighting condition buttons and three slide-bars. Depending on the activity in each specific classroom, teachers can select from the preset scenes of “General,” “AV Mode,” and “Screens,” which deliver varying levels of light intensity to different parts of the classroom. Similarly, the “Energize” and “Calm” presets adjust the luminaire intensity as well as the SPD to offer a wider range of apparent warmth or coolness of light. At any time, teachers can depart from the preset scenes and fine-tune the classroom’s light color and intensity through three slide-bars. Two slide-bars are dedicated to continuous 0-100% dimming, one for the general luminaires and one for the whiteboard luminaire. The third slide-bar allows for 2700 to 6500 K color tuning across all luminaires. Additionally, on/off power buttons are available on the touchpad for the entire system or the general and whiteboard luminaires separately. Whenever the LED system is powered up, it reverts to one of two default lighting conditions until there is further input to the controller’s touchpad. These default settings, the first of which is implemented in the morning and the second after lunch, were agreed upon by the project participants to provide different levels of tuned spectrum and intensity to students throughout the day. The specified sequence of operations is detailed in Table 1.
7 Model number for the Finelite troffer luminaires: HPR-LED-F-2X2-DCO-B-8TW-277V. 8 Model number for the Finelite whiteboard luminaires: HP-2-WW-SM-K-12’-B-8-TW-277V.

Evaluating Tunable Lighting in Classrooms
5
Figure 3. The Finelite LED lighting system control interface.
Table 1. The specified sequence of operations for the LED system prior to commissioning. The illuminances refer to a target average horizontal illuminance at desktop height under the corresponding lighting conditions.
LIGHTING CONDITION LUMINAIRES AFFECTED ILLUMINANCE
RANGE (lx) CCT (K)
Default – Morning General, whiteboard 450-500 5000
Default – Afternoon General, whiteboard 450-500 4000
Pres
et S
cene
s
General General, whiteboard 450-500 4000
AV Mode General, whiteboard off 50-100 3000
Screens General, whiteboard reduced 150-200 4000
Energize General, whiteboard off 500-550 5000
Calm General, whiteboard off 25-75 2800
Sensor Override Not programmed at this time

Evaluating Tunable Lighting in Classrooms
6
3 Trial Installation: Results and Discussion PNNL evaluated the new LED system in classrooms L1 and L3 as well as the incumbent fluorescent systems in the equivalent F1 classroom on January 24, 2018. No measurements were taken in L2 as the floorplan was identical to L1. A detailed evaluation was conducted of the LED system in the L1 and L3 classrooms, consisting of
• illuminance measurements at 15 to 20 points for the General, Energize, and Calm preset conditions;
• a color consistency over dimming evaluation across five intensity settings for three SPD settings at one measurement point;
• an evaluation of color consistency between luminaires, where the color characteristics of seven luminaires were measured at three SPD settings; and
• vertical illuminance and SPD measurements at two measurement points at seated eye height for a person facing the front of the classroom, at three SPD settings.
For the base fluorescent classrooms, horizontal and vertical illuminance measurements and SPDs were recorded. A calibrated9 Konica Minolta® CL-500A spectrophotometer was used to measure SPDs and illuminances; relevant color metrics and other lighting metrics related to melanopic and circadian response were calculated using the measured SPDs. All measurements were taken after dark in the three classrooms, to elminate any contributions from daylight.
3.1 Illuminance Horizontal illuminance was measured at desktop height in the F1 and in two LED classrooms, L1 and L3. Measurements were taken in grids of 9 to 20 points depending on the classroom, with the measurement points located underneath and between luminaires. For the LED classrooms, the General, Energize, and Calm preset conditions were considered because they were likely to be the most commonly used preset conditions. The luminaires in the fluorescent classroom were maintained at full intensity. Table 2 reports the average horizontal illuminances, the range of illuminance values, and the maximum-to-minimum illuminance ratios (max:min) measured in each room at desktop height.
It is worth noting that the measurement grid for classroom L3 was divided into two groups: the front of L3 was where the students’ and teacher’s desks were located so those values are reported in the table. The back of the classroom was dedicated to quiet activity areas and was less representative of the occupied space, with greater spacing between luminaires.
9 CL-500A Konica Minolta® Illuminance Spectrophotometer (10002008) calibrated July 7, 2017.

Evaluating Tunable Lighting in Classrooms
7
Table 2. Maximum and minimum horizontal illuminances* at desktop height for the LED and fluorescent classrooms. Average illuminance, illuminance ranges,** and max:min ratios were calculated for each classroom from measurement data. All values are in lux except for the max:min ratios, which are unitless.
* Illuminance measurements were taken at 100% intensity for the General fluorescent condition and at 52/58%, 56/80%, and 3/9% intensity for the General, Energize, and Calm preset conditions in the L1/L3 LED classrooms. ** Illuminance range calculated by subtracting the minimum from the maximum measured value in each room. During the commissioning phase of installing the LED system, teacher input was used to fine-tune the intensity of each preset condition to offer light levels that the teachers felt were most appropriate for the anticipated uses in each specific classroom. As a result, the horizontal illuminance values for the General LED lighting condition varied from the horizontal illuminance values originally specified. The General light levels deemed appropriate by the teachers were significantly reduced from those offered in the fluorescent classroom, but satisfied the recommendations from the Illuminating Engineering Society (IES) for writing tasks in classroom applications (200 lx for ages less than 25 years, 400 lx for ages 25-65)10. The measurements taken of the fluorescent lighting system at maximum intensity indicated the general illuminance levels greatly exceeded those recommended by the IES when both a and b switching circuits were in use.
3.2 Energy Savings Analysis 3.2.1 Overview of Energy Savings According to data from the U.S. Environmental Protection Agency (EPA), energy expenditures in U.S. K-12 schools. totals about $8 billion annually, and represents the second largest expense to schools after personnel costs.11 EPA goes on to state that, if the $2 billion that could be saved through a 25% reduction in energy costs were invested in hiring teachers, nearly 36,000 new teachers could be added to U.S. K-12 schools, or 40 million new textbooks could be purchased. The U.S. Energy Information Administration has estimated that lighting represents about 26% of the electricity use in the typical K-12 school, which is usually one of the top two electricity uses in schools. With a major portion of a school’s occupied area devoted to classrooms, reductions in lighting energy use in classrooms provides significant energy cost savings potential, possibly enabling the school district to invest those funds more directly in education.
At GRE, energy monitoring equipment and light loggers were installed in each of the three classrooms participating in the trial installation. The monitoring period began while the classrooms were operating under the incumbent fluorescent lighting systems (March 2017). After 2 months (June 2017), the light loggers were removed, but the energy monitoring continued through the installation of the LED lighting systems (August 2017) until the end of 1 full school year (May 2018). Because the captured energy metering data included information for the incumbent fluorescent systems as well as for the trial LED systems, it offered a glimpse of the typical occupancy, operation, and load patterns for both types of systems. While the details of these different patterns may be the subject of a future report, for now, it is possible to generalize them for the purpose of estimating the potential energy savings between the two types of lighting systems at GRE.
The typical classroom had 24 fluorescent luminaires, each with an estimated lamp-ballast rated power of 56 W per luminaire. At 100% intensity, the total system power was 1336 W, with the opportunity to be halved to 668 W using the bi-level switching. While the replacement LED lighting system required a more complex power
10 For recommended classroom illuminance levels, see Table 24.2 in: DiLaura et al., The Lighting Handbook: Tenth Edition, 2011, Illuminating Engineering Society. 11 Energy Efficiency Programs in K-12 Schools, U.S. Environmental Protection Agency, 2011.

Evaluating Tunable Lighting in Classrooms
8
calculation to account for its range of capabilities, the maximum power values for the troffers and whiteboard luminaires were 43 and 40 W per luminaire, respectively. If the LED lighting system in one classroom was operated at maximum intensity, the resulting total system power would be around 525 W. If the fluorescent and LED lighting systems were to be operated at 100% intensity for the same number of hours over a typical school year,12 the LED lighting system offers a potential energy savings of 46% over the fluorescent system. More dynamic energy savings estimations can be determined once dimming controls and use patterns of the LED system are considered.
3.2.2 Additional Savings of a Tunable LED Lighting System To understand the full energy savings potential of the white-tunable LED lighting system described in this report, it is valuable to include the power requirements of the system at various color and intensity settings. A set of 30 power measurements across five intensity settings at six color settings each, listed in Table 3, were taken in laboratory conditions by PNNL of a comparable model of Finelite white-tunable troffer luminaire. Also included in Table 3 are the maximum power values provided by the manufacturer for the whiteboard and 2x2 luminaire installed in the GRE classrooms. Although there is a slight difference between the laboratory and manufacturer maximum power values, likely due to the variation in luminaire models, for the purpose of this discussion, the laboratory-obtained power values will be used for determining the energy estimates. No laboratory data was captured for the 12 ft surface-mounted whiteboard luminaire, but maximum power data was provided by the manufacturer. Because the whiteboard luminaire had a maximum power value of 40 W across all color settings, and because the whiteboard luminaire used the same driver as the troffers, the following energy estimates also assume that both types of luminaires follow the same function for power decrease with respect to intensity decrease.
Table 3. Power measurements of three different LED luminaires over the range of color and intensity settings offered by the system. Maximum power data is listed for the whiteboard and troffers installed in GRE followed by laboratory obtained power values for a comparable troffer luminaire. Minimum power data was taken at the lowest intensity setting before completely powering off the luminaire. Also listed is the average power of each luminaire across all measured CCTs. All values are in watts.
CCT (K) Avg. Power Intensity 6500 5000 4000 3500 3000 2700
GRE Finelite WB 100% 40.2 39.9 39.7 39.7 39.8 40.1 39.9 GRE Finelite 2x2 100% 43.2 42.3 41.9 42.2 42.6 43.1 42.6
Laboratory Finelite 2x2
100% 41.3 40.3 40.2 40.4 39.2 41.6 40.5 75% 24.2 23.9 23.8 23.9 23.1 24.2 23.8 50% 12.7 12.7 12.7 12.7 12.3 12.7 12.7 25% 6.3 6.2 6.2 6.3 6.2 6.3 6.2
Min. (on) 3.6 3.8 3.6 3.6 3.5 3.7 3.6
Based on the values listed in Table 3, power of the LED luminaire remained relatively constant over the SPD range, varying with intensity. At the 100% intensity setting, the lab tested LED luminaire required 39.2 to 41.6 W and each 25% decrease in intensity resulted in a nearly 50% decrease in power draw from the previous intensity condition. At the minimum intensity setting, the lowest setting offered before completely powering off the luminaire, the power draw was measured to be about 3.6 W. Energy monitoring data collected from the individual classrooms confirmed that a luminaire baseline load of 3 W can be expected even after it has been powered off. This small power draw is typical of LED lighting systems with active control systems such as DMX, digital addressable lighting interface (DALI), and power over Ethernet (PoE), and needs to be taken into account in energy use estimates. In this case, the DMX-controlled driver in each luminaire remains “on” as it
12 For this report, a typical school year is considered to be made up of 1400 hours where lighting is required for 40 hours per week for 35 weeks of the calendar year.

Evaluating Tunable Lighting in Classrooms
9
continuously anticipates any future communications with the control device. In the context of the GRE installation, the total power that remains active in a classroom system with all 13 luminaires powered off (39 W) is similar to the load of one luminaire left on at full intensity during the same period. The number of hours that the LED system is powered off in a typical classroom is considerable, and the following energy savings estimates will factor in the baseline draw of the drivers during the unoccupied hours of the GRE classrooms.
During a typical school year, the fluorescent classroom can expect to use about 2000 kWh when operated at full intensity. Under the same operational hours and full intensity, the replacement white-tunable LED system is projected to use just more than 1000 kWh (285 kWh of which is when the system is powered off), offering a potential energy savings of 46%. As mentioned previously, the fluorescent classroom provides illuminance levels higher than those recommended for classroom tasks. If instead the fluorescent system is halved from 24 to 12 total luminaires and is arranged to provide even illumination (unlike the existing checkerboard switching arrangement) to achieve lighting levels closer to IES recommendations, the projected annual energy use would also be reduced to just less than 1000 kWh. Under this scenario, there are no significant savings offered by the LED lighting system compared to the incumbent fluorescent over the school year, if both are maintained at full intensity. However, it is unlikely that the LED lighting system will operate at full intensity with proper deployment of the available dimming controls and programmed sequence of operations. For example, at both the morning and afternoon default settings, all luminaires operate at 52% intensity. Under these default conditions, the LED lighting system will use just more than 500 kWh over the course of the school year. Comparing this value with the 100% intensity of the original 24-luminaire fluorescent system results in a potential energy savings of 72%. A comparison of the potential energy savings across all intensity settings is detailed in Figure 4.13
Figure 4. A comparison of the annual energy consumption in a single classroom of the original fluorescent lighting system (orange) and the trial white-tunable (WT) LED lighting installation (dark blue) during a typical school year over a range of intensity settings. Also included is the annual energy consumption of a potential static-white (SW) LED lighting installation (light blue).
13 IES illuminance recommendations are based on visual task requirements, and serve as the basis for typical energy codes and energy analyses. As discussed later in this report, those illuminances may not be sufficient for other lighting goals related to circadian and behavioral effects.

Evaluating Tunable Lighting in Classrooms
10
Also included in Figure 4 is the projected power of a static-white LED dimmable system where there has been a one-for-one substitution of luminaires with comparable Finelite alternatives.14 The static-white models of the troffer and whiteboard luminaires draw a maximum of 38 and 30 W, respectively, both less than their white-tunable equivalents. Dimming in this alternative system could be accomplished through a 0-10V driver that has a linear power response as well as the ability to completely power off, avoiding the baseline load during the unoccupied hours. If the static-white LED system were to be operated at full intensity over the school year, it is estimated to use 700 kWh with a potential energy savings of 64% relative to the incumbent fluorescent, compared to the 46% savings of the white-tunable system. Similar to the white-tunable LED system, dimming controls will only further the energy savings potential offered by the static-white LED system, as is illustrated in Figure 4 by the difference between the orange line and the blue dotted line at different dimming levels.
The difference in energy savings potential between the white-tunable and static-white LED lighting systems is due in part to the varying power requirements of the individual luminaires. However, the baseline load present during the off-hours of the white-tunable system is responsible for the majority of discrepancy between the two tunable LED systems. The DMX drivers and controller installed with the white-tunable system were the standard control option available from the manufacturer. However, other pre-qualified driver options were also available for controlling the tunable LED system that may have reduced or eliminated the baseline power draw. Each control strategy – DMX, DALI, PoE, 0-10V, etc. - has its own advantages and drawbacks for different applications, so the specification, installation, and commissioning of the controls must be carefully coordinated with the manufacturers involved.15 While DMX controls may allow for a more flexible lighting system, the baseline power draw of a system controlled by DMX or some other active control alternatives can be a potential shortcoming for an educational setting, where the lighting system may spend more hours powered off than powered on (during the evenings, weekends, and summer months).
3.2.3 Analyses of Specific Lighting Scenarios Ultimately, the energy savings potential offered by an LED system is dictated by implementation of controls to accomplish daily classroom activities – either through the engagement of the user or a thoughtful sequence of operations. Since the GRE installation remains in the early stages of its deployment, specific user patterns and energy savings calculations have not yet been fully analyzed. However, it is possible to estimate potential savings through different conceivable operation scenarios. In this section, several different daily lighting controls scenarios are proposed to compare the energy savings potential of the white-tunable LED system against the incumbent fluorescent system.
For each scenario, it is assumed that the classroom is occupied for 8 hours each day (7.5 by teacher and students, 0.5 by janitorial staff). Again, the following estimates also assume that the 3 W baseline draw of each luminaire in the LED system exists any time the system is powered “off.” Intensity profiles are included for both types of lighting systems in the typical classroom layout with a running total of the energy consumed throughout the day. Energy estimates are listed for each scenario indicating the daily and yearly energy consumption of the lighting systems if they were to be operated in the same manner everyday throughout the school year. An annual energy savings estimate is provided comparing the difference in consumption between the LED and fluorescent systems.
14 Sample model number for the Finelite static color troffer luminaires: HPR-LED-F-2X2-DCO-B-835-277V; sample number for the whiteboard luminaires: HP-2-WW-SM-K-12’-B-835-277V. 15 See the DOE SSL Program’s web pages on LED tunable lighting, https://www.energy.gov/eere/ssl/led-color-tunable-products.

Evaluating Tunable Lighting in Classrooms
11
Scenario 1, Maximum Intensity: Both the fluorescent system (operating using all 24 luminaires) and LED system are operated at 100% intensity any time the classroom is occupied.
kWh/day kWh/year Annual Savings Fluorescent System 10.7 1924 46%
LED System 4.8 1042

Evaluating Tunable Lighting in Classrooms
12
Scenario 2, Default Intensity: The fluorescent system is operated at 100% intensity any time the classroom is occupied. During the same periods of occupation, the LED system is operated at the default intensity settings specified by the sequence of operations, which sets the intensity at 52%.
kWh/day kWh/year Annual Savings Fluorescent System 10.7 1924 72%
LED System 2.0 536

Evaluating Tunable Lighting in Classrooms
13
Scenario 3, Active Intensity: During the hours of operation, the LED system is set using the scene buttons on the classroom’s controller. The scenes, listed on the graph for reference, were chosen based on possible classroom activities (group work, lecturing, watching movies, etc.) that could occur during a typical school day. The fluorescent system is being operated to support the same classroom activities, using the bi-level switching offered by the system when necessary.
kWh/day kWh/year Annual Savings Fluorescent System 8.0 1440 71%
LED System 1.7 416 As discussed in the previous section, these examples demonstrate that substantial annual energy savings can be achieved through the introduction of the tunable LED lighting system compared to the fluorescent system. While the maximum intensity scenario for the LED system is not likely, it is important to consider as a worst-case estimate. The default and active intensity scenarios are more representative of the expected use of the LED system and both offer around 70% savings in energy compared to the intensity output considered for the fluorescent system.
3.3 Color Performance and Circadian Metric Calculation 3.3.1 Comparisons of Installed Fluorescent and LED Luminaires The color performance of the fluorescent and LED luminaires was evaluated using SPD data captured at the site. Five luminaires were measured in F1 and seven LED luminaires, including the whiteboard luminaire, were measured in L1. Intensity across the LED luminaires was maintained at 50% output while the color settings were adjusted to the maximum, middle (50%), and minimum SPD outputs offered by the third slide bar. Measurements were taken using the CL-500A located less than 12 in. below the center of each luminaire. The SPD data captured using this method may differ slightly from laboratory sphere photometry, but has been used to calculate typical color quality and chromaticity metrics, included in Table 4.

Evaluating Tunable Lighting in Classrooms
14
Regarding color consistency, all measured lighting conditions of the LED system fell within the specified tolerances in ANSI C78.377 for correlated color temperature (CCT) and Duv. For the LED system, the maximum SPD setting exhibited the largest range in CCT values at 61 K compared to a range of 543 K for the fluorescent system. The ranges of measured Duv were less than 0.0005 for all LED system conditions. Additionally, to determine the magnitude of any significant difference in chromaticity that would be present across the included luminaires, the Δu'v' values were calculated for each SPD condition. To calculate the Δu'v' value, the recorded (u', v') chromaticity coordinates for each luminaire were plotted and used to measure the largest difference (or scalar distance) between the maximum and minimum data points. The color quality values calculated for the fluorescent system were typical of T8 fluorescent systems, with color fidelity (color rendering index, or CRI) of about 80 and with color rendering of red objects (R9) of about 0. Compared to the incumbent fluorescent system, a small improvement in color fidelity was seen under all SPD settings with the introduction of the LED system.
Table 4. Color quality metrics for the lighting systems in the trial LED classrooms and base fluorescent classroom. The data for the fluorescent system is an average of five luminaires at maximum intensity. The data for the LED system is an average values of seven luminaires in classroom L1 across three SPD control settings. The Δu'v' values represent the largest difference in measured u’,v’ coordinates between two luminaires of a given setting.
Setting CCT (K) Duv Δu'v' Ra (CRI) R9 Max. SPD 6664 0.0035 0.0007 83 12 Mid. SPD 4397 -0.0037 0.0005 87 30 Min. SPD 2797 -0.0001 0.0006 83 12
Fluorescent 3729 0.0050 0.0179 79 -1
3.3.2 Color Consistency over the Dimming Range for one LED Luminaire The color performance of one LED luminaire (with minor contributions from adjacent luminaires) throughout the dimming range was also evaluated for the previously considered SPD settings. For each SPD setting, measurements were taken throughout the minimum16-100% dimming range in steps of 25%. Each of the horizontal measurements was taken from desk height at one point near the center of the room, directly beneath a luminaire.
Horizontal illuminance values, reported in Table 5, indicate that light levels for a given intensity setting were relatively consistent regardless of the SPD setting. The maximum difference of 60 lux in illuminance was with the system at 100% intensity. The additional color characteristic measurements offered in
Table 6 indicate that the CCT at each dim setting varied by no more than 60 K. Again, the values for CCT and Duv fell within the acceptable tolerances of ANSI C78.377. Using the same method as detailed in the previous section, Δu'v' values were calculated for each color condition to determine the magnitude of any significant difference in chromaticity that would be present as the system was dimmed. The lowest SPD condition exhibited the largest Δu'v' of 0.002. For the three SPD settings considered, the color consistency of the system indicates the user can adjust the intensity setting of the LED luminaires without any easily noticeable shift in color.
16 The minimum value for the intensity slider bars corresponds to the lowest dim-setting offered by the system without powering off the luminaire.

Evaluating Tunable Lighting in Classrooms
15
Table 5. Measured horizontal illuminance values across the dimming range of the LED luminaire in classroom L1. Three SPD settings were considered for each dim setting.
Dim % Illuminance (lx) Range (lx) Max. SPD Mid. SPD Min. SPD 100 845 850 790 60 75 734 733 689 45 50 527 489 474 53 25 260 266 270 10
min 71 31 62 39
Table 6. Measured color performance characteristics across the dimming range of the LED luminaire in classroom L1. Three SPD settings were considered for each dim setting. The Δu'v' values represent the largest difference in measured (u', v') coordinates between two of the dimming conditions.
3.3.3 Vertical Illuminance and SPD Metrics A preliminary design goal of a 0.3 circadian stimulus (CS, unitless) value was established by SMUD and FCUSD for all three classrooms and was based on previous research.17 The intent of this design target was to ensure adequate lighting in the morning to support the suppression of melatonin that may affect the alignment of circadian phase. However, because standards for CS or related metrics have yet to be established by groups such as the IES, and because school children in Folsom, CA are likely to receive morning exposure to daylight outside of the classroom, for this pilot study the teachers were allowed to establish their desired classroom illuminances, which satisfied IES recommendations for visual tasks. The evaluation of the lighting system documented the resulting CS levels based on the teachers’ selected illuminances.
To evaluate metrics related to non-visual effects of light, PNNL measured vertical illuminance and SPD at seated eye-height in the LED and fluorescent base classrooms for subsequent metric calculations. In each of the three rooms, measurements were recorded in the center of the classroom at seated eye-height, facing forward. For the fluorescent base case, one measurement point was selected since the luminaires were mounted in a continuous configuration, whereas two measurement points were considered for each of the LED classrooms, with one point directly beneath a luminaire and one point between two luminaires. For the LED classrooms, the intensity slide-bars were maintained at 50%, since that was the intensity setting used for the default general setting as selected by the teachers, and measurements were taken at three SPD settings across the full range of the SPD slide-bar. The fluorescent classroom was kept at maximum intensity. Using these measurements, two metrics were calculated: equivalent melanopic lux (EML, with units of melanopic lux or m-lx) and CS.
To calculate CS and EML, the SPD data captured using the CL-500A at each vertical viewing position was entered into the respective calculator tools. Vertical illuminance at each viewing position was also needed for
17 “Light as a circadian stimulus for architectural lighting,” Rea and Figueiro, Lighting Research and Technology, 2016. “Measuring and using light in the melanopsin age,” Lucas et al., Trends in Neuroscience, January 2014.

Evaluating Tunable Lighting in Classrooms
16
the CS calculation. The final CS and EML values are expressed below in tabular form (Table 7) as well as graphically (Figure 5 and Figure 6) for the fluorescent, L1 and L3 classrooms. Figure 7 shows the SPDs associated with each of the LED SPD control settings, as measured from directly underneath a luminaire at a distance of less than 12 in. Of the measured data, only one point at the maximum SPD output (6363 K) directly underneath the luminaire achieved the design goal of a 0.3 CS value. At other SPD settings beneath the luminaire, the LED system provided greater CS than the fluorescent system, at lower illuminances. At the measurement points located between luminaires, the LED system produced about the same CS as the fluorescent classroom, but again, at much lower illuminance levels. The location of the measurement point in relation to a light source results in a difference of calculated CS and EML value.
Figure 6 shows the measured vertical illuminances and the calculated EML values for the same two measurement points across the three classrooms. Decreasing the SPD control setting results in a consistent decrease in EML value despite the vertical illuminances remaining relatively constant. Similar to CS, the measurement points located directly underneath the LED luminaire in classrooms L1 and L3 record EML values 33% to 38% greater than measurement points located between luminaires. EML values for the LED classrooms exceed those in the fluorescent classroom at the maximum SPD control setting, underneath the luminaire, and are able to do so at significantly lower illuminance levels.
Table 7. Calculated values of circadian stimulus and equivalent melanopic lux as well as measured vertical illuminance. For LED classrooms L1 and L3, the intensity was set to 50% as selected by teachers for the General setting, and two measurement points were considered where point 1 was directly beneath a luminaire and point 2 was between luminaires. For the base fluorescent classroom, the system was set at full output and one measurement point was chosen between luminaires. Also included are the measured CCT values for each condition.
CCT (K) CS EML EV (lx) Fluorescent 3682 0.15 166 300
L1
Max. SPD 1 6376 0.31 215 225 2 6360 0.22 133 139
Mid. SPD 1 4377 0.22 164 216 2 4367 0.15 101 134
Min. SPD 1 2744 0.21 92 200 2 2743 0.15 61 133
L3
Max. SPD 1 6363 0.28 181 188 2 6106 0.19 112 120
Min. SPD 1 4309 0.19 133 177 2 4152 0.13 89 121
Min. SPD 1 2722 0.19 80 176 2 2676 0.13 51 114

Evaluating Tunable Lighting in Classrooms
17
Figure 5. Circadian stimulus values calculated from two vertical measurement points for three SPD control settings, with the LED systems set to the 50% intensity control position. Measurements were in taken in two classrooms at seated eye height. Point 1 data corresponds to measurements taken directly underneath a luminaire. Point 2 data corresponds to measurements taken between luminaires. The CS design goal of the LED installation (CS = 0.3) is included in yellow.
Figure 6. Vertical illuminance (left) and EML (right) values at two measurement points for each of the three SPD control settings, with the LED systems set to the 50% intensity control position. Point 1 data corresponds to measurements taken directly underneath a luminaire. Point 2 data corresponds to measurements taken between luminaires.

Evaluating Tunable Lighting in Classrooms
18
Figure 7. SPDs for the three color control settings of the LED system and one for the fluorescent system, measured directly
underneath a luminaire. Seven measurements were taken in L1 and five were taken in F1. Those measurements closest to the average SPD value for each color condition are included in this figure and the corresponding CCT value for each condition is listed in the legend.
A full exploration of why the EML and CS values behave so differently for the different SPD settings is beyond the scope of this report. Neither of these metrics has yet to be adopted by an authority such as the IES or the International Commission of Illumination (CIE) as an accepted way to model the effect of light on the human circadian response. However, the CS and EML data collected for this report indicates that both metrics vary considerably based on the vertical illuminance at the eye, which in turn varies considerably based on the location in the room. This data also demonstrates that the illuminances typically recommended and provided for classrooms do not satisfy recommendations for CS or EML levels. These findings are consistent with previous GATEWAY reports that evaluated tunable lighting systems, cited earlier. For the pilot installation at GRE, the tunable system provides the capability to produce a wide range of CS and EML levels; operating the system at 100% output would be expected to approximately double the levels reported here since they were measured at 50% intensity. But the associated energy use for this increased light intensity was not considered to be justifiable, since the possible benefits have not yet been firmly established. If future evidence emerges that results in changes to the IES recommended illuminances for classrooms (or recommended CS or EML levels), the tunable white lighting system at GRE could be adjusted to meet these possible future standards.

Evaluating Tunable Lighting in Classrooms
19
4 Conclusion This report focused on the technical performance of the LED classroom lighting systems installed in this pilot study, in terms of the illuminances, estimated energy use, and SPD and related human response metrics for the three classrooms. Several key results and lessons learned emerged from those evaluations, as summarized below.
4.1 Key Results • For the same operational hours while operated at maximum intensity, the replacement white-tunable
LED system is estimated to offer a potential energy savings of 46% relative to the incumbent fluorescent system. However, at both the morning and afternoon Default settings for the LED systems, all luminaires operate at 52% intensity, resulting in a potential energy savings of 72%. This savings comes from the increased efficacy of the LED luminaires relative to fluorescent luminaires, and from the reduced illuminances provided by the LED systems.
• The DMX-based control system installed in this pilot study produced over 3W of electrical load per luminaire even when the luminaires were switched off. This load, sometimes referred to as phantom or baseline load, accounted for over 25% of the annual energy use of the system. Because classrooms have extended periods when the lighting is off, the importance of the baseline load and its effect on annual energy use may be elevated relative to other applications with fewer off hours. Baseline power draw with active controls such as DMX, DALI, PoE, and others is an important concern that needs to be addressed to maximize the energy savings potential of tunable LED systems in classrooms. Turning power off completely to the driver would save energy by minimizing the phantom load, but the tradeoff might be less control flexibility, more controllers, or limitations on deep dimming.
• The illuminance levels produced by the incumbent fluorescent systems exceeded those recommended by the IES for this application. The measured average illuminances in the LED classrooms were roughly 50% of the measured average illuminance in the fluorescent classroom, for the General control setting. At this control setting, the LED systems were operating at intensity levels well below their maximum intensity, based on input from the teachers, while still meeting IES recommendations. The ability to tune the intensity to meet the illuminance needs resulted in significant energy reductions for the lighting.
• The measured color characteristics of the LED systems were very consistent, both between different luminaires and over the range of dimming.
• Calculated metrics related to non-visual responses, based on SPD measurements at eye locations, demonstrate important differences between the EML and CS metrics that have been proposed for use in lighting applications. The data from this project also demonstrates that the photopic illuminances typically provided in classrooms are not sufficient to meet common recommended levels of CS or EML, although neither of those metrics has been adopted by recognized standards organizations. While the tunable lighting system in this project could provide a wide range of CS or EML levels, the illuminances and associated energy use would need to be increased to satisfy the existing recommendations for these non-visual metrics.
4.2 Summary This report presented the results from a trial installation of tunable LED lighting systems installed in three classrooms at Gold Ridge Elementary School in the FCUSD in Folsom, CA. SMUD and FCUSD staff coordinated and completed the design and installation of the LED systems, and coordinated the collection of data from teachers, students, and parents. PNNL evaluated the energy and photometric performance of the systems.

Evaluating Tunable Lighting in Classrooms
20
Of the three classrooms evaluated for this report, one was a general education fifth-grade classroom and two were used for educating students diagnosed with ASD. The potential to improve student health and academic performance, especially in ASD classrooms, was one of the motivating factors that prompted FCUSD to install the tunable lighting system in the ASD classrooms. Additionally, FCUSD and SMUD wanted to gain first-hand experience with tunable LED lighting systems in case future evidence confirms the positive effects on student achievement.
The focus of this report, including the key results summarized above, was the energy and photometric performance of the tunable LED systems, including the illuminances, estimated energy use, and SPD and related human response metrics for the three classrooms. Analysis of data regarding the teachers’ use of the systems, teacher and student responses to the lighting, and measured power during different times of day is ongoing, and may be included in a future update to this report.

Evaluating Tunable Lighting in Classrooms PNNL-28512
21
5 Supplemental Report 5.1 Introduction The following report is a supplement to the initial evaluation of a trial installation of light-emitting diode (LED) lighting systems installed in three classrooms at Gold Ridge Elementary (GRE) School in the Folsom Cordova Unified School District (FCUSD) in Folsom, CA. One classroom participating in the trial LED installation, L1, was a fifth-grade general education classroom with 31 students and their teacher. The two other classrooms, L2 and L3, each had six children diagnosed with autism spectrum disorder (ASD) as well as a teacher and several aides. For each classroom, 24 2x2 fluorescent luminaires controlled using bi-level switching were replaced with 12 to 13 Finelite white-tunable LED luminaires controlled using a wall-mounted touch-pad controller. The replacement controllers use DMX512 protocol to communicate with the LED driver onboard each luminaire and can adjust the system’s correlated color temperature (CCT, with control settings ranging from 2700 to 6500 K) and intensity (control settings from 0% to 100%).
Several monitoring procedures were implemented to evaluate the energy performance, user interaction, and occupant response to the LED lighting system during the 2017-2018 school year. Energy metering began while the classrooms were operating under the fluorescent lighting system and continued throughout the 2017-2018 school year. Student surveys were administered twice per day during part of the 2017-2018 school year and were aimed at capturing self-reported performance evaluations before and after the color-tuning capabilities of the LED system were enabled. After the color-tuning capabilities were enabled, user interactions with the touch-pad lighting controller were recorded with a logging device, custom-built by Finelite, and saved to a remote laptop. Figure 8 includes the milestones for the LED system installation as well as the timing of the monitoring.
Figure 8. Timeline for the project. Key dates in the FCUSD academic schedule are shown by black diamonds, trial LED lighting installation milestones are shown by green diamonds, and duration of monitoring procedures are shown by green bars. The three classrooms are designated as L1, L2 and L3.

Evaluating Tunable Lighting in Classrooms PNNL-28512
22
5.2 Trial Installation Update: Results and Discussion 5.2.1 Energy Usage Update Collection of energy metering data for each of the three GRE classrooms began during the last week of the 2016-2017 school year, while all three classrooms were operating under fluorescent lighting systems, and continued until the conclusion of the 2017-2018 school year. The metered energy data can be used to substantiate the daily energy savings estimates hypothesized in Section 2.2.3. Actual energy data from May 9, 2017, and May 15, 2018, were used to make daily energy profiles for the fluorescent and LED lighting systems, respectively. The results are shown in Figure 9, Figure 10, and Figure 11.
For the typical school days considered, the energy savings offered by the LED lighting system varied between 48% and 69%. Greater savings were possible in L1 and L2 as the teachers often operated the fluorescent lighting system at 100% intensity, whereas L3 typically operated the fluorescent lighting at 50% intensity using the available bi-level switching. The actual energy savings throughout an entire school year will be less than what has been estimated in these daily profiles as the DMX-controlled driver in each LED luminaire has a small power draw when the system is turned off. Energy metering data for a day with no school, when the lighting system was powered off, shows that the system uses about 1 kWh over a 24-hour period. The Sacramento Municipal Utility District (SMUD) estimates a reduction in annual energy consumption closer to 26% to 57%, depending on the classroom.18
Daily Fluorescent Energy Use Daily LED Energy Use Daily Energy Savings 9.17 kWh 3.90 kWh 57%
Figure 9: Lighting energy use for a 24 hour period in Classroom L1. The gray and blue bars show the intensity setting of the
system at different times for the fluorescent and LED systems respectively (left axis), while the orange and blue lines show the cumulative energy use of the fluorescent and LED systems respectively (right axis).
18 See the “Gold Ridge Elementary School Circadian Lighting Study,” conducted by SMUD: www.smud.org/-/media/Documents/Business-Solutions-and-Rebates/Advanced-Tech-Solutions/LED-Reports/ Gold-Ridge-Lighting-Study-Final.ashx?la=en&hash=1054E5A06B3C2004E401C37A633EC0517A1622EB

Evaluating Tunable Lighting in Classrooms PNNL-28512
23
Daily Fluorescent Energy Use Daily LED Energy Use Daily Energy Savings
8.81 kWh 2.73 kWh 69% Figure 10: Lighting energy use for a 24 hour period in Classroom L2.
Daily Fluorescent Energy Use Daily LED Energy Use Daily Energy Savings 4.73 kWh 2.46 kWh 48%
Figure 11: Lighting energy use for a 24 hour period in Classroom L3.

Evaluating Tunable Lighting in Classrooms PNNL-28512
24
5.2.2 Controller Monitoring When the color-tuning capabilities of the LED lighting system were enabled, logging devices custom-built by Finelite were connected to the touch-pad controller at the front of each classroom. The devices logged all adjustments to the lighting system; recording the time of adjustment, whether the change was via a preset button, and the resulting intensity control setting of the 2x2 luminaires, the whiteboard luminaire, and the color output. Laptops were installed and tethered to the logging device via RJ45 connectors and the software Tera Term was used to save the logged data to a text file. The controller monitoring period in L2 and L3 lasted 8.5 weeks (1414 hours), while a laptop malfunction limited the monitoring period in L1 to 5 weeks (814 hours). The monitoring period for L2 and L3 included one unoccupied week for the academic spring vacation.
Figure 12 and Table 8 provide an overview of the logged lighting conditions in all three classrooms during the monitoring period. The LED lighting systems spent 77% of the monitored hours with the power off. During the 33% of the monitored hours where the systems were powered on, most of the class time was spent in the default setting immediately available when the system was powered on. The teachers spent 32% of the system’s on-hours in a custom light setting by interacting with the intensity and/or color slide-bars on the controller. The controller preset buttons were used regularly, although for shorter durations than the default or custom lighting options.
Detailed timelines of the controller changes per classroom can be seen in Figure 13, Figure 15, and Figure 17, with any change to the lighting systems logged as a data point. Table 9 through Table 11 include the individual light settings for the classrooms as well as a button-press frequency count and the duration in hours that each setting was maintained. Table 11 is separated into two as nearly halfway through the monitoring period the controller in L3 was inadvertently disconnected from the wall, and the preset buttons were subsequently reset to different intensity and color settings.
Figure 13 through Figure 18 show that each of the teachers interacted with the LED lighting system differently, with each of their individual preferences remaining relatively consistent over the monitoring period. The teacher in L1 primarily used the default on/off functionality of the lighting system while the teachers in L2 and L3 (both ASD classrooms) used the preset buttons and the customizable slide-bars more often. General observations of the logged data for the individual classrooms are provided below.
Table 8. Combined logged controller data for occupied and unoccupied hours in classrooms L1, L2, and L3 from March 23-May 21, 2018 (3639 total hours).
Power On (Default)
47%
Calm6%
Energize3%
Screens1%
A/V3%
General8%
Custom setting32%
Figure 12. Combined logged controller data for the occupied hours in classrooms L1, L2, and L3 from March 23-May 21, 2018 (831 total hours).

Evaluating Tunable Lighting in Classrooms PNNL-28512
25
L1 • The system is regularly powered on around 7:15 to 7:30 a.m. during the school week.
• The classroom operates almost entirely using the power on/power off functionality of the system.
• Occasionally the A/V setting is used and the General setting is used to return to higher light levels afterwards.
• There are some patterns in logged data week to week but nothing notable emerges during the entire monitoring period.
L2 • The system is regularly powered on around 7:15 to 7:30 a.m. during the school week.
• The Calm setting is used almost every day around 8 a.m., 10:15 a.m., and 1:30 p.m., followed by Energize 5 to 10 minutes afterwards. Such regular use suggests that the Calm setting may be used as a schedule cue for students.
• Within seconds of selecting the Energize setting, the color slide-bar is used to decrease the CCT of the lights from 5000 K to 3500-4000 K (while maintaining high system intensity levels). As indicated by the press count and duration values in Table 10, the classroom spent most of the operating hours under a customized lighting condition. Verbal feedback from the teacher in L2 (included in Section 5.2.4) confirmed that the Energize setting was considered uncomfortable and was ultimately avoided.
• After 3 p.m., when the students have been dismissed for the day, interaction with the lighting system is limited to the power on/power off default functionality of the system.
L3 • The system is regularly powered on around 7:15 to 7:30 a.m. during the school week.
• There is little interaction with the lighting until 11:45 a.m. when the Energize or A/V settings are selected. After 10 to 15 minutes, the General setting is used to return to default light levels.
• Use of the Energize setting abruptly shifts to regular use of the A/V setting during the week of April 15. This shift occurs during the same week that the controller is inadvertently disconnected from the wall and the settings are adjusted. The Energize setting is subsequently reset to the maximum capabilities of the system (estimated to be around 6500 K and 850 lx at student desk height) and is likely uncomfortable for the teachers and students.
• For the first half of the monitoring period, the press count of the Energize setting is considerably high. It is unlikely that the Energize setting was selected 147 times during the 4-week period; the high press count may instead indicate that the button is held down for multiple seconds, inflating the final press count.
• Around 1:20 p.m. daily, the slide-bar dedicated to the 2x2 luminaires is used to dim the classroom light levels for 5 to 10 minutes. The General setting is used to revert the system back to higher light levels.
• After 3 p.m., when the students have been dismissed for the day, interaction with the lighting system is limited to the power on/power off default functionality of the system. Regular activity between 7:30 and 9:00 p.m. shows when the janitorial staff is in the classroom.

Evaluating Tunable Lighting in Classrooms PNNL-28512
26
Figure 13. Daily logged controller interaction for classroom L1 from April 15-May 20, 2018. Each data point corresponds to
the lighting setting selected by the teacher with the legend shown in Table 9.
Power On (Default)
88%
A/V2%
General7%
Custom Setting3%
Figure 14. Logged controller data for the on-hours in classroom L1 from April 17-May 20, 2018 (205 hours).
Table 9. Summary of total logged press counts and hours spent in each setting for classroom L1 from April 17-May 20, 2018 (814 hours).

Evaluating Tunable Lighting in Classrooms PNNL-28512
27
Figure 15. Daily logged controller interaction for classroom L2 from April 1-May 20, 2018. Each data point corresponds to
the lighting setting selected by the teacher with the legend shown in Table 10.
Table 10. Summary of total logged press count and hours spent in each light setting for classroom L2 from March 23-May 20, 2018 (1414 hours).
Power On (Default)
21% Calm15%
Energize1%
Custom setting63%
Figure 16. Logged controller data for the on-hours in classroom L1 from April 17-May 20, 2018 (205 hours).

Evaluating Tunable Lighting in Classrooms PNNL-28512
28
Figure 17. Daily logged controller interaction for classroom L3 from April 1-May 20, 2018. .Each data point corresponds to
the lighting setting selected by the teacher with the legend shown in Table 11.
Table 11. Summary of total logged press count and hours spent in each light setting for classroom L3 from March 23-May 20, 2018 (1400 hours). There are two logging periods because on April 19 (657 hours into the monitoring period) the system was reset to new intensity and color settings.

Evaluating Tunable Lighting in Classrooms PNNL-28512
29
5.2.3 Student Surveys Beginning in November 2017, 31 students in the fifth grade general education classroom (L1) were given a short daily survey in the morning and afternoon, at the end of the school day.19 The surveys were aimed at determining whether the LED lighting system influenced the students’ self-reported sleep quality, mood, and performance. Some questions were asked in both surveys, such as “How am I feeling?”, and “How is my energy level?”. In the morning, students were asked whether they slept well the night before, and in the afternoon they were asked, “How was my on-task behavior today?” and “How well did I follow classroom expectations today?”. The questions used multiple-choice rating scales with images to help the children report their answers. Figure 19 shows an example of two questions appearing on both the morning and the end of day surveys.
The surveys were only given to students in classrooms after the LED lighting system was installed; there was no data collection with the baseline fluorescent system before the installation, nor was there a control condition of standard classrooms measured during the period of data collection on the LED systems. Consequently, it is
19 The student surveys were designed and administered by the school district, and the original data collection and analysis were completed by the district. PNNL was subsequently provided with de-identified data through protocols approved by the PNNL Institutional Review Board for further analyses.
Figure 19. Two questions appearing in the student survey administered twice daily to a fifth grade general education class.
Power On (Default)
46%
Calm1%
Energize16%
Screens5%
A/V4%
General17%
Custom Setting 11%
Log Period 1Power On (Default)
49%A/V8%
General16%
Custom Setting 27%
Log Period 2
Figure 18. Logged controller data for the on-hours in classroom L3 from March 23-May 20, 2018 (317 hours). There are two logging periods because on April 19 (657 hours into the monitoring period) the system was reset to new intensity and
color settings.

Evaluating Tunable Lighting in Classrooms PNNL-28512
30
unclear which noticeable trends in the data are due to the change in lighting condition as opposed to other seasonal, classroom, and school-related factors. For example, the average energy level reported every morning by the students remained consistent during the full survey period, but the responses at the end of the day showed a decline in average energy level from around February 19 to around March 11, after which they remain consistent at the lower level. Since no data was collected from a control classroom, it is not possible to determine whether the shift was influenced by the LED lighting system or by other factors related to the season or the school year calendar. For future studies, it is important that a control classroom be surveyed to understand if other factors unrelated to lighting are influencing the data. It would also be useful to have anonymous identifiers for each student so that responses can be tracked for individuals over time; individual tracking was not possible for this study.
5.2.4 Teacher Feedback At the conclusion of the 2017-2018 school year, the primary teacher from each of the participating classrooms was interviewed for feedback on the LED lighting system. The teachers were asked about how they interacted with the lighting, their preferences, and how they would change the system. Overall, the feedback was positive, with all three teachers indicating that the new lighting system offered an improved working and learning environment for themselves and the students. The teacher from L2, an ASD classroom, stated:
“I absolutely love the lighting. I feel like lighting is something that we might not think about but I feel like it can have such a huge impact on [the students’] behavior or on their academics. If the calm setting really helps them calm down and be more regulated, then they're ready to learn and much more willing to learn."
The logged control data included in Figure 12 indicates the teacher in L2 regularly used the color-tuning functionality of the LED lighting system. The Calm setting was used almost daily at 8:30 a.m. and 1:30 p.m., suggesting that the lighting acted as a cue for students to redirect their attention to a new activity.
The teachers considered the preset lighting options particularly beneficial because they allowed for quick interaction with the system. Each teacher commented on using the presets to get the attention of their students or as a transitional cue between certain activities. Their feedback indicated that the lights were more effective for getting the attention of their students than other previously used methods like ringing a bell or talking loudly. The ability to dim the lighting system was reported as particularly valuable, with the ability to change the color of the light was considered a secondary benefit. The teachers from the ASD classrooms (L2 and L3) both considered the Energize setting (moderate to high light output control setting combined with high CCT setting) to be uncomfortable and ultimately avoided using it, and L1 almost never used the setting. To further the effectiveness of the system, the teachers suggested the addition of a remote to control the lights; however, the teachers’ feedback did not support the use of a mobile touch-pad or smartphone as a controlling device.
5.3 Conclusion This supplemental report evaluated the performance of the LED classroom lighting systems installed in three classrooms in terms of metered energy use, user interaction, and occupant response during the 2017-2018 school year. Several key results emerged from the evaluation and are summarized below.
• Actual metered energy data for a typical school day before and after the LED lighting installation was used to substantiate the specific lighting scenarios estimated in Section 3.2.3. Comparing the incumbent fluorescent lighting system to the LED lighting installation showed a 48% to 69% reduction in daily energy use for the three classrooms. The actual energy savings throughout an entire school year will be less than what has been estimated in these daily profiles as the DMX-controlled driver in each LED luminaire has a small power draw when the system is turned off. Annual estimates, which include weekends and academic holidays/breaks, suggest the reduction in energy use will be closer to 26% to 57% per classroom due to the baseline electrical load of the control system during the off-hours of the system.

Evaluating Tunable Lighting in Classrooms PNNL-28512
31
• The three teachers whose classrooms were included in this pilot study had unique preferences when using the lighting system. The teachers in classrooms L2 and L3 used the preset buttons and customizable slide-bars on the controller daily. In particular, the Calm setting was often used at specific times of the day, suggesting that it acted as a schedule cue for students.
• When asked to give feedback on the LED lighting systems, all three teachers included in this pilot study felt that the LED lighting system offered an improved working and learning environment for themselves and their students. Being able to dim the lighting system was seen as particularly valuable, with the ability to change the color of the light was considered a secondary benefit.

For more information, visit: energy.gov/eere/ssl
PNNL-27806 ▪ September 2018