evaluating the tailored adaptive personality assessment system … · 2016-07-04 · public...
TRANSCRIPT

Calhoun: The NPS Institutional Archive
Theses and Dissertations Thesis Collection
2014-03
Evaluating the tailored adaptive personality
assessment system on delayed entry program attrition
Turpin, Adam R.
Monterey, California: Naval Postgraduate School
http://hdl.handle.net/10945/41454
NAVAL POSTGRADUATE
SCHOOL
MONTEREY, CALIFORNIA
THESIS
Approved for public release; distribution is unlimited
EVALUATING THE TAILORED ADAPTIVE PERSONALITY ASSESSMENT SYSTEM ON DELAYED
ENTRY PROGRAM ATTRITION
by
Adam R. Turpin
March 2014
Thesis Co-Advisors: Elda Pema Simona Tick

THIS PAGE INTENTIONALLY LEFT BLANK
REPORT DOCUMENTATION PAGE Form Approved OMB No. 0704-0188 Public reporting burden for this collection of information is estimated to average 1 hour per response, including the time for reviewing instruction, searching existing data sources, gathering and maintaining the data needed, and completing and reviewing the collection of information. Send comments regarding this burden estimate or any other aspect of this collection of information, including suggestions for reducing this burden, to Washington headquarters Services, Directorate for Information Operations and Reports, 1215 Jefferson Davis Highway, Suite 1204, Arlington, VA 22202-4302, and to the Office of Management and Budget, Paperwork Reduction Project (0704-0188) Washington DC 20503. 1. AGENCY USE ONLY (Leave blank)
2. REPORT DATE March 2014
3. REPORT TYPE AND DATES COVERED Master’s Thesis
4. TITLE AND SUBTITLE EVALUATING THE TAILORED ADAPTIVE PERSONALITY ASSESSMENT SYSTEM ON DELAYED ENTRY PROGRAM ATTRITION
5. FUNDING NUMBERS
6. AUTHOR(S) Adam R. Turpin 7. PERFORMING ORGANIZATION NAME(S) AND ADDRESS(ES)
Naval Postgraduate School Monterey, CA 93943-5000
8. PERFORMING ORGANIZATION REPORT NUMBER
9. SPONSORING /MONITORING AGENCY NAME(S) AND ADDRESS(ES) N/A
10. SPONSORING/MONITORING AGENCY REPORT NUMBER
11. SUPPLEMENTARY NOTES The views expressed in this thesis are those of the author and do not reflect the official policy or position of the Department of Defense or the U.S. Government. IRB Protocol number ____N/A____.
12a. DISTRIBUTION / AVAILABILITY STATEMENT Approved for public release; distribution is unlimited
12b. DISTRIBUTION CODE
13. ABSTRACT (maximum 200 words) The Tailored Adaptive Personality Assessment System (TAPAS) was a test administered from March 2011 to March 2013 by the U.S. Navy to assess the non-cognitive skills of potential recruits. The TAPAS test aims to assess various aspects of recruit behavior that are not captured by typical screening tests, such as schooling and the Armed Forces Qualification Test (AFQT) along with other observable characteristics measured at entry. This thesis estimates whether the TAPAS scores predict recruit attrition in the Delayed Entry Program (DEP), while controlling for schooling, AFQT scores, and demographics. Indeed, the analysis finds that several TAPAS facets are significant predictors of attrition behavior. In particular, dominance, intellectual efficiency, order, adventure seeking, commitment to serve, and situational awareness are significant predictors of DEP attrition. Additionally, conduct waivers proved to be significant predictors of DEP attrition, with alcohol and drug waivers having the largest effects.
14. SUBJECT TERMS Navy, Delayed Entry Program, DEP, Attrition, Tailored Adaptive Personality Assessment System, TAPAS, Non-cognitive, Recruit Testing, Enlisted, Recruit, Personnel Selection, Screening
15. NUMBER OF PAGES
59 16. PRICE CODE
17. SECURITY CLASSIFICATION OF REPORT
Unclassified
18. SECURITY CLASSIFICATION OF THIS PAGE
Unclassified
19. SECURITY CLASSIFICATION OF ABSTRACT
Unclassified
20. LIMITATION OF ABSTRACT
UU NSN 7540-01-280-5500 Standard Form 298 (Rev. 2-89) Prescribed by ANSI Std. 239-18
i

THIS PAGE INTENTIONALLY LEFT BLANK
ii

Approved for public release; distribution is unlimited
EVALUATING THE TAILORED ADAPTIVE PERSONALITY ASSESSMENT SYSTEM ON DELAYED ENTRY PROGRAM ATTRITION
Adam R. Turpin Lieutenant, United States Navy
B.S., United States Naval Academy, 2007
Submitted in partial fulfillment of the requirements for the degree of
MASTER OF SCIENCE IN MANAGEMENT
from the
NAVAL POSTGRADUATE SCHOOL March 2014
Author: Adam R. Turpin
Approved by: Elda Pema Thesis Co-Advisor
Simona Tick Thesis Co-Advisor
William Gates Dean, Graduate School of Business and Public Policy
iii

THIS PAGE INTENTIONALLY LEFT BLANK
iv

ABSTRACT
The Tailored Adaptive Personality Assessment System (TAPAS) was a test administered
from March 2011 to March 2013 by the U.S. Navy to assess the non-cognitive skills of
potential recruits. The TAPAS test aims to assess various aspects of recruit behavior that
are not captured by typical screening tests, such as schooling and the Armed Forces
Qualification Test (AFQT) along with other observable characteristics measured at entry.
This thesis estimates whether the TAPAS scores predict recruit attrition in the Delayed
Entry Program (DEP), while controlling for schooling, AFQT scores, and demographics.
Indeed, the analysis finds that several TAPAS facets are significant predictors of attrition
behavior. In particular, dominance, intellectual efficiency, order, adventure seeking,
commitment to serve, and situational awareness are significant predictors of DEP
attrition. Additionally, conduct waivers proved to be significant predictors of DEP
attrition, with alcohol and drug waivers having the largest effects.
v

THIS PAGE INTENTIONALLY LEFT BLANK
vi

TABLE OF CONTENTS
I. INTRODUCTION........................................................................................................1 A. BACKGROUND ..............................................................................................1 B. PURPOSE AND BENEFITS OF STUDY .....................................................1 C. ORGANIZATION OF THE THESIS ............................................................2
II. LITERATURE REVIEW ...........................................................................................3 A. OVERVIEW .....................................................................................................3 B. REGRESSION MODELS ...............................................................................3
1. Greenamyer, 2009 ................................................................................3 2. Nakada, 1995 ........................................................................................3 3. Buddin, 2005 .........................................................................................4 4. Pema, Fahrman, Mehay, and Tick, 2013 ...........................................4
C. TAPAS DATA FOR NON-COGNITIVE FACTORS ESTIMATION .......5 D. DEP ATTRITION PREDICTORS ................................................................6
1. Time Spent in DEP...............................................................................6 2. Age of Recruits .....................................................................................6 3. Cognitive Skills and Abilities ..............................................................6
a. AFQT .........................................................................................6 b. Schooling ...................................................................................7
4. Gender ...................................................................................................8 5. Race and Ethnicity ...............................................................................8 6. Other Variables ....................................................................................8
E. SUMMARY ......................................................................................................9
III. DATA DESCRIPTION .............................................................................................11 A. INTRODUCTION..........................................................................................11 B. DATA SOURCES ..........................................................................................11 C. SAMPLE .........................................................................................................11
1. Sample Characteristics ......................................................................11 2. Descriptive Statistics ..........................................................................11 3. Dependent Variable ...........................................................................12 4. Independent Variables.......................................................................13
a. TAPAS Facet Scores ...............................................................13 b. TAPAS Composite Scores .......................................................14 c. Age ...........................................................................................14 d. Gender (Female) .....................................................................15 e. Marital Status (Married) .........................................................15 f. Race .........................................................................................15 g. Education ................................................................................16 h. AFQT Score (Afqtscore) .........................................................17 i. Days in DEP (Dep_days) ........................................................18 j. Waiver Status...........................................................................19 k. Year Dummies (Yr20XX) ........................................................20
vii

IV. DEP ATTRITION ANALYSIS ................................................................................21 A. PROBIT ANALYSIS USING COMPOSITE TAPAS SCORES ...............21
1. Can-do .................................................................................................21 2. Will-do .................................................................................................23
B. PROBIT ANALYSIS USING TAPAS FACETS SCORES .......................25 C. PROBIT ANALYSIS USING TAPAS VERSIONS 7 AND 8,
DEVELOPED SPECIALLY FOR TESTING ATTRITION .....................28
V. CONCLUSIONS AND RECOMMENDATIONS ...................................................35 A. CONCLUSIONS ............................................................................................35 B. RECOMMENDATIONS ...............................................................................36
LIST OF REFERENCES ......................................................................................................39
INITIAL DISTRIBUTION LIST .........................................................................................41
viii
LIST OF FIGURES
Figure 1. Age Distribution of DEP Participants in Sample .............................................15 Figure 2. Race/Ethnicity Distribution of DEP Participants in Sample............................16 Figure 3. Education Levels of DEP Participants in Sample ............................................17 Figure 4. AFQT Score Distribution of DEP Participants in Sample ...............................18 Figure 5. Time in DEP for DEP Participants in Sample .................................................19
ix

THIS PAGE INTENTIONALLY LEFT BLANK
x

LIST OF TABLES
Table 1. Descriptive Statistics of Analysis Dataset .......................................................12 Table 2. Descriptive Statistics of TAPAS Variables .....................................................14 Table 3. The Effect of TAPAS Composite Can-Do on DEP Attrition, Controlling
for Demographic Characteristics, Quantitative Skills, and Waivers ...............22 Table 4. The Effect of TAPAS Composite Will-Do on DEP Attrition, Controlling
for Demographic Characteristics, Quantitative Skills, and Waivers ...............23 Table 5. The Effect of TAPAS Facets Scores on DEP Attrition ...................................25 Table 6. The Effect of TAPAS Version 7 Facet Scores on DEP Attrition ....................29 Table 7. The Effect of TAPAS Version 8 Facet Scores on DEP Attrition ....................31
xi

THIS PAGE INTENTIONALLY LEFT BLANK
xii
LIST OF ACRONYMS AND ABBREVIATIONS
AFQT Armed Forces Qualification Test
CNRC Commander, Naval Recruiting Command
DEP Delayed Entry Program
MEPCOM Military Entrance Processing Command
MEPS Military Entrance Processing Stations
TAPAS Tailored Adaptive Personality Assessment System
xiii

THIS PAGE INTENTIONALLY LEFT BLANK
xiv

ACKNOWLEDGMENTS
I would like to thank professors Elda Pema and Simona Tick for their guidance,
dedication, inspiration, and contributions not only to this thesis, but also to my entire
journey at Naval Postgraduate School (NPS).
To my fellow classmates: It was a pleasure learning from and with you. Thank
you for making my experience at NPS enjoyable. I wish you all well in your future
endeavors.
To my wife, Slavica: I thank you for your endless love, support, encouragement,
and understanding without which completion of this thesis would not have been possible.
To my Mom: Thank you for always believing in me and pushing me to excel. I
would have never made it this far without you.
To my dogs: Leona, Spartan, and Shipmate, thank you for all the licks and
smiling faces each and every day I came home from school. It was always nice to have a
fan club.
xv

THIS PAGE INTENTIONALLY LEFT BLANK
xvi

I. INTRODUCTION
A. BACKGROUND
The U.S. Navy puts great effort into recruiting, training, and retaining the most
qualified and committed individuals. Traditionally, to predict attrition, retention and job
performance, the Navy used recruit demographic characteristics and so-called cognitive
skills measures, captured by schooling and Armed Forces Qualification Test (AFQT)
scores. However, beginning in April 2011, the Navy administering the Tailored Adaptive
Personality Assessment System (TAPAS) test for the recruit cohorts up through March
2013 in an effort to add non-cognitive skill measures to predict attrition, retention, and
job performance.
B. PURPOSE AND BENEFITS OF STUDY
The purpose of this research is to evaluate aspects of the Tailored Adaptive
Personality Assessment System (TAPAS) administered to Navy Delayed Entry Program
(DEP) participants at the Military Entrance Processing Stations (MEPS) from April 2011
to March 2013. The first part of this analysis evaluates the relationship between TAPAS
composite scores and DEP attrition. The second part of the analysis evaluates the
relationship between individual TAPAS facet scores and DEP attrition. These analyses
are first evaluated on demographics alone, then quantitative skills measures are included,
and then moral waivers are included.
This research contributes to the understanding of the effect of various personality
factors on recruits’ decisions to attrite or access from DEP. Manpower professionals
could utilize the findings of this thesis to develop better recruiting policies for screening
applicants that add non-cognitive measures to other observable characteristics, such as
demographics, AFQT, and education level. Such policies, along with further research
into more precise personality measures, have the potential to considerably reduce
growing attrition costs.
1
C. ORGANIZATION OF THE THESIS
This thesis is organized into five chapters. Chapter II presents a literature review
and covers the most recent studies on attrition and non-cognitive testing. Chapter III
describes the data and provides an overview of the data sources and variables used in the
analysis. Chapter IV presents the analysis of TAPAS scores on DEP attrition using a
probit model to determine what personality characteristics of Navy DEP participants
make them more likely to access to initial recruit training. Chapter V presents the
conclusions and recommendations.
2

II. LITERATURE REVIEW
A. OVERVIEW
This chapter reviews the most relevant studies that examine attrition behavior.
The Delayed Entry Program has not been as extensively investigated as early term
attrition, primarily due to the lack of available data on DEP attrites, especially after they
leave DEP (Lane, 2006). However, a few studies utilize data collected at the time of
enlistment to evaluate the predictive power of several demographic and cognitive factors
of DEP participants.
This chapter reviews attrition studies that have addressed attrition behavior,
discusses their approaches, data, and findings. In addition, this literature review addresses
the benefits and drawbacks of several explanatory variables in modeling attrition
behavior.
B. REGRESSION MODELS
1. Greenamyer, 2009
Greenamyer (2009) utilizes a linear probability model (LPM) to analyze the
effects of AFQT percentile score and age on Navy DEP attrition. While dichotomous
variables pose no issues, using a continuous variable as a key explanatory variable
(AFQT) in a probability model can yield implausible estimates of the dependent variable
outside the probability range from zero to one. Using an LPM also assumes the marginal
effects of the explanatory variables are constant. While this may be true for certain
variables, it is unlikely that this is the case for all of them. For example, it is unlikely that
the first day in DEP has the same effect on attrition as the 200th day. The LPM can be
useful where marginal effects are constant and the key explanatory variables are
dichotomous.
2. Nakada, 1995
Nakada (1995) uses a logit regression to model Navy DEP attrition. Included in
its variable list are age dummy variables for ages 17, 18, 19, 20, and 21+ as the control 3
group. This study also uses high school senior (HSSR) and high school diploma graduate
(HSDG) along with AFQT and other demographic, economic, and racial/ethnic dummy
variables. Nakada (1995) discusses the use of a probit or logit as more appropriate than
OLS because, while “inefficient parameter estimates and discrete distribution problems
can be overcome with large enough samples, probit and logit estimation methods, which
restrict estimated probabilities to the zero-one interval, are more appropriate (Nakada,
1995, p.12).” Nakada (1995) chose the logit method because of a large sample size
(n=296,551).
This study’s model choice captures the behavior of DEP attrition more efficiently
when compared to OLS. However, the choice of age variables leaves too much
information in the control group. By selecting ages 21 and older as the base, it may be
confusing effects of several age groups. A better way would have been to make age
dummies for every age and select one as the control group so that a more distinct
comparison can be made. Although this does not affect the outcome of his estimation on
the dependent variable, the effects of the age variables may be underestimated.
3. Buddin, 2005
Buddin (2005) uses a probit regression because most outcomes included in his
analysis are discrete, with the exception of time to promotion. Unlike Nakada (1995),
Buddin (2005) uses a continuous age variable and considers whether or not the recruit
took a trigonometry and/or geometry class, along with AFQT as measures of cognitive
ability. Use of a continuous age variable allows for a more meaningful interpretation of a
change in age and how that affects DEP attrition. Interestingly, Buddin (2005) includes
whether or not the recruit took any trigonometry or geometry classes. This appears to be
an early effort to investigate whether AFQT scores are explaining all of the unobservable
characteristics of the individual recruits’ skills and abilities.
4. Pema, Fahrman, Mehay, and Tick, 2013
Pema et al. (2013) use OLS regressions of non-cognitive test scores on different
dependent variables to determine the correlation between TAPAS scores and several
4

variables already used in previous attrition research. First, the study regresses TAPAS
scores on each variable without holding other factors constant. Next, it conducts a
multivariate regression to identify any correlation between TAPAS scores and the
dependent variable (Pema et al., 2013). This is an improvement from Greenamyer (2009)
in that this approach utilizes OLS to identify the unique and significant effect of an
explanatory variable rather than to explain attrition behavior in a linear fashion.
Furthermore, using both a bivariate and multivariate linear regression Pema et al. (2013)
separates how much of the effect is due to the TAPAS scores and how much is due to
other factors that are controlled for in the multivariate linear regression.
Pema et al. (2013) also use probit models to estimate the effects of TAPAS on
accession probability. It estimated two models, one with “cognitive controls” (i.e.,
AFQT and Armed Services Vocational Aptitude Battery (ASVAB) categories) and
another without the cognitive controls to discern the partial effects of each TAPAS facet
and composite scores on accession probability (Pema et al., 2013). It used an appropriate
model and validated the premise that non-cognitive individual characteristics explain
more of the attrition decision than do cognitive characteristics alone.
C. TAPAS DATA FOR NON-COGNITIVE FACTORS ESTIMATION
Prior research on DEP attrition has primarily utilized observable data collected
from the recruits. There is little research using non-cognitive traits as predictors of DEP
attrition. Pema et al. (2013) obtained TAPAS composite and facet scores and regressed
observable characteristics on these scores to determine if the TAPAS scores yielded new
information from what the observables already provided for first term attrition or if they
were redundant. It found that a large number of TAPAS facets and composite scores are
significantly correlated to some of the demographic characteristics, but weakly correlated
to cognitive measures (AFQT, ASVAB, education level). This indicates that TAPAS
information may explain more about attrition than previous models (Pema et al., 2013).
Employing TAPAS data to model DEP attrition should yield more information on
the behavior of DEP attrites. This will add important and meaningful information to the
field of attrition research as well as benefit the Navy in its recruiting efforts. Being able
5
to more accurately identify those with a higher propensity to attrite from DEP can be a
significant cost saver to the Navy.
D. DEP ATTRITION PREDICTORS
1. Time Spent in DEP
Time spent in DEP has consistently been indicated as a key predictor of attrition
from the Delayed Entry Program. Several studies find a strong positive correlation
between length of time in DEP and DEP attrition. In 1994, the Navy Personnel and
Research Development Center found that an increase of one month in DEP correlates
with a 1.4 percentage point increase in the probability of a participant attriting (Nakada,
1994). A similar finding comes from a 2005 Rand study by Buddin, investigating trends
in Army attrition where an extra month spent in DEP was linked to a 1.8 percentage point
increase in DEP attrition. Of note, this study also shows that from fiscal year 1995 to
fiscal year 2001 the Army shortened DEP length by two months for non-high school
seniors and experienced an average DEP attrition decline of 2.5 percentage points over
this period.
2. Age of Recruits
Age of the recruit at the time of enlistment is found by many studies to be a
significant predictor of DEP attrition as well. Buddin (2005) finds a one percentage point
increase in DEP attrition for a two year increase in average age of recruits. Greenamyer
(2009) also finds a significant positive correlation with age and DEP attrition, albeit the
effect is very small (0.27 percentage points). These previous findings show that age
might explain some of the DEP attrition behavior.
3. Cognitive Skills and Abilities
a. AFQT
The Navy has been using the Armed Forces Qualification Test (AFQT) since
1976 as a way to measure a potential recruit’s intelligence and cognitive abilities. It has
long been the assumption that measures of cognitive abilities were the major indicators of
6

performance and retention. In 2005, Buddin evaluated not only whether or not AFQT
scores are correlated with attrition, but it also investigated if taking mathematics classes
such as trigonometry and geometry had any relation with Army DEP attrition. While the
study found all three to be significant, the effects were so small as to be effectively zero.
The AFQT is highly correlated with job performance but not necessarily correlated with
DEP attrition (Buddin, 2005). Baykiz (2007) found that amongst Marine Corps enlistees
that were high school seniors and high school graduates there was a negative correlation
between AFQT score and the probability of attriting from DEP Greenamyer (2007)
interacts age and AFQT scores and finds that, on average, individuals younger than 21
years of age attrite at lower rates as AFQT increases.
Lane (2006) comments on this interesting notion that DEP attrition may in fact be
undesirable not only because it is costly, but also because there is evidence that
individuals attriting from DEP are of a higher quality:
The finding that DEP attrites had higher AFQT scores is especially important in discriminating among these groups, because this finding contradicts the notion that DEP attrition is “wanted” attrition of lower quality recruits who would eventually fail anyway. Research has consistently shown cognitive ability as the best predictor of job performance (Hunter & Hunter, 1984; Schmidt & Hunter, 1998). The military uses the ASVAB, of which the Armed Forced Qualification Test (AFQT) is a part, as its measure of cognitive ability; research shows that cognitive ability, as measured by the ASVAB, is useful in predicting job performance in the military (Ree, Earles, & Teachout, 1994). Therefore, the finding that DEP attrites had higher cognitive ability scores than individuals who shipped to training translates into the fact that the U.S. Navy is losing higher, not lower, quality candidates to attrition before they enter training. (Lane, 2006, p. 8)
Previous studies findings suggest that AFQT scores are only a small predictor of
DEP attrition behavior and suggests that there might be other factors that predict DEP
attrition that cognitive tests are not able to capture.
b. Schooling
Education level has consistently been a strong predictor of attrition. Individuals
that did not graduate from high school are twice as likely to attrite in the first term when
7

compared to those that achieved a high school diploma (Knapik, 2004). Specifically,
Ogren (1999) found that education level had a strong effect on DEP attrition behavior.
This supports earlier work that identified education and cognitive ability as the best
predictors of attrition (Lockman and Warner, 1977). Lane (2006) also lists education as
one of the more prominent factors in predicting DEP attrition behavior. Of note, Buddin
(2005) found that while having a high school diploma is significant to predicting attrition,
those having a GED had no statistically different attrition rates from those who had no
education credentials at all.
4. Gender
Gender has always been identified as an indicator of DEP attrition. Nakada
(1994) provides evidence that, all else held constant, males attrite at lower rates when
compared to females. It shows males attrited from DEP at a rate of 13 percent while
females attrited at a rate of 22 percent. Buddin (2005) finds similar effects, with men
attriting at a lower rate of 14 percent, while women attrite at a rate of 19 percent.
5. Race and Ethnicity
Race and ethnicity have been shown to be key predictors of DEP attrition. Blacks
and other minorities attrite at lower rates when compared to whites (Nakada, 1995).
Buddin (2005) finds that minorities, in general, attrite from DEP at lower rates than
whites. Conversely, Neuhalfen (2007) found that attrition rates for blacks were actually
higher for tier I recruits but mirrored previous study results for tier II and III recruits.
This indicates that race and ethnicity may explain some attrition behavior, but also that
this behavior may also be based on the quality of recruit as modeled by AFQT score and
education level.
6. Other Variables
There are several variables previous studies on attrition behavior have found to be
either insignificant or of little “practical significance.” Nakada (1994) found significant
negative effects for unemployment rate on DEP attrition, but the coefficient was so small
(-0.12) that it was of little practical use. While this study found many individual 8
characteristics meaningful, it found most recruiter characteristics to be insignificant. The
one exception was the variable indicating if the recruiter was in paygrade E-7 or above,
which had a small negative effect on DEP attrition. Furthermore, Buddin (2005)
confirms Nakada’s (1994) findings that unemployment rate and recruiter characteristics
have negligible effects on attrition rates. Buddin (2005) also finds that age, while
significant, has only a minor effect on attrition, with a two years increase in age being
correlated with a one-percentage point drop in DEP attrition.
AFQT is also generally regarded as a good predictor of trainability and of attrition
behavior. This is substantiated by Wegner and Hodari (2004) who assert that there is an
association between AFQT scores and attrition. Lane (2006) suggests AFQT is a key
factor in determining which individuals will attrite from DEP as it finds recruits with
higher AFQT scores were more likely to attrite. While it is quite likely that AFQT scores
yield valuable information on attrition behavior, it is also plausible that non-cognitive
traits can add further insight as to why some recruits attrite and some do not. Pema et al.
(2013) find that the Tailored Adaptive Personality Assessment System (TAPAS), a non-
cognitive test given to all recruits during 2011-2013, enhances our understanding of why
some applicants enlist and some do not. TAPAS scores appear significant even after
controlling for gender, race, and waiver status, AFQT scores, and education category.
This indicates there are some recruit characteristics that AFQT is not efficient at
capturing but that may be captured by non-cognitive tests, such as TAPAS.
E. SUMMARY
Previous studies on DEP attrition have generated consistent findings. These
studies find that time-in-DEP has a significant positive correlation with DEP attrition.
This is most likely due to the additional time a recruit has to reconsider his/her decision
to join the military. Also, previous studies indicate that gender, specifically being
female, is associated with higher attrition levels. This might be explained by women
having additional domestic duties and not being the primary wage earners (Wegner and
Hodari, 2004). Whites are more likely to attrite than any other race/ethnicity. At this
point, it is unclear why this is the case other than to hypothesize that there may be
9

inherent racial and ethnic differences causing whites to attrite at higher rates. Singles as
well, demonstrated higher attrition levels than compared to their married counterparts.
Singles, especially young singles that make up the majority of the recruiting pool, may
feel less pressure to make it to basic training than their married counterparts for a couple
of reasons: (1) they do not have the financial pressures of providing for a family and (2)
they do not have the support from a spouse to encourage them to make it through to basic
training. Education level and AFQT scores garnered mixed opinions. Some found
evidence that education level was positively correlated with attrition while others
believed it to be only a negligible effect. The same is true about AFQT with the military
using it as a key predictor for decades while many researchers believe non-cognitive
testing is more efficient at capturing certain recruit characteristics.
Others variables such as unemployment and recruiter characteristics have been
shown to either have minimal or insignificant effects that explain DEP attrition. Probit is
the estimation technique of choice by those studying attrition. Using OLS to estimate
probabilities can lead to inefficiencies and probabilities outside of the zero to one
interval. Current research also asserts that personality characteristics can yield valuable
information about individual behavior both in first term and DEP attrition.
10
III. DATA DESCRIPTION
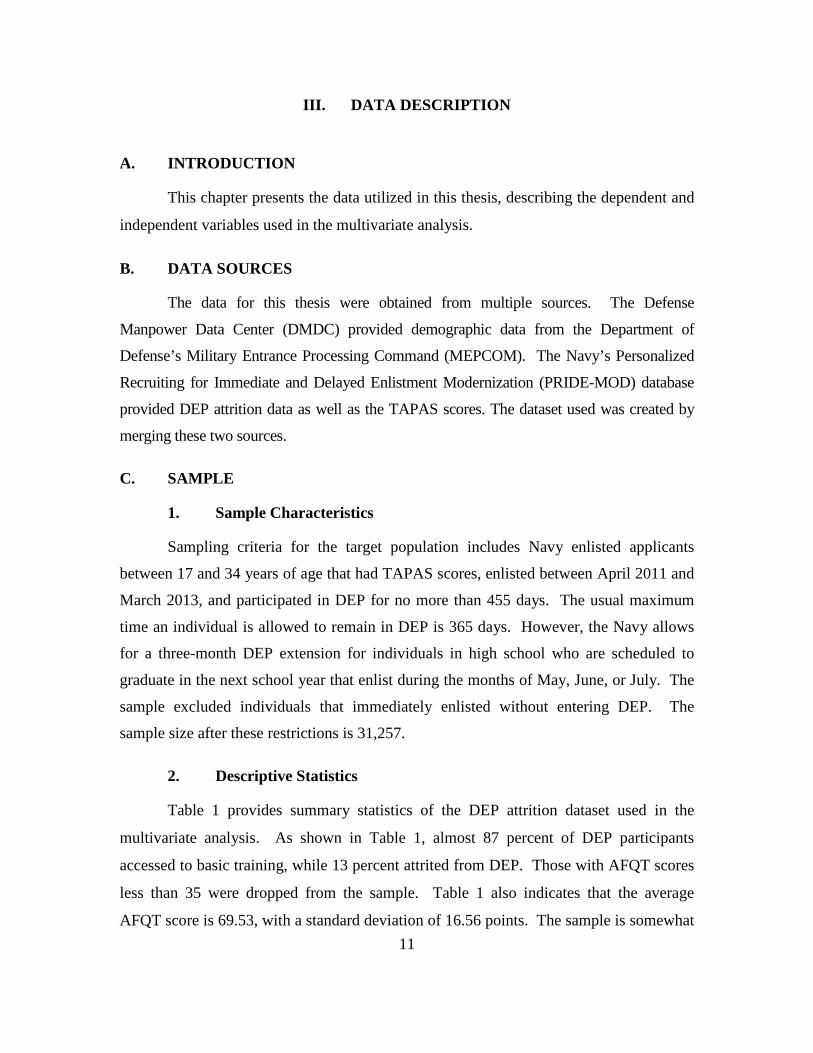
A. INTRODUCTION
This chapter presents the data utilized in this thesis, describing the dependent and
independent variables used in the multivariate analysis.
B. DATA SOURCES
The data for this thesis were obtained from multiple sources. The Defense
Manpower Data Center (DMDC) provided demographic data from the Department of
Defense’s Military Entrance Processing Command (MEPCOM). The Navy’s Personalized
Recruiting for Immediate and Delayed Enlistment Modernization (PRIDE-MOD) database
provided DEP attrition data as well as the TAPAS scores. The dataset used was created by
merging these two sources.
C. SAMPLE
1. Sample Characteristics
Sampling criteria for the target population includes Navy enlisted applicants
between 17 and 34 years of age that had TAPAS scores, enlisted between April 2011 and
March 2013, and participated in DEP for no more than 455 days. The usual maximum
time an individual is allowed to remain in DEP is 365 days. However, the Navy allows
for a three-month DEP extension for individuals in high school who are scheduled to
graduate in the next school year that enlist during the months of May, June, or July. The
sample excluded individuals that immediately enlisted without entering DEP. The
sample size after these restrictions is 31,257.
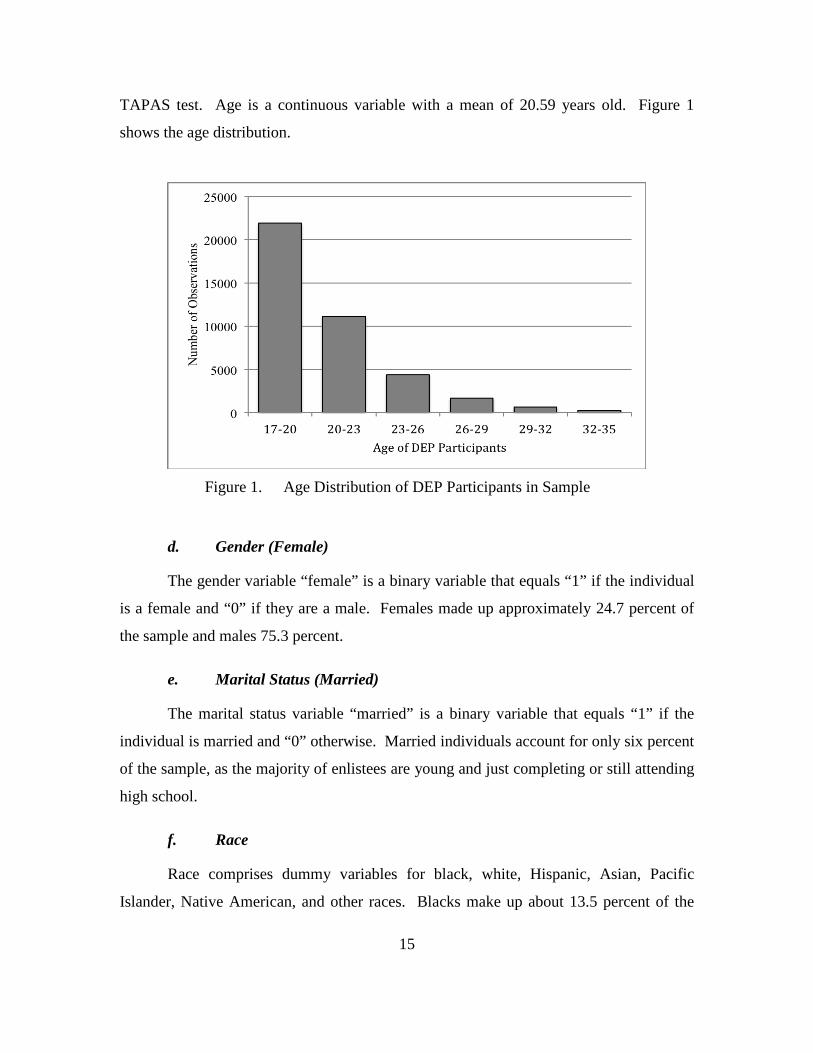
2. Descriptive Statistics
Table 1 provides summary statistics of the DEP attrition dataset used in the
multivariate analysis. As shown in Table 1, almost 87 percent of DEP participants
accessed to basic training, while 13 percent attrited from DEP. Those with AFQT scores
less than 35 were dropped from the sample. Table 1 also indicates that the average
AFQT score is 69.53, with a standard deviation of 16.56 points. The sample is somewhat 11
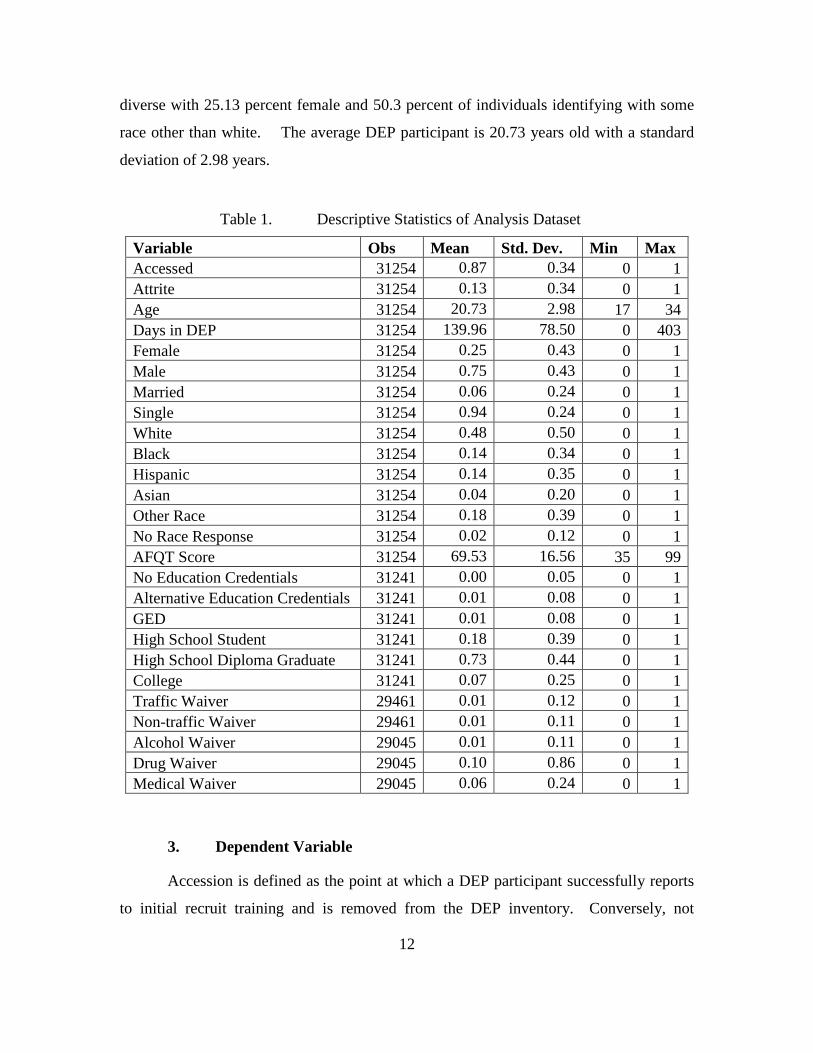
diverse with 25.13 percent female and 50.3 percent of individuals identifying with some
race other than white. The average DEP participant is 20.73 years old with a standard
deviation of 2.98 years.
Table 1. Descriptive Statistics of Analysis Dataset
Variable Obs Mean Std. Dev. Min Max Accessed 31254 0.87 0.34 0 1 Attrite 31254 0.13 0.34 0 1 Age 31254 20.73 2.98 17 34 Days in DEP 31254 139.96 78.50 0 403 Female 31254 0.25 0.43 0 1 Male 31254 0.75 0.43 0 1 Married 31254 0.06 0.24 0 1 Single 31254 0.94 0.24 0 1 White 31254 0.48 0.50 0 1 Black 31254 0.14 0.34 0 1 Hispanic 31254 0.14 0.35 0 1 Asian 31254 0.04 0.20 0 1 Other Race 31254 0.18 0.39 0 1 No Race Response 31254 0.02 0.12 0 1 AFQT Score 31254 69.53 16.56 35 99 No Education Credentials 31241 0.00 0.05 0 1 Alternative Education Credentials 31241 0.01 0.08 0 1 GED 31241 0.01 0.08 0 1 High School Student 31241 0.18 0.39 0 1 High School Diploma Graduate 31241 0.73 0.44 0 1 College 31241 0.07 0.25 0 1 Traffic Waiver 29461 0.01 0.12 0 1 Non-traffic Waiver 29461 0.01 0.11 0 1 Alcohol Waiver 29045 0.01 0.11 0 1 Drug Waiver 29045 0.10 0.86 0 1 Medical Waiver 29045 0.06 0.24 0 1
3. Dependent Variable
Accession is defined as the point at which a DEP participant successfully reports
to initial recruit training and is removed from the DEP inventory. Conversely, not
12
accessing, or attriting, is voluntarily or involuntarily being removed from the DEP
program with the expressed intentions of not continuing to basic training. To analyze
accession and attrition from DEP, the dependent variable used in the analysis is
accession, defined as a binary variable that is equal to “1” if the individual accessed, and
“0” if they attrited. According to Table 1, the average DEP accession rate in this sample
is 87 percent.
4. Independent Variables
TAPAS composite and facet scores are the independent variables of interest as
this thesis wants to test whether the TAPAS scores can explain any variation in the DEP
attrition rates. Other independent variables used in the multivariate analysis include
demographic variables such as age, male, female, married, single, race categories (White,
Black, Hispanic, other race), schooling level (no high school diploma, high school
student, high school diploma graduate, some college, and college degree), AFQT score,
and waiver status. Year dummy variables (for the years 2011, 2012, and 2013) are used
in the analysis to control for any unobserved factors that vary over time and may affect
the accession decision of recruits. Each independent variable is discussed below.
a. TAPAS Facet Scores
The TAPAS test evaluates 15 unique personality attributes, or facets, and gives a
numerical score to each of these attributes. Table 2 displays the summary statistics for
each of the 15 facets. Certain facets, such as optimism, were renamed to wellbeing in later
versions of TAPAS. Therefore, these scores were merged into one variable. As the test
developed, certain facets, such as excitement, were added to the test (Fahrman, 2013).
The original facets have values for every observation in the sample while newer facets
only have values for more recent observations.
13

Table 2. Descriptive Statistics of TAPAS Variables
Variable Obs Mean Std. Dev. Min Max Can-Do 31254 108.342 18.490 33.62 178.5 Will-Do 31254 109.653 19.743 22.47 183.7 Achievement 31254 0.212 0.502 -2.09 2.38 Adjustment 31254 0.029 0.458 -1.82 2.91 Cooperation 22448 0.093 0.497 -1.86 2.82 Dominance 31254 0.217 0.534 -2.23 1.96 Even temper 31254 0.259 0.469 -2.11 2.58 Excitement/Attention Seeking 31254 -0.270 0.557 -2.42 2.35 Intelligence Efficiency 31254 0.114 0.554 -2.13 2.49 Nondelinquency 31254 0.141 0.516 -2.43 2.68 Order 22448 -0.315 0.538 -2.27 1.86 Physical Motivation 31254 0.118 0.596 -2.57 2.22 Self-Control 22414 -0.168 0.516 -2.05 1.97 Sociability 22414 -0.156 0.567 -2.04 2.06 Tolerance 22414 0.013 0.530 -2.13 2.81 Selflessness/Generosity 22448 -0.040 0.468 -2.17 2.04 Optimism/Wellbeing 31254 0.226 0.435 -1.97 2.68
b. TAPAS Composite Scores
The TAPAS test combines the results of some of the facets and creates two
composite scores called “will do” and “can do.” “will-do” is a measure of an individual’s
predisposition to achieving higher physical fitness scores, on-the-job effort, and attrition.
“can-do” forecasts intermediate training performance and an individual’s knowledge of
his or her job (Heffner, White, and Kilcullen, 2010).
Based on the literature review, it is hypothesized that there exists a strong
correlation between DEP attrition and the “will do” composite score. The analysis
chapter will test this hypothesis.
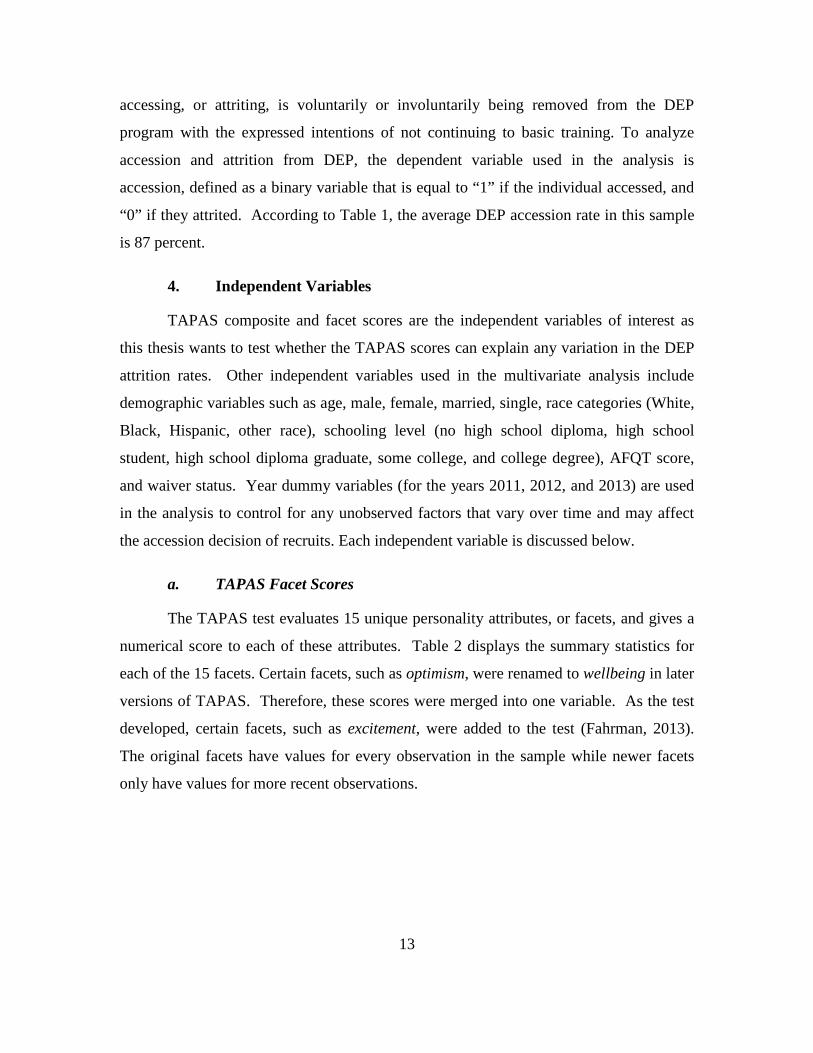
c. Age
The sample was restricted to individuals between 17 and 34 years of age,
inclusive. According to the Navy’s recruiting website, www.navy.com, “You must be no
older than 34 but at least 17 years old. If you are not yet 18, you must have parental
consent [to enlist].” Age was computed as of the day the individual was administered the
14
TAPAS test. Age is a continuous variable with a mean of 20.59 years old. Figure 1
shows the age distribution.
Figure 1. Age Distribution of DEP Participants in Sample
d. Gender (Female)
The gender variable “female” is a binary variable that equals “1” if the individual
is a female and “0” if they are a male. Females made up approximately 24.7 percent of
the sample and males 75.3 percent.
e. Marital Status (Married)
The marital status variable “married” is a binary variable that equals “1” if the
individual is married and “0” otherwise. Married individuals account for only six percent
of the sample, as the majority of enlistees are young and just completing or still attending
high school.
f. Race
Race comprises dummy variables for black, white, Hispanic, Asian, Pacific
Islander, Native American, and other races. Blacks make up about 13.5 percent of the
15

sample. Whites constitute 49.4 percent of the sample. Hispanics compose about 13.9
percent of the sample. Asians are approximately 4.1 percent of the sample. Other races
including Pacific Islanders, Native Americans, and individuals identifying with another
race other than those listed, are categorized as “other race” and represent 17.4 percent of
the sample. Observations with no race response are identified by the variable “no race
response” and comprised 1.7 percent of the sample. Figure 2 shows the racial
distribution.
Figure 2. Race/Ethnicity Distribution of DEP Participants in Sample
g. Education
Individuals’ education levels are identified by seven categories. All of these
education levels are recorded at the time of processing. “No Credentials” indicates that
the individual either is a high school dropout, failed the high school exit exam, or is
pursuing, but not yet obtained a GED. “HS Student” indicates that person was enrolled
in high school at the time of enlistment. “Alt Credential” means the individual
participated in an alternative credential program such as a correspondence course, adult
education, occupational program certification, home school diploma, received an
attendance certification from high school, and other non-traditional credentials. “GED”
16

indicates a person has passed the General Educational Development (GED) test and
earned a Certificate of High School Equivalency. “HS Diploma” indicates that individual
is a high school graduate. “Some College” indicates an individual attended and
completed at least one semester of college but less than what is required for a degree.
“College Graduate” includes individuals with associates, bachelors, masters, doctorate,
and other professional degrees. For analysis purposes, individual education levels are
placed into four categories: No High School Diploma (composed of GED, Alternative
Credentials, and No Credentials), High School Diploma Graduate, High School Student,
and College (comprised of Some College and College Degree). While education level
was recorded at the time of enlistment, which is after the TAPAS test, it is not likely that
an individual’s education level would increase significantly from the relatively short time
between taking the TAPAS test and enlistment. Figure 3 is a graphical depiction of the
educational distribution.
Figure 3. Education Levels of DEP Participants in Sample
h. AFQT Score (Afqtscore)
The Armed Forces Qualification Test is a measure of the individual’s aptitude and
potential to perform well in a given task. Test scores range from 0 to 99 and are divided
17
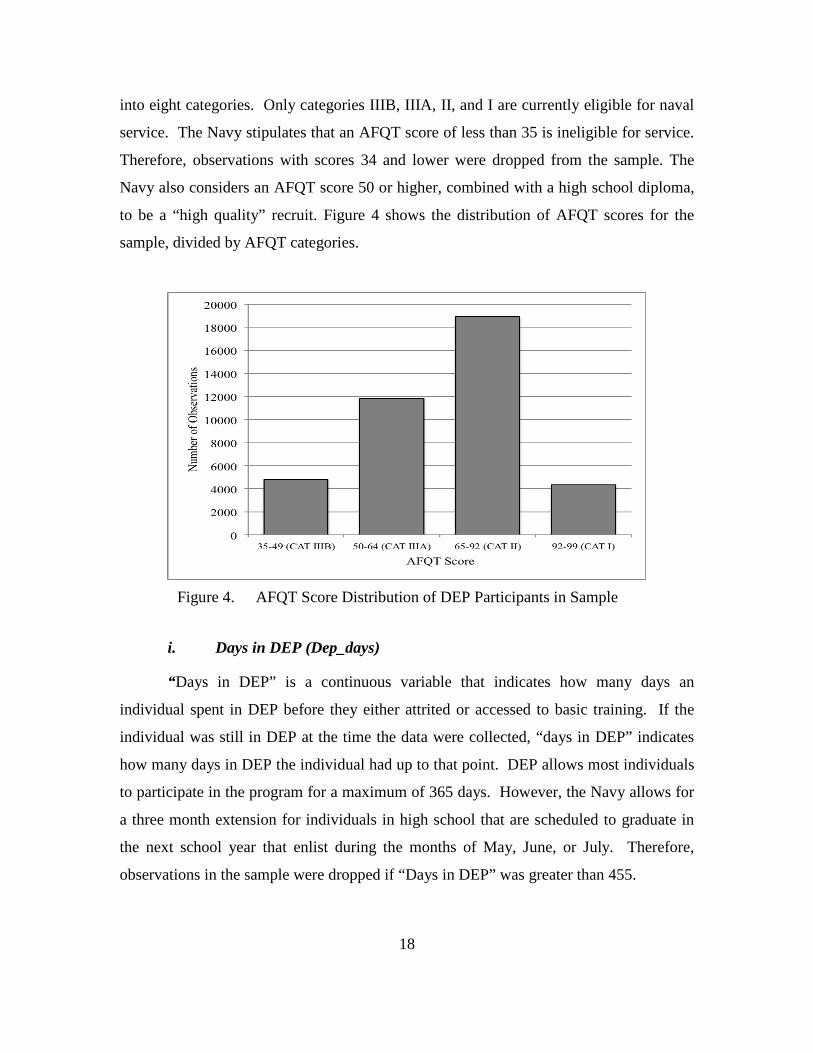
into eight categories. Only categories IIIB, IIIA, II, and I are currently eligible for naval
service. The Navy stipulates that an AFQT score of less than 35 is ineligible for service.
Therefore, observations with scores 34 and lower were dropped from the sample. The
Navy also considers an AFQT score 50 or higher, combined with a high school diploma,
to be a “high quality” recruit. Figure 4 shows the distribution of AFQT scores for the
sample, divided by AFQT categories.
Figure 4. AFQT Score Distribution of DEP Participants in Sample
i. Days in DEP (Dep_days)
“Days in DEP” is a continuous variable that indicates how many days an
individual spent in DEP before they either attrited or accessed to basic training. If the
individual was still in DEP at the time the data were collected, “days in DEP” indicates
how many days in DEP the individual had up to that point. DEP allows most individuals
to participate in the program for a maximum of 365 days. However, the Navy allows for
a three month extension for individuals in high school that are scheduled to graduate in
the next school year that enlist during the months of May, June, or July. Therefore,
observations in the sample were dropped if “Days in DEP” was greater than 455.
18
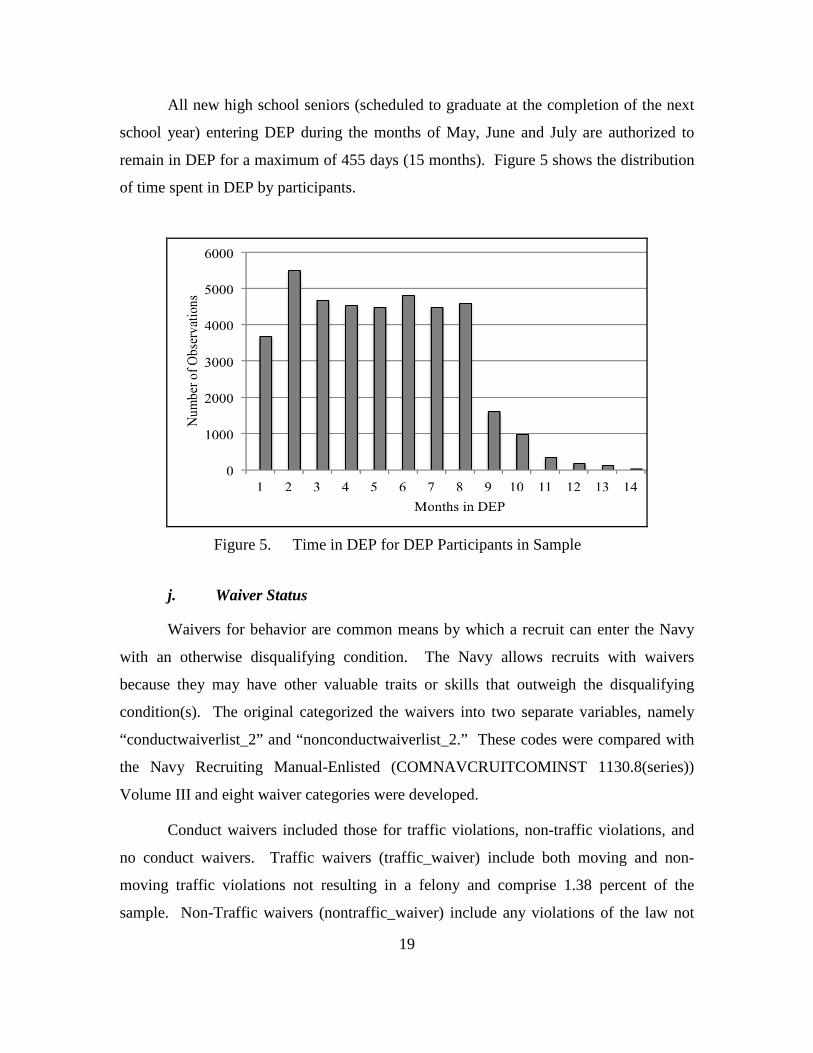
All new high school seniors (scheduled to graduate at the completion of the next
school year) entering DEP during the months of May, June and July are authorized to
remain in DEP for a maximum of 455 days (15 months). Figure 5 shows the distribution
of time spent in DEP by participants.
Figure 5. Time in DEP for DEP Participants in Sample
j. Waiver Status
Waivers for behavior are common means by which a recruit can enter the Navy
with an otherwise disqualifying condition. The Navy allows recruits with waivers
because they may have other valuable traits or skills that outweigh the disqualifying
condition(s). The original categorized the waivers into two separate variables, namely
“conductwaiverlist_2” and “nonconductwaiverlist_2.” These codes were compared with
the Navy Recruiting Manual-Enlisted (COMNAVCRUITCOMINST 1130.8(series))
Volume III and eight waiver categories were developed.
Conduct waivers included those for traffic violations, non-traffic violations, and
no conduct waivers. Traffic waivers (traffic_waiver) include both moving and non-
moving traffic violations not resulting in a felony and comprise 1.38 percent of the
sample. Non-Traffic waivers (nontraffic_waiver) include any violations of the law not
19

involving a vehicle that resulted in one or more misdemeanor or felony charges or where
a vehicle was involved that resulted in a felony charge. These waivers are rare, due to the
seriousness of the actions being waived and thus represent only 1.17 percent of the
sample.
Non-conduct waivers included those for alcohol abuse, drug abuse, and medical
conditions. Alcohol abuse waivers (alcohol_waiver) indicate the individual had abused
alcohol in the past and comprised 1.17 percent of the sample. Drug abuse waivers
(drug_waiver) indicate the individual had abused illegal or prescription drugs in the past.
These individuals made up 10.22 percent of the sample. Medical conditions waivers
(med_waiver) are for individuals who have medical issues that would normally be
disqualifying for naval service. They composed 5.87 percent of the sample.
k. Year Dummies (Yr20XX)
Calendar years are identified by year dummy variables to capture year effects that
may vary over time. These year dummies are created from the year in which the
individual made the decision to access or attrite from DEP. Dummies for yr2011,
yr2012, and yr2013 were created. Year 2011 is used as the control group.
20

IV. DEP ATTRITION ANALYSIS
To address the question “Do TAPAS scores predict whether or not a recruit will
attrite from the Delayed Entry Program?” this thesis uses a multivariate analysis approach
to identify the variables that explain the variations in the DEP attrition rates.
Specifically, this analysis uses a probit model to determine the probability that a DEP
participant will access to basic training based on TAPAS scores while controlling for
other explanatory variables. The analysis investigates the predictive power of both, the
composite scores and the 15 facet scores. Five new facets created specifically for
military attrition studies are also investigated for their predictive abilities (Drasgow et al.,
2012). Findings from this analysis indicate how likely a DEP participant is to access to
basic training based on the composite scores and the facets.
Three probit models evaluate each TAPAS score. The first model includes only
demographic information. The second adds quantitative controls for education and
cognitive ability (AFQT score). The third model adds controls for waivers.
A. PROBIT ANALYSIS USING COMPOSITE TAPAS SCORES
The first set of probit regressions estimates the effects of the TAPAS composite
scores on DEP accession probability. The probit coefficient indicates direction and
significance, while the partial effect shows magnitude of the effect these composite
scores have on the probability of accessing to basic training from the DEP.
1. Can-do
The first column of Table 3 describes the results of the composite score can-do on
DEP accession when only controlling for demographics. Can-do has a statistically
significant partial effect of -0.0003. This suggests that an additional point of the can-do
composite score decreases the likelihood a recruit will access by 0.03 percentage points.
The second column adds quantitative controls for education level and AFQT scores. The
can-do effect is largely unchanged in both magnitude and significance. Including
waivers in the regression produces an insignificant can-do coefficient. Waivers,
21
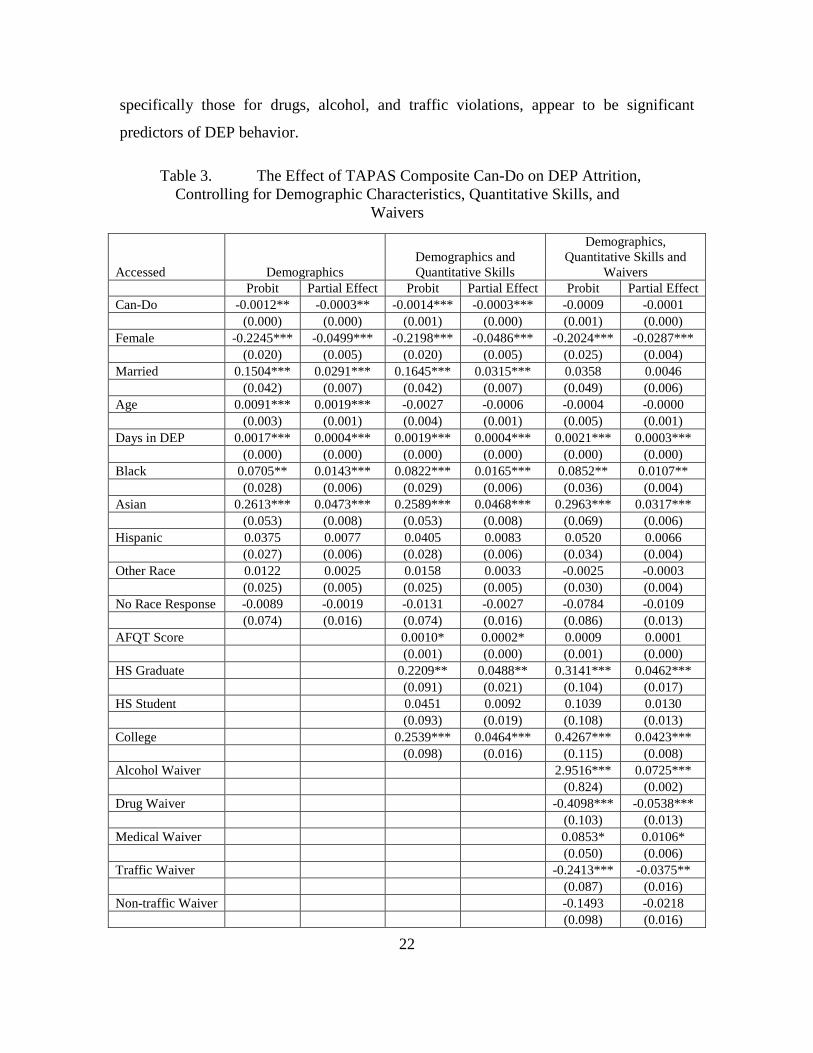
specifically those for drugs, alcohol, and traffic violations, appear to be significant
predictors of DEP behavior.
Table 3. The Effect of TAPAS Composite Can-Do on DEP Attrition, Controlling for Demographic Characteristics, Quantitative Skills, and
Waivers
Accessed Demographics Demographics and Quantitative Skills
Demographics, Quantitative Skills and
Waivers Probit Partial Effect Probit Partial Effect Probit Partial Effect Can-Do -0.0012** -0.0003** -0.0014*** -0.0003*** -0.0009 -0.0001 (0.000) (0.000) (0.001) (0.000) (0.001) (0.000) Female -0.2245*** -0.0499*** -0.2198*** -0.0486*** -0.2024*** -0.0287*** (0.020) (0.005) (0.020) (0.005) (0.025) (0.004) Married 0.1504*** 0.0291*** 0.1645*** 0.0315*** 0.0358 0.0046 (0.042) (0.007) (0.042) (0.007) (0.049) (0.006) Age 0.0091*** 0.0019*** -0.0027 -0.0006 -0.0004 -0.0000 (0.003) (0.001) (0.004) (0.001) (0.005) (0.001) Days in DEP 0.0017*** 0.0004*** 0.0019*** 0.0004*** 0.0021*** 0.0003*** (0.000) (0.000) (0.000) (0.000) (0.000) (0.000) Black 0.0705** 0.0143*** 0.0822*** 0.0165*** 0.0852** 0.0107** (0.028) (0.006) (0.029) (0.006) (0.036) (0.004) Asian 0.2613*** 0.0473*** 0.2589*** 0.0468*** 0.2963*** 0.0317*** (0.053) (0.008) (0.053) (0.008) (0.069) (0.006) Hispanic 0.0375 0.0077 0.0405 0.0083 0.0520 0.0066 (0.027) (0.006) (0.028) (0.006) (0.034) (0.004) Other Race 0.0122 0.0025 0.0158 0.0033 -0.0025 -0.0003 (0.025) (0.005) (0.025) (0.005) (0.030) (0.004) No Race Response -0.0089 -0.0019 -0.0131 -0.0027 -0.0784 -0.0109 (0.074) (0.016) (0.074) (0.016) (0.086) (0.013) AFQT Score 0.0010* 0.0002* 0.0009 0.0001 (0.001) (0.000) (0.001) (0.000) HS Graduate 0.2209** 0.0488** 0.3141*** 0.0462*** (0.091) (0.021) (0.104) (0.017) HS Student 0.0451 0.0092 0.1039 0.0130 (0.093) (0.019) (0.108) (0.013) College 0.2539*** 0.0464*** 0.4267*** 0.0423*** (0.098) (0.016) (0.115) (0.008) Alcohol Waiver 2.9516*** 0.0725*** (0.824) (0.002) Drug Waiver -0.4098*** -0.0538*** (0.103) (0.013) Medical Waiver 0.0853* 0.0106* (0.050) (0.006) Traffic Waiver -0.2413*** -0.0375** (0.087) (0.016) Non-traffic Waiver -0.1493 -0.0218 (0.098) (0.016)
22
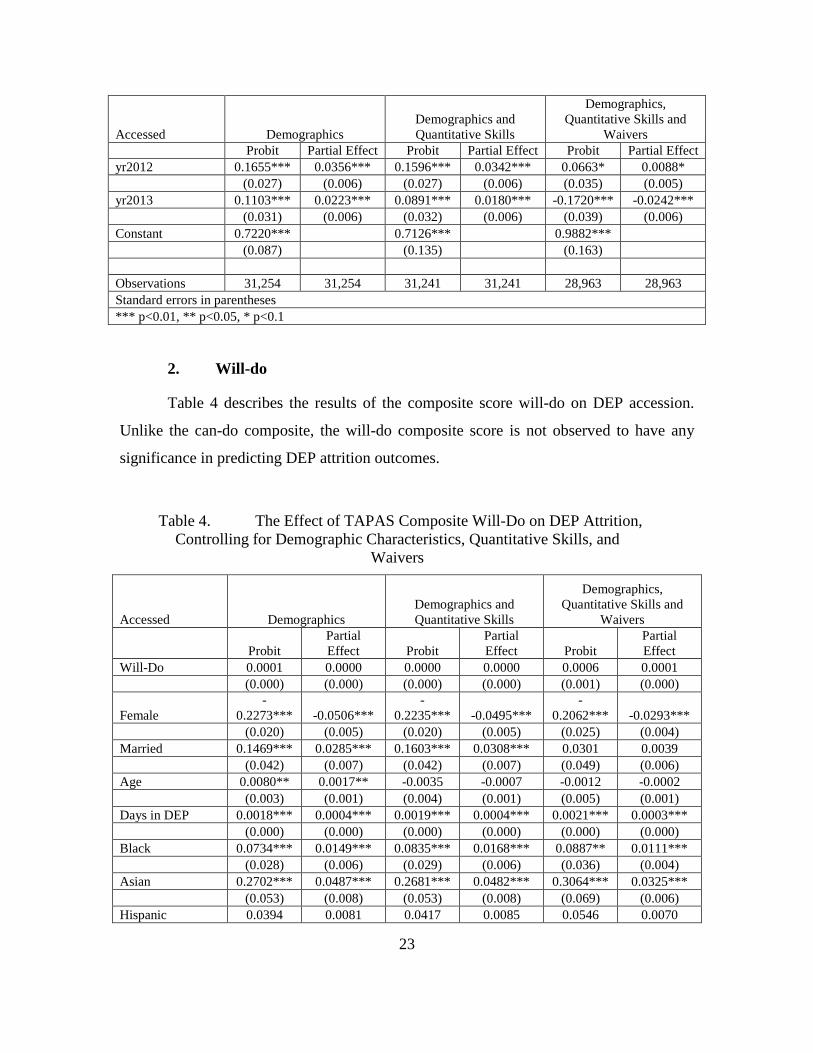
2. Will-do
Table 4 describes the results of the composite score will-do on DEP accession.
Unlike the can-do composite, the will-do composite score is not observed to have any
significance in predicting DEP attrition outcomes.
Table 4. The Effect of TAPAS Composite Will-Do on DEP Attrition, Controlling for Demographic Characteristics, Quantitative Skills, and
Waivers
Accessed Demographics Demographics and Quantitative Skills
Demographics, Quantitative Skills and
Waivers
Probit Partial Effect Probit
Partial Effect Probit
Partial Effect
Will-Do 0.0001 0.0000 0.0000 0.0000 0.0006 0.0001 (0.000) (0.000) (0.000) (0.000) (0.001) (0.000)
Female -
0.2273*** -0.0506*** -
0.2235*** -0.0495*** -
0.2062*** -0.0293*** (0.020) (0.005) (0.020) (0.005) (0.025) (0.004) Married 0.1469*** 0.0285*** 0.1603*** 0.0308*** 0.0301 0.0039 (0.042) (0.007) (0.042) (0.007) (0.049) (0.006) Age 0.0080** 0.0017** -0.0035 -0.0007 -0.0012 -0.0002 (0.003) (0.001) (0.004) (0.001) (0.005) (0.001) Days in DEP 0.0018*** 0.0004*** 0.0019*** 0.0004*** 0.0021*** 0.0003*** (0.000) (0.000) (0.000) (0.000) (0.000) (0.000) Black 0.0734*** 0.0149*** 0.0835*** 0.0168*** 0.0887** 0.0111*** (0.028) (0.006) (0.029) (0.006) (0.036) (0.004) Asian 0.2702*** 0.0487*** 0.2681*** 0.0482*** 0.3064*** 0.0325*** (0.053) (0.008) (0.053) (0.008) (0.069) (0.006) Hispanic 0.0394 0.0081 0.0417 0.0085 0.0546 0.0070
Accessed Demographics Demographics and Quantitative Skills
Demographics, Quantitative Skills and
Waivers Probit Partial Effect Probit Partial Effect Probit Partial Effect yr2012 0.1655*** 0.0356*** 0.1596*** 0.0342*** 0.0663* 0.0088* (0.027) (0.006) (0.027) (0.006) (0.035) (0.005) yr2013 0.1103*** 0.0223*** 0.0891*** 0.0180*** -0.1720*** -0.0242*** (0.031) (0.006) (0.032) (0.006) (0.039) (0.006) Constant 0.7220*** 0.7126*** 0.9882*** (0.087) (0.135) (0.163) Observations 31,254 31,254 31,241 31,241 28,963 28,963 Standard errors in parentheses *** p<0.01, ** p<0.05, * p<0.1
23

Accessed Demographics Demographics and Quantitative Skills
Demographics, Quantitative Skills and
Waivers
Probit Partial Effect Probit
Partial Effect Probit
Partial Effect
(0.027) (0.006) (0.028) (0.006) (0.034) (0.004) Other Race 0.0128 0.0027 0.0161 0.0033 -0.0011 -0.0001 (0.025) (0.005) (0.025) (0.005) (0.030) (0.004) No Race Response -0.0078 -0.0016 -0.0124 -0.0026 -0.0770 -0.0107 (0.074) (0.016) (0.074) (0.016) (0.086) (0.013) AFQT Score 0.0008 0.0002 0.0007 0.0001 (0.001) (0.000) (0.001) (0.000) HS Graduate 0.2233** 0.0494** 0.3146*** 0.0463*** (0.091) (0.021) (0.104) (0.017) HS Student 0.0495 0.0101 0.1071 0.0134 (0.093) (0.019) (0.108) (0.013) College 0.2563*** 0.0468*** 0.4267*** 0.0423*** (0.098) (0.015) (0.115) (0.008) Alcohol Waiver 2.9283*** 0.0725*** (0.824) (0.002)
Drug Waiver -
0.4066*** -0.0534*** (0.103) (0.013) Medical Waiver 0.0851* 0.0106* (0.050) (0.006)
Traffic Waiver -
0.2404*** -0.0374** (0.087) (0.016) Non-traffic Waiver -0.1493 -0.0218 (0.098) (0.016) yr2012 0.1613*** 0.0347*** 0.1547*** 0.0331*** 0.0644* 0.0086* (0.027) (0.006) (0.027) (0.006) (0.035) (0.005)
yr2013 0.1048*** 0.0212*** 0.0828*** 0.0168*** -
0.1745*** -0.0246*** (0.031) (0.006) (0.031) (0.006) (0.039) (0.006) Constant 0.6059*** 0.5919*** 0.8463*** (0.088) (0.136) (0.164) 31,254 31,254 31,241 31,241 28,963 28,963 Standard errors in parentheses *** p<0.01, ** p<0.05, * p<0.1
24
B. PROBIT ANALYSIS USING TAPAS FACETS SCORES
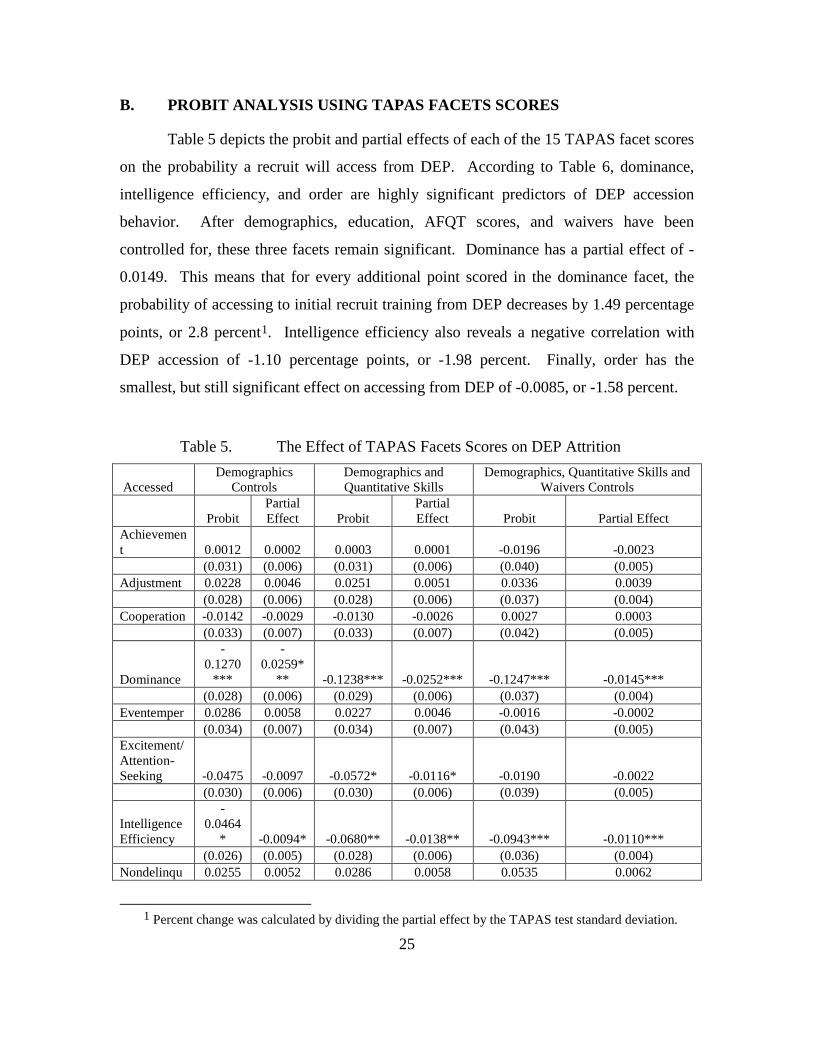
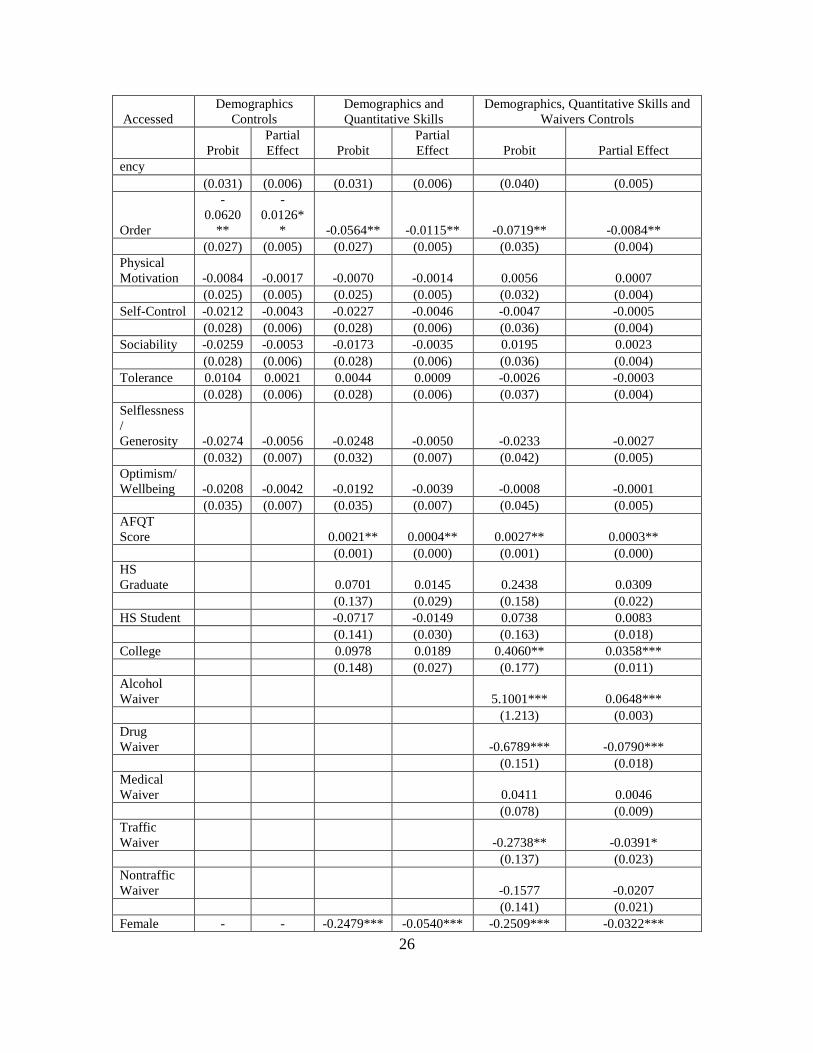
Table 5 depicts the probit and partial effects of each of the 15 TAPAS facet scores
on the probability a recruit will access from DEP. According to Table 6, dominance,
intelligence efficiency, and order are highly significant predictors of DEP accession
behavior. After demographics, education, AFQT scores, and waivers have been
controlled for, these three facets remain significant. Dominance has a partial effect of -
0.0149. This means that for every additional point scored in the dominance facet, the
probability of accessing to initial recruit training from DEP decreases by 1.49 percentage
points, or 2.8 percent1. Intelligence efficiency also reveals a negative correlation with
DEP accession of -1.10 percentage points, or -1.98 percent. Finally, order has the
smallest, but still significant effect on accessing from DEP of -0.0085, or -1.58 percent.
Table 5. The Effect of TAPAS Facets Scores on DEP Attrition
Accessed Demographics
Controls Demographics and Quantitative Skills
Demographics, Quantitative Skills and Waivers Controls
Probit
Partial Effect Probit
Partial Effect Probit Partial Effect
Achievement 0.0012 0.0002 0.0003 0.0001 -0.0196 -0.0023
(0.031) (0.006) (0.031) (0.006) (0.040) (0.005)
Adjustment 0.0228 0.0046 0.0251 0.0051 0.0336 0.0039
(0.028) (0.006) (0.028) (0.006) (0.037) (0.004)
Cooperation -0.0142 -0.0029 -0.0130 -0.0026 0.0027 0.0003
(0.033) (0.007) (0.033) (0.007) (0.042) (0.005)
Dominance
-0.1270
***
-0.0259*
** -0.1238*** -0.0252*** -0.1247*** -0.0145***
(0.028) (0.006) (0.029) (0.006) (0.037) (0.004)
Eventemper 0.0286 0.0058 0.0227 0.0046 -0.0016 -0.0002
(0.034) (0.007) (0.034) (0.007) (0.043) (0.005)
Excitement/ Attention-Seeking -0.0475 -0.0097 -0.0572* -0.0116* -0.0190 -0.0022
(0.030) (0.006) (0.030) (0.006) (0.039) (0.005)
Intelligence Efficiency
-0.0464
* -0.0094* -0.0680** -0.0138** -0.0943*** -0.0110***
(0.026) (0.005) (0.028) (0.006) (0.036) (0.004)
Nondelinqu 0.0255 0.0052 0.0286 0.0058 0.0535 0.0062
1 Percent change was calculated by dividing the partial effect by the TAPAS test standard deviation.
25
Accessed Demographics
Controls Demographics and Quantitative Skills
Demographics, Quantitative Skills and Waivers Controls
Probit
Partial Effect Probit
Partial Effect Probit Partial Effect
ency
(0.031) (0.006) (0.031) (0.006) (0.040) (0.005)
Order
-0.0620
**
-0.0126*
* -0.0564** -0.0115** -0.0719** -0.0084**
(0.027) (0.005) (0.027) (0.005) (0.035) (0.004)
Physical Motivation -0.0084 -0.0017 -0.0070 -0.0014 0.0056 0.0007
(0.025) (0.005) (0.025) (0.005) (0.032) (0.004)
Self-Control -0.0212 -0.0043 -0.0227 -0.0046 -0.0047 -0.0005
(0.028) (0.006) (0.028) (0.006) (0.036) (0.004)
Sociability -0.0259 -0.0053 -0.0173 -0.0035 0.0195 0.0023
(0.028) (0.006) (0.028) (0.006) (0.036) (0.004)
Tolerance 0.0104 0.0021 0.0044 0.0009 -0.0026 -0.0003
(0.028) (0.006) (0.028) (0.006) (0.037) (0.004)
Selflessness/ Generosity -0.0274 -0.0056 -0.0248 -0.0050 -0.0233 -0.0027
(0.032) (0.007) (0.032) (0.007) (0.042) (0.005)
Optimism/ Wellbeing -0.0208 -0.0042 -0.0192 -0.0039 -0.0008 -0.0001
(0.035) (0.007) (0.035) (0.007) (0.045) (0.005)
AFQT Score
0.0021** 0.0004** 0.0027** 0.0003**
(0.001) (0.000) (0.001) (0.000)
HS Graduate
0.0701 0.0145 0.2438 0.0309
(0.137) (0.029) (0.158) (0.022)
HS Student
-0.0717 -0.0149 0.0738 0.0083
(0.141) (0.030) (0.163) (0.018)
College
0.0978 0.0189 0.4060** 0.0358***
(0.148) (0.027) (0.177) (0.011)
Alcohol Waiver
5.1001*** 0.0648***
(1.213) (0.003)
Drug Waiver
-0.6789*** -0.0790***
(0.151) (0.018)
Medical Waiver
0.0411 0.0046
(0.078) (0.009)
Traffic Waiver
-0.2738** -0.0391*
(0.137) (0.023)
Nontraffic Waiver
-0.1577 -0.0207
(0.141) (0.021)
Female - - -0.2479*** -0.0540*** -0.2509*** -0.0322*** 26

Accessed Demographics
Controls Demographics and Quantitative Skills
Demographics, Quantitative Skills and Waivers Controls
Probit
Partial Effect Probit
Partial Effect Probit Partial Effect
0.2562***
0.0560***
(0.032) (0.008) (0.033) (0.008) (0.042) (0.006)
Married 0.1740
*** 0.0324*
** 0.1862*** 0.0343*** 0.1342 0.0142*
(0.065) (0.011) (0.066) (0.011) (0.085) (0.008)
Age 0.0075 0.0015 -0.0041 -0.0008 -0.0021 -0.0002
(0.005) (0.001) (0.006) (0.001) (0.008) (0.001)
Days in DEP
0.0012***
0.0002*** 0.0013*** 0.0003*** 0.0014*** 0.0002***
(0.000) (0.000) (0.000) (0.000) (0.000) (0.000)
Black 0.0753
* 0.0149* 0.0952** 0.0186** 0.1028* 0.0113*
(0.043) (0.008) (0.044) (0.008) (0.057) (0.006)
Asian 0.2108
*** 0.0383*
** 0.2119*** 0.0383*** 0.3180*** 0.0294***
(0.078) (0.012) (0.078) (0.012) (0.111) (0.008)
Hispanic 0.0953
** 0.0186*
* 0.1042** 0.0202** 0.1430** 0.0153***
(0.044) (0.008) (0.044) (0.008) (0.058) (0.006)
Other Race 0.0265 0.0053 0.0313 0.0063 0.0118 0.0014
(0.039) (0.008) (0.039) (0.008) (0.049) (0.006)
No Race Response 0.0477 0.0095 0.0494 0.0098 -0.0290 -0.0035
(0.114) (0.022) (0.114) (0.022) (0.139) (0.017)
yr2012 0.1632
*** 0.0341*
** 0.1545*** 0.0322*** 0.0581 0.0069
(0.035) (0.008) (0.035) (0.008) (0.046) (0.006)
yr2013 0.1666
*** 0.0314*
** 0.1512*** 0.0287*** -0.1210* -0.0151*
(0.053) (0.009) (0.053) (0.009) (0.064) (0.009)
Constant 0.6921
***
0.7284***
0.9697***
(0.116)
(0.196)
(0.243)
Observations 13,608 13,608 13,606 13,606 12,432 12,432 Standard errors in parentheses *** p<0.01, ** p<0.05, * p<0.1
27
C. PROBIT ANALYSIS USING TAPAS VERSIONS 7 AND 8, DEVELOPED SPECIALLY FOR TESTING ATTRITION
Tables 6 and 7 display the results of five newer facets that were developed
specifically for the military to use in evaluating attrition and other manpower models
(Drasgow et al., 2012). These facets are adventure seeking, commitment to serve,
courage, team orientation, and situational awareness. Adventure seeking, commitment to
serve, and situational awareness were only administered in version 7 of the TAPAS test
while ourage and team orientation were only administered in version 8. These versions
were given to Navy recruits across the country during the same time frame as the rest of
the TAPAS versions.
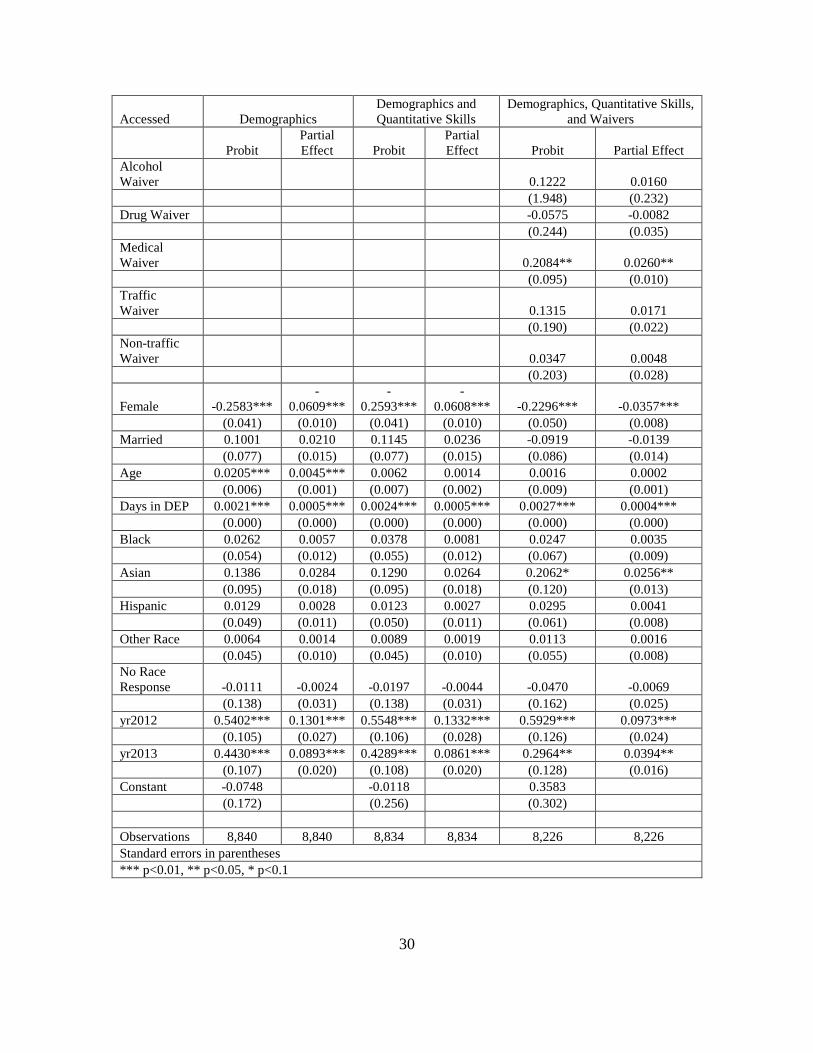
Table 6 displays the results of version 7 of the TAPAS test. All three of the
unique facets (adventure seeking, commitment to serve, and situational awareness) reveal
some significance. Adventure seeking is significant at the 5 percent level and has an
effect of -1.32 percentage points, or -2.18 percent, per additional point scored in the
adventure seeking facet on the probability of accessing from DEP to initial recruit
training. Not controlling for waivers, commitment to serve was highly significant. After
controlling for waivers however, commitment to serve’s predictive power decreased from
a 1 percent significance level to a 10 percent significance level. After all controls, its
effect is a positive 1.08 percentage points, or 2.14 percent. This is interpreted as an
additional point scored in the commitment to serve facet increases a recruit’s probability
of accessing from DEP to initial recruit training by 1.08 percentage points, or 2.14
percent. Situational awareness increased in significance as controls when waivers were
controlled for. Situational awareness is significant at the 5 percent level and has an effect
of -1.26 percentage points, or -2.51 percent on DEP accession.
28

Table 6. The Effect of TAPAS Version 7 Facet Scores on DEP Attrition
Accessed Demographics Demographics and Quantitative Skills
Demographics, Quantitative Skills, and Waivers
Probit Partial Effect Probit
Partial Effect Probit Partial Effect
Adventure Seeking -0.0756** -0.0166** -0.0785** -0.0171** -0.0926** -0.0132** (0.031) (0.007) (0.031) (0.007) (0.038) (0.005) Commitment 0.1229*** 0.0270*** 0.1303*** 0.0285*** 0.0756* 0.0108* (0.034) (0.007) (0.034) (0.007) (0.042) (0.006) Situational Awareness -0.0620* -0.0136* -0.0607* -0.0133* -0.0882** -0.0126** (0.036) (0.008) (0.036) (0.008) (0.044) (0.006) Achievement -0.0315 -0.0069 -0.0353 -0.0077 -0.0326 -0.0047 (0.039) (0.008) (0.039) (0.008) (0.047) (0.007) Adjustment -0.0869* -0.0191* -0.0896* -0.0196* 0.0027 0.0004 (0.047) (0.010) (0.047) (0.010) (0.057) (0.008) Attention Seeking -0.0486 -0.0107 -0.0582* -0.0127* -0.0426 -0.0061 (0.031) (0.007) (0.031) (0.007) (0.038) (0.005) Cooperation -0.0313 -0.0069 -0.0371 -0.0081 -0.0468 -0.0067 (0.035) (0.008) (0.035) (0.008) (0.043) (0.006) Dominance -0.0495 -0.0109 -0.0491 -0.0107 -0.0201 -0.0029 (0.038) (0.008) (0.038) (0.008) (0.046) (0.007) Eventemper -0.0174 -0.0038 -0.0232 -0.0051 0.0049 0.0007 (0.040) (0.009) (0.040) (0.009) (0.049) (0.007) Intelligence Efficiency -0.0891***
-0.0196***
-0.0946***
-0.0206*** -0.0708 -0.0101
(0.034) (0.007) (0.037) (0.008) (0.044) (0.006) Optimism 0.0203 0.0045 0.0180 0.0039 0.0143 0.0020 (0.040) (0.009) (0.040) (0.009) (0.049) (0.007) Order -0.0359 -0.0079 -0.0354 -0.0077 0.0090 0.0013 (0.032) (0.007) (0.033) (0.007) (0.040) (0.006) Physical Motivation -0.0376 -0.0083 -0.0341 -0.0075 -0.0133 -0.0019 (0.031) (0.007) (0.031) (0.007) (0.038) (0.005) Selflessness 0.0134 0.0029 0.0181 0.0039 0.0660 0.0094 (0.042) (0.009) (0.042) (0.009) (0.051) (0.007) Nondelinquency 0.0141 0.0031 0.0140 0.0031 0.0701* 0.0100* (0.035) (0.008) (0.035) (0.008) (0.043) (0.006) AFQT Score
0.0001 0.0000 -0.0005 -0.0001
(0.001) (0.000) (0.001) (0.000) HS Graduate
0.2259 0.0525 0.2769 0.0438
(0.172) (0.042) (0.198) (0.035) HS Student
-0.0342 -0.0076 -0.0125 -0.0018
(0.177) (0.040) (0.205) (0.030) College
0.2761 0.0526* 0.4527** 0.0484***
(0.186) (0.030) (0.218) (0.017)
29
Accessed Demographics Demographics and Quantitative Skills
Demographics, Quantitative Skills, and Waivers
Probit Partial Effect Probit
Partial Effect Probit Partial Effect
Alcohol Waiver
0.1222 0.0160
(1.948) (0.232) Drug Waiver
-0.0575 -0.0082
(0.244) (0.035) Medical Waiver
0.2084** 0.0260**
(0.095) (0.010) Traffic Waiver
0.1315 0.0171
(0.190) (0.022) Non-traffic Waiver
0.0347 0.0048
(0.203) (0.028)
Female -0.2583*** -
0.0609*** -
0.2593*** -
0.0608*** -0.2296*** -0.0357*** (0.041) (0.010) (0.041) (0.010) (0.050) (0.008) Married 0.1001 0.0210 0.1145 0.0236 -0.0919 -0.0139 (0.077) (0.015) (0.077) (0.015) (0.086) (0.014) Age 0.0205*** 0.0045*** 0.0062 0.0014 0.0016 0.0002 (0.006) (0.001) (0.007) (0.002) (0.009) (0.001) Days in DEP 0.0021*** 0.0005*** 0.0024*** 0.0005*** 0.0027*** 0.0004*** (0.000) (0.000) (0.000) (0.000) (0.000) (0.000) Black 0.0262 0.0057 0.0378 0.0081 0.0247 0.0035 (0.054) (0.012) (0.055) (0.012) (0.067) (0.009) Asian 0.1386 0.0284 0.1290 0.0264 0.2062* 0.0256** (0.095) (0.018) (0.095) (0.018) (0.120) (0.013) Hispanic 0.0129 0.0028 0.0123 0.0027 0.0295 0.0041 (0.049) (0.011) (0.050) (0.011) (0.061) (0.008) Other Race 0.0064 0.0014 0.0089 0.0019 0.0113 0.0016 (0.045) (0.010) (0.045) (0.010) (0.055) (0.008) No Race Response -0.0111 -0.0024 -0.0197 -0.0044 -0.0470 -0.0069 (0.138) (0.031) (0.138) (0.031) (0.162) (0.025) yr2012 0.5402*** 0.1301*** 0.5548*** 0.1332*** 0.5929*** 0.0973*** (0.105) (0.027) (0.106) (0.028) (0.126) (0.024) yr2013 0.4430*** 0.0893*** 0.4289*** 0.0861*** 0.2964** 0.0394** (0.107) (0.020) (0.108) (0.020) (0.128) (0.016) Constant -0.0748
-0.0118
0.3583
(0.172)
(0.256)
(0.302)
Observations 8,840 8,840 8,834 8,834 8,226 8,226 Standard errors in parentheses *** p<0.01, ** p<0.05, * p<0.1
30
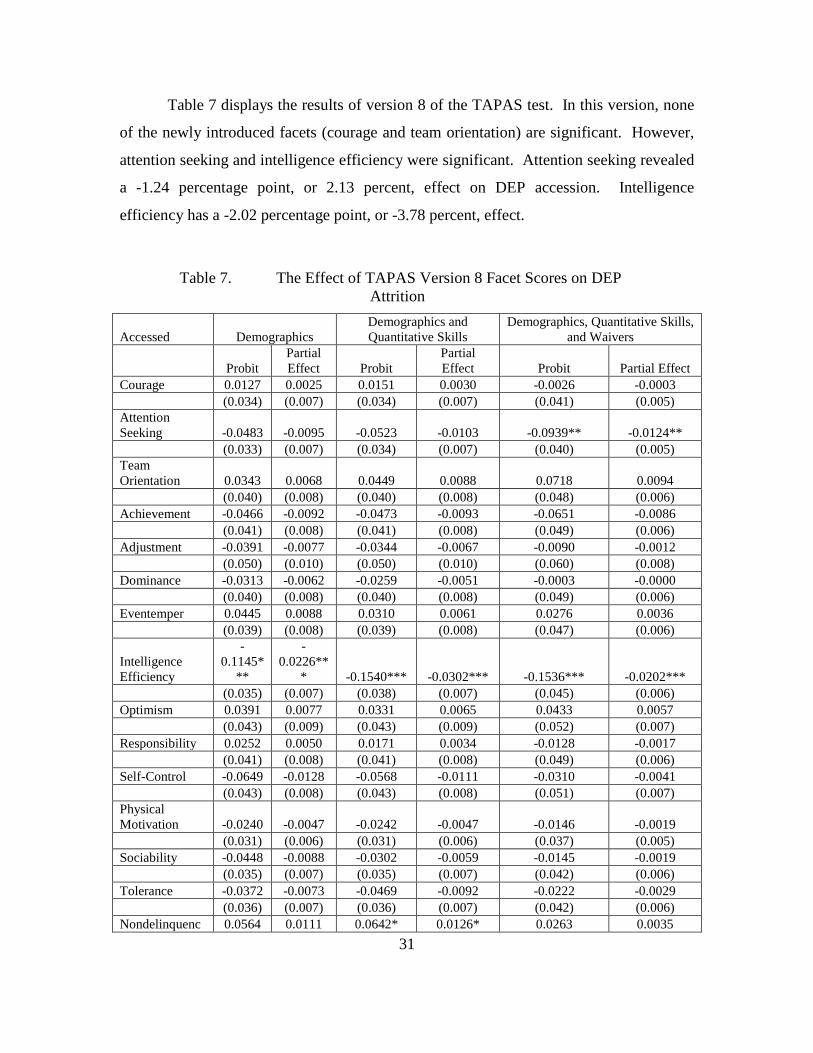
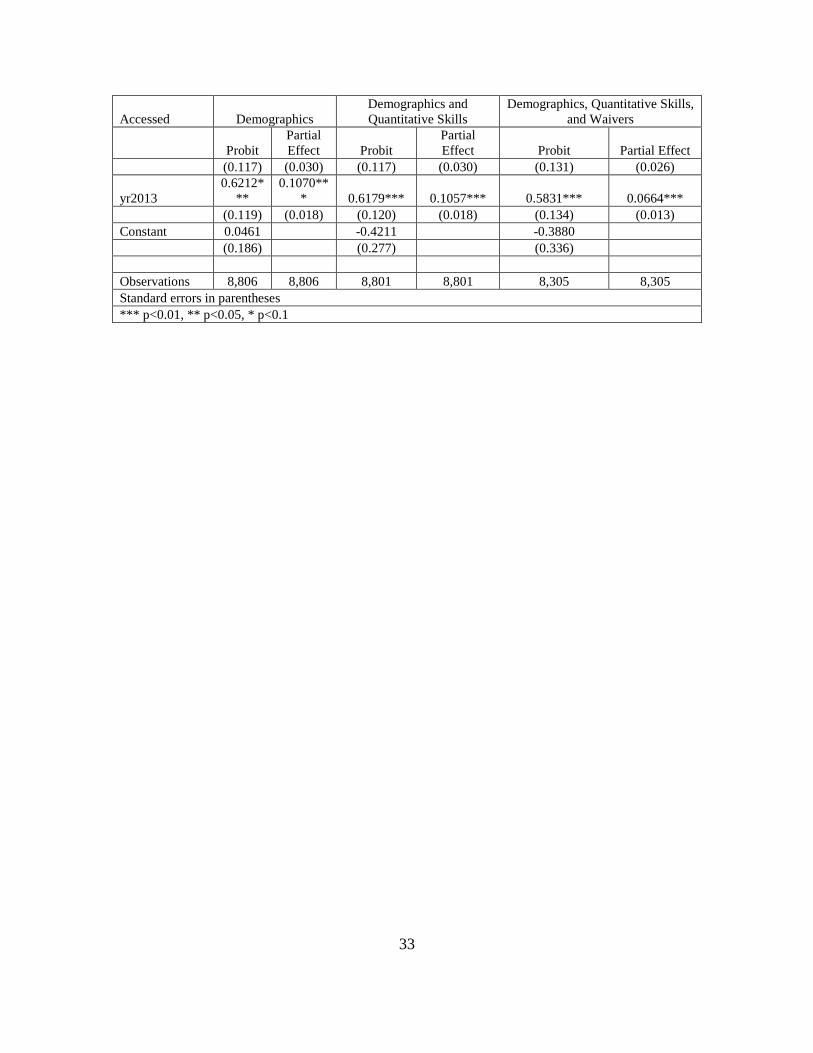
Table 7 displays the results of version 8 of the TAPAS test. In this version, none
of the newly introduced facets (courage and team orientation) are significant. However,
attention seeking and intelligence efficiency were significant. Attention seeking revealed
a -1.24 percentage point, or 2.13 percent, effect on DEP accession. Intelligence
efficiency has a -2.02 percentage point, or -3.78 percent, effect.
Table 7. The Effect of TAPAS Version 8 Facet Scores on DEP Attrition
Accessed Demographics Demographics and Quantitative Skills
Demographics, Quantitative Skills, and Waivers
Probit Partial Effect Probit
Partial Effect Probit Partial Effect
Courage 0.0127 0.0025 0.0151 0.0030 -0.0026 -0.0003 (0.034) (0.007) (0.034) (0.007) (0.041) (0.005) Attention Seeking -0.0483 -0.0095 -0.0523 -0.0103 -0.0939** -0.0124** (0.033) (0.007) (0.034) (0.007) (0.040) (0.005) Team Orientation 0.0343 0.0068 0.0449 0.0088 0.0718 0.0094 (0.040) (0.008) (0.040) (0.008) (0.048) (0.006) Achievement -0.0466 -0.0092 -0.0473 -0.0093 -0.0651 -0.0086 (0.041) (0.008) (0.041) (0.008) (0.049) (0.006) Adjustment -0.0391 -0.0077 -0.0344 -0.0067 -0.0090 -0.0012 (0.050) (0.010) (0.050) (0.010) (0.060) (0.008) Dominance -0.0313 -0.0062 -0.0259 -0.0051 -0.0003 -0.0000 (0.040) (0.008) (0.040) (0.008) (0.049) (0.006) Eventemper 0.0445 0.0088 0.0310 0.0061 0.0276 0.0036 (0.039) (0.008) (0.039) (0.008) (0.047) (0.006)
Intelligence Efficiency
-0.1145*
**
-0.0226**
* -0.1540*** -0.0302*** -0.1536*** -0.0202*** (0.035) (0.007) (0.038) (0.007) (0.045) (0.006) Optimism 0.0391 0.0077 0.0331 0.0065 0.0433 0.0057 (0.043) (0.009) (0.043) (0.009) (0.052) (0.007) Responsibility 0.0252 0.0050 0.0171 0.0034 -0.0128 -0.0017 (0.041) (0.008) (0.041) (0.008) (0.049) (0.006) Self-Control -0.0649 -0.0128 -0.0568 -0.0111 -0.0310 -0.0041 (0.043) (0.008) (0.043) (0.008) (0.051) (0.007) Physical Motivation -0.0240 -0.0047 -0.0242 -0.0047 -0.0146 -0.0019 (0.031) (0.006) (0.031) (0.006) (0.037) (0.005) Sociability -0.0448 -0.0088 -0.0302 -0.0059 -0.0145 -0.0019 (0.035) (0.007) (0.035) (0.007) (0.042) (0.006) Tolerance -0.0372 -0.0073 -0.0469 -0.0092 -0.0222 -0.0029 (0.036) (0.007) (0.036) (0.007) (0.042) (0.006) Nondelinquenc 0.0564 0.0111 0.0642* 0.0126* 0.0263 0.0035
31

Accessed Demographics Demographics and Quantitative Skills
Demographics, Quantitative Skills, and Waivers
Probit Partial Effect Probit
Partial Effect Probit Partial Effect
y (0.036) (0.007) (0.037) (0.007) (0.044) (0.006) AFQT Score
0.0038*** 0.0008*** 0.0038*** 0.0005***
(0.001) (0.000) (0.001) (0.000) HS Graduate
0.5287*** 0.1209*** 0.5366*** 0.0868**
(0.178) (0.046) (0.203) (0.039) HS Student
0.3294* 0.0565** 0.2900 0.0331
(0.184) (0.027) (0.210) (0.021) College
0.5696*** 0.0817*** 0.5197** 0.0486***
(0.192) (0.019) (0.220) (0.014) Alcohol Waiver
-0.2243 -0.0346
(0.178) (0.032) Drug Waiver
-0.2435 -0.0381
(0.194) (0.035) Medical Waiver
0.0595 0.0081
(0.074) (0.010) Traffic Waiver
-0.3736** -0.0636**
(0.146) (0.031) Nontraffic Waiver
-0.2511 -0.0395
(0.189) (0.035)
Female
-0.2312*
**
-0.0488**
* -0.2158*** -0.0450*** -0.1913*** -0.0270*** (0.041) (0.009) (0.042) (0.009) (0.050) (0.007) Married 0.1340* 0.0246* 0.1534* 0.0277** 0.0681 0.0086 (0.078) (0.013) (0.079) (0.013) (0.096) (0.012) Age 0.0095 0.0019 -0.0054 -0.0011 0.0037 0.0005 (0.007) (0.001) (0.008) (0.001) (0.009) (0.001)
Days in DEP 0.0021*
** 0.0004**
* 0.0022*** 0.0004*** 0.0021*** 0.0003*** (0.000) (0.000) (0.000) (0.000) (0.000) (0.000)
Black 0.1122*
* 0.0211** 0.1510*** 0.0277*** 0.1541** 0.0186** (0.056) (0.010) (0.058) (0.010) (0.070) (0.008)
Asian 0.4358*
** 0.0669**
* 0.4357*** 0.0663*** 0.2937** 0.0315*** (0.116) (0.013) (0.116) (0.013) (0.134) (0.011) Hispanic -0.0095 -0.0019 0.0004 0.0001 -0.0010 -0.0001 (0.051) (0.010) (0.051) (0.010) (0.062) (0.008) Other Race 0.0028 0.0006 0.0127 0.0025 -0.0225 -0.0030 (0.047) (0.009) (0.047) (0.009) (0.056) (0.007) No Race Response -0.1079 -0.0226 -0.1144 -0.0239 -0.2023 -0.0307 (0.138) (0.031) (0.138) (0.031) (0.155) (0.027)
yr2012 0.6797*
** 0.1538**
* 0.6982*** 0.1575*** 0.8089*** 0.1322***
32
Accessed Demographics Demographics and Quantitative Skills
Demographics, Quantitative Skills, and Waivers
Probit Partial Effect Probit
Partial Effect Probit Partial Effect
(0.117) (0.030) (0.117) (0.030) (0.131) (0.026)
yr2013 0.6212*
** 0.1070**
* 0.6179*** 0.1057*** 0.5831*** 0.0664*** (0.119) (0.018) (0.120) (0.018) (0.134) (0.013) Constant 0.0461
-0.4211
-0.3880
(0.186)
(0.277)
(0.336)
Observations 8,806 8,806 8,801 8,801 8,305 8,305 Standard errors in parentheses *** p<0.01, ** p<0.05, * p<0.1
33

THIS PAGE INTENTIONALLY LEFT BLANK
34

V. CONCLUSIONS AND RECOMMENDATIONS
A. CONCLUSIONS
This thesis examined whether or not TAPAS composite and facet scores predict
DEP attrition for Navy recruits that took the TAPAS test between March 2011 and March
2013. Using probit regression analysis, and controlling for demographics, quantitative
skills, and waivers, the main findings revealed several traits as significant predictors of a
recruit’s successful accession out of the DEP.
After controlling for demographics, quantitative skills, and waivers, the TAPAS
composite scores are found to not be significant predictors of DEP attrition behavior,
therefore not adding any additional screening information to that offered by schooling
and AFQT scores. Probit coefficients on schooling and AFQT, after controlling for
demographics and waivers, show that higher AFQT scores and higher education
significantly increases the probability a recruit will access from the DEP to initial recruit
training. Additionally, waivers consistently proved to be significant predictors of DEP
attrition.
However, individual TAPAS facets, namely dominance, intellectual efficiency,
and order were consistently found to be significant predictors of DEP attrition for Navy
recruits. In version 7 of the TAPAS test, which included facets specifically designed to
test for attrition behavior, facets adventure seeking and situational awareness were highly
significant in predicting DEP attrition, while facet commitment to serve was the only
positive predictor, albeit of weak significance after controlling for waivers.
The largest single TAPAS predictor of DEP attrition is the dominance facet. This
trait identifies recruits who have a propensity to “take charge” and are “natural leaders”
(Drasgow et al., 2012). Recruits scoring high in the dominance facet may view waiting
to go to initial recruit training as a passive option, thereby opting to take action and make
another employment decision where they feel more in control. Another view is that
dominance is an unwanted personality characteristic for a Navy recruit. Having this type
of personality may make them more disdainful of authority figures. In this case, this
35

analysis is highlighting “good” attrition characteristics. These are the recruits the Navy
wants to attrite in DEP, before more money and resources are wasted once they enter the
training pipeline.
Another significant TAPAS facet predicting DEP attrition is intellectual
efficiency. Intellectual efficiency characterizes individuals that “make decisions quickly”
and are analytical in nature (Drasgow et al., 2012). Recruits scoring high in this facet
might be at a higher risk of attriting from DEP because they have time after the initial
enlistment decision to reconsider their choice to enlist. The individual may also feel they
made a decision too quickly without having a clear understanding of their future job in
the Navy.
The TAPAS facet order is also a significant predictor of DEP attrition behavior.
Order describes individuals that “tend to organize tasks and activities” and “desire to
maintain neat and clean surroundings” (Drasgow et al., 2012). These individuals may not
be able to tolerate waiting in DEP for long periods of time because they are more
accustomed to working by a schedule. They may leave DEP because the program is not
structured enough for them.
B. RECOMMENDATIONS
Can TAPAS scores predict DEP attrition beyond the traditional screening
variables used, such as schooling and AFQT?
1. Based on the findings on dominance, Commander, Naval Recruiting Command (CNRC) could consider implementing a policy where recruiters in charge of DEP pools are notified of individuals who score high in the dominance facet. This policy would enable recruiters to appoint these recruits to positions of authority within the DEP pool that best aligns with their personalities.
2. Based on the findings on intellectual efficiency, CNRC could consider implementing a policy that reduces the time spent in DEP for recruits scoring high in this facet. If this is not feasible, another option CNRC could consider is encouraging recruiters to interact more with these recruits and quickly provide them with as much information on their job choice as possible so the individual can be sure he or she made an informed decision.
36
3. Based on the findings on order, CNRC could direct local recruiters to develop a detailed monthly DEP activity schedule with both mandatory and optional events. This would be useful to all DEP recruits, and those with high order scores could organize and plan their routines around a known, set schedule of events while waiting to access to basic training.
4. The unique facets in TAPAS versions 7 and 8 should be evaluated more to better understand their predictive abilities for attrition behavior. As time progresses and more DEP attrition decision data are available, further research should be focused on these test versions and their five distinctive facets. Additionally, TAPAS developers, MEPCOM, CNRC, and researchers could work together to further revise these specialty facets.
5. Further research should be commissioned to investigate the predictive power of conduct and non-conduct waivers on DEP attrition. Although these waivers are observed to be significant in this analysis, further research should be conducted to validate this premise.
6. Understanding why some recruits attrite from DEP and others go on to basic training is critical if the Navy desires to lower recruiting costs. Employing TAPAS as a selection tool may aid decision makers in their efforts to identify recruits that are more likely to attrite earlier in the application process. Because attrition is a significant cost to recruiting, it would be beneficial to continue observing these recruits throughout basic training and their first-term to determine what is the long range predictive power of the TAPAS test. Non-cognitive skills and abilities are difficult to measure accurately and completely. Further research must be conducted on this subject to ensure the Navy is receiving the most accurate and complete information on its recruits. The TAPAS test should continually be reevaluated and updated to ensure it is providing the best and most precise depiction of the non-cognitive abilities of future sailors.
37

THIS PAGE INTENTIONALLY LEFT BLANK
38

LIST OF REFERENCES
Baykiz, M. S. (2007). An analysis of the Marine Corps delayed entry program (DEP) attrition by high school graduates and high school seniors (Master’s thesis), 19–24. Retrieved from Defense Technical Information Center website: http://www.dtic.mil/dtic/tr/fulltext/u2/a467132.pdf.
Bruno, M. G. (2005). Analysis of recruit attrition from the U.S. Marine Corps delayed entry program (Master’s thesis). Retrieved from Calhoun, the institutional archive for Naval Postgraduate School: http://hdl.handle.net/10945/2003.
Buddin, R. J. (2005). Success of first-term soldiers. Santa Monica, CA: RAND, 28–29.
Commander, Navy Recruiting Command (2011a). Navy recruiting manual-enlisted COMNAVCRUITCOMINST 1130.8J Volume II. Millington, TN: Author.
Commander, Navy Recruiting Command(2011b). Navy recruiting manual-enlisted COMNAVCRUITCOMINST 1130.8J Volume III. Millington, TN: Author.
Cooke, T. W. & Quester, A. O. (1988). Who stays and who leaves? Identifying successful Navy recruits. Alexandria, VA: Center for Naval Analyses.
Drasgow, F., Stark, S., Chernyshenko, O. S., Nye, C. D., Hulin, C. L., & White, L. A. (2012). Development of the tailored adaptive personality assessment system (TAPAS) to support Army selection and classification decisions (Technical Report 1311). Urbana, IL: Drasgow Consulting Group.
Fahrman, J. K. (2013). Evaluating the Tailored Adaptive Personality Assessment System on Navy Recruits. (Master’s thesis). Retrieved from Calhoun, the institutional archive for Naval Postgraduate School: http://hdl.handle.net/10945/39528.
Golfin, P. A. (2002). Delayed entry program (DEP) management in the 21st century: How effective was the Navy’s cyber DEP website? Alexandria, VA: Center for Naval Analyses.
Greenamyer, D. G. (2009). Study of enlistment test scores and other attrition factors from the Navy’s delayed entry program (Master’s thesis). Retrieved from Calhoun, the institutional archive for Naval Postgraduate School: http://hdl.handle.net/10945/4870.
Knapik, J. J., Jones, B. H., Hauret, K., Darakjy, S., & Piskator, E. (2004). A review of the literature on attrition from the military services: Risk factors for attrition and strategies to reduce attrition (12-HF-01Q9A-04). Aberdeen Proving Ground, MD: U.S. Army Center for Health Promotion and Preventive Medicine, 44–46.
39
Lane, M. E. (2006). Predictors of attrition from the U.S. Navy delayed entry program. Research Triangle Park, NC: RTI International, 3.
Lane, M.E., Johns, C. W., White, M. A., & Eshwar, N. C. (2006). Delayed entry program attrition survey results (NPRST-TN-06-6). Millington, TN: Naval Personnel Research, Studies, and Technology Division, Bureau of Naval Personnel
Lockman, R. F. & Warner, J. T. (1977). Predicting attrition: A test of alternative approaches. Alexandria, VA: Center for Naval Analyses, 11.
Nakada, M. K. (1994). Delayed entry program (DEP) attrition: Recruits, recruiters, contracts, and economics (TR-95-3). San Diego, CA: Navy Personnel Research and Development Center, 18.
Neuhalfen, J. K. (2007). Analysis of recruit attrition from the Navy’s delayed entry program and recruit training command (Master’s thesis), 12–14. Retrieved from Calhoun, the institutional archive for Naval Postgraduate School: http://hdl.handle.net/10945/3152.
Ogren, M. A. (1999). Delayed entry program attrition: A multivariate analysis. (Master’s thesis), 37. Retrieved from Calhoun, the institutional archive for Naval Postgraduate School: http://hdl.handle.net/10945/13545.
Pema, E., Fahrman, J., Mehay, S., & Tick S. (2013). Evaluation of the tailored adaptive personality assessment system (TAPAS) using data on Navy recruits. Unpublished manuscript, Naval Postgraduate School, Monterey, CA, 44–46.
Simpson, P. G. (1997). Optimal recruiting strategy to minimize U.S. Navy delayed entry program (DEP) attrition (Master’s thesis). Retrieved from Calhoun, the institutional archive for Naval Postgraduate School: http://hdl.handle.net/10945/8782.
Thompson, E. L. (2011). The effect of state unemployment rate on attrition for first-term U.S. Navy enlisted personnel (Master’s thesis). Retrieved from Calhoun, the institutional archive for Naval Postgraduate School: http://hdl.handle.net/10945/5744.
Wegner, J. W. & Hodari A. K. (2004). Predictors of attrition: Attitudes, behaviors, and educational characteristics. Alexandria, VA: Center for Naval Analyses, 4–5.
40

INITIAL DISTRIBUTION LIST
1. Defense Technical Information Center Ft. Belvoir, Virginia 2. Dudley Knox Library Naval Postgraduate School Monterey, California
41