evaluating the snow crystal size distribution and density
TRANSCRIPT

Evaluating the Snow Crystal Size Distribution and Density Assumptions withina Single-Moment Microphysics Scheme
ANDREW L. MOLTHAN AND WALTER A. PETERSEN
NASA Marshall Space Flight Center, Huntsville, Alabama
STEPHEN W. NESBITT
Department of Atmospheric Sciences, University of Illinois at Urbana–Champaign, Urbana, Illinois
DAVID HUDAK
Environment Canada, King City, Ontario, Canada
(Manuscript received 4 May 2010, in final form 29 June 2010)
ABSTRACT
The Canadian CloudSat/Cloud–Aerosol Lidar and Infrared Pathfinder Satellite Observations (CALIPSO)
Validation Project (C3VP) was a field campaign designed to obtain aircraft, surface, and radar observations of
clouds and precipitation in support of improving the simulation of snowfall and cold season precipitation,
their microphysical processes represented within forecast models, and radiative properties relevant to re-
motely sensed retrievals. During the campaign, a midlatitude cyclone tracked along the U.S.–Canadian
border on 22 January 2007, producing an extensive area of snowfall. Observations of ice crystals from this
event are used to evaluate the assumptions and physical relationships for the snow category within the
Goddard six-class, single-moment microphysics scheme, as implemented within the Weather Research and
Forecasting (WRF) model.
The WRF model forecast generally reproduced the precipitation and cloud structures sampled by radars
and aircraft, permitting a comparison between C3VP observations and model snowfall characteristics. Key
snowfall assumptions in the Goddard scheme are an exponential size distribution with fixed intercept and
effective bulk density, and the relationship between crystal diameter and terminal velocity. Fixed values for
the size distribution intercept and density did not represent the vertical variability of naturally occurring
populations of aggregates, and the current diameter and fall speed relationship underestimated terminal
velocities for all sizes of crystals.
1. Introduction
As computational resources continue to grow, weather
forecast models are transitioning to the use of parame-
terizations that predict the evolution of hydrometeors and
their microphysical processes. Currently, the National
Centers for Environmental Prediction (NCEP) utilize the
Nonhydrostatic Mesoscale Model (NMM) version of the
Weather Research and Forecasting (WRF) model (Janjic
2001, 2003) as one of their forecast tools for weather pre-
diction throughout North America. In support of forecast
model research and test bed efforts, high-resolution WRF
model forecasts have been produced, focusing on forecasts
of severe convection (Kain et al. 2003) and the prediction
of winter storms (Bernardet et al. 2008). Numerous mi-
crophysics schemes are available within the WRF model as
of version 3.2, ranging from early single-moment schemes
designed for the prediction of warm rain processes
(Kessler 1969) to schemes that include a single-moment
characterization of varying numbers of ice classes (Lin
et al. 1983; Hong et al. 2004; W.-K. Tao et al. 2008,
personal communication; Thompson et al. 2008), and the
inclusion of two double-moment schemes to improve
the representation of particle number concentrations
(Milbrandt and Yau 2005; Morrison et al. 2009). Many
of these schemes incorporate relationships based upon
observations obtained during aircraft field campaigns,
Corresponding author address: Andrew L. Molthan, NASA
Marshall Space Flight Center, 320 Sparkman Dr., Huntsville, AL
35805.
E-mail: [email protected]
4254 M O N T H L Y W E A T H E R R E V I E W VOLUME 138
DOI: 10.1175/2010MWR3485.1
� 2010 American Meteorological Society

relating size distributions and other properties to ambient
temperature (Hong et al. 2004; Thompson et al. 2008).
Common to all schemes are assumptions or parame-
terizations to characterize the properties of hydrome-
teor size distributions, their bulk densities, and their
terminal fall speeds. Lin et al. (1983) and Rutledge and
Hobbs (1984) developed equations for the prediction
of up to six mixing ratios (qx) representing water mass:
vapor, cloud ice, cloud water, snow (qs), rain, and graupel
or hail. Although cloud water droplets and cloud ice crys-
tals were assumed to be monodisperse, the rain, snow, and
graupel categories were prescribed an exponential size
distribution:
Nx(D) 5 N
oxe�l
xD, (1)
where the number concentration of a hydrometeor with
diameter D, Nx(D), is determined as a function of the
size distribution intercept Nox and slope parameter lx.
The total mass within the particle size distribution
depends upon the relationship between mass and diameter.
Herein, discussion will emphasize various assumptions re-
lated to the snow category. Locatelli and Hobbs (1974)
determined relationships between crystal diameter and
mass in a power-law form:
M(D)5 am
Dbm , (2)
where values of bm averaged around 2 for unrimed ag-
gregates, suggesting that mass was related to the cross-
sectional area. Rimed crystals tended to have a greater
amount of mass within the same cross-sectional area,
resulting in larger values of am for relatively small changes
in bm. Populations of crystals can be characterized by their
effective bulk density, or the ratio of the total particle
mass to the total volume of all equivalent diameter
spheres. The effective bulk density of a crystal population
has been related to the slope parameter of their best-fit,
exponential size distribution (Heymsfield et al. 2004). Lin
et al. (1983) represented snow crystals by spheres, where
the mass of a single particle in (2) is the product of rs and
its spherical volume, or am 5 (p/6)rs and bm 5 3. By in-
tegrating the product of (1) and (2) to obtain the total
mass within the population (qsra), the slope of the dis-
tribution ls can be isolated in terms of the distribution
intercept Nos and a constant effective bulk density:
ls5
Nos
prs
qsr
a
� �1/4
. (3)
When Nos and rs are fixed, variability in ls will be de-
termined only by changes in the snow content. In the
exponential size distribution, the arithmetic mean size is
equal to ls21, implying that increases (decreases) in
mean particle size will be limited to regions where snow
content increases (decreases).
The fall speeds of individual crystals are determined
by a power-law relationship between terminal velocity
and diameter, following Locatelli and Hobbs (1974), with
a correction factor that allows for an increase in fall speed
as air density decreases (Heymsfield 1973):
V(D) 5 ayDb
y
ro
r
� �1/2
, (4)
where ro represents the air density at the surface, and
r the local air density surrounding the falling crystals.
Values of ay and by vary by crystal habit and degree of
riming (Locatelli and Hobbs 1974). The integrated prod-
uct of (1), (2), and (4) determines the mass flux or pre-
cipitation rate. In addition, these relationships determine
the size distribution and fall speeds required for calcula-
tions of accretion rates, since accretion depends upon the
volume swept out by falling crystals and their consump-
tion of other hydrometeors.
The Goddard six-class, single-moment microphysics
scheme incorporates many of the equations developed
by Lin et al. (1983) and Rutledge and Hobbs (1984), and
continues the use of a fixed, exponential size distribution
intercept and effective bulk density. Additional benefits
of the Goddard scheme include an improved representa-
tion of the Bergeron process, noniterative methods for
saturation adjustment, an order of operations that ex-
ecutes all microphysical processes with the same temper-
ature profile, and modified snow and graupel production
processes to reduce high density particles within thunder-
storm anvils (Tao et al. 2003; Lang et al. 2007; W.-K. Tao
et al. 2008, personal communication).
The Goddard scheme can provide additional value by
generating a suite of simulated cloud profiles useful in
the development of satellite-based retrievals of cloud
properties and precipitation rate. Profiles of ice and liquid
water content, combined with accurate size distributions
and fall speeds, will allow for the simulation of passive
microwave brightness temperatures and radar reflectivity
from current sensors (Matsui et al. 2009) and future in-
struments in the National Aeronautics and Space Ad-
ministration (NASA) Global Precipitation Measurement
(GPM) mission. Accurate estimation of ice crystal prop-
erties is key, given the diversity in microwave scattering
among naturally occurring crystal habits (Liu 2004,
2008a). Water vapor and small cloud droplets or ice crys-
tals must also be represented because although they may
not contribute to precipitation, they remain a factor in
estimating signal attenuation and provide additional scat-
tering to remote sensors.
NOVEMBER 2010 M O L T H A N E T A L . 4255

Herein, we present a synthesis of observations of a
widespread snowfall event on 22 January 2007, observed
during the Canadian CloudSat/Cloud–Aerosol Lidar and
Infrared Pathfinder Satellite Observations (CALIPSO)
Validation Project (C3VP). Field campaigns such as C3VP
provide important data required to evaluate the assump-
tions made within the Goddard scheme by measuring par-
ticle size distributions and hydrometeor mass content via
surface and aircraft instruments. Aircraft crystal probe
imagery, measurements of ice water content, and atmo-
spheric state parameters can be compared against Goddard
scheme output to examine the consistency between ob-
served and modeled characteristics of ice microphysics for
this particular event.
2. The Canadian CloudSat/CALIPSO ValidationProject
The C3VP campaign was a multinational collabora-
tion between the CloudSat/CALIPSO and NASA GPM
communities to provide a suite of observations necessary
for the evaluation and improvement of high-resolution
forecast models, which predict the hydrometeor mass
content and precipitation rates of multiple liquid or ice
phase categories (Hudak et al. 2006; Petersen et al. 2007).
Snowfall and cold season precipitation were emphasized
to assist with the development of satellite retrievals for
current and future remote sensors. In this application,
high resolution refers to a horizontal grid spacing (1 km)
comparable to the along-track resolution (1.7 km) of the
94-GHz CloudSat radar. CloudSat was designed for sen-
sitivity to small ice crystals and the capability of detecting
snowfall from space (Liu 2008b). Attenuation of the radar
signal by ice is much less than attenuation by cloud water
or rainfall when water content is minimal (Stephens
et al. 2002). During C3VP, the operational, C-band, dual-
polarimetric radar at King City, Ontario, Canada, was
used in conjunction with a vertically pointing, ground-
based cloud radar to validate CloudSat reflectivity prod-
ucts (Hudak et al. 2008), while also providing additional
detail about cloud microphysical processes. Other rele-
vant satellite sensors include the 89-GHz channel of the
Advanced Microwave Scanning Radiometer for Earth
Observing System (AMSR-E) aboard the NASA Aqua
satellite and the Advanced Microwave Sounding Unit-B
(AMSU-B) aboard National Oceanic and Atmospheric
Administration (NOAA) polar-orbiting satellites. Each
remote sensor samples clouds and precipitation over the
C3VP operational domain.
Radar and satellite observations of precipitation were
supplemented by surface optical disdrometers, measure-
ment of crystal terminal velocities, and a time series of
temperature and liquid equivalent precipitation from an
experimental U.S. Climate Reference Network (USCRN)
site located near Egberg, Ontario, Canada. Campaign
deployments were managed at the Canadian Centre for
Atmospheric Research Experiments (CARE) site in
southeastern Ontario, and included the deployment of
an instrumented Convair-580 aircraft provided by Na-
tional Research Council Canada (NRC Convair-580),
capable of measuring snow crystal size distributions, ice
water content, and atmospheric state data from wing
mounted probes (Fig. 1).
a. Development of precipitation on 22 January 2007
Snowfall during the 22 January 2007 event was gen-
erated by a midlatitude cyclone traveling along the
U.S.–Canadian border between 0000 and 1200 UTC.
The cyclone produced a broad area of snowfall across
southern Ontario, associated with synoptic-scale ascent
to the north of a warm frontal boundary. Precipitation
and cloud cover were sampled by surface instrumen-
tation, upper-air soundings, and aircraft probes, with
structures remotely sensed by the King City and CloudSat
radars. A liquid equivalent accumulation of 2.8 mm was
measured at the USCRN site between 0200 and 0800 UTC,
while surface temperatures during the period were nearly
steady at 298C (Fig. 2).
FIG. 1. Overview of the C3VP operational domain and datasets
used in this study. The crosshair indicates the location of the dual-
polarimetric radar at King City, Ontario, with range rings in 50-km
increments. The heavy dashed line oriented southeast to northwest
is along the 3318 azimuth of range–height scans obtained from the
King City radar. Portions of the aircraft flight track referred to as
the spiral and ascent are color coded and referenced in subsequent
figures and the remainder of the text.
4256 M O N T H L Y W E A T H E R R E V I E W VOLUME 138

Combinations of aircraft data, balloon soundings, and
King City radar reflectivity depict the vertical structure
of temperature, humidity and precipitation during the
event. At 0400 UTC, radar indicated two distinct layers
of cloud and precipitation, separated at an altitude of
4 km (Fig. 3a). Sounding data indicated a layer from the
surface to 4 km that was nearly saturated (supersatu-
rated) with respect to water (ice), a shallow, unsaturated
layer at 4 km, and a third layer from 4 to 6 km where ice
supersaturation was on the order of 10%. A third layer of
ice supersaturation was located near 7 km, but ice in this
layer was not detected by the King City radar. These layers
eventually merged, with intermittent, downward streaks
of enhanced reflectivity suggesting a period of active
seeder-feeder processes (Rutledge and Hobbs 1983)
that likely enhanced precipitation development toward
0600 UTC (Fig. 3b).
By 0600 UTC, the entire vertical column was saturated
(supersaturated) with respect to water (ice), producing
a deep column through which ice crystals could grow by
vapor deposition, accretion, or aggregation (Fig. 3b). Ob-
servations from CloudSat around 0600 UTC indicated
cloud-top altitudes near 7 km, and identified an area of
enhanced precipitation near the CARE site and south-
ernmost portion of the orbital segment, inferred through
an increase in radar reflectivity (Fig. 4). At 0624 UTC,
dual-polarimetric parameters suggested a deep layer
of aggregation in the lowest 2 km, marked by an in-
crease in horizontally polarized radar reflectivity (Fig. 5).
Differential reflectivity decreased sharply across the
2-km level as individual, horizontally oriented crystals
transitioned to larger aggregates with irregular shapes
and no preferred orientation. As the cyclone departed
and synoptic-scale forcing waned, cloud depths were re-
duced to 3 km or less, and precipitation rates decreased
(Fig. 3c).
b. Aircraft vertical profiles
As part of the 22 January 2007 intensive observing
period, the NRC Convair-580 sampled clouds and pre-
cipitation in the vicinity of the King City radar, the
CloudSat flight track, and CARE site instrumentation
(Fig. 1). Previous studies have demonstrated that the pa-
rameters of an exponential size distribution evolve from
cloud top to cloud base, and are often related to temper-
ature as small crystals collide and aggregate (Houze et al.
1979; Lo and Passarelli 1982; Heymsfield et al. 2002; Field
and Heymsfield 2003; Heymsfield et al. 2007). This anal-
ysis focuses on two profiles: a descending aircraft spiral
obtained in the vicinity of the CARE site, and the as-
cending departure from the CARE site on an east-
southeast heading (Fig. 1). Although some previous
studies have incorporated Lagrangian spirals (Lo and
Passarelli 1982), the spiral described here descended at
a rate of 3–5 m s21, sampling the broad characteristics of
crystal populations over the CARE site instrumentation.
Combined, the two profiles include observations between
0600 and 0700 UTC, but are assumed to be broadly rep-
resentative of precipitation that occurred during the hour,
as King City radar observations indicated little change in
the coverage or intensity of precipitation during the same
time period. Although crystal probe imagery, radar sam-
pling, and the aircraft vertical profiles of temperature and
moisture were obtained at slightly different time periods
and locations, qualitative comparisons are justified by the
steady-state nature of the precipitation shield.
The aircraft was equipped with Particle Measuring
Systems (PMS) 2D-C (15 mm20.96 mm) and 2D-P (0.2–
6.4 mm) probes capable of measuring crystal diameters
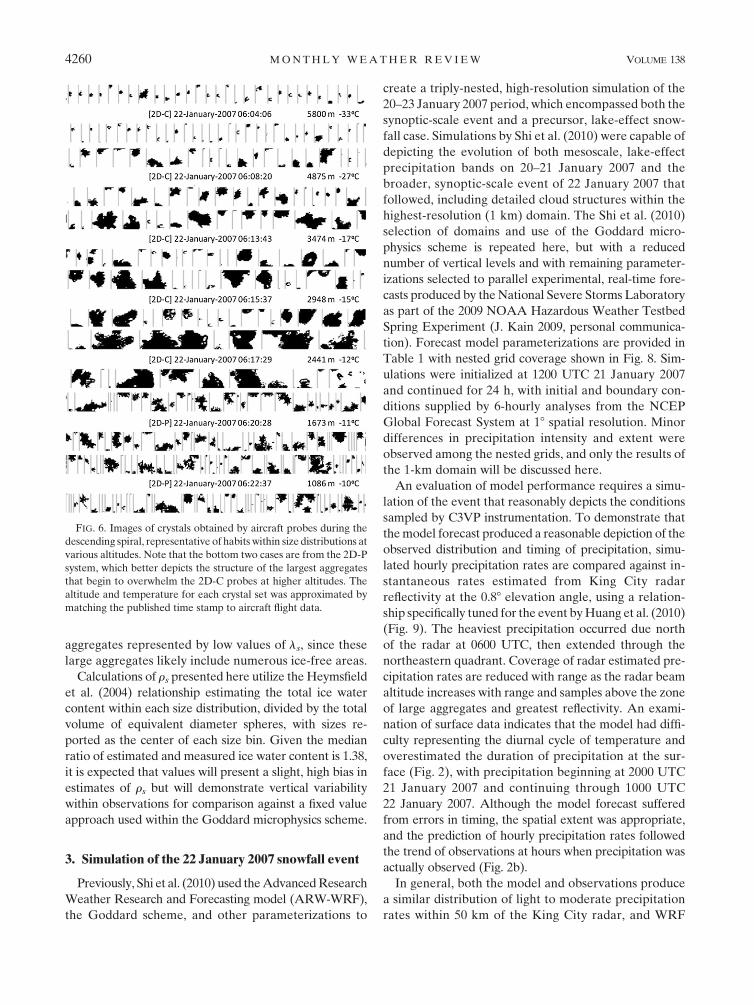
and number concentrations. During the descending air-
craft spiral, crystal probe imagery indicated that aggregates
were present throughout the bulk of the vertical column,
appearing at temperatures as cold as 2278C (Fig. 6). Air-
craft spiral data obtained approximately 35 km northwest
of the King City radar indicate a rapid increase in aggre-
gate size near the 3-km level, coincident with a marked
increase in horizontally polarized radar reflectivity and
transition to lower values of differential reflectivity (Fig. 5).
Aircraft probes sampled an environment that was satu-
rated with respect to water and with ambient temperature
of approximately 2128C, supportive of branched crystal
development, growth, and aggregation (Pruppacher and
FIG. 2. Comparison of the modeled and observed (top) pre-
cipitation rates and (bottom) 2-m air temperature during the
24-h forecast period. Analysis of precipitation rates include a
modified accumulation compensating for model timing errors
(ADJ) by integrating model accumulated precipitation only be-
yond 0200 UTC.
NOVEMBER 2010 M O L T H A N E T A L . 4257
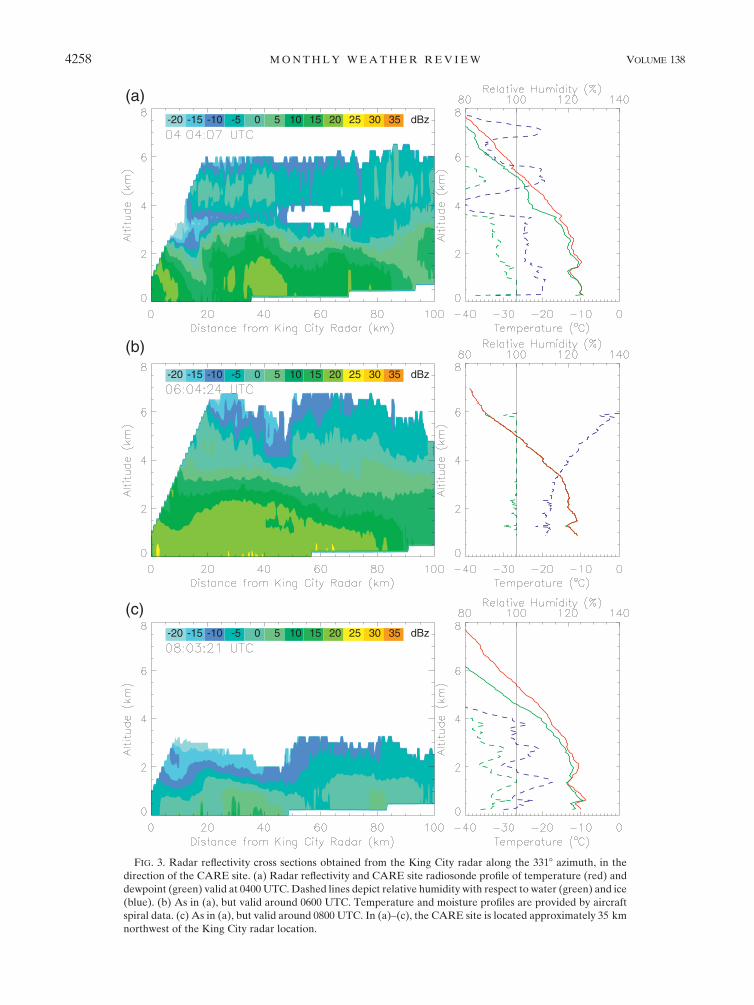
FIG. 3. Radar reflectivity cross sections obtained from the King City radar along the 3318 azimuth, in the
direction of the CARE site. (a) Radar reflectivity and CARE site radiosonde profile of temperature (red) and
dewpoint (green) valid at 0400 UTC. Dashed lines depict relative humidity with respect to water (green) and ice
(blue). (b) As in (a), but valid around 0600 UTC. Temperature and moisture profiles are provided by aircraft
spiral data. (c) As in (a), but valid around 0800 UTC. In (a)–(c), the CARE site is located approximately 35 km
northwest of the King City radar location.
4258 M O N T H L Y W E A T H E R R E V I E W VOLUME 138

Klett 1978). The deep layer of water (ice) saturation
(supersaturation) likely encouraged some riming of
crystals and enhanced the development of crystal ag-
gregates, but digital photographs of crystals at the
surface indicated that any riming that occurred was
light, and did not shroud the entire crystalline structure
(Petersen et al. 2007).
Imagery from crystal probes were converted to ice crys-
tal size distributions and postprocessed by A. Heymsfield,
accommodating the overlap in the size ranges of the 2D-C
and 2D-P systems and eliminating the effects of shattered
crystals, which are detrimental to the calculation of size
distribution parameters (Heymsfield et al. 2008). The re-
sulting size distributions were available in 5-s increments
of aircraft flight time. The moment fitting method of
Heymsfield et al. (2002) was used to estimate the inter-
cept Nos and slope ls of an exponential size distribution,
based on calculations of the first and second moments of
the observed size distributions. To focus on the highest-
quality data, moment-fit estimates of Nos and ls were only
retained herein if they produced a fitted size distribution
that was strongly correlated to observations (R2 $ 0.8).
Although threshold values of R2 have varied in other
studies from 0.6 (Heymsfield 2003) to 0.8 (Heymsfield
et al. 2004), the value of R2 $ 0.8 was used here to com-
pare model assumptions against the highest-quality data.
c. Calculation of snow bulk density
Within the Goddard scheme, the mass–diameter re-
lationship for a population of spherical crystals is de-
scribed in terms of a fixed, effective bulk density, which
defaults to rs 5 100 kg m23. Heymsfield et al. (2004)
described a technique to obtain an effective population
bulk density (re) based upon aircraft measurement of ice
water content and the total volume of spheres repre-
sented within a given size distribution. The mass–diameter
relationship of Heymsfield et al. (2004) was used to calcu-
late the total ice water content from sampled populations
of ice crystals, where am 5 0.077 kg m�bm and bm 5 2.05,
a relationship obtained from a large number of aircraft
samplings within convectively driven cirrus and strati-
form ice clouds.
Estimates from the Heymsfield et al. (2004) relation-
ship can be checked against observations by examining
the ratio of calculated ice water content to counterflow
virtual impactor (CVI; Twohy et al. 1997) measurements
obtained aboard the NRC Convair-580. Pairs of calcu-
lated and measured ice water content indicate that the
calculated ice water content (IWC) often exceeds the
CVI measurement, with the resulting scatterplot sug-
gesting that the best fit occurs for measured and calcu-
lated values between 0.01 and 0.2 g m23 (Fig. 7a). Ratios
were binned at intervals of 20%, resulting in a right-
skewed distribution with a median of 1.38 and standard
deviation of 0.93 (Fig. 7b). The clustering of ice water
content ratios between 0.8 and 1.2 is appropriate, given
the use of a fixed mass–diameter relationship and CVI
errors of 11% (23%) for condensed total water contents
of 0.2 g m23 (0.01 g m23) as reported by Heymsfield
et al. (2005). The greatest ice water contents measured
by the CVI were obtained in the lowest 1–2 km of the
aircraft profile and from large aggregates, which differ
from the smaller particles of cirrus and ice clouds that
are best represented by the Heymsfield et al. (2004)
relationship. The Heymsfield et al. (2004) relationship
is applied to volumes dominated by large diameter
FIG. 4. CloudSat radar reflectivity profiles of snowfall occurring
across the C3VP operational domain around 0600 UTC 22 Jan
2007. Observations are taken from the orbital segment in Fig. 1.
FIG. 5. Cross sections of (a) horizontally polarized radar re-
flectivity and (b) differential reflectivity, obtained from the King
City radar at 0624 UTC along the 3318 azimuth, in the direction of
the CARE site. The approximate location of the aircraft spiral is
indicated in (a) and (b).
NOVEMBER 2010 M O L T H A N E T A L . 4259
aggregates represented by low values of ls, since these
large aggregates likely include numerous ice-free areas.
Calculations of rs presented here utilize the Heymsfield
et al. (2004) relationship estimating the total ice water
content within each size distribution, divided by the total
volume of equivalent diameter spheres, with sizes re-
ported as the center of each size bin. Given the median
ratio of estimated and measured ice water content is 1.38,
it is expected that values will present a slight, high bias in
estimates of rs but will demonstrate vertical variability
within observations for comparison against a fixed value
approach used within the Goddard microphysics scheme.
3. Simulation of the 22 January 2007 snowfall event
Previously, Shi et al. (2010) used the Advanced Research
Weather Research and Forecasting model (ARW-WRF),
the Goddard scheme, and other parameterizations to
create a triply-nested, high-resolution simulation of the
20–23 January 2007 period, which encompassed both the
synoptic-scale event and a precursor, lake-effect snow-
fall case. Simulations by Shi et al. (2010) were capable of
depicting the evolution of both mesoscale, lake-effect
precipitation bands on 20–21 January 2007 and the
broader, synoptic-scale event of 22 January 2007 that
followed, including detailed cloud structures within the
highest-resolution (1 km) domain. The Shi et al. (2010)
selection of domains and use of the Goddard micro-
physics scheme is repeated here, but with a reduced
number of vertical levels and with remaining parameter-
izations selected to parallel experimental, real-time fore-
casts produced by the National Severe Storms Laboratory
as part of the 2009 NOAA Hazardous Weather Testbed
Spring Experiment (J. Kain 2009, personal communica-
tion). Forecast model parameterizations are provided in
Table 1 with nested grid coverage shown in Fig. 8. Sim-
ulations were initialized at 1200 UTC 21 January 2007
and continued for 24 h, with initial and boundary con-
ditions supplied by 6-hourly analyses from the NCEP
Global Forecast System at 18 spatial resolution. Minor
differences in precipitation intensity and extent were
observed among the nested grids, and only the results of
the 1-km domain will be discussed here.
An evaluation of model performance requires a simu-
lation of the event that reasonably depicts the conditions
sampled by C3VP instrumentation. To demonstrate that
the model forecast produced a reasonable depiction of the
observed distribution and timing of precipitation, simu-
lated hourly precipitation rates are compared against in-
stantaneous rates estimated from King City radar
reflectivity at the 0.88 elevation angle, using a relation-
ship specifically tuned for the event by Huang et al. (2010)
(Fig. 9). The heaviest precipitation occurred due north
of the radar at 0600 UTC, then extended through the
northeastern quadrant. Coverage of radar estimated pre-
cipitation rates are reduced with range as the radar beam
altitude increases with range and samples above the zone
of large aggregates and greatest reflectivity. An exami-
nation of surface data indicates that the model had diffi-
culty representing the diurnal cycle of temperature and
overestimated the duration of precipitation at the sur-
face (Fig. 2), with precipitation beginning at 2000 UTC
21 January 2007 and continuing through 1000 UTC
22 January 2007. Although the model forecast suffered
from errors in timing, the spatial extent was appropriate,
and the prediction of hourly precipitation rates followed
the trend of observations at hours when precipitation was
actually observed (Fig. 2b).
In general, both the model and observations produce
a similar distribution of light to moderate precipitation
rates within 50 km of the King City radar, and WRF
FIG. 6. Images of crystals obtained by aircraft probes during the
descending spiral, representative of habits within size distributions at
various altitudes. Note that the bottom two cases are from the 2D-P
system, which better depicts the structure of the largest aggregates
that begin to overwhelm the 2D-C probes at higher altitudes. The
altitude and temperature for each crystal set was approximated by
matching the published time stamp to aircraft flight data.
4260 M O N T H L Y W E A T H E R R E V I E W VOLUME 138

model profiles were extracted within a 50-km radius of
the King City radar to provide comparisons to aircraft
data. This selection of model profiles encompasses the
descending spiral and bulk of the departure ascent, the
instrumentation at the CARE site, and provides a large
sample representing the properties of snowfall within
the forecast domain. Output from the model valid time
of 0600 UTC 22 January 2007 is used because it provides
the best temporal fit to the aircraft profiles and the
CloudSat overpass. Spatial patterns of simulated and
observed precipitation varied little through 0700 UTC.
a. Comparisons of model and aircraft verticalprofiles
Conditional mean profiles of hydrometeor content are
used in comparisons, including only the grid points and
vertical levels with nonzero values. The aircraft CVI and
calculated estimates of ice water content indicate discrete
layers of enhanced ice water content approximately
0.25 km thick at altitudes of 1 and 2 km, but these features
were not represented in the forecast mean vertical profile
(Fig. 10a). Radar observations indicated a higher altitude,
distinct cloud layer from 4 to 6 km at 0400 UTC (Fig. 3a),
which could have seeded the layer below and locally en-
hanced the ice water content as these populations con-
tinued to fall. The aircraft temperature profile suggests
that these layers were within regions of conditional in-
stability with embedded convection, but no cellular or
banded structures were apparent in King City radar
imagery, and measurements of vertical velocity were not
available. Layers of increased IWC present in observa-
tions but not within the model mean profile may be the
result of seeder-feeder processes that were not predicted
by the model forecast, occurred on vertical scales that
the combined model dynamics, vertical grid spacing, and
spatial averaging were incapable of representing, or
TABLE 1. Configuration of the Advanced Research WRF model, version 2.2, for simulation of the 22 Jan 2007 snowfall event.
Physical process Parameterization scheme References
Boundary layer Mellor–Yamada–Janjic Janjic (1990, 1996, 2001)
Longwave radiation Rapid radiative transfer Mlawer et al. (1997)
Shortwave radiation Dudhia scheme Dudhia (1989)
Land surface processes Noah land surface model Ek et al. (2003)
Cloud microphysics Goddard scheme W.-K. Tao et al. (2008,
personal communication)
9-km cumulus parameterization Grell–Devenyi scheme Grell and Devenyi (2002)
Saturation adjustment Goddard scheme Tao et al. (2003)
Horizontal grid spacing 9–3–1 km Shi et al. (2010)
Time step 30–10–3 s Shi et al. (2010)
Vertical levels 34 Shi et al. (2010)
FIG. 7. Comparisons of the ice water content measured by the aircraft counterflow virtual impactor probe vs
calculation from particle size distributions and the mass–diameter relationship of Heymsfield et al. (2004), combining
the profiles obtained during the descending spiral and departure ascent. (a) Scatterplot of calculated and measured
total ice water contents. (b) Histogram of the ratio of calculated and measured total ice water content.
NOVEMBER 2010 M O L T H A N E T A L . 4261

represent a mismatch between the evolution of the
simulated storm and processes sampled by the aircraft.
Graupel was not predicted in the vicinity of the CARE
site, in agreement with aircraft observations (Fig. 6),
digital photographs of precipitating crystals (Petersen
et al. 2007), and the results of Shi et al. (2010).
Profiles of temperature and relative humidity with
respect to water or ice were obtained on the WRF model
vertical levels without further interpolation. Large dis-
crepancies occur between the model and aircraft profiles
between 3 and 4 km (Fig. 10b). These differences re-
sulted from the use of the Tao et al. (2003) saturation
adjustment scheme and temperature threshold in this
particular forecast. By applying the threshold at 2158C,
supersaturation with respect to ice was converted to cloud
ice mass, while the sampled environment remained sat-
urated (supersaturated) with respect to water (ice). Sim-
ilarly, any supersaturation with respect to water leads to
additional mass in the cloud water category. Since the
saturation adjustment occurs as a final step within the
microphysics subroutine, this stages the next model time
step with cloud ice and cloud water for advection or ad-
ditional microphysical processes. In this event, no cloud
liquid water was reliably detected by the Rosemount Ice
Detector (RICE) probe.
Although a direct comparison of the forecast cloud liq-
uid water content to observations would suggest a forecast
error, this error could be alleviated by incorporating the
saturation adjustment elsewhere within the flow of the
microphysics subroutine. A similar argument can be made
for the production of cloud ice, but the resulting ice water
content is comparable to observations, whereas liquid
water was not detected. An examination of the model
mean temperature profile reveals a persistent warm bias
throughout the vertical column (Fig. 10c), and a component
of the bias may be the result of excessive deposition during
the saturation adjustment process. The warm bias in tem-
perature may also result from the initial and boundary
conditions, or other simulated physical processes.
FIG. 8. Graphical depiction of the triply nested grids and varying
resolutions used by Shi et al. (2010), and replicated for use in
simulations of the 22 Jan 2007 snowfall event.
FIG. 9. (a) Instantaneous, liquid equivalent precipitation rate estimated from the King City radar at 0600 UTC, based
upon the relationship proposed by Huang et al. (2010) for the event and radar reflectivity at 0.88 elevation angle.
(b) Liquid equivalent, 1-h accumulated precipitation within the model domain, ending at 0600 UTC 22 Jan 2007. Both
(a) and (b) are centered on the location of the King City radar with range rings provided at 50-km intervals.
4262 M O N T H L Y W E A T H E R R E V I E W VOLUME 138

b. Size distribution parameters and snow bulkdensity
Mean profiles of the size distribution slope parameter
were calculated based on (3), the fixed values of the dis-
tribution intercept, and fixed value of effective bulk
density. Each distribution parameter can be compared
against observations from aircraft profiles to determine
if the Goddard scheme assumptions accurately repre-
sent their magnitudes and vertical variability. The use of
a fixed distribution intercept (Nos 5 1.6 3 104 mm21 m23)
does not represent the general increase in Nos with height
(Fig. 11a). Aircraft-measured values span two orders of
magnitude, while the constant value of Nos represents
conditions only near the 3-km level. Profiles obtained
during the C3VP campaign are comparable to previous
field campaigns sampling ice crystals. Houze et al. (1979)
and Heymsfield et al. (2002) have demonstrated vari-
ability in Nos with temperature or altitude, although
functional relationships vary among events. Except near
the cloud top, estimates of rs suggest that the default value
of 100 kg m23 in the Goddard scheme was rarely ob-
served. Instead, density decreased toward the cloud base
in a manner similar to the slope parameter (Fig. 11b), as
suggested by Heymsfield et al. (2004).
Below 3 km, the mean profile of simulated ls over-
estimates values observed from either aircraft profile,
implying that the model produced a size distribution
with mean crystal size (D 5 l�1s ) smaller than observed
(Fig. 11c). The ascending aircraft profile indicates a
smooth increase in ls with height and is presumed to be
representative of the broader precipitation shield, with
FIG. 10. Comparisons of model vertical profiles and available aircraft data, based upon grid points within 50 km of the King City radar.
(a) Conditional mean profiles of hydrometeor mass content, compared with aircraft profile estimates of ice and liquid water content.
(b) Model vertical profiles of saturation with respect to water (green line) and ice (blue line) compared to aircraft spiral data shown with
symbols. (c) Profiles of air temperature. Colored symbols refer to the descending aircraft spiral and departure ascent shown in Fig. 1.
FIG. 11. (a) Aircraft observations of the snow crystal size distribution intercept Nos vs the fixed value (line) within the Goddard
microphysics scheme. (b) Aircraft estimates of effective bulk density rs based upon measured particle size distributions and the mass–
diameter relationship of Heymsfield et al. (2004) vs the fixed value (line) within the Goddard scheme. (c) Profiles of ls based upon the
mean profile of simulated snow content, constant Nos and rs, compared with aircraft estimates from observed particle size distributions.
Crosshairs (1) indicate data from the descending aircraft spiral (departure ascent) shown in Fig. 1.
NOVEMBER 2010 M O L T H A N E T A L . 4263

ls approaching 1 mm21 near the cloud base. The value of
1 mm21 is comparable to previous observations by Houze
et al. (1979) or Lo and Passarelli (1982), and the minimum
value provided in a summary parameterization of l(T) by
Ryan (2000). The Goddard scheme produced a steady
value near 2.1 mm21, continued through a depth of 3 km,
suggesting that the arithmetic mean size of simulated
crystals was nearly invariant and smaller than suggested
by observations.
When a constant density and intercept are applied
within the single-moment framework, it implies that the
slope parameter in (3) will vary only as an inverse func-
tion of the snow mass content. In the altitude range of
3–4 km, cloud ice accumulated within the Goddard scheme
contributes to snow through autoconversion and accretion,
implying that small ice crystals are aggregating into larger-
sized particles while consuming smaller droplets or other
crystals. This causes a sharp increase in the snow content
from 3 to 5 km. At altitudes below 3 km, the simulated
profile of snow content generates a profile of ls with
minimal variability. Stagnant ls values in the lowest 3 km
are contrary to aircraft observations indicating that ls
continued to decrease steadily toward the cloud base. In
terms of mean crystal size, the microphysics scheme pro-
duced a profile with little variability below 2 km, while the
mean size from observed distributions continued to grow.
Naturally occurring crystals continued to aggregate, as
observed in the reduced number concentrations of small
particles (Nos), an increase in their mean size, inferences
from dual-polarimetric radar parameters (Fig. 5), and
crystal probe imagery (Fig. 6). The effects of aggrega-
tion on size distribution parameters are not well rep-
resented by an approach utilizing a fixed intercept and
density, where variability in Nos and ls are reduced.
Above the 3-km level, comparisons between the
Goddard scheme assumptions and aircraft data are com-
plicated by the separation of cloud ice and snow categories
within the model simulation. This division implies that the
model expects a rapid transition from lower-density ag-
gregates to monodisperse (20 mm), pure ice spheres com-
posing the cloud ice category. Particles as large as 1 mm
were observed at altitudes of 5–6 km (not shown), but the
Goddard scheme predicted that cloud ice crystals would
dominate. Reliable fits to exponential size distributions
were frequently obtained in the same altitude range, in-
dicating that crystal populations could be represented by
a complete size distribution rather than a monodisperse
assumption (Fig. 11). Combined with observed bulk den-
sities less than pure ice, the cloud ice particles simulated
at the cloud top do not accurately represent the size
distribution or density characteristics of the observed
crystal populations. The Goddard scheme could be im-
proved upon by prescribing a size distribution and density
to the cloud ice category that blends with the properties
of simulated aggregates. By incorporating a size distri-
bution for these particles, their size distribution and fall
speeds could be blended within the deeper layer of snow
below, reducing the sharp transition present near 4 km.
c. Evaluation of the snow terminal velocity–diameter relationship
Given a size distribution and mass–diameter relation-
ship, the resulting precipitation rate depends upon the
fall speeds of individual crystals. Locatelli and Hobbs
(1974) proposed a power-law fit between the diameter
of a crystal or aggregate and its terminal velocity, and a
comparable relationship can be determined for the 22
January 2007 event, using data from the Hydrometeor
Velocity and Shape Detector (HVSD; Barthazy et al.
2004). The HVSD is a ground-based instrument that
images crystals as they pass between a series of detec-
tors, and repeated snapshots of individual crystals are
used to estimate their fall speeds. During this event, the
HVSD was deployed at the CARE site and output data
were examined by Gyuwon Lee (McGill University 2009,
personal communication) to ensure that the crystal fall
speeds were not biased by winds during the event. It is
assumed here that the reported velocity is the terminal
velocity for each crystal.
Observations of crystal sizes and fall speeds were as-
sembled into a joint histogram, using the observed bin
sizes for diameter and velocities of 5 cm s21, respectively.
Size and velocity was determined for over 11 000 in-
dividual flakes observed between 0200 and 0800 UTC
(Fig. 12). Paired observations of size and velocity were fit
to a power law of the form VðDÞ 5 ayDb
y through least
squares minimization, following Locatelli and Hobbs
(1974), but restricted to size bins larger than 1 mm with at
least 50 observations. These restrictions were applied be-
cause the HVSD has difficulty detecting particles smaller
than 1 mm, and the fit should not be biased by small num-
ber concentrations of the largest crystals.
The crystals retained for calculation of the power-law fit
produced a terminal velocity–diameter relationship similar
to the Locatelli and Hobbs (1974) category of ‘‘unrimed
radiating assemblages of dendrites,’’ as both the co-
efficient ay 5 2.146 m12b s21 and exponent by 5 0.145 were
similar to their reported values of ay 5 1.671 m12b s21 and
by 5 0.16 (Fig. 12). The resemblance between the Locatelli
and Hobbs (1974) fit for aggregates and the relationship
derived from HVSD data is supported by the appearance
of aggregates throughout the spiral descent profile
sampled by the aircraft probes (Fig. 6), inference from
dual-polarimetric radar parameters (Fig. 5), and pho-
tographs acquired at the surface (Petersen et al. 2007).
Differences in measurement style also contribute, as
4264 M O N T H L Y W E A T H E R R E V I E W VOLUME 138

the HVSD data reported the maximum crystal di-
mension and Locatelli and Hobbs (1974) used an
equivalent diameter circle. The strong correlation (R2 5
0.787) for the power-law relationship derived from the
HVSD suggests a reliable representation, although the
histogram exhibits a large amount of scatter in fall
speeds for all crystal sizes generally, and especially those
smaller than 2 mm in diameter. The resulting best fit
from HVSD data implies a greater fall speed at all
crystal sizes than currently assumed within the Goddard
scheme, but less than those in the Lin et al. (1983) for-
mulation.
Although the model forecast provided a reasonable
prediction of the liquid equivalent precipitation rate, the
result was obtained despite a poor representation of the
velocity–diameter relationship for crystals observed at
the surface. By representing snow crystals as spheres of a
constant density, the amount of mass within a simulated
particle of a given diameter may exceed the natural par-
ticle of equivalent size. The constant value of rs exceeds
observations, and a sphere (bm 5 3) exceeds observed
values of bm from 1.8 to 2.2 (Locatelli and Hobbs 1974;
Heymsfield et al. 2004). Although a simulated particle of
a given diameter may have a terminal velocity less than
observations, an expected reduction in mass flux or pre-
cipitation rate may be offset by an overestimate of the mass
assigned to each particle. Errors in the size distribution
compensate by reducing the arithmetic mean size (ls21),
and combine with the mass–diameter and diameter–fall
speed relationships to produce a reasonable surface accu-
mulation rate. Attempts to validate and improve upon
quantitative precipitation forecasts must be compre-
hensive and address all characteristics of the particle size
distribution, mass–diameter, and diameter–fall speed re-
lationships in order to properly account for accretion
terms, other interactions among precipitating cloud
species, and their resulting precipitation rates.
4. Summary and conclusions
The snowfall event of 22 January 2007 occurred within
the operational domain of the C3VP campaign and was
observed by radar, aircraft, and surface instrumentation.
The WRF model, in conjunction with the Goddard six-
class, single-moment microphysics scheme and other
physical parameterizations, was capable of simulating the
overall structure and evolution of the precipitation. Val-
idation efforts using temperature and liquid equivalent
precipitation rate demonstrated that a high-resolution
forecast model can recreate the sensible weather of the
event, but comparisons to aircraft data demonstrate
several opportunities to improve upon ice crystal rep-
resentation in support of satellite retrieval development.
The use of a fixed distribution intercept and snow
density lack the diversity present in aircraft measure-
ments. In aircraft profiles, the distribution intercept and
density decreased toward the cloud base as snow crystal
distributions transitioned to larger sizes of low density
aggregates. The assumed density of rs 5 100 kg m23
exceeded aircraft-estimated values throughout the bulk
of the aircraft ascending profile, and when combined
with the fixed distribution intercept, limited the range in
model-simulated values of ls to portions of the profile
where snow content varied. The resulting size distributions
generally produced crystal populations with a smaller
mean size (larger ls) than suggested by aircraft data, par-
ticularly in the lowest 2 km where crystal probe imagery
and dual-polarimetric radar indicated significant aggrega-
tion. Within the 3–6-km layer, the Goddard scheme pre-
dicts a separation of ice water into monodisperse cloud
ice and size distributed aggregate categories, resulting in a
sharp contrast in ice crystal characteristics, contrary to air-
craft observations. This implies that the model separation
of cloud ice and snow is less applicable in this case of deep,
snowing profiles. Instead, the scheme may benefit from
a comparable size distribution for the cloud ice category
that allows for particle densities less than pure ice.
FIG. 12. Joint histogram of crystal maximum dimension and
HVSD estimate of terminal fall speed along with proposed fits by
Locatelli and Hobbs (1974), Lin et al. (1983), and W.-K. Tao et al.
(2008, personal communication). Mean (crosshair), median (open
square) and standard deviation of terminal velocities are plotted
for each size bin where data were sufficient (N $ 50) for providing
a best-fit estimate. Relationships are extrapolated for sizes smaller
than 1 mm and less than 50 occurrences (dashed). Histogram
shading is performed at 1%, 10%, and every 10% thereafter.
NOVEMBER 2010 M O L T H A N E T A L . 4265

In this specific case, the Tao et al. (2003) saturation
adjustment scheme contributed to errors in the vertical
profile of water vapor. Although aircraft observations
indicated that the vertical column was saturated with
respect to water and supersaturated with respect to ice,
the saturation adjustment step eliminated all supersatura-
tion with respect to ice at temperatures colder than 2158C.
Other microphysical processes eliminate supersaturation
with respect to ice (e.g., vapor deposition to snow), but the
saturation adjustment scheme is arbitrary in its application
of a temperature threshold. Saturation adjustment steps
could be modified to avoid dependence on a single tem-
perature threshold. Korolev and Isaac (2006) reported
a temperature dependence for relative humidity within
mixed-phase and ice clouds, which may improve upon
simulations of the water vapor profile.
Although the model reproduced the liquid equivalent
precipitation rate at the surface, the terminal velocity–
diameter relationship used within the Goddard scheme
underestimated fall speeds across the full range of di-
ameters observed by the HVSD. Increasing the terminal
velocities across the full range of aggregate diameters
will increase the precipitation rate and may degrade the
forecast simulation described here, but should be consid-
ered as a means of improving the physical representation
of the snow category. Expected increases in precipitation
rate from the increase in terminal velocity may be offset by
incorporating a nonspherical mass–diameter relationship
and by improving the representation of particle size
distributions.
In the single-moment framework, the effects of aggre-
gation on the size distribution must be handled through
flexibility in the slope parameter and bulk density, since
aggregation is neither a source nor a sink for ice mass. The
summary findings of Ryan (2000) claimed that functions
of ls(T) are more reliable than Nos(T), providing greater
flexibility in size distribution parameters over the current
use of a constant intercept. To permit flexibility in the
effective bulk density of snow, Heymsfield et al. (2004)
suggested that rs could be represented as a function of
ls. Alternatively, Field et al. (2005) used a series of
temperature-dependent relationships to incorporate the
moments of observed particle size distributions within the
microphysical processes of the Thompson et al. (2008)
scheme. As an alternative, a double-moment represen-
tation within the Goddard scheme would allow for a
prediction of the mass content and the total number con-
centration, allowing for a decrease (increase) in number
concentration (size) as crystals approach the cloud base
with less reliance on the model temperature profile
(Milbrandt and Yau 2005; Morrison et al. 2009). Im-
provements to the representation of snow crystals,
combined with accurate profiles of ice and liquid water
content, should contribute to greater forecast accuracy
and support the development of retrievals applicable to
future satellite campaigns.
Acknowledgments. The authors thank Wei-Kuo Tao
and Roger Shi of NASA Goddard Space Flight Center
for assistance with the Goddard microphysics scheme in
the WRF modeling framework, and three anonymous
reviewers for helping to improve the clarity of figures
and analysis. Model simulations were performed on the
NASA Discover Cluster. Data from the HVSD instru-
ment were provided by GyuWon Lee of McGill Univer-
sity. Petersen acknowledges support from the NASA
Precipitation Measurement Mission (via Dr. R. Kakar)
and the Global Precipitation Measurement project (via
Dr. M. Schwaller). Nesbitt acknowledges support from
the Global Precipitation Measurement Project (via
Dr. M. Schwaller). Prime funding for aircraft studies
during the Canadian CloudSat/CALIPSO Validation
Project was provided by the Canadian Space Agency.
The lead author was supported in part by the Coopera-
tive Education Program at NASA Marshall Space Flight
Center.
REFERENCES
Barthazy, E., S. Goke, R. Schefold, and D. Hogl, 2004: An optical
array instrument for shape and fall velocity measurements of
hydrometeors. J. Atmos. Oceanic Technol., 21, 1400–1416.
Bernardet, L., and Coauthors, 2008: The Developmental Testbed
Center and its winter forecasting experiment. Bull. Amer. Me-
teor. Soc., 89, 611–627.
Dudhia, J., 1989: Numerical study of convection observed during the
winter monsoon experiment using a mesoscale two-dimensional
model. J. Atmos. Sci., 46, 3077–3107.
Ek, M., M. E. Mitchell, Y. Lin, E. Rogers, P. Grunmann, V. Koren,
G. Gayno, and J. D. Tarpley, 2003: Implementation of Noah
land surface model advances in the National Centers for En-
vironmental Prediction operational mesoscale Eta model.
J. Geophys. Res., 108, 8851, doi:10.1029/2002JD003296.
Field, P. R., and A. J. Heymsfield, 2003: Aggregation and scaling of
ice crystal size distributions. J. Atmos. Sci., 60, 544–560.
——, R. J. Hogan, P. R. A. Brown, A. J. Illingworth, T. W. Choularton,
and R. J. Cotton, 2005: Parameterization of ice-particle size dis-
tributions for mid-latitude stratiform cloud. Quart. J. Roy. Meteor.
Soc., 131, 1997–2017.
Grell, G. A., and D. Devenyi, 2002: A generalized approach to
parameterizing convection combining ensemble and data as-
similation techniques. Geophys. Res. Lett., 29, D00A09,
doi:10.1029/2007JD009766.
Heymsfield, A. J., 1973: Laboratory and field observations of the
growth of columnar and plate crystals and frozen droplets.
J. Atmos. Sci., 30, 1650–1656.
——, 2003: Properties of tropical and midlatitude ice cloud particle
ensembles. Part I: Median mass diameters and terminal ve-
locities. J. Atmos. Sci., 60, 2573–2591.
——, A. Bansemer, P. Field, S. Durden, J. Stith, J. Dye, W. Hall,
and T. Grainger, 2002: Observations and parameterizations of
particle size distributions in deep tropical cirrus and stratiform
4266 M O N T H L Y W E A T H E R R E V I E W VOLUME 138

precipitating clouds: Results from in situ observations in
TRMM field campaigns. J. Atmos. Sci., 59, 3457–3491.
——, ——, C. Schmitt, C. Twohy, and M. Poellot, 2004: Effective
ice particle densities derived from aircraft data. J. Atmos. Sci.,
61, 982–1003.
——, Z. Wang, and S. Matrosov, 2005: Improved radar ice water
content retrieval algorithms using coincident microphysical
and radar measurements. J. Appl. Meteor., 44, 1391–1412.
——, A. Bansemer, and C. H. Twohy, 2007: Refinements to ice
particle mass dimensional and terminal velocity relationships
for ice clouds. Part I: Temperature dependence. J. Atmos. Sci.,
64, 1047–1067.
——, P. Field, and A. Bansemer, 2008: Exponential size distribu-
tions for snow. J. Atmos. Sci., 65, 4017–4031.
Hong, S.-Y., J. Dudhia, and S.-H. Chen, 2004: A revised approach
to ice microphysical processes for the bulk parameterization of
clouds and precipitation. Mon. Wea. Rev., 132, 103–120.
Houze, R. A. J., P. V. Hobbs, P. H. Herzegh, and D. B. Parsons,
1979: Size distributions of precipitation particles in frontal
clouds. J. Atmos. Sci., 36, 156–162.
Huang, G.-J., V. N. Bringi, R. Cifelli, D. Hudak, and W. A. Petersen,
2010: A methodology to derive radar reflectivity-liquid equiv-
alent snow rate relations using C-band radar and a 2D video
disdrometer. J. Atmos. Oceanic Technol., 27, 637–651.
Hudak, D., H. Barker, P. Rodriguez, and D. Donovan, 2006:
Winter precipitation studies with a dual polarized C-band
radar. Preprints, European Conf. on Radar in Meteorology and
Hydrology, Barcelona, Spain, 1–6.
——, P. Rodriguez, and N. Donaldson, 2008: Validation of the
CloudSat precipitation occurrence algorithm using the Cana-
dian C-band radar network. J. Geophys. Res., 113, D00A07,
doi:10.1029/2008JD009992.
Janjic, Z. I., 1990: The step-mountain coordinate: Physical package.
Mon. Wea. Rev., 118, 1429–1443.
——, 1996: The surface layer in the NCEP Eta model. Preprints,
11th Conf. on Numerical Weather Prediction, Norfolk, VA,
Amer. Meteor. Soc., 354–355.
——, 2001: Nonsingular implementation of the Mellor-Yamada
level 2.5 Scheme in the NCEP Meso model. NCEP Office Note
437, National Centers for Environmental Prediction, 61 pp.
——, 2003: A nonhydrostatic model based on a new approach.
Meteor. Atmos. Phys., 82, 271–285.
Kain, J. S., M. E. Baldwin, P. R. Janish, S. J. Weiss, M. P. Kay, and
G. W. Carbin, 2003: Subjective verification of numerical
models as a component of a broader interaction between re-
search and operations. Wea. Forecasting, 18, 847–860.
Kessler, E., 1969: On the Distribution and Continuity of Water Sub-
stance in Atmospheric Circulation. Amer. Meteor. Soc., 84 pp.
Korolev, A., and G. A. Isaac, 2006: Relative humidity in liquid,
mixed-phase, and ice clouds. J. Atmos. Sci., 63, 2865–2880.
Lang, S., W.-K. Tao, R. Cifelli, W. Olson, J. Halverson, S. Rutledge,
and J. Simpson, 2007: Improving simulations of convective
systems from TRMM LBA: Easterly and westerly regimes.
J. Atmos. Sci., 64, 1141–1164.
Lin, Y.-L., R. D. Farley, and H. D. Orville, 1983: Bulk parame-
terization of the snow field in a cloud model. J. Climate Appl.
Meteor., 22, 1065–1092.
Liu, G., 2004: Approximation of single scattering properties of ice
and snow particles for high microwave frequencies. J. Atmos.
Sci., 61, 2441–2456.
——, 2008a: A database of microwave single-scattering properties
for nonspherical ice particles. Bull. Amer. Meteor. Soc., 89,
1563–1570.
——, 2008b: Deriving snow cloud characteristics from CloudSat
observations. J. Geophys. Res., 113, D00A09, doi:10.1029/
2007JD009766.
Lo, K. K., and R. E. J. Passarelli, 1982: The growth of snow in
winter storms: An airborne observational study. J. Atmos. Sci.,
39, 697–706.
Locatelli, J. D., and P. V. Hobbs, 1974: Fall speeds and masses
of solid precipitation particles. J. Geophys. Res., 79, 2185–
2197.
Matsui, T., X. Zeng, W.-K. Tao, H. Masunaga, W. S. Olson, and
S. Lang, 2009: Evaluation of long-term cloud-resolving model
simulations using satellite radiance observations and multi-
frequency satellite simulators. J. Atmos. Oceanic Technol., 26,
1261–1274.
Milbrandt, J. A., and M. K. Yau, 2005: A multimoment bulk mi-
crophysics parameterization. Part I: Analysis of the role of the
spectral shape parameter. J. Atmos. Sci., 62, 3051–3064.
Mlawer, E. J., S. J. Taubman, P. D. Brown, M. J. Iacono, and
S. A. Clough, 1997: Radiative transfer for inhomogeneous
atmosphere: RRTM, a validated correlated-k model for the
long-wave. J. Geophys. Res., 102 (D14), 16 663–16 682.
Morrison, G., G. Thompson, and V. Tatarskii, 2009: Impact of
cloud microphysics on the development of trailing strati-
form precipitation in a simulated squall line: Comparison
of one- and two-moment schemes. Mon. Wea. Rev., 137,
991–1007.
Petersen, W. A., and Coauthors, 2007: NASA GPM/PMM partic-
ipation in the Canadian CloudSat/CALIPSO validation pro-
ject C3VP. Physical process studies in snow. Preprints, 33rd
Int. Conf. on Radar Meteorology, Cairns, Australia, Amer.
Meteor. Soc., 1–7.
Pruppacher, H. R., and J. D. Klett, 1978: Microphysics of Clouds
and Precipitation. D. Reidel, 714 pp.
Rutledge, S. A., and P. V. Hobbs, 1983: The mesoscale and micro-
scale structure and organization of clouds and precipitation
in midlatitude cyclones. Part VII: A model for the seeder-
feeder process in warm-frontal rainbands. J. Atmos. Sci., 40,1185–1206.
——, and ——, 1984: The mesoscale and microscale structure and
organization of clouds and precipitation in midlatitude clouds.
Part XII: A diagnostic modeling study of precipitation de-
velopment in narrow cold frontal rainbands. J. Atmos. Sci., 41,
2949–2972.
Ryan, B., 2000: A bulk parameterization of the ice particle size
distribution and the optical properties in ice clouds. J. Atmos.
Sci., 57, 1436–1451.
Shi, J. J., and Coauthors, 2010: WRF simulations of the 20–22 January
2007 snow events over eastern Canada: Comparison with in situ
and satellite observations. J. Appl. Meteor. Climatol., 49,2246–2266.
Stephens, G. L., and Coauthors, 2002: The CloudSat mission and
the A-Train. Bull. Amer. Meteor. Soc., 83, 1771–1790.
Tao, W.-K., and Coauthors, 2003: Microphysics, radiation and
surface processes in the Goddard Cumulus Ensemble (GCE)
model. Meteor. Atmos. Phys., 82, 97–137.
Thompson, G., P. R. Field, R. M. Rasmussen, and W. D. Hall, 2008:
Explicit forecasts of winter precipitation using an improved
bulk microphysics scheme. Part II: Implementation of a new
snow parameterization. Mon. Wea. Rev., 136, 5095–5115.
Twohy, C. H., A. J. Schanot, and W. A. Cooper, 1997: Measure-
ment of condensed water content in liquid and ice clouds using
an airborne counterflow virtual impactor. J. Atmos. Oceanic
Technol., 14, 197–202.
NOVEMBER 2010 M O L T H A N E T A L . 4267