evaluating the running time of a communication round over the internet omar bakr idit keidar mit...
TRANSCRIPT
Evaluating the Running Time of a Communication Round over the Internet
Omar Bakr Idit Keidar
MIT MIT/Technion
PODC 2002
© Omar Bakr and Idit Keidar; PODC July 2002
Communication Round
• Exchange of information from all hosts to all hosts
• Part of many distributed algorithms, systems– consensus, atomic commit, replication, ...

© Omar Bakr and Idit Keidar; PODC July 2002
Common Metric for Evaluating Algorithms
• Number of rounds (or steps) they require
© Omar Bakr and Idit Keidar; PODC July 2002
Questions
• What is the best way to implement a communication round over the Internet– decentralized vs. centralized
• How long is a communication round over the Internet?
© Omar Bakr and Idit Keidar; PODC July 2002
Prediction is Hard
• Internet is unpredictable, diverse, …• Different answers for different topologies,
different times• Different performance metrics
– local running time one host is engaged in algorithm
– overall running time from when first host starts to when last host finishes
© Omar Bakr and Idit Keidar; PODC July 2002
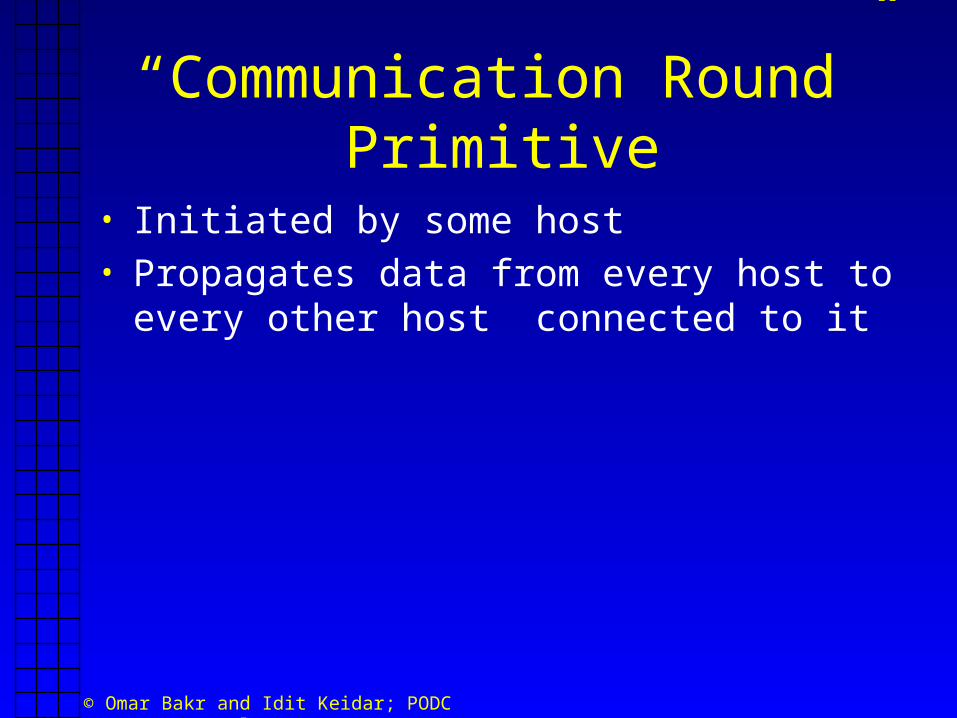
“Communication Round” Primitive
• Initiated by some host• Propagates data from every host to every other host
connected to it
© Omar Bakr and Idit Keidar; PODC July 2002
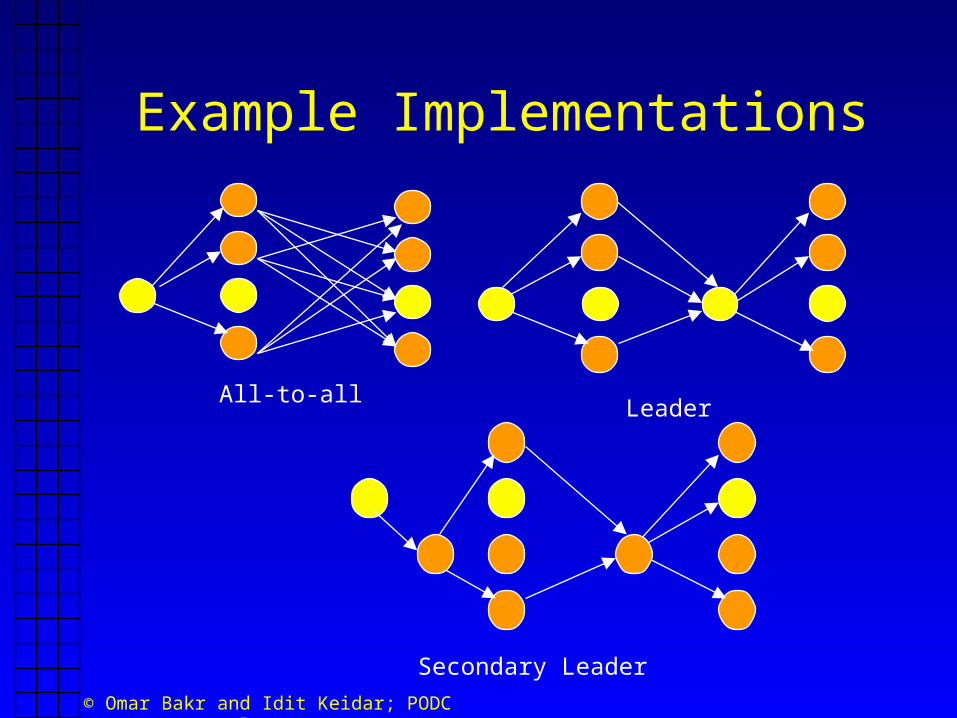
Example Implementations
All-to-allLeader
Secondary Leader

© Omar Bakr and Idit Keidar; PODC July 2002
Experiment I
• 10 hosts: Taiwan, Korea, US academia, ISPs• TCP/IP (connections always up)• Algorithms:
– All-to-all– Leader (initiator)– Secondary leader (not initiator)
periodically initiated at each host
- 650 times over 3.5 days
© Omar Bakr and Idit Keidar; PODC July 2002
Computing Overall Running Time
• Elapsed time from initiation (at initiator) until all hosts terminate
• Requires estimating clock differences– Clocks not synchronized, drift– We compute difference over short intervals– Compute 3 different ways – Achieve accuracy within 20 ms. on 90% of runs
© Omar Bakr and Idit Keidar; PODC July 2002
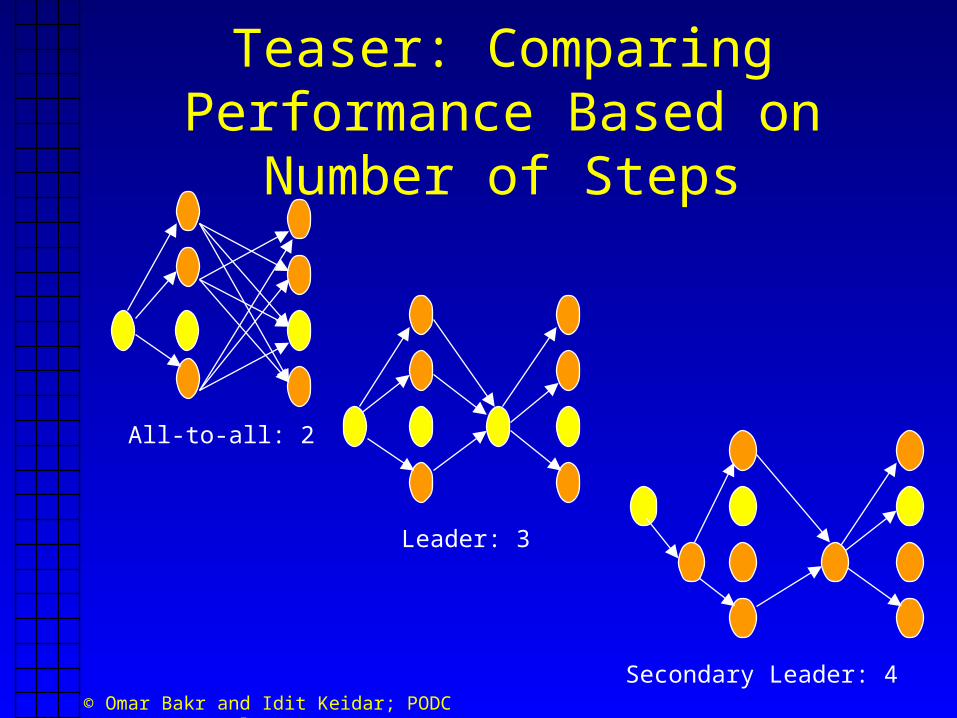
Teaser: Comparing Performance Based on Number of Steps
All-to-all: 2
Leader: 3
Secondary Leader: 4
© Omar Bakr and Idit Keidar; PODC July 2002
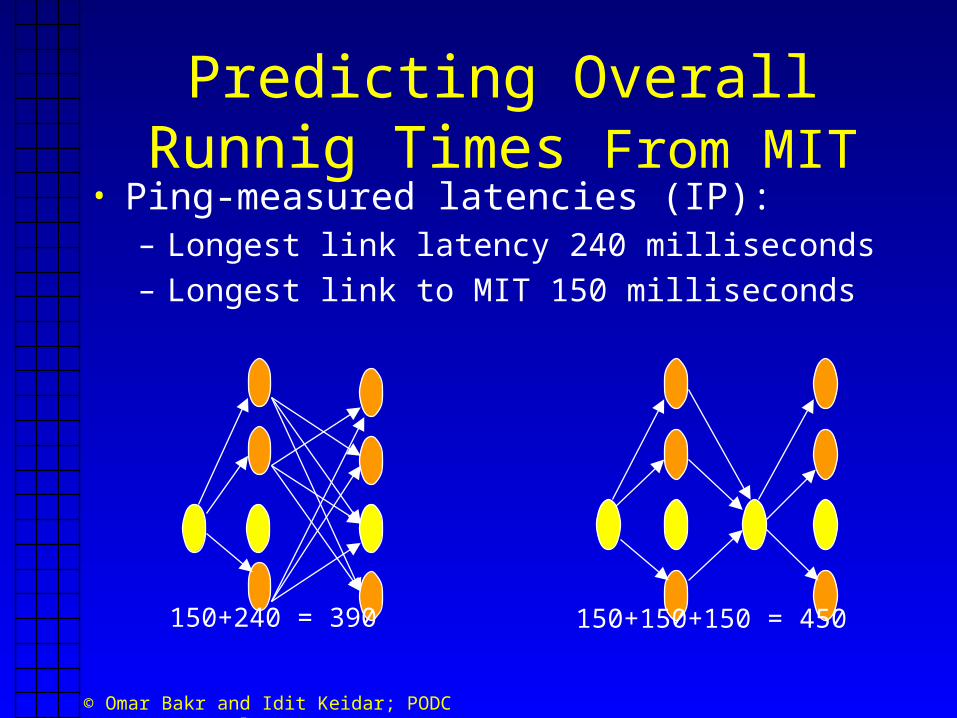
Predicting Overall Runnig Times From MIT
• Ping-measured latencies (IP):– Longest link latency 240 milliseconds– Longest link to MIT 150 milliseconds
150+240 = 390 150+150+150 = 450
© Omar Bakr and Idit Keidar; PODC July 2002
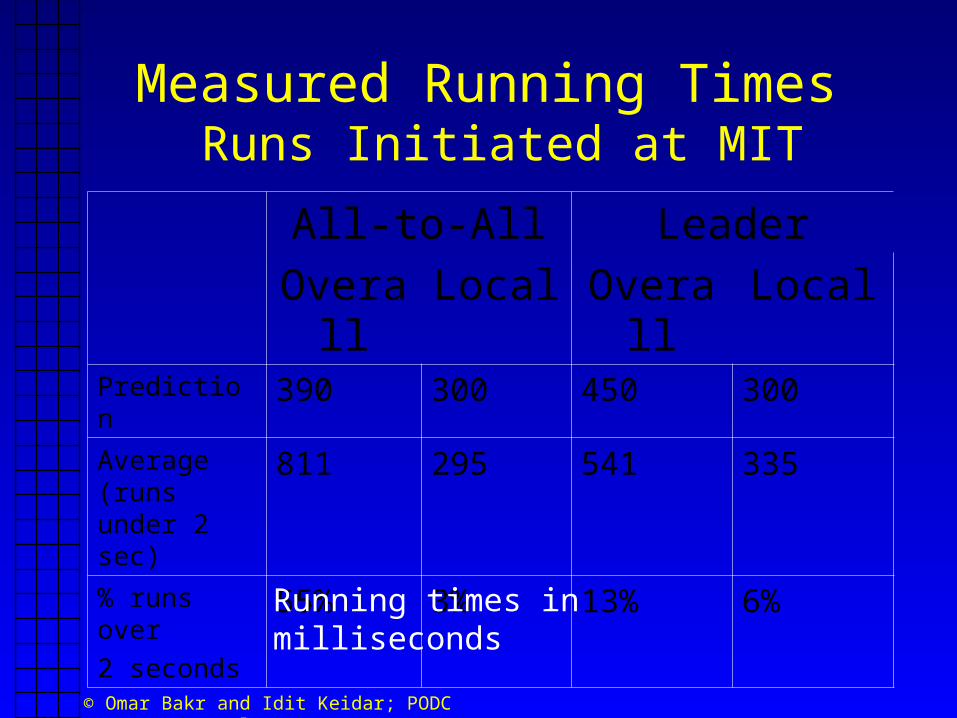
Measured Running Times Runs Initiated at MIT
All-to-All Leader
Overall Local Overall LocalPrediction 390 300 450 300Average (runs under 2 sec)
811 295 541 335
% runs over
2 seconds55% 3% 13% 6%
Running times in milliseconds
© Omar Bakr and Idit Keidar; PODC July 2002
What’s Going On?
• Loss rates on two links are very high– 42% and 37%– Taiwan to two ISPs in the US
• Loss rates on other links up to 8%• Upon loss, TCP’s timeout is big
– More than round-trip-time
• All-to-all sends messages on lossy links– Often delayed by loss
© Omar Bakr and Idit Keidar; PODC July 2002
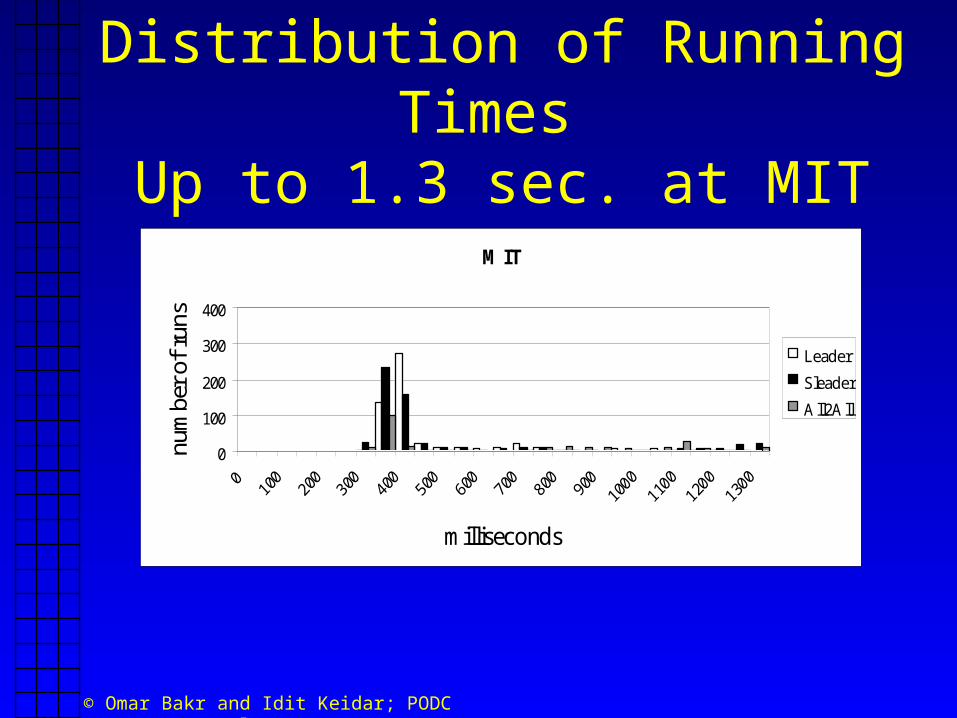
Distribution of Running Times Up to 1.3 sec. at MIT
MIT
0
100
200
300
400
milliseconds
num
ber
of r
uns
Leader
Sleader
All2All
© Omar Bakr and Idit Keidar; PODC July 2002
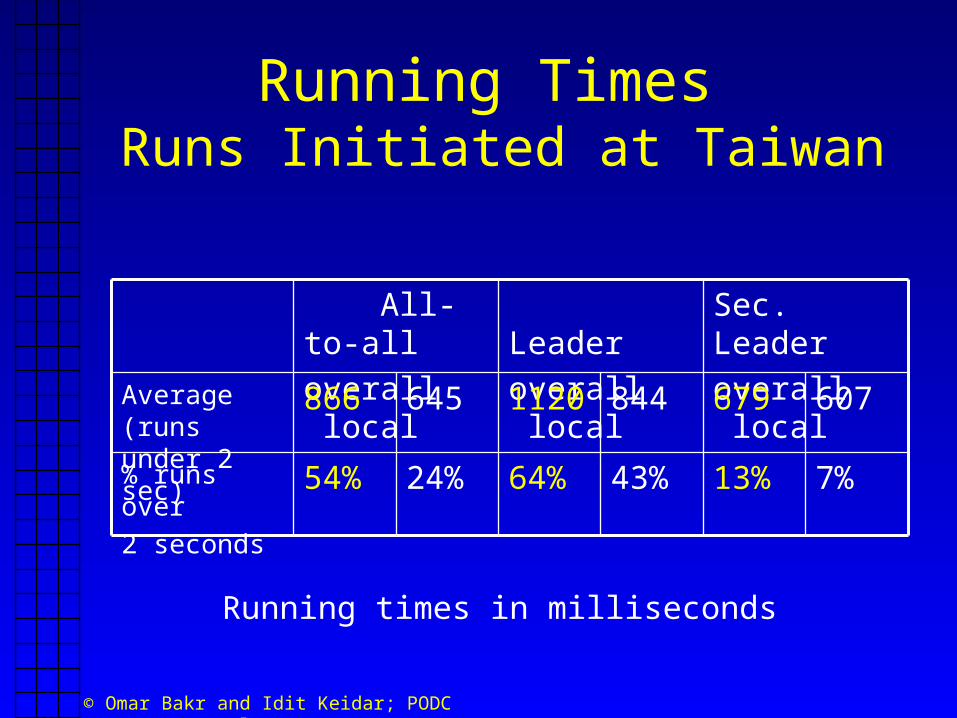
Running Times Runs Initiated at Taiwan
% runs over
2 seconds
Average (runs under 2 sec)
Sec. Leader
overall local
Leader
overall local
All-to-all
overall local
7%13%43%64%24%54%
6076798441120645866
Running times in milliseconds
© Omar Bakr and Idit Keidar; PODC July 2002
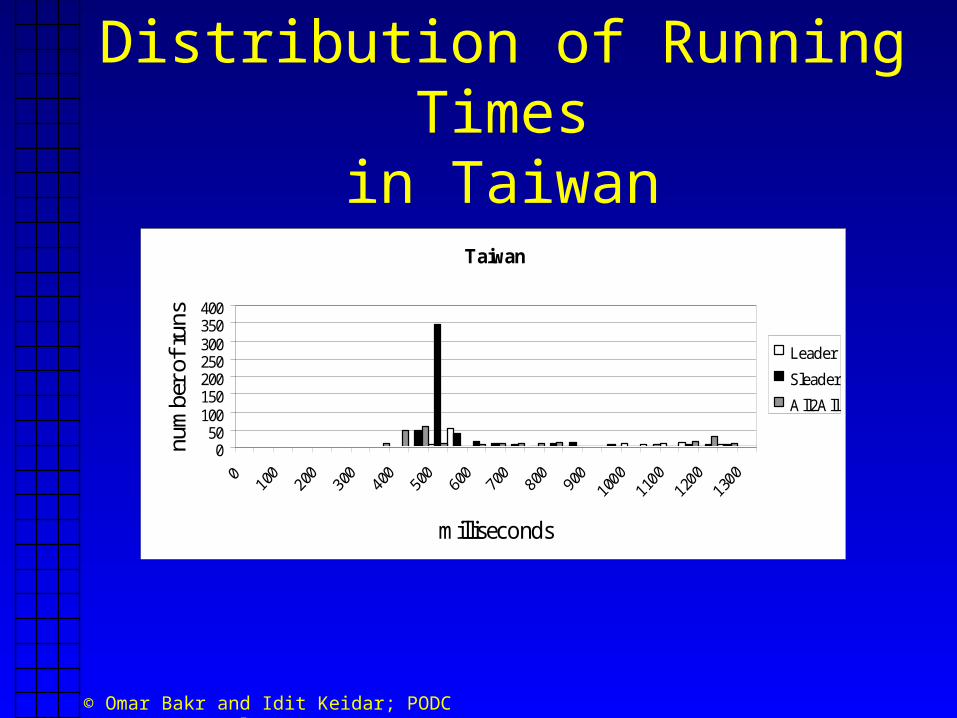
Distribution of Running Timesin Taiwan
Taiwan
050
100150200250300350400
milliseconds
num
ber
of r
uns
Leader
Sleader
All2All

© Omar Bakr and Idit Keidar; PODC July 2002
What’s Going On?
All-to-all Leader Secondary Leader
Taiwan
MIT
Hosts with bad links to Taiwan
Other Hosts
Good link
Lossy link
© Omar Bakr and Idit Keidar; PODC July 2002
Experiment II: Removing Taiwan
• Overall running times much better– For every initiator and algorithm, less than 10%
over 2 seconds (as opposed to 55% previously)
• All-to-all overall still worse than others!– either Leader or Secondary Leader best,
depending on initiator– loss rates of 2% - 8% are not negligible– all-to-all sends O(n2) messages; suffers
• But, all-to-all has best local running times
© Omar Bakr and Idit Keidar; PODC July 2002
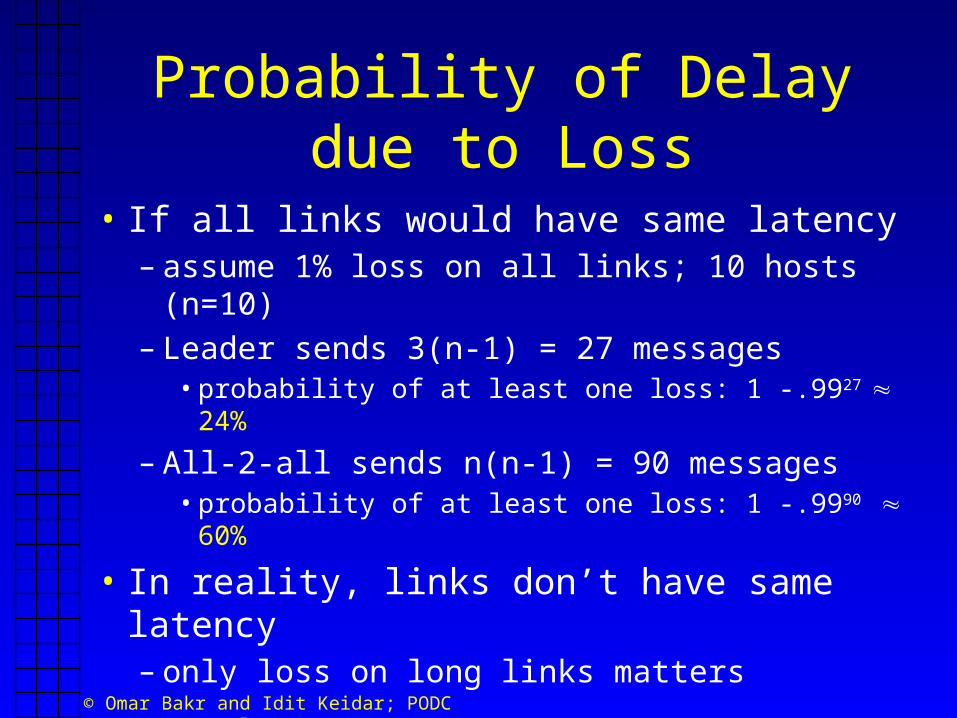
Probability of Delay due to Loss
• If all links would have same latency– assume 1% loss on all links; 10 hosts (n=10)– Leader sends 3(n-1) = 27 messages
• probability of at least one loss: 1 -.9927 24%
– All-2-all sends n(n-1) = 90 messages• probability of at least one loss: 1 -.9990 60%
• In reality, links don’t have same latency– only loss on long links matters

© Omar Bakr and Idit Keidar; PODC July 2002
Conclusions• Message loss causes high variation in TCP link latencies
– latency distribution has high variance, heavy tail
• Latency distribution determines expected time for receiving O(n) concurrent messages
• Secondary leader helps – No triangle inequality, especially for loss
• Different for overall vs. local running times
• Number of rounds/steps not sufficient metric– One-to-all and all-to-all have different costs