evaluating the impact of the “moving ahead through
TRANSCRIPT

1
Evaluating the Impact of the “Moving Ahead Through Financial Management”
Curriculum: A Randomized Control Study
Final Report – Survivor Interview Data
December 20, 2013
By
Judy L. Postmus, Ph.D., ACSW
Associate Professor & Director
Center on Violence Against Women & Children
Rutgers University, School of Social Work
Andrea Hetling, Ph.D.
Assistant Professor
Edward J. Bloustein School of Planning & Social Policy
Gretchen Hoge, MSW
Ph.D. Student
Center on Violence Against Women & Children
Rutgers University, School of Social Work
We would like to acknowledge the incredible work of so many partners who made this study
possible. First, we wish to thank The Allstate Foundation for their encouragement and financial
support to make this project a reality. Second, we want to thank the research team at Rutgers
including Amanda Mathisen Stylianou and other staff and students from the Center on Violence
Against Women & Children. We also want to thank our research collaborators from other
universities including Dr. Fran Danis from the University of Texas at Arlington, Drs. Elithet
Silva-Martinez and Jenice Vazquez Pagan from the University of Puerto Rico, and Dr. Corinne
Warrener from Clark Atlanta University. All were invaluable assets to recruiting agencies and
interviewing survivors. We also wish to thank the numerous research assistants who helped
collect or analyze data as well as the 14 domestic violence organizations willing to participate in
this project. Additional thanks goes to NNEDV for their vision in developing this curriculum
with The Allstate Foundation and to their support of this project. Finally, we want to thank the
survivors and advocates who participated in this project. Their experiences and willingness to
meet with the researchers allowed for rich information to be gathered and disseminated in order
to improve services for other survivors.

2
Table of Contents
Executive Summary 3
Introduction 7
Research Design 8
Results 11
…Section 1: Data Collection from Research Project Participants 11
…Section 2: Demographic Characteristics 13
…Section 3: Impact of Curriculum 17
…Section 4: Participant Perspectives on Skills Learned and Applied 26
Limitations 29
Recommendations 30
References 32
Attachment 1: Conceptual Framework 33
Attachment 2: Allstate Survey – English 34
Attachment 3: Allstate Survey – Spanish 65
Attachment 4: Scales 99

3
Executive Summary
This project builds upon the previous evaluation conducted by the Center on Violence Against
Women & Children (VAWC) at Rutgers University, School of Social Work to accomplish a
multi-year experimental, longitudinal design to determine the impact of the Moving Ahead
through Financial Management curriculum with survivors of violence. Survivors were assigned
to either an experimental group (receiving advocacy services and the curriculum during group
and individual sessions) or a control group (receiving advocacy services only). All survivors,
recruited on an ongoing basis from 14 domestic violence organizations from 7 states and Puerto
Rico, were interviewed four times over a 14 month period.
A total of 457 women participated in the first round of interviews; of these 341 completed more
than one interview. This report focuses on this group of 195 women that completed all four
interviews (experimental group, n=94; control group, n=101). By limiting our analysis to
women in this longitudinal sample, we are able to show a very detailed picture of the impact of
the curriculum over time.
Participants from the longitudinal sample (n=195) ranged in age from 21 to 62 years of age with
an average age of 38. Sixty percent of the participants identified themselves as Latina or
Hispanic; over 20% identified as Black, non-Hispanic. Less than 5% identified themselves as
“other” (i.e. Asian, Multi-ethnic), and 14.4% identified themselves as White, non-Hispanic.
Over 45% answered “no” when asked if they were born in the U.S.; over 87% of those (n=77)
had lived in the U.S. for 5 years or more. Additionally, most of the participants (44.1%) made
less than $25,000 in the past year for their entire household, results in most participants (80.5%)
reporting that it was somewhat difficult to extremely difficult to live on their income. Regarding
their relationship status, many of the participants were separated (30.8%) or single (30.3%)
followed by divorced (19.5%) and married (15.9%). Over 82% of the participants are financially
responsible for children with most of the participants responsible for three children or less.
Finally, most of the participants (79.2%) are not currently in an abusive relationship.
To understand the difference between the participants that completed all four interviews (n=195)
and those that did not (n=262), a number of statistical tests were run. Results indicated that
individuals that completed all four interviews (n=195) were older by about two years. There was
also a statistically significant difference among ethnic groups. A higher percentage of women
that identified as “Latinas” and a lower proportion of those identifying as “Other” completed all
four interviews compared to those that completed between one and three interviews. No other
significant differences were found.
Survivors who were randomly selected to receive the economic empowerment curriculum
(experimental group) showed significantly higher scores than women in the control group and
significant changes over time in:
Financial literacy
Financial attitudes
Economic self-efficacy
Economic self-sufficiency
Financial intentions (or motivation)

4
Financial behaviors
Quality of life
Survivors in the experimental group also showed significantly lower scores when compared to
participants in the control group and significant changes over time in:
Financial strain
Perceptions on difficulty living on annual household income
Survivors in BOTH groups also showed significantly lower scores over time in the following;
however, there were no significant differences between the experimental or control groups:
Economic abuse
Physical, psychological, & sexual abuse
Depression
Anxiety
PTSD
As an experimental study, the results strongly indicate that the differences observed post-
curriculum are likely caused by participation in the curriculum and not by other factors. Our
ability to generalize these findings to other populations is limited by two issues. First, the
agencies in the study chose to participate. It is possible that the success of the curriculum rests
with the support from the agencies and the advocates charged with providing the curriculum.
Second, all of the women in the study were receiving services; hence the results cannot be
generalized to all women who experience IPV. This is an important limitation when considering
our findings on mental health and abuse measures. Finally, some of the measures chosen were
untested; additional validation is needed to ensure the scales appropriately capture the intent of
the questions. Further testing is needed to address all of these limitations.
The data collected from the IPV survivors in this study provide rich information on the positive
impact the curriculum has on their lives across a number of key variables. Several
recommendations emerge as a result of this study and include:
Practice and Policy Implications. The curriculum shows great promise as a core service for
IPV survivors wishing to escape abuse. Financial concerns are often rated as top concerns for
victims seeking to escape. This curriculum provides the needed knowledge, skills, and efficacy
to change financial behaviors to economically support survivors to live independently from their
abusers. Hence, we recommend the following:
Train all advocates and agency staff on this curriculum as a personal tool to empower
staff as well as how to provide the curriculum in group and individual settings with
survivors.
Consider the curriculum as a core service that should be included in the “toolkits” of all
staff working with survivors.
Economic abuse should be included in all standard assessments, alongside physical,
emotional, and sexual abuse.
Include this curriculum as one type of support group that is offered to all survivors.

5
Advocate that the next re-authorization of the Violence Against Women Act (VAWA)
includes recognition of economic abuse and how financial literacy can positively help
survivors. Insist that funding be included to cover such services.
Dissemination. Several strategies should be attempted when disseminating the information to a
larger population of stakeholders. These stakeholders include administrators and staff of
domestic violence organizations, Allstate employees, policy makers, academics, and the general
public (which include IPV survivors). Hence, listed below are some recommended strategies to
disseminate the results from this study:
Submit scholarly articles for publication in academic journals and for presentations at
academic conferences
Develop and publish “Research Briefs” on the VAWC and TAF websites. These briefs
will be summaries of published articles, condensed to 2-3 pages of key points from the
articles.
Develop and disseminate a brief summary of this report to be distributed to domestic
violence organizations and Allstate entities.
Invite participating agencies to the summer conference held at TAF; present the data
collected in several different presentations and workshops
Develop and implement a social media campaign that promotes the findings from this
study and the importance of the curriculum. Engage the general public on discussions
about economic abuse and economic empowerment.
Research. Finally, further research is needed to address the limitations identified in this study
and to further analyze the data collected to understand the more nuanced results.
Recommendations include:
Conduct further analyses with these data; disseminate results using the recommendations
listed above. Some examples include:
o Determining the models (including the pathways) that best predict what is needed
to change financial behavior over time
o Determining the models (including the pathways) that best predict improving
survivors’ financial well-being and economic empowerment over time
o Determining the models (including the pathways) that best predict improving
survivors’ emotional well-being including quality of life, depression, anxiety, and
PTSD over time
o Determining the role that economic abuse plays with depression among survivors.
Identify barriers that battered Latina immigrants face in achieving economic self-
sufficiency and financial well-being. Little is known about the ways in which battered
Latina immigrants address barriers to economic self-sufficiency and financial well-being
as they strive to support themselves and their families on a daily basis and live free from
violence and abuse. There is also a lack of understanding regarding the connection
between financial well-being and emotional well-being for battered Latina immigrants.
Interviews for this study are currently being conducted.
Replicate this study with IPV survivors NOT receiving services from domestic violence
organizations but residing in their communities to determine if the impact of the
curriculum is the same as it is with IPV survivors receiving services from domestic
violence organizations.

6
Replicate this study with women (non IPV survivors) living in impoverished
communities to determine if the impact of the curriculum is the same as it is with IPV
survivors.
Continue testing the reliability and validity of the measures and scales used in this study.
Develop and implement a study that examines what is needed for domestic violence
organizations to successfully implement and sustain an economic empowerment program.
This could include comparing how agencies implement the curriculum as well as
comparing the impact of the curriculum to other economic empowerment strategies such
as micro-enterprise loans or matched savings programs.
Develop and implement a study that examines how best to implement the curriculum
based on cultural, social, and socio-economic backgrounds. For example, does the
Spanish curriculum work culturally with all Latina groups? How well would the
curriculum work with survivors from higher socio-economic groups?

7
Introduction
This project builds upon the previous evaluation conducted by the Center on Violence Against
Women & Children (VAWC) at Rutgers University, School of Social Work to accomplish a
multi-year experimental, longitudinal design to determine the impact of the Moving Ahead
through Financial Management curriculum with survivors of violence. Survivors were assigned
to either an experimental group (receiving advocacy services and the curriculum during group
and individual sessions) or a control group (receiving advocacy services only). All survivors,
recruited on an ongoing basis, were interviewed four times over a 14 month period. The specific
aims included:
1. Develop a randomized control study in partnership with key leaders from different
sectors and multidisciplinary backgrounds that expands our knowledge about the
effectiveness and impact of The Allstate Foundation’s (TAF) financial literacy program
with survivors of violence.
2. Determine if participation in the Moving Ahead through Financial Management
curriculum improves survivors’ lives on a number of outcome variables including all
forms of abuse, economic empowerment, economic self-sufficiency, economic self-
efficacy, financial literacy, financial well-being, and emotional well-being.
Our hypotheses included the following:
1. Survivors who learn the “Moving Ahead Through Financial Management” curriculum,
when compared to survivors who have not learned this curriculum, will have greater
improvements in the following areas:
a. Their financial literacy knowledge
b. Their perception of their economic empowerment, economic self-sufficiency,
economic self-efficacy, and quality of life
c. Their financial intentions and behaviors
2. Survivors who learn the “Moving Ahead Through Financial Management” curriculum,
when compared to survivors who have not learned this curriculum, will have lower rates
in the following areas:
a. The abuse they experience including economic, psychological, and physical
b. Their emotional well-being including depression, post-traumatic stress disorder
(PTSD), and anxiety
c. Their financial stress
The goal of Year One (July 2010-June 2011) was to accomplish the first aim of the project,
namely to develop a randomized control study in partnership with key leaders from different
sectors and multidisciplinary backgrounds that expands our knowledge about the effectiveness
and impact of TAF’s financial literacy program with survivors of violence. Such development
was necessary since conducting randomized controlled studies with domestic violence survivors
AND understanding financial literacy and economic empowerment are innovative and
groundbreaking work.
To accomplish the specific aim of Year One, several strategies were used including: 1) creating
an Advisory Committee to provide input into the project; 2) finalizing the research design (i.e.

8
the survey, data collection procedures, and the curriculum protocol); 3) recruiting agencies to
participate in the project; and 4) hosting a national meeting to train all involved on the
curriculum and the research protocols.
Research Design
The research design included creating the curriculum protocol, recruiting agencies, hosting a
national meeting, finalizing data collection procedures, and developing the survey. The final
section of the research design includes the data analyses strategies used.
Creating the Curriculum Protocol
The VAWC-Rutgers research team drafted a curriculum protocol for advocates to follow when
implementing the economic empowerment curriculum. Such protocols were needed to establish
the reliability (or fidelity) of the “intervention.” In most research designs, the “intervention” was
to be given in the same manner for every single research participant. However, providing such a
consistent intervention in multiple agencies by multiple advocates with different ways of
providing the curriculum was not attainable or feasible. Hence, the research team created
standards that were consistent across agencies but still allowed for flexibility in how the
curriculum was implemented.
The draft protocol was reviewed, revised, and finalized by the Curriculum Protocol Task Force
(that included the advocates’ input). The final protocol required the following for all agencies
involved in the project:
Provide at least 4 group sessions and at least 1 individual session
All content from each module in the curriculum must be covered; the way the curriculum
is delivered (including the order of the content) is up to the individual agency
A checklist must be completed by each agency to ensure that all of the topics are covered.
This checklist was developed using the topics found in the curriculum
Recruiting Agencies
While the survey, data collection procedures, and curriculum protocol were being developed, the
research teams in all three regions began recruiting agencies to participate. Researchers met with
agency directors and staff to review the project, discuss the roles and responsibilities of the
agency and the researchers, and invite those interested to participate in the project. Names of
agencies potentially interested were generated by state coalitions who have trained agencies on
the economic empowerment curriculum. Fourteen agencies were recruited from Connecticut (1),
Iowa (2), New Jersey (3), New York (2), Rhode Island (1), Texas (2), Wisconsin (1) and Puerto
Rico (2). All 14 agencies were invited to submit for additional financial support from The
Allstate Foundation to participate in the project. Additionally, two advocates from each agency
were invited to attend a national meeting in Chicago, held at the end of May.
Hosting a National Meeting
VAWC-Rutgers, in cooperation with staff from The Allstate Foundation, hosted a national
meeting in Chicago May 29-31, 2011. This three-day meeting included training on the
curriculum – provided by Kim Pentico, Rene Renick, and Jolynn Woehrer from NNEDV – as
well as information on the research project. Fifty people attended this meeting including 15

9
Advisory Board members, 26 advocates, and 9 researchers. NNEDV discussed the goals of each
curriculum module, brainstormed strategies for delivering the curriculum, and discussed ways to
troubleshoot challenges that advocates might encounter. The research team started with a
presentation on the results from the first project and an overview of the current project. They
then differentiated the advocates’ versus the researchers’ roles in the project, discussed
recruitment strategies, and presented the curriculum protocol. Their presentation ended with a
review of the survey and the questions to be asked.
Throughout the meeting, advocates and researchers were encouraged to network with each other
and learn from each other about their own successes in implementing the curriculum. VAWC-
Rutgers created a listserv to provide researchers, advocates, and funders to stay connected,
provide information and support, and seek answers to challenges faced.
Finalizing Data Collection Procedures
The VAWC Rutgers research team developed draft data collection procedures that were finalized
by the Data Collection Task Force of the Advisory Committee. The procedures included
decisions as to the timing of each interview, how interviews were to be conducted, how survivors
would be selected for the experimental and control groups, and incentives provided. First, each
participant was interviewed four (4) times with Time 1 (T1) occurring one to two weeks before
the commencement of the curriculum. Time 2 (T2) interviews were conducted after the delivery
of the curriculum or approximately 2 months after T1. The final two interviews (T3 & T4) were
conducted approximately every 6 months after T2.
The first interview was conducted face-to-face with the data recorded using SNAP software, an
online survey tool. A second and subsequent set of interviews were conducted by telephone or in
person. Upon conclusion of the T1 interview, participants were randomly divided into a control
or experimental group with the latter group receiving the curriculum.
The participants were recruited from 14 different advocacy organizations located in 7 different
states and Puerto Rico. Advocates in these agencies distributed informational flyers to IPV
survivors in order to provide them with information about the study. Participant eligibility
criteria included: 1) must be female over the age of 18; 2) must have experienced some form of
IPV (i.e. physical, psychological, sexual, or economic) at least once in the previous year; 3) have
not attended a financial literacy class within the past 2 years, 4) are committed to attend the
curriculum group if selected, and 5) and are committed to participate in the research project
whether or not they are selected for the curriculum group. Participating domestic violence
agencies included both shelters and non-residential programs. Participants were given a twenty
dollar incentive for completing the T1 interview, twenty-five dollars at T2, thirty dollars at T3,
and forty dollars at T4. The study protocol was approved by the Rutgers Institutional Review
Board.
Developing the Survey
The VAWC-Rutgers research team reviewed the survey used in the original Allstate project as
well as to determine which theoretical model best fits the overall purpose of this project. One
such theory was chosen – The Theory of Planned Behavior (TPB). The team took the TPB and
mapped out a conceptual diagram of particular variables (i.e. factors or topics) that should be

10
included in the survey in order to predict a change in financial behaviors. (See Attachment 1:
Conceptual Model.)
Survey development started with running exploratory factor analyses (EFA) on scales used in the
first Allstate project. Such analytical techniques determine how to reduce the number of
questions asked in several untested scales. After several of these EFAs were completed, the
research team reviewed all of the remaining scales to determine if such scales were appropriate.
The research team then combined TPB with lessons learned from the EFAs and from a review of
all of the questions used in the first project and created a draft survey (See Attachment 2:
Survey) that included:
Demographic factors (i.e. age, ethnicity, disability, employment & education status,
children, marital status, income, health insurance)
Family of Origin Financial Practices
Abuse including physical, emotional, and economic abuse
Financial knowledge (i.e. financial literacy)
Financial Attitudes
Economic self-efficacy
Economic self-sufficiency
Current Financial Norms
Financial behavioral intentions
Financial behaviors
We included several outcome measures that we believe a change in financial behaviors would
impact, namely survivor’s financial and emotional well-being.
Financial well-being
o Financial strain
o Subjective satisfaction
Emotional well-being
o Quality of Life
o Depression
o Anxiety
o PTSD
The draft survey was then circulated and discussed with members of the Survey Development
Task Force prior to finalizing the questions to be asked. The final survey was then entered into
SNAP, an online data collection program. The online survey can be viewed at:
http://snapwebhost.rutgers.edu/snapwebhost/surveypreview.asp?k=130514074306
The final survey was also translated into Spanish by Dr. Elithet Silva-Martinez and validated by
one of the research interviewers in Texas (Dr. Delissa Garcia Nuno). See Attachment 3 for the
Spanish version of the survey.
The Data Analysis Plan
Several strategies were used to analyze the data collected from the interviews. After the T1
interviews, analyses were conducted on the scales used for each variable. For new or revised

11
scales, we used exploratory factor analyses; for existing scales, we used confirmatory factor
analyses. These strategies are used to understand the reliability and validity of the scales and the
questions asked in each scale. The results of these analyses can be found in Attachment 4.
When conducting analyses, it is important to understand any missing data, which happens if a
participant chooses to skip a question. Large amounts of missing data can lead to serious
challenges in evaluating the curriculum. An examination of the data in all four time periods,
however, indicate that there is very little missing data with less than five percent missing for all
variables; for many variables, the proportion of missing data is zero. This negligible proportion
of missing data is likely attributable to the method of data collection. Participants were
interviewed face-to-face or over the phone for each time period, leaving little opportunity to skip
or ignore questions. As there are few missing values (less than 5% for all variables), those
values can be considered missing at random and the typical statistical method of listwise deletion
will be used for handling the missing values.
Data analysis also included a series of repeated measure ANOVAs as a way to evaluate the
overall impact of the curriculum on financial and emotional well-being outcomes of interest over
time. These analyses were used to determine whether there were significant differences between
those participants who received the curriculum and those who did not on scale variables of
interest. These analyses also determined whether those differences were a result of the passage
of time or if they could be attributed to participation in the curriculum. The results of these
analyses can be found in Section 3. Impact of the Curriculum.
Results
The results focus on the impact of the curriculum over time by comparing a number of outcome
measures for curriculum participants (experimental group) versus non-participants (control
group). Results are divided into six sections:
1. Data Collected from Research Project Locations – summary of interviews completed per
domestic violence organization over the four time periods
2. Demographic Characteristics – comparison of key characteristics of the sample of women
who completed the first interview (initial sample) to the sample of women who
completed all four interviews (longitudinal sample).
3. Impact of the Curriculum (longitudinal sample only) – presentation of scale outcome
measures for women who completed the curriculum versus those that did not.
4. Skills Learned and Applied (experimental group only) – description of the accounts from
participants on the skills acquired from the curriculum and the subsequent use of these
skills.
Section 1. Data Collection from Research Project Participants
A total of 457 women participated in the first round of interviews, 241 of whom were assigned to
the curriculum group and 216 of whom were assigned to the control group. In the second round,
300 women completed interviews. In the third round, 279 women completed interviews and in
the fourth round, 245 women participated in the final round of interviews. The number of
participants in each study group (control and experimental) remained fairly even in all time

12
periods. Table 1 presents the list of states and sites participating in the evaluation and the sample
size for each wave of data collection. If a woman did not complete one of the interviews, the
researcher continued to contact her and included her in later interviews when possible. For
example, if a woman did not complete Time 2, she may be added back into the sample during
data collection at Time 3. The sample size of 245 at Time 4 does not indicate that 245 women
completed all four interviews.
Table 1. Evaluation States and Sites
Agency Name T1 T2 T3 T4
Northeast 220 135 122 104
Connecticut Women’s Center 31 8 8 8
New Jersey Jersey Battered Women’s Services
(JBWS)
35 26 24 19
Women’s Space 15 15 14 12
YWCA 23 16 15 10
New York Sahki 22 14 5 7
VIP 61 33 38 30
Rhode Island Sojourner House 33 23 18 18
Midwest 72 37 33 34
Iowa Domestic Violence Intervention Program 23 9 6 6
Family Resources 11 0 0 0
Wisconsin Sojourner Family Peace Center 38 28 27 28
Texas 131 95 92 76
The Family Place 110 88 75 62
Safe Haven 21 7 17 14
Puerto Rico 34 33 32 31
Matria 14 14 13 14
Nueva Mujer 20 19 19 17
TOTAL 457 300 279 245
In addition to knowing the sample size at particular time periods, the number of interviews
completed by each participant is also of interest. Table 2 reports the number of women who
completed one, two, three, or all four interviews by region, state and agency. As the table
demonstrates, 116 (25%) women, who only completed the first interview, were dropped from the
project. Women were dropped for various reasons, including: the agency did not provide the
curriculum to the experimental group; the agency provided the curriculum to the control group;
the participant did not complete the curriculum; the researcher was not able to get in contact with
the participant; and the participant did not want to continue in the project. Although any drop in
participation is important to consider, the usual attrition rate in other studies of domestic violence
survivors, an often times very mobile group, is much higher.
Table 2. Participant Count by Number of Completed Interviews
Agency Name 1 2 3 4
Northeast 58 36 53 73
Connecticut Women’s Center 16 8 5 2
New Jersey Jersey Battered Women’s Services 6 6 6 17

13
Agency Name 1 2 3 4
(JBWS)
Women’s Space 0 0 4 11
YWCA 3 5 9 6
New York Sahki 8 5 6 3
VIP 18 7 14 22
Rhode Island Sojourner House 7 5 9 12
Midwest 31 6 6 29
Iowa Domestic Violence Intervention Program 13 4 1 5
Family Resources 11 0 0 0
Wisconsin Sojourner Family Peace Center 7 2 5 24
Texas 26 10 32 63
The Family Place 22 8 23 57
Safe Haven 4 2 9 6
Puerto Rico 1 0 3 30
Matria 0 0 1 13
Nueva Mujer 1 0 2 17
TOTAL 116 52 94 195
Considering the remaining 75 percent of the sample (n=341), 15 percent of the women
completed two interviews, 28 percent completed three interviews, and close to half (n = 195,
57%) completed all four interviews. This report focuses on this group of 195 women that
completed all four interviews. By limiting our analysis to women in this longitudinal sample, we
are able to show a very detailed picture of the impact of the curriculum over time.
Complementary analysis will be conducted at a later time that will utilize various groupings of
the samples, including the full sample of 457 when appropriate.
Section 2. Demographic Characteristics
The following tables present the frequencies and percentages for the demographic variables
using both the initial sample (n=457) and the sample that completed all four interviews (n=195),
also called the longitudinal sample. It is important to compare these groups to account for any
potential differences in demographics that might impact the research outcomes.
Participants from the initial sample (n=457) ranged in age from 18 to 64 years of age with an
average age of 36. Almost 45% of the participants identified themselves as Latina or Hispanic;
almost 20% identified as Black, non-Hispanic. Over 18% identified themselves as “other” (i.e.,
bi-racial, Native American, Asian). Only 18% identified themselves as White, non-Hispanic.
Participants from the longitudinal sample (n=195) ranged in age from 21 to 62 years of age with
an average age of 38. Sixty percent of the participants identified themselves as Latina or
Hispanic; over 20% identified as Black, non-Hispanic. Less than 5% identified themselves as
“other” (i.e. Asian, Multi-ethnic), and 14.4% identified themselves as White, non-Hispanic.
Table 3. Ethnicity

14
Ethnic Group Initial sample
(n=457)
Longitudinal sample
(n=195)
Latina / Hispanic 246 (53.8%) 117 (60%)
Black 92 (20.1%) 41 (21%)
White, non-Hispanic 80 (17.5%) 28 (14.4%)
Other 39 (8.6%) 9 (4.6%)
Additionally, for the initial sample (n=457) over 54% of the participants answered “no” when
asked if they were born in the U.S.; 79% of those (n=258) had lived in the U.S. for 5 years or
more.
For the longitudinal sample (n=195) over 45% answered “no” when asked if they were born in
the U.S.; over 87% of those (n=77) had lived in the U.S. for 5 years or more.
Table 4. Were you born in the United States of America?
Initial sample
(n=457)
Longitudinal sample
(n=195)
Yes 236 (51.6%) 107 (54.9%)
No 219 (47.9%) 88 (45.1%)
Missing 2 (0.4%) 0 (0%)
If you were not born in the U.S., how long have you lived here?
Less than 1 year 3 (0.7%) 2 (2.2%)
1 year to less than 5 years 20 (4.4%) 9 (10.2%)
5 years to less than 10 years 58 (12.7%) 16 (18.1%)
10 years or more 138 (30.2%) 61 (69.3%)
Missing 2 (0.4%) 0 (0%)
Information about employment and student status was also collected from the participants.
Results were similar for both groups. Over half of the participants (54% of the initial sample and
50.8% of the longitudinal sample) were not working; most participants (86%) were not in school.
Participants were also asked if they had health insurance. A little over half of the participants in
both samples (53% and 60%) said yes.
Table 5. Employment & Student Status
Initial sample
(n=457)
Longitudinal sample
(n=195)
Are you currently employed?
Yes, Full-Time 103 (22.5%) 46 (23.6%)
Yes, Part-Time 102 (22.3%) 49 (25.1%)
No 250 (54.7%) 99 (50.8%)
Missing 2 (0.4%) 1 (0.5%)
Are you currently a student?
Yes, Full-Time 20 (4.4%) 9 (4.6%)

15
Initial sample
(n=457)
Longitudinal sample
(n=195)
Yes, Part-Time 42 (9.2%) 19 (9.2%)
No 392 (85.8%) 167 (85.6%)
Missing 3 (0.7%) 1 (0.5%)
Do you have health
insurance?
Yes 252 (55.1%) 117 (60%)
No 202 (44.2%) 77 (39.5%)
Missing 2 (0.4%) 1 (0.5%)
Table 6 presents data on family demographics including marital status, children, and current
relationship with an abuser. For the initial sample (n=457), results indicated that many of the
participants were single (35%) followed by separated (28%) or divorced (19%). Almost 78% of
the participants were financially responsible for children with most of the participants
responsible for three or less children. Finally, most of the participants (80%) were not currently
in an abusive relationship.
For the longitudinal sample (n=195), results indicated that many of the participants are separated
(30.8%) or single (30.3%) followed by divorced (19.5%) and married (15.9%). Over 82% of the
participants are financially responsible for children with most of the participants responsible for
three children or less. Finally, most of the participants (79.2%) are not currently in an abusive
relationship.
Table 6. Family Demographics
Initial sample
(n=457)
Longitudinal sample
(n=195)
Marital Status
Married 68 (14.9%) 31 (15.9%)
Civil Union / Partnership 12 (2.6%) 6 (3.1%)
Separated 124 (27.1%) 60 (30.8%)
Divorced 84 (18.4%) 38 (19.5%)
Widowed 5 (1.1%) 1 (0.5%)
Single (includes dating) 163 (35.7%) 59 (30.3%)
Missing 1 (0.2%) 0 (0%)
Financially responsible for
children?
Yes 365 (79.9%) 160 (82.1%)
No 91 (19.9%) 35 (17.9%)
Missing 1 (0.2%) 0 (0%)
If yes, how many children?
One child 108 (23.6%) 47 (24.1%)

16
Initial sample
(n=457)
Longitudinal sample
(n=195)
Two children 120 (26.3%) 53 (27.2%)
Three children 82 (17.9%) 38 (19.5%0
More than three children (4-
15) 54 (11.8%)
22 (11.2%)
N/A 91 (19.9%) 35 (17.9%)
Missing 2 (0.4%) 0 (0%)
In a current abusive
relationship?
Yes 91 (19.9%) 36 (18.5%)
No 362 (79.2%) 158 (81%)
Missing 4 (0.9%) 1 (0.5%)
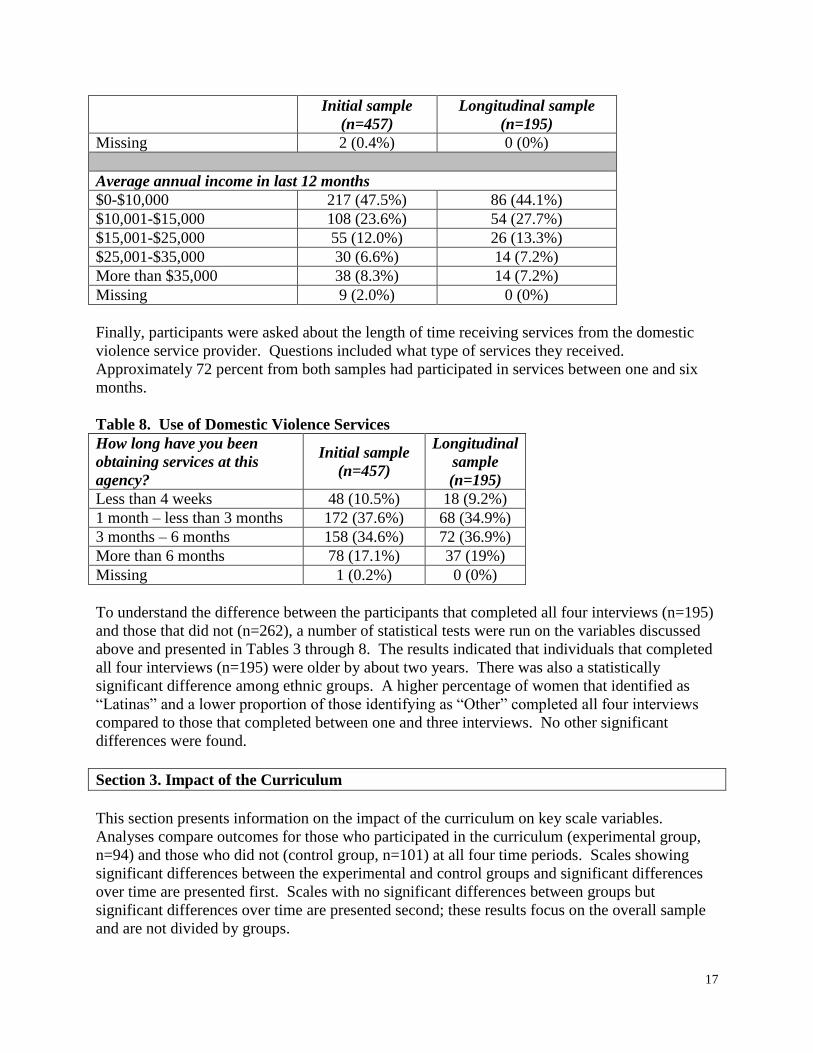
Participants were asked about their financial status. Questions were asked about their
perceptions of income difficulty in their childhood household as well as in their current
household. Finally, participants were also asked about their average annual income. As seen in
Table 7, most of the participants in the initial sample (n=457) grew up in homes in which it was
difficult for the family to live on the income. Additionally, most of the participants (83%) made
less than $25,000 in the past year for their entire household, resulting in most participants (79%)
reporting that it was somewhat difficult to extremely difficult to live on their income.
In the longitudinal dataset (n=195) most of the participants grew up in homes in which it was
difficult for the family to live on the income. Additionally, most of the participants (44.1%)
made less than $25,000 in the past year for their entire household, results in most participants
(80.5%) reporting that it was somewhat difficult to extremely difficult to live on their income.
Table 7. Financial Background
Initial sample
(n=457)
Longitudinal sample
(n=195)
How difficult was it for your family to live on their total household income?
Extremely difficult 93 (20.4%) 47 (24.1%)
Very difficult 75 (16.4%) 37 (19%)
Somewhat difficult 113 (24.7%) 45 (23.1%)
A little difficult 96 (21.0%) 38 (19.5%)
Not at all difficult 77 (16.8%) 28 (14.4%)
Missing 3 (0.7%) 0 (0%)
How difficult was it for you to live on your income in the past 12 months?
Extremely difficult 133 (29.1%) 63 (32.3%)
Very difficult 142 (31.1%) 62 (31.8%)
Somewhat difficult 84 (18.4%) 32 (16.4%)
A little difficult 81 (17.7%) 32 (16.4%)
Not at all difficult 15 (3.3%) 6 (3.1%)
17
Initial sample
(n=457)
Longitudinal sample
(n=195)
Missing 2 (0.4%) 0 (0%)
Average annual income in last 12 months
$0-$10,000 217 (47.5%) 86 (44.1%)
$10,001-$15,000 108 (23.6%) 54 (27.7%)
$15,001-$25,000 55 (12.0%) 26 (13.3%)
$25,001-$35,000 30 (6.6%) 14 (7.2%)
More than $35,000 38 (8.3%) 14 (7.2%)
Missing 9 (2.0%) 0 (0%)
Finally, participants were asked about the length of time receiving services from the domestic
violence service provider. Questions included what type of services they received.
Approximately 72 percent from both samples had participated in services between one and six
months.
Table 8. Use of Domestic Violence Services
How long have you been
obtaining services at this
agency?
Initial sample
(n=457)
Longitudinal
sample
(n=195)
Less than 4 weeks 48 (10.5%) 18 (9.2%)
1 month – less than 3 months 172 (37.6%) 68 (34.9%)
3 months – 6 months 158 (34.6%) 72 (36.9%)
More than 6 months 78 (17.1%) 37 (19%)
Missing 1 (0.2%) 0 (0%)
To understand the difference between the participants that completed all four interviews (n=195)
and those that did not (n=262), a number of statistical tests were run on the variables discussed
above and presented in Tables 3 through 8. The results indicated that individuals that completed
all four interviews (n=195) were older by about two years. There was also a statistically
significant difference among ethnic groups. A higher percentage of women that identified as
“Latinas” and a lower proportion of those identifying as “Other” completed all four interviews
compared to those that completed between one and three interviews. No other significant
differences were found.
Section 3. Impact of the Curriculum
This section presents information on the impact of the curriculum on key scale variables.
Analyses compare outcomes for those who participated in the curriculum (experimental group,
n=94) and those who did not (control group, n=101) at all four time periods. Scales showing
significant differences between the experimental and control groups and significant differences
over time are presented first. Scales with no significant differences between groups but
significant differences over time are presented second; these results focus on the overall sample
and are not divided by groups.

18
Financial Knowledge (Literacy): The individual’s perceived financial knowledge was
measured through the Financial Literacy Scale (Postmus, Plummer, McMahon, & Zurlo, 2013).
This scale was created during the last round of data collection based on the curriculum and
included 51 questions. The scale was then revised, using an EFA, into a shortened version (13
questions) that included 4 subscales: Knowledge about Credit (4 items, α = .86), Knowledge
about Obtaining Resources (3 items, α = .820), Knowledge about Investing and Long Term
Planning (4 items, α = .87), and Knowledge about Joint Assets with Partner (2 items, α = .825).
Another EFA was conducted with this scale for this study and additional questions were
removed. The four subscales remained the same but the number of questions was 15. The
reliability coefficients for this scale are: Knowledge about Credit (5 items, α = .887), Knowledge
about Obtaining Resources (4 items, α = .678), Knowledge about Investing and Long Term
Planning (4 items, α = .852), and Knowledge about Joint Assets with Partner (2 items, α = .878).
Participants in the experimental group started with a mean score of 2.67, lower than the control
group who started with a mean score of 2.81. Both groups showed significant improvement over
time. However, the curriculum had a statistically significant impact on outcomes, with the
experimental group scoring 4.01 in comparison to 3.27 for the control group at Time 4.
Responses to Financial Literacy Scale for experimental group are reported in Table 9 of this
report.
2.81 3.09
3.313.27
2.67
4.04 3.95 4.01
2.5
3
3.5
4
4.5
Time 1 Time 2 Time 3 Time 4
Financial Literacy Mean (n=195)
Control Group
Experimental Group
Financial Attitudes: The scale measuring financial attitudes includes a scale (15 questions)
created from existing financial attitudes scales (Parrotta & Johnson, 1998) and from the addition
of four questions related to gender norms and finances. Since this scale was new, an EFA was
completed and resulted in a reduction from 19 questions to 14 questions and three subscales
including Barriers to Financial Management 72 questions – mean = 3.99 on 5 point scale,
α=.732), Attitudes about Financial Planning (3 questions – mean = 4.30, α=.684), Gender
Attitudes Related to Finances (2 questions – mean = 3.81, α=.595), and Future Financial
Planning (2 question – mean = 4.19, α=.697).
Participants started at a similar place with mean scores of approximately 4.0 for each group. The
experimental group shows significant improvement over time, with the initial improvement from
T1 to T2 most notable. The curriculum had a statistically significant impact on outcomes as

19
well, with the experimental group scoring about 4.2 in comparison to 4.0 for the control group in
all follow-up periods.
4.03 4 3.99 3.99
4.02
4.2 4.19 4.17
3
3.5
4
4.5
5
Time 1 Time 2 Time 3 Time 4
Financial Attitudes Mean (n=195)
Control Group
Experimental Group
Economic Self-Efficacy: The scale of Economic Self-Efficacy was created by altering the
General Self-Efficacy Scale using Bandura’s General Self-Efficacy Scale (Schwarzer &
Jerusalem, 1995). This scale captures the participants’ confidence in managing their finances.
For each item, the wording was changed to specify financial self-efficacy. In addition, the
responses were changed to range from 1 (Strongly Disagree) to 5 (Strongly Agree). The scale
demonstrated adequate internal reliability with a Cronbach’s Alpha of .883.
Participants started at a similar place with mean scores of approximately 3.1 for each group.
Both groups showed improvement over time. However, the curriculum had a statistically
significant impact on outcomes, with the experimental group scoring 3.8 in comparison to 3.51
for the control group in Time 4.
3.13
3.32
3.53 3.513.15
3.65 3.76 3.8
2
2.5
3
3.5
4
Time 1 Time 2 Time 3 Time 4
Economic Self-Efficacy Mean (n=195)
Control Group
Experimental Group

20
Economic Self-Sufficiency: The scale for Economic Self-Sufficiency (Gowdy & Pearlmutter,
1993) is a 15-question scale that asks participants to indicate their ability to accomplish
financially-related tasks regarding their economic situation during the 30 days prior to the
interview. Participants rated their level of financial self-sufficiency using a 5-point scale with
answers ranging from 1 (no, not at all) to 5 (yes, all of the time). Since limited analyses had been
done on the development of this scale, we opted to run an EFA, resulting in a 14-question scale
(mean = 2.50, α=.86) and 3 subscales including: Ability to Manage Daily (Immediate) Financial
Needs (7 questions – mean = 2.86, α=.80) and Ability to Have Discretionary Funds (3 questions
– mean = 1.66, α=.742), and Basic Assets for Community Living (4 questions – mean= 2.50,
α=.64)
Participants started at a similar place with mean scores of approximately 2.51 for experimental
group and 2.45 for the control group. Both groups showed improvement over time. The
curriculum had a statistically significant impact on outcomes, with the experimental group
scoring 3.3 in comparison to 2.92 for the control group.
2.45
2.77 2.89 2.922.51
3.013.19
3.3
2
2.5
3
3.5
4
Time 1 Time 2 Time 3 Time 4
Economic Self Sufficiency Mean (n=195)
Control Group
Experimental Group
Financial Intentions & Behaviors: The next set of figures outlines Financial Behavioral
Intentions and Financial Behavior. Financial Behavioral Intentions (or motivation) included
questions about participants’ motivation to perform certain financial behaviors. Financial
Behaviors are those actual financial behaviors participants used over the past month. Both sets
of questions (14 in total) were created from the Economic Empowerment Curriculum and were
similar in nature. Participants were first asked about their financial behavior (How often, in the
last month, did you….), followed by their intentions (How likely are you in the next month
to…).
Participants started at a similar place for financial intentions with mean scores of approximately
3.08 for the experimental group and 2.97 for the control group. Both groups showed
improvement over time. However, the curriculum had a statistically significant impact on
outcomes, with the experimental group scoring 3.59 in comparison to 3.24 for the control group
in Time 4.

21
2.97 3.113.26 3.24
3.08
3.76 3.623.59
2
2.5
3
3.5
4
Time 1 Time 2 Time 3 Time 4
Financial Intentions Mean (n=195)
Control Group
Experimental Group
Participants started at a similar place with mean scores of financial behaviors as 2.84 for the
experimental group and 2.76 for the control group. The curriculum had a statistically significant
impact on outcomes, with the experimental group scoring 3.53 in comparison to 3.1 for the
control group in Time 4. Although the scores of both groups improved over time, the graph
illustrates that the curriculum group experienced a large increase between Time 1 and T2, while
the control group’s change was more constant and less notable. Responses to Financial
Behaviors Scale for experimental group are reported in Table 10.
2.76 2.823.12 3.1
2.84
3.45 3.483.53
2
2.5
3
3.5
4
Time 1 Time 2 Time 3 Time 4
Financial Behaviors Mean (n=195)
Control Group
Experimental Group
Financial Strain: The Financial Strain survey (Aldana & Liljenquist, 1998) includes 18
questions on a scale from 1 (Never) to 5 (Always) and includes 5 subscales including Education
(3 items – mean = 3.15), Relationships (4 items – mean = 2.78), Physical (4 items – mean =
3.15), Credit Card Use (3 items – mean = 1.39) and Meeting Obligations (4 items – mean =
2.97). The overall scale demonstrated high reliability with an alpha coefficient of .84. All
subscales in this study, except for the Credit Card Use subscale, demonstrated high internal
reliability (Education, α=.81, Relationships, α=.80, Physical, α=.87, Credit Card Use, α=.54, and
Meeting Obligations, α=.82).

22
Participants started at a similar place with mean scores of approximately 2.85 for each group.
The scores of both groups decreased significantly over time. However, the curriculum had a
statistically significant impact on outcomes, with the experimental group scoring 1.98 in
comparison to 2.26 for the control group in Time 4.
2.84
2.632.4
2.26
2.86
2.12 2.03 1.98
1.5
2
2.5
3
3.5
Time 1 Time 2 Time 3 Time 4
Financial Strain Mean (n=195)
Control Group
Experimental Group
Difficulty Living on Annual Household Income: Participants reported their difficulty living on
annual household income on a scale of 1, “Not at all difficult,” to 5, “Extremely difficult.” There
was a significant effect of time on outcomes for the overall sample, with the overall sample
starting at a mean score of 3.72 and ending at 3.08. The graph also shows a descriptive
difference between the curriculum and comparison groups, with curriculum participants scoring
2.89 in comparison to 3.25 of the control group at Time 4. However, statistical tests yielded
mixed results on statistical significance over time. This particular outcome is measured by only
one question, as opposed to the other outcomes which are based on scales comprised of multiple
questions. A t-test of means at Time 4 does indicate a significant impact of the curriculum at this
last time point, but further testing will be pursued to further investigate changes over time.
3.75
3.51 3.39
3.25
3.68
3.31
3.062.89
2
2.5
3
3.5
4
Time 1 Time 2 Time 3 Time 4
Difficulty Living on Annual Household Income Mean (n=195)
Control Group
Experimental Group

23
Quality of Life: The Quality of Life Scale (Bybee & Sullivan, 2005) is an adapted version of
Andrews & Whitey’s Scale of Well-Being (Andrews & Whitey, 1976). The scale captures
positive emotional health on a scale of 1-7 and has been validated with survivors of domestic
violence. The scale demonstrates strong reliability with an alpha coefficient of 0.88.
Participants started at a similar place with mean scores of approximately 4.0 for each group.
Both groups showed improvement over time. However, the curriculum had a statistically
significant impact on outcomes, with the experimental group scoring 5.33 in comparison to 4.99
for the control group in Time 4. The graph also illustrates that the improvements for the
experimental group were more dramatic immediately after participating in the curriculum.
4.05
4.54
4.98 4.99
4.06
5.035.16 5.33
3.5
4
4.5
5
5.5
Time 1 Time 2 Time 3 Time 4
Quality of Life Mean (n=195)
Control Group
Experimental Group
All Women Experienced Improvements in Measures of Mental Health and Abuse
The following section covers the scales in which there were significant changes over time;
however there were no significant differences between the experimental or control groups.
Hence, the graphs only focus on the sample as a whole.
Post-Traumatic Stress Disorder (PTSD): Finally, post-traumatic stress disorder (PTSD) was
measured using revised questions from the National Comorbidity Survey (NCS, 1992),
implemented in 1992 as a nationally representative survey that assesses the prevalence and
correlates of DSM-IIIR diagnoses. The scale includes 9 items with responses ranging from 1
(Never) to 4 (Very Often). Among this dataset, the scale demonstrated strong internal reliability
with the Cronbach’s Alpha = .891.
There was a significant effect of time on outcomes for the overall sample, which started at a
mean score of 2.39 and ended at 1.86.

24
2.39
2.021.87 1.86
1
1.5
2
2.5
3
Time 1 Time 2 Time 3 Time 4
Post Traumatic Stress Disorder Mean (n=195)
Overall Sample(n=195)
Anxiety: Anxiety was measured using the Generalized Anxiety Disorder-7 (Spitzer, Kroenke,
Williams, & Lowe, 2006). The scale consists of 7 questions with responses ranging from 1 (Not
at All) to 5 (Nearly Every Day). An 8th
question (not included in the sum and mean scores) asks:
If you checked off any problems, how difficult have these problems made it for you to work,
take care of things at home, and get along with other people? Response options for this question
ranged from 1 (Not Difficult at All) to 4 (Extremely Difficult). Previous studies have found
good internal consistency (.92), test-retest reliability (.83), diagnostic criterion validity with
SCID, and construct validity with the Beck Anxiety Inventory (r=.72) and anxiety subscale from
the SCL-90 (.74) (Spitzer, et al., 2006). Among this dataset, the scale demonstrated strong
internal reliability with the Cronbach’s Alpha = .911.
There was a significant effect of time on outcomes for the overall sample, with the overall
sample starting at a mean score of 2.34 and ending at 1.92.
2.34
2.071.93 1.92
1
1.5
2
2.5
3
Time 1 Time 2 Time 3 Time 4
Anxiety Mean (n=195)
Overall Sample(n=195)
Depression: The Center for Epidemiologic Studies – Depressed Mood Scale (CES-D) (Frazier,
1977) is a 20-item scale used to measure depression symptomatology. Participants were asked to
rate the questions based on the past week on a scale from 1 (less than 1 day) to 4 (5-7 days). To

25
score the scale, four questions are reversed (questions 4, 8, 12 and 16); a sum score is created. In
this study the scale demonstrated strong internal reliability with Cronbach’s alpha = .92.
There was a significant effect of time on outcomes for the overall sample, with the overall
sample starting at a mean score of 2.18 and ending at 2.05, with the greatest difference exhibited
between Time 1 and Time 3 of data collection.
2.181.99
1.85
2.05
1
1.5
2
2.5
3
Time 1 Time 2 Time 3 Time 4
Depression Mean (n=195)
Overall Sample(n=195)
Intimate Partner Violence (physical, sexual, & emotional abuse): The original Abusive
Behavior Inventory (ABI) (Shepard & Campbell, 1992) was used in this study; this inventory
includes two dimensions including: Physical (10 items) and Psychological Abuse (20 items). A
confirmatory factor analysis (CFA) using the two subscales in this dataset was a poor fit so an
exploratory factor analysis (EFA) was run to explore the factor structure of the ABI among this
dataset and reduce duplicate questions or remove questions that were inappropriate. The EFA
resulted in dropping 5 questions. The remaining 25 questions loaded onto 3 subscales including
Psychological Abuse (13 questions – mean = 3.51 on 5-point scale), Physical Abuse (9 questions
– mean = 2.46) and Sexual Abuse (3 questions – mean = 2.16). Each of the subscales
demonstrated a strong internal reliability with Psychological Abuse α=.920, Physical Abuse
α=.929 and Sexual Abuse α=.848. The mean of the overall scale was 3.00.
There was a significant effect of time on outcomes for the overall sample, with the overall
sample starting at a mean score of 2.77 and ending at 1.38.

26
2.77
1.55 1.5
1.38
1
1.5
2
2.5
3
Time 1 Time 2 Time 3 Time 4
Abuse Mean (n=195)
Overall Sample(n=195)
The Scale of Economic Abuse – 12 items (SEA-12) (Postmus, Plummer, & Stylianou, in press)
is a 12-item scale that identifies the frequency of economic abuse participants experienced in their
relationships. Participants were asked to rate how often a partner had exhibited financially
abusive behaviors in the past 12 months. Participants indicated such frequency using a 5-point
scale with answers ranging from 1 (never) to 5 (quite often). The SEA-12 includes three
subscales including: 1) Economic Control (5 questions – mean = 3.15), 2) Economic Exploitation
(3 questions – mean = 2.68) and 3) Employment Sabotage (4 questions – mean = 1.98) (Postmus,
et al., in press). Each subscale in this study demonstrated high internal reliability (Economic
Control, α =.84; and Economic Exploitation, α =.81; and Employment Sabotage, α=.80). The
overall mean for this scale is 2.64.
There was a significant effect of time on outcomes for the overall sample, with the overall
sample starting at a mean score of 2.58 and ending at 1.35.
2.58
1.55 1.49 1.35
1
1.5
2
2.5
3
Time 1 Time 2 Time 3 Time 4
Economic Abuse Mean (n=195)
Overall Sample(n=195)
Section 4. Participant perspectives on skills learned and applied

27
“…knowledge about things I never even thought of - like budgeting - they taught me how
to do that... I learned about different banking options and thinking about the future and
planning...”
“…the program encourages you to talk about your problems and find ways to move
forward.”
This final section of the report describes participants’ impression of the skills they learned and
were able to use since completing the curriculum. For these analyses, we examined the
responses of the 94 women who completed the curriculum and also responded to all four
interviews.
Financial Literacy
Table 9 presents item responses from the financial literacy scale examined above on p. 12.
Curriculum participants were asked to rate whether they knew particular things related to
financial management. Participants were judged as acquiring the following knowledge by a
response of “agree” or “strongly agree” on a five-point scale ranging from 1 (Strongly disagree)
to 5 (Strongly Agree).
Table 9. Financial Literacy Responses for Experimental Group Completing all Time
Periods (n=94)
Item Strongly
Agree/Agree (%) T1 T4
I know how to access my credit card report. 37.2 85.1 I know how to understand my credit report and credit
history. 24.5 83
I know how to improve my credit rating. 20.2 72.4 I know how to create a budget. 35.5 90.4 I know how to create financial goals. 37.3 86.1 I know how to identify my partner’s assets and financial
responsibilities. 27.6 64.5
I know how to identify joint or combined financial
responsibilities and assets. 37.3 81.7
I know how to recognize the signs of financial abuse. 53.8 93.6 I know what to expect if I try to get a loan. 48.9 85.1 I know how to get the resources that are available in my
community to help me leave my abuser. 66.0 93.7
I know how to get public assistance benefits. 73.4 90.5 I know how to get legal assistance in my community. 60.6 91.5 I know how to create a financial safety plan. 45.1 82.9 I know how to invest my savings through things like
savings bonds, mutual funds, and stocks. 17 71.3
I know about community programs such as IDA and 6.4 58.5

28
EITCs that can help me with my financial goals. I know how to plan for retirement and the different types
of plans available. 12.9 67.4
I know how to plan for my estate. 14.9 71.2
The proportion of women who knew how to perform particular financial tasks before
participating in the curriculum (at Time 1) were compared to the proportion with that knowledge
at the last follow-up interview (Time 4). Large increases were found in every item.
Financial Behavior
Curriculum participants were also asked how often they had completed financial tasks in the past
month. Table 10 presents the proportion of women who reported “often” or “always” completing
specific skills on a five-point scale ranging from 1 (Never) to 5 (Always). The table compares
the proportion from Time 1 (pre-curriculum) to the proportion in Time 4.
Table 10. Financial Behaviors Responses for Experimental Group Completing all Time
Periods (n=94)
How often in the last month (30 days) did you… Often/Always (%)
T1 T4 …pay your bills on time? 48.9 79.8 …follow a weekly or monthly budget? 35.1 66.0 …review and evaluate your spending habits? 46.8 65.2 …identify your own financial goals for the future? 34 63.9 …follow your financial goals? 30.8 60.7 …use a bank account? 40.4 57.5 …make financial decisions without much thought? 27.7 14.9 …track down where money was spent? 48.9 73.4 …make payments toward your debt? 43.6 65.6 …contribute to a retirement savings account? 6.4 13 …estimate your monthly household income and
expenses? 43.6 65.9
…spend more money than you had? 25.8 9.5 …set aside money for savings? 10.7 19.1 …pay more than the interest on your loans, credit, etc.? 14.8 15.9
Large increases are found for almost every item with two types of exceptions. First, for two
items, “make financial decisions without much thought” and “spend more money than you had,”
an improvement would be indicated by a decrease over time, as observed. Second, only a
modest increase was seen for the last items, “ pay more than the interest on your loans, credit,
etc.” However, this behavior is arguably affected by income as much or more than knowledge.
Participants were also asked open-ended questions about their feelings about the curriculum.
Their voices complement the quantitative data in the above tables very well. Participants
highlighted a number of areas in which they felt the curriculum was particularly useful. These
included:

29
Credit
I learned how to establish and take advantage of credit. I learned a lot about credit and
bank accounts. As an immigrant, I didn’t know a lot about these things. I really learned
what credit is and I’m continuing to read the books.
How to manage a credit card and ask for loans to make credit, those are things I learned
and still am learning them and I am applying to my life.
I still manage my credit card and what they are charging me for, check the credit card
very frequently.
The information related to credit cards is what I have used the most. I have to pay the
credit card even though I’m not working... so I pay the interest at least
Planning for the future
I learned how to establish long term income for retirement, insurance issues (getting
papers together for safety purposes). All the other stuff I had a little information about
but the curriculum helped me understand it better.
The biggest one is just the savings. Making sure I put at least something in there every
time I get paid. I started a 401K, I put in bi-weekly.
Economic Abuse
The curriculum was very eye opening and invaluable, helping me realize that my partner
is and was extremely financially abusive and I learned how unhealthy that is and
attempted to deal with it.
Investment
…Also, the class has led me to spend more, but be responsible. I bought a place as a way
of investing in mine and my daughter’s security. Gave me a push to be financially
responsible. Since everyone (in the group) is doing it, I should be able too.
Paying Bills/Debt
I have to be attentive to the payments that are due and ensure that I have enough money
to pay what needs to be paid.
Just trying to stay on a strict budget and not going over, and saving what I need to be
saving.
Budgeting
I use the budgeting information the most. I learned a lot regarding managing my money,
how to make a budget and also how to get rid of debt. All of this information is very
useful to me and I use it all the time.
Budgeting. Budget budget budget. And plan ahead, and save money.
Saving Money
I try to save 10% of my income every month. As far as the little things to try and sell stuff.
30
There were many strategies they taught us, save money, not spend on things that are not
necessary. Before I used to go out and buy things that weren't necessary and now I make
a list and only buy what I need.
How to save, even if is a dollar, that is what I do some times, buy stuff in cheaper price
Limitations
As an experimental study, the results strongly indicate that the differences observed post-
curriculum are likely caused by participation in the curriculum and not by other factors. Our
ability to generalize these findings to other populations is limited by two issues. First, the
agencies in the study chose to participate. It is possible that the success of the curriculum rests
with the support from the agencies and the advocates charged with providing the curriculum.
Second, all of the women in the study were receiving services; hence the results cannot be
generalized to all women who experience IPV. This is an important limitation when considering
our findings on mental health and abuse measures. Finally, some of the measures chosen were
untested; additional validation is needed to ensure the scales appropriately capture the intent of
the questions. Further testing is needed to address all of these limitations.
Recommendations
The data collected from the IPV survivors in this study provide rich information on the positive
impact the curriculum has on their lives across a number of key variables. Several
recommendations emerge as a result of this study and are organized under practice and policy
implications, dissemination, and further research.
Practice and Policy Implications
The curriculum shows great promise as a core service for IPV survivors wishing to escape abuse.
Financial concerns are often rated as top concerns for victims seeking to escape. This curriculum
provides the needed knowledge, skills, and efficacy to change financial behaviors to
economically support survivors to live independently from their abusers. Hence, we recommend
the following:
Train all advocates and agency staff on this curriculum as a personal tool to empower
staff as well as how to provide the curriculum in group and individual settings with
survivors.
Consider the curriculum as a core service that should be included in the “toolkits” of all
staff working with survivors.
Economic abuse should be included in all standard assessments, alongside physical,
emotional, and sexual abuse.
Include this curriculum as one type of support group that is offered to all survivors.
Advocate that the next re-authorization of the Violence Against Women Act (VAWA)
includes recognition of economic abuse and how financial literacy can positively help
survivors. Insist that funding be included to cover such services.
Dissemination

31
Several strategies should be attempted when disseminating the information to a larger population
of stakeholders. These stakeholders include administrators and staff of domestic violence
organizations, Allstate employees, policy makers, academics, and the general public (which
include IPV survivors). Hence, listed below are some recommended strategies to disseminate
the results from this study:
Submit scholarly articles for publication in academic journals and for presentations at
academic conferences
Develop and publish “Research Briefs” on the VAWC and TAF websites. These briefs
will be summaries of published articles, condensed to 2-3 pages of key points from the
articles.
Develop and disseminate a brief summary of this report to be distributed to domestic
violence organizations and Allstate entities.
Invite participating agencies to the summer conference held at TAF; present the data
collected in several different presentations and workshops
Develop and implement a social media campaign that promotes the findings from this
study and the importance of the curriculum. Engage the general public on discussions
about economic abuse and economic empowerment.
Research
Finally, further research is needed to address the limitations identified in this study and to further
analyze the data collected to understand the more nuanced results. Recommendations include:
Conduct further analyses with these data; disseminate results using the recommendations
listed above. Some examples include:
o Determining the models (including the pathways) that best predict what is needed
to change financial behavior over time
o Determining the models (including the pathways) that best predict improving
survivors’ financial well-being and economic empowerment over time
o Determining the models (including the pathways) that best predict improving
survivors’ emotional well-being including quality of life, depression, anxiety, and
PTSD over time
o Determining the role that economic abuse plays with depression among survivors.
Identify barriers that battered Latina immigrants face in achieving economic self-
sufficiency and financial well-being. Little is known about the ways in which battered
Latina immigrants address barriers to economic self-sufficiency and financial well-being
as they strive to support themselves and their families on a daily basis and live free from
violence and abuse. There is also a lack of understanding regarding the connection
between financial well-being and emotional well-being for battered Latina immigrants.
Interviews for this study are currently being conducted.
Replicate this study with IPV survivors NOT receiving services from domestic violence
organizations but residing in their communities to determine if the impact of the
curriculum is the same as it is with IPV survivors receiving services from domestic
violence organizations.

32
Replicate this study with women (non IPV survivors) living in impoverished
communities to determine if the impact of the curriculum is the same as it is with IPV
survivors.
Continue testing the reliability and validity of the measures and scales used in this study.
Develop and implement a study that examines what is needed for domestic violence
organizations to successfully implement and sustain an economic empowerment program.
This could include comparing how agencies implement the curriculum as well as
comparing the impact of the curriculum to other economic empowerment strategies such
as micro-enterprise loans or matched savings programs.
Develop and implement a study that examines how best to implement the curriculum
based on cultural, social, and socio-economic backgrounds. For example, does the
Spanish curriculum work culturally with all Latina groups? How well would the
curriculum work with survivors from higher socio-economic groups?

33
References
Aldana, S. G., & Liljenquist, W. (1998). Validity and reliability of a financial strain survey.
Financial Counseling and Planning, 9(2), 11-19.
Andrews, F., & Whitey, S. (1976). Social indicators of well-being: Americans' perceptions of life
quality. New York: Plenum Press.
Bybee, D., & Sullivan, C. M. (2005). Predicting re-victimization of battered women 3 years after
exiting a shelter program. American Journal of Community Psychology, 36(1/2), 85-96.
Frazier, E. L. (1977). Center for Epidemiologic Studies - Depressed Mood Scale (CES-D).
Rockville, MD: National Institute of Mental Health.
Gowdy, E. A., & Pearlmutter, S. (1993). Economic self-sufficiency: It's not just money. Affilia,
8(4), 368-387.
NCS. (1992). National Comorbidity Survey Retrieved February 16, 2003, from
www.hcp.med.harvard.edu/ncs
Parrotta, J. L., & Johnson, P. J. (1998). The impact of financial attitudes and knowledge on
financial management and satisfaction of recently married individuals. Association for
Financial Counseling and Planning Education, 9(2), 59-75.
Postmus, J. L., Plummer, S. B., McMahon, S., & Zurlo, K. (2013). Financial literacy: Building
economic empowerment with survivors of violence. Journal of Family and Economic
Issues, 34, 275-284.
Postmus, J. L., Plummer, S. B., & Stylianou, A. M. (in press). Measuring economic abuse in the
lives of survivors: Revising the Scale of Economic Abuse. Violence Against Women.
Schwarzer, R., & Jerusalem, M. (1995). Generalized self-efficacy scale. In J. Weinman, S.
Wright & M. Johnston (Eds.), Measures in health psychology: A user's portfolio. Causal
and control beliefs (pp. 35-37). Windsor, England: NFER-NELSON.
Shepard, M., & Campbell, J. A. (1992). The Abusive Behavior Inventory: A measure of
psychological and physical abuse. Journal of Interpersonal Violence, 7(3), 291-305.
Spitzer, R. L., Kroenke, K., Williams, J. B. W., & Lowe, B. (2006). A brief measure for
assessing generalized anxiety disorder. Archives of Internal Medicine, 166(10), 1092-
1097.