evaluating the costing journey: a costing levels continuum ... · the costing maturity model aims...
TRANSCRIPT

Evaluating the Costing Journey: A Costing Levels Continuum Maturity Model
July 2009

2
The PAIB Committee welcomes your feedback on this document. Comments should be addressed to:
Professional Accountants in Business Committee International Federation of Accountants
545 Fifth Avenue, 14th Floor New York, New York 10017 USA
Email comments should be sent to: [email protected]
The mission of the International Federation of Accountants (IFAC) is to serve the public interest, strengthen the worldwide accountancy profession and contribute to the development of strong international economies by establishing and promoting adherence to high-quality professional standards, furthering the international convergence of such standards and speaking out on public interest issues where the profession’s expertise is most relevant.
This publication was prepared by IFAC’s PAIB Committee which serves IFAC member bodies and the more than one million professional accountants worldwide who work in commerce, industry, the public sector, education, and the not-for-profit sector. Its aim is to enhance the role of professional accountants in business by encouraging and facilitating the global development and exchange of knowledge and best practices.
This publication may be downloaded free-of-charge from the IFAC website at http://www.ifac.org. The approved text is published in the English language.
Copyright © July 2009 by the International Federation of Accountants (IFAC). All rights reserved. Permission is granted to make copies of this work provided that such copies are for use in academic classrooms or for personal use and are not sold or disseminated and provided that each copy bears the following credit line: “Copyright © July 2009 by the International Federation of Accountants (IFAC). All rights reserved. Used with permission of IFAC. Contact [email protected] for permission to reproduce, store or transmit this document.” Otherwise, written permission from IFAC is required to reproduce, store or transmit, or to make other similar uses of, this document, except as permitted by law. Contact [email protected].
ISBN: 978-1-60815-038-0

3
EVALUATING THE COSTING JOURNEY:
A COSTING LEVELS CONTINUUM MATURITY MODEL: BETA VERSION
CONTENTS
Page
Foreword ................................................................................................................................... 4
Introduction ............................................................................................................................... 6
The 12 Costing Continuum Levels ........................................................................................... 8
Appendix: Costing Stages of Maturity ..................................................................................... 19

4
Foreword The launch of the Costing Levels Continuum Maturity Model provides a complementary resource to the International Good Practice Guidance on Evaluating and Improving Costing in Organizations for both IFAC member bodies and their members working in commerce, industry, the public sector, education, and the not-for-profit sectors. Issuing this separately is an opportunity for IFAC to provide additional practical support without adding to the length of the guidance document. It also allows IFAC to engage member bodies and their members in the development and further improvement of this costing maturity model. To this end we invite feedback to facilitate its ongoing development in the form of suggested changes and revisions.
The Costing Levels Continuum Maturity Model further supports how to think about applying principle D in the guidance. Principle D states that:
The design, implementation, and continuous improvement of costing methods, data collection, and systems should reflect a balance between the required level of accuracy and cost of measurement (i.e. cost benefit tradeoff) based on the competitive situation of the organization.
The costing maturity model aims to help professional accountants apply professional judgment in determining where an organization’s capability is for supporting internal managerial analysis and decisions. The model can also help organization’s decide what level to aspire to given organizational requirements and the decision needs of employees. As such, it is a self-assessment tool that can be used by professional accountants to discuss with colleagues their organization’s current practice and to consider appropriate action for improving performance evaluation and analysis – interpretative and diagnostic, and planning and decision support – analytical and predictive.
The maturity approach usefully recognizes that there will be a point (a “level” in the model) beyond which additional analysis will fail to improve decision making enough to justify the incremental effort and its cost to improve its costing. In making this judgment call, the same principles apply as to the business decisions that an improvement to costing is intended to support. The resources that need to be devoted to the improvement need to be identified and costed. As well as the outlay in systems design, development and implementation, the resource requirement of operating any new data collection systems and keeping cost models and IT systems up to date needs to be considered. An apparent gain in system sophistication can easily be negated by later inability to maintain, update, and operate it effectively.
Although the maturity journey is represented in 12 separate levels, some organizations may find themselves in-between levels or at various places on the journey. The significance of this cost maturity model is to highlight that cost models and supporting systems should reflect the underlying reality of the way the organization works, as far as affordability and materiality allow, and within the context of the required business decisions. The cost maturity model can also help professional accountants to play a central role in educating users, including advising, for example, on the selection of costing methods, and cost measurement, and classification.
We thank Gary Cokins of SAS ([email protected]; http://blogs.sas.com/cokins), a leading business analytics software and services company, for working with us to develop this cost maturity model. This is a beta version and the feedback from IFAC’s member bodies, professional accountants and others interested in this field, will enable us to continually improve it.

FOREWORD
5
We also invite IFAC member bodies to consider whether the final version of this model could form the basis of some form of assessment service that they might wish to provide to their members. This assessment could evolve into a more formal certification process where the institute plays a role in helping their members to assess costing maturity in their organizations including scoring criteria and guidelines and examiner training materials.
Roger Tabor
Chairman, IFAC PAIB Committee

EVALUATING THE COSTING JOURNEY: A COSTING LEVELS CONTINUUM MATURITY MODEL: BETA VERSION
6
Introduction A Costing Levels Continuum Maturity Model
As a minimum, organizations typically report expenses to comply with legal and regulatory requirements. Many organizations also calculate costs (e.g., product costs) that consume resources, and their associated expenses. Successively more sophisticated levels of costing tools and techniques also exist, along a continuum, where each next higher level can provide organizations with greater accuracy, visibility, and insights for analysis and decision making. This document complements the International Federation of Accountants (IFAC) International Good Practice Guidance (IGPG) on Evaluating and Improving Costing in Organizations (see principle D) by describing these levels of costing maturity.
The 12-level Costing Continuum Maturity Model can be used as a self-assessment tool to help an organization (a) determine its current capability, and (b) decide what higher level it might justify aspiring to. Each higher level should be based on internal decision-making requirements, and should satisfy professional accountants in business, decision makers, and other stakeholders – which will include customers, employees, and shareholders or funding bodies.
The continuum measures two key capabilities of costing systems: (a) the modeling capabilities of an approach, including the calculation of historical costs and projections of some future ones (e.g., through using budgets), and (b) the robustness of the marginal/incremental1 information an approach provides. This latter aspect is relevant to effective decision support, because many decisions in an organization have incremental impacts on resource expenses. The information from some of the higher levels can also be used for planning decisions, such as target costing for new product development, investment decision making (also see IGPG on Project Appraisal Using Discounted Cash Flow), and variance analysis of actual versus planned or expected costs. The continuum does not address how to use cost information, concentrating instead on attaining a high quality of cost data for a range of purposes.
The costing continuum can apply to any enterprise-wide organization, internal department, or sub-contractor that:
• provides products and services to users, commercial customers, or public sector or not-for-profit recipients;
• needs an appropriate level of resources (i.e., neither wastefully excessive nor dangerously deficient) to meet its customers’ typically price-sensitive needs; and
• requires revenues or appropriated funds to sustain long-term payment for its resources and make investments in its future.
The quality of internally reported cost information strongly influences the quality (e.g., usefulness, scope, accuracy) of the managerial accounting information used for planning, cost 1 The terms “marginal” and “incremental” are to be assumed synonymous in this document. They are both
popularly used and interchangeable. Their context involves the pervasive nature of decision making in companies i.e., the vast majority of decisions involve an incremental change to the status quo. Their use in this document refers to the ability of a management accounting approach to provide insight into the impact of a change in demand volume, and hence resource consumption (and consequently the costs) of the resource that supplies capacity to satisfy demand – see principle B of IFAC’s International Good Practice Guidance.

EVALUATING THE COSTING JOURNEY: A COSTING LEVELS CONTINUUM MATURITY MODEL: BETA VERSION
7
estimating, budgeting, and rolling financial forecasts.
The costing continuum’s 12 levels range from data collection, calculations, and reporting that are simplistic, to those that offer a high level of transparency, foresight, and improved insight into the effects incremental changes are likely to have on required resources and costs. As an organization progresses along the continuum, the value of benefits can potentially compound. As the organization progresses, the administrative effort (and therefore costs) to attain the next higher level increases, therefore each next higher step should be justified. One can test each next step by asking, “Is the climb worth the view?” That is, will the incremental accuracy, visibility, and insights gained exceed the extra effort to model and calculate the costs?
Each next level up the continuum expands on the prior one, which means that the effort to attain the prior level and its cost modeling design and capabilities can be retained, modified, or removed. More benefits accumulate as the organization improves its capabilities.
A graphical set of figures (appended) illustrates each level of the Costing Continuum Maturity Model.

EVALUATING THE COSTING JOURNEY: A COSTING LEVELS CONTINUUM MATURITY MODEL: BETA VERSION
8
The 12 Costing Continuum Levels The Basic Levels of Costing Maturity Principles
Two basic principles apply to all levels of the costing continuum. The first is relating the resource capacities (types and amounts) to the outputs, products or services, and the end-users (e.g., customers) that consume the resources. It is basically the principle of matching and balancing the relationships of demand with supply. The second is reflecting the nature of cost as resources are consumed in these relationships. That is, this second principle recognizes that some inputs (and hence their costs) change with change in output demand, while other inputs (and their costs) remain constant regardless of changes in output demand (until a next discrete unit of resource is needed to expand or contract capacity).
Each costing technique level is distinguished by how more effectively the organization incorporates these two principles – and also improves its performance. The better cost information helps an organization understand how demand relates to supply, and how cost behaves through consumption relationships, then the better will be its visibility, analysis, planning, budgeting, and decision making.
Level 1 – Blind
Level 1 – Blind and Insensitive
(Bookkeeping)
Level 1 is exclusively financial accounting and reporting at its most fundamental level. Expenses from the two basic transactional systems, payroll and purchasing, are accumulated in a general ledger accounting system. Some accrual accounting bookkeeping entries produce adjustments, such as to bad debt reserves, to report a period-end income and balance sheet statements. Cost centers are few and aggregated at high levels, for example operations, sales, marketing, and administration. Costs are not calculated, and no information that will provide insight into the effects of incremental changes, for example on the level of resources and costs, is provided. Only expenses are captured and accumulated from transactions.
Level 2 – Process Visibility
Level 2 – Partial Visibility
(Process costing, lean accounting)
Level 2 links and accumulates primary cost centers in time sequence. This costing technique, sometimes referred to as lean accounting, is used to support a process improvement method called value stream mapping. A value stream includes all the value-added activities involved in providing specific products and services to customers. Typically, the value stream’s process steps (e.g., work activities) for which costs are measured are also tagged with attributes denoting value (value-added versus non value-added) or amount of importance (much, some, little). This information brings focus to where opportunity for process improvement may lie. Optionally, if a value stream’s product cost is calculated, all products of a process are presumed to be homogenous (i.e., only an aggregated single average cost). The definition of cost behavior characteristics in Level 2 is overly simplistic, and insight into incremental changes is not supported.

EVALUATING THE COSTING JOURNEY: A COSTING LEVELS CONTINUUM MATURITY MODEL: BETA VERSION
9
A variation of Level 2 is called throughput accounting derived from the theory of constraints (TOC) methodology. The TOC method states that any product cost is meaningless and irrelevant. Its assumption is all expenses excluding input purchased raw materials and components (i.e., where input volume will vary with output volume) are fixed and not easily adjustable in the short-term. Throughput accounting is intended as a short-term product mix prioritization selection technique, and it applies under the special condition where a 24 hour and 365 days per year physical constraint governs the flow for all product throughput. Without that special condition, traditional marginal revenue versus marginal cost analysis introduced in Level 7 applies.
Levels 3 and 4 – Output Visibility / Highly Aggregated
Level 3 includes the costs of processes that consume resources2 in the costs of outputs (e.g., products).
Level 3 – Partial Visibility (Excluding Internal Support)
(Direct costing without overhead)
Level 3 begins to calculate costs for different output groupings (e.g., product or standard service-line3 families). Calculated costs are restricted to the direct production costs that can be directly associated with the output groups, such as their direct material and direct labor cost.
For Level 3, non-product making costs are not included. These types of costs include distribution, selling, marketing, accounting, and administration. The types of costs (e.g., by channel, by customer) for these activities that are here reported below-the-gross-profit-margin line do not feature until in Level 7.
Level 4 – Visibility (With Internal and External Support); Cumulative Output Consumption
(Direct expenses plus one, or few, indirect expense pool allocation)
Level 4 is the first level of the Costing Continuum that “allocates” indirect and shared costs to cost objects.
The total cost of an indirect support department is assigned and added to the direct cost centers (from Level 3) using a single allocation factor, for example by the number of output group units produced by the direct cost center. These shared costs are added to the direct material and labor costs that were previously assigned to the output groups. Cost behavior definitions in Level 3 and 4 systems are simplistic and limited to final cost objects. Insight into the effects of incremental changes in output is therefore limited.
2 The term “resources” is regularly used in this document. Examples of resources are an employee, electrical
power, or an asset of equipment. They possess capacity. From a financial perspective, examples of each resource’s “expenses” would be wages for employees, kilowatt rate for electrical power, or depreciation for assets. These expenses become costs of work activities after resources are consumed, and ultimately end up as the costs of outputs, outcomes, products, services, channels, and customers.
3 For service organizations, such as banks, telecommunications, and hospitals, where their products may not be tangible or physical (e.g., a bank’s completed automobile loan), simply substitute the term “standard service-line” for “product” and the meaning will be the same. Non-standard services are calculated as “cost-to-serve” and traced directly to channel and customer costs.

EVALUATING THE COSTING JOURNEY: A COSTING LEVELS CONTINUUM MATURITY MODEL: BETA VERSION
10
A modest improvement to increase cost accuracy applies the “step-down” allocation method, where one or more support departments receive allocated indirect expense from a higher (more indirect) level support department (e.g. training department to the housekeeping department, and then to the primary cost center). But only a single factor (cost driver) is used from each support department. In Level 6b, multiple activity cost drivers are used.
Level 5 – Improving Output Information with Approximate Accuracy
Level 5 calculates costs in relatively greater detail for individual outputs, not just their groups.
Level 5a – Resource-to-Processes Consumption Relationships to Individual Outputs
(Traditional standard costing)
Level 5a more accurately traces (direct) and allocates (indirect) costs to individual outputs and products, in contrast to the aggregated and grouped output costs in Levels 3 and 4 (e.g., product families).
In Level 5a, the work centers (e.g., a machine or processing desk) within a cost center are individually tracked. Then each work center’s accumulated costs are directly associated with a single unit of output to produce the individual output and its cost. For example, in discrete manufacturing with assembled components (in contrast to fluid process manufacturing, like paint), for each product, (a) material quantities are captured in the “bill of material (BOM),” and (b) direct labor is captured in a “routing” based on time units. The quantities are drawn from predetermined standards that often reflect historical averages, and are valued in financial terms with standard or actual rates (e.g. $ per minute) in the costing system.
In Level 5a, the use of operational quantities results in reasonably accurate costs (assuming adequate data integrity) and standard metrics (defined as “average under normal operating conditions”), because they are direct. However, the allocated indirect and shared costs introduce inaccuracy, because they are combined with the direct costs using a BOM or routing factor, thus partially violating the “causality principle.” (See principle C of the International Good Practice Guidance). In Level 6, these indirect costs are directly traced to outputs using their own unique cost driver(s) and quantities, thus better satisfying the “causality principle.” Level 5 systems provide more detailed insight into incremental information (i.e., for specific outputs), but there is no gain in the quality of marginal information itself.
The magnitude of the output cost error depends on (a) the amount of indirect cost relative to the direct costs, as well as (b) how different the traced indirect cost (in higher levels) deviates from the direct cost assignment. The greater the relative amount of indirect costs and their drivers’ deviation from the direct standard cost driver assignment, then the larger the magnitude of the error of the output’s cost.
Level 5b – Resource-to-Processes Consumption Relationships to Individual Outputs
(Project accounting and job-order costing)
Level 5b applies to organizations with special conditions, where the organization’s work and processes are typically not repetitive or recurring, and its purpose is usually unique for the end user. Examples of these organizations would be a law firm (delivering a legal case), a management consulting firm (consulting on a project), or a make-to-order manufacturing job

EVALUATING THE COSTING JOURNEY: A COSTING LEVELS CONTINUUM MATURITY MODEL: BETA VERSION
11
shop (delivering a special product). This approach can be compared to a primitive form of time-driven activity-based costing (ABC), where time-driven ABC estimates two things: (a) the practical capacity of committed resources and their cost, and (b) unit times for performing transactional activities.
Level 6 – Improved Treatment of Indirect Costs to Increase Accuracy
The “Ground Floor” for Measured Push (Top Down) ABC
Level 6 substantially increases the accuracy of output, product, and standard service-line costs by tracing indirect expenses to outputs in a way that is more consistent with the causality principle. This cost tracing contrasts with allocating the indirect costs based on broad averages, with no consumption relationship to the behavior of indirect resources and their costs (used in Level 3 to 5 of the Costing Continuum).
The primary way the causality principle can be complied with for indirect costs is by disaggregating the cost centers used in the prior Levels 3 to 5 into what some accounting textbooks refer to as “cost pools.” Today, cost pools are more commonly labeled as “activity costs” – the foundation for ABC.
Level 6 is the level where activity-based costing (ABC) principles are first applied. There are three mini-levels of ABC – 6a to 6c. In each one, resource expenses are “pushed” (top down) through activity costs, and eventually re-assigned to final cost objects.4 This contrasts with a quantitative “demand pull” (bottom up) costing that begins in Level 9. In Levels 6 through 9, general ledger expenses are traced directly to activity cost pools (or alternatively can be traced to those pools from payroll or accounts payable systems). These expenses are in monetary units. There is not yet an explicit connection of resources and their cost characteristics with a dedicated resource cost object. This results in incomplete resource information, as is evident from the common practice in this level of allocating activities to activities and not to the resource that causes and consumes a particular indirect activity. This results in a quality of incremental information that is similar to Level 5 – albeit assigned in a more detailed way, as was discussed with Level 5.
Level 6a – Resource-to-Activities Consumption Relationships to Individual Outputs
(Activity-based costing)
Level 6a represents a major step up from Level 5 in terms of cost accuracy, visibility, and understanding. In Level 6a, two or more work activities for each cost center (or their work centers) are defined. General ledger expenses (e.g., salaries, supplies, etc.) are traced directly to these work activities using various means (called “resource drivers”). For wage-related expenses, time can be apportioned (e.g., percentages, minutes), using estimates from a few knowledgeable employees or from time-sheet collection systems. For non wage-related expenses, each expense type’s consumption will have quantified driver measures (e.g., electricity cost of a number of machine hours).
4 Cost objects are the persons or things that benefit from work activities. They are the destination to which costs
are traced.
EVALUATING THE COSTING JOURNEY: A COSTING LEVELS CONTINUUM MATURITY MODEL: BETA VERSION
12
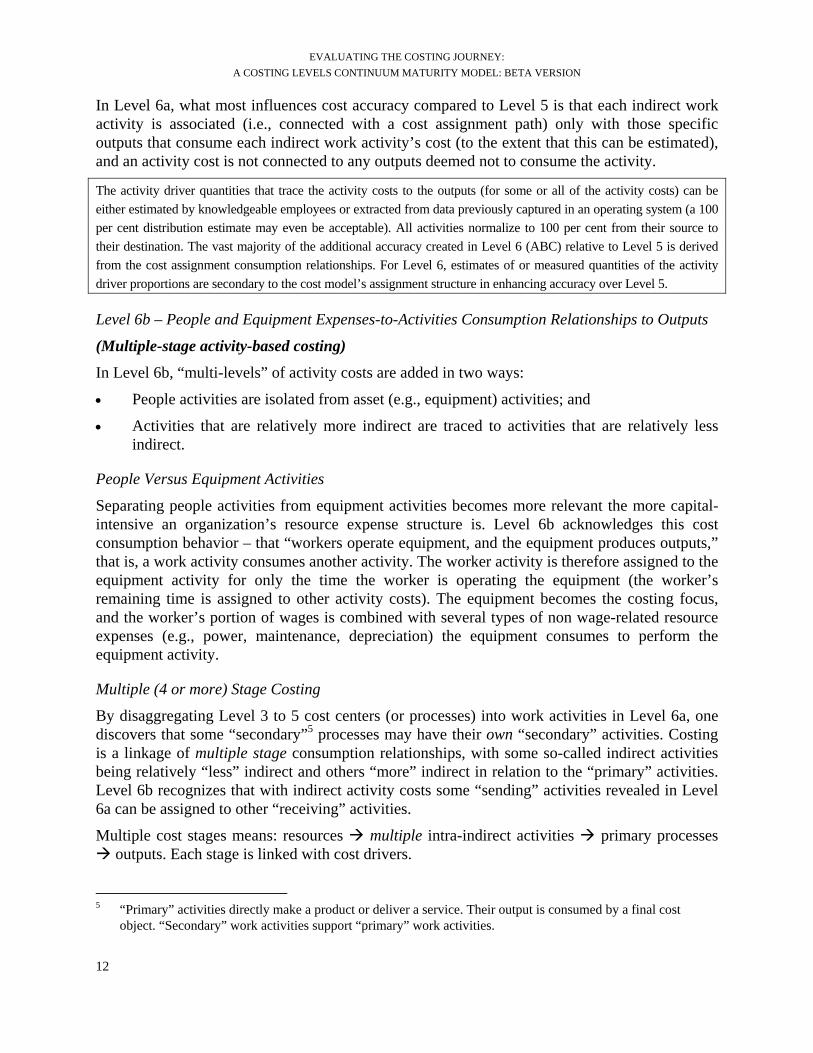
In Level 6a, what most influences cost accuracy compared to Level 5 is that each indirect work activity is associated (i.e., connected with a cost assignment path) only with those specific outputs that consume each indirect work activity’s cost (to the extent that this can be estimated), and an activity cost is not connected to any outputs deemed not to consume the activity.
The activity driver quantities that trace the activity costs to the outputs (for some or all of the activity costs) can be either estimated by knowledgeable employees or extracted from data previously captured in an operating system (a 100 per cent distribution estimate may even be acceptable). All activities normalize to 100 per cent from their source to their destination. The vast majority of the additional accuracy created in Level 6 (ABC) relative to Level 5 is derived from the cost assignment consumption relationships. For Level 6, estimates of or measured quantities of the activity driver proportions are secondary to the cost model’s assignment structure in enhancing accuracy over Level 5.
Level 6b – People and Equipment Expenses-to-Activities Consumption Relationships to Outputs
(Multiple-stage activity-based costing)
In Level 6b, “multi-levels” of activity costs are added in two ways:
• People activities are isolated from asset (e.g., equipment) activities; and
• Activities that are relatively more indirect are traced to activities that are relatively less indirect.
People Versus Equipment Activities
Separating people activities from equipment activities becomes more relevant the more capital-intensive an organization’s resource expense structure is. Level 6b acknowledges this cost consumption behavior – that “workers operate equipment, and the equipment produces outputs,” that is, a work activity consumes another activity. The worker activity is therefore assigned to the equipment activity for only the time the worker is operating the equipment (the worker’s remaining time is assigned to other activity costs). The equipment becomes the costing focus, and the worker’s portion of wages is combined with several types of non wage-related resource expenses (e.g., power, maintenance, depreciation) the equipment consumes to perform the equipment activity.
Multiple (4 or more) Stage Costing
By disaggregating Level 3 to 5 cost centers (or processes) into work activities in Level 6a, one discovers that some “secondary”5 processes may have their own “secondary” activities. Costing is a linkage of multiple stage consumption relationships, with some so-called indirect activities being relatively “less” indirect and others “more” indirect in relation to the “primary” activities. Level 6b recognizes that with indirect activity costs some “sending” activities revealed in Level 6a can be assigned to other “receiving” activities.
Multiple cost stages means: resources multiple intra-indirect activities primary processes outputs. Each stage is linked with cost drivers.
5 “Primary” activities directly make a product or deliver a service. Their output is consumed by a final cost
object. “Secondary” work activities support “primary” work activities.
EVALUATING THE COSTING JOURNEY: A COSTING LEVELS CONTINUUM MATURITY MODEL: BETA VERSION
13
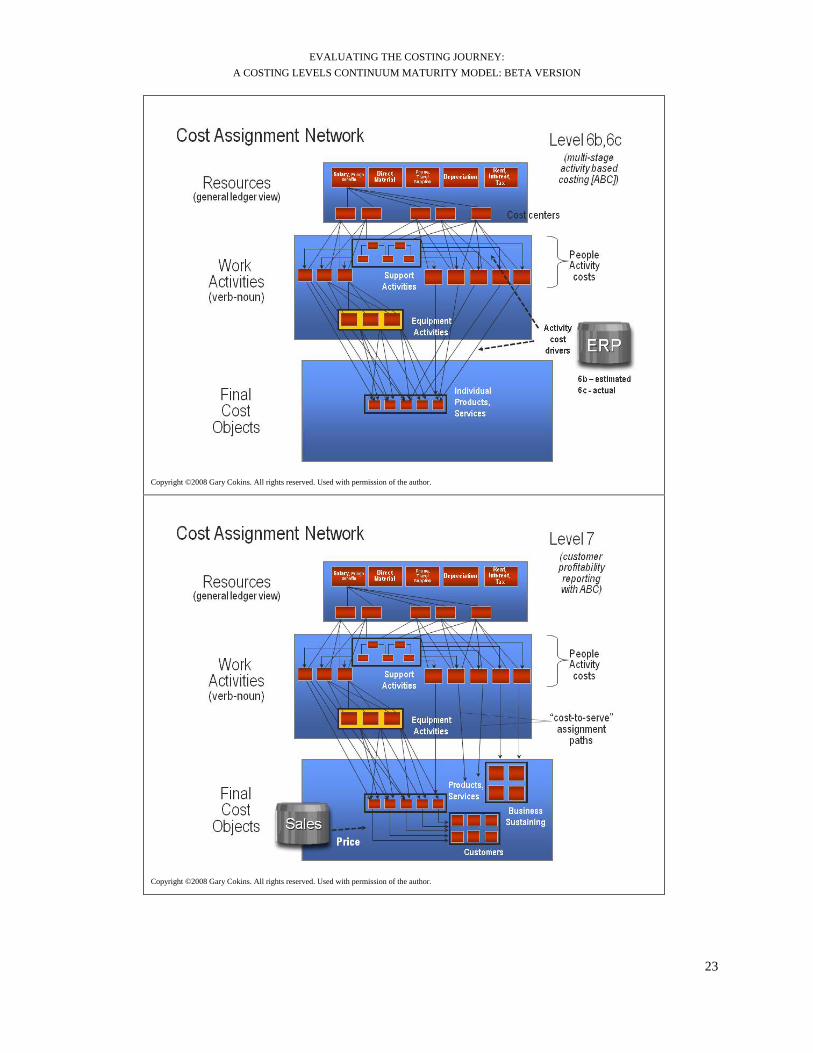
Level 6c – People and Equipment Resource-to-Activities Measured Consumption Relationships to Outputs
(Automated multiple-level activity-based costing)
In Level 6c, estimates of activity driver quantities, provided by knowledgeable employees, are replaced with actual measured quantities extracted from transactional operating systems, for example from an enterprise resource planning (ERP) system.
Level 7 – Customer Demand Sensitive, the Foundation to Quote New Orders
Level 7 – Resource-to-Activities Measured Consumption Relationships to Both Outputs and Customers
(Customer profitability reporting)
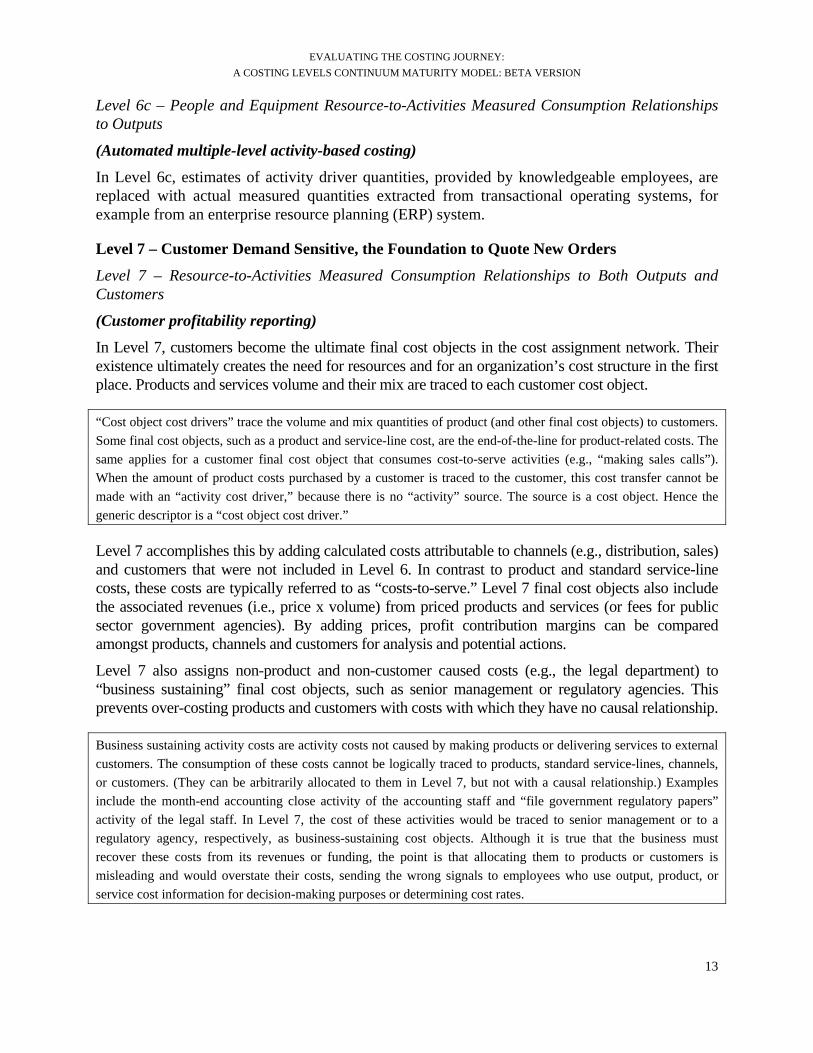
In Level 7, customers become the ultimate final cost objects in the cost assignment network. Their existence ultimately creates the need for resources and for an organization’s cost structure in the first place. Products and services volume and their mix are traced to each customer cost object.
“Cost object cost drivers” trace the volume and mix quantities of product (and other final cost objects) to customers. Some final cost objects, such as a product and service-line cost, are the end-of-the-line for product-related costs. The same applies for a customer final cost object that consumes cost-to-serve activities (e.g., “making sales calls”). When the amount of product costs purchased by a customer is traced to the customer, this cost transfer cannot be made with an “activity cost driver,” because there is no “activity” source. The source is a cost object. Hence the generic descriptor is a “cost object cost driver.”
Level 7 accomplishes this by adding calculated costs attributable to channels (e.g., distribution, sales) and customers that were not included in Level 6. In contrast to product and standard service-line costs, these costs are typically referred to as “costs-to-serve.” Level 7 final cost objects also include the associated revenues (i.e., price x volume) from priced products and services (or fees for public sector government agencies). By adding prices, profit contribution margins can be compared amongst products, channels and customers for analysis and potential actions.
Level 7 also assigns non-product and non-customer caused costs (e.g., the legal department) to “business sustaining” final cost objects, such as senior management or regulatory agencies. This prevents over-costing products and customers with costs with which they have no causal relationship.
Business sustaining activity costs are activity costs not caused by making products or delivering services to external customers. The consumption of these costs cannot be logically traced to products, standard service-lines, channels, or customers. (They can be arbitrarily allocated to them in Level 7, but not with a causal relationship.) Examples include the month-end accounting close activity of the accounting staff and “file government regulatory papers” activity of the legal staff. In Level 7, the cost of these activities would be traced to senior management or to a regulatory agency, respectively, as business-sustaining cost objects. Although it is true that the business must recover these costs from its revenues or funding, the point is that allocating them to products or customers is misleading and would overstate their costs, sending the wrong signals to employees who use output, product, or service cost information for decision-making purposes or determining cost rates.

EVALUATING THE COSTING JOURNEY: A COSTING LEVELS CONTINUUM MATURITY MODEL: BETA VERSION
14
In summary, the major difference between organizations at Level 7 from those at Level 6 is that Level 7 organizations trace non-product and non standard-service costs (i.e., costs-to-serve), such as distribution, marketing and selling costs, to (a) groups (segments) and, subsequently, to (b) the individual channels and customers. They do not allocate these costs to products, because no causal relationships exist. If the costs are allocated, then products costs would be misleadingly overstated.
The Predictive View of Costs
In Level 7, the predictive view of future customer demands is not yet forecast. Level 7 continues to be descriptive and reports only about what happened. However, unit-level consumption cost rates (ratios) calculated in Level 7 start becoming valid for quoting and bidding one-time opportunities. As a simple example, an order for 1,000 units with $10.00 labor and material cost (assuming both the material and temporary laborers are variable expenses) would cost $10,000.
A variation of Level 7 is transaction based costing. This technique leverages today’s computer power, and it applies in business-to-customer (B2C) industries like banking that require highly scalable cost and profit calculations to hundreds of thousands customers on a near real-time (e.g., daily) frequency. This technique begins with measuring all unit cost rates of transactional events (e.g., cost per each bank wire transfer). For each customer, it multiplies the recorded quantity of their transaction with each rate, and it then sums the total transaction costs (and accumulates them with each customer’s prior costs). In effect, it allows reporting a daily profit and loss for every customer. The rationale for such high computing intensity is that customer and marketing relationship management (CRM, MRM) systems used for offering tailored deals, discounts, etc. (typically utilized by call center or customer account representatives) must be aware of each customer’s past actions and their new potential economic value to sell more products and services.
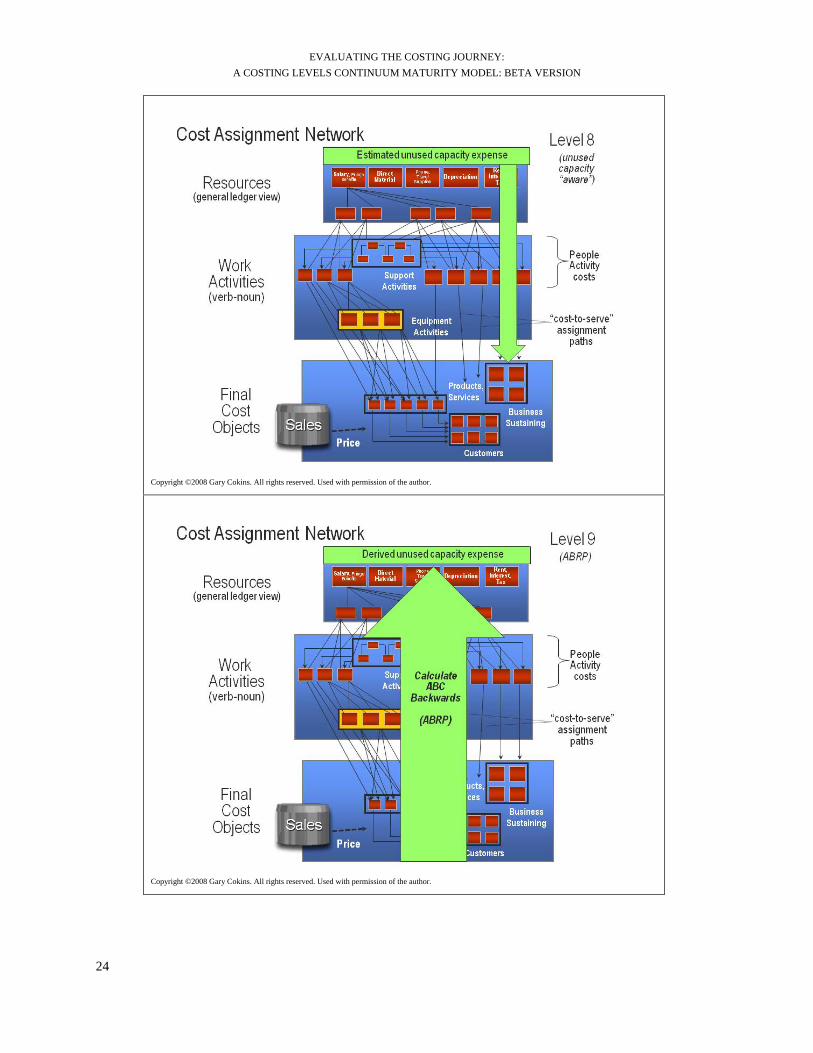
Level 8 – Unused Capacity Awareness
Level 8 – Resource-to-Activities Measured Consumption Relationships to Customers; Segmented Estimated Unused Capacity
(Standard costing with estimated unused capacity)
Organizations that plan at Level 8 have already attained Level 6 or 7. Organizations at Level 8 (a) determine, usually by estimating, the amount of each resource’s idle or unused capacity amount or time (if any), and (b) assign these costs to a business sustaining cost object called “unused or idle capacity.”
Resources supply capacity for work. Customers create demand for that capacity, giving rise to the need for products and services with channels to receive them. Resources are either used or not used. Most are used, and those are traced and assigned in all of the levels. But including a resources idle capacity expense in the cost assignments (to the degree that it does) overstates all of the process/activity costs as well as the output costs. It will also overstate cost rates used for projections.
As far as marginal/incremental information is concerned, Level 8 is a marked improvement over lower levels. Here, the cost of resources and cost behavior characteristics begin to be emphasized, therefore laying the groundwork for a better quality of marginal information. In turn, when making optimization decisions, this supports development of insights into the incremental gain that result from changes in output.

EVALUATING THE COSTING JOURNEY: A COSTING LEVELS CONTINUUM MATURITY MODEL: BETA VERSION
15
Levels 9 to 12 – Demand-Driven Planning with Capacity Sensitivity
Levels 9 to 12 shift from the descriptive view of cost measurement to the predictive view of managerial economics for decision making (e.g., customer quotes, driver-based budgeting). These four levels leverage the information from Levels 6 to 8 to project resource requirements (and their associated costs), so as to match forecasted demand quantities with supplied capacity. Each successive level also strives for better resource and marginal information insights.
Levels 9 to 12 balance the emphasis on final cost objects with the resources that are consumed by them. In a sense, these four levels reverse the Costing Continuum journey from Levels 1 to 8, where the focus was on outputs resulting from the consumption of work activities. In Levels 9 to 12, the predictive capabilities require the ability to run the model backwards (from final cost objects to resources). Level 11 is the resource consumption accounting (RCA) approach. RCA stresses resources and their cost characteristics as the starting point for all cost flows through the model (i.e., an accurate product or customer contribution margin starts with a true reflection of resources and their cost characteristics).
Resources are the sources of all cost in an organization. The resources invested in also determine the cost structure managers are faced with to achieve strategy. For example, consider the cost structure of an airport with a fully automated baggage handling system, compared to an airport that relies entirely on manual labor. The explicit inclusion of resources, their cost, and cost characteristics are essential for three reasons: (a) to facilitate predictive capabilities, (b) to produce accurate marginal information throughout the cost model, and (c) to isolate excess/idle capacity information.
Levels 9 to 12 replace “estimated” unused capacity costs by shifting from a cost “push” (top down) model to a quantitative demand “pull” (bottom up) model. Thus, each level empirically deduces (i.e., derives with calculation) the amount of each resource’s unused idle capacity expense that remains (i.e., is subtracted from how much capacity expense was used).
Level 9a – One-Time Customer Orders with Consumption Relationships to Resources; “Relevant Range” Sensitive
(Activity-based resource planning, ABRP)
Organizations that plan at Level 9a have attained Level 8, but Level 9a organizations begin to calculate their models backwards to determine the expected impact on resources from a one-time customer order, or a process change. This method uses the quantitative demand “pull” (bottom up) method as opposed to the alternative costing technique to “push” costs (top down) through the model.
For ABC systems, Level 9a represents the beginning of activity-based resource planning (ABRP). With ABRP, organizations leverage the resource and activity consumption relationships to calculate resource capacity requirements.
An essential advance from Levels 6 to 8 is found in the classification of individual resource expenses depending on their correlation with changes in output (usually activities). Each resource expense is classified as fixed (unaffected) or variable, depending on how adjustable it is within a specified time horizon because of incremental changes in the volume of demand unit

EVALUATING THE COSTING JOURNEY: A COSTING LEVELS CONTINUUM MATURITY MODEL: BETA VERSION
16
output quantities. This approach to defining cost behavior to provide incremental information is an improvement on previous levels. The improvement increases the more extensively that groups of resources are disaggregated to discrete ones that comprise a homogeneous group; but this approach does not fully support the concept of a resource as a discrete entity (e.g., a machine, a person or a building).
An example of a non-ABC approach that has developed sophisticated predictive capabilities is the German cost accounting approach called Grenzplankostenrechnung, abbreviated as GPK (further described in Evaluating and Improving Costing in Organizations).
Level 9b – Aggregate Customer Orders with Consumption Relationships to Resources (Activity-Based Resource Planning, ABRP)
Organizations that plan at Level 9b have already attained Level 9a. Organizations at Level 9b determine the expected impact on all resources of all the forecast customer orders or process changes. Level 9b organizations leverage consumption relationships to calculate resource capacity requirements.
Level 9b organizations first compare the projected requirement for resource capacity types and amounts to their existing ones. They then determine if resource types and quantities should be added, or removed, (as might be the case if new operating efficiencies and productivity improvements can reduce the consumption rates, thus lessening the impact on resource capacities).
Level 10 – Aggregate Customer Orders with Time-Based Consumption Relationships to Resources
(Time-driven activity-based costing [TDABC])
Level 10 organizations exclusively use time-based activity drivers as standards. In contrast to the “pull” (bottom up) ABC-based ABRP of Level 9, where activity consumption rates are re-calibrated after determining past period resource costs, Level 10’s TDABC freezes each output’s activity time rate as a standard rate, and calculates each activity cost as a “standard cost.”
Since all of TDABC’s activity costs are calculated “at standard cost,” then the net difference between the actual resource costs and the aggregate standard activity costs can be calculated. This difference can be a substitute for unused or deficient capacity.
In cases where actual output is higher than planned, the excess/idle capacity variance will be calculated as a negative number (i.e., over-absorption). An accurate unused capacity number is only possible with the use of a supply-based denominator rate calculation. Level 10 TDABC primarily focuses on direct costs (as in Level 5a). It is therefore more applicable to organizations with highly repetitive events (i.e., transactions) that are characterized by relatively less indirect-to-direct relationships as compared to organizations with substantial indirect costs.
Time-based costing for direct labor expenses has existed in US manufacturing companies since the early 1900s. It was primarily used for product costing using “routings” or “labor sheets” at the product’s single “unit-level.” Gradually and with time, it was recognized that this traditional standard costing method can also be applied to non-manufacturing service environments. TDABC is an example of the gradual recognition where time-based activity drivers apply to the direct labor costing described in Level 5a.

EVALUATING THE COSTING JOURNEY: A COSTING LEVELS CONTINUUM MATURITY MODEL: BETA VERSION
17
Level 11 – Aggregate Customer Orders with Flexed Consumption Relationships to Resources
(Resource consumption accounting – RCA)
Organizations that plan at Level 11 are similar to those at Level 10, in that they have also attained Level 9, but Level 11 replaces activity-to-activity relationships in the multiple-stage cost assignment network with resource-to-resource or activity-to-resource relationships, where understanding these relationships is essential to properly reflect resource costs and their characteristics.
Resources
In Level 11, resources are no longer viewed as equal to a general ledger expense account. Instead, resources are discrete entities (e.g., a machine, a group of technicians) that managers deploy, commit, manage, and influence to effect change and achieve enterprise objectives (i.e., every decision managers make is a decision to apply resources). Level 11 also introduces a resource-specific cost object – called a resource pool – that serves to manage capacity and capture the cost characteristics unique to a set of homogenous resources.
Capacity only physically resides in a resource, not in activities or final outputs; resources are the starting point for managing capacity and costs. For the marginal information it provides, this method – referred to as resource consumption accounting (RCA) – draws on core economic principles from GPK. Level 11 provides highly divisible marginal and absorption costing information on all cost objects, which are compiled with a singular emphasis on adhering to the causality principle – both its strong and weak forms. For more on these two aspects of the principle of causality, refer respectively to paragraphs C.1 and C.6 of the International Federation of Accountants (IFAC) International Good Practice Guidance (IGPG) on Evaluating and Improving Costing in Organizations. Similar to Level 10, Level 11 determines the expected impact on all resources from all the forecast customer orders or process changes.
Flexed Cost Feedback to Operational Managers
In addition to projecting future resource capacity requirements (and their costs), Level 11 provides past period feedback of cost variances based on “flexing” for actual produced volume (as opposed to a static plan). A supply-based denominator is used in rate calculations, resulting in an accurate valued cost variance for unused or deficient capacity.
Direct and Indirect Capacity Resource Planning
In contrast to Level 10 organizations that mainly highlight direct expenses, Level 11 organizations report and plan on significant direct and all indirect support departments.
In summary, Level 11 RCA organizations integrate both descriptive cost control feedback for corrective actions and predictive resource planning into a single model.
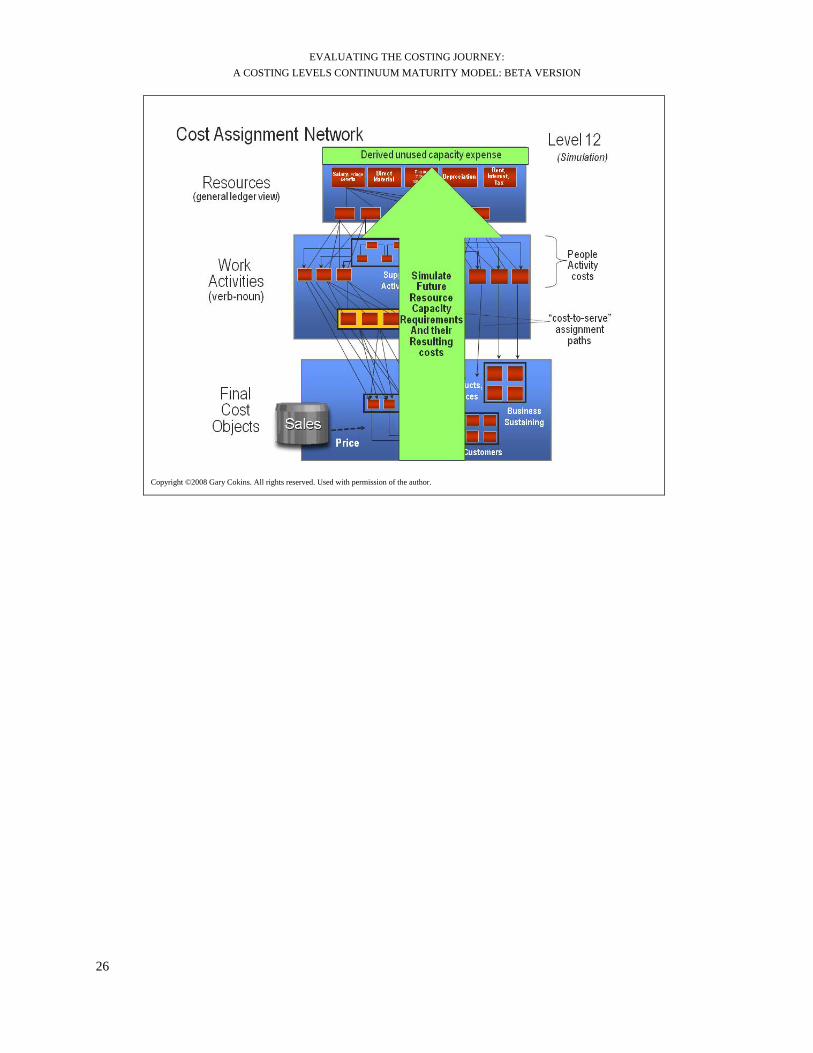
Level 12 – Simulation
Organizations that plan at Level 12 have arguably attained the highest level of cost planning. Simulation can come in many flavors and degrees of sophistication. One example is called “systems dynamics,” which in simplistic terms reflects the simultaneous interdependencies of

EVALUATING THE COSTING JOURNEY: A COSTING LEVELS CONTINUUM MATURITY MODEL: BETA VERSION
18
factors and influences on any entity or organization. Simulation is a high form of modeling, where modeling represents physical operations.
Level 12 simulations embrace finite forward capacity planning, a term used by production schedulers who plan and schedule the manufacture of a diverse mix of products using a broad set of different equipment. This type of simulated planning includes the reality of processing and wait times, product positions, resource capacity consumption rates, and capacity constraints. In contrast to the infinite capacity assumption in Levels 1 to 11 (e.g., two products being simultaneously manufactured on the same machine at the same time rather than in sequence), simulation models calculate the time delays resulting from the variability of processing times and periodic process flow bottlenecks. Service organizations, like banks and hospitals, experience similar issues with uneven wait times in queues at banks for bank tellers and surgery operating rooms respectively. These time delays result in temporary idle time of a resource (e.g., worker and/or equipment) that has an opportunity cost. In Levels 1 to 11, this cost is averaged rather than precisely calculated.
Simulation can lead to optimization. To optimize anything implies achieving an ideal condition.
Optimization can be dismissed by some managers as theoretical or impractical to achieve, but it can be realized. Enterprise optimization can be described as the pursuit and realization of an organization’s strategic objectives with the least amount of total resources in an ever-changing environment. This pursuit maximizes long-term shareholder wealth creation through a deep understanding of customers.
Optimization is about determining the best level of resources (i.e., human capital or equipment) to produce the highest yield and desired outcomes. Optimization includes managing that same “best level” of resources – and aligning their behavior and priorities with the strategic objectives of the executive team. Optimization cannot be realized without business analytics. Modeling is fundamental to achieving effective enterprise performance management, and business analytics is at the heart of modeling.
Level 12 simulations can project and estimate (a) the level of resource expenses, and (b) the total and unit costs of the processes and outputs that consume the resources. It can do this at frequent intervals as the new and current conditions are updated with dynamic updating, approaching near real-time as its ultimate goal, if justified by decision making and control requirements.
Although enterprise resource planning (ERP) software systems contribute transactional data, they are not a panacea for supporting a predictive view at this level. The management actions of planning, simulating, defining and analyzing alternatives, and selecting an optimum outcome via decisions that managers are responsible for support a predictive view more broadly. These management actions can only be taken by integrating the various methodologies of the performance management framework and embedding business analytics, especially predictive analytics, within each methodology.
EVALUATING THE COSTING JOURNEY: A COSTING LEVELS CONTINUUM MATURITY MODEL: BETA VERSION
19
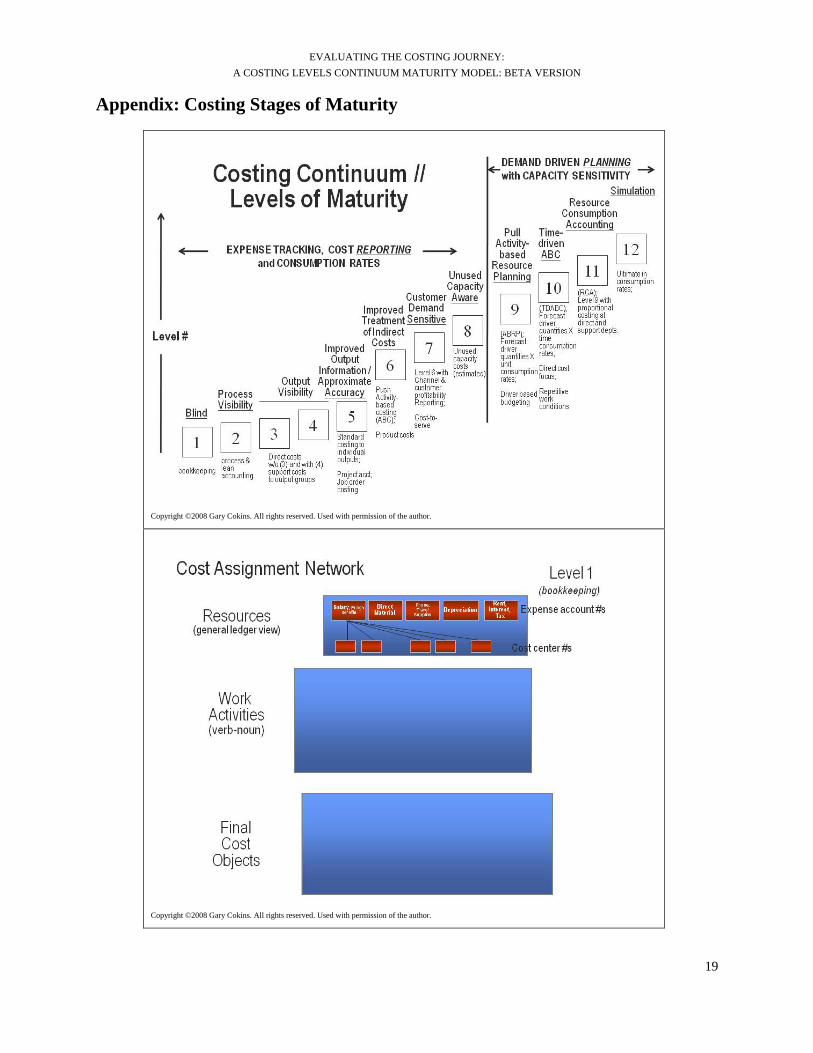
Appendix: Costing Stages of Maturity
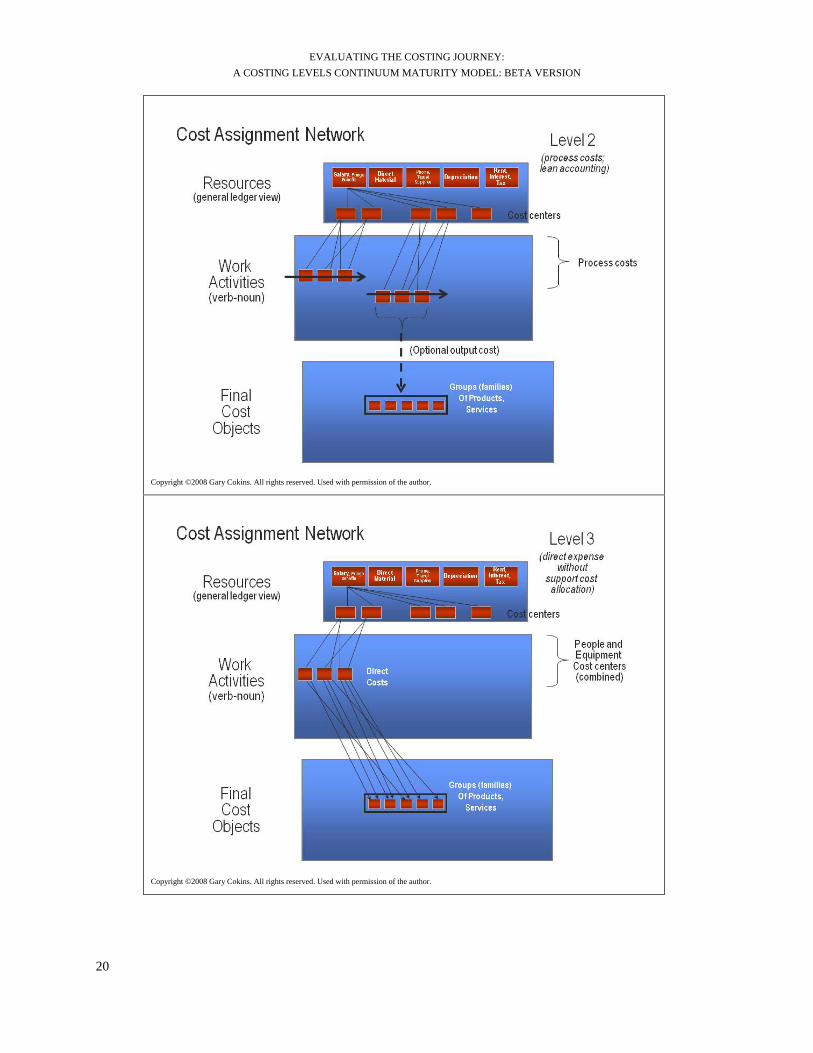
Copyright ©2008 Gary Cokins. All rights reserved. Used with permission of the author.
Copyright ©2008 Gary Cokins. All rights reserved. Used with permission of the author.
EVALUATING THE COSTING JOURNEY: A COSTING LEVELS CONTINUUM MATURITY MODEL: BETA VERSION
20
Copyright ©2008 Gary Cokins. All rights reserved. Used with permission of the author.
Copyright ©2008 Gary Cokins. All rights reserved. Used with permission of the author.

EVALUATING THE COSTING JOURNEY: A COSTING LEVELS CONTINUUM MATURITY MODEL: BETA VERSION
21
Copyright ©2008 Gary Cokins. All rights reserved. Used with permission of the author.
Copyright ©2008 Gary Cokins. All rights reserved. Used with permission of the author.

EVALUATING THE COSTING JOURNEY: A COSTING LEVELS CONTINUUM MATURITY MODEL: BETA VERSION
22
Copyright ©2008 Gary Cokins. All rights reserved. Used with permission of the author.
Copyright ©2008 Gary Cokins. All rights reserved. Used with permission of the author.
EVALUATING THE COSTING JOURNEY: A COSTING LEVELS CONTINUUM MATURITY MODEL: BETA VERSION
23
Copyright ©2008 Gary Cokins. All rights reserved. Used with permission of the author.
Copyright ©2008 Gary Cokins. All rights reserved. Used with permission of the author.
EVALUATING THE COSTING JOURNEY: A COSTING LEVELS CONTINUUM MATURITY MODEL: BETA VERSION
24
Copyright ©2008 Gary Cokins. All rights reserved. Used with permission of the author.
Copyright ©2008 Gary Cokins. All rights reserved. Used with permission of the author.

EVALUATING THE COSTING JOURNEY: A COSTING LEVELS CONTINUUM MATURITY MODEL: BETA VERSION
25
Copyright ©2008 Gary Cokins. All rights reserved. Used with permission of the author.
Copyright ©2009 RCA Institute. All rights reserved. Used with permission of the author.
EVALUATING THE COSTING JOURNEY: A COSTING LEVELS CONTINUUM MATURITY MODEL: BETA VERSION
26
Copyright ©2008 Gary Cokins. All rights reserved. Used with permission of the author.


28
International Federation of Accountants 545 Fifth Avenue, 14th Floor, New York, NY 10017 USA Tel +1 (212) 286-9344 Fax +1 (212) 286-9570 www.ifac.org