evaluating the automated alignment of 3d human body...
TRANSCRIPT
Evaluating the Automated Alignment of 3D Human Body Scans
David A. Hirshbergc, Matthew Loperc, Eric Rachlinc, Aggeliki Tsolia,c, Alexander Weissa,
Brian Cornerb, Michael J. Blacka,c a Department of Computer Science, Brown University, Providence, RI, USA b U.S. Army Natick Soldier Research, Development and Engineering Center
c Max Planck Institute for Intelligent Systems, Tübingen, Germany
Abstract The statistical analysis of large corpora of human body scans requires that these scans be in alignment, either for a small set of key landmarks or densely for all the vertices in the scan. Existing techniques tend to rely on hand-placed landmarks or algorithms that extract landmarks from scans. The former is time consuming and subjective while the latter is error prone. Here we show that a model-based approach can align meshes automatically, producing alignment accuracy similar to that of previous methods that rely on many landmarks. Specifically, we align a low-resolution, artist-created template body mesh to many high-resolution laser scans. Our alignment procedure employs a robust iterative closest point method with a regularization that promotes smooth and locally rigid deformation of the template mesh. We evaluate our approach on 50 female body models from the CAESAR dataset that vary significantly in body shape. To make the method fully automatic, we define simple feature detectors for the head and ankles, which provide initial landmark locations. We find that, if body poses are fairly similar, as in CAESAR, the fully automated method provides dense alignments that enable statistical analysis and anthropometric measurement. Keywords: laser scan alignment, landmark detection, 3D body models, mesh alignment, mesh deformation.
1. Introduction Fitting a low-resolution mesh to high-resolution laser scans has many applications ranging from human shape analysis to the creation of detailed graphics models for animation. There have been several large-scale anthropometric studies of human body shape that have collected full-body 3D range scans. Insights from analyzing these data can be used for ergonomic design of human spaces, clothing design, and human health analysis. To facilitate the analysis of body shape variation across the population, large corpora of body scans must be brought into correspondence or alignment. A fully automated method of alignment would be of value to the community doing large-scale studies of body shape.
Aligning scans today remains laborious, typically relying on landmarks placed on the subjects before scanning. There are several problems with this approach. For example a skilled technician is required, there may be variability in marker placement across technicians and there can be human error in placement. The process is time consuming, which limits the number of people scanned in a day and increases the cost of scanning studies. Finally, landmarks are often identified in the 3D scans by hand – a process that is both time consuming and error prone. There exist automatic method to detect landmarks in body scans but these can be quite sensitive to noise and missing data in the scans. Other automatic methods give only approximate alignments [1, 3, 7]. Speeding up the landmark and correspondence extraction procedure without sacrificing significantly the accuracy of alignment is important for processing and analyzing large numbers of laser scans.
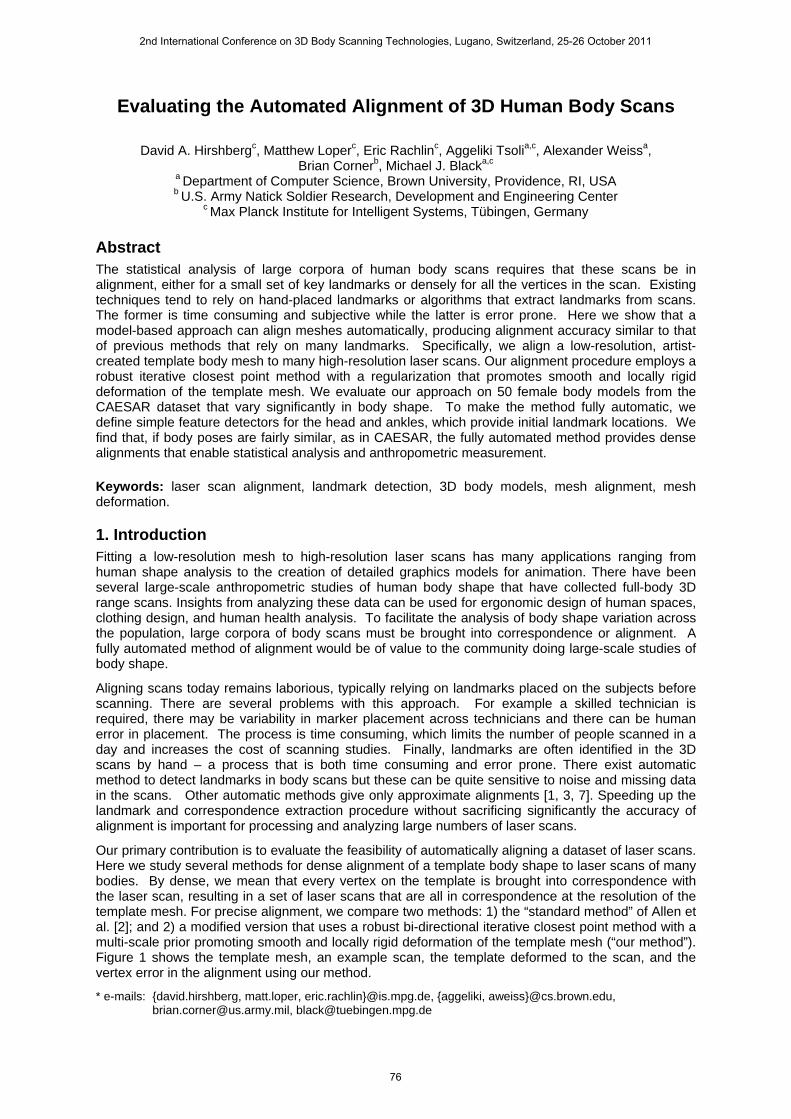
Our primary contribution is to evaluate the feasibility of automatically aligning a dataset of laser scans. Here we study several methods for dense alignment of a template body shape to laser scans of many bodies. By dense, we mean that every vertex on the template is brought into correspondence with the laser scan, resulting in a set of laser scans that are all in correspondence at the resolution of the template mesh. For precise alignment, we compare two methods: 1) the “standard method” of Allen et al. [2]; and 2) a modified version that uses a robust bi-directional iterative closest point method with a multi-scale prior promoting smooth and locally rigid deformation of the template mesh (“our method”). Figure 1 shows the template mesh, an example scan, the template deformed to the scan, and the vertex error in the alignment using our method.
* e-mails: {david.hirshberg, matt.loper, eric.rachlin}@is.mpg.de, {aggeliki, aweiss}@cs.brown.edu, [email protected], [email protected]
2nd International Conference on 3D Body Scanning Technologies, Lugano, Switzerland, 25-26 October 2011
76
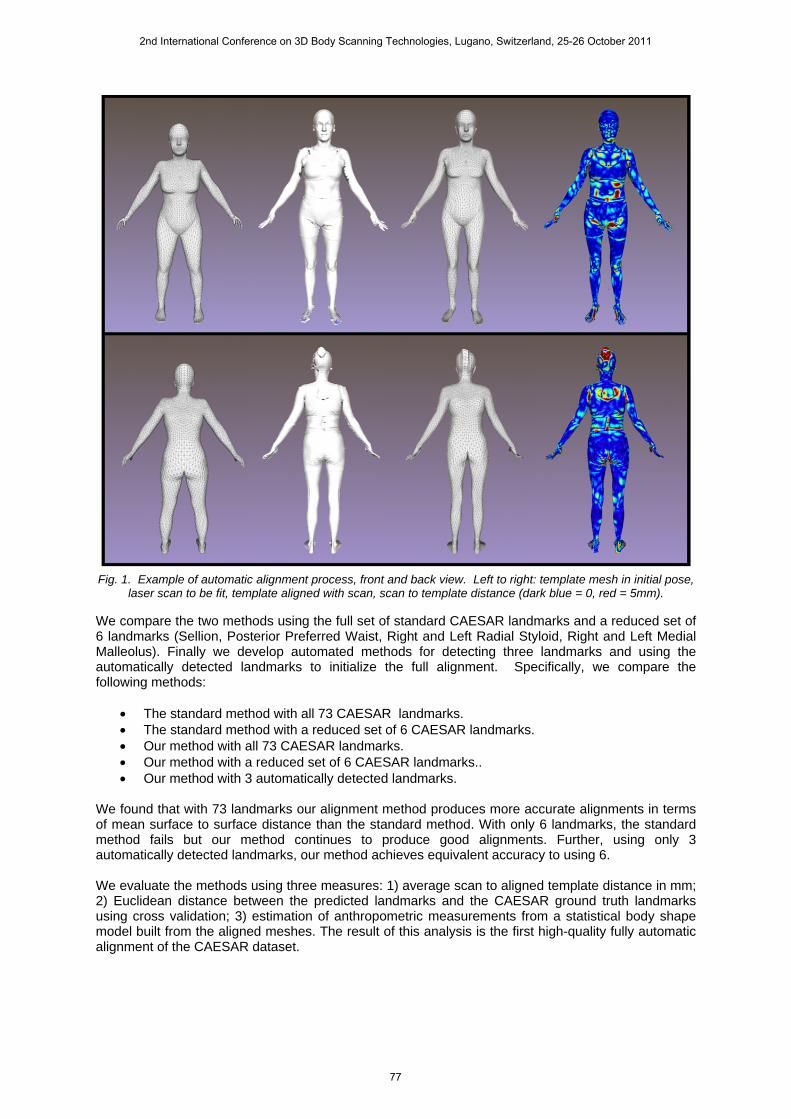
Fig. 1. Example of automatic alignment process, front and back view. Left to right: template mesh in initial pose, laser scan to be fit, template aligned with scan, scan to template distance (dark blue = 0, red = 5mm).
We compare the two methods using the full set of standard CAESAR landmarks and a reduced set of 6 landmarks (Sellion, Posterior Preferred Waist, Right and Left Radial Styloid, Right and Left Medial Malleolus). Finally we develop automated methods for detecting three landmarks and using the automatically detected landmarks to initialize the full alignment. Specifically, we compare the following methods:
• The standard method with all 73 CAESAR landmarks. • The standard method with a reduced set of 6 CAESAR landmarks. • Our method with all 73 CAESAR landmarks. • Our method with a reduced set of 6 CAESAR landmarks.. • Our method with 3 automatically detected landmarks.
We found that with 73 landmarks our alignment method produces more accurate alignments in terms of mean surface to surface distance than the standard method. With only 6 landmarks, the standard method fails but our method continues to produce good alignments. Further, using only 3 automatically detected landmarks, our method achieves equivalent accuracy to using 6. We evaluate the methods using three measures: 1) average scan to aligned template distance in mm; 2) Euclidean distance between the predicted landmarks and the CAESAR ground truth landmarks using cross validation; 3) estimation of anthropometric measurements from a statistical body shape model built from the aligned meshes. The result of this analysis is the first high-quality fully automatic alignment of the CAESAR dataset.
2nd International Conference on 3D Body Scanning Technologies, Lugano, Switzerland, 25-26 October 2011
77

2. Related Work Fitting a template to a 3D laser scan typically is done using some version of an iterative closest point (ICP) method [15]. For example, Kahler et al. [12] deform a template mesh to fit incomplete head scans. Their deformation procedure is initialized using volumetric radial basis functions. Szeliski and Lavallee [18] also define a volumetric deformation procedure using spline functions. Feldmar and Ayache [8] describe a registration method based on matching surface points, normals and curvatures. At the same time they enforced similarity of affine transformations within spherical regions of the 3D space. Allen et al. [2] propose a similar technique in which similarity of transformations of nearby regions is defined directly over the template surface rather than within a spherical volume. This latter method has become a de facto standard. Azouz et al. [4,5] perform rigid alignment of the CAESAR meshes using a volumetric scan representation. They do not perform a non-rigid alignment of the bodies and hence have difficulty dealing with pose variations in the data. Wuhrer et al. [21] take a similar approach that uses multi-dimensional scaling and a coarse to fine method for efficiency. Like most of these approaches, the method finds interesting correspondences but they do not show detailed metric alignments. All the abovementioned optimization techniques for fitting are sensitive to local minima. A typical approach to deal with undesirable minima is to identify a set of points on the scan surface (landmarks) that correspond to another set of points (correspondences) on the template. Quite often markers are placed manually on the scan surface and correspondences are also defined manually. Alternative approaches for defining landmarks and their correspondences automatically are less time-consuming but they lack accuracy. Although many such techniques [13,7,11] have been applied successfully to watertight models in graphics and information retrieval, they are unable to handle adequately the noisy and missing information inherent in laser scan data. Moreover, most of these techniques are more robust to variation in pose rather than shape. An alternative solution for accelerating the marker and correspondence selection procedure is to automate the detection of anatomical landmarks on the scan. Using template matching, Suikerbuik et al. [17] detect 3 landmarks located on the top of the nose and on the ankles of CAESAR scans. The landmarks are detected with an accuracy of approximately 2cm. Azouz et al. [6] autodetect the whole set of CAESAR landmarks by learning landmark characteristics and the spatial relationships between them from a set of human scans with predefined landmarks. Han and Nam, [10] detect an alternative set of landmarks that are suited for predicting human body measurements. These landmark detection methods have not been evaluated to determine how accurately they can be used with dense alignment methods to align templates to scans.
3. Methods 3.1 Template and data Our template is a watertight, symmetric 3D triangulated mesh constructed by an artist (see Fig. 1). It contains approximately 11,000 vertices and 22,000 triangles. The resolution on the mesh varies based on variation in local geometry. It is posed similarly to how the subjects were asked to stand in the CAESAR study.
We evaluate our alignment procedure using 3D laser range scans from the North American version of the Civilian American and European Surface Anthropometry Resource (CAESAR) dataset [14]. Here we focus exclusively on the alignment of females. We select a subset of them containing 50 females with various body types and ethnicities. Each laser scan comes with the 3D location of 73 markers placed on anthropometric landmarks, mainly at places where bones can be palpated through the skin. Parts of our experiments were conducting using a subset of the CAESAR landmarks positioned roughly at the top of the nose, right inner wrist, left inner wrist, right inner ankle, left inner ankle, lower back.
3.2 Automatic landmark detection 3.2.1. Automated head detection Face detection in images has been widely studied, and many solutions exist and are in regular commercial use in cameras and photographic software systems. These methods for 2D image analysis do not immediately generalize to 3D head detection. Unlike images, range scans have
2nd International Conference on 3D Body Scanning Technologies, Lugano, Switzerland, 25-26 October 2011
78
varying numbers of measurements, in varying locations and with missing data. Our approach for 3D face detection solves this problem by first projecting the 3D data onto an appropriately oriented plane to produce a 2D depth map representing the distance from pixels in the image plane to the 3D surface. When done appropriately, we are then able to use standard methods for 2D face detection to solve the 3D problem. If the plane is located directly in front of the face, the resulting depth image is a 2D grayscale image that provides an accurate and reliable 2D representation of the faces distinctive 3D shape. Here we focus on detecting the CAESAR data set's sellion landmark which is located at the top of the nose, roughly between the eyebrows. By generating depth images of limited portions of each 3D CAESAR scan, we are able to use standard eigenface-style face detection [19] to localize the sellion landmark. To generate each depth image, a point, p, on the scan is first selected as the center of the image. Next, to orient the image, the mean, m, of the set of points, S, within 8 cm of p is computed. Notice that when p is on the head or face of the scan, m consistently lies behind p, and thus provides an approximate surface normal with which to orient the image plane, L. Given L, a depth image is produced by projecting all points in S onto L, along with all additional points within 20 cm of P that are also no further from L than any point in S. When p is located on the face, this second distance constraint ensures that points on the back of the head are not inadvertently included. The set of 3D points that has been projected onto L provides depth values at various locations on L. To transform these values into a depth image, linear interpolation is used to obtain a depth value at each pixel. Once a depth value for each pixel is determined, all values are normalized to range from 0 to 1. At this point, all that remains is to orient the depth image so that, in the case of the head, the face is always upright. To do this, principal component analysis (PCA) is used to determine the direction of maximum variation of the projected points prior to interpolation. In other words, before the projected points are turned into a depth image, PCA reveals the direction over which they are most spread out. This direction is chosen as “up”. Figure 2 shows 4 of the sellion-centered depth images used during training (i.e. for each training image, p was explicitly chosen to be the sellion). To train our eigenface detector, we generated 500 sellion-centered depth images from 500 CAESAR female scans. From these the mean face was computed (see Figure 2) and then subtracted from each training image. Finally PCA was run on the mean-subtracted data and obtain 60 "eigenfaces" to use for face detection. The first 4 eigenfaces are shown in Figure 2. When searching a new scan for a face, a point p, is randomly selected from the upper 1/5 of the scan. A depth image centered at p is generated using the procedure outlined above. The mean-subtracted depth image is then given a score based on how it can be reconstructed as a linear combination of the first 60 eigenfaces. In essence, this score estimates the likelihood that the depth image is a face given the distribution of eigenface components that was learned during training.
Fig. 2. Automated head detection. 3D heads are turned into 2D depth images (left). A 3D “eigenface” model is
learned from training data and is then used for head detection (see text).
2nd International Conference on 3D Body Scanning Technologies, Lugano, Switzerland, 25-26 October 2011
79
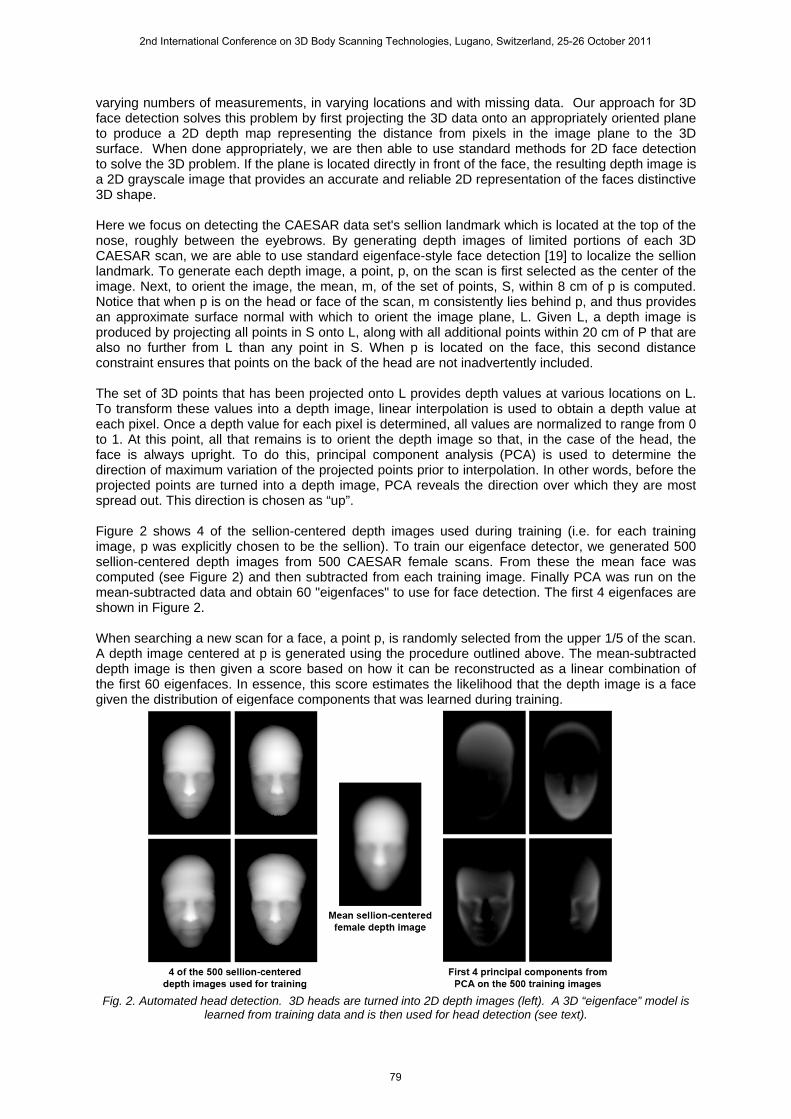
By randomly considering 150 points in the top 1/5 of each CAESAR scan, we were able to reliably classify points close to the sellion as those having the highest scores. To refine this initial estimate of the sellion's location, an additional 20 points near each of the top 20 scoring original points are searched. Finally, we note that even though a large amount of training data (500 labeled scans) was required to train our sellion detector, we expect that the same detector could be used on other datasets, even those collected using other types of scanners and at different spatial resolutions. 3.2.2. Automated ankle detection As in most large-scale collections, CAESAR subjects were instructed to stand with their feet in similar positions and orientations. We exploit this highly regular placement to automatically detect the right and left medial malleolus landmarks, corresponding to protrusions on the subjects' inner ankles. Using a training set of 50 subjects with known landmark locations we computed the mean, minimum and maximum height of the malleolus landmarks from the ground plane; these were 86.9 mm, 42 mm and 130 mm, respectively. Automated landmark detection on test scans is restricted to a vertical window of 30 mm to 142 mm. Figure 3 shows the points on a particular scan that fell within the search window. Also shown are these same points projected onto the ground plane. For each scan, we used a k-means algorithm, with k = 2, to partition the points into two clusters. In figure 3, M1 and M2 denote the means of the two point clusters, and C denotes the halfway point between M1 and M2. To estimate the location of the medial malleolus landmarks, we compute the closest point in each cluster to C. These points, labeled A1 and A2, are typically quite close to the true landmarks, which are shown in orange.
Fig. 3. Automated ankle detection. See text.
Finally, in order to distinguish left from right, the two clusters are projected onto the ground plane, and PCA is used to compute the direction of maximum variation in each projected cluster. In the figure, F1 and F2 denote the projected means of the two clusters, and the dark blue lines indicate each cluster's direction of maximum variation. Within a given cluster, the farthest point from F along this direction reveals the direction of that clusters "big toe". The locations of the toe points, labeled T1 and T2, in turn reveal which direction is forward, and hence which direction is left. In this figure, cluster 1 is the subject’s right foot. 3.3. Alignment method The traditional method for aligning a template mesh to a laser body scan is to use ICP to move the vertices of the template to the lie on the surface of the scan, subject to some regularization that allows the aligned template to maintain a reasonable shape in areas where the scan has holes or noise [2]. In particular, Allen et al. [2] represent their alignment as an affine transformation for each template
2nd International Conference on 3D Body Scanning Technologies, Lugano, Switzerland, 25-26 October 2011
80
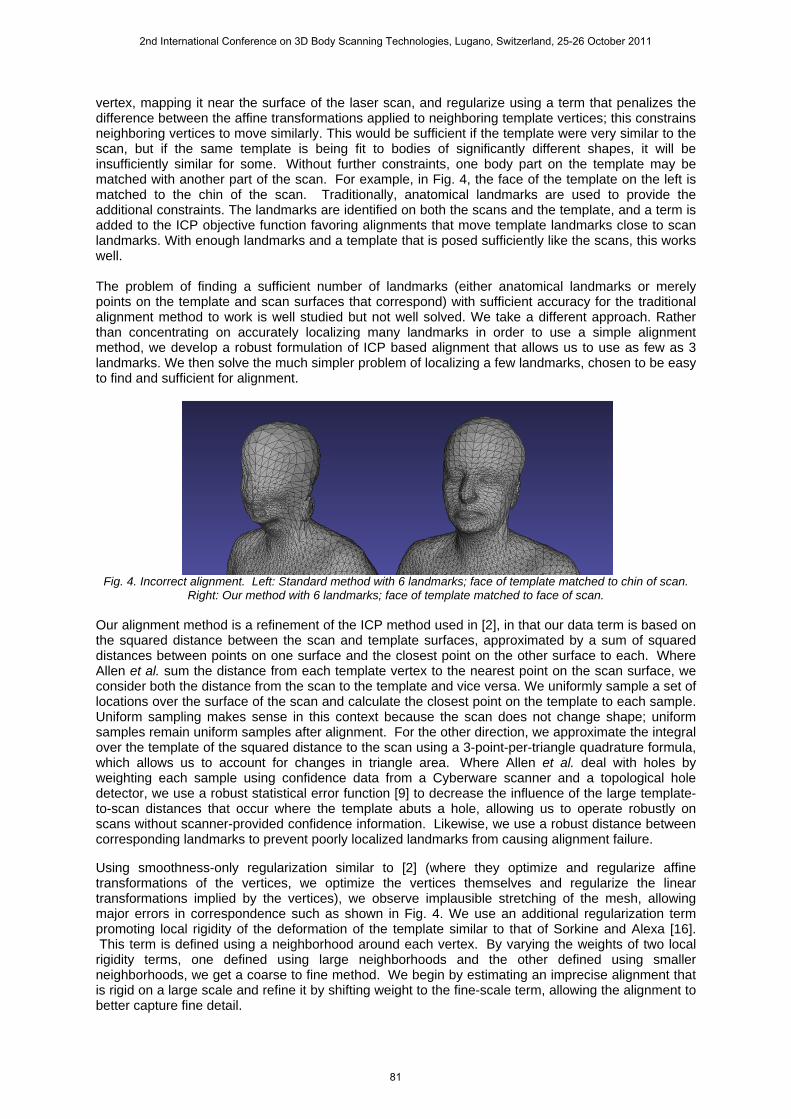
vertex, mapping it near the surface of the laser scan, and regularize using a term that penalizes the difference between the affine transformations applied to neighboring template vertices; this constrains neighboring vertices to move similarly. This would be sufficient if the template were very similar to the scan, but if the same template is being fit to bodies of significantly different shapes, it will be insufficiently similar for some. Without further constraints, one body part on the template may be matched with another part of the scan. For example, in Fig. 4, the face of the template on the left is matched to the chin of the scan. Traditionally, anatomical landmarks are used to provide the additional constraints. The landmarks are identified on both the scans and the template, and a term is added to the ICP objective function favoring alignments that move template landmarks close to scan landmarks. With enough landmarks and a template that is posed sufficiently like the scans, this works well. The problem of finding a sufficient number of landmarks (either anatomical landmarks or merely points on the template and scan surfaces that correspond) with sufficient accuracy for the traditional alignment method to work is well studied but not well solved. We take a different approach. Rather than concentrating on accurately localizing many landmarks in order to use a simple alignment method, we develop a robust formulation of ICP based alignment that allows us to use as few as 3 landmarks. We then solve the much simpler problem of localizing a few landmarks, chosen to be easy to find and sufficient for alignment.
Fig. 4. Incorrect alignment. Left: Standard method with 6 landmarks; face of template matched to chin of scan.
Right: Our method with 6 landmarks; face of template matched to face of scan. Our alignment method is a refinement of the ICP method used in [2], in that our data term is based on the squared distance between the scan and template surfaces, approximated by a sum of squared distances between points on one surface and the closest point on the other surface to each. Where Allen et al. sum the distance from each template vertex to the nearest point on the scan surface, we consider both the distance from the scan to the template and vice versa. We uniformly sample a set of locations over the surface of the scan and calculate the closest point on the template to each sample. Uniform sampling makes sense in this context because the scan does not change shape; uniform samples remain uniform samples after alignment. For the other direction, we approximate the integral over the template of the squared distance to the scan using a 3-point-per-triangle quadrature formula, which allows us to account for changes in triangle area. Where Allen et al. deal with holes by weighting each sample using confidence data from a Cyberware scanner and a topological hole detector, we use a robust statistical error function [9] to decrease the influence of the large template-to-scan distances that occur where the template abuts a hole, allowing us to operate robustly on scans without scanner-provided confidence information. Likewise, we use a robust distance between corresponding landmarks to prevent poorly localized landmarks from causing alignment failure.
Using smoothness-only regularization similar to [2] (where they optimize and regularize affine transformations of the vertices, we optimize the vertices themselves and regularize the linear transformations implied by the vertices), we observe implausible stretching of the mesh, allowing major errors in correspondence such as shown in Fig. 4. We use an additional regularization term promoting local rigidity of the deformation of the template similar to that of Sorkine and Alexa [16]. This term is defined using a neighborhood around each vertex. By varying the weights of two local rigidity terms, one defined using large neighborhoods and the other defined using smaller neighborhoods, we get a coarse to fine method. We begin by estimating an imprecise alignment that is rigid on a large scale and refine it by shifting weight to the fine-scale term, allowing the alignment to better capture fine detail.
2nd International Conference on 3D Body Scanning Technologies, Lugano, Switzerland, 25-26 October 2011
81
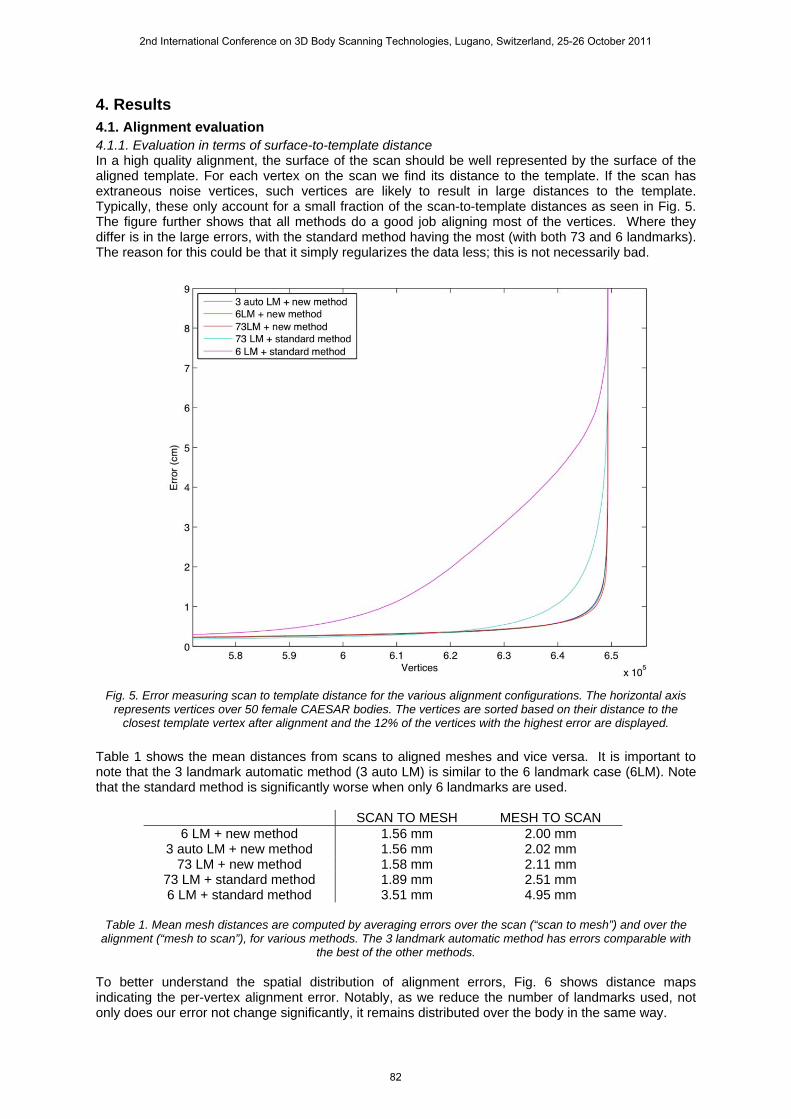
4. Results 4.1. Alignment evaluation 4.1.1. Evaluation in terms of surface-to-template distance In a high quality alignment, the surface of the scan should be well represented by the surface of the aligned template. For each vertex on the scan we find its distance to the template. If the scan has extraneous noise vertices, such vertices are likely to result in large distances to the template. Typically, these only account for a small fraction of the scan-to-template distances as seen in Fig. 5. The figure further shows that all methods do a good job aligning most of the vertices. Where they differ is in the large errors, with the standard method having the most (with both 73 and 6 landmarks). The reason for this could be that it simply regularizes the data less; this is not necessarily bad.
Fig. 5. Error measuring scan to template distance for the various alignment configurations. The horizontal axis
represents vertices over 50 female CAESAR bodies. The vertices are sorted based on their distance to the closest template vertex after alignment and the 12% of the vertices with the highest error are displayed.
Table 1 shows the mean distances from scans to aligned meshes and vice versa. It is important to note that the 3 landmark automatic method (3 auto LM) is similar to the 6 landmark case (6LM). Note that the standard method is significantly worse when only 6 landmarks are used.
SCAN TO MESH MESH TO SCAN 6 LM + new method 1.56 mm 2.00 mm
3 auto LM + new method 1.56 mm 2.02 mm 73 LM + new method 1.58 mm 2.11 mm
73 LM + standard method 1.89 mm 2.51 mm 6 LM + standard method 3.51 mm 4.95 mm
Table 1. Mean mesh distances are computed by averaging errors over the scan (“scan to mesh”) and over the
alignment (“mesh to scan”), for various methods. The 3 landmark automatic method has errors comparable with the best of the other methods.
To better understand the spatial distribution of alignment errors, Fig. 6 shows distance maps indicating the per-vertex alignment error. Notably, as we reduce the number of landmarks used, not only does our error not change significantly, it remains distributed over the body in the same way.
2nd International Conference on 3D Body Scanning Technologies, Lugano, Switzerland, 25-26 October 2011
82
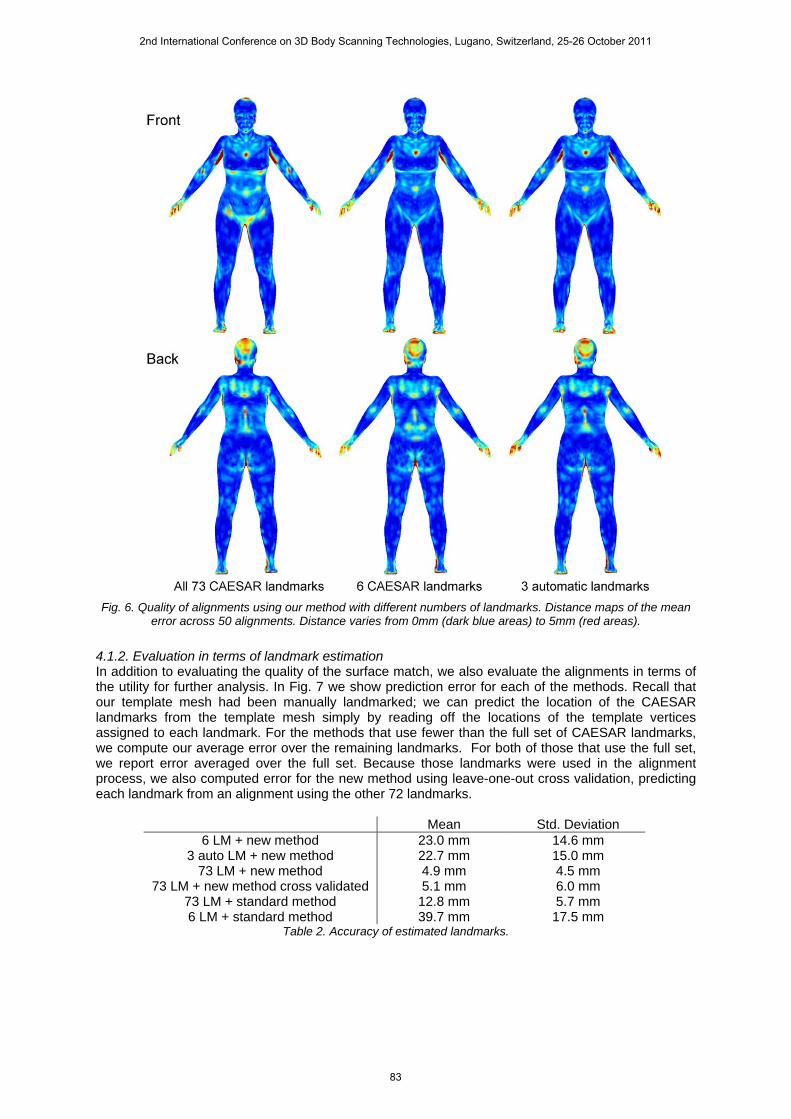
Fig. 6. Quality of alignments using our method with different numbers of landmarks. Distance maps of the mean
error across 50 alignments. Distance varies from 0mm (dark blue areas) to 5mm (red areas).
4.1.2. Evaluation in terms of landmark estimation In addition to evaluating the quality of the surface match, we also evaluate the alignments in terms of the utility for further analysis. In Fig. 7 we show prediction error for each of the methods. Recall that our template mesh had been manually landmarked; we can predict the location of the CAESAR landmarks from the template mesh simply by reading off the locations of the template vertices assigned to each landmark. For the methods that use fewer than the full set of CAESAR landmarks, we compute our average error over the remaining landmarks. For both of those that use the full set, we report error averaged over the full set. Because those landmarks were used in the alignment process, we also computed error for the new method using leave-one-out cross validation, predicting each landmark from an alignment using the other 72 landmarks.
Mean Std. Deviation 6 LM + new method 23.0 mm 14.6 mm
3 auto LM + new method 22.7 mm 15.0 mm 73 LM + new method 4.9 mm 4.5 mm
73 LM + new method cross validated 5.1 mm 6.0 mm 73 LM + standard method 12.8 mm 5.7 mm 6 LM + standard method 39.7 mm 17.5 mm
Table 2. Accuracy of estimated landmarks.
2nd International Conference on 3D Body Scanning Technologies, Lugano, Switzerland, 25-26 October 2011
83
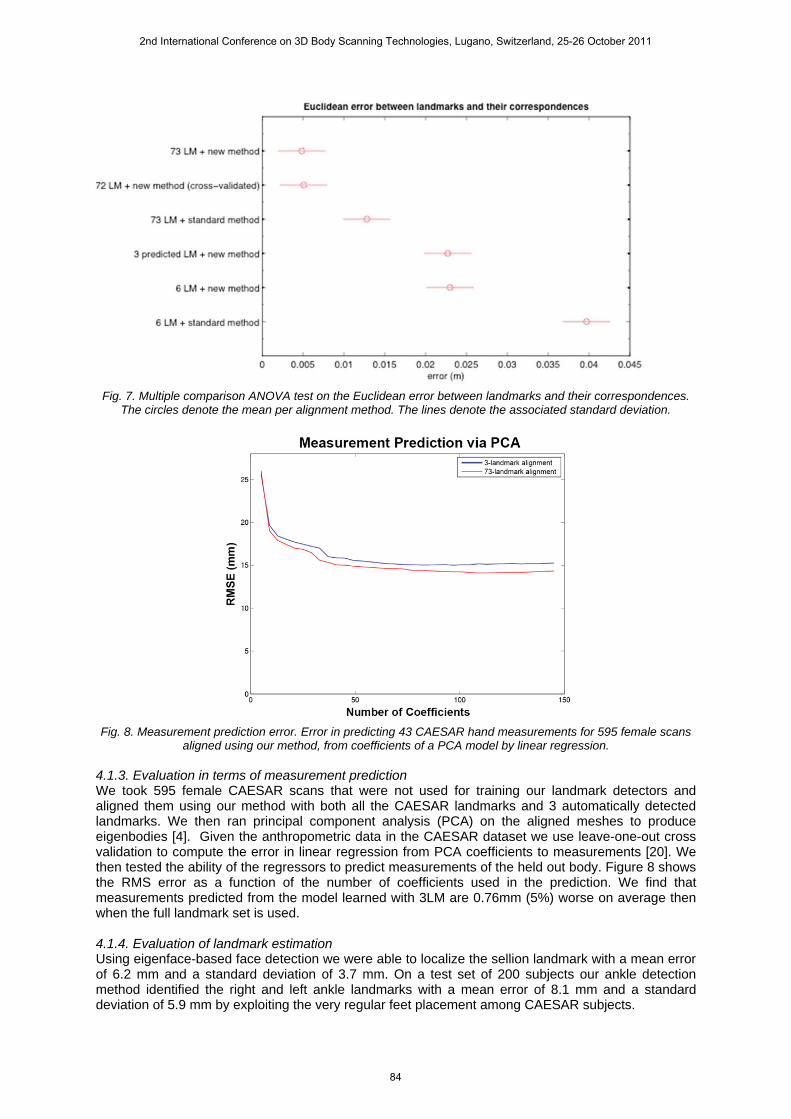
Fig. 7. Multiple comparison ANOVA test on the Euclidean error between landmarks and their correspondences.
The circles denote the mean per alignment method. The lines denote the associated standard deviation.
Fig. 8. Measurement prediction error. Error in predicting 43 CAESAR hand measurements for 595 female scans
aligned using our method, from coefficients of a PCA model by linear regression. 4.1.3. Evaluation in terms of measurement prediction We took 595 female CAESAR scans that were not used for training our landmark detectors and aligned them using our method with both all the CAESAR landmarks and 3 automatically detected landmarks. We then ran principal component analysis (PCA) on the aligned meshes to produce eigenbodies [4]. Given the anthropometric data in the CAESAR dataset we use leave-one-out cross validation to compute the error in linear regression from PCA coefficients to measurements [20]. We then tested the ability of the regressors to predict measurements of the held out body. Figure 8 shows the RMS error as a function of the number of coefficients used in the prediction. We find that measurements predicted from the model learned with 3LM are 0.76mm (5%) worse on average then when the full landmark set is used. 4.1.4. Evaluation of landmark estimation Using eigenface-based face detection we were able to localize the sellion landmark with a mean error of 6.2 mm and a standard deviation of 3.7 mm. On a test set of 200 subjects our ankle detection method identified the right and left ankle landmarks with a mean error of 8.1 mm and a standard deviation of 5.9 mm by exploiting the very regular feet placement among CAESAR subjects.
2nd International Conference on 3D Body Scanning Technologies, Lugano, Switzerland, 25-26 October 2011
84

5. Conclusions We have evaluated several methods for aligning template meshes to laser scans. The ultimate goal is to achieve accurate alignment without the need to landmark scans by hand. We evaluated accuracy of the alignments using scan-to-template distance, template-to-scan distance, Euclidean landmark distance error, and measurement prediction. Arguably, this last evaluation measure is all that matters for many applications. We found that 1) reducing the number of landmarks from 73 to 6 caused a standard method to fail; 2) using our method, reasonable alignments could be obtained with only 6 landmarks; 3) while scan-to-template distances were low with 6 landmarks, the prediction of missing landmarks was significantly worse than using 72 landmarks (ie with one held out); 4) 3 automatically detected landmarks produce alignments that are as accurate as 6 ground truth landmarks; 5) measurement prediction accuracy decreased by 5% when using 3 automatic landmarks. Clearly more research needs to go into evaluation methods for alignment methods. None of the methods used here is entirely satisfactory but together they give a sense of what is important. Clearly increasing the regularization enables alignment with fewer landmarks but also increases the smoothness of the aligned model which may cause other problems. Future work should examine methods to refine the alignment and reduce the regularization. Here we only evaluated female bodies though we expect the results to hold for males. Future alignment methods also need to fit hand better and be robust to the presence of hair. If landmark detection is important, then the body model provides a powerful way to find them. Right now the landmarks on our template are determined by hand. Given the alignments to the meshes, the landmark locations on the template can be refined. Here the template mesh was in a pose similar to the scans. This was not absolutely necessary. We found that with 6 or more markers, we could use a template in a T-pose and it would deform properly to align to the scans. To deal with larger pose variations, we expect that the more markers may be necessary or more sophisticated pose optimization methods would be need. This is a topic of our current research.
Acknowledgements We thank Scott Ettinger for the implementation of the Allen et al. [2] alignment method. This work was supported in part by NIH EUREKA award 1R01NS066311–01, NSF award IIS–0812364 and the Office of Naval Research, Contract W911QY-10-C-0172. The presented work has been approved for public release (U11-248).
References 1. Tsoli, A. and Black, M.J., (2011): “Shape- and pose-invariant correspondences using probabilistic
geodesic surface embedding”, DAGM. 2. Allen, B., Curless, B., Popovic, Z., (2003): “The space of human body shapes: reconstruction and
parameterization from range scans”, Proceedings of ACM SIGGRAPH, San Diego, CA, pp. 587-594
3. Anguelov, D., Srinivasan, P., Pang, H., Koller, D., Thrun, S., Davis, J., (2004): "The correlated correspondence algorithm for unsupervised registration of nonrigid surfaces". Proceedings of Neural Information Processing Systems, pp. 33.
4. Azouz, Z. B., Rioux, M., Shu, C., Lepage, R., (2004): “Analysis of human shape variation using volumetric techniques”, Proceedings of Computer Animation and Social Agents, Geneva, Switzerland, pp. 197–206
5. Azouz, Z. B., Rioux, M., Shu, C., Lepage, R., (2005): “Characterizing Human Shape Variation Using 3-D Anthropometric Data”, The Visual Computer International Journal of Computer Graphics, Vol. 22, No. 5, pp. 302-314
6. Azouz, B.Z., Shu, C., Mantel, A., (2006): “Automatic location of anthropometric landmarks on 3D human models”. Proceedings of International Symposium on 3D Data Processing, Visualization and Transmission, Chapel Hill, NC, USA, pp. 750-757
2nd International Conference on 3D Body Scanning Technologies, Lugano, Switzerland, 25-26 October 2011
85

7. Bronstein, A.M. and Bronstein, M.M. and Kimmel, R. and Mahmoudi, M. and Sapiro, G., (2010): “A Gromov-Hausdorff framework with diffusion geometry for topologically-robust non-rigid shape matching”, International Journal of Computer Vision, Vol. 89, No. 2, pp. 266-286
8. Feldmar, J., Ayache, N., (1994): “Rigid and affine registration of smooth surfaces using differential properties”, Proceedings of European Conference on Computer Vision, Stockholm, Sweden, pp. 397-406
9. Geman S., McClure D., (1987): “Statistical methods for tomographic image reconstruction”, Proceedings of the International Statistical Institute Bulletin, Vol. 4, pp. 5-21
10. Han, H., Nam, Y., (2011): “Automatic body landmark identification for various body figures”, International Journal of Industrial Ergonomics
11. Huang, Q., Adams, B., Wicke, M., Guibas, L. (2008): “Non-rigid registration under isometric deformations”, Proceedings of Eurographics Symposium on Geometry Processing, pp. 1449–1457
12. Kahler, K., Haber, J. Yamauchi, H. Seidel, H.-P., (2002): “Head Shop: Generating animated head models with anatomical structure”, Proceedings of ACM SIGGRAPH Symposium on Computer Animation, San Antonio, TX, USA, pp. 55-64
13. Kim, V.G., Lipman, Y., Funkhouser, T., (2011): “Blended intrinsic maps”, Proceedings of ACM SIGGRAPH, Vancouver, Canada
14. Robinette, K., Blackwell, S., Daanen, H., Boehmer, M., Fleming, S., (2002): Civilian American and European Surface Anthropometry Resource (CAESAR) Final Report, AFRL-HE-WP-TR-2002-0169, United States Air Force Research Laboratory
15. Rusinkiewicz, S., Levoy, M., (2001): “Efficient variants of the ICP algorithm”, Proceedings of the International Conference on 3-D Digital Imaging and Modeling, Quebec City, Canada, pp. 145-152
16. Sorkine and Alexa, As-Rigid-As-Possible Surface Modeling, Eurographics 2007. 17. Suikerbuik, R., Tangelder, J.W.H., Daanen, H.A.M., Oudenhuijzen, A., (2004): “Automatic Feature
Detection in 3D Human Body Scans“, Conference on Digital Human Modeling for Design and Engineering, Rochester, NY, USA
18. Szeliski, R., Lavallee, S., (1994): “Matching 3D anatomical surfaces with non-rigid deformations using octree-splines”, Proceedings of IEEE Workshop on Biomedical Images Analysis, Seattle, WA, USA, p. 144-153
19. Turk, M., Pentland, A., (1991): “Eigenfaces for recognition”, Journal of Cognitive Neuroscience, Vol. 3, No. 1, pp. 71–86
20. Weiss, A., Hirshberg, D., Black, M.J., (2011): “Home 3D body scans from noisy image and range data”, ICCV.
21. Wuhrer, S., Shu, C., Azouz, Z. B., Bose, P., (2007): “Posture Invariant Correspondence of Incomplete Triangular Manifolds”, International Journal of Shape Modeling. Vol. 13, No. 2
2nd International Conference on 3D Body Scanning Technologies, Lugano, Switzerland, 25-26 October 2011
86