evaluating station facilities through...
TRANSCRIPT

Presented at PTV Innovation day & User Group Meeting, New Delhi on 25th Nov 2015
Evaluating StationFacilities through
SimulationPresented by: Rohan ModiGuide: Prof. H.M. Shivanand Swamy

o Background
o Literature review
o Data collection
o Base Model
development & Output
o Scenario development
o Findings and
recommendations
Presentation Overview
2Evaluating Station Facilities Through SimulationC E P T University, Ahmedabad
BackgroundIntroductionResearch ObjectiveScope & LimitationsResearch Methodology
3Evaluating Station Facilities Through SimulationC E P T University, Ahmedabad

o Develop a methodology to assess transit station capacity using
microsimulation model
o To demonstrate physical constraints of Maninagar railway station
4
Introduction
Research Objective
o Rail based transit system are one of most Efficient and Economic, offers
Shorter Travel Time and expected to enhance PT share.
o Attempts are to build passenger friendly stations
o Density, Walking Distance and Transfer Time as performance
assessment tool
o Assessment through Manual Method and Simulation
o Simulation represents Effective Visualization and Detailed Analysis
Evaluating Station Facilities Through SimulationC E P T University, Ahmedabad

Scope & Limitations
5
o The model created in PTV VISSIM is applicable to Maninagar railwaystation only. It is created for the paid areas of the station only.
o There are certain loop holes in infrastructure that can’t be incorporatedin model.
Research MethodologyIntroduction
Literature study
Case study
Data collection
Base modeldevelopment
Modelcalibration
Analysis
Aim andObjective
Scope andLimitation
LOSidentification
Evaluationstandards
Data needed
Process
Surveymethodology
Scenariodevelopment
Conclusion andrecommendation
Evaluating Station Facilities Through SimulationC E P T University, Ahmedabad

Literature ReviewIntroduction toperformance AssessmentSummary of case studies
6Evaluating Station Facilities Through SimulationC E P T University, Ahmedabad
7
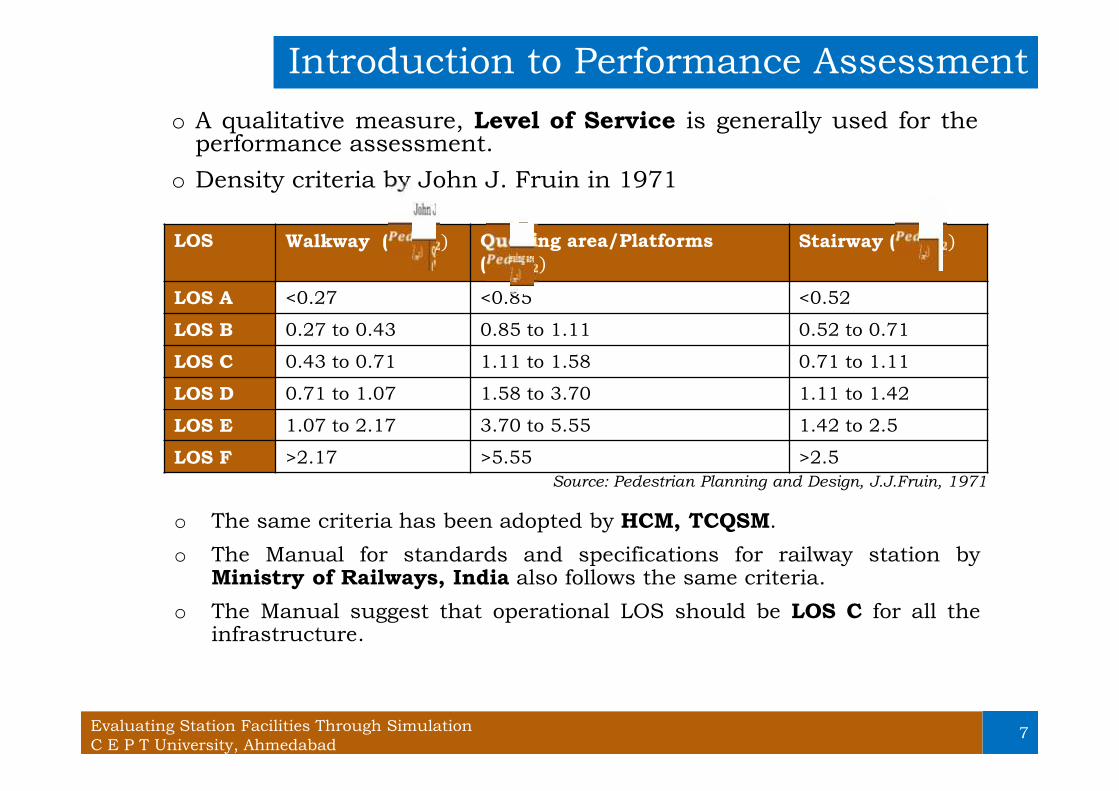
Introduction to Performance Assessmento A qualitative measure, Level of Service is generally used for the
performance assessment.o Density criteria by John J. Fruin in 1971
LOS Walkway ( ) Queuing area/Platforms( ) Stairway ( )
LOS A <0.27 <0.85 <0.52
LOS B 0.27 to 0.43 0.85 to 1.11 0.52 to 0.71
LOS C 0.43 to 0.71 1.11 to 1.58 0.71 to 1.11
LOS D 0.71 to 1.07 1.58 to 3.70 1.11 to 1.42
LOS E 1.07 to 2.17 3.70 to 5.55 1.42 to 2.5
LOS F >2.17 >5.55 >2.5Source: Pedestrian Planning and Design, J.J.Fruin, 1971
o The same criteria has been adopted by HCM, TCQSM.o The Manual for standards and specifications for railway station by
Ministry of Railways, India also follows the same criteria.o The Manual suggest that operational LOS should be LOS C for all the
infrastructure.
Evaluating Station Facilities Through SimulationC E P T University, Ahmedabad

8
Introduction to Performance Assessment
LOS BFree circulation,occasional needto adjust path
LOS AFree circulation,
Ability to move indesired path
LOS CSlightly restricted
circulation,Frequent need to
adjust path
LOS DCirculation without
touching isimpossible,
overpassing slowerpedestrian is
restricted
LOS ERestricted
circulation for allpedestrians,
Limited abilitypass slowerpedestrian
LOS FComplete
breakdown incirculation, Can’t
pass slowerpedestrian
Source: Author
Evaluating Station Facilities Through SimulationC E P T University, Ahmedabad

9
Summary of case studiesMetrotown
station,Burnaby
Railway stationin South Africa
North Melbournestation, Victoria
o Data needed for the study such as station layout, trainschedule, passenger volume, speed has been identified
o Methodology has been finalised
Evaluating Station Facilities Through SimulationC E P T University, Ahmedabad
Data CollectionWhy Maninagar?Introduction to MRSData CollectionMethodologyObservation from DataCollection
10Evaluating Station Facilities Through SimulationC E P T University, Ahmedabad
11
Why Maninagar?
SabarmatiRailwaystation
AhmedabadRailway Station
ManinagarRailway Station
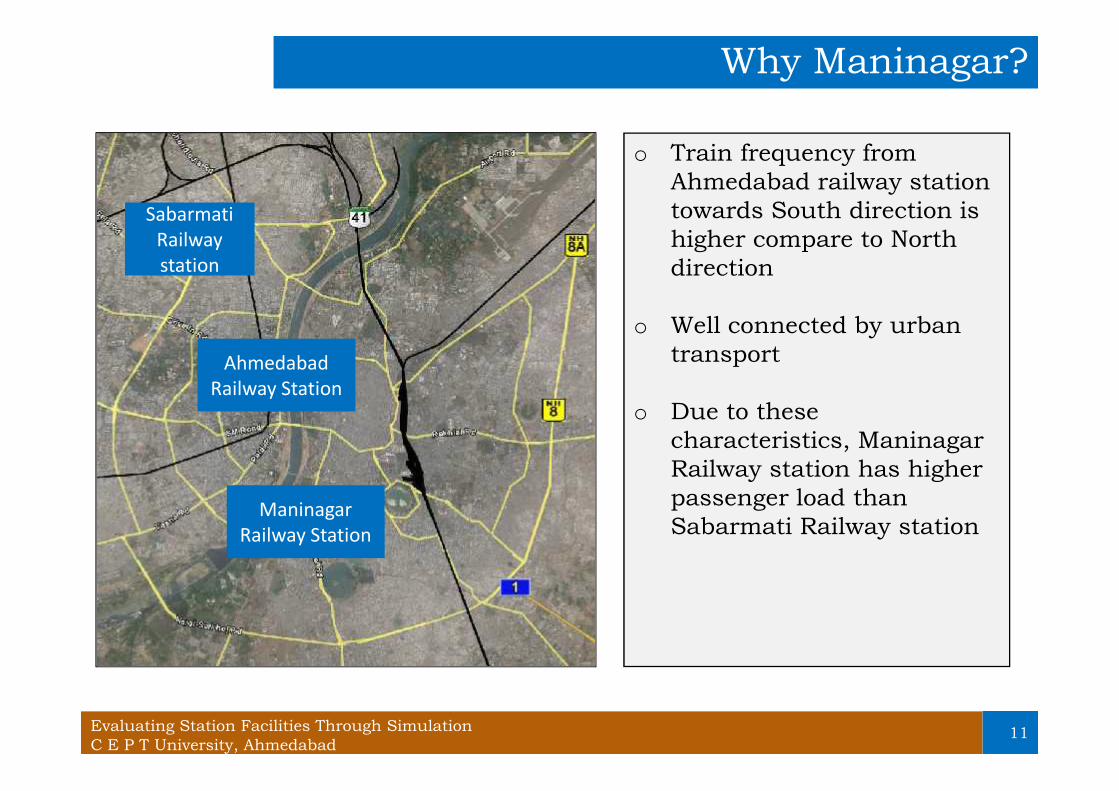
o Train frequency fromAhmedabad railway stationtowards South direction ishigher compare to Northdirection
o Well connected by urbantransport
o Due to thesecharacteristics, ManinagarRailway station has higherpassenger load thanSabarmati Railway station
Evaluating Station Facilities Through SimulationC E P T University, Ahmedabad

12
Introduction to Maninagar Railway Station
PF 2 (Towards Mumbai)
PF 1 (Towards Ahmedabad) 1 2
3N
BRTS
AMTS Terminal
AMTS
AMTS
Evaluating Station Facilities Through SimulationC E P T University, Ahmedabad

13
Data Collection Methodology
Trainschedule
Defining peakperiod
Passengercount
Speedsurvey
Classified Inand out countat entrances
and FOB
Speed ofpedestrian withrespect to age,gender, Group,
Luggage
Data collection
Secondarydata Primary data
Stationlayout
Evaluating Station Facilities Through SimulationC E P T University, Ahmedabad

Data Collection Methodology
14
Defining Peak
0
1
2
3
4
Trai
ns
Time
Daily trains2 Local and2 Express
trains3 Local and3 Express
trains
Evaluating Station Facilities Through SimulationC E P T University, Ahmedabad

Data Collection Methodology
14
Speed Survey
o Speed varies with, Group behaviour, Luggage characteristics Gender Age
Videography Survey Location
PF 2
PF 1 1 2
43
N
1 2
3
Evaluating Station Facilities Through SimulationC E P T University, Ahmedabad
16
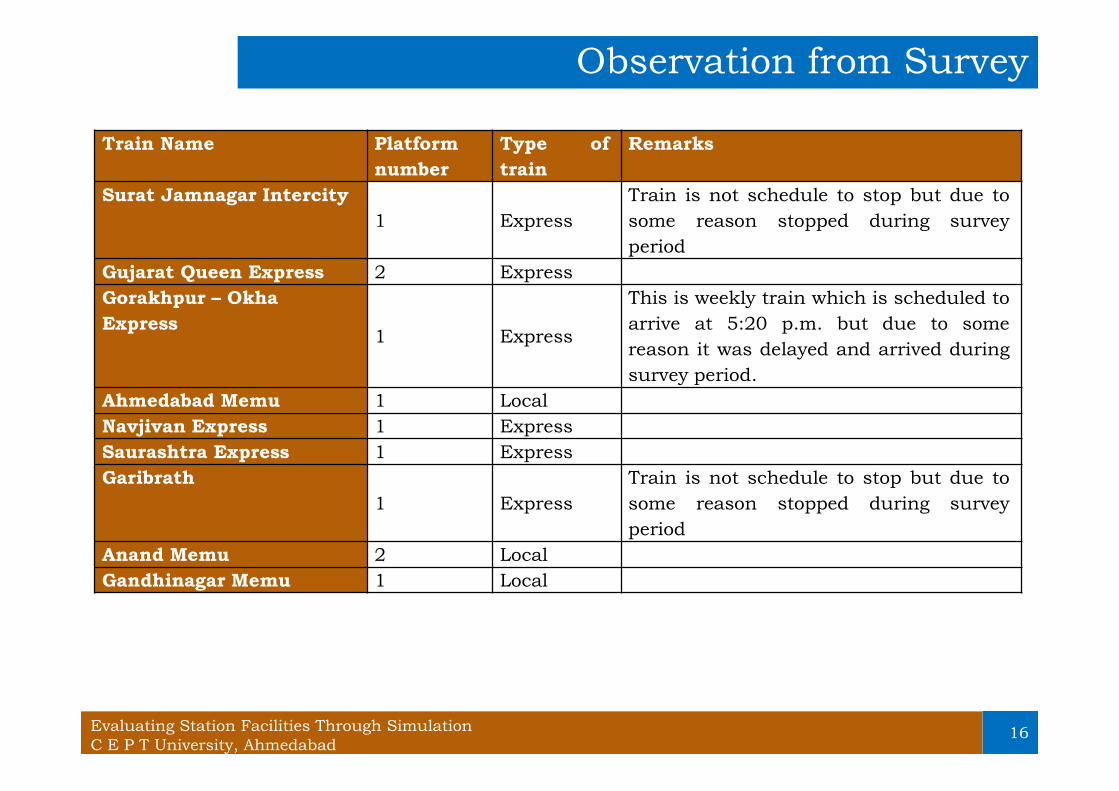
Observation from Survey
Train Name Platformnumber
Type oftrain
Remarks
Surat Jamnagar Intercity1 Express
Train is not schedule to stop but due tosome reason stopped during surveyperiod
Gujarat Queen Express 2 ExpressGorakhpur – OkhaExpress
1 Express
This is weekly train which is scheduled toarrive at 5:20 p.m. but due to somereason it was delayed and arrived duringsurvey period.
Ahmedabad Memu 1 LocalNavjivan Express 1 ExpressSaurashtra Express 1 ExpressGaribrath
1 ExpressTrain is not schedule to stop but due tosome reason stopped during surveyperiod
Anand Memu 2 LocalGandhinagar Memu 1 Local
Evaluating Station Facilities Through SimulationC E P T University, Ahmedabad
17
Observation from Survey
0
50
100
150
200
250
300
350
400
05:4
5
05:5
0
05:5
5
06:0
0
06:0
5
06:1
0
06:1
5
06:2
0
06:2
5
06:3
0
06:3
5
06:4
0
06:4
5
06:5
0
06:5
5
07:0
0
07:0
5
07:1
0
07:1
5
07:2
0
07:2
5
07:3
0
07:3
5
07:4
0
07:4
5
07:5
0
07:5
5
08:0
0
PASS
ENGE
RS
TIME
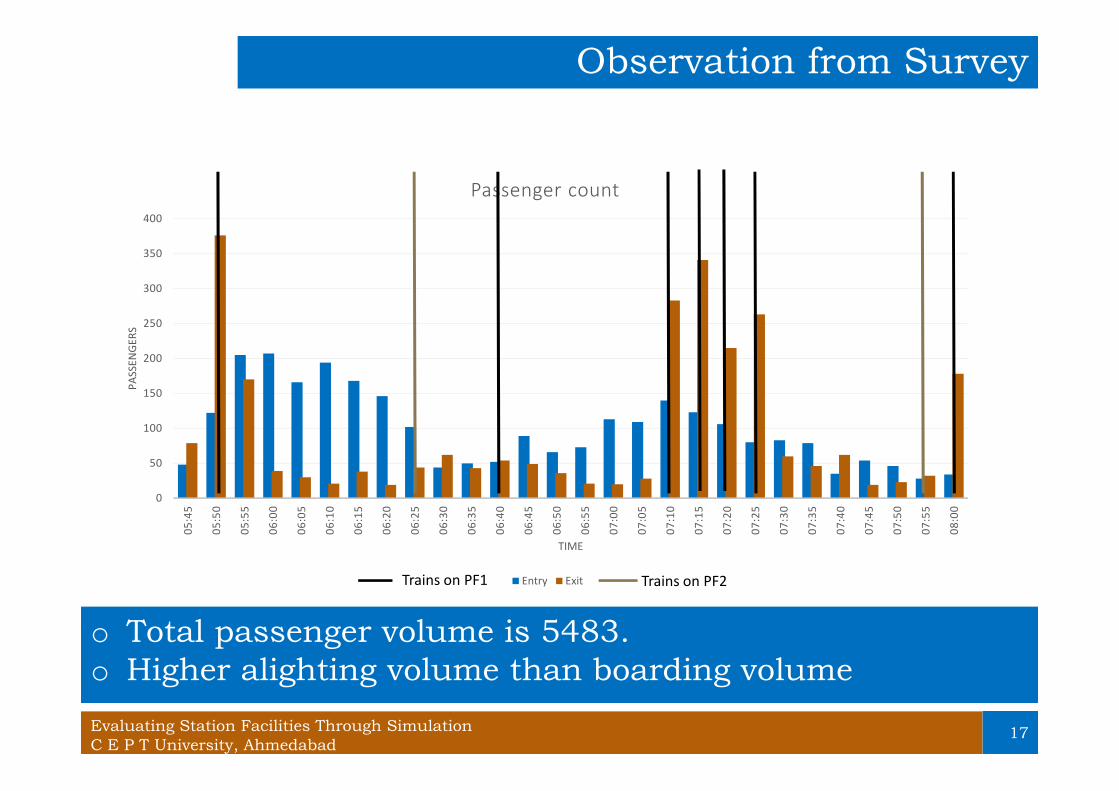
Passenger count
Entry Exit Trains on PF2Trains on PF1
o Total passenger volume is 5483.o Higher alighting volume than boarding volumeEvaluating Station Facilities Through SimulationC E P T University, Ahmedabad

18
Observation from Survey
Evaluating Station Facilities Through SimulationC E P T University, Ahmedabad
o Gate 2 is predominant entry-exit point.o The passengers are daily commuters.

Base Model Development & OutputIntroduction to SocialForce ModelModel LimitationsMethodology for ModelDevelopmentModel CalibrationModel ValidationOutput
19Evaluating Station Facilities Through SimulationC E P T University, Ahmedabad

20
Introduction to Social Force Modelo Through Viswalk as an add-on module in Vissim, it is possible to simulate
high volume of pedestrian traffic and analyse only pedestrian situation orinteraction of pedestrian traffic with vehicular traffic.
o In Vissim, vehicular traffic behaviour is based on Wiedemann’s phycho-physical car-following model while pedestrian traffic is based on SocialForce Model by Helbing & Molnar.
o The model considers pedestrian motion is subjected to forces and due tothis forces, pedestrian move in certain direction.
Source: http://futurict.blogspot.in/2014/12/social-forces-revealing-causes-of.html
F= + + +
Evaluating Station Facilities Through SimulationC E P T University, Ahmedabad

21
Model Limitationso Uniform alighting-boarding has been from each coach.
o Passenger input is just outside of the station area. If locationchanged then it may affect density at bottlenecks.
o It is not possible to visualise passengers travelling withluggage and with family or group with exact composition.
o The passengers waiting at station by occupying seatingarrangements are not possible to visualise.
o The passengers in waiting area tend to move if and whencongestion increases however the same is not true in themodel.
Evaluating Station Facilities Through SimulationC E P T University, Ahmedabad
22
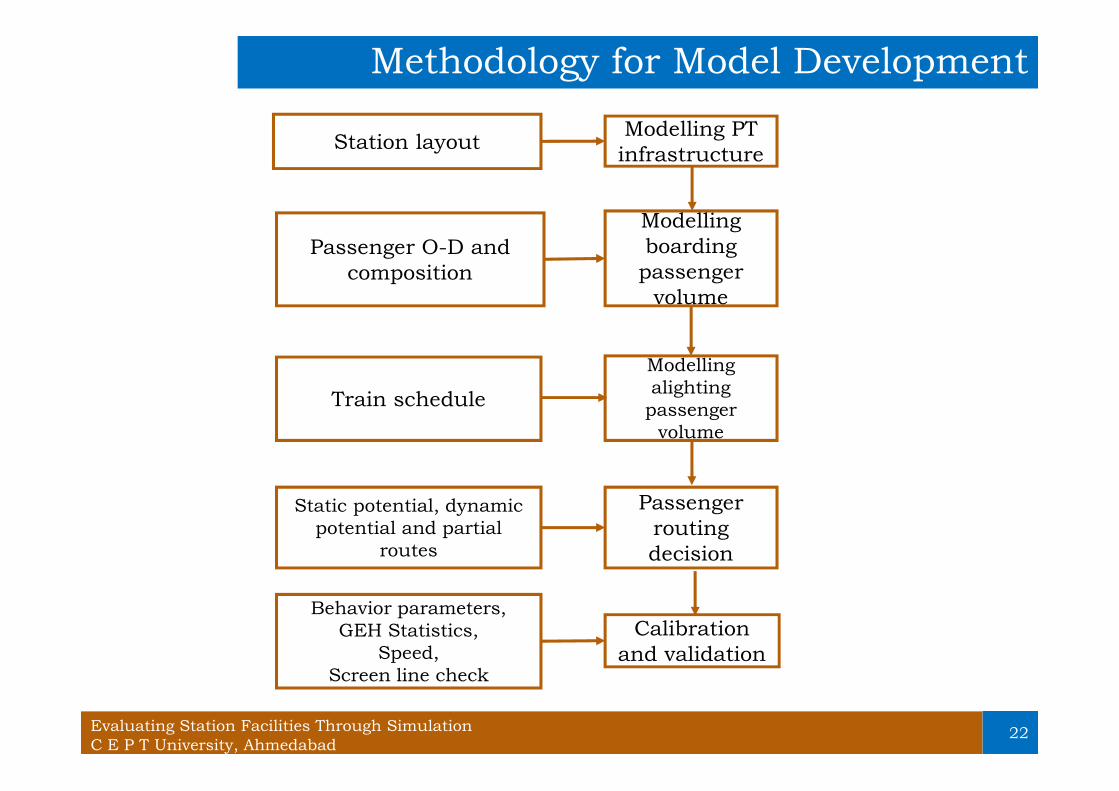
Methodology for Model Development
Modelling PTinfrastructure
Modellingboardingpassenger
volume
Modellingalighting
passengervolume
Calibrationand validation
Passengerroutingdecision
Passenger O-D andcomposition
Train schedule
Static potential, dynamicpotential and partial
routes
Behavior parameters,GEH Statistics,
Speed,Screen line check
Station layout
Evaluating Station Facilities Through SimulationC E P T University, Ahmedabad

23
Methodology for Model Development
Modelling PT Infrastructure
o Railway Track, PT Lines & PT Stops Different stops & PT lines for different trains
o Waiting Area & Platform Edge Physically it is a single unit but in model it differs Waiting area behaviour such as Wait at Fixed Location & Wait if held
up
o Stairs Access to Station area FOB
o Supporting Infrastructure Seating arrangements, water hut, commercial outlets and columns of
station building platform sheds, traction line & pedestrian RoB Obstacle distance of 0.5m
Evaluating Station Facilities Through SimulationC E P T University, Ahmedabad

24
Methodology for Model Development
Modelling Boarding-Alighting Volumes
o Passenger Input Passenger input at 5 min interval as counted from each gate. Stochastic variation
o Passenger Composition Relative Flow for each category is modelled for passenger entering
from each gate and Alighting from each traino Speed
Desired speed for each category in from of S- shaped curve Maximum & Minimum speed for each category
o Boarding Volumes Interaction between platforms calculated using passenger count at
entry-exit and FOB for 5 min time interval Boarding volume assigned to only trains which are coming from
Ahmedabad railway station or going beyond Ahmedabad railwaystation
o Alighting Volumes Passenger going out from each gate within 10 mins from train arrival
is considered as alighting volume
Evaluating Station Facilities Through SimulationC E P T University, Ahmedabad

25
Methodology for Model Development
Passenger Routing Decisions
o It is human tendency to minimize travel time to their decision.
o Shortest path may not be quickest path
o Thus static route with dynamic potential is considered which is function ofgeneral strength “g” and directional impact “h”
Evaluating Station Facilities Through SimulationC E P T University, Ahmedabad

26
Model Calibration
o The calibration is a process by which one tries to fit the accuracyof the model with existing situation.
o Two type of calibration process System Calibration Operation Calibration
o Model calibrated by adjusting behaviour parameters.
o These parameters governs passengers characteristics such asreaction time, distance from obstacles and passengers, strengthbetween passengers, directions, evading distance and randomforce.
o There is no study available for relationship between change inparameter value and change in behaviour.
Evaluating Station Facilities Through SimulationC E P T University, Ahmedabad

27
Model Calibration
Walkingbehaviourparameter
Explanation Change Effect Defaultvalue
Adjustedvalue
Tau (τ) Tau can be interpreted asreaction time which can berelated to inertia or relaxationtime. It relates the differencebetween desired speed anddesired direction withcurrent speed and direction.It can be consider as thedriving force.
Increase Increases pedestrianacceleration, decreasedensity at the bottleneck,increases radius nearobjects
0.4 0.6
React to n Related to social forceconsidered for the pedestrianmovement. It determines themaximum number ofpedestrians to be considerduring calculation of socialforce
Decrease It makes pedestrians morejitter and increase densityat the bottleneck, leads toformation of the group
8 5
Lambdamean (λ)
It considers the event andpedestrians behind apedestrian do not affect themovement of pedestrian
Increase Counter flow more efficient,flow through bottleneckdepending on the size ofjam,makes pedestrian pushmore
0.176 0.35
Evaluating Station Facilities Through SimulationC E P T University, Ahmedabad

28
Model Calibration
Walkingbehaviourparameter
Explanation Change Effect Defaultvalue
Adjustedvalue
A socialIsotropic,A socialMean,B socialIsotropic,B SocialMean
Governs the directiondependency forcebetween two pedestrians
Increase Counter flow is handledvery smoothly,Lower density at thebottleneck,higher headwaybetween passengers
2.720,0.20,0.4,2.8
3.5,0.3,0.45,3
VD Decides when to evadeopposite pedestrian
Increase Increase distance forevade
3 4
Noise Parameter governs therandom force
Increase Prevents deadlocks 1.2 1.5
Grid size The distance at whichpedestrians have aneffect on each other
Decrease Reduce the maximumdistance of theinfluence
0.5 m 0.5 m
Evaluating Station Facilities Through SimulationC E P T University, Ahmedabad

29
Model Validationo Validation is the process by which one checks the accuracy of
the model.o It determines how closely the simulation model is replicating the
actual study area based on the validation targets set.
Parameter Satisfying CriteriaGEH Statistic <5
Speed <15%
Screen line accuracy <5%
Source: Traffic Modelling Guidelines, Transport for London, 2010
o GEH statistic is generally use to check the goodness to fit of the model
o GEH= ( )( )Where K is observed flow
M is modelled flow
o GEH should be less than 5 for more than 85% cases of total run
Evaluating Station Facilities Through SimulationC E P T University, Ahmedabad

30
Model Validation
GEH Statistics
55006365
42434774
6895
5266
6278
41804656
6733
0
1000
2000
3000
4000
5000
6000
7000
8000
1 2 3 4 5
Pass
enge
rsPassenger volume
Observed volume Modelled volume
2.96
1.09 0.97 1.09
1.96
0.00
0.50
1.00
1.50
2.00
2.50
3.00
3.50
1 2 3 4 5
GEH
Valu
e
Simulation run
GEH value
GEH is less than 5 for all cases, hence model isaccurate
Evaluating Station Facilities Through SimulationC E P T University, Ahmedabad

31
Model Validation
Speed by Category
0.00
0.50
1.00
1.50
2.00
2.50
3.00
3.50
4.00
4.50
1 2 3 4 5 6 7 8 9 10 11 12 13 14
Aver
age
Spee
d(k
mph
)
Passenger category
Average speed
Simulated Average speed Observed Average speed
o Maximum variation is 10%
Evaluating Station Facilities Through SimulationC E P T University, Ahmedabad

32
Model Validation
Speed by Characteristics
0
1
2
3
4
Minor Young Elder Older
Spee
d (k
mh)
Age
Simulate average speed Observed average speed
0
1
2
3
4
Individual Group
Spee
d (k
mph
)
Group and individual
Simulated Average speed Observed average speed
0
1
2
3
4
Male Female
Spee
d (k
mph
)
Gender
Simulated average speed Observed average speed
0
1
2
3
4
Without luggage with luggage
Spee
d (k
mph
)
Luggage characteristics
Simulated average speed Observed average speed
o Maximum variation is 11%
Evaluating Station Facilities Through SimulationC E P T University, Ahmedabad

0
15
30
45
60
75
90
105
120
135
150
165
180
195
300 600 900 1200 1500 1800 2100 2400 2700 3000 3300 3600 3900 4200 4500 4800 5100 5400 5700 6000 6300 6600 6900 7200 7500 7800 8100 8400
Pass
enge
rs
Simulation seconds
Passenger Flow
Simulated flow Observed Flow
33
Model Validation
Screen Line Accuracy
o Model is 99% accurate for total screen line flow
Evaluating Station Facilities Through SimulationC E P T University, Ahmedabad
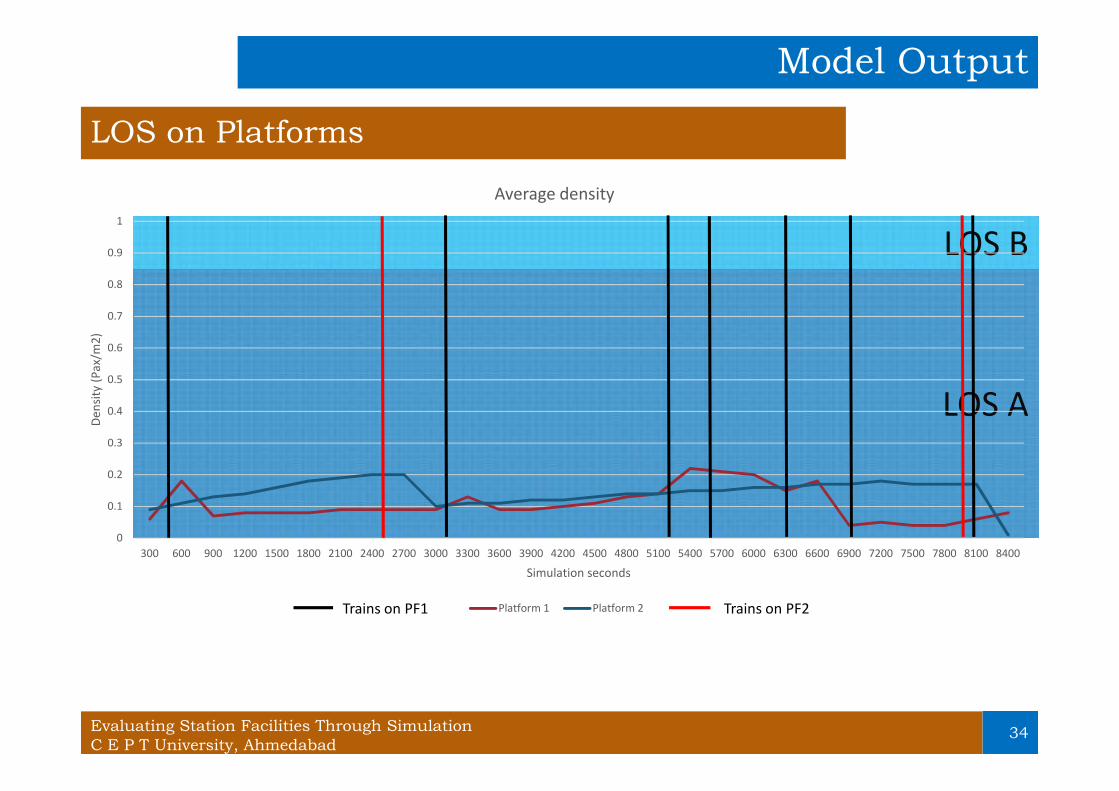
34
Model Output
LOS A
LOS B
0
0.1
0.2
0.3
0.4
0.5
0.6
0.7
0.8
0.9
1
300 600 900 1200 1500 1800 2100 2400 2700 3000 3300 3600 3900 4200 4500 4800 5100 5400 5700 6000 6300 6600 6900 7200 7500 7800 8100 8400
Dens
ity (P
ax/m
2)
Simulation seconds
Average density
Platform 1 Platform 2 Trains on PF2Trains on PF1
LOS on Platforms
Evaluating Station Facilities Through SimulationC E P T University, Ahmedabad

35
Model Output
LOS on FOB
LOS A
LOS BLOS C
LOS D
0
0.2
0.4
0.6
0.8
1
1.2
1.4
300 600 900 1200 1500 1800 2100 2400 2700 3000 3300 3600 3900 4200 4500 4800 5100 5400 5700 6000 6300 6600 6900 7200 7500 7800 8100 8400
Dens
ity (p
ed/m
2)
Simulation seconds
Average density on FOB
Avergae density Trains on PF2Trains on PF1
MaximumLOS B for 3
minutes
Evaluating Station Facilities Through SimulationC E P T University, Ahmedabad

36
Model Output
LOS on Sections near gates
LOS A
LOS B
0
0.1
0.2
0.3
0.4
0.5
0.6
0.7
0.8
0.9
1
300 600 900 1200 1500 1800 2100 2400 2700 3000 3300 3600 3900 4200 4500 4800 5100 5400 5700 6000 6300 6600 6900 7200 7500 7800 8100 8400
Dens
ity (P
ax/m
2)
Simulation seconds
Average density near gates
Gate 1 Gate 2 Gate 3 Trains on PF2Trains on PF1
Evaluating Station Facilities Through SimulationC E P T University, Ahmedabad

37
Model Output
Sections
Evaluating Station Facilities Through SimulationC E P T University, Ahmedabad

38
Model Output
Sections
LOS A LOS B
Evaluating Station Facilities Through SimulationC E P T University, Ahmedabad

39
Model Output
Summaryo Both Platforms operate at level of service Ao Foot over bridge operates at Level of Service Bo All the sections operates at LOS A
o Thus infrastructure is underutilised.
Evaluating Station Facilities Through SimulationC E P T University, Ahmedabad

Scenario DevelopmentMinistry of Railways, IndiaVolume increased by 50%Volume increased by100%
40Evaluating Station Facilities Through SimulationC E P T University, Ahmedabad

41
Scenario Development
ScenarioDevelopment tocheck capacity
As per Manual forstandards and
specifications forstation design by
Ministry ofRailways, India
50% increasein volume
100%increase in
volume
IdentifyingBottlenecks tocheck capacity
Evaluating Station Facilities Through SimulationC E P T University, Ahmedabad

42
As per Ministry of Railways, India
LOS on Platforms
LOS A
LOS B
0.00
0.20
0.40
0.60
0.80
1.00
300 600 900 1200 1500 1800 2100 2400 2700 3000 3300 3600 3900 4200 4500 4800 5100 5400 5700 6000 6300 6600 6900 7200 7500 7800 8100 8400
Dens
ity (P
ax/m
2)
Simulation seconds
Average density
Platform 1 Platform 2 Trains on PF2Trains on PF1
LOS on FOB
LOS ALOS BLOS CLOS D
00.20.40.60.8
11.21.4
300 600 900 1200 1500 1800 2100 2400 2700 3000 3300 3600 3900 4200 4500 4800 5100 5400 5700 6000 6300 6600 6900 7200 7500 7800 8100 8400
Dens
ity (p
ax/m
2)
Simulation seconds
Average density
Average density
Maximum LOSC
Trains on PF2Trains on PF1
Evaluating Station Facilities Through SimulationC E P T University, Ahmedabad

43
As per Ministry of Railways, India
LOS on Sections near Gates
LOS A
LOS B
LOS C
LOS D
0
0.2
0.4
0.6
0.8
1
1.2
1.4
1.6
1.8
300 600 900 1200 1500 1800 2100 2400 2700 3000 3300 3600 3900 4200 4500 4800 5100 5400 5700 6000 6300 6600 6900 7200 7500 7800 8100 8400
Dens
ity (P
ax/m
2)
Simulation seconds
Average density near gates
Gate 1 Gate 2 Gate 3 Trains on PF2Trains on PF1
MaximumLOS D faced
by 1%passengers
Evaluating Station Facilities Through SimulationC E P T University, Ahmedabad

44
As per Ministry of Railways, India
LOS on Various Sections
% Passengers under LOS
LOS A LOS B LOS C LOS D
Bottlenecks
0%
50%
100%
1 2 3 4 5 6 7 12 13 14 15 16 17 18 19 20 21 22 23 24 25 26 27 28 29 30 31 32 33 34 35 36 37 38 39 40 41 44% o
f pas
seng
ers
Section number
% of passengers under LOS
LOS A LOS B LOS C LOS D LOS E LOS F
LOS D facedby 1%
passengersonly..
Evaluating Station Facilities Through SimulationC E P T University, Ahmedabad

45
Volume Increased by 50%
LOS on Platforms
LOS on FOB
LOS A
LOS B
Trains on PF2Trains on PF1
0
0.2
0.4
0.6
0.8
1
300 600 900 1200 1500 1800 2100 2400 2700 3000 3300 3600 3900 4200 4500 4800 5100 5400 5700 6000 6300 6600 6900 7200 7500 7800 8100 8400
Dens
ity (P
ax/m
2)
Simulation seconds
Average density
Platform 1 Platform 2
LOS ALOS BLOS CLOS D
-0.1
0.4
0.9
1.4
300 600 900 1200 1500 1800 2100 2400 2700 3000 3300 3600 3900 4200 4500 4800 5100 5400 5700 6000 6300 6600 6900 7200 7500 7800 8100 8400
Dens
ity (P
ax/m
2)
Simulation seconds
FOB
Average Density Trains on PF2Trains on PF1
Maximum LOS Dfaced by 1%passengers
Evaluating Station Facilities Through SimulationC E P T University, Ahmedabad
46
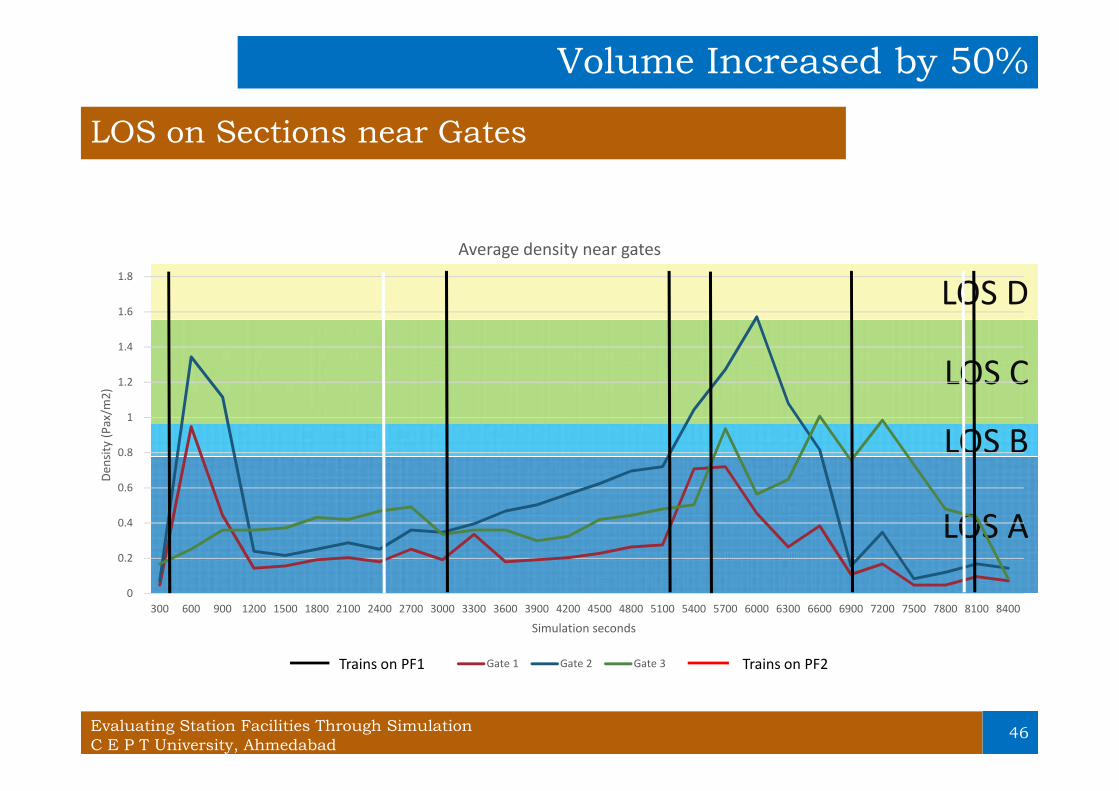
Volume Increased by 50%
LOS on Sections near Gates
LOS A
LOS B
LOS C
LOS D
0
0.2
0.4
0.6
0.8
1
1.2
1.4
1.6
1.8
300 600 900 1200 1500 1800 2100 2400 2700 3000 3300 3600 3900 4200 4500 4800 5100 5400 5700 6000 6300 6600 6900 7200 7500 7800 8100 8400
Dens
ity (P
ax/m
2)
Simulation seconds
Average density near gates
Gate 1 Gate 2 Gate 3 Trains on PF2Trains on PF1
Evaluating Station Facilities Through SimulationC E P T University, Ahmedabad
47
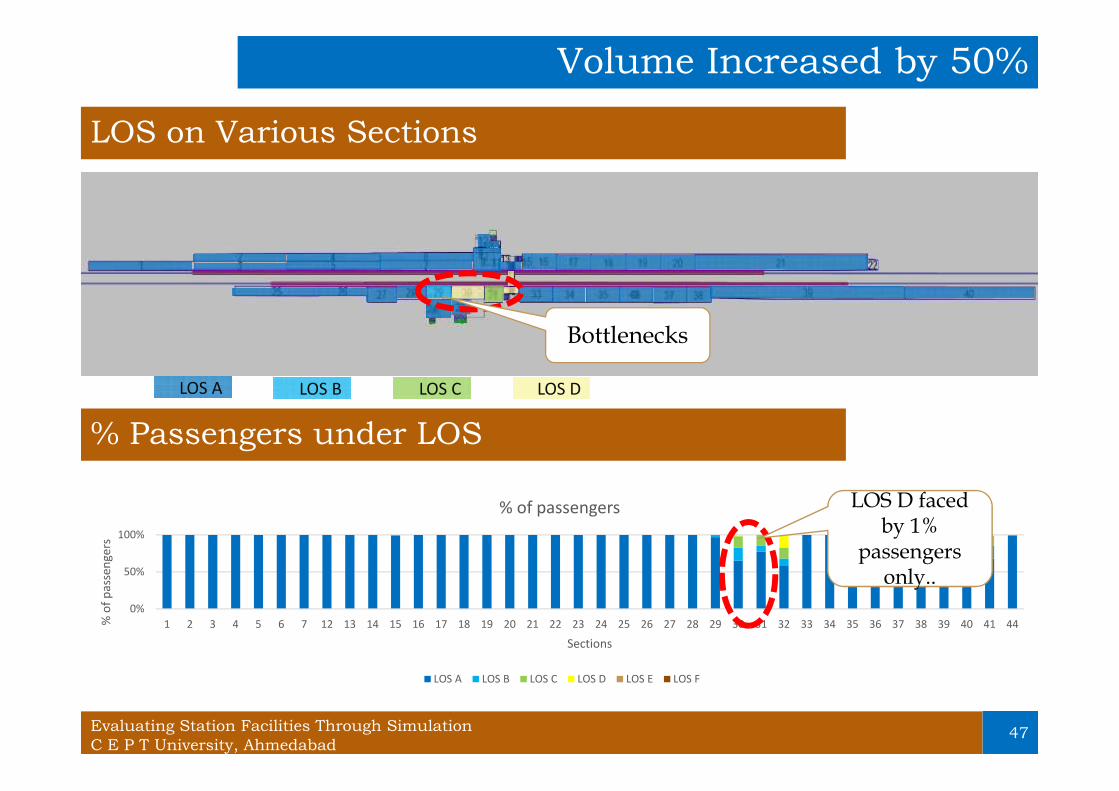
Volume Increased by 50%
LOS on Various Sections
% Passengers under LOSLOS A LOS B LOS C LOS D
Bottlenecks
0%
50%
100%
1 2 3 4 5 6 7 12 13 14 15 16 17 18 19 20 21 22 23 24 25 26 27 28 29 30 31 32 33 34 35 36 37 38 39 40 41 44% o
f pas
seng
ers
Sections
% of passengers
LOS A LOS B LOS C LOS D LOS E LOS F
LOS D facedby 1%
passengersonly..
Evaluating Station Facilities Through SimulationC E P T University, Ahmedabad
48
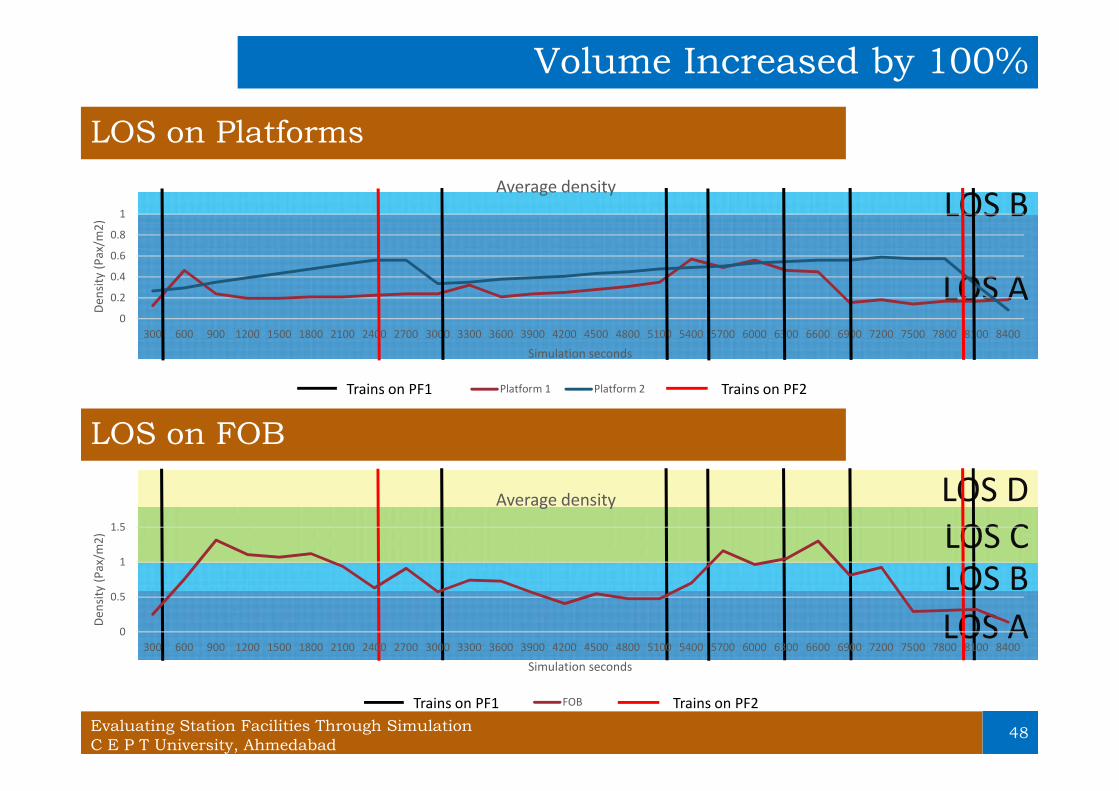
Volume Increased by 100%
LOS on Platforms
LOS on FOB
LOS A
LOS B
0
0.2
0.4
0.6
0.8
1
300 600 900 1200 1500 1800 2100 2400 2700 3000 3300 3600 3900 4200 4500 4800 5100 5400 5700 6000 6300 6600 6900 7200 7500 7800 8100 8400
Dens
ity (P
ax/m
2)
Simulation seconds
Average density
Platform 1 Platform 2 Trains on PF2Trains on PF1
LOS ALOS BLOS CLOS D
Trains on PF2Trains on PF1
0
0.5
1
1.5
300 600 900 1200 1500 1800 2100 2400 2700 3000 3300 3600 3900 4200 4500 4800 5100 5400 5700 6000 6300 6600 6900 7200 7500 7800 8100 8400
Dens
ity (P
ax/m
2)
Simulation seconds
Average density
FOB
Evaluating Station Facilities Through SimulationC E P T University, Ahmedabad

49
Volume Increased by 100%
LOS on Sections near Gates
Trains on PF2Trains on PF1
LOS A
LOS BLOS C
LOS D
0
0.5
1
1.5
2
2.5
300 600 900 1200 1500 1800 2100 2400 2700 3000 3300 3600 3900 4200 4500 4800 5100 5400 5700 6000 6300 6600 6900 7200 7500 7800 8100 8400
Dens
ity (P
ax/m
2)
Simulation seconds
Average density
Gate 1 Gate 2 Gate 3
Maximum LOSD, when 2 trainsarrives within 10
minutes timeperiod
Evaluating Station Facilities Through SimulationC E P T University, Ahmedabad

50
Volume Increased by 100%
LOS on Various Sections
% Passengers under LOSLOS A LOS B LOS C LOS D
Bottlenecks
0%
20%
40%
60%
80%
100%
1 2 3 4 5 6 7 12 13 14 15 16 17 18 19 20 21 22 23 24 25 26 27 28 29 30 31 32 33 34 35 36 37 38 39 40 41 44
% o
f pas
seng
ers
Section number
% of passenger
LOS A LOS B LOS C LOS D LOS E LOS F
21%passenger
faces LOS Don section 31
Evaluating Station Facilities Through SimulationC E P T University, Ahmedabad

Findings & RecommendationsFindingsRecommendations
51Evaluating Station Facilities Through SimulationC E P T University, Ahmedabad

52
Findingso The worst case in all the scenario is when two train arrives on platform 1
within time period of 10 minutes.
Scenario detail BottlenecksBase scenario None
Scenario 1: Capacity check as perMinistry of Railways
Gate 2
Section besides FOB on PF 1
Scenario 2: Volume increased by 50% Gate 2
FOB
Section beside FOB on PF1
Scenario 3: Volume increased by 100% Gate 2
FOB
Section near FOB on PF1
Section beside FOB on PF 1
Evaluating Station Facilities Through SimulationC E P T University, Ahmedabad

53
Recommendationso As there is no issue of infrastructure in scenario 1, trains can be
terminate at Maninagar railway station instead of Ahmedabadrailway station.
o To improve Level of service at gate 2, it is recommended toprovide alternative exit point.
o To improve level of service on FOB, it is recommended to increasewidth of FOB, to provide another FOB. Instead of steps,Escalators/lift can be tested for the level of service.
o The recommendation with increasing FOB width is considered asanother scenario and analysis is carried out.
o By increasing width it is found that the level of service on theFOB has improved along with sections near FOB.
Evaluating Station Facilities Through SimulationC E P T University, Ahmedabad

54
Recommendationso The scenario with increased width of FOB has been tested
with volume increased by 100%.
LOS ALOS BLOS CLOS D
0
0.2
0.4
0.6
0.8
1
300 600 900 1200 1500 1800 2100 2400 2700 3000 3300 3600 3900 4200 4500 4800 5100 5400 5700 6000 6300 6600 6900 7200 7500 7800 8100 8400
Dens
ity (P
ax/m
2)
Simulation seconds
FOB
Average densityTrains on PF2Trains on PF1
0%
20%
40%
60%
80%
100%
Base scenario Scenario 1 Scenario 2 Scenario 3 Recommendation scenario
% o
f pas
seng
ers
LOS
% of Passengers under LOS
LOS A LOS B LOS C LOS D LOS E LOS F
Evaluating Station Facilities Through SimulationC E P T University, Ahmedabad

55
Recommendations
0%
20%
40%
60%
80%
100%
Base scenario Scenario 1 Scenario 2 Scenario 3 Recommendation scenario
% o
f Pas
seng
ers
LOS
% of Passengers on section near FOB on PF2
LOS A LOS B LOS C LOS D LOS E LOS F
0%
20%
40%
60%
80%
100%
Base scenario Scenario 1 Scenario 2 Scenario 3 Recommendation scenarion
% o
f pas
seng
ers
LOS
% of Passengers on section near FOB on PF1
LOS A LOS B LOS C LOS D LOS E LOS F
Evaluating Station Facilities Through SimulationC E P T University, Ahmedabad
56
Conclusiono VISSIM- an important tool to analyse pedestrian
infrastructure Capacity Bottlenecks Alternative analysis
o Further scope of work using VISSIM Analysis of decision making area Analysis of ITS improvement and pedestrian infrastructure for the
station Evacuation study for station Alternative analysis for physical integration of Maninagar railway
station and BRTS station
Evaluating Station Facilities Through SimulationC E P T University, Ahmedabad

Thank you..
Evaluating Station Facilities Through SimulationC E P T University, Ahmedabad
57