evaluating source rock maturity using multi-sample kinetic ... · 1 north dakota geological survey...
TRANSCRIPT
1
North Dakota Geological Survey
Evaluating Source Rock Maturity Using
Multi-Sample Kinetic Parameters from
the Bakken Formation (Miss.–Dev.),
Williston Basin, ND By
Stephan H. Nordeng
GEOLOGICAL INVESTIGATION NO. 164 NORTH DAKOTA GEOLOGICAL SURVEY Edward C. Murphy, State Geologist Lynn D. Helms, Director Dept. of Mineral Resources 2013

2
Abstract
Ten samples of shale from the Bakken (Miss.-Dev.) Formation were analyzed using LECO TOC,
Rock Eval 6 and multiple heating rate pyrolysis. The results indicate that within a single well
penetrating thermally immature source rock, the frequency factor and activation energy vary in
a log-linear fashion. Another sample from a similarly immature core produced almost identical
kinetic parameters. A second sample set collected from thermally “mature” portions of the
Bakken Formation followed a separate trend. These results suggest that subtle variations in
kerogen composition are responsible for the observed covariance in the activation energy and
natural logarithm of the frequency factor within a single well. The results also suggest that
thermal maturation results in shift in kerogen kinetic parameters to higher activation energies
and larger frequency factors. This shift results in a conspicuously different set of kinetic
parameters between the more mature and less mature sample suites.
Introduction
The degradation of kerogen into petroleum products is essential to the development of
petroleum systems. Magoon and Beaumont (1999) emphasis this with their definition of a
“petroleum system” that states:
“a pod of active source rock and all genetically related oil and gas accumulations. It includes all of the geologic elements and processes that are essential if an oil and gas accumulation is to exist”.
The essential geologic elements involve rocks that act as petroleum sources, reservoirs, seals and overburden. The processes include trap formation and those involved in hydrocarbon generation, migration, and accumulation . A petroleum system forms when the location and timing of the essential geologic elements and processes result in petroleum accumulations. At the core of every petroleum system there is a source rock that consists of organic matter that originated in a near surface environment, is modified into kerogen during burial and when subjected to sufficient heat degrades into petroleum (oil, gas, or some combination). The significance of oil generation rates in the development of the Bakken petroleum system is central to Meissner’s (1978) and Price’s (1994) recognition that source beds in the Bakken Formation have formed continuous petroleum accumulations within the almost impermeable beds that lie between and below the two source beds of the Bakken Formation. Because the role of migration and trap creation are largely eliminated, maturation and oil generation become the systems defining processes. Therefore, concentrating on chemical processes, especially those that control reaction rates, becomes critical in applying the petroleum system concept to this formation.

3
The purpose of this investigation is to present experimental data collected from the Bakken Formation that may define kerogen maturity through experimentally determined kinetic properties. One of the most difficult issues that impact the interpretation of maturation indicators is how to account for the natural variation in kerogen composition that is always, to some degree, present in source rocks. This is significant because, under the same thermal stress, different kerogen compositions decompose into petroleum at different rates. This results in scattered maturation indices even when a single stratigraphic section with the same thermal history is sampled. Because kerogen maturation is fundamentally tied to chemical reaction rates it seems that a solution to this problem requires an examination of the kinetic parameters that control reaction rates. Earlier kinetic studies of the source rocks in the Bakken were largely concerned with calibrating Rock Eval methods, in particular Tmax (the temperature that results in the maximum release of hydrocarbons using a standard pyrolysis program), to oil generation. Tmax is generally believed to be related to kerogen activation energies (Tissot and Espitalie, 1975). More recently, Waples et al. (2010) have used Rock Eval pyrograms to estimate activation energies under the assumption that the frequency factor is constant. However, the expectation that the frequency factor is constant is not supported by published empirical evidence (i.e. Wood, 1988). This study attempts to address whether-or-not frequency factors within the Bakken Formation are constant or at least independent of activation energy. To do this, two sets of samples from Bakken cores were taken from the most mature and least mature portions of Williston Basin in North Dakota. These two sample sets allow for the observation of how kinetic parameters vary within a single well given the same thermal history and how kinetic parameters vary between wells with different thermal histories. The wells were selected on the basis of core availability and presumed level of maturation as defined by previously determined values of Tmax (Nordeng et al., 2010). Individual samples were selected to encompass as large a stratigraphic range as the availability of core permitted.

4
Figure 1. Index Map showing the wells sampled for this report. Gray shaded portion of the map
represents areas in which the Bakken Formation is absent. The light green shading represents the
portion of the Williston Basin where the Bakken Formation has average Tmax values greater than 435oC
and is therefore probably “mature”. The yellow shading represents the distribution of the “immature”
Bakken Formation where the average Tmax < 435oK.
The kinetic parameters that define chemical reaction rates are found in the empirically derived Arrhenius equation that states: Eq. 1
k = Ae-Ea/RT Where:
k is the change in the molar mass of the reactant with respect to time
A is a frequency factor describes the number of potential elementary reactions per unit time
Ea is the activation energy that describes the energy barrier that must be exceeded in order for a reaction
to occur
R is the gas constant
T is the reaction temperature (oK)
When the reaction in question is first order and occurs under isothermal conditions then
activation energies (Ea) and frequency factors can be obtained from a plot of the natural
logarithm of the reaction rate (ln k) versus the inverse of the absolute temperature ( 1/T ),
where k is the reaction rate (mass/time) and T is the temperature (T in oK). However, activation
energies and frequency factors may also be found using non-isothermal experiments so long as
the temperature varies at a constant rate. Kissinger (1958) found an approximate solution for

5
the Arrhenius equation under these conditions. In his solution, Kissinger shows that the
temperature that corresponds with the maximum reaction rate (Tp) shifts (Fig. 2) with the
heating rate ( ) in accordance with the activation energy (Ea) and frequency factor (A) as
follows:
Eq. 2
ln ( /Tp2) = ln (AR/Ea) - Ea/R Tp
Where: Ea = Activation Energy (kJ/mole) R = Gas Constant (.008314) kJ/mol-
oK
A = Frequency factor (-min)
Tp = Temperature that causes maximum reaction rates (oK)
= Heating Rate (oK/min)
Figure 2. Pyrograms illustrating the shift to higher maximum reaction rate temperatures (Tp) as
the heating rate ( ) increases. The pyrograms are from a sample of the Bakken Formation
collected from the Federal DG-1 (see Table 1).
0.00
0.10
0.20
0.30
0.40
0.50
0.60
0.70
0.80
0.90
1.00
275 375 475 575
Re
lati
ve R
eac
tio
n R
ate
Temperature oC
2 degrees/min
5 degrees/min
10 degrees/min
20 degrees/min
50 degrees/min
Maximum Reaction Rate Temperature (Tp)
6
Methods:
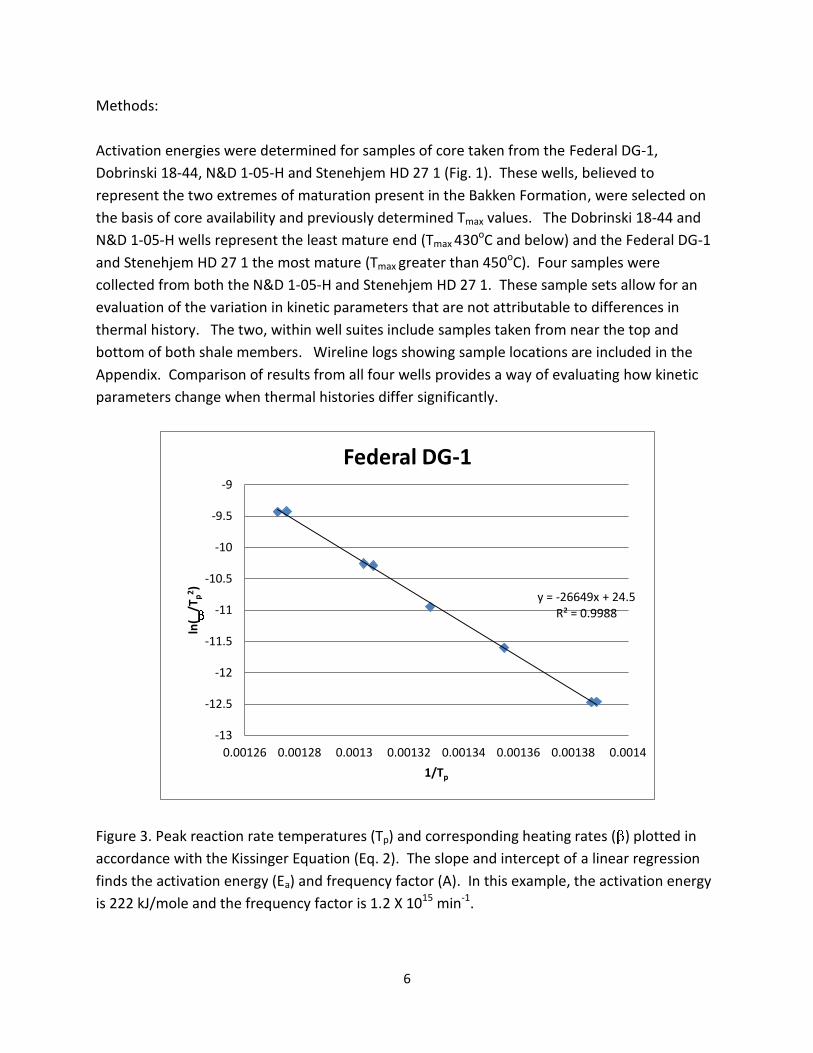
Activation energies were determined for samples of core taken from the Federal DG-1,
Dobrinski 18-44, N&D 1-05-H and Stenehjem HD 27 1 (Fig. 1). These wells, believed to
represent the two extremes of maturation present in the Bakken Formation, were selected on
the basis of core availability and previously determined Tmax values. The Dobrinski 18-44 and
N&D 1-05-H wells represent the least mature end (Tmax 430oC and below) and the Federal DG-1
and Stenehjem HD 27 1 the most mature (Tmax greater than 450oC). Four samples were
collected from both the N&D 1-05-H and Stenehjem HD 27 1. These sample sets allow for an
evaluation of the variation in kinetic parameters that are not attributable to differences in
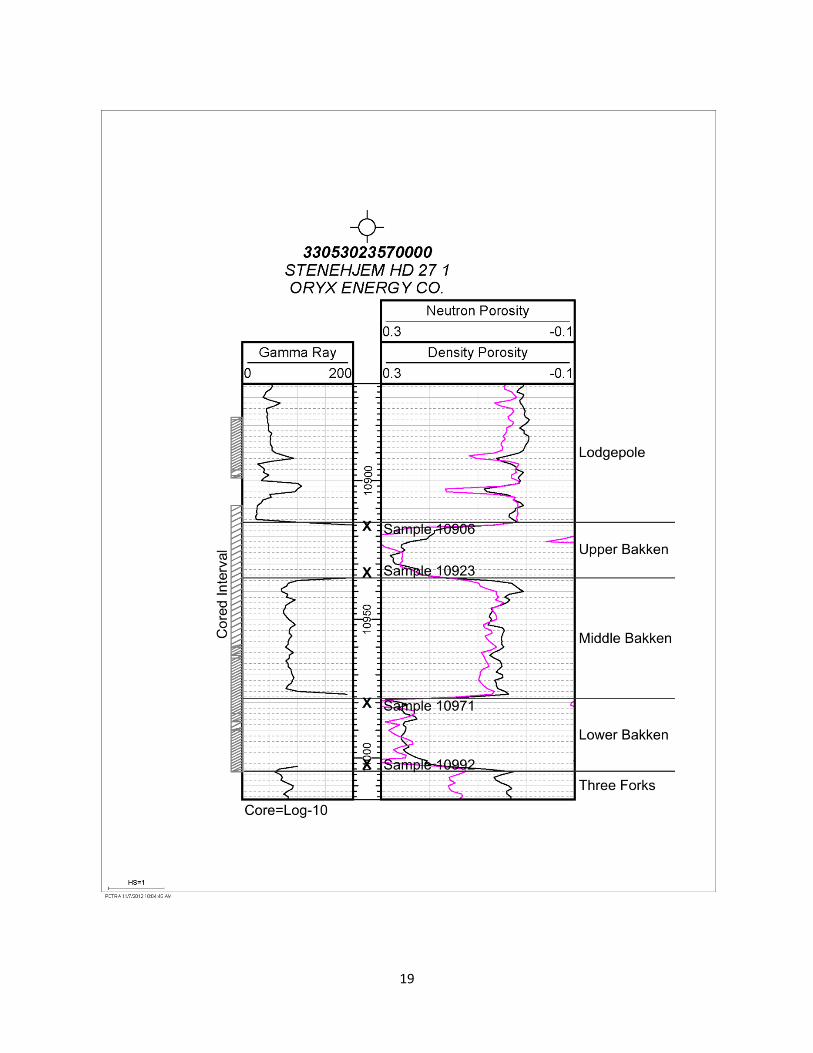
thermal history. The two, within well suites include samples taken from near the top and
bottom of both shale members. Wireline logs showing sample locations are included in the
Appendix. Comparison of results from all four wells provides a way of evaluating how kinetic
parameters change when thermal histories differ significantly.
Figure 3. Peak reaction rate temperatures (Tp) and corresponding heating rates ( ) plotted in
accordance with the Kissinger Equation (Eq. 2). The slope and intercept of a linear regression
finds the activation energy (Ea) and frequency factor (A). In this example, the activation energy
is 222 kJ/mole and the frequency factor is 1.2 X 10¹⁵ min-1.
y = -26649x + 24.5 R² = 0.9988
-13
-12.5
-12
-11.5
-11
-10.5
-10
-9.5
-9
0.00126 0.00128 0.0013 0.00132 0.00134 0.00136 0.00138 0.0014
ln(
/Tp
2 )
1/Tp
Federal DG-1
7
All of the samples used in this study are from core (see appendix for logs and sample locations).
Approximately five grams of material were collected and shipped to Weatherford Labs for
analysis. Following crushing, analyses included the determination of the total organic carbon
(TOC) by the LECO method along with measurements of Tmax, the amount of free hydrocarbons
(S1), reactive kerogen (S2) organic oxygen compounds (S3) present in each sample. Tmax, S1, S2
and S3 and the derived values for hydrogen index (HI), oxygen index (OI) and production index
(PI) were determined using the Rock Eval 6 method (see Table 1).
Activation energies (Ea) and frequency factors (A) were found using heating rates that increased
2, 5, 10, 20 and 50 degrees C/min. An additional heating rate and peak temperature is provided
by the Rock Eval pyrolysis used to find Tmax. The data supplied by Weatherford included
measurements of the relative amount of hydrocarbons generated by the decomposition of
kerogen at temperatures above that needed to vaporize free hydrocarbons (see Fig. 2 for an
example). The peak reaction temperature (Tp) for each heating rate is obtained with a
polynomial interpolation of the recorded pairs of temperature and hydrocarbon mass obtained
during pyrolysis. These data are included in the spreadsheet labeled Kinetic Data.xlsx (included
with the CD) and are plotted using the Kissinger method (see Appendix for graphs). Linear
regression of these plots supplies the slope and intercept which allows for the determination of
Ea and A from the following:
Slope = -Ea/ R
and
Intercept = ln (AR/Ea)
where R = .008314 kJ/mole-oK
Results:
All of the sample analyses exhibit a strong linear correlation (r2>0.99) when plotted as ln( /Tp2)
versus 1/Tp. Consequently, reasonable estimates of activation energy (Ea) and frequency factor
(A) are possible (see appendix and attached files for graphical and tabular data). The samples
from the N&D 1-05 H yielded activation energies that increased with depth from 209 kJ/M to
220 kJ/M (Table 1). Frequency factors also increase with depth. This variation in activation
energy and corresponding frequency factor represents, at 100oC in Equation 1, a tenfold
difference in hydrocarbon generation rates within the Bakken Formation at the same location.
The sample from the Dobrinski 18-44, sampled near the base of the lower Bakken at another
marginally mature location, provided an activation energy and frequency factor that is very
similar to the sample taken from near the base of the lower shale in the N&D 1-05 H. Similarly,
8
the kinetic parameters obtained for the Federal DG-1 are close to values obtained for the
Stenejhem HD 27 1.
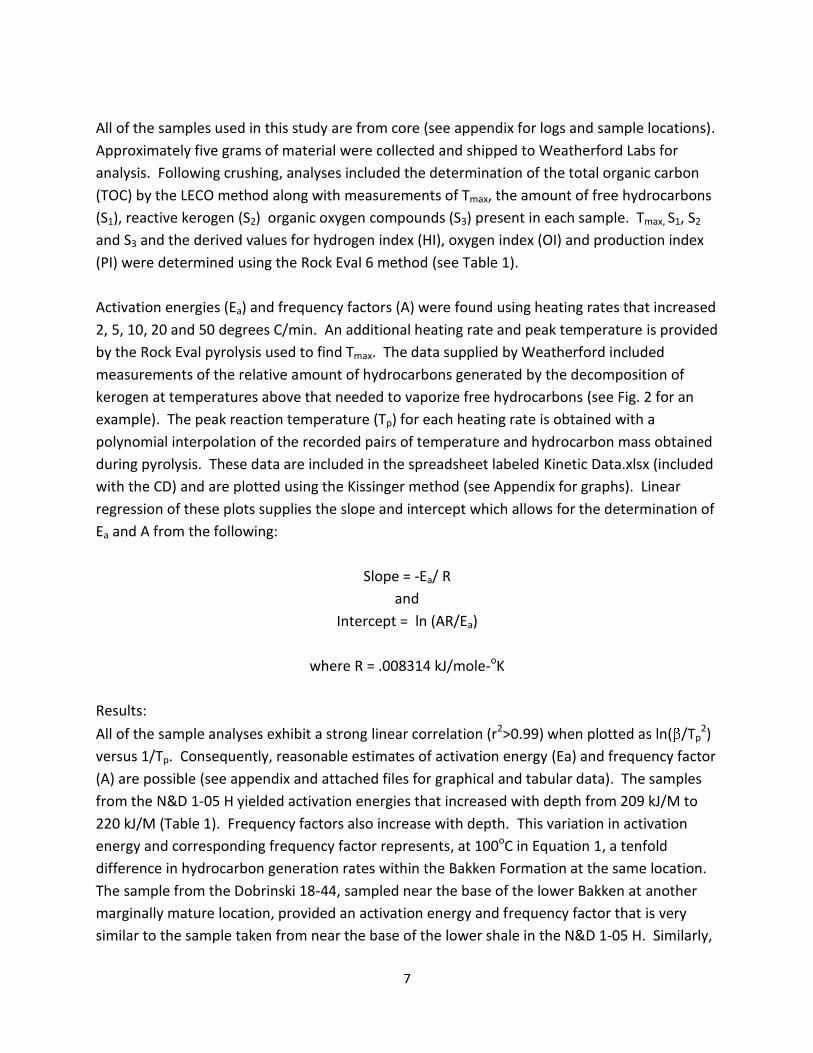
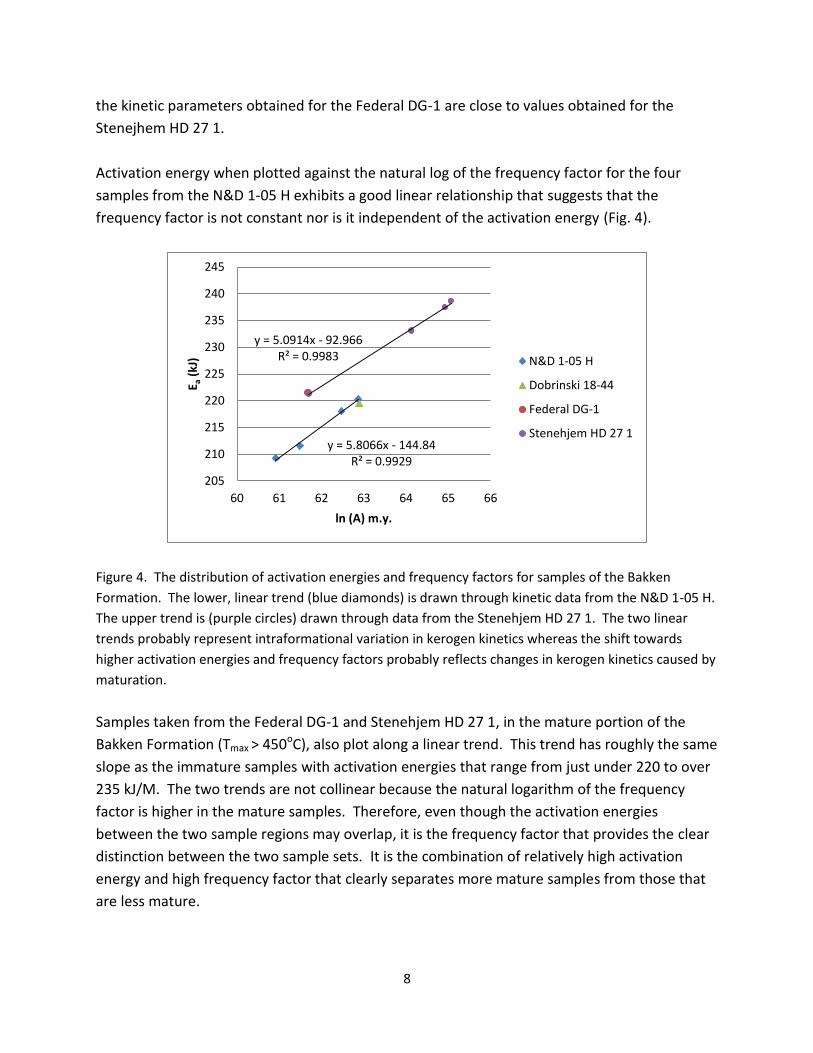
Activation energy when plotted against the natural log of the frequency factor for the four
samples from the N&D 1-05 H exhibits a good linear relationship that suggests that the
frequency factor is not constant nor is it independent of the activation energy (Fig. 4).
Figure 4. The distribution of activation energies and frequency factors for samples of the Bakken
Formation. The lower, linear trend (blue diamonds) is drawn through kinetic data from the N&D 1-05 H.
The upper trend is (purple circles) drawn through data from the Stenehjem HD 27 1. The two linear
trends probably represent intraformational variation in kerogen kinetics whereas the shift towards
higher activation energies and frequency factors probably reflects changes in kerogen kinetics caused by
maturation.
Samples taken from the Federal DG-1 and Stenehjem HD 27 1, in the mature portion of the
Bakken Formation (Tmax > 450oC), also plot along a linear trend. This trend has roughly the same
slope as the immature samples with activation energies that range from just under 220 to over
235 kJ/M. The two trends are not collinear because the natural logarithm of the frequency
factor is higher in the mature samples. Therefore, even though the activation energies
between the two sample regions may overlap, it is the frequency factor that provides the clear
distinction between the two sample sets. It is the combination of relatively high activation
energy and high frequency factor that clearly separates more mature samples from those that
are less mature.
y = 5.8066x - 144.84 R² = 0.9929
y = 5.0914x - 92.966 R² = 0.9983
205
210
215
220
225
230
235
240
245
60 61 62 63 64 65 66
E a (
kJ)
ln (A) m.y.
N&D 1-05 H
Dobrinski 18-44
Federal DG-1
Stenehjem HD 27 1

9
Conclusions:
The data collected during the course of this study show that there is a linear relationship
between the activation energy and natural logarithm of the frequency factor when samples of
the Bakken Formation are taken from different stratigraphic positions within the same well.
However, the linear relationship between wells is different. The difference between the linear
trends in the two wells is largely present in the value of the intercept. The tight linear
distribution of kinetic data along two separate, though subparallel, trends clearly separates the
samples into two groups that correspond with the two regions of organic maturity studied. The
slope and intercept of these trends suggests that variations in kerogen composition and related
reaction rates may be evaluated using kinetic properties. The two kinetic parameters appear,
at least for this limited dataset, capable of defining maturation using kinetic parameters that
result from differences in kerogen composition. These data indicate that during maturation,
activation energies and frequency factors shift together to higher values. This produces a linear
trend that is subparallel to but offset from the trend formed by the less mature samples. If so,
then activation energy determinations may be a useful way of describing and with calibration
evaluating kerogen maturity.
Table 1. Results from Rock Eval 6 and Kissinger kinetic experiments for samples of the Bakken
Formation.
Sample ID
WELL NAME Core Depth
(ft.)
S1
mg Oil g sample
S2
mg HC g sample
S3
mg OC g sample
TMAX
(oC)
LECO TOC
(wt %)
HI 100XS2
TOC
OI 100XS3
TOC
PI S1
(S1+S2)
Ea kJ/M
A -min
8177-1 Dobrinski 18-44 8666 2.03 23.19 1.15 424 7.83 296 15 0.080 219.50 3.92E+15
16532-1 N&D 1-05 H 9410.5 9.33 101.83 1.50 430 17.03 598 9 0.084 209.29 5.43E+14
16532-2 N&D 1-05 H 9426 8.41 67.64 0.71 428 11.57 584 6 0.111 211.58 9.61E+14
16532-3 N&D 1-05 H 9469 11.79 101.70 2.24 426 18.30 556 12 0.104 218.04 2.58E+15
16532-4 N&D 1-05 H 9482.5 11.41 54.82 0.65 430 10.70 512 6 0.172 220.31 3.82E+15
9569-1 Federal DG-1 10932 4.21 11.94 0.58 456 9.85 121 6 0.261 221.56 1.16E+15
10906 Stenehjem HD 27-1
10906 5.64 11.62 0.49 452 6.83 170 7 0.33 220.31 1.19 E+15
10923 Stenehjem HD 27-1
10923 5.35 15.02 0.42 451 9.30 161 5 0.26 221.30 2.96E+16
10971 Stenehjem HD 27-1
10971 5.97 18.96 0.47 451 12.24 155 4 0.24 237.46 1.34E+16
10992 Stenehjem HD 27-1
10992 6.11 19.68 0.42 451 13.48 146 3 0.24 233.12 1.34E+16
10
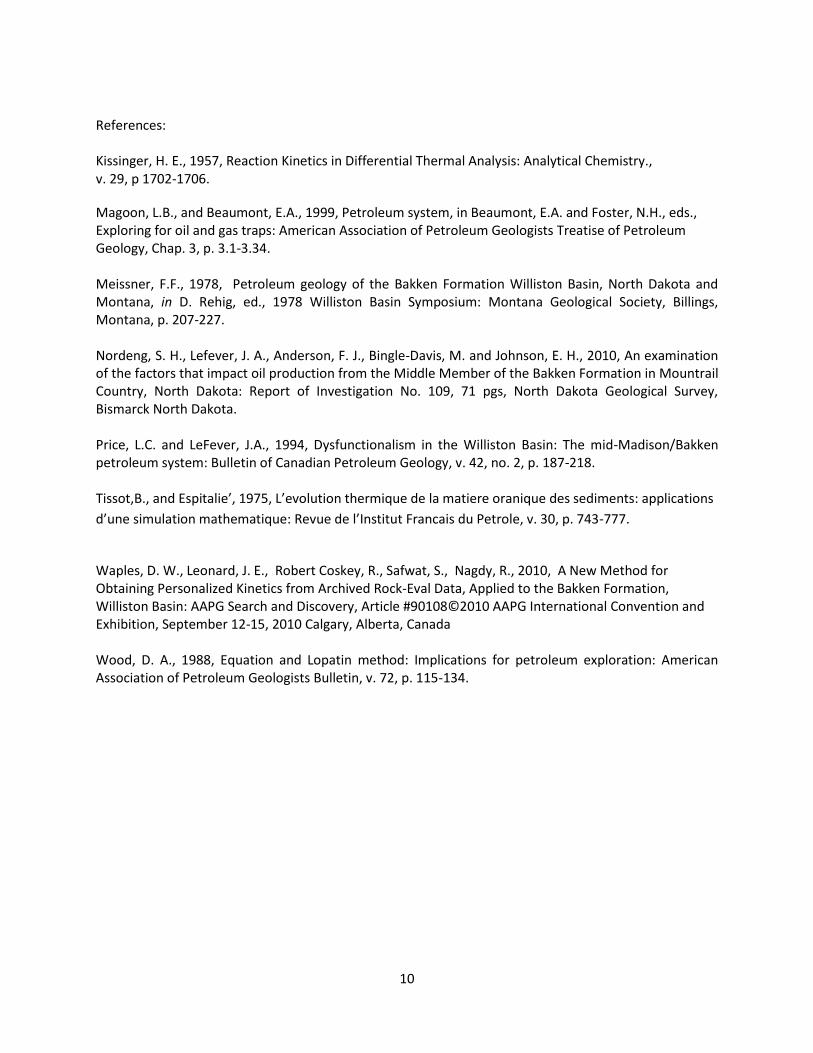
References: Kissinger, H. E., 1957, Reaction Kinetics in Differential Thermal Analysis: Analytical Chemistry., v. 29, p 1702-1706.
Magoon, L.B., and Beaumont, E.A., 1999, Petroleum system, in Beaumont, E.A. and Foster, N.H., eds., Exploring for oil and gas traps: American Association of Petroleum Geologists Treatise of Petroleum Geology, Chap. 3, p. 3.1-3.34. Meissner, F.F., 1978, Petroleum geology of the Bakken Formation Williston Basin, North Dakota and Montana, in D. Rehig, ed., 1978 Williston Basin Symposium: Montana Geological Society, Billings, Montana, p. 207-227. Nordeng, S. H., Lefever, J. A., Anderson, F. J., Bingle-Davis, M. and Johnson, E. H., 2010, An examination of the factors that impact oil production from the Middle Member of the Bakken Formation in Mountrail Country, North Dakota: Report of Investigation No. 109, 71 pgs, North Dakota Geological Survey, Bismarck North Dakota. Price, L.C. and LeFever, J.A., 1994, Dysfunctionalism in the Williston Basin: The mid-Madison/Bakken petroleum system: Bulletin of Canadian Petroleum Geology, v. 42, no. 2, p. 187-218. Tissot,B., and Espitalie’, 1975, L’evolution thermique de la matiere oranique des sediments: applications
d’une simulation mathematique: Revue de l’Institut Francais du Petrole, v. 30, p. 743-777.
Waples, D. W., Leonard, J. E., Robert Coskey, R., Safwat, S., Nagdy, R., 2010, A New Method for Obtaining Personalized Kinetics from Archived Rock-Eval Data, Applied to the Bakken Formation, Williston Basin: AAPG Search and Discovery, Article #90108©2010 AAPG International Convention and Exhibition, September 12-15, 2010 Calgary, Alberta, Canada Wood, D. A., 1988, Equation and Lopatin method: Implications for petroleum exploration: American Association of Petroleum Geologists Bulletin, v. 72, p. 115-134.

11
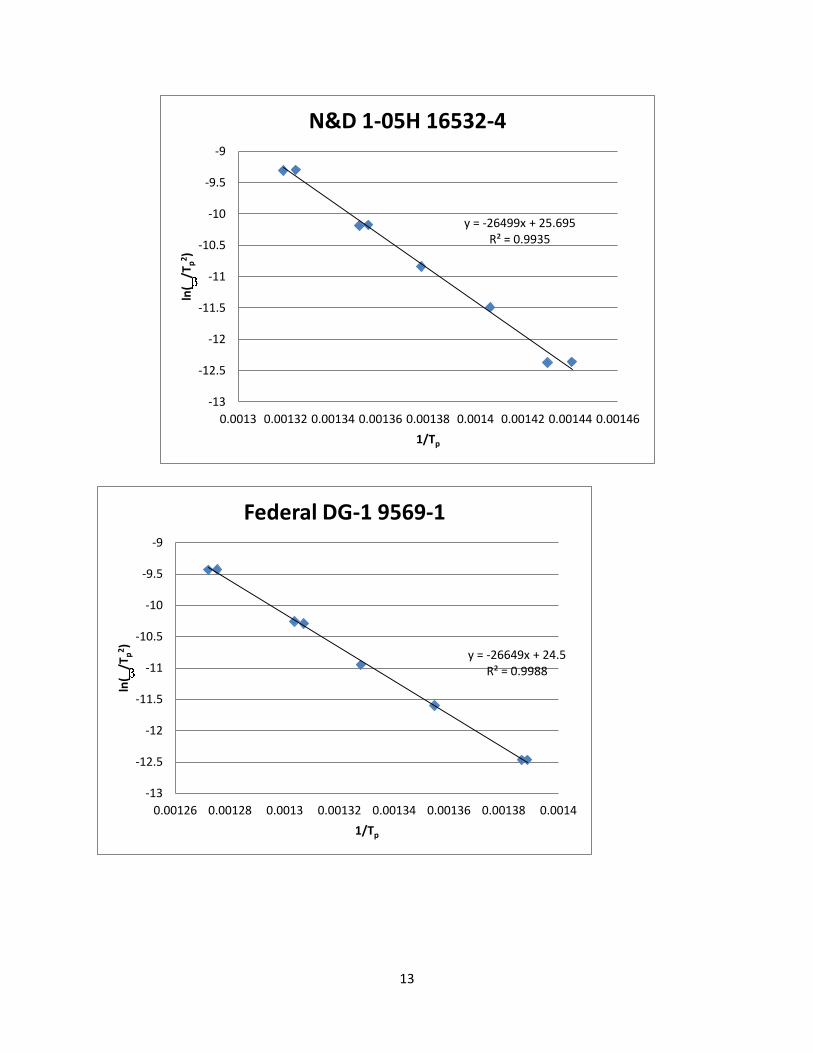
Appendix I
Kissinger Plots for the wells posted in Figure 3 and results tabulated in Table 1.
y = -26398x + 25.724 R² = 0.9987
-13
-12.5
-12
-11.5
-11
-10.5
-10
-9.5
-9
0.00132 0.00134 0.00136 0.00138 0.0014 0.00142 0.00144 0.00146
ln(
/Tp
2 )
1/Tp
Dobrinski 18-44 8177-1
y = -25174x + 23.794 R² = 0.9983
-13
-12.5
-12
-11.5
-11
-10.5
-10
-9.5
-9
0.0013 0.00132 0.00134 0.00136 0.00138 0.0014 0.00142 0.00144 0.00146
ln(
/Tp
2 )
1/Tp
N&D 1-05H 16532-1

12
y = -25448x + 24.355 R² = 0.9986
-13
-12.5
-12
-11.5
-11
-10.5
-10
-9.5
-9
0.0013 0.00132 0.00134 0.00136 0.00138 0.0014 0.00142 0.00144 0.00146
ln(
/Tp
2 )
1/Tp
N&D 1-05H 16532-2
y = -26226x + 25.314 R² = 0.9967
-13
-12.5
-12
-11.5
-11
-10.5
-10
-9.5
-9
0.0013 0.00132 0.00134 0.00136 0.00138 0.0014 0.00142 0.00144 0.00146
ln(
/Tp
2)
1/Tp
N&D 1-05H 16532-3
13
y = -26499x + 25.695 R² = 0.9935
-13
-12.5
-12
-11.5
-11
-10.5
-10
-9.5
-9
0.0013 0.00132 0.00134 0.00136 0.00138 0.0014 0.00142 0.00144 0.00146
ln(
/Tp
2 )
1/Tp
N&D 1-05H 16532-4
y = -26649x + 24.5 R² = 0.9988
-13
-12.5
-12
-11.5
-11
-10.5
-10
-9.5
-9
0.00126 0.00128 0.0013 0.00132 0.00134 0.00136 0.00138 0.0014
ln(
/Tp
2)
1/Tp
Federal DG-1 9569-1

14
y = -26618x + 24.524 R² = 0.9914
-13
-12.5
-12
-11.5
-11
-10.5
-10
-9.5
-9
0.00126 0.00128 0.0013 0.00132 0.00134 0.00136 0.00138 0.0014 0.00142
ln(
/Tp
2 )
1/Tp
Stenehjem HD 27 1 10906
y = -29013x + 27.652 R² = 0.9904
-13
-12.5
-12
-11.5
-11
-10.5
-10
-9.5
-9
0.00126 0.00128 0.0013 0.00132 0.00134 0.00136 0.00138 0.0014
ln(
/Tp
2)
1/Tp
Stenehjem HD 27 1 10923

15
Appendix II – Neutron-Density Porosity Logs showing sample locations.
y = -28424x + 26.881 R² = 0.9945
-13
-12.5
-12
-11.5
-11
-10.5
-10
-9.5
-9
0.00126 0.00128 0.0013 0.00132 0.00134 0.00136 0.00138 0.0014
ln(
/Tp
2 )
1/Tp
Stenehjem HD 27 1 10971
y = -29141x + 27.792 R² = 0.9964
-13
-12.5
-12
-11.5
-11
-10.5
-10
-9.5
-9
0.00126 0.00128 0.0013 0.00132 0.00134 0.00136 0.00138 0.0014
ln(
/Tp
2)
1/Tp
Stenehjem HD 27 1 10992

16

17

18
19