evaluating soil quality and bioefficacy study of cajanus...
TRANSCRIPT

499
http://journals.tubitak.gov.tr/agriculture/
Turkish Journal of Agriculture and Forestry Turk J Agric For(2016) 40: 499-511© TÜBİTAKdoi:10.3906/tar-1406-21
Evaluating soil quality and bioefficacy study of Cajanus cajan L. in coal mine-degraded land
Shrabani SEN, Vipin KUMAR*Department of Environmental Science and Engineering, Indian School of Mines, Dhanbad, India
* Correspondence: [email protected]
IntroductionThe mining industry uses about 0.25% of the total land as compared to other industries. As per the Vision Coal - 2025 (Ministry of Coal, 2005) document, the total land requirement for overburden and other waste dumps, mine operation, and mine infrastructure is projected to increase from an area of 1470 km2 in 2006–2007 to 2925 km2. An older report presented by Business Line (2000) stated that about 140,771 ha of land was covered by surface mining and in addition 57,000 ha of land was required, among which 13,000 ha was under forest cover. The overburden removal of coal in India alone increased from 500 million cubic meters (Mm3) in 2003–2004 to 682 Mm3 in 2009–2010 (CIL, 2011). The dumping of overburden/mine wastes/spoil materials generated from opencast coal mines is considered as a major contributor to ecological and environmental degradation (Cherfas, 1992; Chaoji, 2002; Ghose, 2004). Overburden materials are nutrient-poor, loosely adhered particles of shale, stones, boulders, cobbles, and so forth and are devoid of true soil character (Raju and Hassan, 2003; Deka Boruah, 2006; Gogoi et al., 2007).
Measures such as reclamation, restoration, and replacement are being carried out in order to prevent degradation of coal mine-degraded land. Restoration is necessary not only to control soil erosion but also to improve air quality and visual impact (landscape) apart from dump stabilization (Singh et al., 1996; Dobson et al., 1997) and removal of threats to the surrounding population (Wong, 2003). Restoration constitutes the most widely accepted and useful way to reduce erosion and protect soils against degradation during reclamation. Productivity of soil can be increased by adding various natural amendments, as these amendments stimulate the microbial activity that provides the nutrients and organic carbon to the soil (Sheoran et al., 2010). Long-term mine spoil reclamation requires the establishment of stable nutrient cycles from plant growth and microbial processes (Lone et al., 2008; Kavamura and Esposito, 2010).
A number of restoration methods, such as topsoil removal, sod cutting, and soil inversion, have been implemented to restore abiotic conditions suitable for high diversity and threatened species in seminatural calcareous grasslands (Dolman and Sutherland, 1994; Kiehl and
Abstract: Surface mining activities in past and recent times have resulted in the existence of a number of overburden dumps (mine spoils) through excavation and deposition of removed soil and rock debris. These spoils require environmental stabilization/restoration through proper revegetation. The present study was undertaken to examine the influence of various amendments to soil properties and the growth and yield of Cajanus cajan L. cultivation in mine-degraded soils. An experiment was conducted with nine combinations of various amendments to C. cajan L., a widely cultivating legume in India for its highly nutritious seeds. The physicochemical and biological properties of mine spoil before and after treatment were analyzed. Plant growth in terms of seed germination, shoot length, root length, total dry weight, number of leaves, root nodules, and yield components were measured. The experimental results revealed that combination of C3 (mine spoil amended with biofertilizers, farmyard manure, and fly-ash) and C8 (mine spoil amended with biofertilizers, vermicompost, and fly-ash) showed the best results to support vegetation. Percentage increases in crop growth, grain yield, and soil nutrients compared to the control were also observed. With C3, grain yield was found to be maximum (79.66 g/pot), with an increase of 215.95%. Number of pods per plant was found to be 27.50 and 27.75 in C3 and C8 treatments, respectively. All the physicochemical and biological properties were enhanced significantly (P ≤ 0.05) in all the combinations compared to the untreated control. C8 exhibited significantly higher concentrations of nitrogen, phosphorous, and potassium of about 67.55, 5.16, and 58.33 mg kg–1, proving it to be good at improving soil quality.
Key words: Bioefficacy, Cajanus cajan, coal mine, degraded land, soil amendments
Received: 03.06.2014 Accepted/Published Online: 01.03.2016 Final Version: 14.06.2016
Research Article

500
SEN and KUMAR / Turk J Agric For
Pfadenhauer, 2007; Schnoor and Olsson, 2010; Odman et al., 2011). Topsoil removal and soil disturbances may also reach deeper soil layers with a high pH and limestone content (Dolman and Sutherland, 1994; Jones et al., 2010). Successful consistent revegetation of drastically disturbed mine land throughout the United States and several other countries has been achieved by using biological tools: tree seedlings, native shrubs, and grass species (Cordell et al., 2002).
Currently revegetation of overburden dumps is done by the mine authority with the required help from the forest authority. Generally the native varieties of plant species (mostly trees and shrubs) that can grow reasonably on the dump cover material are planted and nurtured to establish the vegetative cover. This practice, while fulfilling the requirements of environmental stabilization of overburden dumps, lacks in one aspect: there is no possibility of annual harvesting of economic crops, which is very important from a socioeconomic point of view.
The aim of the present study was to evaluate the effect of different soil amendments such as chemical fertilizers, organic fertilizers, vermicompost, biofertilizers, and fly-ash in appropriate combinations to support vegetation in mine-degraded land.
2. Materials and methods2.1. Study areaThe study area was chosen at the Muraidih opencast coal mine of the Jharia coal field (JCF) area in Dhanbad, India (Figure 1). Mining is done by shovel dumper method and all the waste materials of the mine are disposed of in the form of overburden dumps. The JCF is spread over the Dhanbad and Bokaro districts of Jharkhand, considered as the coal capital of India, and is one of the most important coal fields of India containing the only remaining reserve of prime coking coal of the country.2.2. Sample collection and analysesCoal mine-degraded soil (mine spoil) samples were collected from ten different locations of the study area. From each location, five samples were collected by using split tube coring tools manually. The collected samples were taken to the laboratory into two parts for pot experiments and laboratory studies.
The physical properties of mine spoil and amended combinations, such as moisture content and water-holding capacity, were determined by gravimetric method. Bulk density was determined by soil core method, and porosity was calculated from the bulk density. Chemical parameters
438
439
Figure 1. Location of the study sites.
501
SEN and KUMAR / Turk J Agric For
such as pH and EC were determined by using a pH meter and EC meter respectively in a suspension of spoil sample in water in the ratio of spoil:water = 1:2.5. Organic carbon was determined by oxidation with potassium dichromate in an acid medium (Walkey and Black, 1934). Available N was determined by alkaline permanganate method (Subbaiah and Asija, 1996). Available P was determined by the Olsen method (Sparling et al., 1985). Available K was extracted by neutral 1(N) ammonium acetate solution (soil to extractant ratio of 1:10) and determined by flame photometer (Jackson, 1973). Available heavy metal content was determined by the DTPA (diethylene triamine penta acetic acid) extraction method, whereas total heavy metal content was analyzed using an atomic absorption spectrophotometer (GBC, Avanta, Australia). Dehydrogenase activity was assayed using 2,3,5-triphenyltetrazolium chloride as the substrate (Casida, 1977).2.3. Experimental designThe pot experiment was carried out in greenhouse conditions with four replicates in a randomized block design with nine treatments consisting of five different amendments: chemical fertilizers (CFs; urea, diammonium phosphate (DAP), and muriate of potash), farmyard manures (FYMs), vermicompost (VC), biofertilizers (BFs; Rhizobium, phosphate-solubilizing bacteria, and potash-mobilizing bacteria), and fly-ash (FA) in appropriate combinations. CFs and BFs were procured from a local market, FYM and VC were prepared in-house in the departmental research field, and FA was collected from the Chandrapura thermal power plant, Jharkhand, India. Seeds were treated using BFs, whereas soil treatment was done by mixing of amendment combinations at recommended rates before sowing. The physicochemical properties of amendments (FA, VC, and FYM) were analyzed following the standard methods used in mine spoil analysis. The combinations used were as follows:
C0 = mine spoil (100%)C1= mine spoil (93.5%) + FYM (2%) + BF (10 g/kg
seed) + VC (2.5%) + FA (2%)C2 = mine spoil (93.5%) + FYM (2%) + BF (10 g/kg
seed) + VC (2.5%) + FA (2%)C3 = mine spoil (96%) + FYM (2%) + BF (10 g/kg seed)
+ FA (2%)C4 = mine spoil (93.5%) + FYM (2%) + VC (2.5%) +
FA (2%)C5 = mine spoil (95.5%) + FYM (2%) + BF (10 g/kg
seed) + VC (2.5%)C6 = mine spoil (94.84%) + FYM (2%) + VC (2.5%) +
CF (urea - 0.03%, DAP - 0.03%, potash - 0.06%)C7 = mine spoil (94.84%) + FYM (2%) + CF (urea -
0.3%, DAP - 0.3%, potash - 0.06%) + FA (2%)
C8 = mine spoil (95.5%) + BF (10 g/kg seed) + VC (2.5%) + FA (2%)
C9 = mine spoil (94.84%) + VC (2.5%) + CF (urea - 0.3%, DAP - 0.3%, potash - 0.06%) + FA (2%)2.4. Plant growth experimentHealthy seeds of Cajanus cajan L. were seeded into the clay pots. For inoculation, the seeds were soaked in actively growing bacterial isolates. Initially the pots were placed in the greenhouse for 7 days and later kept under direct sunlight. The positions of pots were changed every week to nullify environmental effects due to positioning. The bioefficacy study was based on seed germination, plant height (shoot and root length), dry weight, number of root nodules, and number of leaves at 30, 60, 90, and 120 days after sowing (DAS). Yield components such as number of seeds per pod, number of pods per plant, weight of 100 seeds, and grain yield per pot were estimated at the maturity of plants using standard methods at the time of harvesting (120 DAS).2.5. Statistical analysisThe statistical analyses were conducted to determine mean, standard deviation, and correlation by using data analysis of MS Excel 2007 (Microsoft Inc.). Analysis of variance (ANOVA) was used to compare the means of different combinations. Where significant F-values were observed, differences between individual means were tested using Duncan’s multiple range test at the 5% level of significance. The data were analyzed using SPSS 16.0 (SPSS Inc., Chicago, IL, USA) and the XLSTAT 2013 package.
3. Results3.1. Characterization of the amendments usedBiofertilizers, being living organisms, were not analyzed for their physicochemical parameters. Chemical fertilizers were also not analyzed as the important chemical component contents were known. Farmyard manure and vermicompost prepared in-house and collected fly-ash used in the experiment were analyzed in the laboratory for their physicochemical parameters and the results are summarized in Table 1. 3.1.1. Farmyard manureFarmyard manure was basic in nature with a pH of about 7.42 (Table 1). The manure has an optimum water-holding capacity of about 65.75, indicating its appropriateness for plant growth. High levels of nitrogen (N), phosphorous (P), and potassium (K) content were found in farmyard manure with available N ranging between 3115.3 and 3220.3 mg kg–1, available phosphorous between 2038.03 and 2150.01 mg kg–1, and available potassium between 5180.71 and 5444.31 mg kg–1. Trace metal concentration (total) in farmyard manure showed the following trend: Fe > Mn > Zn > Cu > Cr > Ni > Co > Pb > Cd.

502
SEN and KUMAR / Turk J Agric For
3.1.2. VermicompostVermicompost was found to have higher concentrations of N, P, and K of about 4380.50 mg kg–1 N, 3084 mg kg–1 P, and 6599.77 mg kg–1 K, respectively, thus proving it as a good fertilizer. Porosity of vermicompost was about 68.19%, thus leading to a lower bulk density of about 0.84 g cm–3. Organic carbon ranged between 24.07% and 24.53%. Cation exchange capacity was found to be about 75.38 cmol kg–1. In vermicompost, Fe concentration (total) was found
to be highest, ranging between 11042.73 and 11229.03 mg kg–1, followed by Zn and Cu having concentrations of about 431.61 and 145.69 mg kg–1, respectively. Among DTPA available trace elements, Mn concentration was found to be highest at about 10.24 mg kg–1, followed by Zn ranging between 9.33 and 9.35 mg kg–1 and Fe ranging between 29.11 and 29.13 mg kg–1.3.1.3. Fly-ashFly-ash has a very low moisture content of about 4.31 and
Table 1. Physicochemical properties of the amendments used.
Parameters UnitsValues (mean ± SD)
Farmyard manure Vermicompost Fly-ash
Moisture content (MC) % 15.43 ± 0.51 16.30 ± 0.12 4.31 ± 0.02Water holding capacity (WHC) % 65.75 ± 0.5 66.75 ± 1.0 59.25 ± 0.5Bulk density (BD) g cm–3 0.94 ± 0.02 0.84 ± 0 1.12 ± 0.04Porosity % 64.42 ± 0.18 68.19 ± 0.18 62.07 ± 1.45pH ─ 7.42 ± 0 7.75 ± 0.04 6.82 ± 0Electrical conductivity (EC) dS m–1 2.63 ± 0.01 2.23 ± 0 0.25 ± 0Organic carbon (OC) % 21.96 ± 0.09 24.45 ± 0.38 1.67 ± 0.04Organic matter (OM) % 37.86 ± 0.16 42.15 ± 1.3 2.87 ± 0.06Available N mg kg–1 3167.80 ± 52.50 4380.50 ± 60.86 0.00Available P mg kg–1 2094.02 ± 55.99 3084 ± 82.99 60.52 ± 0.54Available K mg kg–1 5312.51 ± 131.80 6599.77 ± 3.55 32.57 ± 2.68Cation exchange capacity (CEC) cmol(+) kg–1 56.2 ± 0.11 75.38 ± 0.36 6.6 ± 0.02Total trace elementsPb
mg kg–1
9.43 ± 0.14 7.45 ± 0.23 23.5 ± 0.22Zn 382.13 ± 088.66 431.61 ± 2.25 32.3 ± 9.85Cu 136.13 ± 0.41 145.69 ± 15.09 42.85 ± 2.84Fe 11,688.63 ± 215.24 11,135.88 ± 93.15 17,957.63 ± 26.03Mn 239.05 ± 16.53 353.68 ± 10.97 217.26 ± 4.29Ni 14.31 ± 0.48 14.74 ± 1.44 18.61 ± 0.51Cd 1.48 ± 0.33 1.21 ± 0.01 0.95 ± 0.64Co 12.09 ± 0.51 7.25 ± 1.71 11.13 ± 1.08Cr 35.05 ± 1.88 42.61 ± 0.32 11.79 ± 1.73DTPA available trace elementsPb
mg kg–1
0. 90 ± 0.01 0.56 ± 0.01 0.40 ± 0.02Zn 17.08 ± 0.01 29.12 ± 0.01 0.62 ± 0.01Cu 2.34 ± 0.0 5.74 ± 00 0.85 ± 0.01Fe 9.23 ± 0.01 9.34 ± 0.01 8.41 ± 0.85Mn 6.92 ± 0.03 10.24 ± 0.03 1.22 ± 0-.64Ni 0.22 ± 0.02 0.82 ± 0.08 0.21 ± 0.02Cd < 0.0004 < 0.0004 < 0.0004Co 0.197 ± 0.04 0.24 ± 00 0.15 ± 0.04Cr < 0.003 < 0.003 < 0.003

503
SEN and KUMAR / Turk J Agric For
low P and K contents of about 60.52 and 32.57 mg kg–1, respectively. Nitrogen content was found to be negligible. Lower NPK content is generally unfavorable for plant growth. However, fly-ash is enriched in trace elements, with Fe (total) having a highest concentration of about 17957.63 mg kg–1, followed by Mn > Cu > Zn > Pb > Ni > Cr> Cd. Among DTPA available trace elements, Fe had
the highest concentration of about 8.41 mg kg–1, followed by Mn, Cu, and other metals.3.2. Physicochemical properties of mine spoilMine spoil was devoid of nutrients. It was of high bulk density, low moisture content, and low water-holding capacity and was deficient in nitrogen, phosphorus, and potassium (Table 2). The mean value of pH of the studied
Table 2. Physicochemical and biological properties of mine spoil samples.
Parameters Unit Mean value ± SD
Moisture content (MC) % 4.14 ± 0.18Water holding capacity (WHC) % 29.03 ± 0.62Bulk density (BD) g cm–3 1.45 ± 0.07Porosity % 45.46 ± 2.56Sand % 76.79 ± 1.70Silt % 14.47 ± 0.88Clay % 8.45 ± 0.93pH ─ 7.71 ± 0.13Electrical Conductivity (EC) dS m–1 0.22 ± 0.05Organic carbon (OC) % 0.88 ± 0.07Organic matter (OM) % 1.52 ± 0.13Available N mg kg–1 30.57 ± 2.20Available P mg kg–1 1.95 ± 0.08Available K mg kg–1 42.28 ± 1.88Cation exchange capacity (CEC) cmol (+) kg–1 8.11 ± 0.78Dehydrogenase activity µg g–1 dry soil h–1 3.99 ± 0.11Total trace elementsPb 18.20 ± 0.72Zn 128.25 ± 11.11Cu 17.65 ± 0.81Fe 12,779.50 ± 320.40Mn mg kg–1 251.80 ± 8.75Ni 23.34 ± 0.94Cd 1.43 ± 0.34Co 9.28 ± 0.71Cr 28.61 ± 0.81DTPA available trace elementsPb 2.82 ± 0.03Zn 15.78 ± 0.05Cu 2.98 ± 0.04Fe 8.86 ± 0.06Mn mg kg–1 10.28 ± 0.05Ni 0.91 ± 0.10Cd 0.06 ± 0.01Co 0.60 ± 0.03Cr 0.23 ± 0.00
504
SEN and KUMAR / Turk J Agric For
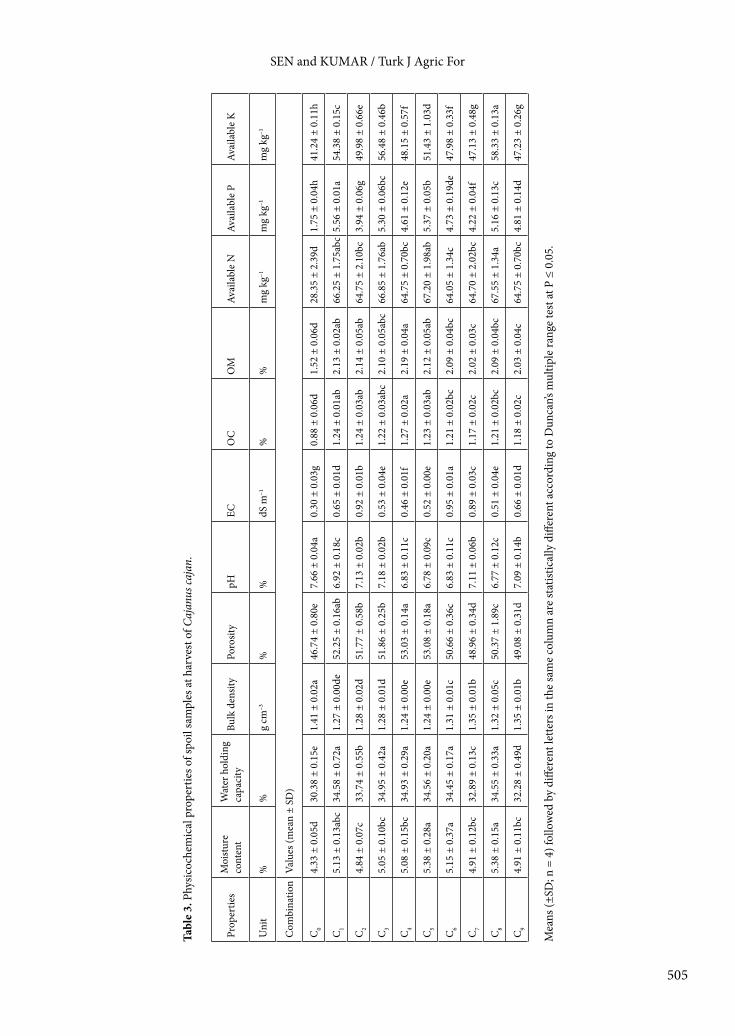
overburden material was found to be slightly alkaline with a value of 7.71 ± 0.13. The mean value of electrical conductivity of the spoil sample was 0.22 ± 0.05 dS m–1. The result of the spoil sample analysis for organic carbon was 0.88 ± 0.07%. 3.3. Effects of amendments on physicochemical properties of mine spoil At the time of harvesting, the improvements in physicochemical and nutrient status of the mine spoil were analyzed and the results are given in Table 3. The bulk density of the mine spoil decreased from 1.41 ± 0.02 g cm–3 to 1.24 ± 0.00 g cm–3. The decrease in bulk density will reduce the compaction, which facilitates the aeration and better penetration and spreading of plant roots, thereby making the rhizosphere favorable for massive root development. The addition of amendments also increases the porosity, water-holding capacity, moisture contents, and electrical conductivity. The organic carbon content also increased from 0.88 ± 0.06% to 1.27 ± 0.02 %, which might be due to high organic carbon content in the amendments.
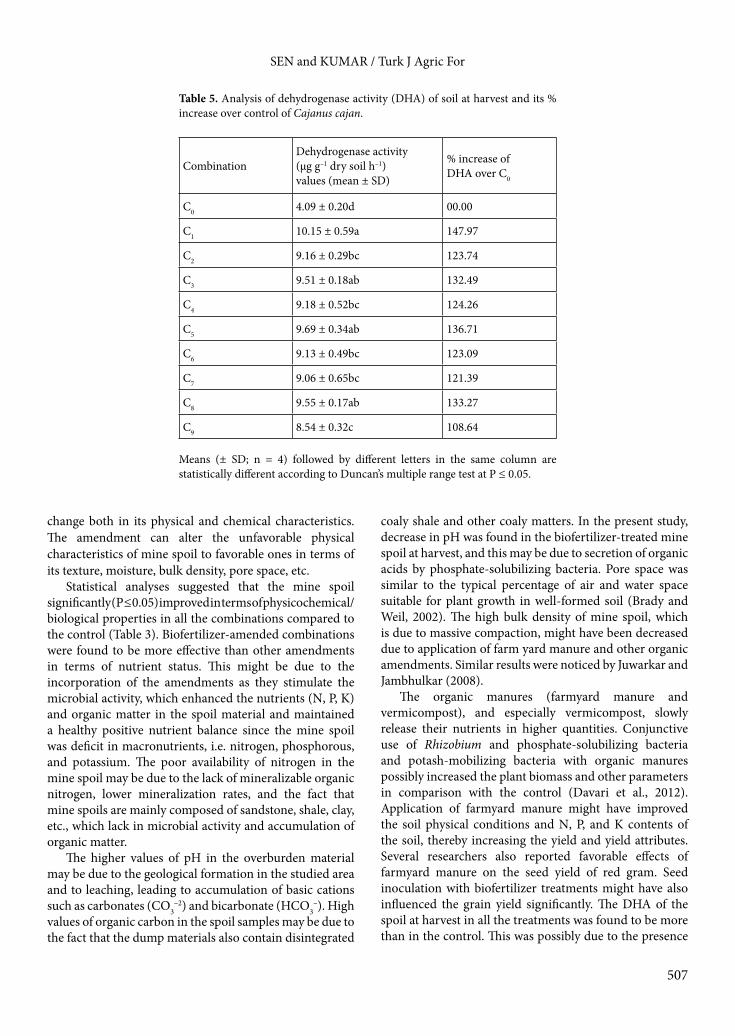
Similarly, available nitrogen, phosphorous, and potassium also improved; biofertilizers might have improved the spoil material by fixing atmospheric nitrogen, solubilizing inorganic phosphorus, and mobilizing potassium.3.4. Effects of amendments on trace metals of mine spoilThe total and DTPA available trace element concentrations in the spoil at harvest of Cajanus cajan in all treatments were found to be below their respective toxic levels (Table 4). It was observed that there were no significance differences between trace metals in the studied combinations of soil amendments. The concentrations of trace elements in seeds of Cajanus cajan were well within critical limits as per as per World Health Organization guidelines.3.5. Effects of amendments on dehydrogenase activity of mine spoilThe dehydrogenase activity (DHA) of spoil in all treatments and in the control was observed at harvesting. The statistical analysis of DHA data showed that the DHA of spoil samples in all the treatments was significantly increased compared to the control after plantation of Cajanus cajan. The maximum value (10.15 ± 0.59 µg g–1
dry soil h–1) of dehydrogenase activity in spoil sample was recorded in treatment C1 with an increase of 147.97% over the control (Table 5).3.6. Effect of different soil amendment on growth of Cajanus cajanThe statistical analysis suggested that the mine spoil being treated with different amendments enhanced the seed
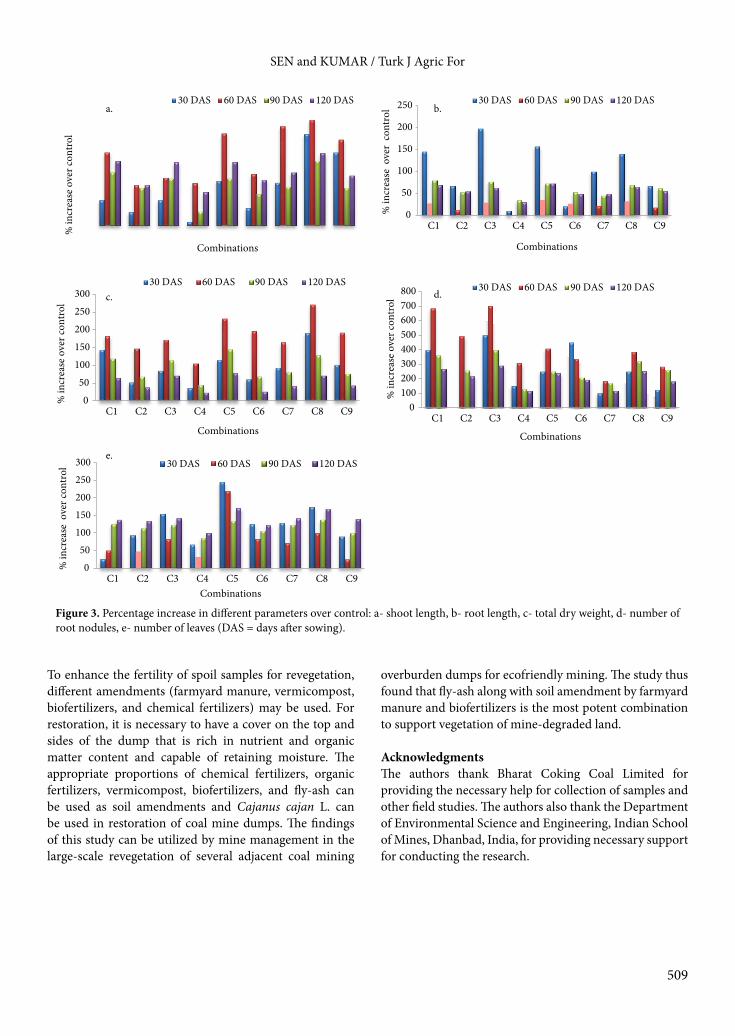
germination, plant height, total dry weight, number of leaves, root nodulation, and yield components significantly (P ≤ 0.05) compared to the nonamended control (Figures 2 and 3). The combinations amended with biofertilizers were effectively improved in growth in comparison to other amendments. All the combinations of amendments used increased the percent of seed germination compared to the control, C0 (mine spoil). Highest seed germination percentage was observed in C5 and C3, followed by C8 and C1.
3.7. Effect on yield components of Cajanus cajanThe yield components in terms of number of pods per plant, number of seeds per pod, weight per 100 seeds (grains), and weight of grains per pot were measured at harvest for all nine treatments and for the control to find out the effects of different amendments for Cajanus cajan. All the yield components were found to have higher values in all the treatments compared to those of the control (Table 6).3.7.1. Comparison of yield components of the amendmentsThe statistical analysis of the data showed that the yield components of Cajanus cajan measured at harvest, except number of seeds per pod, were significantly (P ≤ 0.05) increased in all the treatments compared to control. The combinations of biofertilizer, farmyard manure, vermicompost, and fly-ash were found to be better amendment combinations in terms of plant growth as well as grain yield. Combinations C3 and C8 showed the best results with respect to grain yield per pot of about 79.66 g in C3 followed by combination C8 with grain yield of about 79.09 g (Table 6). Combinations C0 and C4 showed poor grain yield of about 20.76–29.66 g in C0 and 33.55–36.95 g in C4. Number of pods per plant was highest with C8 followed by C3, i.e. 27.75 and 27.50, respectively, as compared to other combinations. The percentage increase in weight per 100 seeds was maximum with combination C3 at about 15.45 g and minimum with combination C0 at 9.53 g. All the yield components were found to have higher values in all the treatments compared to those of the control. The statistical analysis of the data showed that the yield components of Cajanus cajan measured at harvest, except number of seeds per pod, were significantly (P ≤ 0.05) increased in all the treatments compared to control.
4. DiscussionFor successful revegetation of the spoil material, addition of a suitable type and amount of fertilizers and amendments is required. Different types of amendment may be used to improve the fertility of mine spoil, bringing immediate
505
SEN and KUMAR / Turk J Agric For
Tabl
e 3.
Phy
sicoc
hem
ical
pro
pert
ies o
f spo
il sa
mpl
es at
har
vest
of C
ajan
us ca
jan.
Prop
ertie
sM
oist
ure
cont
ent
Wat
er h
oldi
ng
capa
city
Bulk
den
sity
Po
rosit
ypH
EC
OC
O
M
Avai
labl
e N
Ava
ilabl
e P
Av
aila
ble
K
Uni
t%
%g
cm–3
%%
dS m
–1%
%m
g kg
–1m
g kg
–1m
g kg
–1
Com
bina
tion
Valu
es (m
ean
± SD
)
C0
4.33
± 0
.05d
30.3
8 ±
0.15
e1.
41 ±
0.0
2a46
.74
± 0.
80e
7.66
± 0
.04a
0.30
± 0
.03g
0.88
± 0
.06d
1.52
± 0
.06d
28.3
5 ±
2.39
d1.
75 ±
0.0
4h41
.24
± 0.
11h
C1
5.13
± 0
.13a
bc34
.58
± 0.
72a
1.27
± 0
.00d
e52
.25
± 0.
16ab
6.92
± 0
.18c
0.65
± 0
.01d
1.24
± 0
.01a
b2.
13 ±
0.0
2ab
66.2
5 ±
1.75
abc
5.56
± 0
.01a
54.3
8 ±
0.15
c
C2
4.84
± 0
.07c
33.7
4 ±
0.55
b1.
28 ±
0.0
2d51
.77
± 0.
58b
7.13
± 0
.02b
0.92
± 0
.01b
1.24
± 0
.03a
b2.
14 ±
0.0
5ab
64.7
5 ±
2.10
bc3.
94 ±
0.0
6g49
.98
± 0.
66e
C3
5.05
± 0
.10b
c34
.95
± 0.
42a
1.28
± 0
.01d
51.8
6 ±
0.25
b7.
18 ±
0.0
2b0.
53 ±
0.0
4e1.
22 ±
0.0
3abc
2.10
± 0
.05a
bc66
.85
± 1.
76ab
5.30
± 0
.06b
c56
.48
± 0.
46b
C4
5.08
± 0
.15b
c34
.93
± 0.
29a
1.24
± 0
.00e
53.0
3 ±
0.14
a6.
83 ±
0.1
1c0.
46 ±
0.0
1f1.
27 ±
0.0
2a2.
19 ±
0.0
4a64
.75
± 0.
70bc
4.61
± 0
.12e
48.1
5 ±
0.57
f
C5
5.38
± 0
.28a
34.5
6 ±
0.20
a1.
24 ±
0.0
0e53
.08
± 0.
18a
6.78
± 0
.09c
0.52
± 0
.00e
1.23
± 0
.03a
b2.
12 ±
0.0
5ab
67.2
0 ±
1.98
ab5.
37 ±
0.0
5b51
.43
± 1.
03d
C6
5.15
± 0
.37a
34.4
5 ±
0.17
a1.
31 ±
0.0
1c50
.66
± 0.
36c
6.83
± 0
.11c
0.95
± 0
.01a
1.21
± 0
.02b
c2.
09 ±
0.0
4bc
64.0
5 ±
1.34
c4.
73 ±
0.1
9de
47.9
8 ±
0.33
f
C7
4.91
± 0
.12b
c32
.89
± 0.
13c
1.35
± 0
.01b
48.9
6 ±
0.34
d7.
11 ±
0.0
6b0.
89 ±
0.0
3c1.
17 ±
0.0
2c2.
02 ±
0.0
3c64
.70
± 2.
02bc
4.22
± 0
.04f
47.1
3 ±
0.48
g
C8
5.38
± 0
.15a
34.5
5 ±
0.33
a1.
32 ±
0.0
5c50
.37
± 1.
89c
6.77
± 0
.12c
0.51
± 0
.04e
1.21
± 0
.02b
c2.
09 ±
0.0
4bc
67.5
5 ±
1.34
a5.
16 ±
0.1
3c58
.33
± 0.
13a
C9
4.91
± 0
.11b
c32
.28
± 0.
49d
1.35
± 0
.01b
49.0
8 ±
0.31
d7.
09 ±
0.1
4b0.
66 ±
0.0
1d1.
18 ±
0.0
2c2.
03 ±
0.0
4c64
.75
± 0.
70bc
4.81
± 0
.14d
47.2
3 ±
0.26
g
Mea
ns (±
SD; n
= 4
) fol
low
ed b
y di
ffere
nt le
tters
in th
e sa
me
colu
mn
are
stat
istic
ally
diff
eren
t acc
ordi
ng to
Dun
can’s
mul
tiple
rang
e te
st at
P ≤
0.0
5.

506
SEN and KUMAR / Turk J Agric For
Tabl
e 4.
DTP
A av
aila
ble
trac
e el
emen
ts in
min
e sp
oil s
ampl
es at
har
vest
of C
ajan
us ca
jan.
Trac
e el
emen
tsPb
Zn
Cu
Fe
Mn
Ni
C
d
C
o
Cr
Uni
tm
g kg
–1
Com
bina
tion
Valu
es (m
ean
± SD
)
C0
2.78
± 0
.05a
15.5
8 ±
0.53
2.93
± 0
.05*
8.76
± 0
.18a
10.2
8 ±
0.06
a0.
85 ±
0.1
7a0.
06 ±
0.0
1a0.
59 ±
0.0
2a0.
23 ±
0a
C1
2.21
± 0
.06c
17.1
3 ±
0.04
a2.
53 ±
0.5
5*8.
8 ±
0.07
a9.
79 ±
0.2
8c0.
69 ±
0.1
5b0.
05 ±
0.0
2abc
d0.
14 ±
0.0
1e0.
24 ±
0.0
4e
C2
2.77
± 0
.05a
15.2
4 ±
0.12
bc2.
53 ±
0.3
1*8.
39 ±
0.2
3abc
9.78
± 0
.29c
0.64
± 0
.01b
c0.
02 ±
0.0
0de
0.35
± 0
.01c
0.23
± 0
c
C3
2.52
± 0
.34a
b14
.79
± 1.
72bc
d2.
55 ±
0.2
3*7.
86 ±
0.4
4cd
9.59
± 0
.36c
d0.
63 ±
0.0
1bc
0.03
± 0
.01b
cde
0.34
± 0
.02c
0.19
± 0
.05d
C4
2.73
± 0
.19a
14.8
6 ±
0.16
bcd
2.82
± 0
.06*
7.33
± 1
.15d
9.5
± 0.
06cd
0.44
± 0
.03d
0.03
± 0
.00b
cde
0.15
± 0
.02e
0.41
± 0
.03e
C5
2.75
± 0
.09a
13.9
9 ±
0.93
de2.
41 ±
0.7
8*7.
62 ±
0.2
4cd
9.6
± 0.
15cd
0.54
± 0
.02c
d0.
03 ±
0.0
1de
0.21
± 0
.05d
e0.
3 ±
0.13
d
C6
2.2
± 0.
04c
15.2
9 ±
0.71
bc2.
59 ±
0.0
8*8.
44 ±
0.2
a9.
31 ±
0.2
4d0.
51 ±
0.0
5cd
0.06
± 0
.00a
bc0.
28 ±
0.0
5cd
0.11
± 0
.01c
d
C7
2.34
± 0
.17b
c14
.3 ±
5.5
3cd
2.75
± 0
.34*
7.83
± 2
.64c
d9.
83 ±
3.5
bc0.
55 ±
0.6
6cd
0.03
± 0
.88c
de0.
29 ±
0.7
7cd
0.36
± 0
.73c
d
C8
2.4
± 0.
42bc
13.1
1 ±
0.43
e2.
71 ±
0.0
8*8.
42 ±
0.0
7a10
.13
± 0.
2ab
0.45
± 0
.05d
0.06
± 0
.02a
b0.
46 ±
0.1
6b0.
23 ±
0.0
1b
C9
2.32
± 0
.07b
c12
.86
± 0.
69e
2.66
± 0
.10*
9.04
± 0
.69a
9.53
± 0
.17c
d0.
07 ±
0.0
1a0.
07 ±
0.0
6a0.
24 ±
0.0
2de
0.24
± 0
.02c
d
Mea
ns (±
SD; n
= 4
) fol
low
ed b
y di
ffere
nt le
tters
in th
e sa
me
colu
mn
are
stat
istic
ally
diff
eren
t acc
ordi
ng to
Dun
can’s
mul
tiple
rang
e te
st at
P ≤
0.0
5.*:
Non
signi
fican
t.
507
SEN and KUMAR / Turk J Agric For
change both in its physical and chemical characteristics. The amendment can alter the unfavorable physical characteristics of mine spoil to favorable ones in terms of its texture, moisture, bulk density, pore space, etc.
Statistical analyses suggested that the mine spoil significantly (P ≤ 0.05) improved in terms of physicochemical/biological properties in all the combinations compared to the control (Table 3). Biofertilizer-amended combinations were found to be more effective than other amendments in terms of nutrient status. This might be due to the incorporation of the amendments as they stimulate the microbial activity, which enhanced the nutrients (N, P, K) and organic matter in the spoil material and maintained a healthy positive nutrient balance since the mine spoil was deficit in macronutrients, i.e. nitrogen, phosphorous, and potassium. The poor availability of nitrogen in the mine spoil may be due to the lack of mineralizable organic nitrogen, lower mineralization rates, and the fact that mine spoils are mainly composed of sandstone, shale, clay, etc., which lack in microbial activity and accumulation of organic matter.
The higher values of pH in the overburden material may be due to the geological formation in the studied area and to leaching, leading to accumulation of basic cations such as carbonates (CO3
–2) and bicarbonate (HCO3–). High
values of organic carbon in the spoil samples may be due to the fact that the dump materials also contain disintegrated
coaly shale and other coaly matters. In the present study, decrease in pH was found in the biofertilizer-treated mine spoil at harvest, and this may be due to secretion of organic acids by phosphate-solubilizing bacteria. Pore space was similar to the typical percentage of air and water space suitable for plant growth in well-formed soil (Brady and Weil, 2002). The high bulk density of mine spoil, which is due to massive compaction, might have been decreased due to application of farm yard manure and other organic amendments. Similar results were noticed by Juwarkar and Jambhulkar (2008).
The organic manures (farmyard manure and vermicompost), and especially vermicompost, slowly release their nutrients in higher quantities. Conjunctive use of Rhizobium and phosphate-solubilizing bacteria and potash-mobilizing bacteria with organic manures possibly increased the plant biomass and other parameters in comparison with the control (Davari et al., 2012). Application of farmyard manure might have improved the soil physical conditions and N, P, and K contents of the soil, thereby increasing the yield and yield attributes. Several researchers also reported favorable effects of farmyard manure on the seed yield of red gram. Seed inoculation with biofertilizer treatments might have also influenced the grain yield significantly. The DHA of the spoil at harvest in all the treatments was found to be more than in the control. This was possibly due to the presence
Table 5. Analysis of dehydrogenase activity (DHA) of soil at harvest and its % increase over control of Cajanus cajan.
CombinationDehydrogenase activity (µg g–1 dry soil h–1)values (mean ± SD)
% increase of DHA over C0
C0 4.09 ± 0.20d 00.00
C1 10.15 ± 0.59a 147.97
C2 9.16 ± 0.29bc 123.74
C3 9.51 ± 0.18ab 132.49
C4 9.18 ± 0.52bc 124.26
C5 9.69 ± 0.34ab 136.71
C6 9.13 ± 0.49bc 123.09
C7 9.06 ± 0.65bc 121.39
C8 9.55 ± 0.17ab 133.27
C9 8.54 ± 0.32c 108.64
Means (± SD; n = 4) followed by different letters in the same column are statistically different according to Duncan’s multiple range test at P ≤ 0.05.

508
SEN and KUMAR / Turk J Agric For
of one or more of farmyard manure, vermicompost, and biofertilizers in the treatments.
The improvement in growth parameters and yield components may not be solely due to the inoculation of seeds with biofertilizers but also because of several other factors such as release of growth-promoting substances, suppression of plant pathogens, and proliferation of beneficial microbes in the rhizosphere (Kundu and Guar, 1980; Goud and Kale, 2010). Number of root nodules and plant biomass were increased in the combinations made up of biofertilizers, vermicompost, and fly-ash and farmyard manures, possibly combining the effects of all amendments. Biofertilizers enhanced the growth parameters. Roots are the sites of microbial infection,
so well-infected roots increase the number of nodules (Selvakumar et al., 2012).
The combinations prepared with biofertilizers along with farmyard manure and fly-ash induced the best growth. This is most likely because the microorganisms used as biofertilizers stimulated plant growth by providing necessary nutrients as a result of their colonization at their rhizosphere or by symbiotic association. Similar effects were reported in earlier studies (Varma and Shuepp, 1995; Juwarkar and Jambhulkar, 2008; Thenmozhi et al., 2010).
From the experimental results, it may be concluded that the successful growth of the studied pulse crop in these barren, recalcitrant overburden dump materials is possible with the application of suitable amendments.
a.
b.
c.
d.
e. f.
0
20
40
60
80
100
120
C0 C1 C2 C3 C4 C5 C6 C7 C8 C9
% o
f see
d ge
rmin
atio
n
Combinations
01020304050607080
C0 C1 C2 C3 C4 C5 C6 C7 C8 C9
Shoo
t len
gth
(cm
)
Combinations
30 DAS 60 DAS 90DAS 120 DAS
010203040506070
C0 C1 C2 C3 C4 C5 C6 C7 C8 C9
Root
leng
th (c
m)
Combinations
30 DAS 60 DAS 90DAS 120 DAS
02468
10121416
C0 C1 C2 C3 C4 C5 C6 C7 C8 C9
Tota
l dry
wei
ght (
g)
Combinations
30 DAS 60 DAS 90 DAS 120 DAS
05
10152025303540
C0 C1 C2 C3 C4 C5 C6 C7 C8 C9
Num
ber o
f roo
t nod
ules
Combinations
30 DAS 60 DAS 90DAS 120 DAS
01020304050607080
C0 C1 C2 C3 C4 C5 C6 C7 C8 C9
Num
ber o
f lea
ves
Combinations
30 DAS 60 DAS 90DAS 120 DAS
Figure 2. Effect of various soil amendments on growth parameters: a- percent seed germination, b- shoot length, c- root length, d- total dry weight, e- number of root nodules, f- number of leaves (DAS = days after sowing).
509
SEN and KUMAR / Turk J Agric For
a. b.
c. d.
e.
% in
crea
se o
ver c
ontr
ol
Combinations
30 DAS 60 DAS 90 DAS 120 DAS 30 DAS 60 DAS 90 DAS 120 DAS
30 DAS 60 DAS 90 DAS 120 DAS
0
50
100
150
200
250
C1 C2 C3 C4 C5 C6 C7 C8 C9
% in
crea
se o
ver
cont
rol
Combinations
0
50
100
150
200
250
300
C1 C2 C3 C4 C5 C6 C7 C8 C9
% in
crea
se o
ver c
ontr
ol
Combinations
30 DAS 60 DAS 90 DAS 120 DAS
0100200300400500600700800
C1 C2 C3 C4 C5 C6 C7 C8 C9
% in
crea
se o
ver c
ontr
ol
Combinations
0
50
100
150
200
250
300
C1 C2 C3 C4 C5 C6 C7 C8 C9
% in
crea
se o
ver c
ontr
ol
Combinations
30 DAS 60 DAS 90 DAS 120 DAS
Figure 3. Percentage increase in different parameters over control: a- shoot length, b- root length, c- total dry weight, d- number of root nodules, e- number of leaves (DAS = days after sowing).
To enhance the fertility of spoil samples for revegetation, different amendments (farmyard manure, vermicompost, biofertilizers, and chemical fertilizers) may be used. For restoration, it is necessary to have a cover on the top and sides of the dump that is rich in nutrient and organic matter content and capable of retaining moisture. The appropriate proportions of chemical fertilizers, organic fertilizers, vermicompost, biofertilizers, and fly-ash can be used as soil amendments and Cajanus cajan L. can be used in restoration of coal mine dumps. The findings of this study can be utilized by mine management in the large-scale revegetation of several adjacent coal mining
overburden dumps for ecofriendly mining. The study thus found that fly-ash along with soil amendment by farmyard manure and biofertilizers is the most potent combination to support vegetation of mine-degraded land.
AcknowledgmentsThe authors thank Bharat Coking Coal Limited for providing the necessary help for collection of samples and other field studies. The authors also thank the Department of Environmental Science and Engineering, Indian School of Mines, Dhanbad, India, for providing necessary support for conducting the research.

510
SEN and KUMAR / Turk J Agric For
Tabl
e 6.
Effe
ct o
f am
endm
ents
on
yiel
d co
mpo
nent
s of C
ajan
us ca
jan.
Com
bina
tion
No.
of p
ods
per p
lant
No.
of p
ods p
er
plan
t (%↑
)N
o. o
f see
dspe
r pod
No.
of s
eeds
per
pl
ant (
%↑
)W
eigh
t per
100
seed
s (g)
Wei
ght p
er 1
00
seed
s (g)
(%↑
)G
rain
yie
ld
per p
ot (g
)G
rain
yie
ld p
er
pot (
%↑
)
C0
19.2
5 ±
1.50
c0.
002.
75 ±
0.5
0*0.
009.
53 ±
0.1
3g0.
0025
.21
± 4.
45d
0.00
C1
26.5
0 ±
1.29
a37
.66
3.75
± 0
.50*
36.3
613
.97
± 0.
54c
46.6
169
.39
± 6.
96a
175.
22
C2
21.0
0 ±
0.82
b9.
093.
50 ±
0.5
8*27
.27
12.6
7 ±
0.05
de33
.02
46.5
7 ±
6.36
b84
.69
C3
27.5
0 ±
1.29
a42
.86
3.75
± 0
.50*
36.3
615
.45
± 0.
13a
62.1
979
.66
± 10
.05a
215.
95
C4
20.0
0 ±
0.82
bc3.
903.
00 ±
0.0
0*9.
0911
.75
± 0.
37f
23.3
535
.25
± 1.
70c
39.8
0
C5
27.7
5 ±
0.50
a44
.16
3.75
± 0
.50*
36.3
614
.60
± 0.
18b
53.2
675
.97
± 10
.30a
201.
28
C6
20.2
5 ±
0.50
bc5.
193.
50 ±
0.5
827
.27
13.1
5 ±
0.44
d38
.04
46.6
0 ±
8.64
b84
.82
C7
20.7
5 ±
0.50
b7.
793.
75 ±
0.5
0*36
.36
12.1
0 ±
0.47
f27
.02
47.0
8 ±
1.94
b86
.71
C8
27.7
5 ±
0.50
a44
.16
4.00
± 0
.00*
45.4
514
.25
± 0.
20bc
49.5
979
.09
± 0.
00a
213.
66
C9
20.5
0 ±
0.58
bc6.
493.
50 ±
0.5
8*27
.27
12.6
3 ±
0.46
e32
.53
45.2
9 ±
6.90
bc79
.63
Mea
ns (±
SD; n
= 4
) fol
low
ed b
y di
ffere
nt le
tters
in th
e sa
me
colu
mn
are
stat
istic
ally
diff
eren
t acc
ordi
ng to
Dun
can’s
mul
tiple
rang
e te
st at
P ≤
0.0
5.*:
Non
signi
fican
t; (%
↑):
perc
enta
ge in
crea
se.
511
SEN and KUMAR / Turk J Agric For
References
Brady N, Weil R (2002). The Nature and Properties of Soils. 13th ed. Upper Saddle River, NJ, USA: Prentice Hall.
Business Line (2000). Environmental Issues in Coal Mining. Chennai, India: Kasturi and Sons.
Casida JLE (1977). Microbial metabolic activity as measured by dehydrogenase determinations. Appl Environ Microbiol 34: 630-636.
Chaoji V (2002). Environmental challenges and the future of Indian coal. J Mines Metals Fuels 11: 257-262.
Cherfas J (1992). Trees help nature reclaim the slag heaps. New Science 14: 1524-1529.
CIL (2011). Coal India Limited Annual Report. Kolkata, India: Coal India Limited.
Cordell CE, Mans LF, Marx DH (2002). Mycorrhizal fungi and trees-a successful reforestation alternative for mine land reclamation. In: Dumroese RK, Riley LE, Landis TD, technical coordinators. National Proceedings: Forest and Conservation Nursery Associations-1999, 2000, and 2001. Ogden, UT, USA: USDA Rocky Mountain Research Station, pp. 206-212.
Davari M, Sharma SN, Mirzakhani M (2012). Residual influence of organic materials, crop residues, and biofertilizers on performance of succeeding mungbean in organic rice based cropping system. Int J Recycl Org Waste Agric 1: 3-9.
Deka Boruah HP (2006). North eastern coal and environment: an overview. In: Proceedings on Characterization and Gainful Utilization of NE Coal. Jorhat, India: RRL, pp. 28-33.
Dobson AP, Bradshaw AD, Baker AGM (1997). Hopes for the future: restoration ecology and conservation biology. Science 277: 515-522.
Dolman PM, Sutherland WJ (1994). The use of soil disturbance in the management of Breckland grass heaths for nature conservation. J Environ Manage 41: 123-140.
Ghose MK (2004). Effect of opencast mining on soil fertility. J Scientific Ind Res 63: 1006-1009.
Gogoi J, Pathak N, Dowrah J, Deka BHP (2007). In-situ selection of tree species in environmental restoration of opencast coal mine wasteland. In: Proceedings of International Symposium on MPT 2007. New Delhi, India: Allied Publishers, pp. 678-681.
Goud VV, Kale HB (2010). Productivity and profitability of pigeon pea under different sources of nutrients in rainfed condition of Central India. J Food Legumes 23: 212-217.
Jackson ML (1973). Soil Chemical Analysis. New Delhi, India: Prentice Hall of India.
Jones MLM, Norman K, Rhind PM (2010). Topsoil inversion as a restoration measure in sand dunes, early results from a UK field-trial. J Coastal Conserv 14: 139-151.
Juwarkar AA, Jambhulkar HP (2008). Restoration of fly-ash dump through biological interventions. Environ Monit Assess 139: 355-365.
Kavamura VN, Esposito E (2010). Biotechnological strategies applied to the decontamination of soil polluted with heavy metals. Biotechnol Adv 28: 61-69.
Kiehl K, Pfadenhauer J (2007). Establishment and persistence of target species in newly created calcareous grasslands on former arable fields. Plant Ecol 189: 31-48.
Kundu BS, Gaur AC (1980). Effect of phosphobacteria on the yield and phosphate uptake of potato crop. Curr Sci 49: 159.
Lone MI, He Z, Stoffella PJ, Yang X (2008). Phytoremediation of heavy metal polluted soils and water: progress and perspectives. Journal of Zhejiang University Science B 9: 210-220.
Ministry of Coal (2005). Vision Coal - 2025. New Delhi, India: Government of India.
Odman AM, Martensson LM, Sjoholm C, Olsson PA (2011). Immediate responses in soil chemistry, vegetation and ground beetles to soil perturbation. Biodivers Conserv 20: 3039-3058.
Raju KS, Hassan M (2003). Role of Indian Bureau of Mines in protection of environment in the minerals sector. J Mines Metals Fuels 51: 196-200.
Schnoor TK, Olsson PA (2010). Effects of soil disturbance on plant diversity of calcareous grasslands. Agri Ecosystems Environ 139: 714-719.
Selvakumar G, Reetha S, Thamizhiniyan P (2012). Response of bio-fertilizers on growth, yield attributes and associated protein profiling changes of blackgram (Vigna mungo L.). World Applied Sci J 16: 1368-1374.
Sheoran V, Sheoran AS, Poonia P (2010). Soil reclamation of abandoned mine land by revegetation: a review. Int J Soil Sed Water 3: 1-20.
Singh RS, Chaulya SK, Tewary BK, Dhar BB (1996). Restoration of a coal-mine overburden dumps - A case study. Coal Int 244: 80-83.
Sparling GP, Whale KN, Ramsay AV (1985). Quantifying the contribution from the soil microbial biomass to extractable P levels of fresh and air dried soils. Aust J Soil Res 23: 613-621.
Subbaiah BV, Asija GL (1996). A rapid procedure to the determination of available nitrogen in soils. Curr Sci 25: 259-260.
Thenmozhi R, Rejina K, Madhusudhanan K, Nagasathya A (2010). Study on effectiveness of various bio-fertilizers on the growth & biomass production of selected vegetables. Res J Agri Biological Sci 6: 296-301.
Varma A, Shuepp H (1995). Mycorrhization of the commercially important micro propagated plants. Crit Rev Biotechnol 15: 313-328.
Walkey AC, Black TA (1934). Estimation of soil organic carbon by the chromic acid titration method. Soil Sci 4: 27-38.
Wong MH (2003). Ecological restoration of mine degraded soils, with emphasis on metal contaminated soils. Chemosphere 50: 775-780.