evaluating signal to noise and depth investigation of ... · 245 industrial parkway north, aurora,...
TRANSCRIPT

245 Industrial Parkway North, Aurora, Ontario L4G 4C4, Canada Phone: +1(905)841-5004, Fax +1(905)841-0611, www.geotech.ca
1
Evaluating Signal to Noise and Depth Investigation of Airborne Time Domain EM Systems
Introduction The choice of an airborne EM system depends on its ability to detect and define targets. Moreover, the signal to noise ratio is the most critical parameter that defines a system’s limitations in terms of detection, resolution and depth of investigation. To be able to achieve a high signal to noise ratio it is necessary to generate the strongest possible response from the target and to measure the decaying secondary field response within the lowest possible noise level. While the expected theoretical response of an exploration target is easily modeled using commercially available programs, the noise level depends on the particular design of the EM system and can only be estimated practically. The system comparison can be easily undertaken by forward modeling the responses and plotting these against the actual noise level. AEM Depth of Investigation - Signal-to-Noise Analysis Figure 1 presents some examples of modeled responses against the noise level for the newest VTEM-Plus helicopter time-domain EM (TEM) system (see Table 1), using a conductive plate at 400, 600 and 800 m depth that is based on an Athabasca Basin style graphitic conductor. The typical noise level for VTEM-Plus for the latest time gates (dBdt Z-coil) has been calculated as the standard deviation and is 0.0002 pV/(A*m^4) or 0.08 nT/s, drawn as a black line on all three plots. These diagrams illustrate the progressive attenuation of the TEM signal with target depth.
Figure 1: Forward model VTEM-Plus responses for Athabasca type plate conductor dipping 45 degrees at depths of: A) 400, B) 600, and C) 800m using Maxwell (EMIT Imaging Technology, Midland, WA, AU). Plate parameters for all models: Thickness 50 m; Conductance 150 S; Depth Extent 250 m; Length 500 m, Dip 50 degrees. A more complete analysis of VTEM signal strength attenuation with the conductor depth for this Athabasca target is presented in Figure 2a. Again, the progressive attenuation of the TEM signal with target depth is illustrated. Figure 2b presents an analysis of the changing VTEM signal strength with varying plate conductance (conductivity-thickness). The noise level (black line) determines the detectible signal limits based on the range of the conductor depths and conductance.
400m 600m
800m
noise level (0.08nT/s) noise level (0.08nT/s) noise level (0.08nT/s)
Distance, m Distance, m Distance, m
A) B) C)
VTEM dBZ/dt at -400m VTEM dBZ/dt at -600m VTEM dBZ/dt at-800m
245 Industrial Parkway North, Aurora, Ontario L4G 4C4, Canada Phone: +1(905)841-5004, Fax +1(905)841-0611, www.geotech.ca
2
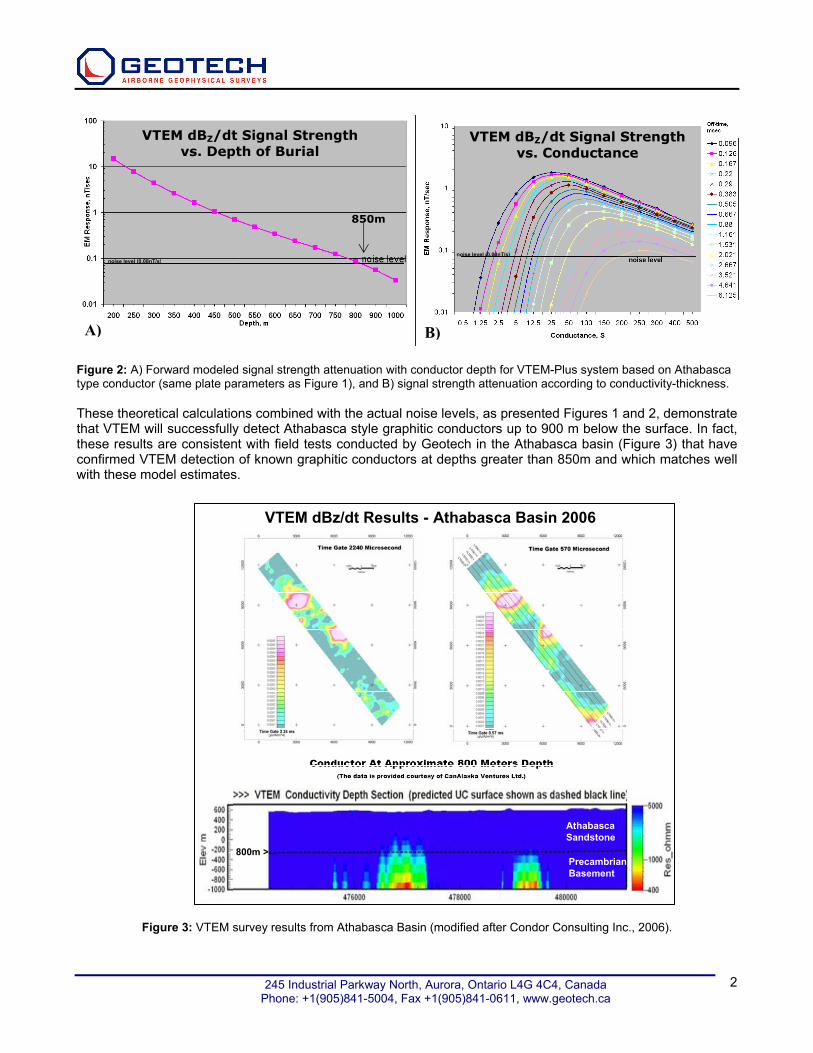
Figure 2: A) Forward modeled signal strength attenuation with conductor depth for VTEM-Plus system based on Athabasca type conductor (same plate parameters as Figure 1), and B) signal strength attenuation according to conductivity-thickness. These theoretical calculations combined with the actual noise levels, as presented Figures 1 and 2, demonstrate that VTEM will successfully detect Athabasca style graphitic conductors up to 900 m below the surface. In fact, these results are consistent with field tests conducted by Geotech in the Athabasca basin (Figure 3) that have confirmed VTEM detection of known graphitic conductors at depths greater than 850m and which matches well with these model estimates.
Figure 3: VTEM survey results from Athabasca Basin (modified after Condor Consulting Inc., 2006).
A) B)
850m
noise level (0.08nT/s) noise level (0.08nT/s)
800m >
Athabasca Sandstone
Precambrian Basement
VTEM dBz/dt Results - Athabasca Basin 2006
VTEM dBZ/dt Signal Strength vs. Depth of Burial
VTEM dBZ/dt Signal Strength vs. Conductance

245 Industrial Parkway North, Aurora, Ontario L4G 4C4, Canada Phone: +1(905)841-5004, Fax +1(905)841-0611, www.geotech.ca
3
AEM Depth of Investigation – Case Examples over Caber VMS Deposit The Caber volcanogenic massive sulphide (VMS) copper-zinc deposit in northern Quebec currently serves as the preferred test range for airborne EM systems. This small, near vertical conductor buried at 125 m depth below the surface under conductive overburden layer is a relatively difficult target for airborne and ground EM systems. All three VTEM system configurations (Table 1) that Geotech currently offers have successfully detected the deposit, due to their low noise and their high signal to noise ratio.
Table 1: List of VTEM system configurations
VTEM System VTEM VTEM-Plus VTEM-Max Typical Noise, pV/(A*m4) 0.0003 0.0002 0.0001
Typical Noise, nT/s 0.07 0.08 0.09 Loop diameter, m 17.4 26 34.6 Peak Current, A 250 190 230
Peak Dipole moment, NIA 240,000 405,000 865,000 * Noise is calculated as the standard deviation of the late dBdt time gates
Figure 4 presents a forward modeling analysis that illustrates the signal attenuation based on the expected VTEM, VTEM-Plus and VTEM-Max late-channel responses over a Caber type conductor with progressively increasing depth of burial, using the 1 mSec delay off-time amplitude. These examples demonstrate that VTEM is capable of detecting a Caber type deposit conductor at depths up to 400 m, VTEM-Plus detects it up to 450 m depth and VTEM-Max detects Caber at burial depths up to 500 m.
Figure 4: VTEM, VTEM-Plus and VTEM-Max system (from left to right) 1ms delay channel dBz/dt responses versus burial depth for a Caber type VMS conductor, based on 3D forward modeling The increasing depth investigation for the various VTEM systems can also be demonstrated using resistivity-depth image sections of actual survey results, as in Figure 5, where the apparent resistivity is only shown for data above the known noise-level and all data below signal-to-noise are intentionally left blank. As shown in Figure 5, the Caber deposit is accurately imaged by all three VTEM systems currently in operation, from 150m to below roughly 450m depths, as a result of favourably high signal to noise levels, in spite of the different dipole-moments inherent in with each system. These results demonstrate the greater importance of signal to noise over simple signal strength (i.e., dipole-moment) considerations in target detection and system selection.
400m 450m 500m
noise level (0.07nT/s) noise level (0.08nT/s)noise level (0.09nT/s)
VTEM dBZ/dt vs. Depth VTEM-Plus dBZ/dt vs. Burial Depth for Caber VMS Model
VTEM-Max dBZ/dt vs. Depth

245 Industrial Parkway North, Aurora, Ontario L4G 4C4, Canada Phone: +1(905)841-5004, Fax +1(905)841-0611, www.geotech.ca
4
Figure 5: Observed dB/dt profiles and Resistivity-Depth Image (RDI) Sections from various VTEM systems currently in operation over Caber deposit. A similar analysis can also be extended to any type of airborne system, requiring changes to system parameters such as 1) transmitter pulse shape, 2) dipole moment and 3) actual system noise level. Figure 6 presents the calculated HTEM responses over the same Caber style vertical plate conductor for the AeroTEM III, HeliGEOTEM II and HeliTEM systems. The noise levels shown have been estimated based on the available historical data.
Figure 6. Modeled EM response (1 mSec off-time) for a Caber type plate target at progressively increasing depths
450m
450m
450m
150m
150m
150m
240m
VTEM over Caber VMS Deposit
VTEM-Plus
VTEM-Max
220m
AeroTEM-III over Caber VMS Target
HeliGEOTEM-II over Caber VMS Target
HeliTEM over Caber VMS Target
290m
0.55nT/s 1.0nT/s 1.0nT/s

245 Industrial Parkway North, Aurora, Ontario L4G 4C4, Canada Phone: +1(905)841-5004, Fax +1(905)841-0611, www.geotech.ca
5
These modeling results demonstrate that these systems are capable of detecting Caber type VMS deposits to depths ranging up to nearly 300m. However, in marked contrast, comparing these results to those from Figures 2 and 4 further demonstrates that all three VTEM systems currently deployed by Geotech will detect Caber type targets to significantly greater depths of burial relative to these other HTEM systems. Table 2 presents a ranking of some of the better known helicopter and fixed-wing TEM systems, using their respective system noise estimates and comparative depths of investigation, based on a same modeling scheme for a small conductive prism (size=40x40x40m, conductance=80siemens). As with the previous modeling examples, the results indicate that the VTEM systems will detect the target to significantly greater depths of burial relative to all competitive systems. This results from improvements in signal-noise due to system design rather than simply increased signal strength obtained through higher transmitter dipole-moment.
Table 2: Estimated Noise and Depth of Investigation of AEM systems for conductive prism target (40x40x40m, 80siemens)
System Dipole Moment, NIA/diameter (m)
Pulse Width (msec)
Bird Height (m) Transmitter/Receiver
Noise Level* (nT/s)
Max Depth of Investigation (m)
VTEM-Max 865,000/34.6 5.4 30/30 0.09 360 VTEM-Plus 405,000/26 7.3 30/30 0.08 320
VTEM 240,000/17.4 7.3 30/30 0.07 290 HeliTEM 1,400,000/30 4 40/65 1.0 190
AeroTEM III 340,000/12 2 30/30 0.55 190 HeliGEOTEM II 750,000/14 4 40/65 1.0 150 MEGATEM II 1,440,000 2.28 120/70 1.2-2 90
SkyTEM (high moment)
197,600/30 10 30/31.5 5-10 40-60
HoisTEM 120,000/24 5 30/30 5 30 GEOTEM 690,000 4 130/60 10 pT (Bx) 10
* Noise estimates based on available historical and published data, including: 1) P. Wolfgram, H. Golden, Airborne EM Applied to Sulphide Nickel – Examples and Analysis. Exploration Geophysics (2001) 32, 136 -140; 2) E. Auken, A.V. Christiansen, J.H. Westergaard, C. Kirkegaard, An integrated processing scheme for high-resolution airborne electromagnetic surveys, the SkyTEM system, Exploration Geophysics, 2009, 40, 184-192; 3) Report on Reid-Mahaffy test MEGATEM II. Ontario Airborne Geophysical Survey Magnetic and EM Data. Geophysical Data Set 1045. Conclusions – AEM Depth of Investigation and Signal to Noise The ability of an airborne EM system to detect and define an exploration target is determined as much, if not more, by the system signal to noise than other considerations, such as pulse width and signal strength (e.g., dipole-moment). Survey evidence supports the theoretical modeling that provides proof to the VTEM system’s superior depth of investigation capability, including >850m drill-proven depths reached in early field survey trials over uraniferous graphites in the Athabasca Basin. However, more recently, realizing the equal importance that signal to noise contributes to depth of investigation, a greater emphasis in VTEM system development has been directed by Geotech towards further lowering the system noise. In fact, as a direct result, supported by theoretical modeling, recent field trials over the 150m deep Caber VMS deposit using three different size VTEM systems, produce essentially the same results due to their low noise and high signal to noise ratios. The evidence reinforces the case for establishing the signal to noise of individual EM systems, in addition to other parameters such as transmitter pulse-width and signal strength, in order to properly evaluate the capabilities of competitive systems during the survey design process. It also emphasizes the usefulness of forward modeling analyses that incorporate signal-to-noise levels in their design, in addition to other system parameters and target characteristics.