evaluating service quality of korean restaurants: a fuzzy
TRANSCRIPT

Evaluating Service Quality
of Korean Restaurants:
A Fuzzy Analytic Hierarchy Approach
M. Mujiya Ulkhaq*, Rizal L. Nartadhi, Pradita Y. Akshinta
Department of Industrial Engineering, Faculty of Engineering, Diponegoro University, 50275,
Semarang, Indonesia
(Received: November 18, 2015 / Revised: March 8, 2016 / Accepted: March 8, 2016)
ABSTRACT
Every service firm must find ways to attract new customers, retain existing customers, and remain competitive and
profitable. As competition increases, delivering better service becomes more important. Service quality is considered
as a vital aspect for the success of the firms. Restaurant cannot be separated from the service quality they have to de-
liver. The development of restaurant is supported with the reputation of the country where the food comes from. Re-
cently, one of the most trending topic is Korean wave which affects the Korean cuisine. A fuzzy AHP was employed
to evaluate the service quality. It is more preferable than traditional AHP which is criticized for its inability to handle
the uncertainty of the decision maker’s perception. Six attributes are used to evaluate five Korean restaurants in Sema-
rang, Indonesia. The result shows that innovation is the most important attribute. It seems that decision makers viewed
the food variation and new method service as main factors that the restaurants have to manage. This finding can pro-
vide the managers with valuable insights into the attribute that reflects customers’ perceptions; also to position their
service based on their competitors. Validating the scale in other culture-based restaurants is an interesting area to be
pursued.
Keywords: Customer Satisfaction, Fuzzy AHP, Korean Restaurants, Service Quality
* Corresponding Author, E-mail: [email protected]
1. INTRODUCTION
Service sector in today’s highly competitive global
market has grown fast and constantly attempts to look for continuous improvement. This development is cor-roborated by a shift of employment from manufacturing sector to service sector. Data from World Bank shows that in most of the developed countries, such as the United States, Germany, France, and Japan, more than 70% of
the labor force is engaged in the service sector (World Bank, 2015). The phenomenon can be considered as a signal of being mature and high quality of standard of living. As consequences, the service providers require
both to have a sensitivity for any changes that can have
an effect on the sustainability of their businesses and to put a concern in a customer satisfaction as their primary goals (Kotler, 2003).
The quality of the service which has to deliver to the customers has been considered as a critical factor for the success of the service provider due to its close con-
nection with customer satisfaction (Chow et al., 2007; Gilbert and Veloutsou, 2006; Parasuraman et al., 1985). Additionally, excellent service precedes customer reten-tion and leads to repeat customer purchase behavior (Cronin and Taylor, 1992; Ladhari et al., 2008) which can eventually increase the market share of service pro-
Industrial Engineering
& Management Systems Vol 15, No 1, March 2016, pp.77-91 http://dx.doi.org/10.7232/iems.2016.15.1.077
ISSN 1598-7248│EISSN 2234-6473│ © 2016 KIIE

Mujiya Ulkhaq, Nartadhi, and Akshinta: Industrial Engineering & Management Systems
Vol 15, No 1, March 2016, pp.77-91, © 2016 KIIE 78
viders as well as generates high incomes (Luo and Hom-burg, 2007). By the meaning, the qualities of the ser-vices should be measured.
Evaluating service quality is challenging since the nature of the service is intangible, simultaneous, and heterogeneous. In addition to the need of measuring the service quality, it is essential to apply an effective tool for recognizing and prioritizing relevant attributes to develop a systematic service quality measurement pro-
cess. This method also should develop consensus deci-sion making. Therefore, the multi-criteria decision mak-ing (MCDM) theory could be applied in analyzing the performance of service quality of some alternatives. This MCDM theory is a discipline that take aim at supporting decision makers who are faced with formulating various
and conflicting evaluations. Analytic hierarch process (AHP) proposed by Saaty
(1980) is one of the most popular and powerful MCDM tool for decision making that has been used for years. Despite of the advantages as seeking consistency in judg-ments, being user friendly, allowing users to structure
complex problems in the form of a hierarchy levels, and relatively easy to handle multiple attributes, AHP has been criticized for its inability to adequately handle the ambiguity of the concepts that are associated with hu-man being’s subjective judgment. Human’s judgments in AHP are represented as precise; yet in real life situa-
tions, the linguistic assessment of human feelings and perceptions are fuzzy. Hence, it is not reasonable to rep-resent it in terms of precise numbers-it is more conven-ience to give interval judgments than fixed value judg-ments.
In this study, it is believed that service quality eva-
luation resulted from evaluators can be considered as
linguistic variables. Thus, it must be conducted in an
uncertain, fuzzy environment. The fuzzy set theory by
Zadeh (1965) is considered to have capability to handle
this situation. It is designed to model the vagueness of
human cognitive processes and provide formalized tool
for dealing with the imprecision intrinsic to many pro-
blems. This fuzzy set theory has been combined with AHP
to present the fuzzy AHP. It can provide the flexibility
and robustness needed for the decision maker to under-
stand the decision problem. The fuzzy AHP has been
applied in many fields of management science, such as
decision making (e.g. Calabrese et al., 2013; Ho et al.,
2012; Huang et al., 2008) and also in service quality
area (e.g. Bilsel et al., 2006; Büyüközkan et al., 2011;
Büyüközkan and Ç ifçi, 2012). However, it is barely
employed in restaurants.
Likewise, restaurant as a part of food service busi-
ness also cannot be detached from the service quality they have to deliver to the customers. It has been chal-lenged to create a unique and clear distinction among its competitors along with its quality of the service to be success in differentiating its service. This study aims to apply the fuzzy AHP approach in Korean restaurants
located in Semarang, Indonesia. Korean restaurants have
been chosen since Korean cuisine is considered emerg-ing, indicating tremendous potential for growth period, as well as being perceived differently for its uniqueness
and flavor (Jang et al., 2009). These attributes could attract Indonesian customers who want to experience a new taste of food. Previous study of foreign travelers in South Korea that talks about the possibility of globaliza-tion of Korean cuisine found that a vegetable-based healthy diet is the most vital factor that will qualify Ko-
rean cuisine to go global (Hong et al., 2009). This study also develops a new multiple-item scale for evaluating service quality of restaurants, especially for Korean res-taurants which have distinctive characteristics among other ethnic or culture-based restaurants. It may provide some insights to the managers of the restaurants on how
patrons rate the service quality; hence enabling the man-agers to position their service quality based on their competitors and to discover dimensions of service which they have to improve.
The paper is structured as follows. In the following sections, the research design of this study is introduced
as well as the attributes that are used in this study. Next, the fuzzy AHP approach is presented to give the readers such understanding about the tools that is used in this study. A case study and discussion to exhibit the ap-plicability of the method is reported in the fourth section. Finally, the conclusion and future research direction will
be presented in the last section.
2. RESEARCH DESIGN
In this study, the attributes for evaluating service quality of Korean restaurants were determined as six attributes: tangibles, responsiveness, empathy, assurance, reliability, and innovation (Chin and Tsai, 2013). The five first attributes was the dimensions of classic SER-
VQUAL and the last was added due to a consideration that it had a positive influence on customer satisfaction by the mediating effects of service quality (Tsai et al., 2010). The sub-attributes used in this study are based on research by Chin and Tsai (2013). However, the sub-att-ributes had been slightly modified since this study was
conducted in Korean restaurants. Tangibles (T) refers to restaurant’s facilities-equi-
pment, physical design (exterior and interior design, tableware), environment, appearance of the employees, and cleanliness. The availability of restaurant’s equip-ment, such as plates, spoons, and chopsticks when the
restaurant is full of customers, is critical to provide a satisfactory service. It is important for restaurant to be convenient; hence, the menu which is offered should clarify the customers to provide easiness. The waitper-son’s appearance also plays an important role in provid-ing the valuable service to the customers. A favorable
scenario under this facet would be “The waitperson ser-ving you is clean and neat” (Luoh and Tsaur, 2007). The cleanliness of the restaurants is one of the issues that
Evaluating Service Quality of Korean Restaurants
Vol 15, No 1, March 2016, pp.77-91, © 2016 KIIE 79
should be evaluated in the quality of service since the human health plays as the main objective. Since the cus-tomers do not take delivery of only meals and beverages,
but also large component of services, they undoubtedly depend on other cues in the absence of tangibles evidence by which to assess the service quality. Sub-attributes for tangibles includes: (1) creating attractive Korean envi-ronment (T1), (2) showing appearance of Korean nuance (T2), (3) keeping cleanliness of tableware and dining
environment (T3), (4) offering clear and legible menu (T4), and (5) creating pleasant dining atmosphere (T5).
Responsiveness (R) can be defined as a conscious-ness of the employees, chefs, and manager when deliv-ering or serving the food to the customers. It also relates with the aspect of how far the restaurant could resolve a
problem about customers’ concerns and manage com-plaints that customers suggested. The quality of the ser-vice may be enhanced if, for example, employees have knowledge about the meals which are being served, or if employees respond enthusiastically to a customer’s re-quest for service. The employees also must have a will-
ingness whenever help is needed, listening the custom-ers complaints and come up with solutions through the needs of customers. In sum, its sub-attributes are: (1) providing enthusiastic service (RES1), (2) possessing Korean cuisine knowledge (RES2), (3) showing ability to deal with emergencies (RES3), and (4) providing
activity information actively (RES4). Empathy (E), as a third attribute, means caring and
considering personally to customers. Caring means indi-vidualized customer service and attention to customers and focus on understanding needs of customers, perhaps by adhering to special dietary requirements, or being
sympathetic towards customers’ problems (Lee and Hing, 1995). This attribute includes: (1) displaying positive concern for individual customers (E1), (2) providing meticulous service (E2), (3) having flexible rules with customers (E3), and (4) considering customers’ requests in advance (E4).
Assurance (A) can be described as employee’s ex-perience, attitude, and ability to bring the trust and belief. The customers should be able to believe in the recom-mendations of employee, feel confident that food is free from contamination and be able to say any concern without fear. Because customers feel dependent to ser-
vice providers psychologically, courtesy of the employee is important for the confidence of the customers. Com-munication, such as the transfer of information between employee and customers, the degree of interaction, and the level of two-way communication, is critical in assur-ance attribute. Communication manner, the attitude of
employee in the service setting communicated with a customer is also a common point of discussions. Sub-attributes belong to this attribute are: (1) displaying good communication manners (A1), (2) having well-trained employees (A2), (3) exhibiting capability of answering customer’s questions (A3), and (4) offering customers a
sense of security (A4).
Reliability (L) means ability to give reliable and accurate offer that had been given. Accuracy presents information about service, such as the menu and bills, in
a clear and concise way. It also may involve reserva-tions of tables, adherence to customer requests regarding the preparation of menu items and accurate billing (Lee and Hing, 1995). Reliable employee is the one who al-ways get the menu correctly based on customers’ orders. Its includes: (1) delivering guaranteed and timely ser-
vice (REL1), (2) presenting correct bills (REL2), (3) maintaining and cleaning the environment and facilities regularly (REL3), and (4) serving tasty food that meets customers’ demand (REL4).
Finally, innovation (I) can be considered as what restaurant can give to customers in case of food varia-
tion and new method of service. The food variation re-lates with taste, aesthetic, appearance, and price. The new method refers to the way of employee delivering the menu and the way of manager offering special pro-motion to the customers. The sub-attributes are: (1) of-fering innovative menu (I1), (2) providing customized
services (I2), and (3) offering innovative activities (I3). The objective of this research is set to find out the
best service quality performance of Korean restaurant in Semarang, Indonesia. Seoul Palace, Kobe Garden, Chung Gi Wa, Dae Jang Geum, and Gang Gang Sullai are se-lected because they are the leader in the field of provid-
ing Korean cuisine in Semarang and also have great reputations. Seoul Palace which was founded 24 years ago is the first Korean restaurant in Semarang and well known as one of the best Korean cuisine providers in this area. In order to make the taste alike with the origi-nal dish, the owner even did a research prior to the
country of origin before opening the restaurant. It is easy to find the restaurant since it is located in the center of the city. Kobe Garden was founded in 1998 by Sema-rang native family and located on Bukit Raya Street, in the heart of a populated upper-middle-class neighbor-hood. The concept was simply to create a cozy envi-
ronment that was well suited to have a great gathering. The restaurant uses organic rice to serve the customers since it is concerned with health, in which Korean food is known for its healthy food. Chung Gi Wa is the youngest Korean restaurant among others, which is founded on August 2014. First established in Jakarta, the capital city
of Indonesia, the restaurant offers the most various bar-becue menu in wood-made interior design. Dae Jang Geum is located in the luxurious neighborhood, along with fancy restaurants and five stars hotels. The nuance of Korea of the interior design makes the customers believe that they are in the actual Korean restaurant.
Gang Gang Sullai offers all-you-can-eat meals so that customers only pay uniform bills.
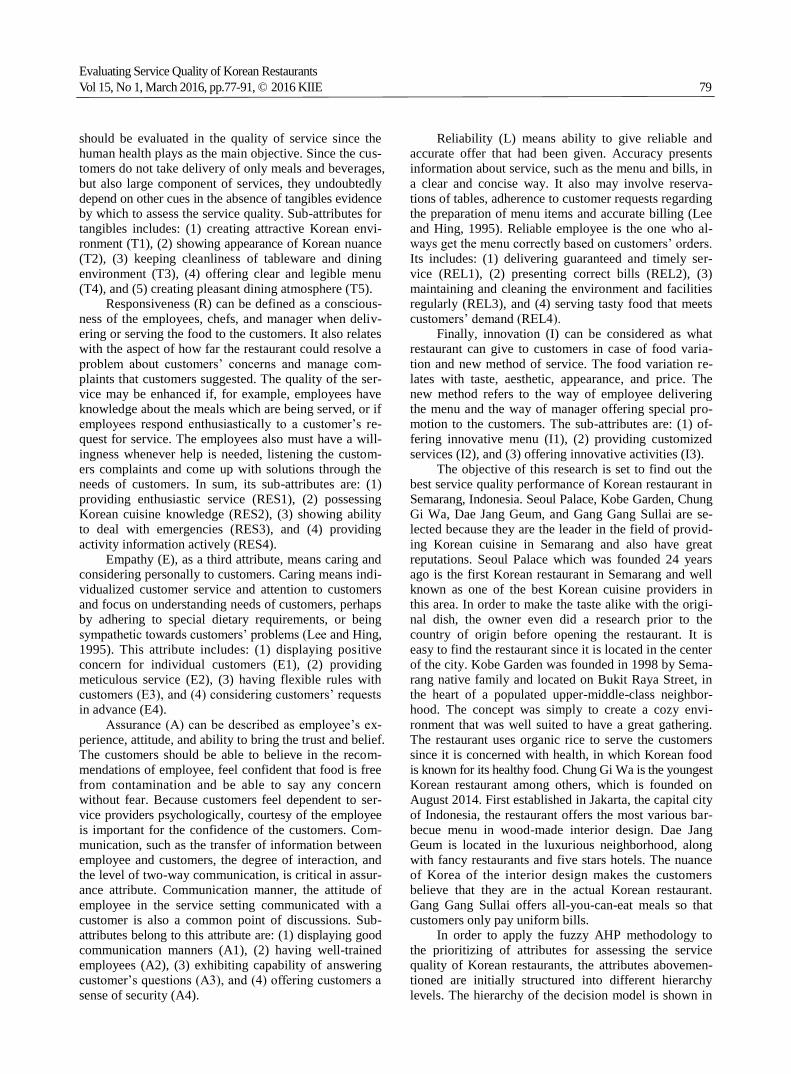
In order to apply the fuzzy AHP methodology to the prioritizing of attributes for assessing the service quality of Korean restaurants, the attributes abovemen-tioned are initially structured into different hierarchy
levels. The hierarchy of the decision model is shown in
Mujiya Ulkhaq, Nartadhi, and Akshinta: Industrial Engineering & Management Systems
Vol 15, No 1, March 2016, pp.77-91, © 2016 KIIE 80
Figure 1, where the goal is to find out the best service quality performance of Korean restaurant in Semarang. This hierarchy of attributes is the subject of a pairwise
comparison of the fuzzy AHP. Data are collected from five experts who are very fond of Korean cuisine and have abundant experiences in visiting Korean restau-rants in Semarang. The decision makers are asked to compare the elements, i.e. sub-attributes, on a pairwise basis in order to estimate their relative importance in
relation to the element at the immediately preceding level, i.e. the attributes. A nine-point scale questionnaire which is attached in Appendix, is used to show the decision makers’ judgment between options as equally, moder-ately, strongly, very strongly, and extremely favorable (or unfavorable). The theory of fuzzy AHP that is used
in this study is briefly described in the following section.
3. FUZZY AHP
This study employed the fuzzy AHP approach to evaluate the service quality of Korean restaurants. To be simple, the fuzzy AHP approach extends the AHP by Saaty (1980) by combining it with the fuzzy set theory by Zadeh (1965). AHP is primarily applied in decision-
making problems with multiple attributes, usually con-flicting, and with uncertain results. Basically, decision makers have to decompose the goal of the decision pro-cess into its attributes (and sub-attributes if any) and alternatives, in ordered hierarchy. Once the hierarchy has been structured, the decision makers evaluate the
importance of each attribute in pairwise comparisons, structured in matrices. The final scoring is on a relative basis, comparing the importance of one decision alterna-
tive to another. AHP also offers a mechanism for check-ing the consistency of the evaluations made by the deci-sion makers. The information and priority weights of
elements can be obtained using direct questioning or a questionnaire method. AHP is very popular has been used in solving many MCDM problems due to its nu-merous advantages. Several researches that used AHP are attributed here: Badri (2001), Chan and Chan (2004), Hou and Su (2007), Lee and Kozar (2006), Liu and Hai
(2007). Regardless of its some advantages, AHP has been
critiqued for some reasons. It does not completely cap-
ture the importance of qualitative aspects because its
discrete scale cannot reflect the human thinking style. In
AHP, human’s judgments are represented as precise
number, however, when the preferences of the decision
makers are affected by uncertainty and imprecision, it is
not reasonable to use definite and precise numbers to
represent linguistic judgments (Chan and Kumar, 2007;
Kwong and Bai, 2003). In order to deal with ambiguity,
the fuzzy logic (Zadeh, 1965) is integrated into AHP to
give rise to the fuzzy AHP approach.
Fuzzy set theory is designed to model the human cognitive processes’ imprecision or vagueness. The key idea is that an element has a degree of membership in a fuzzy set (Zimmermann, 2001). It has the advantage of represent vagueness and provide formalized tools for
dealing with the imprecision intrinsic to many problems. Fuzzy AHP converts linguistic judgments in triangular fuzzy numbers (TFNs) in fuzzy pairwise comparison matrices. These matrices are then processed to obtain the relative weights of attributes and the ranking of such alternatives. Several theoretical results have been pre-
sented as the application of fuzzy set theory in AHP, see
Tangibles
T1
T2
T3
T4
T5
Responsiveness
RES1
RES2
RES3
RES4
Empathy
E1
E2
E3
E4
Assurance
A1
A2
A3
A4
Reliability
REL1
REL2
REL3
REL4
Innovation
I1
I2
I3
Seoul Palace Kobe Garden Chung Gi WaLevel 4: Alternatives
Dae Jang Geum Gang Gang Sullai
Level 2: Attributes
Level 3: Sub-attributes
Level 1: Overall ObjectiveTo find out best service quality performance
of Korean restaurant in Semarang
Figure 1. The evaluation framework of the Korean restaurants service quality model.
Evaluating Service Quality of Korean Restaurants
Vol 15, No 1, March 2016, pp.77-91, © 2016 KIIE 81
for example: Bilsel et al. (2006), Büyüközkan et al. (2011), Büyüközkan and Ç ifçi (2012), Chamodrakas et al. (2010), Calabrese et al. (2013), Dura’n and Aguilo (2008), Ho
et al. (2012), Huang et al. (2008), Hsu et al. (2007), Kang and Lee (2007), Liu and Lai (2009).
There are various fuzzy AHP methods proposed by numerous authors to handle the comparison matrices (Buckley, 1985; Chang, 1996; Custora and Buckley, 2001; Lee, 2010; Wang and Chin, 2006). Among them, Chang’s
method (1996) is widely used, also in this study, due to its implementation simplicity to calculate relative weights.
3.1 Triangular Fuzzy Numbers
Definition 1. Let RFM be called a fuzzy number if exists Rx 0 such that 10 xM ; and for any 1,0 ,
axxA A
, is a closed interval. F(R) is repre-sented all fuzzy number sets and R is the set of real
numbers. Definition 2. A triangular fuzzy number is denoted as M = (l, m, u) if its membership function 1,0: RxM is equal to:
otherwise,
,,
,,
,0
,
,
umx
mlx
um
u
um
xlm
l
lm
x
xM (1)
where l ≤ m ≤ u, l and u are lower and upper value of the support of M respectively, as well as m is the mid-value of M. The support of M is the set of elements x R l
.x u Therefore, when l = m = u, it is a non-fuzzy number by convention. In this study, first linguistic terms are used to represent the decision makers’ assessments,
and then triangular fuzzy numbers are used for evalua-tions, which are shown in Table 1.
Let two triangular fuzzy numbers M1 and M2 where M1 = (l1, m1, u1) and M2 = (l2, m2, u2), the main opera-tional laws are as follows (Chang, 1996):
Equally Moderately Strongly Very Strongly Extremely
1
0
0.5
1 2 3 4 5 6 7 8 9
M1 M9M2 M3
M4 M5M6 M7 M8
( )M x
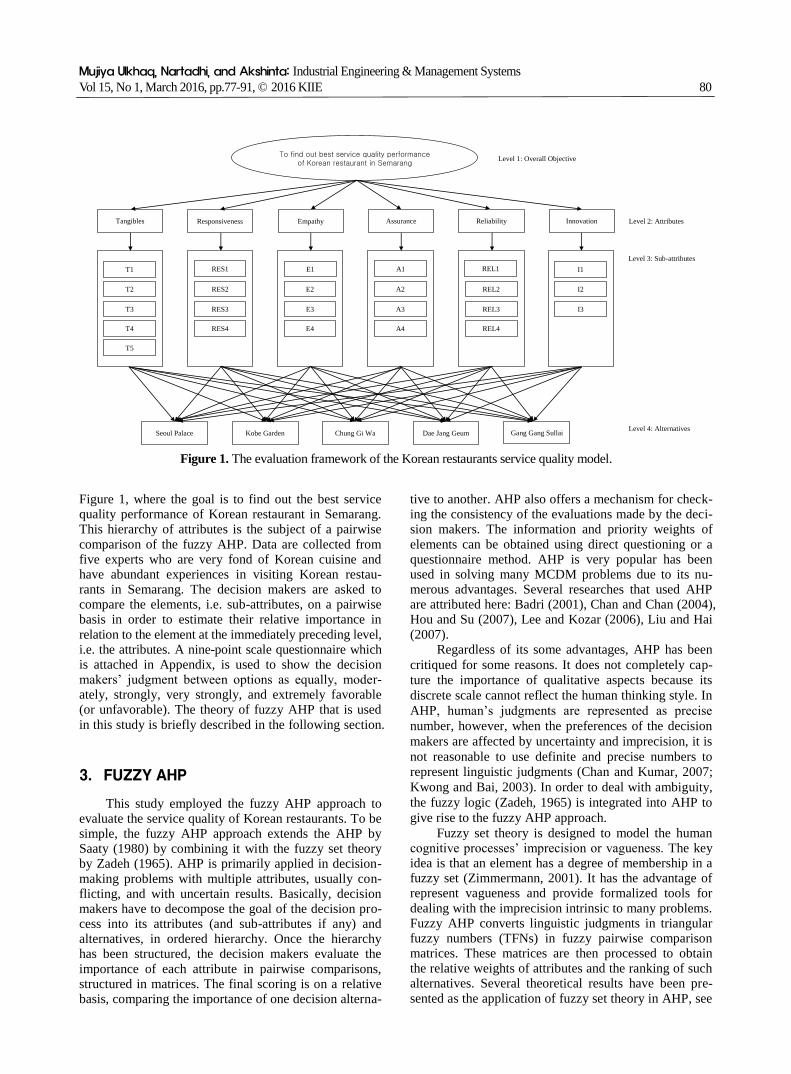
Figure 2. The membership functions of the triangular
numbers.
1. .,,,,,, 212121222111 uummllumluml (2)
2. .,,,,,, 212121222111 uummllumluml (3)
3. .,0,,,,,,, 111111 Rumluml (4)
4. (l1, m1, u1)-1
≈ (1/u1, 1/m1, 1/l1). (5)
3.2 Fuzzy Representation of an Assessment in a Pairwise Comparison
Let triangular numbers M1, M3, M5, M7, and M9 are used to represent the assessment from “equally” to “ex-tremely preferred”; and M2, M4, M6, and M8 are as the middle values. Figure 2 shows the membership func-tions of the triangular fuzzy numbers Mt = (lt, mt, ut)
where t = 1, 2, …, 9 and where lt, mt, and ut are the lower, middle, and upper values of the fuzzy number Mt
respectively. δ represents a fuzzy degree of judgment where ut-lt = lt-ut = δ. A larger value of δ implies a higher fuzzy degree of judgment. When δ = 0, the judgment is a non-fuzzy number. Zhu et al. (1999) showed that δ
should be larger than or equal to one-half. In this study, the value δ was set to be one.
3.3 Value of Fuzzy Synthetic Extent
Let X = {x1, x2, …, xn} be an object set and U = {u1, u2, …, un} be a goal set. Based on the extent analy-
Table 1. Triangular fuzzy numbers scale
Linguistic Triangular Fuzzy Number Reciprocal
Same comparison (equal) (1, 1, 1) (1, 1, 1)
Midline (intermediate) (1/2, 1, 3/2) (2/3, 1, 2)
One element is important enough than others (moderately) (1, 3/2, 2) (1/2, 2/3 ,1)
Midline (intermediate) (3/2, 2, 5/2) (2/5, 1/2, 2/3)
One element is strong enough than other (strongly) (2, 5/2, 3) (1/3, 2/5, 1/2)
Midline (intermediate) (5/2, 3, 7/2) (2/7, 1/3, 2/5)
One element is stronger on important aspect than other (very strongly) (3, 7/2, 4) (1/4, 2/7, 1/3)
Midline (intermediate) (7/2, 4, 9/2) (2/9, 1/4, 2/7)
One element is absolute stronger than other (extremely strong) (4, 9/2, 9/2) (2/9, 2/9, 1/4)
Mujiya Ulkhaq, Nartadhi, and Akshinta: Industrial Engineering & Management Systems
Vol 15, No 1, March 2016, pp.77-91, © 2016 KIIE 82
sis method, each object could be taken to perform extent analysis for each goal respectively. Then the m extent analysis values for each object can be found with the
following signs:
,,,, 21 mggg iii
MMM I = 1, 2, …, n, (6)
where , , ,i i i i
j j j jg g g g
M l m u j = 1, 2, …, m are triangu-
lar fuzzy numbers.
Definition 3. Let
nggg iii
MMM ,,, 21 be the values of ex-tent analysis of i-th object for m goals, then the value of fuzzy synthetic extent with respect to the i-th object is defined as (Chang, 1996):
1
1 1 1i i
m n mj j
i g gj i j
S M M
(7)
3.4 Weight Vector
In order to obtain the estimates for the vectors of
weights under each attribute, a principle of comparison for fuzzy numbers has to be taken into consideration.
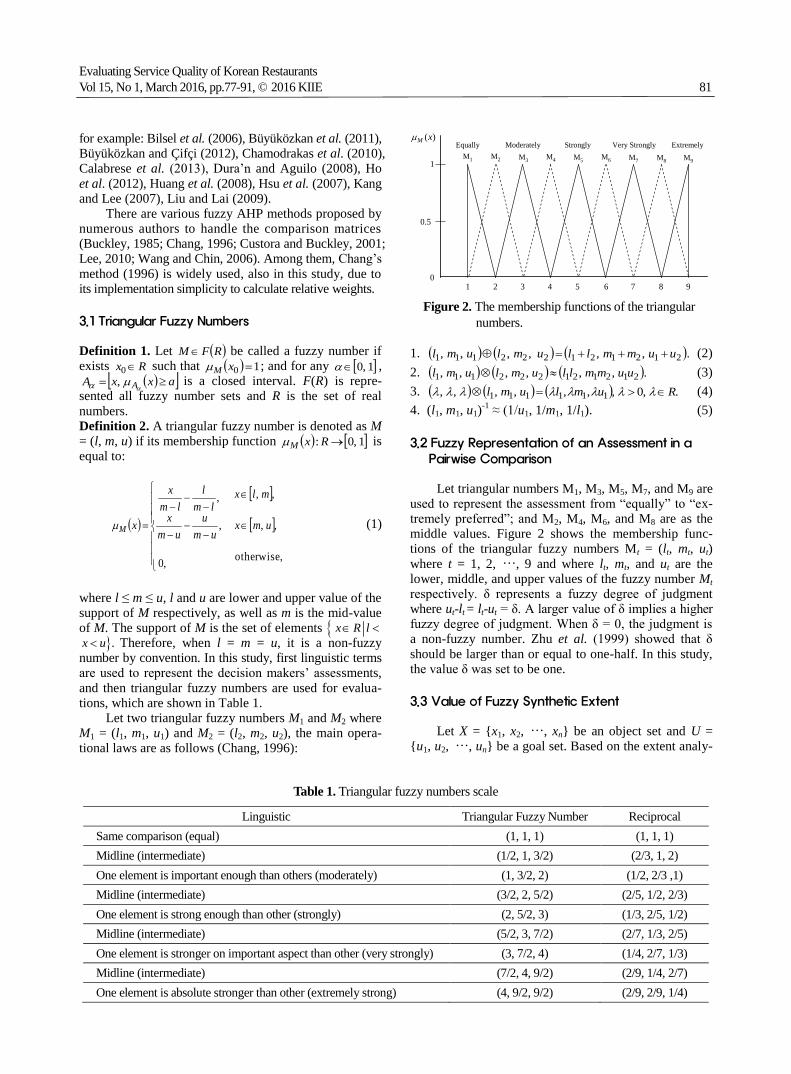
Definition 4. Let M1 and M2 are two triangular fuzzy numbers that are denoted by (l1, m1, u1) and (l2, m2, u2) respectively, then the degree of possibility of M1 ≥ M2 is
defined as
yxVyx
2MM21 ,minsupMM1
(8)
When a pair (x, y) exists such that x ≥ y and
1M x
2M 1,y then:
1MM 21 V , iffm1 ≥ m2. (9)
Ifm1 ≤ m2, let V(M1 ≥ M2) = hgt(M1∩M2). Then
2 1
2 11 1 2 21 2
, , M M
otherwise,0,
l ul u
m u m lV d
(10)
Where d is the abscissa of the highest intersection point D between M1 and M2 (see Figure 3).
Definition 5. The degree of possibility for a fuzzy num-ber to be greater than k fuzzy numbers Mi (i = 1, 2, …, k) can be defined as
.MMminM,,M,MM 21 ik VV (11)
Assume that
d '(Ai) = min V(Si ≥ Sk), (12)
where Ai is the i-th element of the k-th level for k = 1, 2,
…, n; k ≠ i. The number of elements in the k-th level is n. Then the weight vector of the k-th level is obtained as follows:
W' = (d`(A1), d`(A2), …, d`(An))T. (13)
After normalization, the normalized weight vector is
W = (d(A1), d(A2), …, d(An))T, (14)
where W is non-fuzzy number.
4. CASE STUDY
4.1 Step-by-S tep
The following is the application of fuzzy AHP to
evaluate the service quality of Korean restaurants in Se-
marang. The fuzzy AHP approach was employed to choose
the best Korean restaurants based on the aforementioned
attributes. First, the decision makers filled the pairwise
comparison to express their preferences between the al-
ternatives, attributes, and sub-attributes in a nine-point
scale questionnaire. Their answers were then transformed
into triangular fuzzy numbers. If a decision maker con-
sider that attribute i is moderately important as com-
pared with the attribute j, then the triangular fuzzy num-
ber used is (1, 3/2, 2). On the other hand, if attribute j is
believed to be less moderately important than attribute i,
the pairwise comparison between j and I could be pre-
sented by using its reciprocal: (1/2, 2/3, 1). To be simple,
the example of the fuzzy number of the pairwise com-
parison for “innovation” attribute to select the best sub-
attributes is given in Table 2. A fuzzy judgment matrix
for this comparison is given as follows:
1M1 M2
D
l1 l2m1 m2u2u1
d
0
V(M1≥M2)
Figure 3. Interpretation of the location of d.
Evaluating Service Quality of Korean Restaurants
Vol 15, No 1, March 2016, pp.77-91, © 2016 KIIE 83
.
1 1, 1,4.5 2,0.67,1 0.65, 0.22,
,1.5 0.65 0.22,1 1, 1,2.5 0.72, 0.22,
4.5 2, 1,4.5 2.3, 0.4,1 1, 1,
I3
I2
I1
I3I2I1
I
The values of each entry of matrix I can be ob-
tained by (Chen, 2004):
jg
jg
jgij
iiiumlI max,average,min .
The value of fuzzy synthetic extent can be obtained
using Eq. (7). For “innovation” attribute, the values of
fuzzy synthetic extent can be obtained as follows:
I1
1 1 12.4, 5.3, 10 , ,
21.50 11.32 5.73S
0.112, 0.468, 0.1745 ,
I2
1 1 11.44, 2.37, 5 , ,
21.50 11.32 5.73S
0.067, 0.209, 0.873 ,
I3
1 1 11.89, 3.65, 6.5 , ,
21.50 11.32 5.73S
0.088, 0.323, 1.134 .
To obtain the vector of weight, Eq. (9) and Eq. (10)
are used. The calculation of weight vector for “innova-
tion” attribute is given as follows:
1SS 2I1I V ,
1SS 3I1I V ,
874.0088.0323.0873.0209.0
873.0088.0SS 3I2I
V ,
746.0112.0468.0873.0209.0
873.0112.0SS 1I2I
V ,
875.0112.0468.0134.1323.0
134.1112.0SS 1I3I
V ,
1SS 2I3I V .
Finally, by using Eq. (12) the normalized weight
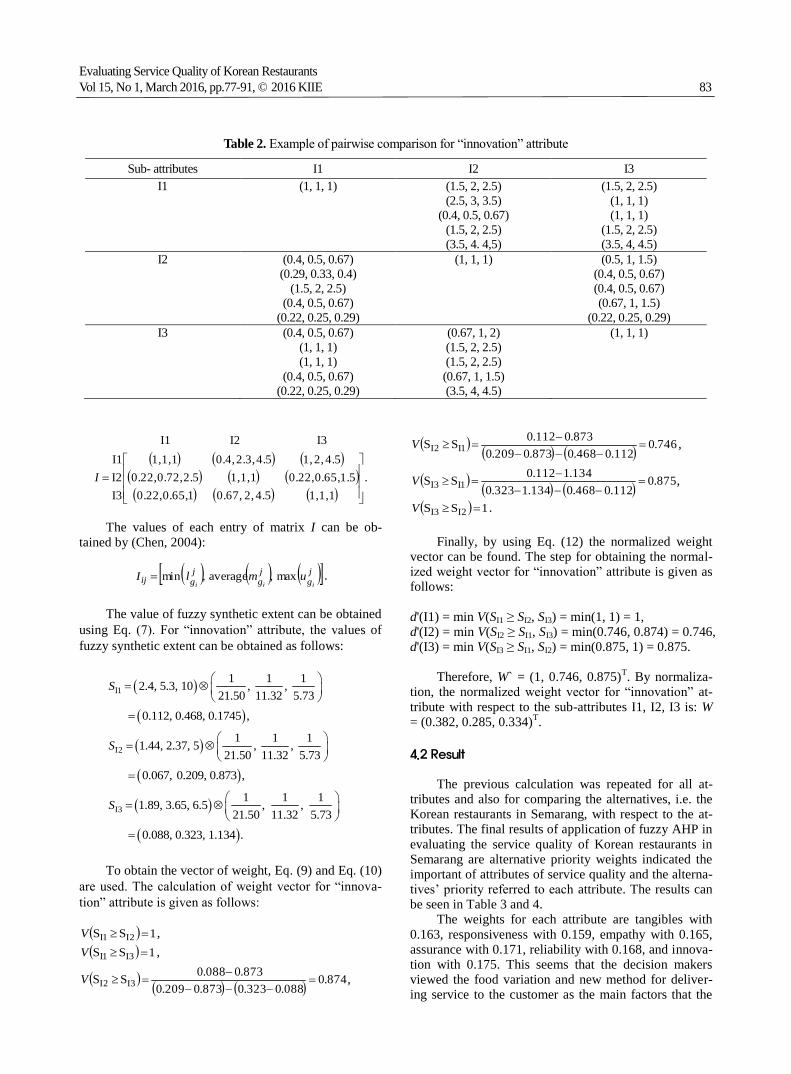
vector can be found. The step for obtaining the normal-ized weight vector for “innovation” attribute is given as follows:
d'(I1) = min V(SI1 ≥ SI2, SI3) = min(1, 1) = 1, d'(I2) = min V(SI2 ≥ SI1, SI3) = min(0.746, 0.874) = 0.746, d'(I3) = min V(SI3 ≥ SI1, SI2) = min(0.875, 1) = 0.875.
Therefore, W` = (1, 0.746, 0.875)
T. By normaliza-
tion, the normalized weight vector for “innovation” at-
tribute with respect to the sub-attributes I1, I2, I3 is: W = (0.382, 0.285, 0.334)
T.
4.2 Result
The previous calculation was repeated for all at-tributes and also for comparing the alternatives, i.e. the Korean restaurants in Semarang, with respect to the at-tributes. The final results of application of fuzzy AHP in
evaluating the service quality of Korean restaurants in Semarang are alternative priority weights indicated the important of attributes of service quality and the alterna-tives’ priority referred to each attribute. The results can be seen in Table 3 and 4.
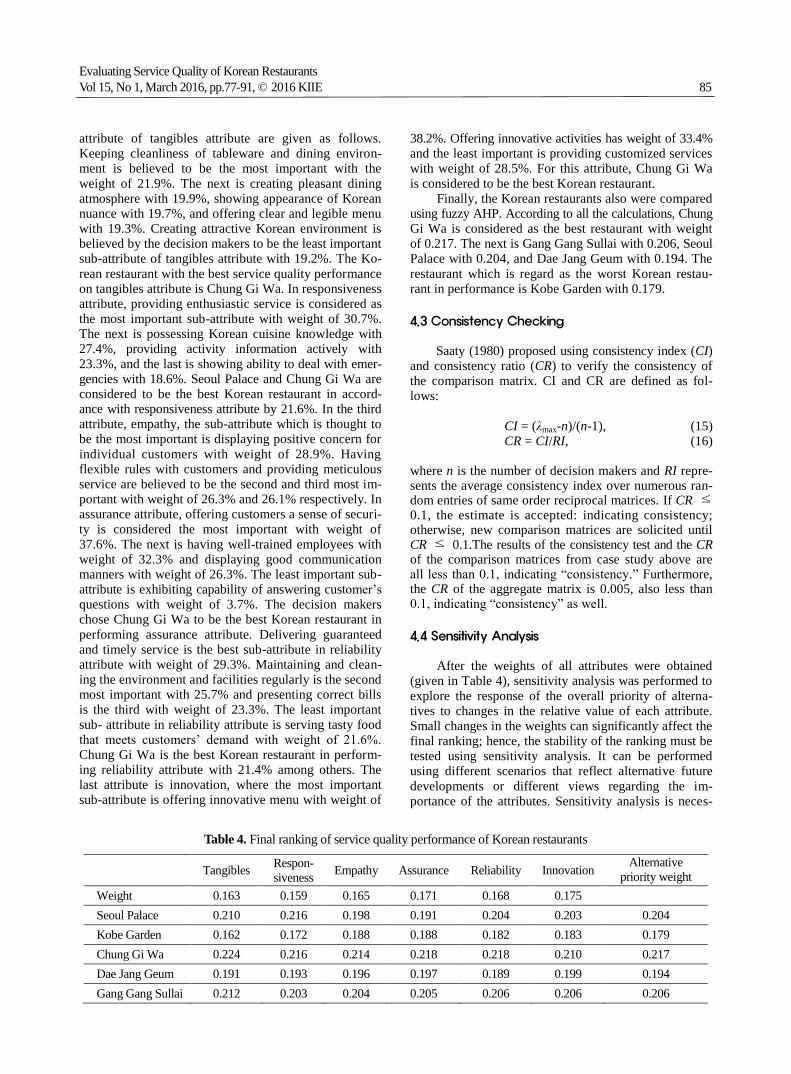
The weights for each attribute are tangibles with
0.163, responsiveness with 0.159, empathy with 0.165, assurance with 0.171, reliability with 0.168, and innova-tion with 0.175. This seems that the decision makers viewed the food variation and new method for deliver-ing service to the customer as the main factors that the
Table 2. Example of pairwise comparison for “innovation” attribute
Sub- attributes I1 I2 I3
I1
(1, 1, 1)
(1.5, 2, 2.5)
(2.5, 3, 3.5)
(0.4, 0.5, 0.67)
(1.5, 2, 2.5)
(3.5, 4. 4,5)
(1.5, 2, 2.5)
(1, 1, 1)
(1, 1, 1)
(1.5, 2, 2.5)
(3.5, 4, 4.5)
I2
(0.4, 0.5, 0.67)
(0.29, 0.33, 0.4)
(1.5, 2, 2.5)
(0.4, 0.5, 0.67)
(0.22, 0.25, 0.29)
(1, 1, 1)
(0.5, 1, 1.5)
(0.4, 0.5, 0.67)
(0.4, 0.5, 0.67)
(0.67, 1, 1.5)
(0.22, 0.25, 0.29)
I3
(0.4, 0.5, 0.67)
(1, 1, 1)
(1, 1, 1)
(0.4, 0.5, 0.67)
(0.22, 0.25, 0.29)
(0.67, 1, 2)
(1.5, 2, 2.5)
(1.5, 2, 2.5)
(0.67, 1, 1.5)
(3.5, 4, 4.5)
(1, 1, 1)

Mujiya Ulkhaq, Nartadhi, and Akshinta: Industrial Engineering & Management Systems
Vol 15, No 1, March 2016, pp.77-91, © 2016 KIIE 84
restaurants have to manage to win a competition among their competitors. Afterwards, employee’s experience, attitude, and ability to bring the trust to the customers is
less important and next is giving reliable and accurate offer to the customers. Restaurant’s physical appearance, equipment, and cleanliness is considered less important
than caring or individualized customer service. The least important attribute in evaluating the service quality of Korean restaurants is responsiveness, which is the con-
sciousness of the restaurants’ employee and manager when delivering the service to the customers.
As can be seen from Table 3, the weights for sub-
Table 3. Summary of alternative priority weights for each attribute
Tangibles T1 T2 T3 T4 T5 Alternative Priority Weight
Weight 0.192 0.197 0.219 0.193 0.199
Seoul Palace 0.203 0.219 0.210 0.208 0.209 0.210
Kobe Garden 0.147 0.163 0.159 0.155 0.184 0.162
Chung Gi Wa 0.237 0.224 0.228 0.219 0.214 0.224
Dae Jang Geum 0.177 0.181 0.203 0.206 0.187 0.191
Gang Gang Sullai 0.235 0.212 0.200 0.211 0.206 0.212
Responsiveness RES1 RES2 RES3 RES4 Alternative Priority Weight
Weight 0.307 0.274 0.186 0.233
Seoul Palace 0.217 0.207 0.209 0.231 0.216
Kobe Garden 0.168 0.179 0.177 0.166 0.172
Chung Gi Wa 0.219 0.212 0.217 0.216 0.216
Dae Jang Geum 0.195 0.192 0.193 0.190 0.193
Gang Gang Sullai 0.201 0.209 0.205 0.197 0.203
Empathy E1 E2 E3 E4 Alternative Priority Weight
Weight 0.289 0.261 0.263 0.186
Seoul Palace 0.204 0.210 0.201 0.204 0.204
Kobe Garden 0.181 0.182 0.183 0.180 0.182
Chung Gi Wa 0.219 0.214 0.214 0.228 0.218
Dae Jang Geum 0.195 0.189 0.193 0.178 0.189
Gang Gang Sullai 0.202 0.205 0.208 0.210 0.206
Assurance A1 A2 A3 A4 Alternative Priority Weight
Weight 0.263 0.323 0.037 0.376
Seoul Palace 0.204 0.187 0.203 0.185 0.191
Kobe Garden 0.177 0.195 0.179 0.192 0.188
Chung Gi Wa 0.213 0.215 0.213 0.225 0.218
Dae Jang Geum 0.201 0.199 0.194 0.192 0.197
Gang Gang Sullai 0.205 0.205 0.211 0.206 0.205
Reliability REL1 REL2 REL3 REL4 Alternative Priority Weight
Weight 0.293 0.233 0.257 0.216
Seoul Palace 0.191 0.207 0.187 0.211 0.198
Kobe Garden 0.184 0.194 0.193 0.180 0.188
Chung Gi Wa 0.213 0.211 0.203 0.231 0.214
Dae Jang Geum 0.199 0.194 0.207 0.181 0.196
Gang Gang Sullai 0.214 0.194 0.210 0.196 0.204
Innovation I1 I2 I3 Alternative Priority Weight
Weight 0.382 0.285 0.334
Seoul Palace 0.201 0.208 0.202 0.203
Kobe Garden 0.192 0.172 0.180 0.183
Chung GiWa 0.203 0.218 0.210 0.210
Dae Jang Geum 0.202 0.196 0.197 0.199
Gang Gang Sullai 0.203 0.206 0.210 0.206
Evaluating Service Quality of Korean Restaurants
Vol 15, No 1, March 2016, pp.77-91, © 2016 KIIE 85
attribute of tangibles attribute are given as follows. Keeping cleanliness of tableware and dining environ-ment is believed to be the most important with the
weight of 21.9%. The next is creating pleasant dining atmosphere with 19.9%, showing appearance of Korean nuance with 19.7%, and offering clear and legible menu with 19.3%. Creating attractive Korean environment is believed by the decision makers to be the least important sub-attribute of tangibles attribute with 19.2%. The Ko-
rean restaurant with the best service quality performance on tangibles attribute is Chung Gi Wa. In responsiveness attribute, providing enthusiastic service is considered as the most important sub-attribute with weight of 30.7%. The next is possessing Korean cuisine knowledge with 27.4%, providing activity information actively with
23.3%, and the last is showing ability to deal with emer-gencies with 18.6%. Seoul Palace and Chung Gi Wa are considered to be the best Korean restaurant in accord-ance with responsiveness attribute by 21.6%. In the third attribute, empathy, the sub-attribute which is thought to be the most important is displaying positive concern for
individual customers with weight of 28.9%. Having flexible rules with customers and providing meticulous service are believed to be the second and third most im-portant with weight of 26.3% and 26.1% respectively. In assurance attribute, offering customers a sense of securi-ty is considered the most important with weight of
37.6%. The next is having well-trained employees with weight of 32.3% and displaying good communication manners with weight of 26.3%. The least important sub- attribute is exhibiting capability of answering customer’s questions with weight of 3.7%. The decision makers chose Chung Gi Wa to be the best Korean restaurant in
performing assurance attribute. Delivering guaranteed and timely service is the best sub-attribute in reliability attribute with weight of 29.3%. Maintaining and clean-ing the environment and facilities regularly is the second most important with 25.7% and presenting correct bills is the third with weight of 23.3%. The least important
sub- attribute in reliability attribute is serving tasty food that meets customers’ demand with weight of 21.6%. Chung Gi Wa is the best Korean restaurant in perform-ing reliability attribute with 21.4% among others. The last attribute is innovation, where the most important sub-attribute is offering innovative menu with weight of
38.2%. Offering innovative activities has weight of 33.4% and the least important is providing customized services with weight of 28.5%. For this attribute, Chung Gi Wa
is considered to be the best Korean restaurant. Finally, the Korean restaurants also were compared
using fuzzy AHP. According to all the calculations, Chung Gi Wa is considered as the best restaurant with weight of 0.217. The next is Gang Gang Sullai with 0.206, Seoul Palace with 0.204, and Dae Jang Geum with 0.194. The
restaurant which is regard as the worst Korean restau-rant in performance is Kobe Garden with 0.179.
4.3 Consistency Checking
Saaty (1980) proposed using consistency index (CI) and consistency ratio (CR) to verify the consistency of the comparison matrix. CI and CR are defined as fol-lows:
CI = (λmax-n)/(n-1), (15) CR = CI/RI, (16)
where n is the number of decision makers and RI repre-sents the average consistency index over numerous ran-dom entries of same order reciprocal matrices. If CR ≤ 0.1, the estimate is accepted: indicating consistency; otherwise, new comparison matrices are solicited until CR ≤ 0.1.The results of the consistency test and the CR of the comparison matrices from case study above are all less than 0.1, indicating “consistency.” Furthermore, the CR of the aggregate matrix is 0.005, also less than 0.1, indicating “consistency” as well.
4.4 Sensitivity Analysis
After the weights of all attributes were obtained (given in Table 4), sensitivity analysis was performed to
explore the response of the overall priority of alterna-tives to changes in the relative value of each attribute. Small changes in the weights can significantly affect the final ranking; hence, the stability of the ranking must be tested using sensitivity analysis. It can be performed using different scenarios that reflect alternative future
developments or different views regarding the im-portance of the attributes. Sensitivity analysis is neces-
Table 4. Final ranking of service quality performance of Korean restaurants
Tangibles Respon-
siveness Empathy Assurance Reliability Innovation
Alternative
priority weight
Weight 0.163 0.159 0.165 0.171 0.168 0.175
Seoul Palace 0.210 0.216 0.198 0.191 0.204 0.203 0.204
Kobe Garden 0.162 0.172 0.188 0.188 0.182 0.183 0.179
Chung Gi Wa 0.224 0.216 0.214 0.218 0.218 0.210 0.217
Dae Jang Geum 0.191 0.193 0.196 0.197 0.189 0.199 0.194
Gang Gang Sullai 0.212 0.203 0.204 0.205 0.206 0.206 0.206

Mujiya Ulkhaq, Nartadhi, and Akshinta: Industrial Engineering & Management Systems
Vol 15, No 1, March 2016, pp.77-91, © 2016 KIIE 86
sary because changing the importance of attribute re-quires various levels of six different attributes with re-spect to evaluating the synthesis value of the five Kore-
an restaurants. Decreasing or increasing the weights of each attribute can view the resulting changes in the weights of the alternatives and their rankings. If the rank-ing is highly sensitive to small changes in the weights of the attributes, careful analysis must be presented. The weights of the attribute were adjusted separately, simu-
lating the weights between 0% and 100%. However, the weights of other attributes also alter accordingly, subject
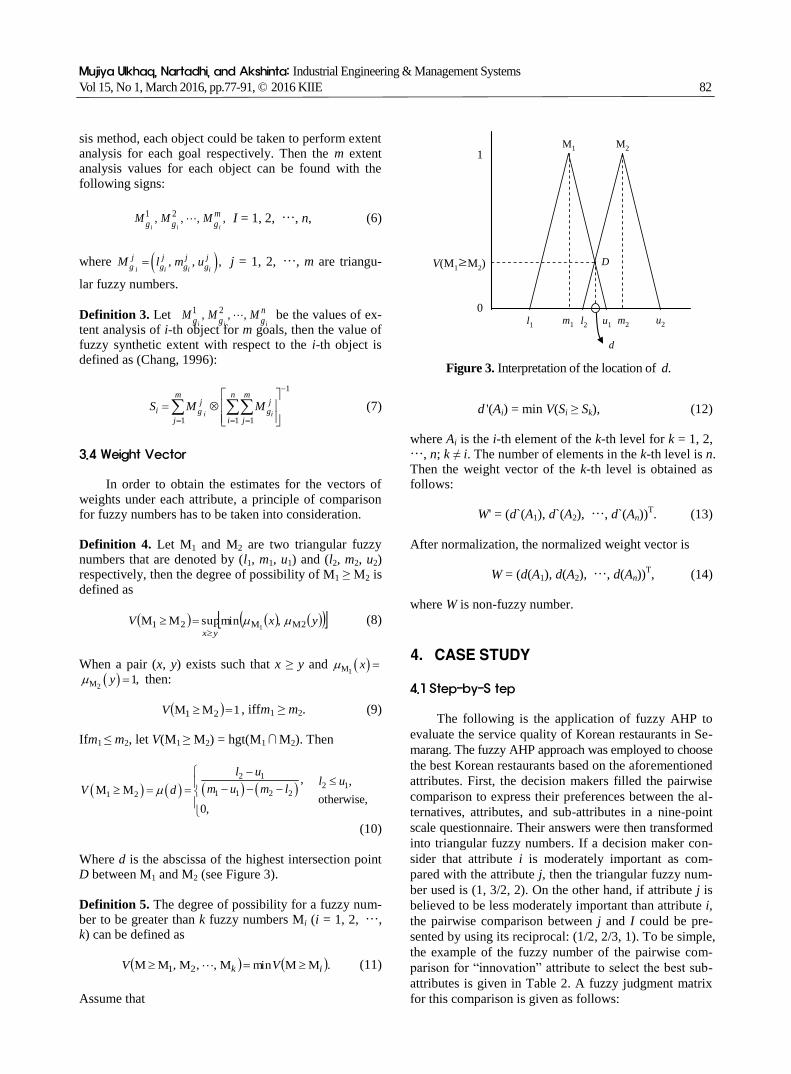
to the total weights of 100%. The performance graph that is depicted in Figure 4
shows how the Korean restaurants perform with respect
to the change in scenario for various parameters. Per-formance sensitivity of alternatives is analyzed when all attributes are increased from their current level by 10%, 25%, and 50%. Increasing tangibles (T) by 10% in-creases the global weight of Kobe Garden decreases from 0.179 to 0.086. Moreover, increasing T by 25%
would decrease the weight of Kobe Garden to 0.085, and if it is increased by 30%, the weight decreases again
Tanglble ReliabilityResponsivene Assurance
EmpathyInnovation
OVERALL
.00
Alt%
.10
.20
.30
.40
Cung GI Wa
Gang Gang Sullal
Kobe Garden
Seoul Palace
Dae Jang Geum
Obj%
.90
.80
.70
.60
.50
.40
.30
.20
.10
.00
Figure 4. Performance sensitivity of alternatives.
Table 5. The results of sensitivity analysis
Seoul Palace
(Rank/Weight) Kobe Garden
(Rank/Weight)
Chung Gi Wa
(Rank/Weight)
Dae Jang Geum
(Rank/Weight)
Gang Gang Sullai
(Rank/Weight)
Original (3/0.204) (5/0.179) (1/0.217) (4/0.194) (2/0.206)
T is increased by 10% (3/0.206) (5/0.086) (1/0.292) (4/0.163) (2/0.254)
T is increased by 25% (3/0.206) (5/0.085) (1/0.292) (4/0.162) (2/0.254)
T is increased by 50% (3/0.208) (5/0.084) (1/0.294) (4/0.161) (2/0.254)
R is increased by 10% (3/0.208) (5/0.087) (1/0.288) (4/0.164) (2/0.253)
R is increased by 25% (3/0.210) (5/0.087) (1/0.288) (4/0.163) (2/0.252)
R is increased by 50% (3/0.213) (5/0.087) (1/0.287) (4/0.163) (2/0.251)
E is increased by 10% (3/0.202) (5/0.088) (1/0.289) (4/0.166) (2/0.255)
E is increased by 25% (3/0.201) (5/0.088) (1/0.289) (4/0.167) (2/0.255)
E is increased by 50% (3/0.199) (5/0.088) (1/0.288) (4/0.169) (2/0.256)
A is increased by 10% (3/0.203) (5/0.088) (1/0.290) (4/0.164) (2/0.254)
A is increased by 25% (3/0.204) (5/0.088) (1/0.291) (4/0.163) (2/0.254)
A is increased by 50% (3/0.204) (5/0.088) (1/0.293) (4/0.161) (2/0.253)
L is increased by 10% (3/0.202) (5/0.088) (1/0.290) (4/0.166) (2/0.254)
L is increased by 25% (3/0.201) (5/0.088) (1/0.291) (4/0.166) (2/0.253)
L is increased by 50% (3/0.199) (5/0.089) (1/0.293) (4/0.167) (2/0.252)
I is increased by 10% (3/0.204) (5/0.089) (1/0.288) (4/0.165) (2/0.254)
I is increased by 25% (3/0.204) (5/0.089) (1/0.286) (4/0.166) (2/0.255)
I is increased by 50% (3/0.205) (5/0.091) (1/0.283) (4/0.166) (2/0.256)
Evaluating Service Quality of Korean Restaurants
Vol 15, No 1, March 2016, pp.77-91, © 2016 KIIE 87
to 0.084. Overall, when the weight of tangible is in-creasing, the global weight of Seoul Palace and Chung Gi Wa are increasing, while the global weight of Kobe
Garden, Dae Jang Geum, and Gang Gang Sullai are de-creasing. When the responsiveness (R) is increased by 10%, the global weight of Dae Jang Geum decreases from 0.194 to 0.164; and it is increased by 25%, the weight of Dae Jang Geum decreases to 0.163, and also when the responsiveness is increased by 50%. Increas-
ing empathy (E) by 10%, the global weight of Seoul Palace would decrease to 0.202. When the empathy is increased by 25%, the global weight of Seoul Palace would decrease as well to 0.201. Table 5 lists all of re-sults of changing the attributes of five Korean restau-rants. The previous situation demonstrates the conclu-
sion of the sensitivity analysis. Regardless of how tangi-bles, responsiveness, empathy, assurance, reliability, and innovation are changed, the estimated ranking remains unchanged. It indicates that the ranking of the alterna-tives are not sensitive with the small changing of the weights of the attributes.
5. CONCLUSION AND FUTURE RESEARCH DIRECTION
The study aims to develop a model to evaluate the service quality of the Korean restaurants in Semarang. Data are collected from five experts who frequently visit Korean restaurants in the city and have affection in Ko-rean cuisine. The result of this research as depicted in Table 3 and 4 show that Korean restaurants should focus more on innovation, assurance, and reliability aspects to perform satisfactory service. The ranking of the Korean restaurants in performance based on the calculations is: Chung Gi Wa (21.7%), Gang Gang Sullai (20.6%), Seoul Palace (20.4%), Dae Jang Geum (19.4%), and Kobe Garden (17.9%). It does not mean that the Chung Gi Wa has a gorgeous service with the others. In fact, other restaurants should improve their service quality consid-ering these attributes. The findings can provide Korean restaurants’ managers with valuable insights into the attributes that reflects customers’ service quality percep-tions.
There can be other method to evaluate the service
quality of restaurants. It is highly recommended to uti-
lize the other tools such as analytic network process
(ANP) by Saaty (1996). ANP can be used if it is sus-
pected that there are interdependent relationships among
attributes. It is more interesting to study when the attrib-
utes are not assumed independent. However, in this
study, the attributes are assumed independent. Another
technique which could be used is technique for order
preference by similarity to ideal solution (TOPSIS) by
Hwang and Yoon (1981). TOPSIS has been modified to
be employed in a fuzzy environment called fuzzy TOP-
SIS. There are many applications of fuzzy TOPSIS in
the literature, such as Dymova et al. (2013), Kannan et
al. (2014), and Roszkowska and Wachowicz (2015).
Further research may be the application of these meth-
ods to evaluate the service quality of restaurants, espe-
cially Korean restaurants and compare the results with
this research. Since this study have developed a new
multiple-item scale for evaluating service quality of res-
taurants, especially for Korean restaurants which have
distinctive characteristics among other ethnic or culture-
based restaurants, validating the scale in other culture-
based restaurants could be the future research as well.
To be more generalized, further research is also needed
to determine whether there are other attributes for eva-
luating the service quality of restaurants, especially for
culture-based restaurants (e.g., China restaurants, French
restaurants, western restaurants), such as price, profes-
sionalism, or the quality of the food.
REFERENCES
Badri, M. A. (2001), A combined AHP-GP model for
quality control systems, International Journal of
Production Economics, 72, 27-40.
Bilsel, R. U., Büyüközkan, G., and Ruan, D. (2006),
Fuzzy preference-ranking model for a quality eva-
luation of hospital web sites, International Journal
of Intelligent Systems, 21, 1181-1197.
Buckley, J. J. (1985), Fuzzy hierarchical analysis, Fuzzy
Sets and Systems, 17, 233-247.
Büyüközkan, G. and Ç ifçi, G. (2012), A combined fuzzy
AHP and fuzzy TOPSIS based strategic analysis of
electronic service quality in healthcare industry,
Expert Systems with Applications, 39, 2341-2354.
Büyüközkan, G., Ç ifçi, G., and Güleryüz, S. (2011), Stra-
tegic analysis of healthcare service quality using
fuzzy AHP methodology, Expert Systems with Ap-
plications, 38, 9407-9424.
Calabrese, A., Costa, R., and Menichini, T. (2013), Us-
ing Fuzzy AHP to manage intellectual capital as-
sets: an application to the ICT service industry, Ex-
pert Systems with Applications, 40, 3747-3755.
Chamodrakas, I., Batis, D., and Martakos, D. (2010),
Supplier selection in electronic marketplaces using
satisficing and fuzzy AHP, Expert Systems with
Applications, 37, 490-498.
Chan, F. T. S. and Chan, H. K. (2004), Development of
the supplier selection model-A case study in the
advanced technology industry, Proceedings of the
Institution of Mechanical Engineers Part B-Journal
of Engineering Manufacture, 218, 1807-1824.
Chan, F. T. S. and Kumar, N. (2007), Global supplier
development considering risk factors using fuzzy
extended AHP-based approach, Omega, 35, 417-431.

Mujiya Ulkhaq, Nartadhi, and Akshinta: Industrial Engineering & Management Systems
Vol 15, No 1, March 2016, pp.77-91, © 2016 KIIE 88
Chang, D. Y. (1996), Applications of the extent analysis
method on fuzzy AHP, European Journal of Oper-
ational Research, 95, 649-655.
Chen, H. H. (2004), A research based on fuzzy AHP for
multi-criteria supplier selection in supply chain,
Master’s Thesis, Department of Industrial Man-
agement, National Taiwan University.
Chin, J. B. and Tsai, C. H. (2013), Developing a service
quality evaluation model for luxurious restaurants
in international hotel chains, Total Quality Man-
agement & Business Excellence, 24, 1160-1173.
Chow, I. H., Lau, V. P., Lo, T. W., Sha, Z., and Yun, H.
(2007), Service quality in restaurant operations in
China: decision- and experiential-oriented perspec-
tives, Hospitality Management, 26, 698-710.
Custora, R. and Buckley, J. J. (2001), Fuzzy hierarchical
analysis: the lambda max method, Fuzzy Sets and
Systems, 120, 181-195.
Dura’n, O. and Aguilo, J. (2008), Computer-aided ma-
chine-tool selection based on a fuzzy-AHP appro-
ach, Expert Systems with Applications, 34, 1787-
1794.
Dymova, L., Sevastjanov, P., and Tikhonenko, A. (2013),
An approach to generalization of fuzzy TOPSIS
method, Information Sciences, 238, 149-162.
Gilbert, G. R. and Veloutsou, C. (2006), A cross-indu-
stry comparison of customer satisfaction, Journal
of Services Marketing, 20, 298-308.
Ho, W., He, T., Lee, C. K. M., and Emrouznejad, A.
(2012), Strategic logistics outsourcing: An inte-
grated QFD and fuzzy AHP approach, Expert Sys-
tems with Applications, 39, 10841-10850.
Hong, J., Park Y., and Shin, J. (2009), A study on the
globalization, commercialization of Korean food
for the 21st century, Journal of Foodservice Man-
agement Society of Korea, 5, 109-125.
Hou, J. and Su, D. (2007), EJB-MVC oriented supplier
selection system for mass customization, Journal of
Manufacturing Technology Management, 18, 54-71.
Hsu, C. Y., Chen, K. T., and Tzeng, G. H. (2007),
FMCDM with fuzzy DEMATEL approach for cus-
tomers’ choice behavior model, International
Journal of Fuzzy Systems, 9, 236-246.
Huang, C. C., Chu, P. Y., and Chiang, H. Y. (2008), A
fuzzy AHP application in government sponsored
R&D project selection, Omega, 36, 1038-1052.
Hwang, C. and Yoon, K. (1981), Multiple Attribute De-
cision Making: Methods and Application, New
York: Springer.
Jang, S., Ha A., and Silkes, C. (2009), Perceived attrib-
utes of Asian foods: from the perspective of the
American customers, International Journal of
Hospitality Management, 28, 63-70.
Kang, H. Y. and Lee, A. H. I. (2007), Priority mix plan-
ning for semiconductor fabrication by fuzzy AHP
ranking, Expert Systems with Applications, 32, 560-
570.
Kannan, D., de Sousa Jabbour, A. B. L., and Jabbour, C.
J. C. (2014), Selecting green suppliers based on
GSCM practices: Using fuzzy TOPSIS applied to a
Brazilian electronics company, European Journal
of Operational Research, 233, 432-447.
Kotler, P. (2003), Marketing Management, (11th ed.),
Prentice Hall, Upper Saddle River, NJ.
Kwong, C. K. and Bai, H. (2003), Determining the im-
portance weights for the customer requirements in
QFD using a Fuzzy AHP with an extent analysis
approach, IIE Transactions, 35, 619-626.
Ladhari, R., Brun, I., and Morales, M. (2008), Determi-
nants of dining satisfaction and post-dining behav-
ioral intentions, International Journal of Hospitali-
ty Management, 27, 563-573.
Lee, S. H. (2010), Using Fuzzy AHP to develop intellec-
tual capital evaluation model for assessing their
performance contribution in a University, Expert
Systems with Applications, 37, 4941-4947.
Lee, Y. and Kozar, K. A. (2006), Investigating the effect
of website quality on e-business success: An ana-
lytic hierarchy process (AHP) approach, Decision
Support Systems, 42, 1383-1401.
Liu, F. H. F. and Hai, H. L. (2005), The voting analytic
hierarchy process method for selecting supplier, In-
ternational Journal of Production Economics, 97,
308-317.
Liu, K. F. R. and Lai, J. H. (2009), Decision-support for
environmental impact assessment: a hybrid appro-
ach using fuzzy logic and fuzzy analytic network
process, Expert Systems with Applications, 36,
5119-5136.
Luo, X. and Homburg, C. (2007), Neglected outcomes
of customer satisfaction, Journal of Marketing, 71,
133-149.
Luoh, H. F. and Tsaur, S. H. (2007), Gender stereotypes
and service quality in customer-waitperson encoun-
ters, Total Quality Management and Business Ex-
cellence, 18, 1035-1054.
Parasuraman, A., Zeithaml, V. A., and Berry, L. L. (1985),
A conceptual model of service quality and its im-
plications for future research, Journal of Marketing,
49, 41-50.
Roszkowska, E. and Wachowicz, T. (2015), Application
of fuzzy TOPSIS to scoring the negotiation offers
in ill-structured negotiation problems, European
Journal of Operational Research, 242, 920-932.
Saaty, T. L. (1980), The Analytic Hierarchy Process:
Planning, Priority Setting, McGraw-Hill Interna-
tional Book, Co., New York.
Saaty, T. L. (1996), The Analytic Network Process: De-
cision Making with Dependence and Feedback,
RWS Publications, Pittsburgh.

Evaluating Service Quality of Korean Restaurants
Vol 15, No 1, March 2016, pp.77-91, © 2016 KIIE 89
Wang, Y. M. and Chin, K. S. (2006), An eigenvector me-
thod for generating normalized interval and fuzzy
weights, Applied Mathematics and Computation,
181, 1257-1275.
World Bank (2015), Employment in services (% of total
employment), Retrieved September April 27, 2015,
from http://data.worldbank.org/indicator/SL.SRV.
EMPL.ZS/.
Zadeh, L. A. (1965), Fuzzy set, Information and Control,
8, 338-353.
Zhu, K. J., Jing, Y., and Chang, D. Y. (1999), A discus-
sion on extent analysis method and applications of
fuzzy AHP, European Journal of Operational Re-
search, 116, 450-456.
Zimmermann, H. J. (2001), Fuzzy Set Theory and Its
Applications (4th ed.), Springer, Berlin.

Mujiya Ulkhaq, Nartadhi, and Akshinta: Industrial Engineering & Management Systems
Vol 15, No 1, March 2016, pp.77-91, © 2016 KIIE 90
<APPENDIX> Questionnaire
The questionnaire with respect to the overall goal to find out the best service quality performance of Korean restaurant in Semarang, Indonesia, is given below:
A. Pairwise comparison for attributes.
Q1. How important is tangibles when it is compared with responsiveness? Q2. How important is tangibles when it is compared with empathy? Q3. How important is tangibles when it is compared with assurance? Q4. How important is tangibles when it is compared with reliability?
Q5. How important is tangibles when it is compared with innovation? Q6. How important is responsiveness when it is compared with empathy? Q7. How important is responsiveness when it is compared with assurance? Q8. How important is responsiveness when it is compared with reliability? Q9. How important is responsiveness when it is compared with innovation? Q10. How important is empathy when it is compared with assurance?
Q11. How important is empathy when it is compared with reliability? Q12. How important is empathy when it is compared with innovation? Q13. How important is assurance when it is compared with reliability? Q14. How important is assurance when it is compared with innovation? Q15. How important is reliability when it is compared with innovation?
B. Pairwise comparison for sub-attribute: Tangibles. Q16. How important is creating attractive Korean environment when it is compared with showing appearance of
Korean nuance? Q17. How important is creating attractive Korean environment when it is compared with keeping cleanliness of
tableware and dining environment? Q18. How important is creating attractive Korean environment when it is compared with offering clear and legi-
ble menu? Q19. How important is creating attractive Korean environment when it is compared with creating pleasant dining
atmosphere? Q20. How important is showing immaculate appearance when it is compared with keeping cleanliness of table-
ware and dining environment? Q21. How important is appearance of Korean nuance when it is compared with offering clear and legible menu?
Q22. How important is appearance of Korean nuance when it is compared with creating pleasant dining atmos-phere?
Q23. How important is keeping cleanliness of tableware and dining environment when it is compared with offer-ing clear and legible menu?
Q24. How important is keeping cleanliness of tableware and dining environment when it is compared with creat-ing pleasant dining atmosphere?
Q25. How important is offering clear and legible menu when it is compared with creating pleasant dining atmos-phere?
C. Pairwise comparison for sub-attribute: Responsiveness.
Q26. How important is providing enthusiastic service when it is compared with possessing Korean cuisine knowledge?
Q27. How important is providing enthusiastic service when it is compared with showing ability to deal with emergencies?
Q28. How important is providing enthusiastic service when it is compared with providing activity information ac-tively?
Q29. How important is possessing Korean cuisine when it is compared with showing ability to deal with emer-gencies?
Q30. How important is possessing Korean cuisine when it is compared with providing activity information active-ly?
Q31. How important is showing ability to deal with emergencies when it is compared with providing activity in-formation actively?
Evaluating Service Quality of Korean Restaurants
Vol 15, No 1, March 2016, pp.77-91, © 2016 KIIE 91
D. Pairwise comparison for sub-attribute: Empathy. Q32. How important is displaying positive concern for individual customers when it is compared with providing
meticulous service?
Q33. How important is displaying positive concern for individual customers when it is compared with having flexible rules with customers?
Q34. How important is displaying positive concern for individual customers when it is compared with considering customers’ requests in advance?
Q35. How important is providing meticulous service when it is compared with having flexible rules with custom-ers?
Q36. How important is providing meticulous service when it is compared with considering customers’ requests in advance?
Q37. How important is having flexible rules with customers when it is compared with considering customers’ re-quests in advance?
E. Pairwise comparison for sub-attribute: Assurance.
Q38. How important is displaying good communication manners when it is compared with having well-trained employees?
Q39. How important is displaying good communication manners when it is compared with exhibiting capability of answering customer questions?
Q40. How important is displaying good communication manners when it is compared with offering customers a sense of security?
Q41. How important is having well-trained employees when it is compared with exhibiting capability of answer-ing customer questions?
Q42. How important is having well-trained employees when it is compared with offering customers a sense of se-curity?
Q43. How important is exhibiting capability of answering customer questions when it is compared with offering customers a sense of security?
F. Pairwise comparison for sub-attribute: Reliability.
Q44. How important is delivering guaranteed and timely service when it is compared with presenting correct bills? Q45. How important is delivering guaranteed and timely service when it is compared with maintaining and clean-
ing the environment and facilities regularly? Q46. How important is delivering guaranteed and timely service when it is compared with serving tasty food that
meets customers’ demand? Q47. How important is presenting correct bills when it is compared with maintaining and cleaning the environ-
ment and facilities regularly? Q48. How important is presenting correct bills when it is compared with serving tasty food that meets customers’
demand? Q49. How important is maintaining and cleaning the environment and facilities regularly when it is compared
with serving tasty food that meets customers’ demand? G. Pairwise comparison for sub-attribute: Innovation.
Q50. How important is offering innovative menu when it is compared with providing customized services? Q51. How important is offering innovative menu when it is compared with offering innovative activities? Q52. How important is providing customized services when it is compared with offering innovative activities?