evaluating search engine
TRANSCRIPT

Chapter 8
Evaluating Search
Engine

Evaluation
Evaluation is key to building effective and efficient
search engines
Measurement usually carried out in controlled laboratory
experiments
Online testing can also be done
Effectiveness, efficiency, and cost are related
e.g., if we want a particular level of effectiveness and
efficiency, this will determine the cost of the system
configuration
Efficiency and cost targets may impact effectiveness &
vice versa
2

Evaluation Corpus
Test collections consisting of documents, queries, and
relevance judgments, e.g.,
3

Test Collections
4
Bibliographic Records
Full-text
Documents
Policy Descriptions
Based on
TREC topics

TREC Topic Example
5
Short
Query
Long
Query
Criteria
for
Relevance

Relevance Judgments
TREC judgments
Depend on task being evaluated, e.g., topical relevance
Generally binary, i.e., relevant vs. non-relevant
Agreement good because of “narrative”
Emphasize on high recall
Obtaining relevance judgments is an expensive, time-
consuming process that requires manual effort
Who does it?
What are the instructions?
What is the level of agreement?
6
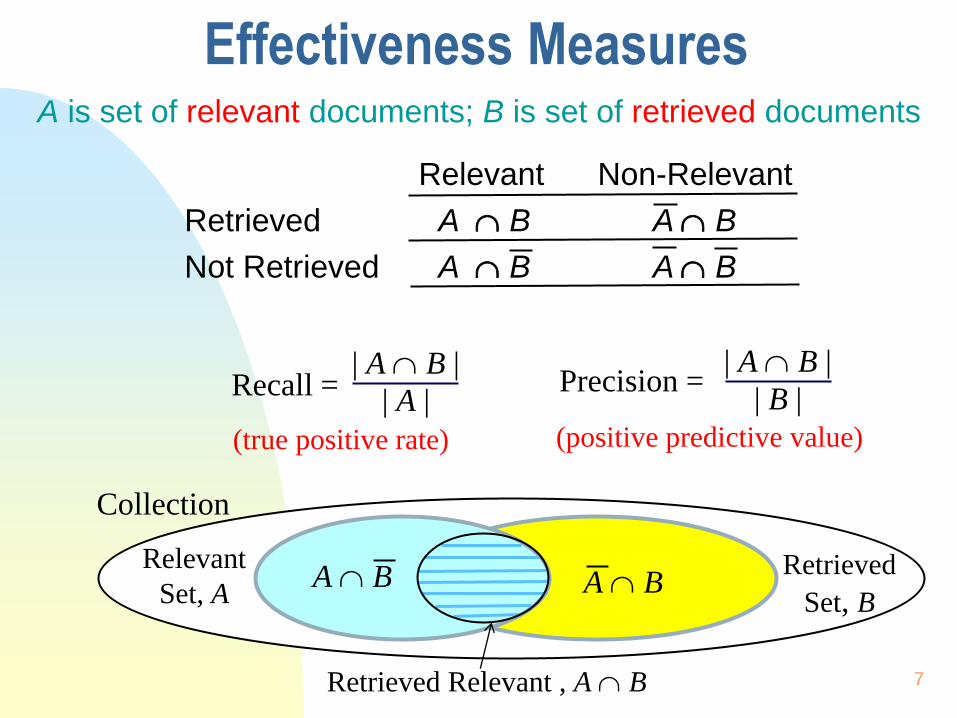
Effectiveness Measures A is set of relevant documents; B is set of retrieved documents
7
Relevant Non-Relevant
Retrieved A B A B
Not Retrieved A B A B
Recall = | A B |
| A | | B |
| A B | Precision =
Collection
Relevant
Set, A Retrieved
Set, B A B A B
Retrieved Relevant , A B
(true positive rate) (positive predictive value)

Classification Errors
Precision is used when probability that a positive result
is correct is important
False Positive (Type I Error)
Non-relevant documents retrieved: | A B |
False positive/False alarm rate:
False Negative (Type II Error)
Relevant documents not retrieved: | A B |
FN Ratio: 1 - Recall
8

F Measure Harmonic mean of recall & precision, a single measure
Harmonic mean emphasizes the importance of small
values, whereas the arithmetic mean is affected
more by outliers that are unusually large
More general form
β is a parameter that determines relative importance of
recall and precision
What if β = 1? 9

Ranking Effectiveness
10
(1/1 1/2 2/3 3/4 4/5 5/6 5/7 5/8 5/9 6/10)
(1/6 1/6 2/6 3/6 4/6 5/6 5/6 5/6 5/6 6/6)
(0/1 1/2 1/3 1/4 2/5 3/6 4/7 4/8 5/9 6/10)
(0/6 1/6 1/6 1/6 2/6 3/6 4/6 4/6 5/6 6/6)

Summarizing a Ranking
Calculating recall and precision at fixed rank positions
Calculating precision at standard recall levels, from 0.0
to 1.0
Requires interpolation
Averaging the precision values from the rank positions
where a relevant document was retrieved
11

Average Precision
12 Mean Average Precision: (0.78 + 0.52) / 2 = 0.65

Averaging
Mean Average Precision (MAP)
Summarize rankings from multiple queries by averaging
average precision
Most commonly used measure in research papers
Assumes user is interested in finding many relevant
documents for each query
Requires many relevance judgments in text collection
Recall-precision graphs are also useful summaries
13

MAP
14
Recall-Precision Graph
15
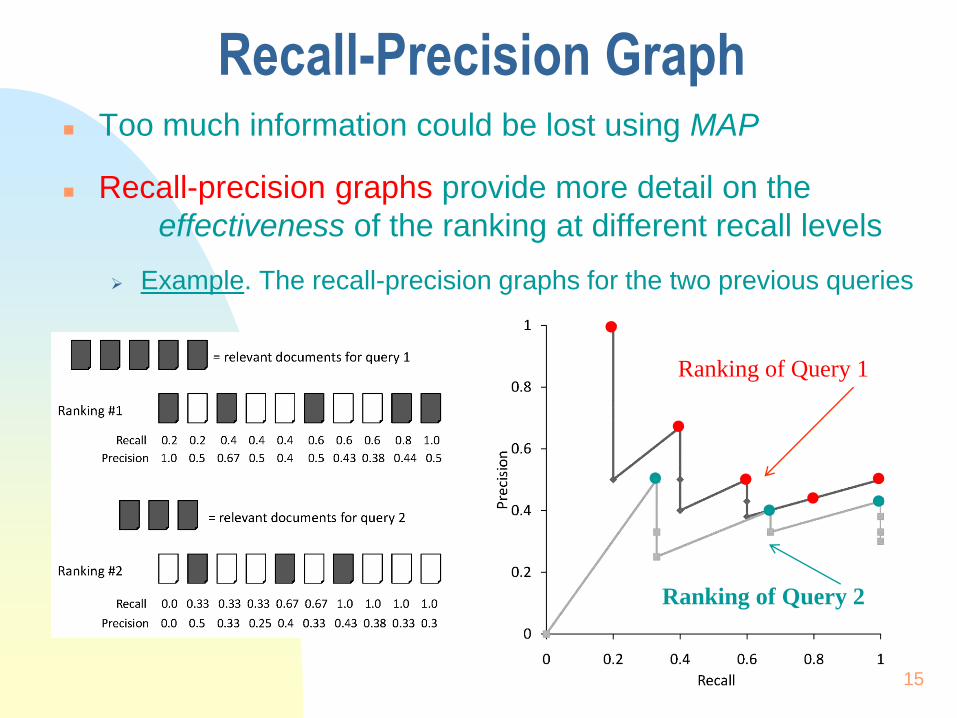
Too much information could be lost using MAP
Recall-precision graphs provide more detail on the
effectiveness of the ranking at different recall levels
Example. The recall-precision graphs for the two previous queries
Ranking of Query 1
Ranking of Query 2

16
Precision and Recall Precision versus Recall Curve
A visual display of the evaluation measure of a retrieval
strategy such that documents are ranked accordingly
Example.
Let q be a query in the text reference collection
Let Rq = { d3, d5, d9, d25, d39, d44, d56, d71, d89, d123 } be
the set of 10 relevant documents for q
Assume the following ranking of retreived documents in
the answer set of q:
1. d123 6. d9 11. d38
2. d84 7. d511 12. d48
3. d56 8. d129 13. d250
4. d6 9. d187 14. d113
5. d8 10. d25 15. d3

17
Example.
|Rq| = 10, total number of relevant documents for q
Given ranking of retrieved documents in the answer set of q:
1. d123 6. d9 11. d38
2. d84 7. d511 12. d48
3. d56 8. d129 13. d250
4. d6 9. d187 14. d113
5. d8 10. d25 15. d3
Precision Versus Recall Curve
0
20
40
60
80
100
20 40 60 80 100
Pre
cisi
on
Recall
•
• • • •
• • • • •
•
30 50 10
An Interpolated
Value 66%
50%
40% 33%
100%

18
To evaluate the performance of a retrieval strategy
over all test queries, compute the average of
precision at each recall level:
where
P(r) = average precision at the rth recall level
Pi (r) = precision at the rth recall level for the ith query
Nq = number of queries used
Precision and Recall
P(r) = __
Nq
i=1
Pi(r)
Nq
__
Nq
i=1 Pi(r)
Nq
1 =

19
Example.
Rq = {d3, d56, d129} & |Rq| = 3, number of relevant docs for q
Given ranking of retreived documents in the answer set of q:
1. d123 6. d9 11. d38
2. d84 7. d511 12. d48
3. d56 8. d129 13. d250
4. d6 9. d187 14. d113
5. d8 10. d25 15. d3
Precision Versus Recall Curve
0
20
40
60
80
100
20 40 60 80 100
Pre
cisi
on
Recall
• • • • • • • • • •
Interpolated precision
at the 11 recall levels
•
10 30 50 70 90
• • 20%
33% 25%

20
Interpolation of Precision at Various Recall Levels
Let ri (0 i < 10) be a reference to the ith recall level
P(ri) = max ri ≤ r ≤ ri+1 P(r)
Interpolation of previous levels by using the next known level
0
20
40
60
80
100
20 40 60 80 100
Pre
cisi
on
Recall
• • • • • • • • • •
Interpolated precision
at the 11 recall levels
•
10 30 50 70 90
• •

21
Precision Versus Recall Curve
Compare the retrieval performance of distinct retrieval
strategies using precision versus recall figures
Average precision versus recall figures become a
standard evaluation strategy for IR systems
Simple and intuitive
Qualify the overall answer set
0
20
40
60
80
100
120
20 40 60 80 100
Pre
cisi
on
Recall
• • • • • • • • •
Average precision
at each recall level
for two
distinct retrieval
strategies
•
• •
• •
• •
• • • • •
•

Focusing on Top Documents Users tend to look at only the top part of the ranked
result list to find relevant documents
Some search tasks have only one relevant doc (P@1) in
mind ̶ the top-ranked doc is expected to be relevant
e.g., in question-answering system, navigation search, etc.
Precision at R (5, 10, or 20): ratio of top ranked relevant docs
Easy to compute, average, understand
Not sensitive to rank positions less than R, higher or lower
Recall not an appropriate measure in this case
Instead need to measure how well the search engine does
at retrieving relevant documents at very high ranks 22

Focusing on Top Documents
Reciprocal Rank
Reciprocal of the rank at which the 1st relevant doc retrieved
Very sensitive to rank position, e.g., dn, dr, dn, dn, dn (RR
= ½), whereas dn, dn, dn, dn, dr (RR = 1/5)
Mean Reciprocal Rank (MRR) is the average of the
reciprocal ranks over a set of queries, i.e.,
23
𝑀𝑅𝑅 = 1
|𝑄𝑠|
1
𝑟𝑎𝑛𝑘𝑖
|𝑄𝑠|
𝑖=1
Number of Queries
Normalization factor
Ranking position of
the first relevant
document

Discounted Cumulative Gain
Popular measure for evaluating web search and related
tasks
Two assumptions:
Highly relevant documents are more useful than marginally
relevant document
The lower the ranked position of a relevant document, the
less useful it is for the user, since it is less likely to be
examined
24

Discounted Cumulative Gain
Uses graded relevance (i.e., a value) as a measure of
the usefulness, or gain, from examining a document
Gain is accumulated starting at the top of the ranking and
may be reduced, or discounted, at lower ranks
Typical discount is 1 / log2(rank)
With base 2, the discount at rank 4 is , and at rank 8 it is
25

Discounted Cumulative Gain
DCG is the total gain accumulated at a particular rank p:
where reli is the graded relevance of the document at rank i,
e.g., ranging from “Bad” to “Perfect” is 0 reli 5, or 0 or 1
Alternative formulation:
Used by some web search companies
Emphasis on retrieving highly relevant documents 26
log2 i is the discount/reduction factor applied to the gain
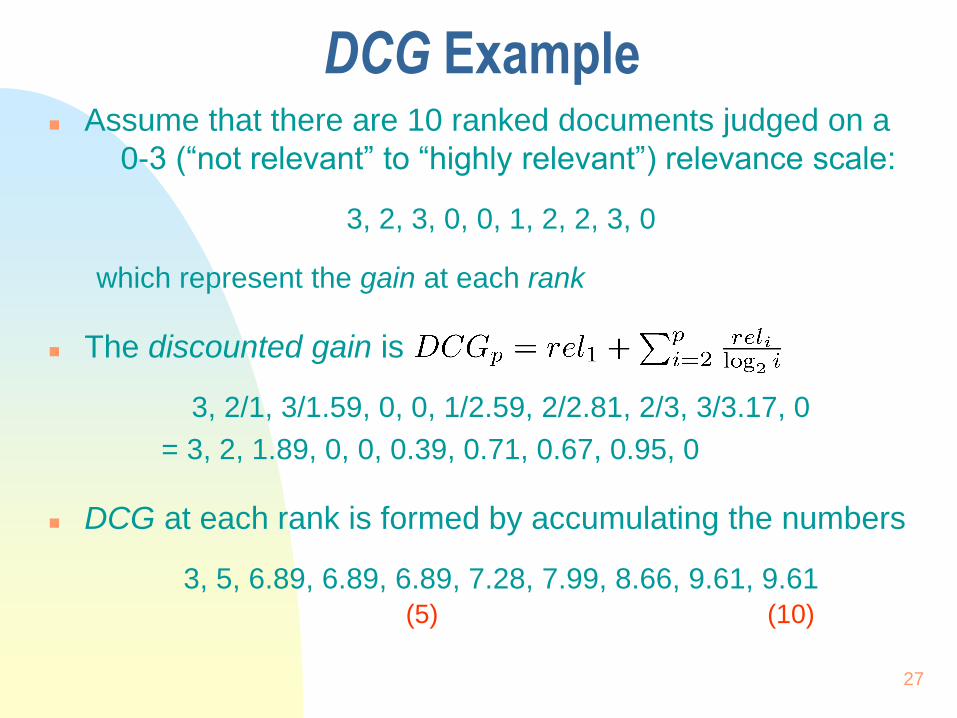
DCG Example Assume that there are 10 ranked documents judged on a
0-3 (“not relevant” to “highly relevant”) relevance scale:
3, 2, 3, 0, 0, 1, 2, 2, 3, 0
which represent the gain at each rank
The discounted gain is
3, 2/1, 3/1.59, 0, 0, 1/2.59, 2/2.81, 2/3, 3/3.17, 0
= 3, 2, 1.89, 0, 0, 0.39, 0.71, 0.67, 0.95, 0
DCG at each rank is formed by accumulating the numbers
3, 5, 6.89, 6.89, 6.89, 7.28, 7.99, 8.66, 9.61, 9.61
27
(5) (10)

Normalized DCG DCG numbers are averaged across a set of queries at
specific rank values, similar to precision@p
e.g., DCG at rank 5 is 6.89 and at rank 10 is 9.61
DCG values are often normalized by comparing the DCG
at each rank with the DCG value for the perfect ranking
NDCGp = DCGp / IDCGp
Makes averaging easier for queries with different numbers of
relevant documents
28

NDCG Example
Perfect ranking for which each relevance level is on
the scale 0-3:
3, 3, 3, 2, 2, 2, 1, 0, 0, 0
Ideal DCG values:
3, 6, 7.89, 8.89, 9.75, 10.52, 10.88, 10.88, 10.88, 10.88
Given the DCG values are 3, 5, 6.89, 6.89, 6.89,
7.28, 7.99, 8.66, 9.61, 9.61, the NDCG values:
1, 0.83, 0.87, 0.77, 0.71, 0.69, 0.73, 0.8, 0.88, 0.88
NDCG 1 at any rank position
29
(5)
(10)
(5) (10)
(5) (10)

Significance Tests
Given the results from a number of queries, how can we
conclude that (a new) ranking algorithm B is better
than (the baseline) algorithm A?
A significance test, which allows us to quantify, enables
us to reject the null hypothesis (no difference) in favor
of the alternative hypothesis (there is a difference)
The power of a test is the probability that the test will reject
the null hypothesis correctly
Increasing the number of queries in the experiment also
increases power (confidence in any judgment) of test
Type 1 Error: the null hypothesis is rejected when it is true
Type 2 Error: the null hypothesis is accepted when it is false 30

Significance Tests
31
Standard Procedure for comparing two retrieval systems:
0.01,

Significance Test
32
x
P = 0.05
Test Statistic Value
Probability distribution for test statistic values assuming the
null hypothesis. The shaded area is the region of rejection for
a one-sided test.

t-Test
Assumption is that the difference between the effectiveness
data values is a sample from a normal distribution
Null hypothesis is that the mean of the distribution of
differences is zero
Test statistic for the paired t-test is
Example. Given that N = 10 such that
A = < 25, 43, 39, 75, 43, 15, 20, 52, 49, 50 > and
B = < 35, 84, 15, 75, 68, 85, 80, 50, 58, 75 >
QuickCalcs (http://www.graphpad.com/quickcalcs/ttest2.cfm) 33
Mean of the
differences
Standard
derivation
One-tailed
P Value

Example: t-Test
34

Wilcoxon Signed-Ranks Test Nonparametric test based on differences between
effectiveness scores
Test statistic
To compute the signed-ranks, the differences are ordered
by their absolute values (increasing), and then assigned
rank values
Rank values are given the sign of the original difference
Sample website
(http://scistatcalc.blogspot.com/2013/10/wilcoxon-signed-
rank-test-calculator.html)
35

Wilcoxon Test Example
9 non-zero differences are (in order of absolute value):
2, 9, 10, 24, 25, 25, 41, 60, 70
Signed-ranks:
-1, +2, +3, -4, +5.5, +5.5, +7, +8, +9
w (sum of the signed-ranks) = 35, p-value = 0.038
Null hypothesis holds if of ‘+’ ranks = of the ‘-’ ranks 36
Two-tailed
P Value