evaluating performance of blast on intel xeon and … file04-03-2012 · evaluating performance of...
TRANSCRIPT

Evaluating Performance of BLAST on Intel Xeon and Itanium2 Processors
Ramesh Radhakrishnan Kalyana ChadalavadaRizwan Ali Ramesh RajagopalanGarima KocharOnur CelebiogluJenwei HsiehScalable Systems Group HPCC Enterprise Solutions
Dell Inc

www.dell.com/hpcc
Agenda
ObjectivesPlatform Comparison• Xeon and Itanium2 Processors • Cache and Memory architecture
BLAST• Application Characteristics
Experimental SetupPerformance Analysis• Memory System Performance• Application performance• Workload Characterization
Future Work
www.dell.com/hpcc
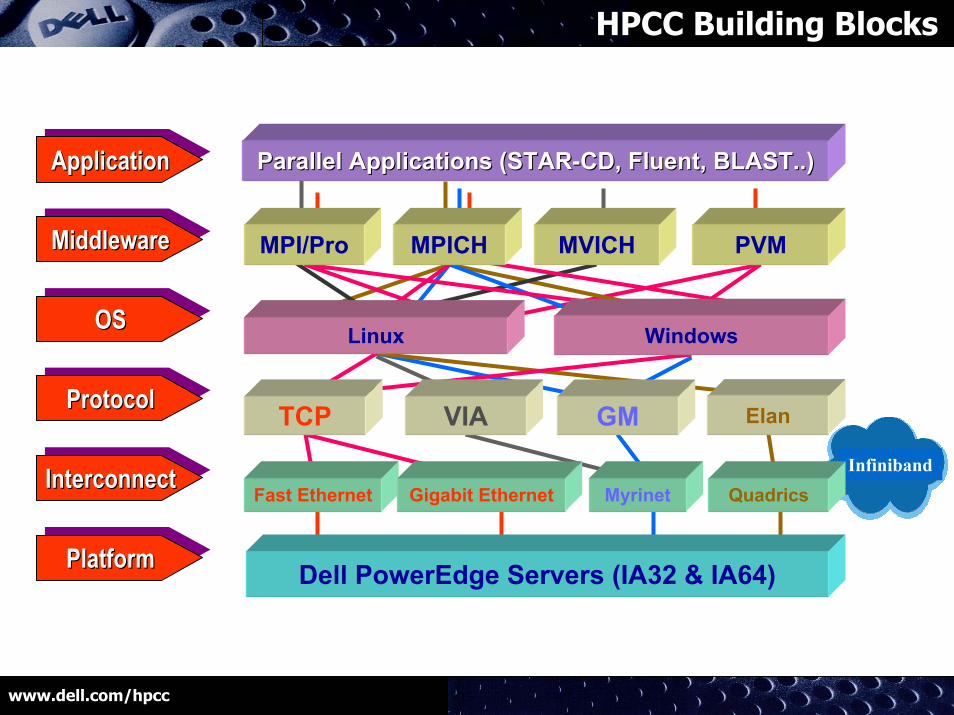
HPCC Building Blocks
Infiniband
VIA
Myrinet
GM
Linux Windows
MPI/Pro PVMMPICH MVICH
Quadrics
PlatformPlatformPlatform
InterconnectInterconnectInterconnect
ProtocolProtocolProtocol
OSOSOS
MiddlewareMiddlewareMiddleware
ApplicationApplicationApplication Parallel Applications (STARParallel Applications (STAR--CD, Fluent, BLAST..)CD, Fluent, BLAST..)
TCP Elan
Fast Ethernet Gigabit Ethernet
Dell PowerEdge Servers (IA32 & IA64)
www.dell.com/hpcc
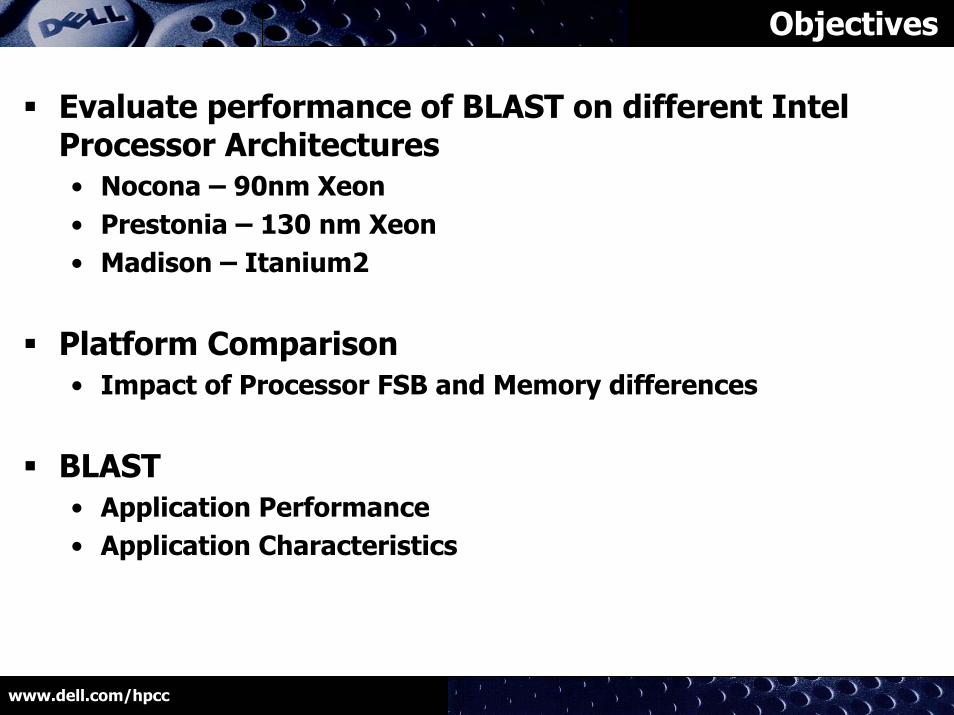
Objectives
Evaluate performance of BLAST on different Intel Processor Architectures• Nocona – 90nm Xeon• Prestonia – 130 nm Xeon• Madison – Itanium2
Platform Comparison• Impact of Processor FSB and Memory differences
BLAST• Application Performance• Application Characteristics

www.dell.com/hpcc
Platform Comparison
Dell PowerEdge Servers• PE1750 (IA32)
• Dual 3.2Ghz Processors, 533MHz FSB• L2 Cache: 512KB, L3: 1MB• DDR-266 MHz
• PE1850 (EM64T)• Dual 3.2Ghz Processors, 800MHz FSB• Dual 3.6Ghz Processors, 800MHz FSB• L2 Cache: 1024KB• DDR2-400 MHz
• PE3250 (IA64)• Dual 1.5Ghz Itanium2 Processors, 400MHz FSB• L2 Cache: 256KB, L3: 6MB• DDR-200 MHz

www.dell.com/hpcc
Processor Comparison
• Xeon DP (130nm) - Prestonia• 1.8Ghz – 3.2Ghz, 400MHz – 533MHz (FSB)• 20 stage pipeline
• Xeon DP (90nm) - Nocona• 2.8Ghz – 3.6Ghz, 800 MHz (FSB)• 31 stage pipeline• x86 64bit Extensions
• Itanium2 - Madison• 1.0Ghz - 1.5Ghz, 400MHz FSB• 64-bit EPIC architecture
www.dell.com/hpcc
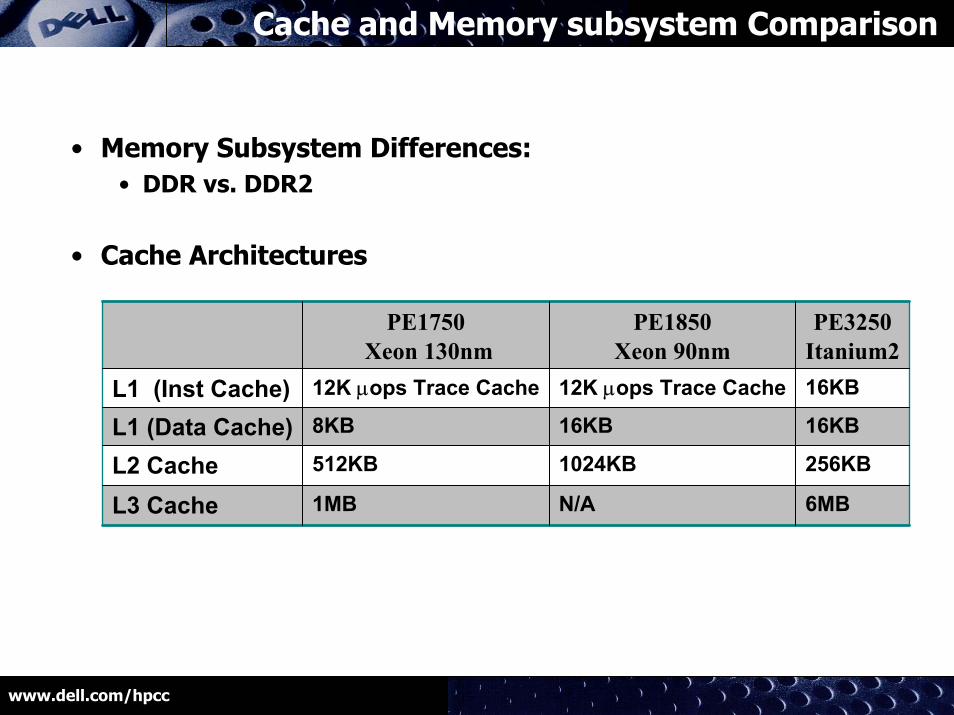
Cache and Memory subsystem Comparison
• Memory Subsystem Differences:• DDR vs. DDR2
• Cache Architectures
6MBN/A1MBL3 Cache
256KB1024KB512KBL2 Cache16KB16KB8KBL1 (Data Cache)16KB12K µops Trace Cache12K µops Trace CacheL1 (Inst Cache)
PE3250Itanium2
PE1850Xeon 90nm
PE1750Xeon 130nm
www.dell.com/hpcc
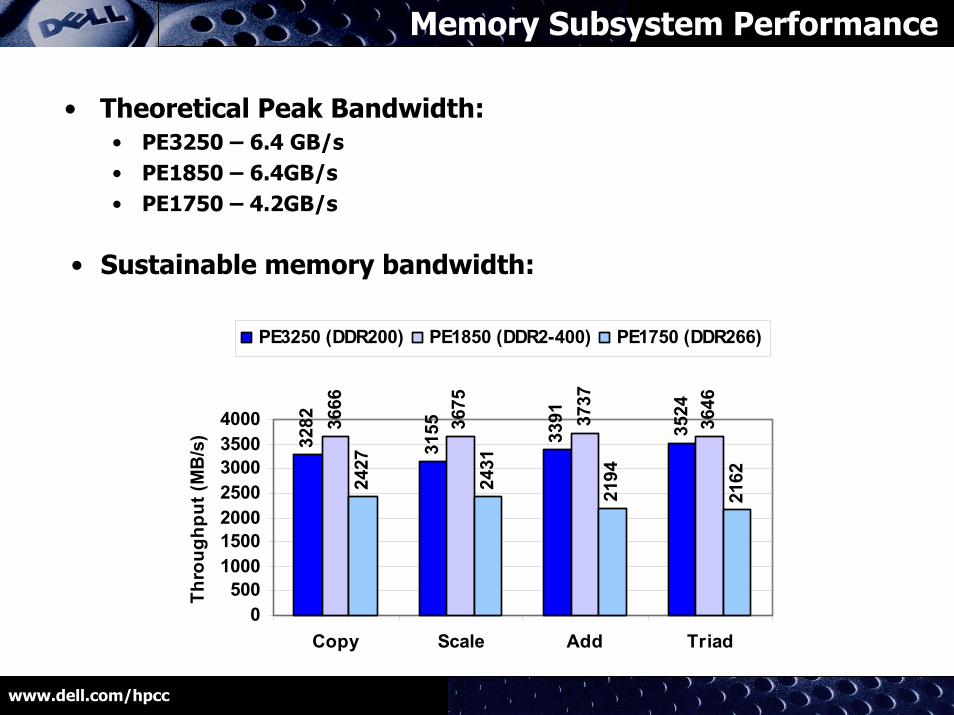
Memory Subsystem Performance
• Theoretical Peak Bandwidth:• PE3250 – 6.4 GB/s• PE1850 – 6.4GB/s • PE1750 – 4.2GB/s
• Sustainable memory bandwidth:32
82
3155 33
91
3524
3666
3675
3737
3646
2427
2431
2194
2162
0500
1000150020002500300035004000
Copy Scale Add Triad
Thro
ughp
ut (M
B/s
)
PE3250 (DDR200) PE1850 (DDR2-400) PE1750 (DDR266)

www.dell.com/hpcc
Cache Performance
• Cache Access and Memory Read Latency (using LMbench)
302371410Memory
21-N/A-27L3
62918L2
242L1
Cycles (processor clocks)201ns116ns128nsMemory
13.7ns-N/A-8.5nsL3
4.02ns9.03ns5.7nsL2
1.34ns1.25ns0.63nsL1
Time (nano seconds)
PE32501.5 GHz (Itanium2)DDR-200
PE18503.2 GHz(90nm Xeon)DDR2-400
PE1750 3.2 GHz (130nm Xeon)DDR266
Cache/MemoryLevels

www.dell.com/hpcc
BLAST
Basic Local Alignment Search Tool• A family of sequence database-search algorithms• Searches a database for similarities to a short query sequence
A B C D A F R G L A A Q A Non-optimal alignment (1 match)
A S R G A A L C N A G F
A B C D A F R G L A A Q A Optimal alignment (4 matches)
A S R G A A L C N A G F
Application Characteristics• Sensitive to processor memory bandwidth• Embarrassingly parallel operation• Integer operation intensive operations

www.dell.com/hpcc
BLAST Performance
2.31 2.37
2.23 2.
36
2.22 2.29
1.44
1.43 1.52
1.52 1.59
1.44
1.35
1.37
1.41 1.46
1.47
1.29
1 1 1 1 11
0.00
0.50
1.00
1.50
2.00
2.50
94k(1Thread)
94k(2Thread)
206k(1Thread)
206k(2Thread)
510k(1Thread)
510k(2Thread)
Query size/ # of threads
Rel
ativ
e Pe
rfor
man
cePE3250 (1.5 GHz) PE1850 (3.6GHz)PE1850 (3.2GHz) PE1750 (3.2 GHz)
• PE1850 - 29%-59% performance improvements• PE3250 – 122% - 137% performance improvements

www.dell.com/hpcc
Scalability (1P to 2P)
89.4
4%
81.5
2%
78.2
5%
82.0
9%
71.0
7%
55.7
0%86.7
4%
78.1
1%
51.1
8%84.5
5%
70.9
0%
72.5
7%
0%10%20%30%40%50%60%70%80%90%
100%
94k 206k 510k
Query Sizes
Perf
orm
ance
e Im
prov
emen
tPE3250 (1.5 GHz) PE1850 (3.6GHz)PE1850 (3.2GHz) PE1750 (3.2 GHz)
• Good Thread-Level Parallelism

www.dell.com/hpcc
EM64T Evaluation
Comparison of the different mode of operations against the protein database
9000
11000
13000
15000
17000
19000
21000
23000
25000
153117 206848 237455
Query Word Size
Tim
e (S
ec)
PE1850/32bitPE1850/64bitOS/32bit-binaryPE1850/64bitOS/64bit binary
• EM64T mode provides benefits with additional registers and memory addressing capability over legacy 32-bit modes.
www.dell.com/hpcc
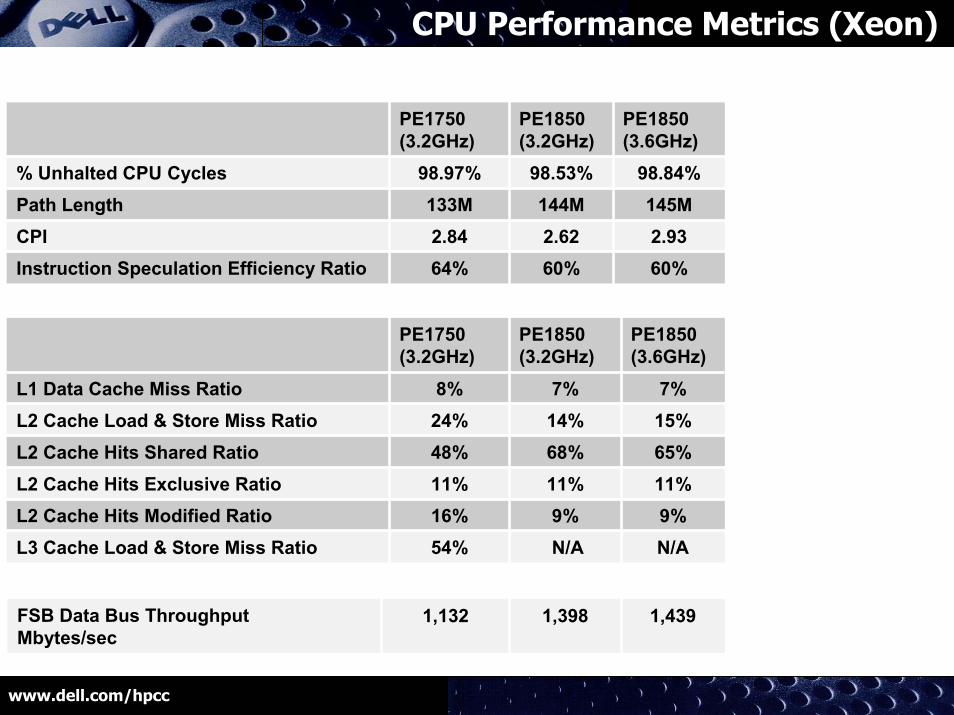
CPU Performance Metrics (Xeon)
60%60%64%Instruction Speculation Efficiency Ratio2.932.622.84CPI
145M 144M133M Path Length 98.84%98.53%98.97%% Unhalted CPU Cycles
PE1850 (3.6GHz)
PE1850 (3.2GHz)
PE1750 (3.2GHz)
PE1850 (3.6GHz)
PE1850 (3.2GHz)
PE1750 (3.2GHz)
N/AN/A54%L3 Cache Load & Store Miss Ratio9%9%16%L2 Cache Hits Modified Ratio
11%11%11%L2 Cache Hits Exclusive Ratio65%68%48%L2 Cache Hits Shared Ratio15%14%24%L2 Cache Load & Store Miss Ratio7%7%8%L1 Data Cache Miss Ratio
1,4391,3981,132FSB Data Bus Throughput Mbytes/sec

www.dell.com/hpcc
CPU Performance Metrics (Xeon vs. Itanium)
7.1%100%100%54%L3 Cache Miss Ratio
22.3%15%14%24%L2 Cache Miss Ratio
15.8%7%7%8%L1 data Cache miss ratio
0.682.932.622.84CPI
PE3250 (1.5GHz Itanium2)
PE1850 (3.6GHz Xeon)
PE1850 (3.2GHz Xeon)
PE1750 (3.2GHz Xeon)

www.dell.com/hpcc
Summary and Future Directions
Evaluated Performance of BLAST on different Platforms• BLAST runs well on IA64 architecture• Scaled well with faster DDR2 memory• No large benefits from increased cache size on Nocona • No additional benefits from 64-bit capabilities • Interesting workload
Future Work• Run on a cluster to evaluate
• Interconnect performance• Different flavors of MPI libraries• Impact of Hyper-Threading